Embed Size (px)
Citation preview

E5 Student Reader v. 9.1 Unit 3 – Page 1 ©2016 KnowAtomTM
Water on Earth
UNIT 3 Student Reader

E5 Student Reader v. 9.1 Unit 3 – Page 2 ©2016 KnowAtomTM
Front Cover: The front cover shows a photograph of a storm over the ocean. Earth’s oceans are a primary driver of the water cycle, which in turn drives weather and climate.

E5 Student Reader v. 9.1 Unit 3 – Page 3 ©2016 KnowAtomTM
Unit 3: Water on Earth
Table of Contents Section 1: Water’s Distribution 4
Message in a Bottle Oceans on Earth Where is Water Found on Earth? How Water Moves The Water Cycle How Oceans Gets Salty Water on Earth Investigation Section 1 Review
4 6 7 8 9 11 12 17
Section 2: Weather and Climate 18 The Gulf Stream Earth’s Climates Oceans Transport Heat Oceans Influence Climate How Hurricanes Form Hurricanes and People Heat and Evaporation Investigation Section 2 Review
18 19 20 21 22 24 26 29
Section 3: Problem of Water Pollution 30 The Everglades Part of the Water Cycle Environmental Threats Engineers Solve Problems The Engineering Process Section 3 Review
30 31 32 33 36 37
Science Words to Know 38

E5 Student Reader v. 9.1 Unit 3 – Page 4 ©2016 KnowAtomTM
Message in a Bottle In August 2015, scientists in England received a surprise in the mail. It was a postcard that had spent the last 109 years in a bottle, traveling the world’s oceans. This postcard is the oldest message in a bottle that has ever been found. The postcard had a note written on it. It promised a shilling to anyone who returned it to the Marine Biological Association of the UK. A shilling is a former British coin. The postcard in the bottle was sent out more than a century ago because scientists wanted to understand where ocean water moved around the planet. For centuries, people have dropped messages in bottles to study the movements of ocean currents. Ocean currents are the paths of flowing ocean water that push warm and cold water to different parts of the planet.
Messages in bottles were used to study ocean currents.
1
Water’s Distribution

E5 Student Reader v. 9.1 Unit 3 – Page 5 ©2016 KnowAtomTM
Ocean currents are constantly moving water around the planet. The movement of ocean currents is complex. It is affected by Earth’s rotation on its axis, how much salt the water holds, the temperature of the water, land formations on the ocean floor, and wind. Because of this, ocean currents involve interactions of different Earth systems: the hydrosphere (all of the water on Earth), the geosphere (Earth’s landforms, including rocks and soil), and the atmosphere (the mixture of gases, dust, water vapor, and other molecules above Earth’s crust). The postcard in the bottle was found on a beach in Germany. It was one of 1,000 bottles released in the North Sea between 1904 and 1906. Slightly more than half of the bottles were returned to the scientists. The rest were believed to be lost at sea. It has been so long since the bottles were put into the ocean that the United Kingdom no longer makes shillings. The Marine Biological Association had to find a shilling on eBay after they received the postcard in 2015. Scientists continue to study ocean currents today. However, they now use different technologies. For example, scientists sometimes attach tiny electronic tags on fish that track where they have been.

E5 Student Reader v. 9.1 Unit 3 – Page 6 ©2016 KnowAtomTM
Oceans on Earth
Earth is a water planet. Oceans cover around 71 percent of Earth’s surface. There are five oceans on Earth: the Arctic Ocean, the Atlantic Ocean, the Indian Ocean, the Pacific Ocean, and the Southern Ocean. However, water flows between these oceans because they are not actually separated. Instead, they form one massive body of water. This is why scientists have used messages in bottles. The currents carry the bottles on their journey around the planet.
Oceans get very deep. The average depth of the ocean is 3,688 meters (12,100 feet). In fact, the planet’s longest mountain range runs through the middle of the ocean. It is called the Mid-Oceanic Ridge, and it is found at a divergent tectonic plate boundary. This mountain range covers 65,000 km (40,389 miles). The average depth to the top of the ridge is 2,500 meters (8,202 feet).
The world’s oceans are all connected.
© NOAA

E5 Student Reader v. 9.1 Unit 3 – Page 7 ©2016 KnowAtomTM
Where is Water Found on Earth? Oceans make up almost 97 percent of all water on Earth. They are filled with salt water. Scientists estimate that if the salt in the ocean could be removed and spread evenly over the ground, it would form a layer more than 166 meters (500 feet) thick. This is the same height as a 40-story office building. The remaining 3 percent of water on Earth is fresh water. Most of the fresh water is stored in frozen glaciers or ice caps, or underground as groundwater. A small proportion of fresh water is found in rivers, lakes, wetlands, and the atmosphere. Proportion refers to the relationship between things, as to size, quantity, or number. Fresh water is important for people. We cannot drink salt water, so most of the water we drink comes from groundwater. Humans and other animals can also get fresh water from lakes and rivers.
E5 Student Reader v. 9.1 Unit 3 – Page 8 ©2016 KnowAtomTM
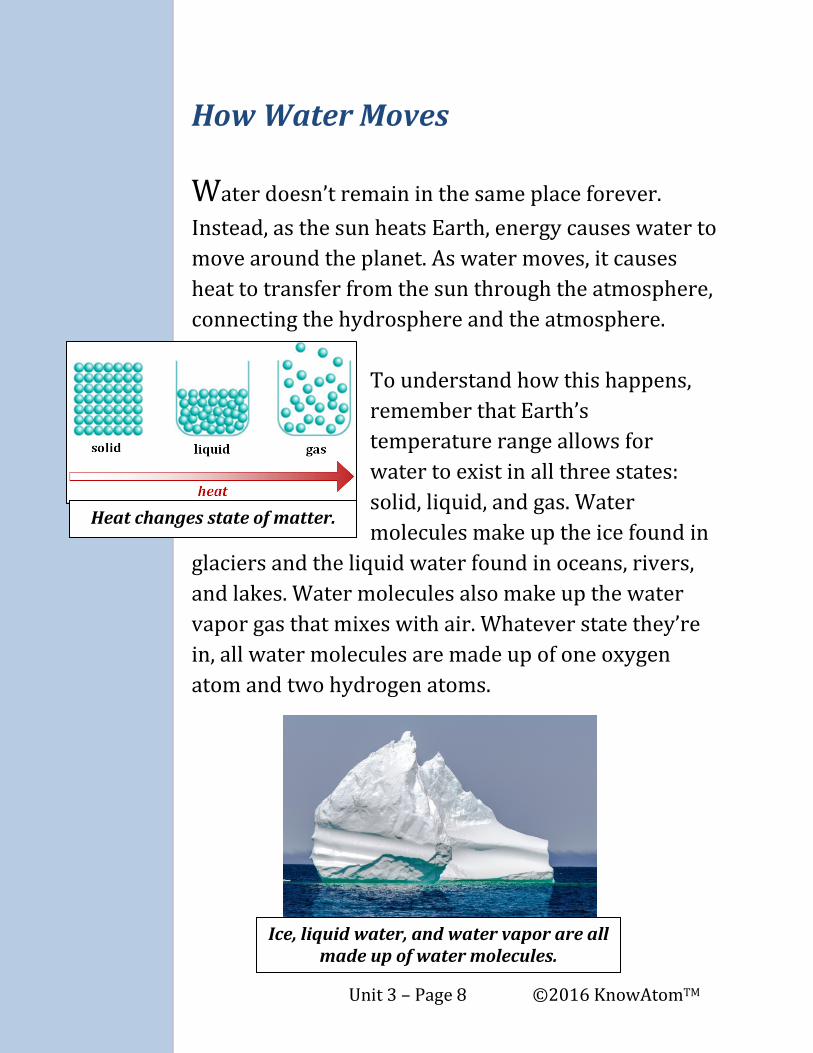
How Water Moves Water doesn’t remain in the same place forever. Instead, as the sun heats Earth, energy causes water to move around the planet. As water moves, it causes heat to transfer from the sun through the atmosphere, connecting the hydrosphere and the atmosphere.
To understand how this happens, remember that Earth’s temperature range allows for water to exist in all three states: solid, liquid, and gas. Water molecules make up the ice found in
glaciers and the liquid water found in oceans, rivers, and lakes. Water molecules also make up the water vapor gas that mixes with air. Whatever state they’re in, all water molecules are made up of one oxygen atom and two hydrogen atoms.
Ice, liquid water, and water vapor are all made up of water molecules.
Heat changes state of matter.

E5 Student Reader v. 9.1 Unit 3 – Page 9 ©2016 KnowAtomTM
The Water Cycle
With enough energy from the sun, liquid water on Earth’s surface evaporates into the atmosphere. Evaporation is the process of liquid water changing into water vapor, its gas state. As the water vapor moves higher in the atmosphere, it loses heat. Eventually it will condense. When it condenses, it changes from a gas back into liquid water. Precipitation is water falling back to Earth’s surface in the form of rain, snow, sleet, or hail. Some of the water that doesn’t immediately evaporate back into the atmosphere will collect into lakes, pools, and other water sources. Some water will seep underground. Water that doesn’t seep into the ground or get absorbed by plants and animals flows downhill because of gravity. Any area of land where all of the water that falls in it drains into a common outlet is called a watershed.
a watershed

E5 Student Reader v. 9.1 Unit 3 – Page 10 ©2016 KnowAtomTM
Plants absorb some water through their roots and release it through their leaves as water vapor back to the atmosphere. The process by which water moves through plants from roots to their leaves and into the atmosphere is called transpiration. The circulation of water from a collection to the atmosphere and back to the surface is called the water cycle.
the water cycle

E5 Student Reader v. 9.1 Unit 3 – Page 11 ©2016 KnowAtomTM
How Oceans Get Salty The movement of water on the planet connects all of Earth’s systems. For example, water vapor is held in the atmosphere. Another gas found in the atmosphere is carbon dioxide. When water falls to Earth’s surface, it is slightly acidic because it carries some of this carbon dioxide. This slightly acidic water causes chemical weathering of the rocks on Earth’s surface. This interaction is between the geosphere and the hydrosphere. The chemical weathering breaks down the rocks, transforming the matter into new substances with different properties, including salt and other minerals. All water that collects on Earth’s surface will eventually flow downhill because of the pull of Earth’s gravity. As water flows downhill, it erodes the particles of salt and other weathered matter. All water eventually ends up in the ocean, where it deposits the salt and other matter. Over millions of years, this salt has collected in the oceans, resulting in salt water.
Ocean water is salty because of interactions between the hydrosphere,
atmosphere, and geosphere.

E5 Student Reader v. 9.1 Unit 3 – Page 12 ©2016 KnowAtomTM
Name: _________________________________________ Date: _____________________
Water on Earth Investigation Section 1: Water Distribution How are the water resources on Earth distributed? Investigate the question by graphing the distribution of water in different reservoirs on Earth and then create a scaled physical model to represent the distribution. 1. Use the blank pie chart below to graph the percentage of freshwater and saltwater reservoirs on Earth. Include labels on the pie chart for each reservoir. Use the data on page 7 of your student reader as a guide to complete the graph.
Graph Title: _________________________________________________

E5 Student Reader v. 9.1 Unit 3 – Page 13 ©2016 KnowAtomTM
2. Use the materials and procedure to create a physical model of the distribution of water on Earth:
• 1 permanent marker • 1 graduated measuring
container (durable)
Procedure 1. Fill the large graduated measuring container with 1,000 mL of
water. This water represents 100% of the water found on Earth. 2. Pour 30 mL of this water into the graduated cup to represent all of
the fresh water on Earth (3%). The remainder of the water in the large graduated measuring container now represents all the salt water on Earth (97%).
3. Label the three plastic cups with separate labels to represent the distribution of fresh water among three main reservoirs: glaciers and ice caps (69%), groundwater (30%), and lakes and rivers (1%).
4. Use the small graduated cup to divide and pour the following volumes of water from the 30 milliliters of “fresh water” into the labeled freshwater reservoir cups: 21 mL in the glaciers and ice caps cup, 9 mL in the groundwater cup, and 1 drop in the lakes and rivers cup.
Analyze the Data and Model 1. Which reservoir holds the majority of water on Earth? ____________________________________________________________________________________
____________________________________________________________________________________
2. Among the sources of fresh water on Earth, which sources can be used/accessed by humans and animals for drinking?
____________________________________________________________________________________
____________________________________________________________________________________
_______________________________________________________________________________
• 1 graduated cup (durable) • 1 small graduated cup (30 mL) • 3 plastic cups

E5 Student Reader v. 9.1 Unit 3 – Page 14 ©2016 KnowAtomTM
Section 2: Ocean Water How do the interactions of Earth’s systems cause ocean water to become salty over time? Use the materials and procedure below to investigate the question. Materials
• 2 spoonfuls of red salt • 1 paint tray • 1 cup of sand • 1 plastic spoon
Procedure
1. Pour 1 cup of sand onto the slope of the paint tray. Smooth out the sand so an even layer covers the slope of the tray.
2. Collect 2 spoonfuls of red salt in the plastic cup and sprinkle it all over the sand.
3. Hold the plastic cup with holes above the highest end of the sand slope. Pour 200 mL of water into the cup with holes so the water flows onto the sand.
Analyze the model 1. Describe what happened to the sand in the model when the water flowed over it. ___________________________________________________________________________________
___________________________________________________________________________________
___________________________________________________________________________________
___________________________________________________________________________________
___________________________________________________________________________________
___________________________________________________________________________________
___________________________________________________________________________________
___________________________________________________________________________________
• 1 plastic cup with holes • 1 plastic cup • graduated cup (durable) with 200 mL of
water

E5 Student Reader v. 9.1 Unit 3 – Page 15 ©2016 KnowAtomTM
2. Describe what happened to the salt in the model when the water flowed over the sand. ___________________________________________________________________________________
___________________________________________________________________________________
___________________________________________________________________________________
___________________________________________________________________________________
___________________________________________________________________________________ 3. Draw a diagram of the model in the space below.
• Label the materials used in the model, the area of the model that represents the ocean, and any surface features (river channels) created by the flowing water.
• Label the parts of the model that represent Earth’s systems. (Only some of Earth’s systems are represented in the model).

E5 Student Reader v. 9.1 Unit 3 – Page 16 ©2016 KnowAtomTM
4. Use what you observed while testing the physical model and the information from your diagram to explain how Earth’s systems interact to produce the salt water in oceans. ___________________________________________________________________________________
___________________________________________________________________________________
___________________________________________________________________________________
___________________________________________________________________________________
___________________________________________________________________________________
___________________________________________________________________________________
___________________________________________________________________________________
___________________________________________________________________________________
___________________________________________________________________________________
___________________________________________________________________________________
___________________________________________________________________________________
___________________________________________________________________________________
___________________________________________________________________________________
___________________________________________________________________________________
___________________________________________________________________________________
___________________________________________________________________________________
___________________________________________________________________________________
___________________________________________________________________________________
___________________________________________________________________________________
___________________________________________________________________________________
___________________________________________________________________________________
___________________________________________________________________________________

E5 Student Reader v. 9.1 Unit 3 – Page 17 ©2016 KnowAtomTM
Section 1 Review
Reading Comprehension Questions:
1. What is the main idea of Section 1? 2. What key details does the text provide to support the main idea of the text? 3. On page 10, the text includes a diagram of the water cycle. How does this diagram provide evidence for interactions among all of Earth’s systems as water cycles around the planet? 4. How does this section relate to the last unit, which focused on weathering and erosion? How are the two sections connected? 5. Identify a quote from the text that answers the question: “Why do eroded materials end up in the ocean?”

E5 Student Reader v. 9.1 Unit 3 – Page 18 ©2016 KnowAtomTM
The Gulf Stream
In the 1700s, there were no telephones. People who wanted to communicate with people overseas had to send letters on ocean vessels. Because of this, Benjamin Franklin was very interested in ocean currents.
Franklin was curious about one current that flowed eastward from the Gulf of Mexico, around the southern tip of Florida, and along the East Coast up to Iceland and Norway. This is the Gulf Stream. Franklin was the first person to chart its movement.
On several trips across the ocean,
Franklin took the temperature of the water as he crossed over it. He realized that the Gulf Stream is like a warm river that moves through the colder waters of the Atlantic Ocean. His observations led him to an important conclusion. He realized the Gulf Stream could speed up the travel time of boats sailing between America and England. They would have to stay in the current when they traveled east and avoid it when they traveled west.
2
Weather and Climate
Franklin’s chart of the Gulf Stream

E5 Student Reader v. 9.1 Unit 3 – Page 19 ©2016 KnowAtomTM
Earth’s Climates
In addition to helping boats sail the oceans more quickly, ocean currents have another important function. They transfer heat around the planet. This is important because Earth’s surface is not heated evenly. Remember that Earth is a sphere. Around its middle, the sun’s rays shine directly onto the planet. This middle point is called the equator. The equator is the imaginary line that runs around the widest part of Earth. It is halfway between the North Pole and the South Pole. This region around the equator is the tropical climate zone. The sun’s rays are the most concentrated here. This causes the temperatures to be high. The sun’s rays spread over a larger area when you move north or south of the equator. This causes Earth’s surface north and south of the equator to receive less direct heat from the sun. As a result, these regions have lower temperatures.
The sun heats Earth unevenly.

E5 Student Reader v. 9.1 Unit 3 – Page 20 ©2016 KnowAtomTM
Oceans Transport Heat
Earth’s land, oceans, and atmosphere all absorb heat from the sun. But the oceans absorb the most. This means that the tropical waters around the equator absorb the most heat. As the ocean absorbs sunlight, its surface warms. With enough heat, the water moves into the atmosphere as water vapor. Evaporation increases the temperature and humidity of the surrounding air. This then causes rain and storms that are carried by winds around the planet. The water cycle is very influenced by these interactions between the atmosphere and the ocean. In fact, the ocean is the primary source of the water cycle. 78 percent of all rain falls onto the ocean and 86 percent of all water
evaporation comes from the ocean. Ocean currents also carry warm water and precipitation from the equator toward the North and South poles. They carry cold water from the poles back to the tropical region.
Ocean currents move warm and cold water around the planet.

E5 Student Reader v. 9.1 Unit 3 – Page 21 ©2016 KnowAtomTM
Oceans Influence Climate As they absorb heat and transfer it and water around the planet, oceans influence Earth’s weather and climate. Weather refers to the conditions of the atmosphere (temperature, humidity, wind speed, air pressure, and precipitation) in a particular place at a particular time. Climate is the average weather over a span of 30 years. Weather changes hour-to-hour. Climate changes over very long periods of time. How close a region is to the equator affects its climate. So does its nearness to the ocean and its elevation. Because tropical regions receive the most direct sunlight, they also experience the most rainfall. This rainfall is mostly over the oceans. They also tend to have a wetter and warmer climate. Regions that are at higher elevations, are farther away from the ocean, and farther from the equator tend to be cooler and drier.
This map shows the temperature of the world’s oceans.
Global Ocean Surface Temperatures
© NASA

E5 Student Reader v. 9.1 Unit 3 – Page 22 ©2016 KnowAtomTM
How Hurricanes Form
As oceans interact with the atmosphere, they cause weather events. For example, a hurricane is a storm
system with strong thunderstorms and sustained winds of 119 to more than 252 kilometers per hour (km/h). Hurricanes form when ocean water is hot enough to quickly evaporate into water vapor and condense into large
clouds. Because of this, hurricanes always begin over warm ocean water near the equator. Hurricanes are then moved by global winds called trade winds that push them from east to west.
Hurricanes move water and heat through the
atmosphere.
Trade winds push hurricanes from east to west.

E5 Student Reader v. 9.1 Unit 3 – Page 23 ©2016 KnowAtomTM
Hurricanes begin when evaporation makes the air above the ocean humid and warm. Humidity is a measure of the amount of water vapor in the air compared to how much water vapor the air can hold. A 0 percent relative humidity means that there is no water vapor in the air. When relative humidity is 100 percent, the atmosphere is full of water vapor. Some is released as precipitation. As evaporation makes the air warmer, that warmer air rises in the atmosphere. At the same time, cold air sinks, creating wind. Winds coming together force air upwards. As humid air rises, it creates clouds. Winds from outside the hurricane push the storm from east to west. Hurricanes can grow more than 800 kilometers wide, with winds more than 252 km/h. They grow stronger when there is warm, moist air. When a hurricane reaches land or cooler water, it weakens because it has no more water or heat to fuel its growth.
how hurricanes form

E5 Student Reader v. 9.1 Unit 3 – Page 24 ©2016 KnowAtomTM
Hurricanes and People
Hurricanes can impact living things. The heavy rains can cause flooding. The strong winds can uproot trees and sometimes even buildings. Because of this, scientists have developed tools to predict the strength of hurricanes and the path they are most likely to travel. For example, scientists know that hurricane activity is greatest in late summer. This is when the difference between air temperatures and sea surface temperatures is the greatest. In the Atlantic Ocean, hurricane season generally runs from June 1 to November 30. However, late August and all of September are the most active hurricane months.
This map shows the tracks of all known hurricanes that formed in the Atlantic Ocean from 1851-2012.
© NOAA

E5 Student Reader v. 9.1 Unit 3 – Page 25 ©2016 KnowAtomTM
Scientists use the Saffir-Simpson Hurricane Wind Scale to categorize hurricanes. This scale describes how much damage a hurricane might cause as it develops. The scale classifies hurricanes by wind speed. It goes from a dangerous Category 1 to a destructive Category 5. Category 5 hurricanes only form about once a year.
Saffir-Simpson Hurricane Wind Scale
Stage
Description
Wind Speed
(km/h) Tropical
Depression a storm system with heavy rain and winds
62 or less
Tropical Storm
a storm system with strong thunderstorms and sustained winds
63-118
Category 1
very fast winds that produce minimal damage from flying debris
119-153
Category 2
extremely fast winds that cause moderate damage from flying debris
154-177
Category 3
winds that cause major damage, including window blow-out
178-208
Category 4
winds that cause extensive damage; roofs and walls collapse
209-251
Category 5
catastrophic winds and home destruction
252 or greater
E5 Student Reader v. 9.1 Unit 3 – Page 26 ©2016 KnowAtomTM
Name: ____ ______ Date: ____________________
Heat and Evaporation Investigation
Question Carry out the investigation below to analyze the following question: How does the temperature of a location affect how quickly water evaporates in that location? Research Answer the research questions, using information from the student reader and what you already know about the water cycle and states of matter. 1. What is evaporation? ______________________________________________________________________________
______________________________________________________________________________ 2. What causes water to change from a liquid state to a gas state? ______________________________________________________________________________
______________________________________________________________________________ Hypothesis Record your hypothesis for the question in the space below. ______________________________________________________________________________
______________________________________________________________________________
______________________________________________________________________________
Summarize Experiment This experiment will compare the mass of water that evaporates from cups placed in warm and cool locations. The variable in the experiment is the relative temperature difference between the two locations (warm and cool). The constants in the experiment are the size of the cups and the initial volume of water in each cup.

E5 Student Reader v. 9.1 Unit 3 – Page 27 ©2016 KnowAtomTM
Materials (per team) • 200 mL of water • 2 plastic cups • 1 permanent marker • 1 graduated cup (durable) • 1 digital scale
Procedure
1. Mass an empty plastic cup labeled “Cup 1.” Fill Cup 1 with 100 mL of water and mass.
2. Place Cup 1 in a warm location (in sunlight if possible) for three days.
3. Repeat Step 1 with Cup 2, and then place it in a cool location for three days.
4. Record the mass of the water remaining in the cups on the third day.
Scientific Diagram Diagram your experiment-in-progress. Title the diagram and label the materials used.
Safety (per student) • goggles
E5 Student Reader v. 9.1 Unit 3 – Page 28 ©2016 KnowAtomTM
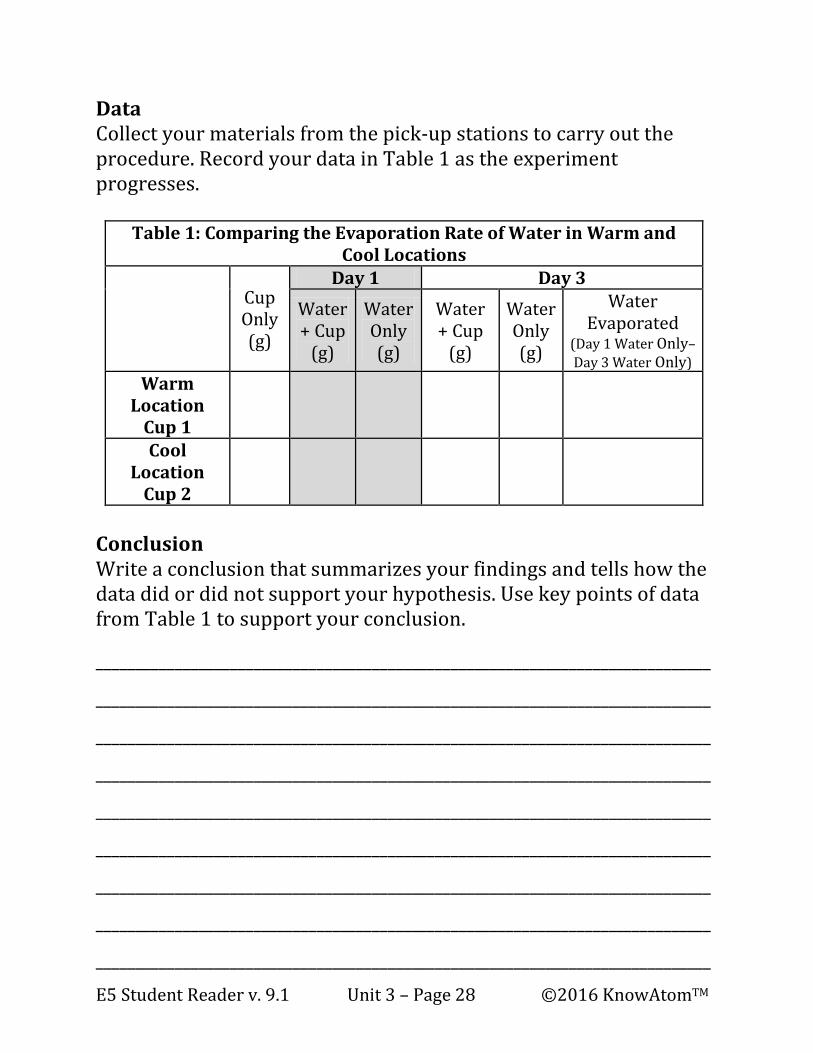
Data Collect your materials from the pick-up stations to carry out the procedure. Record your data in Table 1 as the experiment progresses.
Conclusion Write a conclusion that summarizes your findings and tells how the data did or did not support your hypothesis. Use key points of data from Table 1 to support your conclusion. ______________________________________________________________________________
______________________________________________________________________________
______________________________________________________________________________
______________________________________________________________________________
______________________________________________________________________________
______________________________________________________________________________
______________________________________________________________________________
______________________________________________________________________________
______________________________________________________________________________
Table 1: Comparing the Evaporation Rate of Water in Warm and Cool Locations
Cup Only (g)
Day 1 Day 3 Water + Cup
(g)
Water Only (g)
Water + Cup
(g)
Water Only (g)
Water Evaporated
(Day 1 Water Only– Day 3 Water Only)
Warm Location
Cup 1
Cool Location
Cup 2

E5 Student Reader v. 9.1 Unit 3 – Page 29 ©2016 KnowAtomTM
Section 2 Review
Reading Comprehension Questions:
1. What are two main ideas of Section 2, and how are these ideas supported by key details? 2. How does the cycling of water increase or decrease depending on location on Earth? 3. Why does the text talk about Benjamin Franklin? 4. How are hurricanes related to the water cycle?
E5 Student Reader v. 9.1 Unit 3 – Page 30 ©2016 KnowAtomTM
The Everglades
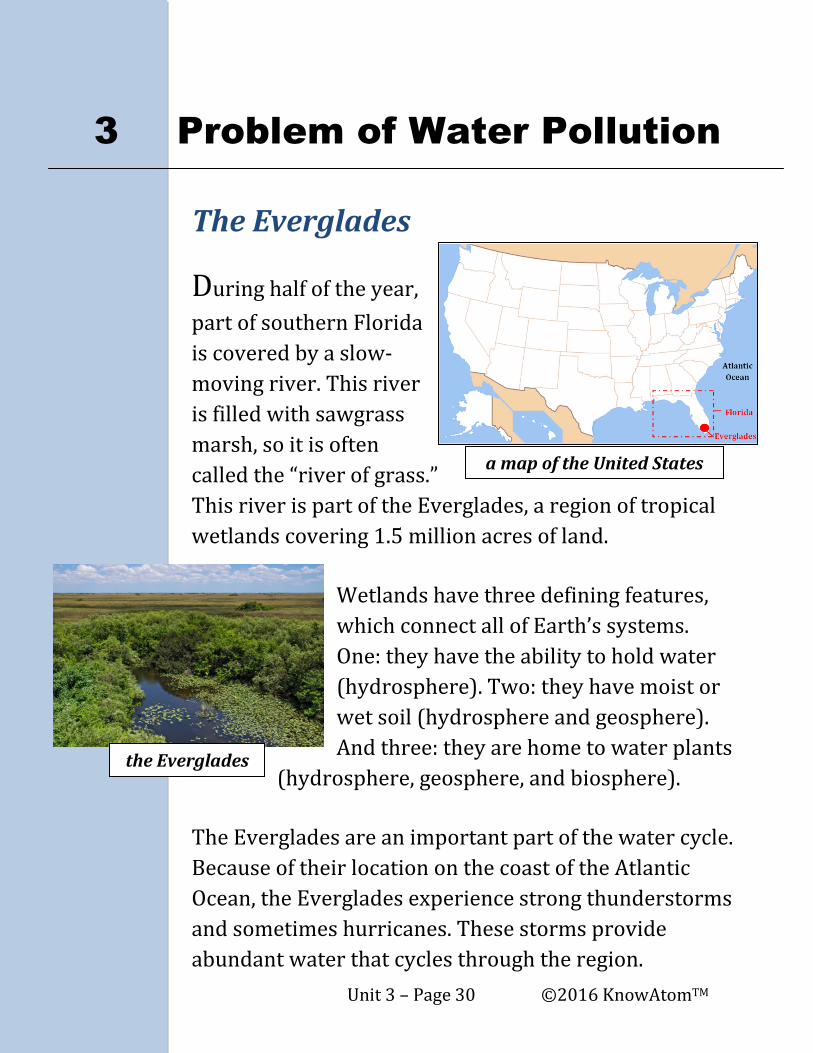
During half of the year, part of southern Florida is covered by a slow-moving river. This river is filled with sawgrass marsh, so it is often called the “river of grass.” This river is part of the Everglades, a region of tropical wetlands covering 1.5 million acres of land.
Wetlands have three defining features, which connect all of Earth’s systems. One: they have the ability to hold water (hydrosphere). Two: they have moist or wet soil (hydrosphere and geosphere). And three: they are home to water plants
(hydrosphere, geosphere, and biosphere). The Everglades are an important part of the water cycle. Because of their location on the coast of the Atlantic Ocean, the Everglades experience strong thunderstorms and sometimes hurricanes. These storms provide abundant water that cycles through the region.
3
Problem of Water Pollution
the Everglades
a map of the United States

E5 Student Reader v. 9.1 Unit 3 – Page 31 ©2016 KnowAtomTM
Part of the Water Cycle There are two seasons in the Everglades: a dry season and a wet season. The dry season lasts from December to April. The wet season lasts from May to November. During the wet season, the Everglades become a river that is shallow but miles wide. It moves so slowly that it is almost impossible to see. Life in the Everglades depends on this natural cycling of water. The wetlands play another important role in the water cycle. They improve water quality because they act as natural filters. Filtration is the process of separating solid matter from a fluid by having the fluid pass through the pores of another substance, called a filter. The Everglades act like a strainer. As water moves from Earth’s surface through the Everglades, it is filtered, becoming purer. For example, some plants in the Everglades take pollutants into their roots and change them into less harmful substances. By the time water has moved through the Everglades, many pollutants have been removed.
Some plants are natural filters.

E5 Student Reader v. 9.1 Unit 3 – Page 32 ©2016 KnowAtomTM
Environmental Threats But the Everglades face many different environmental threats. An environmental threat is anything that can cause harm to the environment. For example, scientists realized that human activity was causing so many pollutants to enter into the water that the Everglades couldn’t filter them all out. This goes back to the water cycle. As rain falls, some of the water is absorbed into the ground. Whatever doesn’t absorb into the ground or get used by plants and animals can become stormwater runoff. Runoff happens when water, along with the substances carried in it, flows from the surface of an area of land, a building or structure. This runoff carries with it sediment from the ground, as well as bacteria, fertilizers, pesticides, oil, and other contaminants. In recent years, scientists have focused on conserving the Everglades. Conservation is the weighing of human needs against the needs of the environment to create a sustainable way for humans to live off of natural resources. Conservation comes in many forms. In the Everglades, it has included setting aside some of the land as a national park and cleaning up polluted rivers.

E5 Student Reader v. 9.1 Unit 3 – Page 33 ©2016 KnowAtomTM
Engineers Solve Problems
Teams of conservation scientists and engineers are working on the problem of water pollution in the Everglades. Engineering is different from science, although science and engineering are connected. Scientists use experiments to gain knowledge. Engineers use that scientific knowledge and mathematics to solve problems by creating new technologies. Similar to how scientists follow a scientific process to answer a question, engineers also follow a process. Engineers often follow a process with eight steps that guides them as they create new technologies to solve problems. The engineering process begins with a problem. In the Everglades, one problem was water pollution that harmed the surrounding environment. When engineers are defining a problem, they include the criteria. The criteria are the needs the solution must meet. They also include the constraints. Constraints are ways the solution is limited. Materials and cost are two common engineering constraints.
Water pollution is one problem facing the Everglades.
© Army Corps of Engineers

E5 Student Reader v. 9.1 Unit 3 – Page 34 ©2016 KnowAtomTM
Once they have identified the problem, engineers need to research it to find out what is known about the problem.
For example, engineers researched where the main sources of pollution in the Everglades were coming from. They realized that much of the pollution came from fertilizers used by farmers and polluted stormwater runoff. They also researched the filtration benefits of the Everglades. For
example, engineers need to know that porous materials allow water to flow through them easily. They also need to know that some materials filter water better than other materials. After engineers have researched their problem, they survey the available materials. This survey includes a sketch of the material, as well as how much of the material they have available and the properties of that material. For example, engineers need to think about the porosity of the materials they are planning to use. The smaller the pore size is, the purer the water will be that flows through it because everything that cannot fit through the pores will be filtered out.
This aerial view shows where stormwater treatment takes place
in the Everglades.
© Centpacrr

E5 Student Reader v. 9.1 Unit 3 – Page 35 ©2016 KnowAtomTM
Engineers then come up with possible solutions for how the problem can be solved with the available materials. For example, many communities use filters made of sand, gravel, soil, or other porous material around storm drains to treat stormwater runoff. As runoff water enters the storm drain, the filter can strain out pollutants before they enter the storm drain. This solution helps to prevent pollution from becoming part of the water cycle. Engineers then diagram and build a prototype. A prototype is a scaled-down first draft of a technology.
Once built, engineers test the prototype. They use the tests to gather data, which are measurements and observations that capture how well the prototype solves the problem during testing. Engineers who want to know how well their storm-drain prototype filter works test it to see how many pollutants it filters out before the water reaches the Everglades. Finally, engineers use their data to decide whether to refine or replicate their prototype. The data tell engineers how well their prototype technology solved the problem.
an example of a water filtration prototype

E5 Student Reader v. 9.1 Unit 3 – Page 36 ©2016 KnowAtomTM
Following an Engineering Process
1
Problem
Identify the problem, including the criteria and constraints of the problem, and summarize in two or three sentences.
2
Research
Use what you know to help solve the problem. Record a minimum of three facts relevant to the problem.
3
Survey Available
Materials
List the available materials that can be used to solve the problem and include for each material a sketch, quantity, description, and properties.
4
Possible Solutions
List three ways the problem can be solved with the available materials.
5
Diagram and Build Prototype
Draw a hand-sized scientific diagram of the prototype solution you will then build from your materials. A scaled-down version of a technology is called a prototype. Title the diagram and include labels for each material or part of your prototype.
6
Test
Test your prototype to see how well it solves the problem.
7
Data
Collect data (measurements and observations) as evidence for how well the prototype solves the problem.
8
Refine or Replicate
Use your data to evaluate the success of the prototype and recommend if it should be refined or replicated. You may redesign your prototype to better solve the problem. Every conclusion must contain a minimum of three elements:
1. Restate the problem and describe the prototype technology.
2. Make a claim about whether the technology should be refined or replicated.
3. Use key points of data gathered from testing to support the recommendation to refine or replicate.

E5 Student Reader v. 9.1 Unit 3 – Page 37 ©2016 KnowAtomTM
Section 3 Review
Reading Comprehension Questions:
1. What is the main idea of Section 3? What details are used to support this idea? 2. How are Earth’s systems connected in wetlands such as the Everglades? 3. Why does the text say that the Everglades act like a strainer? 4. How are design solutions that filter out pollution an example of the STEM cycle in action?

E5 Student Reader v. 9.1 Unit 3 – Page 38 ©2016 KnowAtomTM
Science Words to Know climate – the average weather over a span of 30 years conservation – the weighing of human needs against the needs of the environment to create a sustainable way for humans to live off of natural resources engineer – a person who uses scientific knowledge and mathematics to solve a problem by creating new technologies environmental threat – anything that can cause harm to the environment (e.g., pollution, deforestation, invasive species, overhunting, and climate change) evaporation – the process of liquid water changing into water vapor, its gas state filtration – the process of separating solid matter from a fluid by having the fluid pass through the pores of another substance, called a filter hurricane – a storm system with strong thunderstorms and sustained winds of 119 to more than 252 kilometers per hour ocean currents – paths of flowing ocean water that push warm and cold water to different parts of the planet

E5 Student Reader v. 9.1 Unit 3 – Page 39 ©2016 KnowAtomTM
precipitation – the process of water falling back to Earth in the form of rain, snow, sleet, or hail proportion – the relationship between things, as to size, quantity, or number prototype – a scaled-down first draft of a technology runoff – occurs when water, along with the substances carried in it, flow from the surface of an area of land, a building or structure water cycle – the circulation of water through the hydrosphere from Earth’s surface to the atmosphere and back weather – the conditions of the atmosphere (temperature, humidity, wind speed, air pressure, and precipitation) in a particular place at a particular time

E5 Student Reader v. 9.1 Unit 3 – Page 40 ©2016 KnowAtomTM