Embed Size (px)
Citation preview
Environment International 37 (2011) 479–497
Contents lists available at ScienceDirect
Environment International
j ourna l homepage: www.e lsev ie r.com/ locate /env int
Review
Water pollution in Pakistan and its impact on public health — A review
Azizullah Azizullah a, Muhammad Nasir Khan Khattak b, Peter Richter a,⁎, Donat-Peter Häder a
a Department of Biology, Friedrich-Alexander University, Staudtstr. 5, 91058 Erlangen, Germanyb Department of Neurosurgery, Friedrich-Alexander University, Schwabachanlage 6, 91054 Erlangen, Germany
Abbreviations: BOD, Biological oxygen demand; CODethylene; DDT, 1,1,1-trichloro-2,2-bis-(p-chlorophenyl)level; MNVD, Main Nara Valley Drain; MOE-PAK, MinisNWQM, National Water Quality Monitoring; PAK-EPA,Environmental Protection Ordinance; TDS, Total dissolveThe United Nations International Children's Fund; UNOWWF, World Wide Fund for Nature (World Wildlife Fu⁎ Corresponding author.
E-mail address: [email protected] (P
0160-4120/$ – see front matter © 2010 Elsevier Ltd. Aldoi:10.1016/j.envint.2010.10.007
a b s t r a c t
a r t i c l e i n f oArticle history:Received 23 July 2010Accepted 19 October 2010Available online 18 November 2010
Keywords:Health impactMajor pollutantsPakistanWater pollutionSources of pollution
Water pollution is one of the major threats to public health in Pakistan. Drinking water quality is poorlymanaged and monitored. Pakistan ranks at number 80 among 122 nations regarding drinking water quality.Drinking water sources, both surface and groundwater are contaminated with coliforms, toxic metals andpesticides throughout the country. Various drinking water quality parameters set by WHO are frequentlyviolated. Human activities like improper disposal of municipal and industrial effluents and indiscriminateapplications of agrochemicals in agriculture are the main factors contributing to the deterioration of waterquality. Microbial and chemical pollutants are the main factors responsible exclusively or in combination forvarious public health problems. This review discusses a detailed layout of drinking water quality in Pakistanwith special emphasis onmajor pollutants, sources of pollution and the consequent health problems. The datapresented in this review are extracted from various studies published in national and international journals.Also reports released by the government and non-governmental organizations are included.
, Chemical oxygen demand; DDD, 1,1-dichloro-2,2-bis(p-ethane; EEC, European Economic Community; MAC, Mtry of Environment, Pakistan; NWFP, North West FrontPakistan Environmental Protection Agency; PCRWR, Pad solids; TSS, Total suspended solids; UNESCO, The United, United Nations Organization; USEPA, United States Envnd).
. Richter).
l rights reserved.
© 2010 Elsevier Ltd. All rights reserved.
Contents
1. Introduction . . . . . . . . . . . . . . . . . . . . . . . . . . . . . . . . . . . . . . . . . . . . . . . . . . . . . . . . . . . . . . 4792. Major pollutants . . . . . . . . . . . . . . . . . . . . . . . . . . . . . . . . . . . . . . . . . . . . . . . . . . . . . . . . . . . . 480
2.1. Bacteriological contamination . . . . . . . . . . . . . . . . . . . . . . . . . . . . . . . . . . . . . . . . . . . . . . . . . . 4802.2. Toxic metals . . . . . . . . . . . . . . . . . . . . . . . . . . . . . . . . . . . . . . . . . . . . . . . . . . . . . . . . . . 4822.3. Major cations and anions . . . . . . . . . . . . . . . . . . . . . . . . . . . . . . . . . . . . . . . . . . . . . . . . . . . . 485
2.3.1. Cations . . . . . . . . . . . . . . . . . . . . . . . . . . . . . . . . . . . . . . . . . . . . . . . . . . . . . . . . . 4852.3.2. Anions . . . . . . . . . . . . . . . . . . . . . . . . . . . . . . . . . . . . . . . . . . . . . . . . . . . . . . . . . 488
2.4. Pesticides . . . . . . . . . . . . . . . . . . . . . . . . . . . . . . . . . . . . . . . . . . . . . . . . . . . . . . . . . . . . 4883. Sources of water pollution . . . . . . . . . . . . . . . . . . . . . . . . . . . . . . . . . . . . . . . . . . . . . . . . . . . . . . . 4914. Water pollution and human health . . . . . . . . . . . . . . . . . . . . . . . . . . . . . . . . . . . . . . . . . . . . . . . . . . . 4935. Environmental legislations in Pakistan and their effectiveness . . . . . . . . . . . . . . . . . . . . . . . . . . . . . . . . . . . . . . 4936. Conclusion and recommendations . . . . . . . . . . . . . . . . . . . . . . . . . . . . . . . . . . . . . . . . . . . . . . . . . . . 494References . . . . . . . . . . . . . . . . . . . . . . . . . . . . . . . . . . . . . . . . . . . . . . . . . . . . . . . . . . . . . . . . . 494
1. Introduction
The importance of availability of high quality drinking water can berealized by the press release of UNO Secretary General on world water
day 2002. “An estimated 1.1 billion people lack access to safe drinkingwater, 2.5 billion people have no access to proper sanitation, and morethan 5 million people die each year from water-related diseases — 10times the number killed in wars, on average, each year. All too often,
chlorophenyl) ethane; DDE, 1,1-dichloro-2,2-bis(p-chlorophenyl)aximum acceptance concentration; MCL, Maximum contaminantier Province (former name of Khyber Phakhtoonkhwa Province);kistan Council for Research in Water Resources; PEPO, PakistanNations Educational, Scientific and Cultural Organization; UNICEF,ironmental Protection Agency; WHO, World Health Organization;
480 A. Azizullah et al. / Environment International 37 (2011) 479–497
water is treated as an infinite free good. Yet even where supplies aresufficient or plentiful, they are increasingly at risk from pollution andrising demand. By 2025, two thirds of the world's population is likely tolive in countries with moderate or severe water shortages”.
Water is anessential element for life. Freshwater comprises 3%of thetotal water on earth. Only a small percentage (0.01%) of this freshwateris available for human use (Hinrichsen and Tacio, 2002). Unfortunatelyeven this small proportion of freshwater is under immense stress due torapid population growth, urbanization and unsustainable consumptionof water in industry and agriculture. According to a UNO report, theworld population is increasing exponentially while the availability offreshwater is declining.Many countries in Africa,Middle East and SouthAsiawill have serious threats of water shortage in the next two decades.In developing countries the problem is further aggravated due tothe lack of proper management, unavailability of professionals andfinancial constraint (PCRWR, 2005).
Like other developing countries of the world, Pakistan is also facingcritical water shortage and pollution. The country has essentiallyexhausted its available water resources (PCRWR, 2005); it is consideredas water stressed and is likely to have a water scarcity in the near future(Hashmi et al., 2009a;WWF, 2007). The water precipitation rate is lowerthan the evaporation rate in the country. This causes a continuousdecrease in water quantity in its rivers, lakes and diminishing thegroundwater as well. The problem is further aggravated by factors likelong droughts and lack of construction of new water reservoirs (PCRWR,2005; Ullah et al., 2009). This decrease in water quantity coupled withincreasing demand resulted in severe water shortage in almost all sectorsof the country. The per capita water availability in the country droppedfrom 5000 in 1951 to 1100 m3 per annum (WB-SCEA, 2006). Exponentialincrease in population of the country and no development of new waterresources may cause per capita water availability of less than 1000 m3
from the year 2010 onwards. The situation might get worse in areassituated outside the Indus basin where the average per capita wateravailability per annum is already below 1000 m3 (PAK-EPA, 2005b). Incertain regions, like the drought-affected areas of Sindh Province, peoplealready have no fresh water for drinking and are compelled to drinkbrackish water (Ullah et al., 2009). In Baluchistan Province, theunderground aquifers are dropping at a rate of 3.5 m annually and willbe exhausted in thenext 15 years (Sajjad et al., 1998). This combinationofdecreasingquantity and increasingusage inmultiple sectorshasadverselyaffected the quality of water and resulted in a serious problem of waterpollution.Water quality inmost of the rivers, lakes and ground aquifers ofthe country is considered not to be safe for human consumption.
Various reports present conflicting data about the availability andquality of drinking water to the public in the country. According tonational statistics 56% of the total population has access to safe drinkingwater (Farooq et al., 2008). However, considering international standardsfor safe and drinkable water, only 25.61% (rural 23.5% and 30% urban) ofthe population in Pakistan have access to this basic need (Rosemann,2005). Drinking water supplied by municipalities to the public is mostlycontaminated with infectious microorganisms or hazardous chemicals(WWF, 2007). Drinking water in densely populated cities like Karachi,Lahore, Rawalpindi, Peshawar, Faisalabad, Qasur, Sialkot and Gujrat is
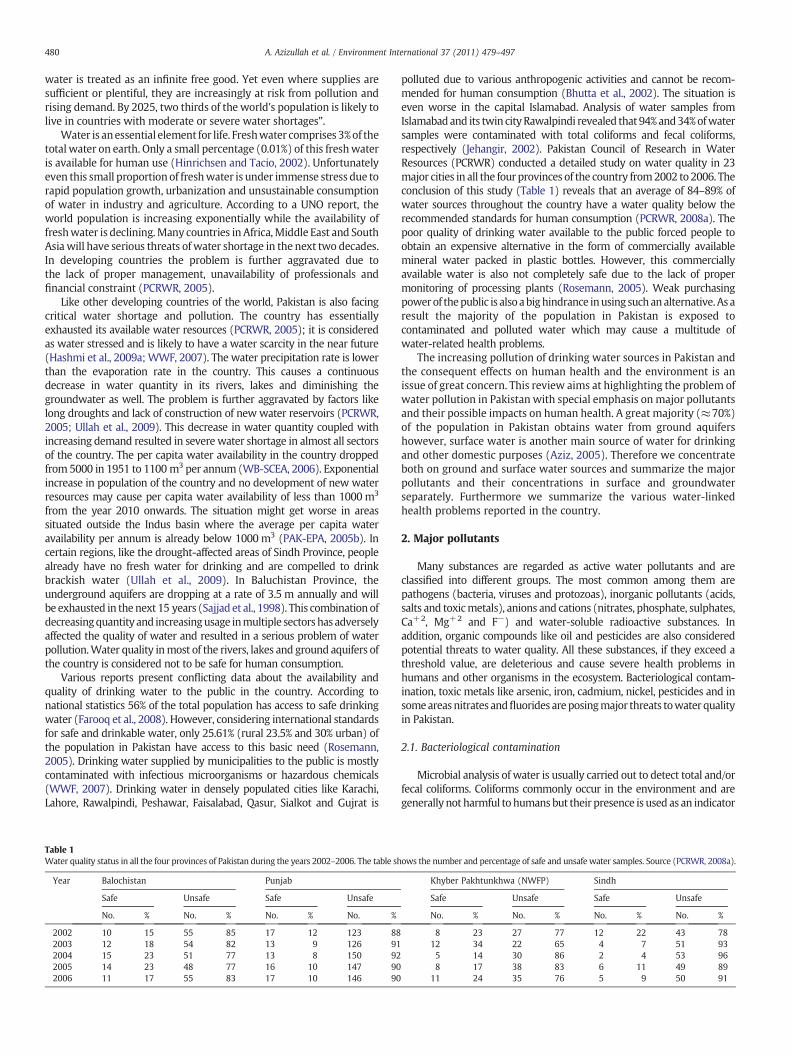
Table 1Water quality status in all the four provinces of Pakistan during the years 2002–2006. The table sh
Year Balochistan Punjab
Safe Unsafe Safe Unsafe
No. % No. % No. % No. %
2002 10 15 55 85 17 12 123 882003 12 18 54 82 13 9 126 912004 15 23 51 77 13 8 150 922005 14 23 48 77 16 10 147 902006 11 17 55 83 17 10 146 90
polluted due to various anthropogenic activities and cannot be recom-mended for human consumption (Bhutta et al., 2002). The situation iseven worse in the capital Islamabad. Analysis of water samples fromIslamabadand its twin cityRawalpindi revealed that 94%and34%ofwatersamples were contaminated with total coliforms and fecal coliforms,respectively (Jehangir, 2002). Pakistan Council of Research in WaterResources (PCRWR) conducted a detailed study on water quality in 23major cities in all the four provinces of the country from2002 to 2006. Theconclusion of this study (Table 1) reveals that an average of 84–89% ofwater sources throughout the country have a water quality below therecommended standards for human consumption (PCRWR, 2008a). Thepoor quality of drinking water available to the public forced people toobtain an expensive alternative in the form of commercially availablemineral water packed in plastic bottles. However, this commerciallyavailable water is also not completely safe due to the lack of propermonitoring of processing plants (Rosemann, 2005). Weak purchasingpowerof thepublic is alsoabighindrance inusing suchanalternative.Asaresult the majority of the population in Pakistan is exposed tocontaminated and polluted water which may cause a multitude ofwater-related health problems.
The increasing pollution of drinking water sources in Pakistan andthe consequent effects on human health and the environment is anissue of great concern. This review aims at highlighting the problem ofwater pollution in Pakistan with special emphasis on major pollutantsand their possible impacts on human health. A great majority (≈70%)of the population in Pakistan obtains water from ground aquifershowever, surface water is another main source of water for drinkingand other domestic purposes (Aziz, 2005). Therefore we concentrateboth on ground and surface water sources and summarize the majorpollutants and their concentrations in surface and groundwaterseparately. Furthermore we summarize the various water-linkedhealth problems reported in the country.
2. Major pollutants
Many substances are regarded as active water pollutants and areclassified into different groups. The most common among them arepathogens (bacteria, viruses and protozoas), inorganic pollutants (acids,salts and toxicmetals), anions and cations (nitrates, phosphate, sulphates,Ca+2, Mg+2 and F−) and water-soluble radioactive substances. Inaddition, organic compounds like oil and pesticides are also consideredpotential threats to water quality. All these substances, if they exceed athreshold value, are deleterious and cause severe health problems inhumans and other organisms in the ecosystem. Bacteriological contam-ination, toxic metals like arsenic, iron, cadmium, nickel, pesticides and insomeareasnitrates andfluorides areposingmajor threats towater qualityin Pakistan.
2.1. Bacteriological contamination
Microbial analysis of water is usually carried out to detect total and/orfecal coliforms. Coliforms commonly occur in the environment and aregenerally not harmful to humans but their presence is used as an indicator
ows the number and percentage of safe and unsafe water samples. Source (PCRWR, 2008a).
Khyber Pakhtunkhwa (NWFP) Sindh
Safe Unsafe Safe Unsafe
No. % No. % No. % No. %
8 23 27 77 12 22 43 7812 34 22 65 4 7 51 935 14 30 86 2 4 53 968 17 38 83 6 11 49 89
11 24 35 76 5 9 50 91

481A. Azizullah et al. / Environment International 37 (2011) 479–497
for water contaminationwith diseases causing germs and pathogens. Thepresence of fecal coliforms and E. coli is also an indicator for watercontamination with human or animal wastes (Farooq et al., 2008).According to the WHO standard for public drinking water total and fecalcoliforms must not be present in 100 mL of water samples i.e. 0 counts/100 mL of water sample (WHO, 1993).
In Pakistan bacteriological contamination has been regarded as themost potential problem of drinking water (PCRWR, 2005). Many studiesreveal heavy bacteriological contamination of drinking water in thecountry as summarized in Table 2 and many of the reported species ofbacteria can cause severe health problems (Table 2a). Water sourcesincluding rivers, lakes and ground aquifers in most of the regions in thecountry are highly polluted with bacteriological contamination (Aziz,2005). In Rawalpindi samples from the water distribution networks andeven at treatment plants were found contaminated with total coliformand in some sites with fecal coliform (Farooq et al., 2008; Hashmi et al.,2009b). In Khairpur in the Sindh province, out of 768 drinking watersamples 567 (73.83%) and 351 (45.70%) were contaminated with totalcoliform and fecal coliform, respectively (Shar et al., 2008b). Anotherstudy conducted in the same city revealed the presence of total coliformsand fecal coliforms in all 90 (100%)water samples collected fromthemainreservoir, distribution lines and consumer taps (Shar et al., 2008a). Thesituation is not much different in other major cities of the country likePeshawar, Lahore andKarachi. In all these cities drinkingwaterwas foundcontaminatedwithbacteria (Anwaret al., 1999, 2004;Hussainet al., 2007;Mumtaz et al., 2010; Sarwar et al., 2004; Zahoorullah et al., 2003). Anotherstudy conducted in major cities of the country reported 65% and 35% ofgroundwater samples contaminated with total coliforms and E. coli,respectively, while 100% samples of the surface water had bacterialcontamination of both total coliforms and E. coli (PCRWR, 2005). A veryrecent study reported that water samples from Rawal Lake, Islamabad,
Table 2Bacteriological contamination of drinking water in various parts of Pakistan. Data are extrpublication.
Sampling location No. of samples
Total Contaminated withtotal coliform
Contaminatedfecal coliform
Rural areas of Punjab – – –
Tap water Lahore city – – –
Four villages in Peshawar 39 38 –
In and around Peshawar 224 92+42a 52Nine different localities in Lahore 2160 446b –
Filtration plants, Islamabad 5 3 –
Filtration plants, Rawalpindi 26 14 –
Surface water samples from varioussources in Pakistan
20 20 20
Groundwater samples from varioussources in Pakistan
344 223 122
Fifteen tube wells around NullahLai Rawalpindi
15 14 –
Groundwater, Karachi 115Tap water (treated) Karachi city 329 – 94Well water, Karachi city 30 – 23Khairpur city, Sindh 768 567 351Khairpur city, Sindh 90 90 90Rawalpindi different locations 8c 2 2Westridge area water distributionnetwork, Rawalpindi
8c 8 8
Tench area water distributionnetwork, Rawalpindi
8c 8 7
Ratta Amral water distributionnetwork, Rawalpindi
8c 6 6
Input water sources of RawalLake, Islamabad
4 4 4
Rawal Lake, Islamabad(at various depth)
9 9 6
a Untreated and treated samples.b Samples having bacterial contamination but not mentioned whether total coliform or fc Number of stations/spots from where samples were collected.
(a lake providing drinking water to more than 1.5 million people ofRawalpindi) and its feeding streams were potentially contaminated withbacteria (Mashiatullah et al., 2010).
Surface and groundwater contamination with bacteria is usuallyattributed to surface runoff through urban areas and pastures, leakage ofsewage disposal systems and septic tanks, overloaded sewage treatmentplants, disposal systems and raw sewage deep well injection (PCRWR,2005). Other factors like cross-connection, broken or leaking pipes, back-siphonage (backflowof polluted or contaminatedwater, froma plumbingfixture or cross-connection into a water supply line, due to a lowering ofthe pressure in the line) and intermittent water supply result incontamination of the distribution system (PCRWR, 2005; Shar et al.,2008b). In rural areas open dugwells and lowwater tablemake it furthervulnerable to bacterial contamination. It is generally considered that thewater is free from bacteriological contamination at the sources andbecomes contaminated in pipes due to unauthorized connection orleakage. But in reality the situation is different in the country aswaterwasfound to contain bacterial contamination even at the source or treatmentplants (Hashmi et al., 2009a; PAK-EPA, 2005a). In the capital, Islamabad(PAK-EPA, 2005a) and Rawalpindi (Farooq et al., 2008; PAK-EPA, 2005a),the filtration and treatment plants do not properly purify water frombacterial contamination before distribution. The situation could be worsein other cities and especially in rural areaswhere there is nomonitoring ofdrinking water quality and no treatment plants exist. Bacterial contam-ination in rural areas is usually expected to be higher than in urban areas.This hypothesis is supported by studies in the rural area of Punjab, where91.30%and95.83%of samples fromtap anddomestic pumps, respectively,were found contaminated with bacteria as compared to 42.85% of tapwater samples from Lahore (Anwar et al., 1999).
Microbial contamination of drinking water is a major contributor towater-borne diseases like diarrhea, nausea, gastroenteritis, typhoid,
acted from various individual studies and arranged chronologically based on year of
% of samples References
with Contaminated withtotal coliform
Contaminated withfecal coliform
91.30–95.83 – Anwar et al. (1999)42.85 – Anwar et al. (1999)97.4 – Zahoorullah et al. (2003)81+19a Sarwar et al. (2004)20.64b – Anwar et al. (2004)60 – PAK-EPA (2005a)53.8 – PAK-EPA (2005a)100 100 PCRWR (2005)
65 35 PCRWR (2005)
93 – Islam-Ul-Haq et al. (2007)
66.63 60.89 Mah-Urooj et al. (2007)– 28.5 Shaikh et al. (2008)– 76 Shaikh et al. (2008)73.83 45.70 Shar et al. (2008b)100 100 Shar et al. (2008a)25 25 Farooq et al. (2008)100 100 Hashmi et al. (2009a)
100 87.5 Hashmi et al. (2009a)
75 75 Hashmi et al. (2009b)
100 100 Mashiatullah et al. (2010)
100 66.6 Mashiatullah et al. (2010)
ecal coliform.
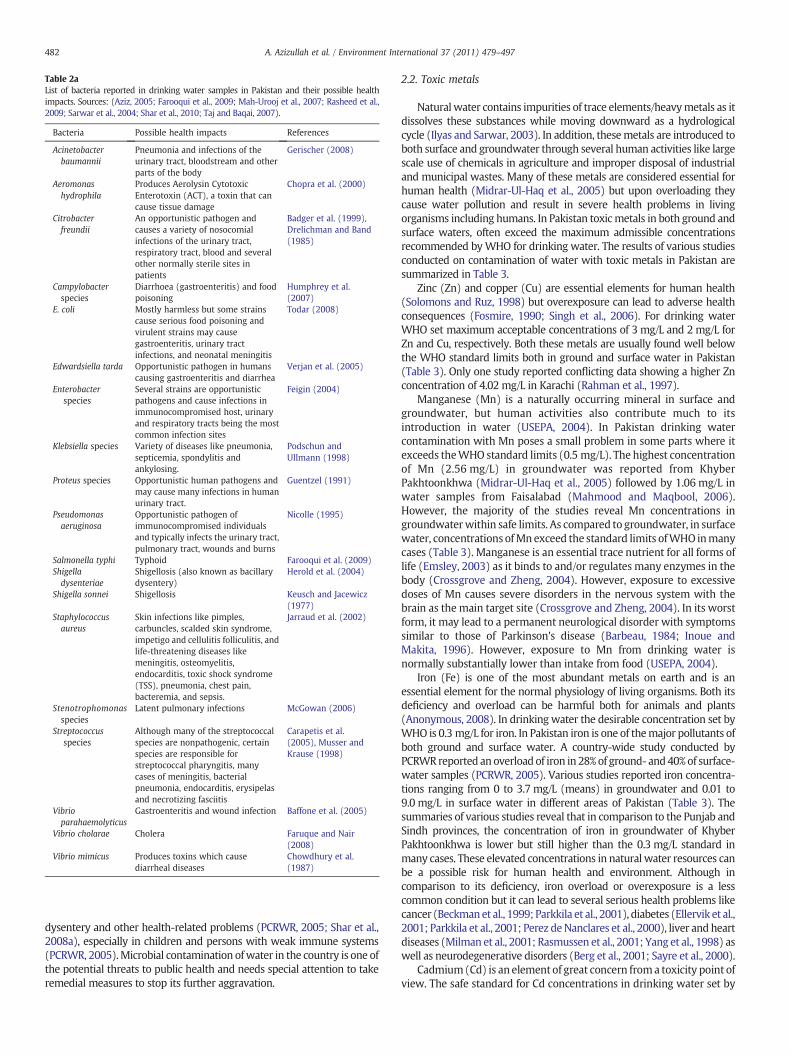
Table 2aList of bacteria reported in drinking water samples in Pakistan and their possible healthimpacts. Sources: (Aziz, 2005; Farooqui et al., 2009; Mah-Urooj et al., 2007; Rasheed et al.,2009; Sarwar et al., 2004; Shar et al., 2010; Taj and Baqai, 2007).
Bacteria Possible health impacts References
Acinetobacterbaumannii
Pneumonia and infections of theurinary tract, bloodstream and otherparts of the body
Gerischer (2008)
Aeromonashydrophila
Produces Aerolysin CytotoxicEnterotoxin (ACT), a toxin that cancause tissue damage
Chopra et al. (2000)
Citrobacterfreundii
An opportunistic pathogen andcauses a variety of nosocomialinfections of the urinary tract,respiratory tract, blood and severalother normally sterile sites inpatients
Badger et al. (1999),Drelichman and Band(1985)
Campylobacterspecies
Diarrhoea (gastroenteritis) and foodpoisoning
Humphrey et al.(2007)
E. coli Mostly harmless but some strainscause serious food poisoning andvirulent strains may causegastroenteritis, urinary tractinfections, and neonatal meningitis
Todar (2008)
Edwardsiella tarda Opportunistic pathogen in humanscausing gastroenteritis and diarrhea
Verjan et al. (2005)
Enterobacterspecies
Several strains are opportunisticpathogens and cause infections inimmunocompromised host, urinaryand respiratory tracts being the mostcommon infection sites
Feigin (2004)
Klebsiella species Variety of diseases like pneumonia,septicemia, spondylitis andankylosing.
Podschun andUllmann (1998)
Proteus species Opportunistic human pathogens andmay cause many infections in humanurinary tract.
Guentzel (1991)
Pseudomonasaeruginosa
Opportunistic pathogen ofimmunocompromised individualsand typically infects the urinary tract,pulmonary tract, wounds and burns
Nicolle (1995)
Salmonella typhi Typhoid Farooqui et al. (2009)Shigelladysenteriae
Shigellosis (also known as bacillarydysentery)
Herold et al. (2004)
Shigella sonnei Shigellosis Keusch and Jacewicz(1977)
Staphylococcusaureus
Skin infections like pimples,carbuncles, scalded skin syndrome,impetigo and cellulitis folliculitis, andlife-threatening diseases likemeningitis, osteomyelitis,endocarditis, toxic shock syndrome(TSS), pneumonia, chest pain,bacteremia, and sepsis.
Jarraud et al. (2002)
Stenotrophomonasspecies
Latent pulmonary infections McGowan (2006)
Streptococcusspecies
Although many of the streptococcalspecies are nonpathogenic, certainspecies are responsible forstreptococcal pharyngitis, manycases of meningitis, bacterialpneumonia, endocarditis, erysipelasand necrotizing fasciitis
Carapetis et al.(2005), Musser andKrause (1998)
Vibrioparahaemolyticus
Gastroenteritis and wound infection Baffone et al. (2005)
Vibrio cholarae Cholera Faruque and Nair(2008)
Vibrio mimicus Produces toxins which causediarrheal diseases
Chowdhury et al.(1987)
482 A. Azizullah et al. / Environment International 37 (2011) 479–497
dysentery and other health-related problems (PCRWR, 2005; Shar et al.,2008a), especially in children and persons with weak immune systems(PCRWR, 2005).Microbial contamination ofwater in the country is one ofthe potential threats to public health and needs special attention to takeremedial measures to stop its further aggravation.
2.2. Toxic metals
Naturalwater contains impurities of trace elements/heavymetals as itdissolves these substances while moving downward as a hydrologicalcycle (Ilyas and Sarwar, 2003). In addition, thesemetals are introduced toboth surface and groundwater through several human activities like largescale use of chemicals in agriculture and improper disposal of industrialand municipal wastes. Many of these metals are considered essential forhuman health (Midrar-Ul-Haq et al., 2005) but upon overloading theycause water pollution and result in severe health problems in livingorganisms including humans. In Pakistan toxicmetals in both ground andsurface waters, often exceed the maximum admissible concentrationsrecommended byWHO for drinking water. The results of various studiesconducted on contamination of water with toxic metals in Pakistan aresummarized in Table 3.
Zinc (Zn) and copper (Cu) are essential elements for human health(Solomons and Ruz, 1998) but overexposure can lead to adverse healthconsequences (Fosmire, 1990; Singh et al., 2006). For drinking waterWHO set maximum acceptable concentrations of 3 mg/L and 2 mg/L forZn and Cu, respectively. Both these metals are usually found well belowthe WHO standard limits both in ground and surface water in Pakistan(Table 3). Only one study reported conflicting data showing a higher Znconcentration of 4.02 mg/L in Karachi (Rahman et al., 1997).
Manganese (Mn) is a naturally occurring mineral in surface andgroundwater, but human activities also contribute much to itsintroduction in water (USEPA, 2004). In Pakistan drinking watercontamination with Mn poses a small problem in some parts where itexceeds theWHO standard limits (0.5 mg/L). The highest concentrationof Mn (2.56 mg/L) in groundwater was reported from KhyberPakhtoonkhwa (Midrar-Ul-Haq et al., 2005) followed by 1.06 mg/L inwater samples from Faisalabad (Mahmood and Maqbool, 2006).However, the majority of the studies reveal Mn concentrations ingroundwaterwithin safe limits. As compared to groundwater, in surfacewater, concentrations ofMnexceed the standard limits ofWHO inmanycases (Table 3). Manganese is an essential trace nutrient for all forms oflife (Emsley, 2003) as it binds to and/or regulates many enzymes in thebody (Crossgrove and Zheng, 2004). However, exposure to excessivedoses of Mn causes severe disorders in the nervous system with thebrain as the main target site (Crossgrove and Zheng, 2004). In its worstform, it may lead to a permanent neurological disorder with symptomssimilar to those of Parkinson's disease (Barbeau, 1984; Inoue andMakita, 1996). However, exposure to Mn from drinking water isnormally substantially lower than intake from food (USEPA, 2004).
Iron (Fe) is one of the most abundant metals on earth and is anessential element for the normal physiology of living organisms. Both itsdeficiency and overload can be harmful both for animals and plants(Anonymous, 2008). In drinking water the desirable concentration set byWHO is 0.3 mg/L for iron. In Pakistan iron is one of themajor pollutants ofboth ground and surface water. A country-wide study conducted byPCRWR reported an overload of iron in 28%of ground- and40%of surface-water samples (PCRWR, 2005). Various studies reported iron concentra-tions ranging from 0 to 3.7 mg/L (means) in groundwater and 0.01 to9.0 mg/L in surface water in different areas of Pakistan (Table 3). Thesummaries of various studies reveal that in comparison to the Punjab andSindh provinces, the concentration of iron in groundwater of KhyberPakhtoonkhwa is lower but still higher than the 0.3 mg/L standard inmany cases. These elevated concentrations in natural water resources canbe a possible risk for human health and environment. Although incomparison to its deficiency, iron overload or overexposure is a lesscommon condition but it can lead to several serious health problems likecancer (Beckmanet al., 1999; Parkkila et al., 2001), diabetes (Ellervik et al.,2001; Parkkila et al., 2001; Perez deNanclares et al., 2000), liver and heartdiseases (Milman et al., 2001; Rasmussen et al., 2001; Yang et al., 1998) aswell as neurodegenerative disorders (Berg et al., 2001; Sayre et al., 2000).
Cadmium(Cd) is an element of great concern froma toxicity point ofview. The safe standard for Cd concentrations in drinking water set by
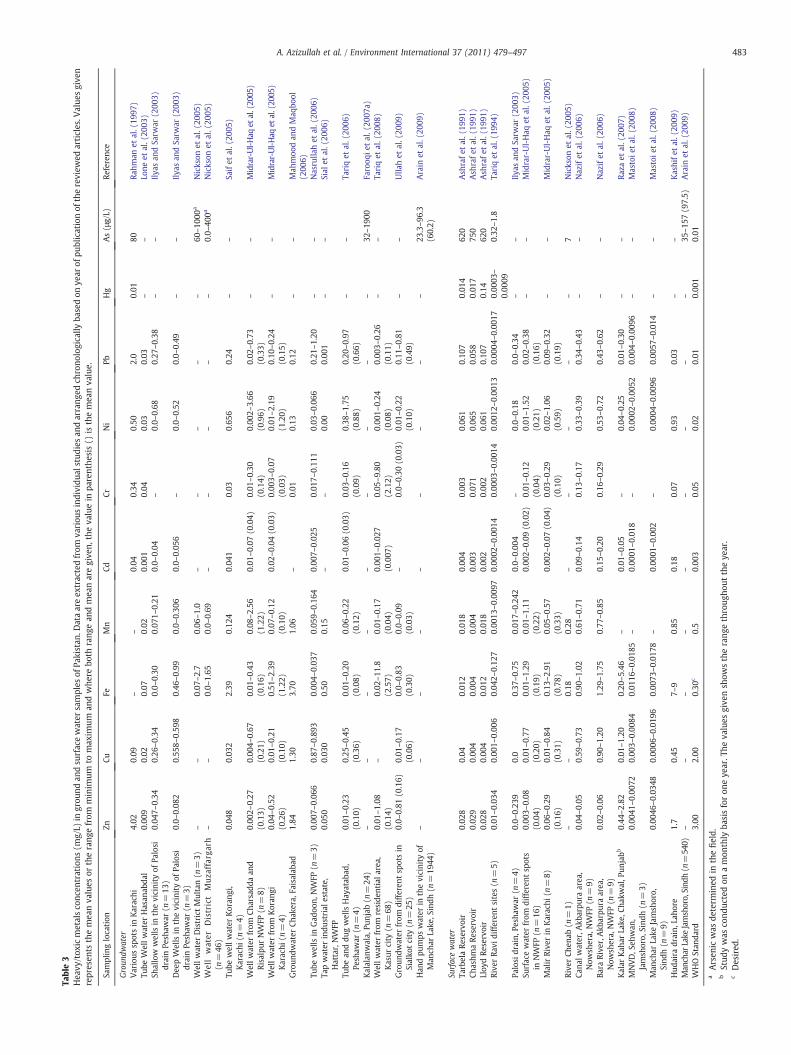
Table3
Hea
vy/tox
icmetalsco
ncen
trations
(mg/L)
ingrou
ndan
dsu
rfacewater
samples
ofPa
kistan
.Dataareex
tractedfrom
variou
sindividu
alstud
iesan
darrang
edch
rono
logically
basedon
year
ofpu
blicationof
thereview
edarticles.V
alue
sgive
nrepresen
tsthemea
nva
lues
ortherang
efrom
minim
umto
max
imum
andwhe
rebo
thrang
ean
dmea
naregive
n,theva
luein
parenthe
sis()
isthemea
nva
lue.
Samplinglocation
ZnCu
FeMn
CdCr
Ni
PbHg
As(μg/L)
Referenc
e
Groun
dwater
Various
spotsin
Karachi
4.02
0.09
––
0.04
0.34
0.50
2.0
0.01
80Ra
hman
etal.(19
97)
Tube
Wellw
ater
Hasan
abda
l0.00
90.02
0.07
0.02
0.00
10.04
0.03
0.03
––
Lone
etal.(20
03)
Shallow
wells
inthevicinity
ofPa
losi
drainPe
shaw
ar(n
=13
)0.04
7–0.34
0.26
–0.34
0.0–
0.30
0.07
1–0.21
0.0–
0.04
–0.0–
0.68
0.27
–0.38
––
Ilyas
andSa
rwar
(200
3)
Dee
pW
ells
inthevicinity
ofPa
losi
drainPe
shaw
ar(n
=3)
0.0–
0.08
20.55
8–0.59
80.46
–0.99
0.0–
0.30
60.0–
0.05
6–
0.0–
0.52
0.0–
0.49
––
Ilyas
andSa
rwar
(200
3)
Wellw
ater
DistrictMultan(n
=3)
––
0.07
–2.7
0.06
–1.0
––
––
–60
–10
00a
Nickson
etal.(20
05)
Well
water
District
Muza
ffar
garh
(n=
46)
––
0.0–
1.65
0.0–
0.69
––
––
–0.0–
400a
Nickson
etal.(20
05)
Tube
wellw
ater
Koran
gi,
Karachi
(n=
4)0.04
80.03
22.39
0.12
40.04
10.03
0.65
60.24
––
Saifet
al.(20
05)
Wellw
ater
from
Charsadd
aan
dRisalpur
NW
FP(n
=8)
0.00
2–0.27
(0.13)
0.00
4–0.67
(0.21)
0.01
–0.43
(0.16)
0.08
–2.56
(1.22)
0.01
–0.07
(0.04)
0.01
–0.30
(0.14)
0.00
2–3.66
(0.96)
0.02
–0.73
(0.33)
––
Midrar-Ul-Haq
etal.(20
05)
Wellw
ater
from
Koran
giKarachi
(n=
4)0.04
–0.52
(0.26)
0.01
–0.21
(0.10)
0.51
–2.39
(1.22)
0.07
–0.12
(0.10)
0.02
–0.04
(0.03)
0.00
3–0.07
(0.03)
0.01
–2.19
(1.20)
0.10
–0.24
(0.15)
––
Midrar-Ul-Haq
etal.(20
05)
Groun
dwater
Chak
era,
Faisalab
ad1.84
1.30
3.70
1.06
–0.01
0.13
0.12
––
Mah
moo
dan
dMaq
bool
(200
6)Tu
bewells
inGad
oon,
NW
FP(n
=3)
0.00
7–0.06
60.87
–0.89
30.00
4–0.03
70.05
9–0.16
40.00
7–0.02
50.01
7–0.11
10.03
–0.06
60.21
–1.20
––
Nasrulla
het
al.(20
06)
Tapwater
indu
strial
estate,
Hattar,NW
FP0.05
00.03
00.50
0.15
––
0.00
0.00
1–
–Sial
etal.(20
06)
Tube
anddu
gwells
Hay
atab
ad,
Pesh
awar
(n=
4)0.01
–0.23
(0.10)
0.25
–0.45
(0.36)
0.01
–0.20
(0.08)
0.06
–0.22
(0.12)
0.01
–0.06
(0.03)
0.03
–0.16
(0.09)
0.38
–1.75
(0.88)
0.20
–0.97
(0.66)
––
Tariqet
al.(20
06)
Kalalan
wala,
Punjab
(n=
24)
––
––
––
––
–32
–19
00Fa
rooq
ietal.(20
07a)
Wellw
ater
from
reside
ntiala
rea,
Kasur
city
(n=
68)
0.01
–1.08
(0.14)
–0.02
–11
.8(2
.57)
0.01
–0.17
(0.04)
0.00
1–0.02
7(0
.007
)0.05
–9.80
(2.12)
0.00
1–0.24
(0.08)
0.00
3–0.26
(0.11)
––
Tariqet
al.(20
08)
Groun
dwater
from
differen
tsp
otsin
Sialko
tcity
(n=
25)
0.0–
0.81
(0.16)
0.01
–0.17
(0.06)
0.0–
0.83
(0.30)
0.0–
0.09
(0.03)
–0.0–
0.30
(0.03)
0.01
–0.22
(0.10)
0.11
–0.81
(0.49)
––
Ulla
het
al.(20
09)
Han
dpu
mps
water
inthevicinity
ofMan
char
Lake
,Sindh
(n=
1944
)–
––
––
––
––
23.3–96
.3(6
0.2)
Arain
etal.(20
09)
Surfacewater
TarbelaRe
servoir
0.02
80.04
0.01
20.01
80.00
40.00
30.06
10.10
70.01
462
0Ash
rafet
al.(19
91)
Chashm
aRe
servoir
0.02
90.00
40.00
40.00
40.00
30.07
10.06
50.05
80.01
775
0Ash
rafet
al.(19
91)
Lloy
dRe
servoir
0.02
80.00
40.01
20.01
80.00
20.00
20.06
10.10
70.14
620
Ash
rafet
al.(19
91)
Rive
rRa
vidifferen
tsites(n
=5)
0.01
–0.03
40.00
1–0.00
60.04
2–0.12
70.00
13–0.00
970.00
02–0.00
140.00
03–0.00
140.00
12–0.00
130.00
04–0.00
170.00
03–
0.00
090.32
–1.8
Tariqet
al.(19
94)
Palosi
drain,
Pesh
awar
(n=
4)0.0–
0.23
90.0
0.37
–0.75
0.01
7–0.24
20.0–
0.00
4–
0.0–
0.18
0.0–
0.34
––
Ilyas
andSa
rwar
(200
3)Su
rfacewater
from
differen
tsp
ots
inNW
FP(n
=16
)0.00
3–0.08
(0.04)
0.01
–0.77
(0.20)
0.01
–1.29
(0.19)
0.01
–1.11
(0.22)
0.00
2–0.09
(0.02)
0.01
–0.12
(0.04)
0.01
–1.52
(0.21)
0.02
–0.38
(0.16)
––
Midrar-Ul-Haq
etal.(20
05)
MalirRive
rin
Karachi
(n=
8)0.06
–0.29
(0.16)
0.01
–0.84
(0.31)
0.13
–2.91
(0.78)
0.05
–0.57
(0.33)
0.00
2–0.07
(0.04)
0.03
–0.29
(0.10)
0.02
–1.06
(0.59)
0.09
–0.32
(0.19)
––
Midrar-Ul-Haq
etal.(20
05)
Rive
rCh
enab
(n=
1)–
–0.18
0.28
––
––
–7
Nickson
etal.(20
05)
Cana
lwater,A
kbarpu
raarea
,Now
shera,
NW
FP(n
=9)
0.04
–0.05
0.59
–0.73
0.90
–1.02
0.61
–0.71
0.09
–0.14
0.13
–0.17
0.33
–0.39
0.34
–0.43
––
Nazifet
al.(20
06)
Bara
Rive
r,Akb
arpu
raarea
,Now
shera,
NW
FP(n
=9)
0.02
–0.06
0.90
–1.20
1.29
–1.75
0.77
–0.85
0.15
–0.20
0.16
–0.29
0.53
–0.72
0.43
–0.62
––
Nazifet
al.(20
06)
Kalar
Kah
arLake
,Cha
kwal,P
unjabb
0.44
–2.82
0.01
–1.20
0.20
–5.46
–0.01
–0.05
–0.04
–0.25
0.01
–0.30
––
Raza
etal.(20
07)
MNVD,S
ehwan
,Jamsh
oro,
Sind
h(n
=3)
0.00
41–0.00
720.00
3–0.00
840.01
16–0.01
85–
0.00
01–0.01
8–
0.00
02–0.00
520.00
4–0.00
96–
–Mastoie
tal.(20
08)
Man
char
Lake
Jamsh
oro,
Sind
h(n
=9)
0.00
46–0.03
480.00
06–0.01
960.00
73–0.01
78–
0.00
01–0.00
2–
0.00
04–0.00
960.00
57–0.01
4–
–Mastoie
tal.(20
08)
Hud
aira
drain,
Laho
re1.7
0.45
7–9
0.85
0.18
0.07
0.93
0.03
––
Kashifet
al.(20
09)
Man
char
Lake
Jamshoro,Sind
h(n
=54
0)–
––
––
––
––
35–15
7(9
7.5)
Arain
etal.(20
09)
WHO
Stan
dard
3.00
2.00
0.30
c0.5
0.00
30.05
0.02
0.01
0.00
10.01
aArsen
icwas
determ
ined
inthefield.
bStud
ywas
cond
uctedon
amon
thly
basisforon
eye
ar.T
heva
lues
give
nsh
owstherang
ethroug
hout
theye
ar.
cDesired
.
483A. Azizullah et al. / Environment International 37 (2011) 479–497
484 A. Azizullah et al. / Environment International 37 (2011) 479–497
WHO is 0.003 mg/L. In Pakistan Cd concentrations in both ground andsurface water, with some exception, are above the WHO safe limits(Table 3). The data of various studies reveal that the groundwater ofKhyber Pakhtoonkhwa and Sindh provinces has relatively highcontamination of Cd as compared to Punjab. Cadmium is a toxic metalcausing both acute and chronic toxicity in humans. Intake of cadmiummay cause acute gastrointestinal problems, such as vomiting anddiarrhea (Nordberg, 2004) while chronic exposure to cadmium for along timemay cause kidney damage (Barbier et al., 2005), reproductiveproblems (Frery et al., 1993; Johnson et al., 2003; Piasek and Laskey,1999), bone damage (Kazantzis, 1979) and cancer (Waalkes et al.,1988).
Chromium is one of themost common elements in the earth crust andwater. For drinking water WHO described its maximum allowableconcentration at 0.05 mg/L. In water sources of Pakistan it has beendocumented in a wide concentration range by different studies. A studyconducted by PCRWR in 23 major cities of the country showed that only1% of groundwater samples exceed the safe limits for chromium (PCRWR,2005). In contrast, individual studies reported chromium concentrationsranging above the safe limits of WHO (0.05 mg/L) in most of the cases(Table 3). Analysis of drinking water samples from the residential area ofKasur showed chromium concentrations reaching 9.80 mg/L (mean2.12 mg/L). In general, chromiumhad 21–42 times higher concentrationsthan the recommended quality value (Tariq et al., 2008). Similarly, 75%samples from various sources in Khyber Pukhtoonkhwa and 25% samplesfrom Karachi (Sindh) exceeded the maximum acceptable value forchromium in drinking water (Midrar-Ul-Haq et al., 2005). In most caseschromium concentrations are lower in surface than in groundwater;however, in somecases theyexceeded the recommendedsafeWHOlimits(Table 3). Frequently higher concentrations of chromium in drinkingwater in cities like Lahore, Gujrat and Sialkot have been traced to theleather industry and tanneries (Ullah et al., 2009). Chromium itself is nottoxic and plays an important role in the carbohydrate metabolism in thebody (Cefalu and Hu, 2004). But some of its compounds especially in itshexavalent status cause skin diseases, cancers, irritants and diseasesrelated to the digestive, excretory, respiratory and reproductive system(Anonymous, 2008).
Nickel, dubbed as “Allergen of the Year 2008”, is a widely distributedelement in the environment, and can be found in air, water and soil(Duda-Chodak and BIaszczyk, 2008). The maximum admissible con-centration set by WHO for nickel in drinking water is 0.02 mg/L. InPakistan its concentration varies from 0 to 3.66 mg/L in groundwaterwhereas in surface water from 0 to 1.52 mg/L as documented in variousstudies (Table 3). Among the groundwater samples, the highest range ofnickel is reported inwater samples fromKhyber Pakhtoonkhwa (0.002–3.66 mg/L) and Karachi (0.01–2.19 mg/L) (Midrar-Ul-Haq et al., 2005).Table 3 shows that in most cases groundwater is contaminated withnickel beyond the standard of WHO. Surface water also shows similarcontamination with nickel. Midrar-Ul-Haq et al. (2005) reported that75% of the surface water samples from the largest city of the country(Karachi) exceed the USEPA criteria for nickel in drinking water. Thelocal population of such areas can be at risk of exposure to high doses ofnickel with food and water being the two main sources (Duda-Chodakand BIaszczyk, 2008). Nickel compounds can cause a variety of adverseeffects, such as nickel allergy in the form of contact dermatitis, lungfibrosis, cardiovascular diseases, kidney problems and cancer of therespiratory tract (McGregor et al., 2000; Oller et al., 1997; Seilkop andOLLER, 2003).
Lead (Pb) is a normal constituent of the earth's crust and traceamounts naturally occur in soil andwater (Raviraja et al., 2008). Drinkingwater picks up lead contamination from various sources like householdpaint, vehicle exhausts and industrial wastes (Nadeem-ul-Haq et al.,2009). The safe standard set by WHO for lead in drinking water is 0.01mg/L. Its concentration is reported from0.001 to 2.0 mg/L in groundwaterand 0 to 0.38 mg/L in surface water from various parts of the country(Table 3). A large study conducted by PCWR in major cities revealed that
15% and 1% of surface and groundwater samples, respectively, had leadabove the safe limits (PCRWR, 2005). However, in contrast, individualstudies revealed that a higher proportion of water sources in the countryhad lead above the safe limits, both in surface and groundwater. InKhyberPakhtoonkhwa (Charsadda and Risalpur) and Karachi 88 and 100% ofwater samples, respectively, exceeded the critical level for lead (Midrar-Ul-Haq et al., 2005). Similarly in Sialkot 100% of the samples analyzedexceeded the critical level of 0.01 mg/L for lead in drinking water (Ullahet al., 2009). Physiological functions of lead useful in the human body arenotwell known(Raviraja et al., 2008), however, exposure tooverdoses forlonger times affects adversely the major organs and systems of the bodysuch as the nervous, digestive, haematopoietic, cardiovascular, reproduc-tive and immunological system as well as the skeleton and the kidneys(Gidlow, 2004; Riess and Halm, 2007; Venkatesh, 2004). Even at lowconcentrations lead is a special threat during pregnancy. It may causedevelopmental delay, low birth weight and miscarriage of the fetus(Bellinger, 2005; McMichael et al., 1986).
Mercury (Hg) is a naturally occurring element and a “persistentbioaccumulative toxin” (Weiss and Wright, 2001). It is introduced to theenvironment through various natural processes as well as differenthuman activities (Weiss and Wright, 2001). According to the WHOstandards, its concentration in drinking water should not exceed0.001 mg/L. In Pakistan data regarding Hg contamination of water arelimited as very few studies exist on the issue. PCRWR reported Hgconcentrations beyond the safe limits in 5% of surface water samples butnone in groundwater samples (PCRWR, 2005). Rahman et al. (1997)reported Hg concentrations of 0.01 mg/L in groundwater samples fromKarachi which is 10 times higher than the WHO standard. A studyconducted on threemainwater reservoirs of the country, namely Tarbela(0.014 mg/L), Chashma (0.017 mg/L) and Lloyd (0.14 mg/L), showed Hgconcentrations beyond the safe limits (Ashraf et al., 1991). However, theavailable data are very limited and further studies are necessary regardingHg concentrations in drinking water throughout the country. Hg is apotentially harmful metal to human health and the environment. It is theonly metal, which indisputably magnifies through the food chain.Furthermore, in the aquatic environment, it is efficiently transformedinto methyl mercury which is its most toxic form (Fatoki and Awofolu,2003). Being a potential cellular toxin, it adversely affects variousimportant processes within nerve cells. It disrupts the neurotransmitterproduction and also decreases the production of important hormonesincluding thyroid hormones and testosterone in the body (Fatoki andAwofolu, 2003).
Arsenic (As) is recognized as a big threat to public health in manycountries like Bangladesh, India, China, Vietnam, Nepal and Myanmar(Islam-Ul-Haque et al., 2007). The situation is the same in Pakistan, andin many of its regions' concentrations of arsenic in drinking waterexceeds the WHO standard of 10 ppb (μg/L). In the early 1990s Ashrafet al. (1991) reported elevated concentrations of arsenic in the largewater reservoirs of Pakistan, i.e. Tarbela, (620 μg/L), Chashma (750 μg/L)and Lloyd (620 μg/L). Similarly an average arsenic concentration of80 μg/L in groundwater samples from Karachi was reported in thenineties (Rahman et al., 1997). However, the issue of arsenic as a threatto drinking water remained unnoticed until a joint study conducted bythe Pakistan Council of Research in Water Resources (PCRWR) and theUnited Nations Children Fund (UNICEF) in 2000. In this studygroundwater contamination with arsenic was identified in the Attokand Rawalpindi districts. Subsequent studies have been conducted byPCRWR in various parts of the country which revealed a wide range ofarsenic concentrations inwater samples. Results obtainedbyPCRWR forarsenic in variousparts of Punjab andSindh(Table 4) showthat a sizablenumber of samples exceed the WHO standard of 10 μg/L. In someareas the situation is very alarming as for example in Multan (Punjab),Dadu and Ganbat (Sindh) where more than 50% of the water samplesexceed the standard limits of 10 μg/L. The situation is further aggravatedas some areas have a contamination of above 50 μg/L and in Sindheven exceeds 200 μg/L (PCRWR, 2008b). Recent studies show elevated

Table 4Arsenic contamination in various districts/cities of Punjab and Sindh Provinces. Source: PCRWR (2008b,c).
City/district name Total no. of samples No. of samples N10 μg/L No. of samples N50 μg/L % of samples N10 μg/L % of samples N50 μg/L
Punjab ProvinceBahawalpur 145 35 6 24.13 4.13Hasilpur 110 9 – 8.18 0Khairpur 108 6 1 5.55 0.92Ahmedpur East 185 44 5 23.78 2.70Yazman 210 44 8 20.95 3.80Sadiqabad 298 57 9 19.12 3.02Rahim Yar Khan 302 63 12 20.86 3.97Khanpur 262 41 5 15.64 1.90Liaqatpur 254 47 6 18.50 2.36Multan City 56 40 7 71.42 12.5Multan Saddar 282 90 3 31.91 1.06Shujaabad 80 34 1 42.5 1.25Jalalpur Pirwala 103 32 4 31.06 3.88Total 2395 543 67 22.67 2.79
Sindh ProvinceKhairpur 420 56 8 13.1 1.9Gambat 388 209 102 53.35 26.03Kotdiji 306 10 2 3.27 0.7Dadu 595 347 150 58.3 26.55Johi 140 30 4 21.4 3Sehwan 139 62 40 44.6 29Total 1988 563 152 28.3 7.64
485A. Azizullah et al. / Environment International 37 (2011) 479–497
arsenic contamination in groundwater of east Punjab reaching 1900μg/L and 2400 μg/L with 91% of samples exceeding the WHO standardlimits of 10 μg/L (Farooqi et al., 2007a,b). In a recent study arsenicreaching 96 μg/L in groundwater and 157 μg/L in surface water(Manchar Lake, Sindh) has been documented (Arain et al., 2009). Inconclusion, arsenic contamination is a serious threat to drinking waterin Pakistan. Many people in the country are exposed to high doses andare at risk of health problems. Overexposure to arsenic may cause adecrease in white and red blood cells production, gastrointestinalirritation, disrupt the heart rhythm, damage blood vessels and cause“pins and needles” sensation in hands and feet (Abernathy et al., 2003).Long time exposure to arsenic can cause melanosis, leuko-melanosis,hyperkeratosis, cardiovascular disease, black foot disease, neuropathyand cancer (Caussy, 2005).
The overall situation of toxic metals in surface and groundwatershows a large variation in their contamination level and frequency. Alltoxic metals except copper and zinc have their concentrations beyondthe critical limits in many cases. Most of the authors linked theelevated concentration of heavy metals in water to human activitieslike disposal of industrial, municipal and domestic wastes.
2.3. Major cations and anions
Cations including sodium (Na+), potassium (K+), calcium (Ca+2),magnesium (Mg+2) and anions like nitrates (NO3
−), nitrites (NO2−),
carbonates (CO3−2), bicarbonates (HCO3
−), sulfates (SO4−2), phos-
phates (PO4−3), chlorides (Cl−) and fluorides (F−) naturally occur in
water and are usually determined in water quality evaluation tests.Data for major cations and anions reported from different parts ofPakistan by various studies are summarized in Table 5 for both surfaceand groundwater.
2.3.1. CationsCations such as Na+, K+, Ca+2 and Mg+2 are essential for various
processes in the body and their presence in water is necessary in anadequate amount. However, at higher concentrations these cationsmay make the water unfit for living organisms.
Sodium shows a large variation in variouswater resources throughoutthe country as revealed by different studies. However, in general, itsconcentration is very low in running water i.e. in canals and rivers but
extremely high in lakes and groundwater. Its concentration in the KallarKahar and Manchar Lakes were much higher than the WHO standard of200 mg/L (Arain et al., 2008;Mastoi et al., 2008; Raza et al., 2007)makingit the major pollutant in both lakes. Na+ concentrations in groundwatersamples from Hyderabad reached 1795 mg/L, and 6 out of 7 sites had aconcentration above the standard limits (Laghari et al., 2004). Similarly,elevated concentrations of Na+ were recorded in groundwater samplessuch as 306 mg/L (maximum value 1688 mg/L) in Lahore, 360 mg/L(maximum value 878 mg/L) in Kalalanwala and 989mg/L (maximumvalue 5500 mg/L) in Nagar Parkar (Table 5). In Kalu Khuhar, Sindh almostall 21 groundwater samples had Na+ beyond the maximum acceptableconcentration(Siddiqui et al., 2005). The studyconductedbyPCRWRin23major cities of Pakistan revealed that 5% of surface and 9% of groundwaterhad a sodium concentration beyond the standard limits. In Faisalabad,Kasur and Sheikhupura the situation was worse where 43, 30 and 27% ofthewater samples, respectively, exceededstandard limits (PCRWR,2005).ThehighconcentrationsofNa+ in theseareasmaybedue to the salineandbrackish nature of water (Raza et al., 2007) and in some cases cationexchange reactions with Ca+2 and carbonates precipitation due to thealkaline nature of the water may contribute to a high Na+ content(Farooqi et al., 2007a). The high sodium concentrations, if present in theformof chlorides and sulphates,make thewater salty andunfit for humanconsumption and irrigation purposes. It may exert osmotic stress on thebiota in the water (Raza et al., 2007) and may cause high blood pressureand hypertension in humans (Kawasaki et al., 1978). Like sodium,potassium(K+) is alsousually reportedabove thequality standards.WHOdid not define any standard limits for K+. The European Unionrecommended standards of 12 mg/L (Tariq et al., 2008). Analyzing dataof different studies, K+ is documented in a range of 3.5 to 94 mg/L but itsmeanconcentration inmostof the studies reached30 mg/Lwell above thestandard of 12 mg/L. According to PCRWR, it exceeds the standard limitsin 36–46% of samples from Faisalabad and 20% of samples from Kasur(PCRWR, 2005).
Calcium (Ca+2) is an important element for the human body becauseit is a structural component of bones, teeth and soft tissues and is essentialin many metabolic processes of the body (Bacher et al., 2010). Accordingto the WHO quality standard for public drinking water the Ca+2
concentration should not exceed 100 mg/L. Various studies revealed itsconcentration above the quality standard (100 mg/L) in groundwater incities like Hyderabad, Lahore and Kasur in the Punjab province and the

Table5
Major
anions
andcation
sco
ncen
tration(m
g/L)
ingrou
ndan
dsu
rfacewater
samples
ofPa
kistan
.Dataareex
tractedfrom
variou
sindividu
alstud
iesan
darrang
edch
rono
logically
basedon
year
ofpu
blicationof
thereview
edarticles.V
alue
sgive
nrepresen
tthemea
nva
lues
ortherang
efrom
minim
umto
max
imum
andwhe
rebo
thrang
ean
dmea
naregive
n,theva
luein
parenthe
sisis
themea
nva
lue.
Samples
location
Na+
K+
Ca+2
Mg+
2Cl
−F−
NO3−
HCO
3−/CO32−
SO42−
PO43−
Referenc
e
Groun
dwater
Tube
wellw
ater
Hassana
bdal
1.42
–4.80
a–
0.21
––
2.4/0.46
––
Lone
etal.(20
03)
Dug
wells
Tarako
,Goh
ati
andKaluKha
n(n
=3)
––
––
–1.08
–1.38
––
––
Shah
andDan
ishw
ar(2
003)
Ninedifferen
tlocalitiesin
Faisalab
adcity
(n=
40)
––
––
–0.38
–1.15
––
––
Kau
saret
al.(20
03)
Han
dpu
mps
water
Hyd
erab
adCity
(n=
7)17
4.1–
1795
.511
.70–
31.55
38.85–
205.3
64.8–22
3.2
312–
1454
––
––
Lagh
arie
tal.(20
04)
Wellw
ater
Baha
walna
gar
(n=
16)
194
38.8
9444
74–
17–
374
–Ta
riqet
al.(20
04)
Wellw
ater
DGKha
n(n
=10
)15
229
6024
65–
22–
180
–Ta
riqet
al.(20
04)
Wellw
ater
Muz
afarga
rhn=
8)19
622
5623
82–
13–
205
–Ta
riqet
al.(20
04)
Wellw
ater
Rajanp
ur(n
=3)
160
2878
2982
–9
–23
0–
Tariqet
al.(20
04)
Groun
dwater
Multan
district(n
=3)
42–23
94.7–
94.4
42–11
811
.1–36
.69–
202
–0
272–
1470
/–1–
900.08
5–26
.44
Nickson
etal.(20
05)
Groun
dwater
Muz
afargrh
(n=
46)
13–31
213.5–
738–
234
5–19
4.6
6–14
99–
0–53
.414
7–87
9/–
26–13
130.03
–0.29
1Nickson
etal.(20
05)
Inan
darou
ndKaluKhu
har,
Sind
h(n
=21
)70
–73
9(2
70)
6–40
(16)
35–34
5(1
44)
22–28
1(9
2)72
–15
15(3
72)
––
212–
386(2
96)/1–
43(1
1)66
–94
8(3
13)
–Sidd
iqui
etal.(20
05)
Groun
dwater
samples
from
five
districts
ofKarachi
(n=
32)
62.5–29
503.0–
112
16.8–64
514
.6–47
872
.6–47
38–
0.4–
44.5
–65
.9–18
54Bd
l–0.21
8Alvie
tal.(20
05)
Groun
dwater
Karachi
(n=
106)
––
––
–0.60
–3.64
––
––
Sidd
ique
etal.(20
06)
Shallow
grou
ndwater
(24–
27m)
Kalan
wala(n
=17
)
301–
878(6
30)
3.50
–6.3(5
.0)
8.4–
44.8
(21.4)
3.64
–31
.4(1
5.0)
20.4–29
9(1
59)
0.95
–21
.1(1
1)Bd
l–64
(9.0)
579–
1895
(857
)/–
284–
1551
(929
)Bd
l–2.18
(0.31)
Farooq
ietal.(20
07a)
Middlegrou
ndwater
(60–
90m)
Kalan
wala(n
=3)
68–38
0(1
83)
2.74
–5.1(3
.6)
59.2–12
9(8
6)28
.5–73
(44.7)
13.1–22
4(8
9)0.38
–0.57
(0.58)
Bdl–1.0
(0.41)
237–
363(2
91)/–
112–
906
(404
)Bd
lFa
rooq
ietal.(20
07a)
Dee
pgrou
ndwater
(165
–18
3m)
Kalalan
wala(n
=4)
234–
300(2
73)
3.5–
5.5(4
.6)
52.4–89
.6(7
4.3)
26.3–78
(50)
74.2–13
0(1
04)
0.38
–2.85
(1.47)
Bdl–0.1
(0.03)
365–
433(4
10)/–
396–
718
(568
)Bd
lFa
rooq
ietal.(20
07a)
486 A. Azizullah et al. / Environment International 37 (2011) 479–497
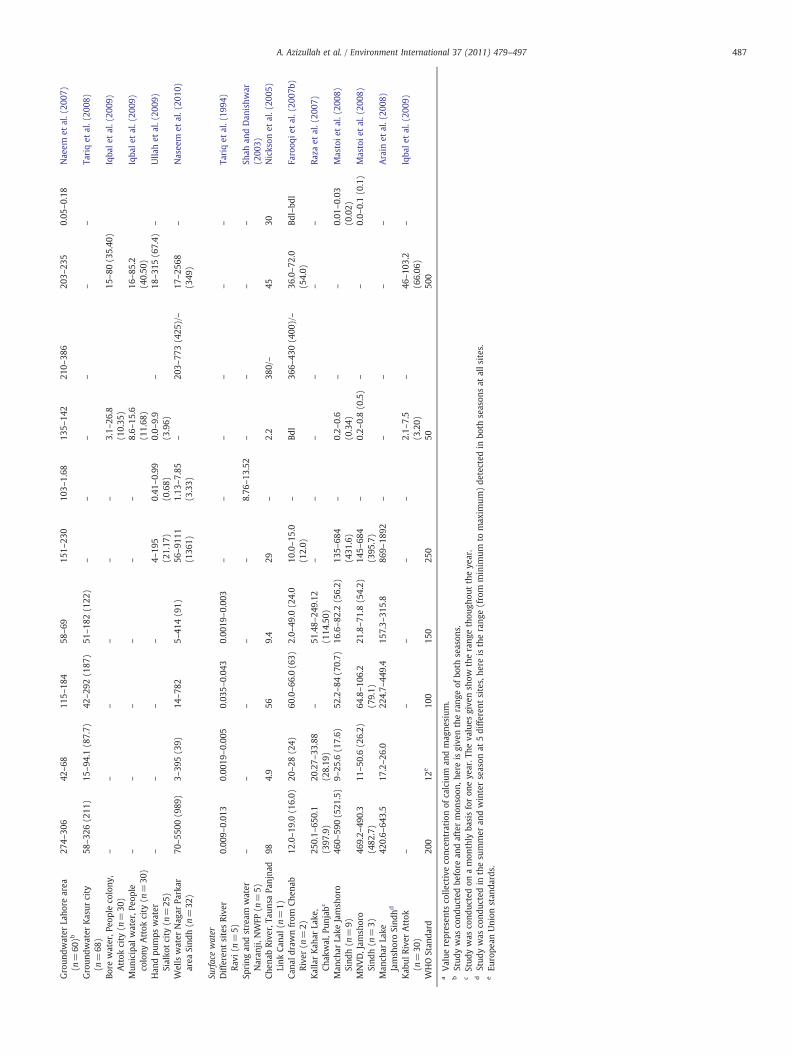
Table5(con
tinu
ed)
Samples
location
Na+
K+
Ca+2
Mg+
2Cl
−F−
NO3−
HCO
3−/CO32−
SO42−
PO43−
Referenc
e
Groun
dwater
Laho
rearea
(n=
60)b
274–
306
42–68
115–
184
58–69
151–
230
103–
1.68
135–
142
210–
386
203–
235
0.05
–0.18
Nae
emet
al.(20
07)
Groun
dwater
Kasur
city
(n=
68)
58–32
6(2
11)
15–94
.1(8
7.7)
42–29
2(1
87)
51–18
2(1
22)
––
––
––
Tariqet
al.(20
08)
Bore
water,P
eopleco
lony
,Attok
city
(n=
30)
––
––
––
3.1–
26.8
(10.35
)15
–80
(35.40
)Iqba
letal.(20
09)
Mun
icipal
water,P
eople
colony
Attok
city
(n=
30)
––
––
––
8.6–
15.6
(11.68
)16
–85
.2(4
0.50
)Iqba
letal.(20
09)
Han
dpu
mps
water
Sialko
tcity
(n=
25)
––
––
4–19
5(2
1.17
)0.41
–0.99
(0.68)
0.0–
9.9
(3.96)
–18
–31
5(6
7.4)
–Ulla
het
al.(20
09)
Wells
water
Nag
arPa
rkar
area
Sind
h(n
=32
)70
–55
00(9
89)
3–39
5(3
9)14
–78
25–
414(9
1)56
–91
11(1
361)
1.13
–7.85
(3.33)
–20
3–77
3(4
25)/–
17–25
68(3
49)
–Nasee
met
al.(20
10)
Surfacewater
Differen
tsitesRive
rRa
vi(n
=5)
0.00
9–0.01
30.00
19–0.00
50.03
5–0.04
30.00
19–0.00
3–
––
––
–Ta
riqet
al.(19
94)
Spring
andstream
water
Naran
ji,NW
FP(n
=5)
––
––
–8.76
–13
.52
––
––
Shah
andDan
ishw
ar(2
003)
Chen
abRive
r,Ta
unsa
Panjna
dLink
Cana
l(n=
1)98
4.9
569.4
29–
2.2
380/–
4530
Nickson
etal.(20
05)
Cana
ldrawnfrom
Chen
abRive
r(n
=2)
12.0–19
.0(1
6.0)
20–28
(24)
60.0–66
.0(6
3)2.0–
49.0
(24.0
10.0–15
.0(1
2.0)
–Bd
l36
6–43
0(4
00)/–
36.0–72
.0(5
4.0)
Bdl–bd
lFa
rooq
ietal.(20
07b)
KallarKah
arLake
,Ch
akwal,P
unjabc
250.1–
650.1
(397
.9)
20.27–
33.88
(28.19
)–
51.48–
249.12
(114
.50)
––
––
––
Raza
etal.(20
07)
Man
char
Lake
Jamsh
oro
Sind
h(n
=9)
460–
590(5
21.5)
9–25
.6(1
7.6)
52.2–84
(70.7)
16.6–82
.2(5
6.2)
135–
684
(431
.6)
–0.2–
0.6
(0.34)
––
0.01
–0.03
(0.02)
Mastoie
tal.(20
08)
MNVD,Jam
shoro
Sind
h(n
=3)
469.2–
490.3
(482
.7)
11–50
.6(2
6.2)
64.8–10
6.2
(79.1)
21.8–71
.8(5
4.2)
145–
684
(395
.7)
–0.2–
0.8(0
.5)
––
0.0–
0.1(0
.1)
Mastoie
tal.(20
08)
Man
char
Lake
Jamsh
oroSind
hd42
0.6–
643.5
17.2–26
.022
4.7–
449.4
157.3–
315.8
869–
1892
––
––
–Arain
etal.(20
08)
Kab
ulRive
rAttok
(n=
30)
––
––
–2.1–
7.5
(3.20)
–46
–10
3.2
(66.06
)–
Iqba
letal.(20
09)
WHO
Stan
dard
200
12e
100
150
250
5050
0
aValue
represen
tsco
llectiveco
ncen
trationof
calcium
andmag
nesium
.b
Stud
ywas
cond
uctedbe
fore
andaftermon
soon
,hereis
give
ntherang
eof
both
season
s.cStud
ywas
cond
uctedon
amon
thly
basisforon
eye
ar.T
heva
lues
give
nsh
owtherang
ethou
ghou
ttheye
ar.
dStud
ywas
cond
uctedin
thesu
mmer
andwinterseason
at5differen
tsites,he
reis
therang
e(from
minim
umto
max
imum
)de
tected
inbo
thseason
sat
alls
ites.
eEu
rope
anUnion
stan
dards.
487A. Azizullah et al. / Environment International 37 (2011) 479–497
488 A. Azizullah et al. / Environment International 37 (2011) 479–497
Kalu Khuhar and Nagar Parkar areas of the Sindh province (Table 5).In Islamabad, 73% of the drinking water samples exceeded the max-imum admissible limits for Ca+2 (PCRWR, 2005). The high concentra-tion of Ca+2 is attributed to the calcareous nature of undergroundmineral rocks. Studies reveal low concentrations of Ca+2 in surfacewater as compared to groundwater of the country. Manchar Lake inSindh province is the only surfacewater reservoirwhich showed a Ca+2
concentration above the standard limits (Table 5). The same can beconcluded from a country-wide study by PCRWR that reported 28% ofgroundwater samples having Ca+2 exceeding the limits in comparisontoonly 5%of surfacewater samples (PCRWR,2005). Short-time intake oflarge amounts of Ca+2 does not generally have any adverse effectbecause the gastrointestinal tract normally limits the amount of calciumabsorbed.However, ingestion of excess calcium for a long timemay leadto elevated blood calcium levels (hypercalcemia) and may cause sideeffects like hypercalciuria, urinary tract calculi, calcification in softtissues like kidneys and in arterial walls and suppression of boneremodeling (Heaney et al., 1982). Among other cations few studiesreported Mg+2 in groundwater from Hyderabad (Laghari et al., 2004)and surface water of Kallar Kahar andManchar lakes (Arain et al., 2008;Raza et al., 2007) exceeding themaximumadmissible limits set byWHO(150 mg/L). But in general its concentration fallswithin the safe limits asevident from Table 5.
2.3.2. AnionsAmong the anion nitrogenous compounds nitrites and nitrates are
important from the health point of view. These are usually measuredduring monitoring water pollution throughout the world. Exposure tonitrates from various environmental sources is possible; howeverdrinking water is considered the main source. Normally ground andsurface water contain low concentrations of nitrates but can reachhigh values due to run off or leaching from agricultural lands (PAK-EPA, 2005b). Although reports regarding nitrate contamination areconflicting, in some parts of the country it is a threat to public health.Nitrates have been regarded as the fourth most potential contaminantby the National Water Quality Monitoring Program (PCRWR, 2005).
A detailed study on nitrate contamination based on analysis of 747samples from all over the country reveals that 19% of the samples hadnitrate concentrations beyond the safe limits (Tahir and Rasheed,2008). Furthermore, drinking water contamination with nitrates isreported from large cities of the country like Islamabad, Rawalapindi(Kazmi and Khan, 2005), Lahore (Naeem et al., 2007), Kasur (Farooqiet al., 2007a), Quetta and Faisalabad (PCRWR, 2005). In a well(ground)water sample fromHaripur, the nitrate concentrationwas ashigh as 1125 mg/L (Kazmi and Khan, 2005). In general, the Punjab andSindh provinces have higher levels of nitrate contamination thanother regions of the country (Tahir and Rasheed, 2008). Nitrate levelsin water fluctuate widely from area to area and season to seasondepending on factors like precipitation and soil type and sometimescan reach levels much beyond WHO standard values for health,particularly during the growing season when fertilizers are heavilyapplied. In addition to fertilizer application, livestock, manure andatmospheric sources also contribute to nitrate contamination ofunderground water supplies (Tahir and Rasheed, 2008).
The most common health impact of nitrate ingestion is a blooddisorder called “methemoglobinemia” commonly known as blue babysyndrome. High levels of nitrates can also be the cause of increasedrisk for respiratory tract infections and goiter development in children(Gupta et al., 2000; Weyer et al., 2001). Nitrates in water are alsolinked with high probability for bladder and ovarian cancer, insulin-dependent diabetes mellitus and genotoxic effects at the chromo-somal level (Ward et al., 1996).
The other important anion in drinking water is fluoride. It is anessential element for human health and both its deficiency andoverexposure lead to adverse effects in teeth and bones. In relation toits effect on human health the optimum range of fluoride concentra-
tion in drinking water is very narrow. In a range of 0.7–1.2 mg/L, it isnecessary for the prevention of dental caries but above 1.5 mg/L itcauses dental and skeletal fluorosis (Center for Disease Control andPrevention (CDCP), 1999). According to the WHO guideline themaximum limits of fluoride in drinking water must not exceed1.5 mg/L (WHO, 1994) and the same limit is recommended byPakistan Environmental Protection Agency (PAK-EPA, 2008).
Various studies revealed lower concentrations of fluorides indrinking water of Pakistan, and elevated concentrations do not seemto be a common problem. For example, Ayyaz et al. (2002) and Khan(2000) reported that 84% of water samples collected from variousparts throughout the country had fluoride concentrations even belowthe minimum recommended concentration of 0.7 mg/L for humanhealth. Similarly in water samples from Faisalabad (Kausar et al.,2003) and Karachi (Siddique et al., 2006), it was well below thestandard limits with few exceptions from an industrial area of Karachi.Furthermore, a few studies suggest water fluorination to avoid theadverse effects of fluoride deficiency in drinking water (Ayyaz et al.,2002; Khan, 2000). However, the situations are not the samethroughout the country. Elevated concentrations of fluoride havebeen reported from some parts in the North West and South East ofthe country. In Naranji (Khyber Pakhtoonkhwa), fluoride concentra-tion in spring water was reported reaching 13.52 mg/L (Shah andDanishwar, 2003). Similarly in Nagar Parkar Town (near the Thardeserts of Pakistan) mean fluoride concentrations of 3.33 mg/L(maximum 7.85 mg/L) were found, with 78% of samples exceedingthe WHO standard limits (Naseem et al., 2010). The highest fluorideconcentrations have been reported from Khalanwala, East Punjab,where it reached as high as 21.1 mg/L (Farooqi et al., 2007a) and22.8 mg/L, and 75% of samples were above theWHO normal standards(Farooqi et al., 2007b). In large cities of the country 6% of ground and25% of surface water samples were documented having fluoride levelshigher than the standard quality criteria. In cities like Kasur, Quettaand Loralai N20% of water samples had fluoride above the standardlimits (PCRWR, 2005). In conclusion, large variation in fluorideconcentration is documented in drinkingwater of the country. For thisvariation, different geological characteristics of different areas seem tobe responsible. Fluoride levels can even differ significantly in watersamples from different wells within the same area (Ahmed et al.,2004). The high concentrations of fluoride are attributed mainly toleaching from fluoride-bearing minerals (Naseem et al., 2010; Shahand Danishwar, 2003), industrial wastes (Siddique et al., 2006),agricultural fertilizers and combustion of coal which release fluorideinto the air which later reaches the soil with rain (Farooqi et al.,2007b). The overall picture of fluoride in drinking water is complexand needs proper management and monitoring in individual areas.Water should be fluorinated in areas where fluoride concentration isvery lowwhile defluorination measures should be taken in areas withelevated fluoride concentrations.
Amongother anions, high chloridesoccur in areaswhere thewater issaline and show a good correlation with Na+. Phosphates occur wellbelow the safe limits and no study reported them above the standardquality limit. Sulphates exceed standard limits in a few areas (Table 5).
2.4. Pesticides
In the last four decades, the use of pesticides has increasedsubstantially throughout the world. It aims at protection of crops frominsect infestation to achieve higher crop yields with better quality (Ziaet al., 2008). An estimated quantity of 2.5 million tons of pesticides isused in the world annually with continuous increases (Pimentel,1995). In Pakistan pesticides were introduced for the first time in1954 with 254 metric tons of formulation (Jabbar et al., 1993; Tariqet al., 2007). After this in the late 1960s and early 1970s, thousands oftons of pesticides were imported from Europe and USA while somepesticides like dichlorodiphenyltrichloroethane (DDT) and benzene
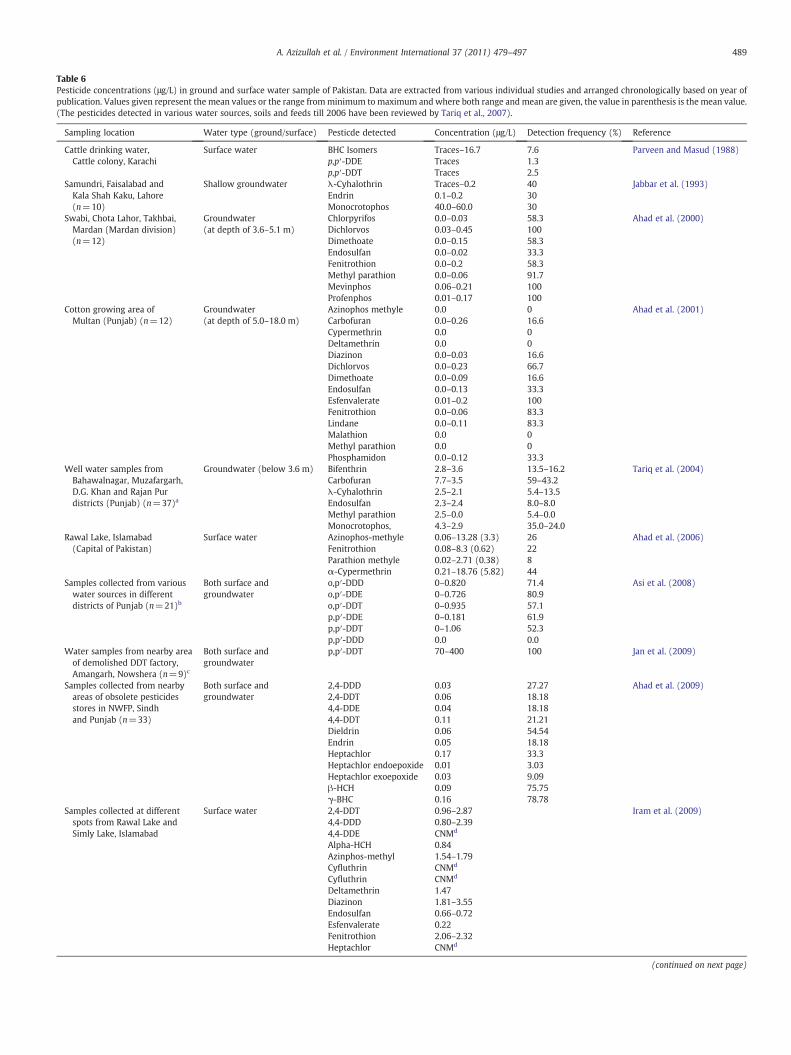
Table 6Pesticide concentrations (μg/L) in ground and surface water sample of Pakistan. Data are extracted from various individual studies and arranged chronologically based on year ofpublication. Values given represent the mean values or the range fromminimum to maximum and where both range andmean are given, the value in parenthesis is the mean value.(The pesticides detected in various water sources, soils and feeds till 2006 have been reviewed by Tariq et al., 2007).
Sampling location Water type (ground/surface) Pesticde detected Concentration (μg/L) Detection frequency (%) Reference
Cattle drinking water,Cattle colony, Karachi
Surface water BHC Isomers Traces–16.7 7.6 Parveen and Masud (1988)p,p′-DDE Traces 1.3p,p′-DDT Traces 2.5
Samundri, Faisalabad andKala Shah Kaku, Lahore(n=10)
Shallow groundwater λ-Cyhalothrin Traces–0.2 40 Jabbar et al. (1993)Endrin 0.1–0.2 30Monocrotophos 40.0–60.0 30
Swabi, Chota Lahor, Takhbai,Mardan (Mardan division)(n=12)
Groundwater(at depth of 3.6–5.1 m)
Chlorpyrifos 0.0–0.03 58.3 Ahad et al. (2000)Dichlorvos 0.03–0.45 100Dimethoate 0.0–0.15 58.3Endosulfan 0.0–0.02 33.3Fenitrothion 0.0–0.2 58.3Methyl parathion 0.0–0.06 91.7Mevinphos 0.06–0.21 100Profenphos 0.01–0.17 100
Cotton growing area ofMultan (Punjab) (n=12)
Groundwater(at depth of 5.0–18.0 m)
Azinophos methyle 0.0 0 Ahad et al. (2001)Carbofuran 0.0–0.26 16.6Cypermethrin 0.0 0Deltamethrin 0.0 0Diazinon 0.0–0.03 16.6Dichlorvos 0.0–0.23 66.7Dimethoate 0.0–0.09 16.6Endosulfan 0.0–0.13 33.3Esfenvalerate 0.01–0.2 100Fenitrothion 0.0–0.06 83.3Lindane 0.0–0.11 83.3Malathion 0.0 0Methyl parathion 0.0 0Phosphamidon 0.0–0.12 33.3
Well water samples fromBahawalnagar, Muzafargarh,D.G. Khan and Rajan Purdistricts (Punjab) (n=37)a
Groundwater (below 3.6 m) Bifenthrin 2.8–3.6 13.5–16.2 Tariq et al. (2004)Carbofuran 7.7–3.5 59–43.2λ-Cyhalothrin 2.5–2.1 5.4–13.5Endosulfan 2.3–2.4 8.0–8.0Methyl parathion 2.5–0.0 5.4–0.0Monocrotophos, 4.3–2.9 35.0–24.0
Rawal Lake, Islamabad(Capital of Pakistan)
Surface water Azinophos-methyle 0.06–13.28 (3.3) 26 Ahad et al. (2006)Fenitrothion 0.08–8.3 (0.62) 22Parathion methyle 0.02–2.71 (0.38) 8α-Cypermethrin 0.21–18.76 (5.82) 44
Samples collected from variouswater sources in differentdistricts of Punjab (n=21)b
Both surface andgroundwater
o,p′-DDD 0–0.820 71.4 Asi et al. (2008)o,p′-DDE 0–0.726 80.9o,p′-DDT 0–0.935 57.1p,p′-DDE 0–0.181 61.9p,p′-DDT 0–1.06 52.3p,p′-DDD 0.0 0.0
Water samples from nearby areaof demolished DDT factory,Amangarh, Nowshera (n=9)c
Both surface andgroundwater
p,p′-DDT 70–400 100 Jan et al. (2009)
Samples collected from nearbyareas of obsolete pesticidesstores in NWFP, Sindhand Punjab (n=33)
Both surface andgroundwater
2,4-DDD 0.03 27.27 Ahad et al. (2009)2,4-DDT 0.06 18.184,4-DDE 0.04 18.184,4-DDT 0.11 21.21Dieldrin 0.06 54.54Endrin 0.05 18.18Heptachlor 0.17 33.3Heptachlor endoepoxide 0.01 3.03Heptachlor exoepoxide 0.03 9.09β-HCH 0.09 75.75γ-BHC 0.16 78.78
Samples collected at differentspots from Rawal Lake andSimly Lake, Islamabad
Surface water 2,4-DDT 0.96–2.87 Iram et al. (2009)4,4-DDD 0.80–2.394,4-DDE CNMd
Alpha-HCH 0.84Azinphos-methyl 1.54–1.79Cyfluthrin CNMd
Cyfluthrin CNMd
Deltamethrin 1.47Diazinon 1.81–3.55Endosulfan 0.66–0.72Esfenvalerate 0.22Fenitrothion 2.06–2.32Heptachlor CNMd
(continued on next page)
489A. Azizullah et al. / Environment International 37 (2011) 479–497

Table 6 (continued)
Sampling location Water type (ground/surface) Pesticde detected Concentration (μg/L) Detection frequency (%) Reference
Lindane CNMd
Parathion-methyl CNMd
α-Cypermethrin CNMd
NF not found.a Values given are the mean values obtained during the months of July–October.b In the original article values are mentioned in ng/mL.c In the orignal article values are mentioned in μg/mL, here converted to μg/L.d CNM detected but concentration not mentioned.
Samples collected at differentspots from Rawal Lake andSimly Lake, Islamabad
Surface water
490 A. Azizullah et al. / Environment International 37 (2011) 479–497
hexachloride (BHC) were produced locally (Ahad et al., 2009). Atpresent an estimated quantity of 70 thousand tons of pesticides areapplied every year in Pakistan with an increasing annual rate of about6% (WWF, 2007). Of the total pesticides used, about 75% are applied tocotton crops and the remaining to others crops such asmaize, tobacco,paddy rice, sugarcane, fruits and vegetable (Jabbar et al., 1993).
An estimated amount of only 0.1% of pesticides applied reach thetarget organisms and the remaining 99.9% disperse through air, soiland water, thus resulting in the pollution of natural ecosystems andaffecting human health and other biota (Pimentel, 1995). In additionto field applications, pesticides are introduced to the environment
Table 7WHO, EPA and PAK-EPA standards for drinking water quality. All values are given inmg/L except pesticides where the values are in μg/L. Sources: (EPA, 2006; PAK-EPA,2008; WHO, 2008).
Qualityparameter
WHO standard USEPAstandard
PAK-EPA standard
Total coliforms(including fecalcoloform andE. coli)
Must not be detectablein 100 mL of watersample
Zero Must not be detectablein 100 mL of watersample
As 0.01 0.01 0.05Cd 0.003 0.005 0.01Cr 0.05 0.1 0.05Cu 2.0 1.3 2.0Fe 0.3a 0.3 –
Hg 0.001 0.002 0.001Mn 0.5 0.05 0.5Ni 0.02 – 0.02Pb 0.01 0.015 0.05Zn 3.0 5.0 5.0Na+ 200 – –
K+ 12b – –
Ca2+ 100 – 200Mg2+ 150 – –
Cl− 250 250 250F− 1.5 4.0 1.5NO3
− 50 (measuredas nitrate)
10(measuredas N)
50
HCO3− – – –
CO32− 500 (as Ca carbonate) – 500 (as Ca carbonate)
SO42− 500 500 400
PO43− – – –
Pesticides (μg/L)2,4-DDD 1 – –
2,4-DDT 1 – –
4,4-DDT 1 – –
Aldrin 0.03 – –
Carbofuran 7.0 40 –
Dieldrin 0.03 – –
Dimethoate 6.0 – –
Endosulfane 0.25 – –
Endrin 0.6 2.0 –
Lindane 2.0 0.2 –
Chlorpyrifos 30 – –
Heptachlor 0.03 0.4 –
Heptachlorepoxide
– 0.2 –
a Desired.b European Union standard.
during manufacturing, handling and transportation. In developingcountries like Pakistan, the problem is further aggravated by improperstorage, careless disposal of pesticides containers and usage ofoutdated pesticides (Zia et al., 2008). This happens mainly becausethe farming communities lack awareness of the harmful effects ofpesticides. As a result pesticide residues contribute to pollution of soil(Agarwal et al., 1994), ground and surface water (Ahad et al., 2001;Jabbar et al., 1993; Tanabe et al., 2001), drinking water (Fung andMak, 2001), and even commercially available mineral water and softdrinks (Johnson et al., 2006).
A limited number of data is available on pesticide contamination ofdrinking water in Pakistan. Major hindrance in the availability of datais the lack of laboratory facilities in the country. Only one or twolaboratories in the country have the analytical facilities that candetermine specific pesticides in parts per billion (Tariq et al., 2007). Inspite of all these limitations pesticides have been detected in water,soil, food and air as reviewed by Tariq et al. (2007). The results ofvarious studies reporting pesticide residues in ground and surfacewaters of Pakistan are summarized in Table 6.
In Pakistan pesticides residues were reported for the first time incattle drinking water in Karachi (Parveen and Masud, 1988). Theresults reported the contamination of 10 samples out of 79 withchlorinated pesticides or their metabolites at concentrations rangingfrom traces to 16.7 μg/L. Sincemost of the pesticides in the country areapplied on cotton crops, extensively cotton-growing areas in theplains of Punjab and Sindh are likely to have contamination ofpesticides in the water. Analysis of shallow groundwater samplesfrom the Summandri area Faisalabad (a cotton growing area) revealedthe presence of pesticides like monocrotophos (40 to 60 μg/L),cyhalothrin (traces to 0.2 μg/L), and endrine (0. 1 to 0.2 μg/L) (Jabbaret al., 1993). In Multan (another cotton growing area), all 12groundwater samples taken from 6 different sites were foundcontaminated with pesticides with 33% samples exceeding maximumresidual limits (MRLs) (Ahad et al., 2001). Tariq et al. (2004) carriedout a shallow groundwater analysis for pesticides residues in fourcotton-growing districts of Punjab Province, namely Bahawalnagar,Muzafargarh, Dera Ghazi Khan and Rajan Pur. Out of 8 pesticidesanalysed for, 6 were detected in water samples of the area at variousconcentrations but the MCLs established by the USEPA for drinkingwater were not exceeded.
In Khyber Pukhtoonkhwa province substantial amounts of pesti-cides are applied on tobacco, sugarcane and maize crops (Ahad et al.,2000). Use of high doses of pesticides on tobacco fields in KhyberPakhtoonkhwa is a common practice. Farmers in the area maysometime apply more than 10 sprays per crop of tobacco (personalobservation, one of the authors is from the area). A study conductedon groundwater from 12 different sites in Mardan division (anextensively tobacco, sugarcane and maize growing area), revealed acontamination with pesticides in 100% of the samples (Ahad et al.,2000). In this study three sites, namely Amber, Swabi (0.82 μg/l),Lahor Shakh, Swabi (0.50 μg/l) and Madras Kalay, Mardan (0.64 μg/l)exceeded the maximum acceptance concentration (MAC) set byEuropean Community (EC).
In Pakistan organochlorin pesticides like DDT have been usedextensively in the past on field crops and in the malaria eradication
491A. Azizullah et al. / Environment International 37 (2011) 479–497
program. Although the use of most of the organochlorin pesticidesand their metabolites has been banned in the country, their presencecan be detected in the environment even now due to their longpersistency. For example Asi et al. (2008) reported various metabo-lites of DDT like o,p′-DDD, o,p′-DDE, o,p′-DDT, p,p′-DDE and p,p′-DDTin samples of ground and surface water from different districts ofPunjab. These metabolites were present at variable concentrations(0.017–1.06 ng/mL) in different samples but in some cases, especiallyin the cotton growing areas, exceeded themaximum admissible limitsset by the European Community. In Mianchannu, District Khanewal,the highest concentration of p,p′-DDT (1.06 ng/mL) was documented,which is 10 times more than the maximum admissible limits (Asiet al., 2008).
DDT had been produced locally in Pakistan. After the ban of the useof such environment non-friendly and toxic pesticides, its factorieshave been abandoned. The long half life of DDTmakes it dangerous tillnow in many parts of the country, particularly in the vicinity of thedemolished factories for its production. A study conducted by Jan et al.(2009) in and around a former DDT-producing factory in AmanGharh,Nowshera, revealed p,p′-DDT contamination in different watersources ranging from 0.07±0.10 to 0.40±0.14 μg/mL (=70–400 μg/L). However, their results are conflicting and do not agreewith other studies. In a study by Ahad et al. (2009) the water samplesfrom the same area had concentrations of various pesticides rangingfrom 0 μg/L to 15.17 μg/L. DDT was reported in the range of ±0.05 μg/L. Furthermore the sample with the maximum level was from a rainwater pond instead of a well or some surface water source. SimilarlyAsi et al. (2008) reported residues of various DDT isomers of up to amaximum of 0.947 μg/L in groundwater and 1.06 μg/L in surfacewater. Compared with the results of Asi et al. (2008) and Ahad et al.(2009) the concentration of 400 μg/L by Jan et al. (2009) looksextremely high.
As stated earlier the improper storage and handling of pesticidesincreases the risk of exposure and contamination. In Pakistan noproper planning for handling pesticides is present at the private or atgovernment level. In the 1980s pesticide import and distribution wastransferred from the public to the private sector, subsidy on pesticideswas abolished and the policy of aerial spraying was withdrawn (Khanet al., 2002). At that time large stocks of pesticides, mostly consistingof banned pesticides, were in government custody but no properstrategy was adopted for handling these stocks. Due to improperstorage and careless handling, most of the sacks are rotten, containersare damaged, metal drums are corroded, and pesticides leaked outand may still leak (Ahad et al., 2009). The obsolete stock of outdatedpesticides is estimated in Punjab (3805 tons), Sindh (2016 tons),Khyber Pukhtoonkhwa (NWFP) (179 tons), Balochistan (128 tons)and Federal Department of Plant Protection (178 tons) (Ahad et al.,2009). Water samples from nearby areas of such obsolete pesticidesstores in three provinces Punjab, Sindh and Khyber Pukhtoonkhwa(NWFP) of the country had residues of organochlorine pesticides likeγ-BHC, β-HCH, Heptachlor exoepoxide, Heptachlor endoepoxide,Heptachlor, Endrin, Dieldrin, 4,4-DDT, 4,4-DDE, 2,4-DDT and 2,4-DDD (Ahad et al., 2009). The residual concentrations in water samplesfrom Khyber Pakhtoonkhwa (NWFP), Punjab, and Sindh, were 0–15.17 (median 0.29) μg/L, 0.25–0.78 (median 0.36) μg/L, and 0.11–0.83 (median 0.21) μg/L respectively. Although the means were nothigh, several individual pesticide residues exceeded their individualmaximum admissible limits.
The first reported study of pesticide residues in water by Parveenand Masud (1988) was on surface water but afterwards there is noreported study on pesticides contamination in surface water sourcesuntil that of Rawal Lake by Ahad et al. (2006). Rawal Lake is a beautifulpicnic point in the capital city Islamabad and supplies drinking waterto more than 1.5 million people of Rawalpindi. It is noteworthy tomention that this Lake caught attention of print and electronic mediain June, 2004 when many dead fish were found in the lake. When the
water samples from the lake were analyzed for pesticides, 30.4 μg/Ltotal pesticides were detected (Ahad et al., 2006). While the firstsampling and analysis was performed in the dry month of June, thefollow-up sampling was done in the rainy season (first week ofAugust) when the lake's total volume increased from 1.85×10³ m3 inJune to 2.47×10⁷ m3; therefore the total pesticides reduced by 64%(from 30.4 μg/L to 11.2 μg/L) due to dilution and degradation.However, the concentration was still approximately 22 times higherthan EEC standards. These concentrations, after receiving treatment intheWater and Sanitation agency (WASA) filtration plant were furtherreduced by 81%. The water supplied to the general public still hadpesticide residues approximately 4 fold higher than EEC standards(Ahad et al., 2006). Another study on Rawal Lake and Simly Lakerevealed the presence of residues of various pesticides belonging tothe group of organophosphates, organochlorines and pyrethroids, andmany of them exceeded the standard of European Union for drinkingwater (Iram et al., 2009).
Water contamination levels with pesticides residues are quitevariable throughout the country but in many cases exceed thestandard limits. The situation is further endangered by the highfrequency of pesticides occurrence in water. Exposure to multiplepesticides for a prolonged time can cause cytotoxic changes andadversely affect the normal functioning of organs like liver and kidneyand possibly produce characteristic clinical effects such as dyspneaand burning sensation in urinary tract (Azmi et al., 2006; Khan et al.,2008). According to the International Agency for research in cancer,pesticides are classified as carcinogens in humans and furthermorethe endocrine disrupting pesticides adversely affect the humanendocrine systems which can lead to various hormonal dysfunctions(Ejaz et al., 2004). Use of pesticides in present day agriculture cannotbe avoided as it is essential for controlling pests to obtain betterquality and higher quantity of crops; but on the other hand it is alsowell known that no pesticide is safe and all have detrimental effectson humans and other biota of aquatic and terrestrial ecosystems. Theonly way to avoid their adverse effects is their safe use through propermanagement. Farmers and workers need to be aware of thedeleterious effects of pesticides and associated problems. They needto be educated well about the safe handling and use of pesticides toensure sustainable development with emphasis on high degree ofenvironment and human protection.
3. Sources of water pollution
Water pollution is most often due to human activities (Hammer,1986). The major ones are indiscriminate disposal of industrial,municipal and domestic wastes in water channels, rivers, streams andlakes, etc. (Kahlown and Majeed, 2003). An estimated 2 million tonsof sewage and other effluents are discharged into the world's watersevery day. In developing countries the situation is worse where over90% of raw sewage and 70% of untreated industrial wastes aredumped into surface water sources (Anonymous, 2010).
According to Sial et al. (2006), in Pakistan out of 6634 registeredindustries 1228 are considered to be highly polluting. Due to the highload of organic and toxic materials in their waste effluents, industriesbecame a major source of water pollution in Pakistan (Nasrullah et al.,2006). The major industries contributing to water pollution aretextile, pharmaceuticals, ceramics, petrochemicals, food industries,steel, oil mills, sugar industries, fertilizer factories, and leather tanning(Sial et al., 2006; WWF, 2007). These industries produce severalhundred thousands of wastewater containing huge quantities ofpollutants like nitrates, nitrites, cations and anions such as Ag+, Na+,K+, Mg2+, Ca2+ Cl−, CO3
2−, HCO3− and toxic metals like arsenic, iron,
lead, mercury, chromium, cadmium, copper, nickel, zinc, cobalt andmagnesium (Ali et al., 1996; Sial et al., 2006; Ullah et al., 2009). Mostof the industries in Pakistan are located in or aroundmajor cities. Theydispose their waste effluent directly into the nearby drains, rivers,
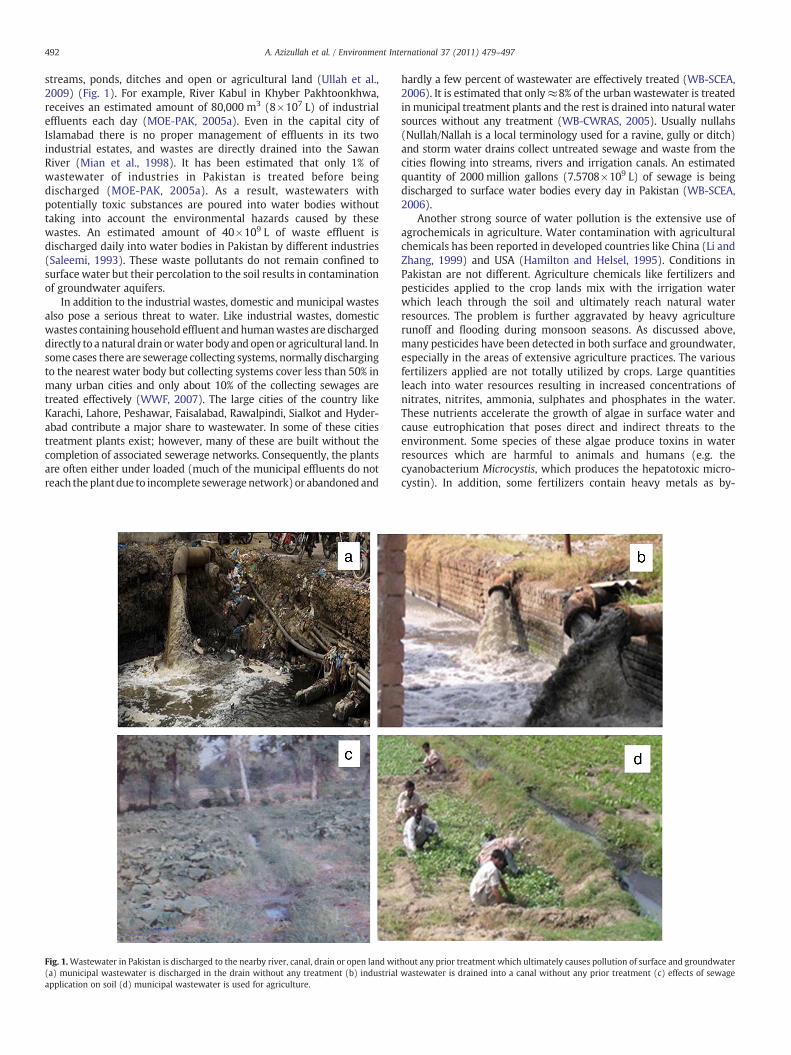
492 A. Azizullah et al. / Environment International 37 (2011) 479–497
streams, ponds, ditches and open or agricultural land (Ullah et al.,2009) (Fig. 1). For example, River Kabul in Khyber Pakhtoonkhwa,receives an estimated amount of 80,000 m3 (8×10⁷ L) of industrialeffluents each day (MOE-PAK, 2005a). Even in the capital city ofIslamabad there is no proper management of effluents in its twoindustrial estates, and wastes are directly drained into the SawanRiver (Mian et al., 1998). It has been estimated that only 1% ofwastewater of industries in Pakistan is treated before beingdischarged (MOE-PAK, 2005a). As a result, wastewaters withpotentially toxic substances are poured into water bodies withouttaking into account the environmental hazards caused by thesewastes. An estimated amount of 40×109 L of waste effluent isdischarged daily into water bodies in Pakistan by different industries(Saleemi, 1993). These waste pollutants do not remain confined tosurface water but their percolation to the soil results in contaminationof groundwater aquifers.
In addition to the industrial wastes, domestic and municipal wastesalso pose a serious threat to water. Like industrial wastes, domesticwastes containinghousehold effluent andhumanwastes are dischargeddirectly to a natural drain orwater body and open or agricultural land. Insome cases there are sewerage collecting systems, normally dischargingto the nearest water body but collecting systems cover less than 50% inmany urban cities and only about 10% of the collecting sewages aretreated effectively (WWF, 2007). The large cities of the country likeKarachi, Lahore, Peshawar, Faisalabad, Rawalpindi, Sialkot and Hyder-abad contribute a major share to wastewater. In some of these citiestreatment plants exist; however, many of these are built without thecompletion of associated sewerage networks. Consequently, the plantsare often either under loaded (much of the municipal effluents do notreach theplantdue to incomplete seweragenetwork)or abandonedand
Fig. 1.Wastewater in Pakistan is discharged to the nearby river, canal, drain or open land wit(a) municipal wastewater is discharged in the drain without any treatment (b) industrialapplication on soil (d) municipal wastewater is used for agriculture.
hardly a few percent of wastewater are effectively treated (WB-SCEA,2006). It is estimated that only≈8% of the urban wastewater is treatedin municipal treatment plants and the rest is drained into natural watersources without any treatment (WB-CWRAS, 2005). Usually nullahs(Nullah/Nallah is a local terminology used for a ravine, gully or ditch)and storm water drains collect untreated sewage and waste from thecities flowing into streams, rivers and irrigation canals. An estimatedquantity of 2000 million gallons (7.5708×10⁹ L) of sewage is beingdischarged to surface water bodies every day in Pakistan (WB-SCEA,2006).
Another strong source of water pollution is the extensive use ofagrochemicals in agriculture. Water contamination with agriculturalchemicals has been reported in developed countries like China (Li andZhang, 1999) and USA (Hamilton and Helsel, 1995). Conditions inPakistan are not different. Agriculture chemicals like fertilizers andpesticides applied to the crop lands mix with the irrigation waterwhich leach through the soil and ultimately reach natural waterresources. The problem is further aggravated by heavy agriculturerunoff and flooding during monsoon seasons. As discussed above,many pesticides have been detected in both surface and groundwater,especially in the areas of extensive agriculture practices. The variousfertilizers applied are not totally utilized by crops. Large quantitiesleach into water resources resulting in increased concentrations ofnitrates, nitrites, ammonia, sulphates and phosphates in the water.These nutrients accelerate the growth of algae in surface water andcause eutrophication that poses direct and indirect threats to theenvironment. Some species of these algae produce toxins in waterresources which are harmful to animals and humans (e.g. thecyanobacterium Microcystis, which produces the hepatotoxic micro-cystin). In addition, some fertilizers contain heavy metals as by-
hout any prior treatment which ultimately causes pollution of surface and groundwaterwastewater is drained into a canal without any prior treatment (c) effects of sewage
493A. Azizullah et al. / Environment International 37 (2011) 479–497
product, and the extensive use of such fertilizers results in theaccumulation of these toxic metals in soil and water (Li and Wu,2008). Agricultural drainage contributes to the overall contaminationof the water resources, however less than the industrial and domesticwastes (MOE-PAK, 2005a).
All these sources of water pollution, i.e. industrial and domesticwastes and agricultural practices, not only contribute toxic chemicalsto water but they also cause widespread bacteriological contamina-tion which results in frequent occurrence of water-borne diseases. Inaddition, they also result in an increase in parameters like biologicaloxygen demand (BOD), chemical oxygen demand (COD), totaldissolved solids (TDS), total suspended solids (TSS), and salinity andthus deteriorate the water quality and make it unfit for drinking andother purposes.
4. Water pollution and human health
Water contamination is one of the main causes of health problemsin human beings. About 2.3 billion peoples are suffering from water-related diseases worldwide (UNESCO, 2003). In developing countriesmore than 2.2 million people die every year due to drinking of uncleanwater and inadequate sanitation (WHO and UNISEF, 2000). Water-related infectious and parasitic diseases account for ≈60% of infantmortality in the world (Ullah et al., 2009).
In Pakistan contamination of drinkingwater with industrial wastesand municipal sewage coupled with lack of water disinfectionpractices and quality monitoring at treatment plants is the maincause of the prevalence of waterborne diseases (Hashmi et al., 2009a).It is very hard to quantify exactly the waterborne diseases in Pakistanbecause of lack of maintenance of records at hospitals (Aziz, 2005).According to a UNICEF report 20–40% of patients in hospitals ofPakistan are suffering from water-linked diseases. These diseasesinclude hepatitis, cholera, dysentery, cryptosporidiosis, giardiasis,and typhoid which account for one third of all deaths in the country(WB-SCEA, 2006). Each year with the onset of monsoon (July andAugust) rains in summer the situation gets worse with water-bornediseases like hepatitis, typhoid fever, gastroenteritis, dysentery,cholera, E. coli diarrhea, rotavirus diarrhea, malaria, giardiasis andintestinal worms. Lack of effective prevention and control measurescontribute in worsening the situation (Qasim, 2008). Diarrhea, whichis a water-linked disease, accounts for 14% of illnesses in childrenbelow five years old and for 7% of all diseases in people of all ages inPakistan (Rosemann, 2005). An estimated number of 0.2–0.25 millionchildren in Pakistan die every year due to diarrhea and other water-related diseases (Rosemann, 2005; WWF, 2007). In Karachi uncleanwater has been the cause of renal infection which leads to death of10,000 people annually (HRDS, 2009).
Many epidemics in the country have been traced to contaminatedwater. In September 1988 an outbreak of Hepatitis E was noticed inthe Pakistan army unit in Abbottabad. It was traced back to fecalcontamination of a water system. A total of 107 persons were infectedout of 800 people in the unit (Bryan et al., 2002). In late 1993 and early1994 water-borne epidemics of Hepatitis E (HEV) affected 3827people in two sectors of Islamabad. Four adults and four new bornbabies died in the epidemics (Rab et al., 1997). During the summer2003 the outbreak of acute gastroenteritis in Gadap, Karachi waslinked to consumption of fecally contaminatedwell water. It wasmostprobably due to a rotavirus in drinking water as concluded by Zahraand Jamil (2001). In October, 2004 an outbreak of typhoid fever hit theremote area of Nek Muhammad village near Karachi which claimedthree human lives and left more than 300 people infected within oneweek (Farooqui et al., 2009). The outbreak has been linked to thecontaminated water of a reservoir well, the only source of drinkingwater in the village. Interviews revealed that 98% of the patientssufferedweakness, 91% fever, 65% diarrhea, and 42% had vomiting andother symptoms (Farooqui et al., 2009). Although in the developed
countries typhoid fever has been almost eliminated, in developingcountries like Pakistan it is still a common disease and a major causeof morbidity and mortality due to lack of sewage and water treatmentfacilities (Ahmed et al., 2006). In the Khairpur district of SindhProvince unclean drinking water has been the cause of very commonoccurrences of water-related diseases like diarrhea, dysentery andtyphoid fever. The Quarterly Report of Infectious Diseases of CivilHospital, Khairpur reported 25 cases of typhoid fever, 18 cases ofdiarrhea, and 7 cases of dysentery in the area during 2006–2007 (Sharet al., 2008b). Similarly, in May 2008 consumption of contaminatedwater led to an episode of gastrointestinal illness in rural Sindhaffecting hundreds of people as reported in national press reports(Hannan et al., 2008).
In certain areas of Punjab, problems of bone softening anddeformation have been reported as a result of high fluoride concentra-tions in drinking water (Ahmed et al., 2004). In Manga Mandi, an areanear Lahore about 124 children were found suffering from skeletalfluorosis due to high fluoride contents in their drinking water (Ahmadet al., 2003). In Kalalanwala, near Lahore more than 400 people werereported having bone diseases with a great majority of children (72%patients were under 15 years of age). In addition to the commoncomplaints of joint and back pain, bone deformation and spinal defectswere observed in the people of the area. The problemhas been traced toa high concentration of fluoride in drinking water of the area (Farooqiet al., 2007a). Arsenic has been reported as a serious problem in manyparts of the country but very few studies are available regarding itshealth effect on the local population. A study conducted by Arain et al.(2009) revealed that 30–40% people of the Bobak village (nearMancharLake in Sindh) were suffering from rough skin with black dots andarsenical skin lesions, especially on face, arms and feet due to exposureto high arsenic concentrations. However, the authors concluded thatarsenic was not the only cause of the skin problems. Other factorincluding malnutrition, improper medical facilities and presence ofother toxicants in surface and groundwater may also contributesynergisticallywith arsenic overload in the area. Another study revealedthat 61 to 73% of the population of villages on the bank ofManchar Lakesuffer from chronic arsenic toxicity like melanosis and keratosis (Kaziet al., 2009). The authors found a strong correlation between arsenicconcentrations in drinkingwater andhair andblood samples of exposedskin in diseased patients. In addition, the exposed people had clinicalfeatures like respiratory problems, anemia, gastrointestinal problems,muscles cramps andweakness. All the health effectswere traced to higharsenic content in drinking water. Among people consuming lowarsenic water (municipal water with low arsenic) no such problemswere observed (Kazi et al., 2009).
Another potential threat to public health is the occurrence ofpesticides in drinking water of Pakistan. Few studies have beenconducted in the country concerning pesticides exposure and humanhealth. Studies revealed the presence of high quantity of pesticides inblood and their adverse effects on various enzyme levels in the bodyand biochemical parameters of blood in Pakistani population exposedto pesticides (Azmi et al., 2006; Ejaz et al., 2004; Khan et al., 2008,2010). Clinical characteristics like headache, vomiting, dizziness,muscle weakness, shortness of breath, skin rash and burningsensation in the urinary tract due to pesticide exposure have beenreported in the country (Azmi et al., 2006; Khan et al., 2010). Althoughthe majority of studies regarding pesticide effects on public healthhave been conducted in populations exposed to pesticides either asworkers or as farmers, the adverse effects can be expected in peopleexposed to pesticides through drinking water.
5. Environmental legislations in Pakistan and their effectiveness
Pakistan Environmental Protection Ordinance 1983 (PEPO 1983) wasthe first ever legislation in the country regarding environmentalprotection (GoP, 1983). This ordinance further resulted in the
494 A. Azizullah et al. / Environment International 37 (2011) 479–497
establishment of two organizations, namely, the Pakistan EnvironmentalProtection Council (PEPC) and the Pakistan Environmental ProtectionAgency (Pak-EPA). Furthermore, the concept of Environmental ImpactAssessment was introduced in the country due to this ordinance.However, slackness in its implementation is evident from the fact thatthe first meeting of PEPC was held in 1993 after 10 years of itsestablishment. It was encouraging that in its first meeting the PEPCapproved National Environmental Quality Standard (NEQS) and soonformulated the maximum acceptable limits for various pollutants inmunicipal and industrial discharges and emission. In 1997 a regulatoryframework known as Pakistan Environmental Protection Act 1997 (PEPA1997) was approved to regulate and monitor issues regarding environ-mental protection in the country (GoP, 1997). InNovember 2002 nationalstandards for drinking water quality were introduced. Similarly otherpolicies including National Environment Policy 2005, National SanitationPolicy 2006 andNationalDrinkingWater Policy 2009havebeen approved(MOE-PAK, 2005b, 2006, 2009). These policies were aimed at preventingwater pollution and providing safe drinkingwater to the general public ataffordable costs. Although such ordinances, acts and policies have beenapproved from time to time, no clear strategy has been devised so far fortheir implementation. As a result, after appropriate and necessaryadministrative capacity on paper, its effectiveness is seriously curtailedin practice. For example, the NEQS for industry and municipal dischargeswere formulated in 1993, but could not be implemented in its spirit untilnow. The industries do not follow the national standards for pollutants intheir waste effluents. Government has introduced different programs likePollution Charge System, Self Monitoring and Reporting, CleanerProduction in Industry and Common Effluent Treatment Plants to controlthe pollution due to industrial wastes. But unfortunately no one isimplemented appropriately due to weak law enforcement and theproblems remained the same (WWF, 2007). Similarly the EnvironmentalImpact Assessment (EIA) system is mandatory but is seldom followed inthe public sector. To monitor environmental quality, laboratories havebeen established in all provinces but are not fully functional due to theabsence of skeletal staff and inadequate budgets. Similarly, environmentaltribunals have been shaped but are not efficient in all provinces. It seemsthat laws and a setup formonitoring the environmental issues exist in thecountrybut lack implementation. Themainhindrances in implementationare insufficient budgetary allocations and lack of effective coordinationand communication among the responsible authorities like federal,provincial and local entities. Political interference cannot be excludedfrom the factors hindering implementation of environmental laws.
6. Conclusion and recommendations
Both surface and groundwater sources in Pakistan are highlypolluted and not safe for human consumption as most of the pollutansexceed the qualitiy standards for drinking water (Table 7). Bacteriolog-ical contamination of water is the most potential threat to consumers.Among the heavy metals, with the exception of Cu and Zn, all exceedtheir standard limits set byWHO in many cases. The frequent and highlevel occurrence of iron, nickel, chromium, cadmium and arsenic isalarming. Among the cations K+ and Na+ were found above thestandard limits in a large number of reports. Nitrates and fluoride are athreat in some parts. Fluoride poses a dual problem, i.e. in some areas itis very lowandneeds tobe supplementedbut in other areas it is toohighand needs removal measures. Pesticides occur frequently in watersamples from different areas and in many cases exceed the safe limits.Various human activities, particularly disposal of untreated industrialand municipal wastes are the main sources of water pollution inPakistan. There is a lack of proper monitoring of water qualityparticularly in rural areas. Water disinfection practices like chlorinationare either nonexistent or unsatisfactory and treatment plants, if theyexist, are not providing quality water to the public. Bacteriological andchemical pollution of public drinking water have been the cause ofwaterborne diseases in many parts of the country. However, compar-
atively little data are available regarding water-related diseases due tothe lack of diagnostic facilities and maintenance of records. Regularsurveys need to be conducted in various parts of the country to obtain aclear picture of water-linked diseases. The following recommendationsare made which may help to control or diminish the problems ofdeteriorating water quality in Pakistan.
• There should be continuous monitoring of drinking water through-out the country both in rural and urban locations.
• Local authorities should be provided with facilities for monitoringand purification of drinking water.
• There is a need to shift from an intermittent to a continuous watersupply system to avoid the wide spread contamination caused byintermittent water supply.
• There should be a renovation of old and rusty pipelines of the waterdistribution network.
• There should be sufficient distances between sewage and drinkingwater supply lines to avoid cross contamination.
• Industrial wastewater disposal should be strictly monitored and allindustries should be forced to adapt wastewater treatmentmeasures. Also active and operating sewage collecting and treat-ment plants in large cities for municipal wastewater treatmentmustbe installed.
• There is a need of the existence and implementation of strict lawswith no compromise on quality of public drinking water.
• Public awareness campaigns should be launched to educate thepopulation about the importance of safe drinking water.
• The public should receive guidance to adapt safety measures forstored water inside the houses.
• The farmer community needs to be educated well about the safehandling and use of pesticides and proper application of fertilizersto minimize the contribution of agricultural practices to waterpollution.
References
Abernathy CO, Thomas DJ, Calderon RL. Health effects and risk assessment of arsenic.J Nutr 2003;133:1536–8.
Agarwal HC, Singh DK, Sharma VB. Fate of parathion in soil under sub-tropical fieldconditions. J Environ Sci Health B 1994;29:189–94.
Ahad K, Anwar T, Ahmad I, Mohammad A, Tahir S, Aziz S. Determination of insecticideresidues in groundwater of Mardan Division, NWFP, Pakistan: a case study. WaterSA 2000;26:409–12.
Ahad K, Hayat Y, Ahmad I, Soomro MH. Capillary chromatographic determination ofpesticides residues in ground water of Multan division. Nucleous 2001;38:145–9.
Ahad K, Mohammad A, Mehboob F, Sattar A, Ahmad I. Pesticide residues in Rawal Lake,Islamabad, Pakistan. Bull Environ Contam Toxicol 2006;76:463–70.
Ahad K, Mohammad A, Khan H, Ahmad I, Hayat Y. Monitoring results fororganochlorine pesticides in soil and water from selected obsolete pesticide storesin Pakistan. Environ Monit Assess 2009 Published Online.
Ahmad M, Ahmad B, Nawazish-i-Hussain S, Mahmood S. Clinical investigations ofskeletal fluorosis in children of Manga Mandi in Pakistan. Pak J Pharm Sci 2003;16:9-11.
Ahmed R, Viqar-un-Nisa, Hussain M, Tanwir R, Qureshi SA. Monitoring of fluoride andiodide levels in drinking water using ion sensitive electrodes. Nucleus 2004;41:51–8.
Ahmed HN, Niaz M, Amin MA, KhanMH, Parhar AB. Typhoid perforation still a commonproblem: situation in Pakistan in comparison to other countries of low humandevelopment. J Pak Med Assoc 2006;56:230–2.
Ali K, Javid MA, Javid M. Pollution and industrial waste6th National Congress Soil Sci.,Lahore, Pakistan; 1996.
Alvi SK, Khan FA, Siddiqui IU, Usmani TH, Mahmood SN. Nitrate/Nitrite contaminationin groundwater of Karachi and its correlation with other physiochemicalparameters. J Chem Soc Pak 2005;27:490–5.
Anonymous. Assessment of surface water for drinking quality; 2008. Directorate ofLand Reclamation Punjab, Irrigation and Power Department, Canal Bank,Mughalpura, Lahore, Pakistan.
Anonymous.WorldWaterDay 22.03.2010; 2010. Retrieved fromwww.worldwaterday2010.info, United Nations.
Anwar MS, Chaudhry NA, TayyabM. Bacteriological quality of drinking water in Punjab:evaluation of H2S strip test. J Pak Med Assoc 1999;49:237–41.
Anwar MS, Chaudhry NA, Tayyib M. Qualitative assessment of bacteriological qualityand chlorination status of drinking water in Lahore. J Coll Physicians Surg Pak2004;14:157–60.
495A. Azizullah et al. / Environment International 37 (2011) 479–497
Arain MB, Kazi TG, Jamali MK, Afridi HI, Baig JA, Jalbani N, et al. Evaluation of physico-chemical parameters of Manchar Lake water and their comparison with otherglobal published values. Pak J Anal Environ Chem 2008;9:101–9.
Arain MB, Kazi TG, Baig JA, Jamali MK, Afridi HI, Shah AQ, et al. Determination of arseniclevels in lake water, sediment, and foodstuff from selected area of Sindh, Pakistan:estimation of daily dietary intake. Food Chem Toxicol 2009;47:242–8.
Ashraf M, Tariq J, Jaffar M. Contents of trace metals in fish, sediment and water fromthree freshwater reservoirs on the Indus River, Pakistan. Fish Res 1991;12:355–64.
Asi MR, Hussain A, Muhmood ST. Solid phase extraction of pesticide residues in watersamples: DDT and its metabolites. Int J Environ Res 2008;2:43–8.
Ayyaz AK, Whelton H, O'Mullane D. A map of natural fluoride in drinking water inPakistan. Int Dent J 2002;52:291–7.
Aziz JA. Management of source and drinking-water quality in Pakistan. East MediterrHealth J 2005;11:1087–98.
Azmi MA, Naqvi SNH, Azmi MA, Aslam M. Effect of pesticide residues on health anddifferent enzyme levels in the blood of farm workers from Gadap (rural area)Karachi-Pakistan. Chemosphere 2006;64:1739–44.
Bacher M, Sztanke M, Sztanke K, Pasternak K. Plasma calcium and magnesiumconcentrations in patients with fractures of long bones treated surgically. Journal ofElementology 2010;15:5-17.
Badger JL, Stins MF, Sik Kim K. Citrobacter freundii invades and replicates in humanbrain microvascular endothelial cells. Infect Immun 1999;67:4208–15.
Baffone W, Casaroli A, Campana R, Citterio B, Vittoria E, Pierfelici L, et al. In vivo'studieson the pathophysiological mechanism of Vibrio parahaemolyticus TDH+-inducedsecretion. Microb Pathog 2005;38:133–7.
Barbeau A. Manganese and extrapyramidal disorders (a critical review and tribute toDr. George C. Cotzias). NeuroToxicol 1984;5:13–35.
Barbier O, Jacquillet G, Tauc M, Cougnon M, Poujeol P. Effect of heavy metals on, andhandling by, the kidney. Nephron Physiol 2005;99:105–10.
Beckman LE, Van Landeghem GF, Sikstrom C, Wahlin A, Markevarn B, Hallmans G, et al.Interaction between haemochromatosis and transferrin receptor genes in gifferentneoplastic disorders. Carcinogenesis 1999;20:1231–3.
Bellinger DC. Teratogen update: lead and pregnancy. Birth Defects Res A Clin MolTeratol 2005;73:409–20.
Berg D, GerlachM, YoudimMB, Double KL, Zecca L, Riederer P, et al. Brain iron pathwaysand their relevance to Parkinson's disease. J Neurochem 2001;79:225–36.
Bhutta MN, Ramzan M, Hafeez CA. Ground water quality and availability in Pakistan.Islamabad, Pakistan: Pakistan Council for Research in Water Resources (PCRWR;2002.
Bryan JP, Iqbal M, Tsarev S, Malik IA, Duncan JF, Ahmed A, et al. Epidemic of hepatitis Ein a military unit in Abbotrabad, Pakistan. Am J Trop Med Hyg 2002;67:662–8.
Carapetis JR, Steer AC, Mulholland EK, Weber M. The global burden of group Astreptococcal diseases. Lancet Infect Dis 2005;5:685–94.
Caussy D. A field guide for detection, management and surveillance of arsenicosis cases.Regional Office for South-East Asia: World Health Organization; 2005.
Cefalu WT, Hu FB. Role of chromium in human health and in diabetes. Diab Care2004;27:2741–51.
Center for Disease Control and Prevention (CDCP). Achievements in public health,1900–1999: fluoridation of drinking water to prevent dental caries. Morb MortalWkly Rep 1999;48:933–40.
Chopra AK, Xu XJ, Ribardo D, Gonzalez M, Kuhl K, Peterson JW, et al. The cytotoxicenterotoxin of Aeromonas hydrophila induces proinflammatory cytokine produc-tion and activates arachidonic acid metabolism in macrophages. Infect Immun2000;68:2808–18.
Chowdhury MA, Aziz KM, Kay BA, Rahim Z. Toxin production by Vibrio mimicus strainsisolated from human and environmental sources in Bangladesh. J Clin Microbiol1987;25:2200–3.
Crossgrove J, Zheng W. Manganese toxicity upon overexposure. NMR Biomed 2004;17:544–53.
Drelichman V, Band JD. Bacteremias due to Citrobacter diversus and Citrobacter freundii:incidence, risk factors, and clinical outcome. Arch Intern Med 1985;145:1808–10.
Duda-Chodak A, BIaszczyk U. The impact of nickel on human health. Journal ofElementology 2008;13:685–96.
Ejaz S, Akram W, Lim CW, Lee JJ, Hussain I. Endocrine disrupting pesticides: a leadingcause of cancer among rural people in Pakistan. Exp Oncol 2004;26:98-105.
Ellervik C, Mandrup-Poulsen T, Nordestgaard BG, Larsen LE, Appleyard M, Frandsen M,et al. Prevalence of hereditary haemochromatosis in late-onset type 1 diabetesmellitus: a retrospective study. Lancet 2001;358:1409.
Emsley J. Manganese. Nature's building blocks: an A–Z guide to the elementsUSA:Oxford University Press; 2003. p. 249–53.
EPA. National drinking water standards. United States Environmental ProtectionAgency; 2006.
Farooq S, Hashmi I, Qazi IA, Qaiser S, Rasheed S. Monitoring of coliforms and chlorineresidual in water distribution network of Rawalpindi, Pakistan. Environ MonitAssess 2008;140:339–47.
Farooqi A, Masuda H, Firdous N. Toxic fluoride and arsenic contaminated groundwaterin the Lahore and Kasur districts, Punjab, Pakistan and possible contaminantsources. Environ Pollut 2007a;145:839–49.
Farooqi A, Masuda H, Kusakabe M, Naseem M, Firdous N. Distribution of highly arsenicand fluoride contaminated groundwater from East Punjab, Pakistan, and thecontrolling role of anthropogenic pollutants in the natural hydrological cycle.Geochem J 2007b;41:213–34.
Farooqui A, Khan A, Kazmi SU. Investigation of a community outbreak of typhoid feverassociated with drinking water. BMC Public Health 2009;9:476.
Faruque SM, Nair GB. Vibrio cholerae: genomics and molecular biology. Norfolk, UK:Caister Academic Press; 2008.
Fatoki OS, Awofolu R. Levels of Cd, Hg and Zn in some surface waters from the EasternCape Province, South Africa. Water SA 2003;29:375–80.
Feigin RD. Textbook of pediatric infectious diseases. Philadelphia, Pennsylvania:Saunders; 2004.
Fosmire GJ. Zinc toxicity. Am J Clin Nutr 1990;51:225–7.Frery N, Nessmann C, Girard F, Lafond J, Moreau T, Blot P, et al. Environmental exposure
to cadmium and human birthweight. Toxicology 1993;79:109–18.Fung YS, Mak JLL. Determination of pesticides in drinking water by micellar
electrokinetic capillary chromatography. Electrophoresis 2001;22:2260–9.Gerischer U. Acinetobacter molecular biology. Caister Academic Press; 2008.Gidlow DA. Lead toxicity. Occup Med 2004;54:76–81.GoP. Pakistan Environmental Protection Ordinance, 1983. Govt. of Pakistan; 1983.GoP. Pakistan Environmental Protection Act, 1997. Govt. of Pakistan; 1997.Guentzel MN. Escherichia, Klebsiella, Enterobacter, Serratia, Citrobacter and Proteus.
Medical microbiology, 3rd edNew York: Churchill Livingstone; 1991. p. 377–88.Gupta SK, Gupta RC, Gupta AB, Seth AK, Bassin JK, Alka G. Recurrent acute respiratory
tract infections in areas with high nitrate concentrations in drinking water. EnvironHealth Perspect 2000;108:363–6.
Hamilton PA, Helsel DR. Effects of agriculture on ground-water quality in five regions ofthe United States. Ground Water 1995;33:217–26.
Hammer MJ. Water and wastewater technology. New York, USA: JohnWiley Inc.; 1986.Hannan A, Raja M, Arshad MU, Absar M. ‘Gastro’ of Mirpur Khas (Sindh) is resolved. J
Ayub Med Coll Abbottabad 2008;20:10–2.Hashmi I, Farooq S, Qaiser S. Chlorination and water quality monitoring within a public
drinking water supply in Rawalpindi Cantt (Westridge and Tench) area, Pakistan.Environ Monit Assess 2009a;158:393–403.
Hashmi I, Farooq S, Qaiser S. Incidence of fecal contamination within a public drinkingwater supply in Ratta Amral, Rawalpindi. Desalin Water Treat 2009b;11:124–31.
Heaney RP, Gallagher JC, Johnston CC, Neer R, Parfitt AM, Whedon GD. Calciumnutrition and bone health in the elderly. Am J Clin Nutr 1982;36:986.
Herold S, Karch H, Schmidt H. Shiga toxin-encoding bacteriophages-genomes inmotion. Int J Med Microbiol 2004;294:115–21.
Hinrichsen D, Tacio H. The coming freshwater crisis is already here. The linkagesbetween population and water. Washington, DC: Woodrow Wilson InternationalCenter for Scholars; 2002. Retrieved from http://www.wilsoncenter.org/topics/pubs/popwawa2.pdf.
HRDS. Seminar on improvement in water supply system in Islamabad. Islamabad,Pakistan: Human Resource Development Society (HRDS; 2009.
Humphrey T, O'Brien S, Madsen M. Campylobacters as zoonotic pathogens: a foodproduction perspective. Int J Food Microbiol 2007;117:237–57.
Hussain M, Rasool SA, Khan MT, Wajid A. Enterococci vs coliforms as a possible fecalcontamination indicator: baseline data for Karachi. Pak J Pharm Sci 2007;20:107–11.
Ilyas A, Sarwar T. Study of trace elements in drinking water in the vicinity of Palosidrain, Peshawar. Pak J Biol Sci 2003;6:86–91.
Inoue N, Makita Y. In: Chang LW, editor. Neurological aspects in human exposures tomanganese. Toxicology of metalsBoca Raton, FL: CRC Press; 1996. p. 415–21.
Iqbal U, Qasim H, Khan AK, Rashid R, Nasreen S, Mahmood Q, et al. Surface and groundwater quality risk assessment in district Attock Pakistan. World Applied SciencesJournal 2009;7:1029–36.
Iram S, Ahmad I, Ahad K, Muhammad A, Anjum S. Analysis of pesticides residues ofRawal and Simly lakes. Pak J Bot 2009;41:1981–7.
Islam-Ul-Haq, Cheema WA, Ahmed CN. Multifaceted ground water quality andrecharge mechanism issues in a mega-city (Rawalpindi, Pakistan), and mitigationstrategies, Securing Groundwater Quality in Urban and Industrial Environments6thInternational IAHS Groundwater Quality Conference (2–7 December 2007),Fremantle, Western Australia; 2007.
Islam-Ul-Haque, Baig MA, Nabi D, Hayat W. Groundwater arsenic contamination — amulti-directional emerging threat to water scarce areas of Pakistan6th Interna-tional IAHS Groundwater Quality Conference (2–7 December 2007), Fremantle,Western Australia; 2007.
Jabbar A, Masud SZ, Parveen Z, Ali M. Pesticide residues in cropland soils and shallowgroundwater in Punjab Pakistan. Bull Environ Contam Toxicol 1993;51:268–73.
Jan MR, Shah J, Khawaja MA, Gul K. DDT residue in soil and water in and aroundabandoned DDT manufacturing factory. Environ Monit Assess 2009;155:31–8.
Jarraud S, Mougel C, Thioulouse J, Lina G, Meugnier H, Forey F, et al. Relationshipsbetween Staphylococcus aureus genetic background, virulence factors, agr groups(alleles), and human disease. Infect Immun 2002;70:631–41.
Jehangir M. Bacteriological contamination and upward trend in nitrate contents,observed in drinking water of Rawalpindi and Islamabad. Pakistan: The NetworkConsumer Protection in Pakistan; 2002.
Johnson MD, Kenney N, Stoica A, Hilakivi-Clarke L, Singh B, Chepko G, et al. Cadmiummimics the in vivo effects of estrogen in the uterus and mammary gland. Nat Med2003;9:1081–4.
Johnson S, Saikia N, Kumar MA. Analysis of pesticide residues in soft drinks; 2006.Centre for Science and Environment, Tughlakabad institutional area, 110062 NewDelhi.
Kahlown MA, Majeed A. Water-resources situation in Pakistan: challenges and futurestrategies. Water resources in the south: present scenario and future prospec-tsIslamabad, Pakistan: Commission on Science and Technology for SustainableDevelopment in the South (COMSATS; 2003. p. 21–39.
Kashif SR, AkramM, Yaseen M, Ali S. Studies on heavy metals status and their uptake byveges in adjoining areas of Hudiara drain in Lahore. Soil & Environment 2009;28:7-12.
Kausar R, Ahmad S, Khalil-Ur-Rehman, Ahmad R. Fluoride status of underground waterof Faisalabad city area. Int J Agri Biol 2003;5:536–9.
496 A. Azizullah et al. / Environment International 37 (2011) 479–497
Kawasaki T, Delea CS, Bartter FC, Smith H. The effect of high-sodium and low-sodiumintakes on blood pressure and other related variables in human subjects withidiopathic hypertension. Am J Med 1978;64:193–8.
Kazantzis G. Renal tubular dysfunction and abnormalities of calcium metabolism incadmium workers. Environ Health Perspect 1979;28:155–9.
Kazi TG, Arain MB, Baig JA, Jamali MK, Afridi HI, Jalbani N, et al. The correlation ofarsenic levels in drinking water with the biological samples of skin disorders. SciTotal Environ 2009;407:1019–26.
Kazmi SS, Khan SA. Level of nitrate and nitrite contents in drinking water of selectedsamples received at AFPGMI, Rawalpindi. Pak J Physiol 2005;1:1–2.
Keusch GT, Jacewicz M. The pathogenesis of Shigella diarrhea. VI. Toxin and antitoxin inShigella flexneri and Shigella sonnei infections in humans. J Infect Dis 1977;135:552–6.
Khan AA. Fluoride levels in drinking water of Pakistan. Pak J Med Res 2000;39:52–60.Khan MA, Iqbal M, Ahmad I, Soomro MH. Economic evaluation of pesticide use
externalities in the cotton zones of Punjab. Pakistan Development Review 2002;41:683–98.
Khan DA, Bhatti MM, Khan FA, Naqvi ST, Karam A. Adverse effects of pesticides residueson biochemical markers in Pakistani tobacco farmers. Int J Clin Exp Med 2008;1:274–82.
Khan DA, Shabbir S, Majid M, Naqvi TA, Khan FA. Risk assessment of pesticide exposureon health of Pakistani tobacco farmers. J Expo Sci Environ Epidemiol 2010;20:196–204.
Laghari A, Chandio SN, Khuhawar MY, Jehangir TM. Effect of wastewater on the qualityof ground water from southern parts of Hyderabad city. J Biol Sci 2004;4:314–6.
Li DP, Wu ZJ. Impact of chemical fertilizers application on soil ecological environment.Ying Yong Sheng Tai Xue Bao 2008;19:1158–65.
Li Y, Zhang J. Agricultural diffuse pollution from fertilisers and pesticides in China.Water Sci Technol 1999;39:25–32.
Lone MI, Saleem S, Mahmood T, Saifullah K, Hussain G. Heavy metal contents ofvegetables irrigated by sewage/tube-well water. Int J Agri Biol 2003;5:533–5.
Mahmood S, Maqbool A. Impacts of wastewater irrigation on water quality and on thehealth of local community in Faisalabad. Pak J Water Res 2006;10:19–22.
Mah-Urooj, Haq T, Perveen F, Sultana L. Bacteriological analysis of groundwater ofKarachi. Pakistan Journal of Water Resources 2007;50:273–7.
Mashiatullah A, Chaudhary MZ, Khan MS, Javed T, Qureshi RM. Coliform bacterialpollution in Rawal Lake, Islamabad and its feeding streams/river. Nucleus 2010;47:35–40.
Mastoi GM, Shah SGS, Khuhawar MY. Assessment of water quality of Manchar Lake inSindh (Pakistan). Environ Monit Assess 2008;141:287–96.
McGowan JE. Resistance in nonfermenting Gram-negative bacteria: multidrugresistance to the maximum. Am J Infect Control 2006;34:S29–37.
McGregor DB, Baan RA, Partensky C, Rice JM, Wilbourn JD. Evaluation of thecarcinogenic risks to humans associated with surgical implants and other foreignbodies — a report of an IARC Monographs Programme Meeting. Eur J Cancer2000;36:307–13.
McMichael AJ, Vimpani GV, Robertson EF, Baghurst PA, Clark PD. The Port Pirie cohortstudy: maternal blood lead and pregnancy outcome. J Epidemiol CommunityHealth 1986;40:18–25.
Mian Z, Ahmed T, Rashid A. Accumulation of heavy metals in water of river Sawan dueto effluents in industrial areaProc of Int Sym on agro-environmental issues andfuture strategies: towards 21st century UA Faisalabad, Pakistan; 1998.
Midrar-Ul-Haq, Khattak RA, Puno HK, Saif MS, Memon KS. Surface and ground watercontamination in NWFP and Sindh provinces with respect to trace elements. Int JAgri Biol 2005;7:214–7.
Milman N, Pedersen P, Steig T, Byg KE, Graudal N, Fenger K. Clinically overt hereditaryhemochromatosis in Denmark 1948–1985: epidemiology, factors of significance forlong-term survival, and causes of death in 179 patients. Ann Hematol 2001;80:737–44.
MOE-PAK. State of the Environment Report 2005 (Draft). Government of Pakistan,Islamabad, Pakistan: Ministry of Environment; 2005a.
MOE-PAK. National Environmental Policy, 2005. Govt. of Pakistan: Ministry ofEnvironment; 2005b.
MOE-PAK. National Sanitation Policy, 2006. Govt. of Pakistan: Ministry of Environment;2006.
MOE-PAK. National Drinking Water Policy, 2009. Govt. of Pakistan: Ministry ofEnvironment; 2009.
Mumtaz MW, Adnan A, Mukhtar H, Nawaz K, Raza A, Ahmad Z. Estimation ofbacteriological levels in surface water samples to evaluate their contaminationprofile. Environ Monit Assess 2010 Published online.
Musser JM, Krause RM. The revival of group A streptococcal diseases, with a commentaryon staphylococcal toxic shock syndrome. Biomedical Research Reports 1998;1:185–218.
Nadeem-ul-Haq, Arain MA, Haque Z, Badar N, Mughal N. Drinking water contaminationby chromium and lead in industrial lands of Karachi. J Pak Med Assoc 2009;59:270–4.
Naeem M, Khan K, Rehman S, Iqbal J. Environmental assessment of ground waterquality of Lahore area, Punjab, Pakistan. Journal of Applied Sciences 2007;7:41–6.
Naseem S, Rafique T, Bashir E, BhangerMI, Laghari A, Usmani TH. Lithological influenceson occurrence of high-fluoride groundwater in Nagar Parkar area, Thar Desert,Pakistan. Chemosphere 2010;78:1313–21.
Nasrullah, Naz R, Bibi H, qbal M, Durrani MI. Pollution load in industrial effluent andground water of Gadoon Amazai Induatrial Estate (GAIE) Swabi, NWFP. J Agri BiolSci 2006;1:18–24.
Nazif W, Perveen S, Shah SA. Evaluation of irrigation water for heavy metals of akbarpuraarea. J Agri Biol Sci 2006;1:51–4.
Nickson RT, McArthur JM, Shrestha B, Kyaw-Myint TO, Lowry D. Arsenic and otherdrinking water quality issues, Muzaffargarh District, Pakistan. Appl Geochem2005;20:55–68.
Nicolle L. Pseudomonas aeruginosa: infections and treatment. N Engl J Med 1995;332:616–7.Nordberg GF. Cadmium and health in the 21st century-historical remarks and trends for
the future. Biometals 2004;17:485–9.Oller AR, Costa M, Oberdörster G. Carcinogenicity assessment of selected nickel
compounds. Toxicol Appl Pharmacol 1997;143:152–66.PAK-EPA. Investigation of drinking water quality of water filteration plants installed at
Islamabad and Rawalpindi. Pakistan Environment Programme (PEP) ComponentAugust 2005Pakistan Environmental Protection Agency (PAK-EPA) Ministry ofEnvironment, Govt. of Pakistan, Islamabad; 2005a.
PAK-EPA. State of Environment Report 2005. Pakistan Environmental Protection Agency(Pak-EPA). Govt. of Pakistan, Islamabad, Pakistan: Ministry of Environment; 2005b.
PAK-EPA. National Standards for Drinking Water Quality (NSDWG). PakistanEnvironmental Protection Agency (PAK-EPA). Government of Pakistan, Islamabad:Ministry of Environment; 2008.
Parkkila S, Niemelä O, Savolainen ER, Koistinen P. HFE mutations do not account fortransfusional iron overload in patients with acute myeloid leukemia. Transfusion2001;41:828–31.
Parveen Z, Masud SZ. Organochlorine pesticide residue in cattle drinking water. Pak JSci Ind Res 1988;31:53–6.
PCRWR. National Water Quality Monitoring Programme. Water Quality Report 2003–2004. Islamabad, Pakistan:PakistanCouncil for Research inWaterResources (PCRWR;2005. available at http://www.pcrwr.gov.pk/wq_phase3_report/TOC.htm.
PCRWR. Annual Report 2005–2006., part 2. Islamabad, Pakistan: Pakistan Council forResearch in Water Resources (PCRWR; 2008a. available at http://www.pcrwr.gov.pk/Annual%20Reports/New%20Annual%20Repot%202005-06_2.pdf.
PCRWR. Arsenic Contamination in Ground Water of Central Sindh Phase I. Islamabad,Pakistan: Pakistan council for Research in Water Resources (PCRWR; 2008b.p. 19–38. Retrieved from http://www.pcrwr.gov.pk/Arsenic_CS/ACS_TOC.htm.
PCRWR. Arsenic Contamination in Ground Water of Southern Punjab Phase I. Islamabad,Pakistan: Pakistan council for Research inWater Resources (PCRWR; 2008c. p. 12–28.Retrieved from http://www.pcrwr.gov.pk/Arsenic_SP/ASP_TOC.htm.
Perez de Nanclares G, Castano L, Gaztambide S, Bilbao JR, Pi J, Gonzalez ML, et al. Excessiron storage in patients with type 2 diabetes unrelated to primary hemochroma-tosis. N Engl J Med 2000;343:890–1.
PiasekM, Laskey JW. Effects of in vitro cadmium exposure on ovarian steroidogenesis inrats. J Appl Toxicol 1999;19:211–7.
Pimentel D. Amounts of pesticides reaching target pests: environmental impacts andethics. Journal of Agricultural and Environmental Ethics 1995;8:17–29.
PodschunR,UllmannU.Klebsiella spp. asnosocomial pathogens: epidemiology, taxonomy,typing methods, and pathogenicity factors. Clin Microbiol Rev 1998;11:589–603.
Qasim M. Twin cities: Water-borne diseases on the rise, The NEWS, Sunday, July 20,2008, Pakistan, 2008.
RabMA, Bile MK, Mubarik MM, Asghar H, Sami Z, Siddiqi S, et al. Water-borne Hepatitis Evirus epidemic in Islamabad, Pakistan: a common source outbreak traced to themalfunction of a modern water treatment plant. Am J Trop Med Hyg 1997;57:151–7.
Rahman A, Lee HK, Khan MA. Domestic water contamination in rapidly growing megacities of Asia: case of Karachi, Pakistan. Environ Monit Assess 1997;44:339–60.
Rasheed F, Khan A, Kazmi SU. Bacteriological analysis, antimicrobial susceptibility anddetection of 16S rRNA gene of Helicobacter pylori by PCR in drinking water samplesof earthquake affected areas and other parts of Pakistan. Malaysian Journal ofMicrobiology 2009;5:123–7.
RasmussenML, FolsomAR, CatellierDJ, TsaiMY, GargU, Eckfeldt JH. A prospective study ofcoronary heart disease and the hemochromatosis gene (HFE) C282Y mutation: theatherosclerosis risk in communities (ARIC) study. Atherosclerosis 2001;154:739–46.
Raviraja A, Babu GNV, Bijoor AR, Menezes G, Venkatesh T. Lead toxicity in a family as aresult of occupational exposure. Arh Hig Rada Toksikol 2008;59:127–33.
Raza N, Niazi SB, Sajid M, Iqbal F, Ali M. Studies on relationship between season andinorganic elements of Kallar Kahar Lake (Chakwal), Pakistan. Journal of Research(Science), Bahauddin Zakariya University, Multan, Pakistan 2007;18:61–8.
Riess ML, Halm JK. Lead poisoning in an adult: lead mobilization by pregnancy? J GenIntern Med 2007;22:1212–5.
Rosemann N. Drinking water crisis in Pakistan and the issue of bottled water. The caseof Nestlé's ‘Pure Life’. Pakistan: Swiss Coalition of Development Organisations andActionaid; 2005. Retrieved from http://www.alliancesud.ch/en/policy/water/downloads/nestle-pakistan.pdf.
Saif MS, Midrar-Ul-Haq, Memon KS. Heavy metals contamination through industrialeffluent to irrigation water and soil in Korangi area of Karachi (Pakistan). Int J AgriBiol 2005;7:646–8.
Sajjad M, Rahim S, Tahir SS. Chemical quality of groundwater in Rawalpindi/Islamabad,24. Water, Engineering and Development Center; 1998. p. 271–4.
Saleemi MA. Environmental assessment and management of irrigation and drainagescheme for sustainable agriculture growth. Lahore, Pakistan: EPA Bulletin; 1993.
Sarwar G, Khan J, Iqbal R, Afridi AK, Khan A, Sarwar R. Bacteriological analysis ofdrinking water from urban and peri-urban areas of Peshawar. Journal ofPostgraduate Medical Institute, Khyber Medical College, Peshawar 2004;18:64–9.
Sayre LM, Perry G, Atwood CS, Smith MA. The role of metals in neurodegenerativediseases. Cell Mol Biol (Noisy-le-grand) 2000;46:731–41.
Seilkop SK, Oller AR. Respiratory cancer risks associated with low-level nickelexposure: an integrated assessment based on animal, epidemiological, andmechanistic data. Regul Toxicol Pharmacol 2003;37:173–90.
Shah MT, Danishwar S. Potential fluoride contamination in the drinking water ofNaranji area, Northwest Frontier Province, Pakistan. Environ Geochem Health2003;25:475–81.
497A. Azizullah et al. / Environment International 37 (2011) 479–497
Shaikh SA, Gul N, Sultana L. Surveillance of drinking water of Karachi city:microbiological quality. Pak J Sci Ind Res 2008;51:272–5.
Shar AH, Kazi Y, Zardari M, Soomro IH. Enumeration of total and fecal coliform bacteriain drinking water of Khairpur Sindh. Pak J Med Res 2008a;47:18–21.
Shar AH, Kazi YF, Soomro IH. Impact of seasonal variation on bacteriological quality ofdrinking water. Bangladesh J Microbiol 2008b;25:69–72.
Shar AH, Kazi YF, Kanhar NA. Seasonal variation of Vibrio cholerae and Vibrio mimicus infreshwater environment. Proc Pakistan Acad Sci 2010;47:25–31.
Sial RA, Chaudhary MF, Abbas ST, Latif MI, Khan AG. Quality of effluents from HattarIndustrial Estate. J Zhejiang Univ Sci B 2006;7:974–80.
Siddique A, Mumtaz M, Saied S, Karim Z, Zaigham NA. Fluoride concentration indrinking water of Karachi City (Pakistan). Environ Monit Assess 2006;120:177–85.
Siddiqui A, Naseem S, Jalil T. Groundwater quality assessment in and around KaluKhuhar, Super Highway, Sindh, Pakistan. Journal of Applied Sciences 2005;5:1260–5.
Singh RP, Kumar S, Nada R, Prasad R. Evaluation of copper toxicity in isolated humanperipheral blood mononuclear cells and it's attenuation by zinc: ex vivo. Mol CellBiochem 2006;282:22.
Solomons NW, Ruz M. Trace element requirements in humans: an update. J Trace ElemExp Med 1998;11:177–95.
Tahir MA, Rasheed H. Distribution of nitrate in the water resources of Pakistan. Afr JEnviron Sci Techol 2008;2:397–403.
Taj A, Baqai R. Antimicrobial effects of alum and sulphur on bacteria isolated frommineral and hospital water. Infectious Diseases Journal of Pakistan 2007:10–3.
Tanabe A, Mitobe H, Kawata K, Yasuhara A, Shibamoto T. Seasonal and spatial studies onpesticide residues in surface waters of the Shinano River in Japan. J Agric FoodChem 2001;49:3847–52.
Tariq J, Jaffar M, Ashraf M. Trace metal concentration, distribution and correlation inwater, sediment and fish from the Ravi River, Pakistan. Fish Res 1994;19:131–9.
Tariq MI, Afzal S, Hussain I. Pesticides in shallow groundwater of Bahawalnagar,Muzafargarh, D.G. Khan and Rajan Pur districts of Punjab, Pakistan. Environ Int2004;30:471–9.
Tariq M, Ali M, Shah Z. Characteristics of industrial effluents and their possible impactson quality of underground water. Soil Environ 2006;25:64–9.
TariqMI, Afzal S, Hussain I, Sultana N. Pesticides exposure in Pakistan: a review. EnvironInt 2007;33:1107–22.
Tariq SR, Shah MH, Shaheen N, Jaffar M, Khalique A. Statistical source identification ofmetals in groundwater exposed to industrial contamination. Environ Monit Assess2008;138:159–65.
Todar K. Online textbook of bacteriology. University ofWisconsin-Madison Departmentof Bacteriology; 2008.
Ullah R, Malik RN, Qadir A. Assessment of groundwater contamination in an industrialcity, Sialkot, Pakistan. Afr J Environ Sci Technol 2009;3:429–46.
UNESCO. Water for people water for life. The United Nations World WaterDevelopment Report; 2003. United Nations Educational, Scientific and CulturalOrganization (UNESCO) and Berghahn Books.
USEPA.Drinkingwater health advisory formanganese; 2004.United States EnvironmentalProtection Agency, Health and Ecological Criteria Division, Washington, DC 20460.
Venkatesh T. The effects of environmental lead on human health—a challengingscenario. Environmental Health Focus 2004;2:8-16.
Verjan N, Hirono I, Aoki T. Genetic loci of major antigenic protein genes of Edwardsiellatarda. Appl Environ Microbiol 2005;71:5654–8.
Waalkes MP, Rehm S, Riggs CW, Bare RM, Devor DE, Poirier LA, et al. Cadmiumcarcinogenesis in male Wistar [Crl:(WI) BR] rats: dose–response analysis of tumorinduction in the prostate and testes and at the injection site. Cancer Res 1988;48:4656–63.
Ward MH, Mark SD, Cantor KP, Weisenburger DD, Zahm SH. Drinking water nitrate andthe risk of non-Hodgkin's lymphoma. Epidemiology 1996;7:465–71.
WB-CWRAS, ‘Pakistan country water resources assistance strategy water economy:Running dry’, 34081-PK, Agriculture and Rural Development Unit, World Bank,2005.
WB-SCEA. Pakistan Strategic Country Environmental Assessment. Main report., Reportno. 36946-PKWorld Bank; 2006. p. 1-66.
Weiss L, Wright S. Mercury on the road to zero. Recommended strategies to eliminatemercury releases from human activities in Oregon by 2020. Oregon: OregonEnvironmental Council & The Mercury Solution Team; 2001.
Weyer PJ, Cerhan JR, Kross BC, Hallberg GR, Kantamneni J, Breuer G, et al. Municipaldrinking water nitrate level and cancer risk in older women: the Iowa Women'sHealth Study. Epidemiology 2001;11:327–38.
WHO. Guidelines for drinking water quality. Geneva, Switzerland: World HealthOrganiazation; 1993.
WHO. Fluorides and oral health. WHO Technical Report Series 846Word HealthOrganization; 1994. p. 5.
WHO. Guidelines for drinking-water quality. Geneva: World Health Organization;2008.
WHO, UNISEF. Global water supply and sanitation assessment 2000 report. USA: WorldHealth Organization and United Nations Children's Fund; 2000. Available at: http://www.who.int/water_sanitation_health/monitoring/jmp2000.pdf.
WWF. Pakistan's waters at riskWater and health related issues in Pakistan and keyrecommendations; 2007. p. 1-33. A special report, WWF — Pakistan, FerozepurRoad, Lahore — 54600, Pakistan.
Yang Q, McDonnell SM, Khoury MJ, Cono J, Parrish RG. Hemochromatosis-associatedmortality in the United States from 1979 to 1992: an analysis of multiple-causemortality data. Ann Intern Med 1998;129:946–53.
Zahoorullah, Akhtar T, Zai S. Quality of drinking water in rural Peshawar. Pak J Med Res2003;42:85–9.
Zahra T, Jamil N. Outbreak of gastroenteritis in Gadap, Karachi during summer of 2003.Infectious Diseases Journal of Pakistan 2001;19:3–4.
Zia MS, Jamil M, Qasim M, Rahman A, Usman K. Natural resources pollution anddegradation due to pesticide use in Pakistan12th International conference onintegrated diffuse pollution management (IWA DIPCON 2008), Khon KaenUniversity, Thailand; 25–29th August, 2008; 2008. p. 226–7.