Embed Size (px)
Citation preview

Full Terms & Conditions of access and use can be found athttp://www.tandfonline.com/action/journalInformation?journalCode=teep20
Download by: [ESRI Economic &Social Research Institute] Date: 12 June 2017, At: 08:30
Journal of Environmental Economics and Policy
ISSN: 2160-6544 (Print) 2160-6552 (Online) Journal homepage: http://www.tandfonline.com/loi/teep20
Water quality and recreational use of publicwaterways
Benjamin Breen, John Curtis & Stephen Hynes
To cite this article: Benjamin Breen, John Curtis & Stephen Hynes (2017): Water quality andrecreational use of public waterways, Journal of Environmental Economics and Policy, DOI:10.1080/21606544.2017.1335241
To link to this article: http://dx.doi.org/10.1080/21606544.2017.1335241
© 2017 The Author(s). Published by InformaUK Limited, trading as Taylor & FrancisGroup
Published online: 01 Jun 2017.
Submit your article to this journal
Article views: 26
View related articles
View Crossmark data

Water quality and recreational use of public waterways
Benjamin Breena,b, John Curtis a,b and Stephen Hynesc
aThe Economic and Social Research Institute, Dublin, Ireland; bTrinity College Dublin, Dublin, Ireland;cSocio-Economic Marine Research Unit, Whitaker Institute, National University of Ireland, Galway, Ireland
ARTICLE HISTORYReceived 11 January 2017Accepted 22 May 2017
ABSTRACTThis study combines routinely collected water quality data from Irelandand an on-site survey of waterway users to evaluate whether trip durationis responsive to changes in water quality. Four categories of recreationalusers are considered: anglers, boaters, other water sports (e.g. rowing,swimming, canoeing, etc.) and land-based activities at water sites,specifically walking and cycling. Water quality measures included in theanalysis include Water Framework Directive (WFD) status, biochemicaloxygen demand, ammonia, phosphorus and faecal coliform. The analysisfinds evidence that higher levels of recreational demand (i.e. trips oflonger duration) occur at sites with better water quality. However, we alsofind no statistical association between the overall WFD status and theduration of the recreational trip, which indicates that WFD status is oflimited practical use for recreational users.
KEYWORDSWater-based recreation;travel cost; water quality;Water Framework Directive
1. Introduction
That people benefit from access to natural and manmade water bodies is well documented (Rein-hard and Pouli 2011; V€olker and Kistemann 2011, 2013). Increasing the visibility of blue space inurban areas has been associated with lower psychological distress (Nutsford et al. 2016) and there isevidence that exposure to blue spaces during physical activity shortens perceived exercise durationand increases willingness to repeat such exercise in the future (White et al. 2015). Nature-basedrecreation, aside from the health benefits, has been shown to produce synergistic effects and impactpositively on individuals’ emotional well-being (Korpela et al. 2014; White et al. 2015). Over 50% ofthe adult population in the developed world frequently access public waterways for recreational pur-poses (Williams and Ryan 2004; Environment Agency 2009; Outdoor Foundation 2013). Goodwater quality enhances the enjoyment which recreational water users derive from their chosen activ-ity (Wade et al. 2010; Dorevitch et al. 2011; Arnold et al. 2013; Aminu et al. 2014; Dorevitch et al.2015; Lee and Lee 2015) but users do not always recognise poor water quality or its associated risks(Westphal et al. 2008). This has been argued as primarily due to a delay in chronic health impactsand difficulty in perceiving the presence of pollutants (Burger, Staine, and Gochfeld 1993) thoughHynes, Hanley, and Scarpa (2008) and Boeri et al. (2012) suggest that the implied health risk maynot be an important aspect of a dedicated water sports recreationalist’s choice of site, unless the levelof water pollution is extreme. Thus good water quality, when it can be perceived by recreationalusers, contributes positively to utility and is likely to increase demand for recreation activities atpublic waterways. However, waterway users risk negative health outcomes due to the difficulty ofdetecting pollutants. Recreational water-users cannot factor poor water quality levels into their
CONTACT John Curtis [email protected]
© 2017 The Author(s). Published by Informa UK Limited, trading as Taylor & Francis GroupThis is an Open Access article distributed under the terms of the Creative Commons Attribution-NonCommercial-NoDerivatives License (http://creativecommons.org/licenses/by-nc-nd/4.0/), which permits non-commercial re-use, distribution, and reproduction in any medium, provided the originalwork is properly cited, and is not altered, transformed, or built upon in any way.
JOURNAL OF ENVIRONMENTAL ECONOMICS AND POLICY, 2017https://doi.org/10.1080/21606544.2017.1335241
perception of an overall recreational experience until a perceptible negative outcome associated withpoor water quality arises, such as digestive illness or eutrophication. Aside from health impacts, pol-lution can reduce the enjoyability of recreational activities by interfering with the user ability to per-form an activity, producing offensive odours and reducing the sightliness of a water way site (Foodand Agriculture Organisation 1996; Lipton 2004; Dodds et al. 2008).
Waterway managers attempt to ensure a high-quality experience for recreational water users.One of the ways that managers can measure the impacts of various management actions on recrea-tional user satisfaction is to quantify changes in recreation demand at public waterways sites, givenchanges in waterway characteristics. This task, like management of waterways, is difficult as water-way users engage in diverse types of recreational activities and will have contrasting preferences fordifferent types of site characteristics. In addition, while some factors affecting recreation demand liewithin managers’ control, such as access, pricing and facilities, others will not, such as hydromor-phological features and weather. While managers may be charged with water quality monitoringand governance, the diversity and extent of water-use (e.g. agricultural, manufacturing, sewage, etc.)mean that waterway managers may ultimately have only limited control of a site’s water quality. Anunderstanding of which water quality metrics recreational users are most sensitive towards wouldenable waterway managers to concentrate resources towards achieving favourable values for thosemetrics.
This study attempts to estimate how recreational user demand is associated with varying levels ofwater quality defined by different water quality metrics. This can inform managers about potentialpublic health risks (in the event that users appear to ignore changes in the presence of dangerouspollutants in public waterways) and possibly pre-emptively avoid them. Second, it can identifywhich water quality measures are incorporated into the utility function of recreational users, thuspartially driving recreation demand. This information can equip waterway managers with a betterunderstanding of the biological and physico-chemical characteristics which, if successfully con-trolled, will benefit waterway-user welfare and improve demand for public waterway use. It will alsohighlight some of the loss in public welfare (and impacts on recreation demand) that could arise inthe event of increased pollution of public waterways.
Numerous studies have analysed the impact of water quality on recreational water-use demand.Topics have included angling (Bockstael, Hanemann, and Kling 1987; Curtis and Stanley 2016),swimming (Needelman and Kealy 1995), beach visits (Hanley, Bell, and Alvarez-Farizo 2003), boat-ing (Lipton 2004) and many other water-based recreational activities (Binkley and Hanemann 1978;G€url€uk and Rehber 2008; Hynes, Hanley, and Scarpa 2008; Paudel, Caffey, and Devkota 2011). Acontribution of this paper is its use of revealed user data to determine which water quality measuresusers are most responsive towards and whether the response varies by recreational activity. Thepaper has parallels with Egan et al. (2009) who find recreational anglers to be responsive to the fullset of water quality measures used by biologists. The overarching water quality measure in Europe isdefined by the European Union’s Water Framework Directive (WFD), which requires that waterbodies be of good ecological status, a description that covers indicators such as biological quality(i.e. fish, benthic invertebrates, aquatic flora), hydromorphological quality, physical–chemical qual-ity, and chemical status (Directive 2000/60/EC 2000). There are five status classes within the WFD’sclassification scheme for water quality: high, good, moderate, poor and bad. These are nominallyeasy to understand but their usefulness to recreational water users may vary depending on the typeof activity water users are involved in. Constituent elements of WFD status, covering a number ofecological and physico-chemical measures, may be more useful for recreational users, but suchinformation is less accessible to the general public. We investigate if recreational use is responsive toWFD status, which comprises biological and physico-chemical states, or whether recreational use ismore responsive to chemical status that is potentially more relevant to most water users with theexception of anglers.
This paper employs a travel cost model to estimate a demand function for water- and land-basedrecreational users of waterway sites across Ireland. Including water quality metrics as site attributes
2 B. BREEN ET AL.

within the travel cost model enables us to examine whether boating enthusiasts, as they perceivewater quality, are responsive to laboratory measures of water quality. Section 2 of the paper providesa description of the WFD water quality measurements used in the analysis. Section 3 describes themethodology used for the analysis, specifically the travel cost model, and considers its suitability forassessing the impacts of changes in water quality on recreation demand. Section 4 describes thesocio-economic and other data sources. Section 5 reports the results of the travel cost model, giventhe inclusion of different water quality measures. The final section provides concluding remarks andsuggestions for further work in the area.
2. WFD water quality measures
The first water quality directive of the EEC, the surface waters directive (Directive 75/440/EEC 1975)focused primarily on the monitoring and protection of drinking water. Upon its inception a series ofmore general water quality directives were implemented relating to bathing water, dangerous sub-stances, freshwater fish and several other uses. The disjointedness of these various water qualitydirectives eventually culminated in the establishment of the WFD (Directive 2000/60/EC 2000).Under the WFD water quality monitoring takes place at diverse water body types (e.g. rivers, lakes,canals, estuaries, coastal waters, etc.). Water pollution can greatly reduce the demand for recreation(Lipton 2004). Due to the presence of decaying matter, eutrophied water is less suitable for recrea-tional purposes, becoming unsightly and developing slime, weed infestation, and noxious odourfrom decaying algae.1 In the extreme case, eutrophication can reduce water oxygen levels, leading tofish kills, significantly impacting recreational fisheries and contributing further to the eutrophicationprocess. Angling and boating activities are physically impeded by eutrophication-driven algalblooms and water users are less likely to swim, boat and fish during algal blooms due to health risks,unfavourable appearance and unpleasant odours (Dodds et al. 2008). Such outcomes can have sig-nificant economic impacts. For example in the United States, estimated losses associated with clo-sure of recreational angling and boating sites due to hypereutrophic conditions are between $182and $589 million per annum (Dodds et al. 2008).
2.1. WFD status
The WFD requires that the status of each water body to be assessed across a number of biologicaland physico-chemical measures producing an overarching WFD ecological status ranging acrossfive categories from ‘bad’ to ‘high’. The biological component of WFD status is possibly of mostinterest to anglers but this will have little relevance to most recreational users. The quality metrics ofrelevance to most recreational activities (e.g. boating, swimming, etc.) are those surrounding thephysico-chemical state of water bodies. Therefore, in addition to investigating how recreational useof waterways is responsive to WFD status we also consider a number of other quality metrics, mostof which are used in the overall WFD assessment.
2.2. Biochemical oxygen demand
Biochemical oxygen demand (BOD) is a measure of water quality that indicates whether a waterbody is in a eutrophied state. Higher BOD levels of a water body are associated with lower dissolvedoxygen levels. For instance, when large quantities of organic material are present in a water bodybacterial uptake of oxygen outstrips the natural replenishment of oxygen from the atmosphere andby photosynthesis. Eutrophication arises when dissolved oxygen levels become so low that respiringaquatic organisms are unable to absorb sufficient oxygen from the water. While individuals involvedin water-based activities, such as swimming, are likely to be most sensitive to eutrophic conditions,the demand for all recreational activities near water are likely to be impacted due to impediment ofactivities, discomfort and visual unpleasantness. Irish regulations giving statutory effect to the WFD
JOURNAL OF ENVIRONMENTAL ECONOMICS AND POLICY 3

and other EU water legislation require rivers with ‘good’ status have mean BOD levels less than orequal to 1.5 mg/l and that the 95th percentile should be less than or equal to 2.6 mg/l.2
2.3. Phosphates
Phosphorous is an essential nutrient required by all organisms for basic life processes. Phosphatecarrying pollutants like fertilisers, wastewater, detergents and run-off from paved surfaces can exac-erbate algal growth in fresh water systems, leading to algal blooms, eutrophication, and increasedBOD. Phosphates are the limiting factor in fresh water plant and algal growth, which makes its con-trol and monitoring critical, if eutrophication is to be avoided. Total phosphates is the sum of ortho-phosphates, polyphosphates and organic phosphorous.3 Orthophosphate is the most readilyavailable form for uptake during photosynthesis. High concentrations generally occur in conjunc-tion with algal blooms. For rivers to have ‘good’ WFD status mean orthophosphate levels must beless than or equal to 0.035 mg P/l and the 95th percentile be less than or equal to 0.075 mg P/l.
2.4. Ammonia
Ammonia is generally present in small amounts in natural waters resulting from the reduction ofnitrogen containing compounds by microbiological activity. Aquatic organisms are extremely sensi-tive to deviations away from the natural ammonia level and in particular, the un-ionised form ofammonia is highly toxic to aquatic animals (Eddy 2005). High ammonia levels produce a noxiousodour and are often indicative of sewage pollution. For rivers to have ‘good’ WFD status meanammonia levels must be less than or equal to 0.065 mg/l N and the 95th percentile should less thanor equal to 0.14 mg N/l.
2.5. Faecal coliform
Faecal coliform originates in human and animal waste and therefore primarily enters a water bodythrough sewage effluent and animal manure run-off. Not all faecal coliform is harmful to humansand the environment but overly high levels in a water body indicate the presence of pathogenicmicro-organisms. For example, water-borne diseases like giardis and cryptosporidiosis can causesevere digestive illness in humans. Furthermore, the aerobic (and potentially anaerobic) decomposi-tion of organic matter in which faecal coliform is contained reduces the DO saturation level. Mea-surement of faecal coliform is not undertaken within the context of WFD monitoring and withinour dataset faecal coliform measurement is only available for canal recreation sites.
In summary, though other water quality metrics are assessed as part of WFD water quality moni-toring we focus on these measures as being those most likely to capture water conditions that have adirect impact on the quality of the recreational experience. Those impacts may include fish kills, ill-ness or discomfort as well as a reduction in visual aesthetic. The analysis here is not concerned withquantifying these impacts, rather we are interested in determining whether changes in levels of waterquality are associated with different durations of recreational activity. We are not attempting to esti-mate causation, as the data we use is cross section across multiple sites.
3. Methodology
The travel cost method (TCM) is a frequently used approach for estimating the demand for recrea-tional activities (Mart�ınez-Espi~neira and Amoako-Tuffour 2008; Egan et al. 2009; Ovaskainen, Neu-vonen, and Pouta 2012; Hynes and Greene 2013). It uses data on the travel costs and other expensesto a location where a specific recreation activity takes place. Travel cost is a revealed ‘price’ foraccessing a site for a specific recreational pursuit, and therefore a proxy for the price an individual iswilling to pay to engage in the activity. In addition to travel cost, other variables are included in the
4 B. BREEN ET AL.

model to control for different factors which may also partially explain variation in an individual’sdemand for a recreational activity. Such factors can be individual specific, such as income, educationor age, or alternative specific, such as site facilities or water quality. The TCM can thus provide notonly estimates of demand for recreational activities, but show how recreation demand varies in asso-ciation with different water quality levels. One would expect a decrease in water quality to be nega-tively associated with recreation demand at sites where the activity takes place. The TCM allows usto evaluate the extent to which this is the case in practice. Trip duration at a recreation site is mod-elled as a function of individual and site-specific attributes:
yi ¼ f xið Þ; (1)
where yi is a discrete count variable indicating the number of trip days that individual i chooses andxi is a vector of individual- and site-specific variables including travel cost. Though the TCM ismore frequently used to model trip demand, it has been used on a number of occasions to modeltrip duration (Mart�ınez-Espi~neira et al. 2008; Mendes and Proenca 2011).
Count models are frequently used to estimate recreational demand models (Mart�ınez-Espi~neiraand Amoako-Tuffour 2008; Ovaskainen, Neuvonen, and Pouta 2012; Hynes and Greene 2013) andare usually based on either a Poisson or negative binomial distribution of recreation demand andfollow a theoretical underpinning provided by Hellerstein and Mendelsohn (1993). Surveys of out-door recreationalists are often conducted on-site, which means only visitors to the site with a posi-tive number of visits are interviewed for the survey. Modelling must account for sample truncationat zero. Additionally, the sample is subject to endogenous stratification, which occurs when the sur-vey sample’s proportions of site users in terms of frequency of visits does not match population pro-portions. This arises because frequent visitors to the recreational site have a higher likelihood ofbeing interviewed than infrequent visitors. Carson (1991) was among the first to address the issue oftruncation in count models, while Shaw (1988) addresses the issue of endogenous stratification. Eng-lin and Shonkwiler (1995) developed truncated and endogenously stratified recreational demandmodels based on the Poisson and negative binomial distributions. The Poisson version of the modelassumes that the conditional mean and variance of trip demand are equal, which in some instancesis likely to be a misspecification. For recreational trip data, the variance is often greater than themean, implying overdispersion in the data. Where overdispersion arises, the negative binomialmodel is preferred.4Following Englin and Shonkwiler (1995), the probability density function forthe truncated and endogenously stratified negative binomial model is given by
hi yijyi > 0; xið Þ ¼ yiG yi þ a�1i
� �ayii λ
yi�1i 1þ aiλi½ �� yiþa�1ð Þ
G a�1ið ÞG yi þ 1ð Þ ; (2)
where G( ¢ ) is the gamma function, and ai is the over-dispersion parameter. In estimation, we spec-ify ai as a constant for all values, though less restrictive specifications such as ai = a0/λi (Englin andShonkwiler 1995), or ai = g(zi) where zi refers to visitor characteristics (Mart�ınez-Espi~neira andAmoako-Tuffour 2008) are also feasible. Where the data is found not be to subject to overdispersiona truncated and endogenously stratified Poisson model is estimated, the probability density functionof which is given by
hi yijyi > 0; xið Þ ¼ e�λiλyi
i
yi! 1� exp �λið Þð Þ: (3)
Defining λi as a function of regressor variables, xi, converts the model into a regression frame-work. Thus, we can model demand as a semi-logarithmic function of price, and independent varia-bles including water quality, such that
lnλi ¼ b0 þ b1x1i þ b2x2i þ bwqxwq þ bwqDmDmxwq� �… (4)
JOURNAL OF ENVIRONMENTAL ECONOMICS AND POLICY 5

where xwq represents the water quality attribute and Dm is a dummy variable for a specific type ofrecreational activity, m (e.g. boating or angling). Our primary focus is investigating the estimatedrelationship between the water quality metric and recreational trip duration. Our hypothesis is thatrecreational users undertake trips of longer duration at sites with better water quality, which wouldbe confirmed by a negative coefficient on the expression bwq þ bwqDm
Dm for recreational activity min Equation (4). As water quality is generally quite good among the sites within our sample, themagnitude of the expression (and its associated marginal effect) should be treated with caution ifextrapolating to recreational sites outside the sample. However, for the given level of water qualitywithin our sample one might anticipate that different recreational users are more responsive towater quality. For instance, recreational users that come into closer contact with the water (e.g.swimmers, rowers) may be more responsive to better water quality, as perceived by the users, thanthose that have less contact (e.g. cyclists, boaters). We can test this hypothesis by testing the relativemagnitudes of bwq þ bwqDm
> bwq þ bwqDnfor recreational activities m and n.
4. Data
Waterways Ireland is charged with the management, maintenance, development and restoration ofseven inland navigable waterways on the island of Ireland, principally for recreational purposes.During 2010 and again in 2014, Waterways Ireland commissioned surveys to obtain information onthe demographic profile of waterway users, to ascertain satisfaction levels with available facilitiesand to measure awareness of Waterways Ireland as the management authority on the navigations.The surveys were undertaken at 24 sites around the Republic of Ireland and Northern Ireland. Thesampling points were spread across both urban and rural areas with interviews occurring on differ-ent days and at different times across the period August–November. Interviewing was weightedtowards busier sites and responses were recorded in a face-to-face interview, which took 10 minuteson average to complete. A total of 1632 and 1247 interviews were collected in each year respectively.The sampling methodology employed was ‘very next person’ interviewing and was weighted towardsbusier areas to reflect actual usage of the waterways. The dataset is a pooled cross section rather thana panel and is not purported to be a representative sample of Irish recreational waterway users.
Users’ recreational activities were classified into four categories; anglers; boaters; those engagedother water sports (e.g. canoeing, water skiing, rowing, etc.); and those engaged in activities forwhich access to water is not essential, specifically walking and cycling. Observations were excludedin the event that no travel cost data was reported and where trip length exceeded 21 days. For thelatter case this was because extended trips are more likely to be associated with multi-purpose visits,not just recreational activity. In total, responses from 1436 survey respondents were used in modelestimation. Various information was collected from survey participants including travel expendi-tures, the length of the current trip, and socio-demographic data.
Survey data used in the analysis are summarised in Table 1. TripDays is the dependent variable inthe study and is defined as the number of leisure activity days spent on the current intercepted trip.DailyCost is denominated in Euro (€) and reflects the expenditure of a single individual for eachday of a trip. It comprises expenditure on items such as fuel, food, beverages and accommodation.From Table 1, we can see that those dedicating their leisure time to water-based activities spendslightly more per day than land-based visitors. It is worth noting however that this group also spendmore days per trip, so spend substantially more on a per trip basis. The variable Experience indicateswhether an individual rates themselves as somewhat or very experienced in pursuit of their leisureactivity. One might expect more experienced practitioners to dedicate more time to their pursuit.The Prof/Managerial variable encompasses individuals who work in a professional or managerialcapacity in contrast to lower skilled employment. This variable may also be a proxy for higherincome and such individuals may have higher levels of demand for recreational activities than thosewho are either in non-professional employment or are not employed. Individuals from abroad thatare holidaying in Ireland during the trip are identified by the variable VisitIreland and may have
6 B. BREEN ET AL.

differing demand for water-based leisure activities than Irish-based users. An individuals’ age andgender can influence their demand for recreation activities and the variables Aged35 + and Male areused to control for these characteristics. We also included a dummy variable in our initial analysisindicating which year the survey was administered but found no statistical effect and dropped itfrom the subsequent models presented here.
Water quality data for 2010 and 2014 were sourced from monitoring stations within the Republicof Ireland that were proximate to 15 waterway sites where surveys were conducted in the Republic ofIreland.5 Water quality data were obtained from the Environmental Protection Agency (http://gis.epa.ie/) for river and lake sites and data for canal sites was provided by Waterways Ireland (www.waterwaysireland.org). A summary of water quality metrics is provided in Table 2. Generally, waterquality at the sites in our dataset is at a relatively high level, though two sites, Kilcock Harbour andGrand Canal Basin, have elevated levels of phosphorus and faecal contamination. Sites with a ‘poor’WFD status are attributable to low biological classifications and not due to physico-chemical status.Therefore, the analysis here is not comparing recreational activity at polluted versus pristine sites,rather is it is comparing recreational activity across sites that are generally of a relatively high stan-dard. Consequently, the results of the analysis are likely to be more muted than if the dataset alsocontained sites with relatively low water quality standards.
The relationship between water quality and recreational demand is likely to be non-linear,though for simplicity we have assumed it to be linear within the narrow range of water quality valueswithin our dataset. However, our model does not purport to be a model of causation, where recrea-tional users are making decisions based on information about water quality. In reality recreationalusers will have limited information about water quality because only official bathing sites have a stat-utory requirement to post monitoring results, none of which are in our dataset. Instead, users’ deci-sions on recreation demand are based on a range of criteria including their own assessment of waterconditions. The models are intended to identify whether users’ behaviours are responsive to waterquality, as indicated by the various quality metrics. In the estimated models we include interactionterms between the water quality metrics and the activity dummy variables to allow variation indemand by activity and water quality.
Table 1. Summary statistics.
Variable Mean Std. Dev. Description
TripDays 3.14 3.19 Days on current tripDailyCostDomestic 15.70 46.70 Per day cost, €, if user from island of IrelandDailyCostForeign 21.51 111.47 Per day cost, €, if user from outside island of IrelandLand 0.42 0.49 =1 if engaged in walking or cycling, 0 otherwiseBoat 0.34 0.47 =1 if engaged in boating activity, 0 otherwiseAngler 0.14 0.35 =1 if engaged in angling, 0 otherwiseSport 0.10 0.30 =1 if engaged in water-based sports activity, 0 otherwiseExperience 0.88 0.32 =1 if very or somewhat experienced, 0 if unskilled or noviceProf/Managerial 0.59 0.49 =1 if professionally employed or managerial, 0 otherwiseVisitIreland 0.27 0.44 =1 if visiting from outside the island of Ireland, 0 otherwiseAge35 + 0.61 0.49 =1 if aged 35 or above, 0 otherwiseMale 0.62 0.49 =1 if male, 0 if femaleToilets 0.86 0.35 =1 if toilet facilities available at location, 0 otherwiseSlipway 0.84 0.36 =1 if slipway facilities available at location, 0 otherwiseN = 1436
Table 2. Water quality measures.
No. sites Mean Std. Dev. Min Max
WFD status = ‘poor’ 9 0.556 0.527 0.000 1.000BOD mg O2/l 11 1.834 1.096 0.658 4.408Ammonia mg N/l 12 0.044 0.029 0.016 0.100Phosphates mg P/l 6 0.038 0.020 0.017 0.076Faecal coliform Count/100 ml 6 1651.958 3510.246 20.000 8800.500
Data points are site-specific annual means.
JOURNAL OF ENVIRONMENTAL ECONOMICS AND POLICY 7

5. Results
Travel cost recreation demand models were initially estimated with the negative binomial specifica-tion controlling both for truncation and endogenous stratification (i.e. Equation (2)). The estimatesdo not show evidence of overdispersion and consequently the models were estimated with a Poissonspecification, which are reported in Table 3. As the water quality metrics are related and recreationalusers may be more responsive to one type of pollution we estimate with only one water quality mea-sure at a time. The dependent variable in all models estimated is TripDays, which is the number ofdays the recreational user spent on the trip. The key variable of interest for this study are the param-eters associated with the water quality measure, WaterQ. In each model presented, the definition ofWaterQ changes. The water quality metric, which is represented by WaterQ, is indicated in the titleof each column of coefficients. For column 1 of Table 3, the variable WaterQ is the WFD ecologicalstatus measure. In column 2,WaterQ represents BOD.
5.1. Water quality
The reference user category in the estimated models are those that engaged in cycling or walking.For these land-based users, the change in trip duration associated with different levels of water
Table 3. Recreational activity days demanded.
WFD status BOD Ammonia Phosphorus Faecal coliform
DailyCostDomestic ¡0.00618*** ¡0.00201*** ¡0.00159** ¡0.0151*** ¡0.0114***(0.00160) (0.000709) (0.000669) (0.00253) (0.00222)
DailyCostForeign ¡0.0132*** ¡0.00355*** ¡0.00304*** ¡0.00878*** ¡0.00222(0.00204) (0.000470) (0.000436) (0.00251) (0.00205)
WaterQ 11.76 ¡1.150*** 0.895*** ¡18.61** ¡0.0105(548.3) (0.183) (0.289) (8.332) (0.00820)
WaterQ £ Angler 0.638 1.161*** ¡1.599** ¡19.12* ¡0.0160(0.752) (0.198) (0.642) (11.09) (0.0111)
WaterQ £ Boat ¡0.265 1.067*** ¡1.411*** ¡12.94 0.0108(0.611) (0.188) (0.323) (8.486) (0.00807)
WaterQ £ Sport 0.942 ¡0.0140 1.056 ¡9.231 ¡0.00425(0.936) (0.335) (0.757) (15.82) (0.0157)
Boat 2.721*** 0.0990 1.710*** 2.099*** 1.137***(0.587) (0.224) (0.0899) (0.397) (0.343)
Angler 1.627** ¡0.333 1.449*** 1.967*** 1.810***(0.732) (0.249) (0.102) (0.481) (0.427)
Sport 0.891 0.769* 0.783*** 0.686 0.465(0.914) (0.397) (0.134) (0.776) (0.724)
Experience 0.222** 0.256*** 0.267*** 0.0464 ¡0.101(0.0873) (0.0866) (0.0780) (0.119) (0.117)
Prof/Managerial 0.0701 0.125*** 0.160*** 0.00768 0.0649(0.0658) (0.0468) (0.0451) (0.0806) (0.0802)
VisitIreland 0.978*** 0.689*** 0.649*** 0.627*** 0.413***(0.0949) (0.0525) (0.0511) (0.116) (0.110)
Age35 + 0.585*** 0.322*** 0.344*** 0.152 0.213**(0.0862) (0.0516) (0.0502) (0.0931) (0.0919)
Male 0.415*** 0.295*** 0.281*** 0.311*** 0.351***(0.0683) (0.0485) (0.0462) (0.0836) (0.0834)
Toilets 0.338 0.802*** 0.904*** 0.942** 2.206(0.351) (0.144) (0.143) (0.377) (2.371)
Slipway ¡11.58 ¡0.0321 0.0263 0.465*** ¡0.239***(548.3) (0.0684) (0.0702) (0.130) (0.0919)
Constant ¡2.753*** ¡0.359 ¡2.205*** ¡1.229** ¡2.237(0.647) (0.293) (0.179) (0.565) (2.532)
N 513 992 1086 346 346Log-Likelihood ¡1001.24 ¡2177.05 ¡2368.36 ¡673.961 ¡682.638AIC 2036.479 4388.108 4770.725 1381.921 1399.276BIC 2108.563 4471.403 4855.559 1447.311 1464.666
Standard error in parentheses. *p < 0.10, **p < 0.05, ***p < 0.01.
8 B. BREEN ET AL.

quality are given by the coefficient on the WaterQ variable. In the case of BOD and phosphorus, theparameter estimates are negative and significantly different from zero, as reported in Table 3. Ourhypothesis is that either ‘poor’WFD status or higher levels of BOD, ammonia, phosphorus or faecalcoliform were anticipated to have a negative association with recreational demand. We formally testthe hypothesis using a one-tailed z-test and report the results in Table 4. We fail to reject the nullhypothesis in the case of the WFD status quality metric, from which we can conclude that there isno category of recreational user where recreational trips are shorter in duration at water bodies thatare designated with a ‘poor’ WFD ecological status. For all the other water quality metrics examinedwe reject the null hypothesis in several, though not all instances. In the case of faecal coliform tripduration of anglers, walkers and cyclists decline as faecal coliform contamination increases. We can-not draw the same conclusion for boaters or those involved in other water sports (i.e. Sport cate-gory). One would not have anticipated this result in the case of the Sport category, as these are therecreational users that have the potential to come into closest contact with water, sometimes beingsubmerged in the water. This result is consistent with research by Hynes, Hanley, and Scarpa (2008)and Boeri et al. (2012) who suggest that water quality and the implied health risk may not be animportant aspect of a dedicated water sports enthusiast’s choice of site, unless the level of water pol-lution is extreme. In the case of the phosphorus water metric, we reject the null hypothesis for allfour recreational user categories, so higher levels of phosphorus are associated with shorter tripdurations. There is a similar result in the case of BOD levels, except for anglers. Only in the case ofboaters are higher ammonia levels associated with shorter trip durations. While the tests are notunanimous, neither across user types nor water quality metrics, there is strong evidence longer tripdurations are associated with higher levels of water quality. But it also appears to be the case is thatthere is no association between trip duration and WFD status. WFD status is assigned as the mini-mum status of biological and chemical components. In the recreational sites within our sample thatare designated ‘poor’ WFD status, the designation is due to ‘poor’ biological rather than chemicalstatus. While biological status may be of interest to anglers, it will have little relevance to other recre-ational users hence it is not surprising that we fail to reject the null hypothesis in the case of theWFD status metric.
The second issue of interest with respect to water quality is whether different categories of recrea-tional users are more responsive to changes in water quality. We examine this issue through one-tailed z-tests with a null hypothesis that one recreational user category’s trip duration is greater thanor equal to trip duration of another recreational user category versus the alternative that it is less.Our prior is that Sports users are more responsive that Anglers, who in turn are more responsivethan Boat users, with Land-based users (i.e. walkers and cyclists) being the least responsive. Wereport a series of these tests in Table 5, where the overwhelming evidence is that we are unable toreject the null in favour of our speculated hypotheses. In just two tests related to faecal coliform dowe find that angler trip duration is less than boater trip duration as faecal coliform contaminationincreases, and similarly for boaters compared to walkers and cyclists. Across the two sets of tests inTables 4 and 5, we can conclude that there is sufficient evidence to say that recreational users areresponsive in terms of the length of their recreational trips to changes in water quality, as recordedby a number of water quality metrics. However, while there are differences across recreational user
Table 4. One-tailed z-tests: null hypothesis that water quality metric is associated with zero or positive differences in recreationaltrip duration versus an alternative hypothesis that deterioration in water quality is associated with shorter recreational tripduration.
User category Null hypothesis WFD status BOD Ammonia Phosphorus Faecal coliform
Land H0: bwq � 0 0.02 6.29*** 3.10 2.23** 1.29*Angler H0: bwq þ bwqDAngler
� 0 0.02 0.14 1.23 4.53*** 3.20***Boat H0: bwq þ bwqDBoat
� 0 0.02 1.57* 3.11*** 7.20*** 0.95Sport H0: bwq þ bwqDSport
� 0 0.02 4.10*** 2.77 2.00** 1.08
*p < 0.10, **p < 0.05, ***p < 0.01.
JOURNAL OF ENVIRONMENTAL ECONOMICS AND POLICY 9
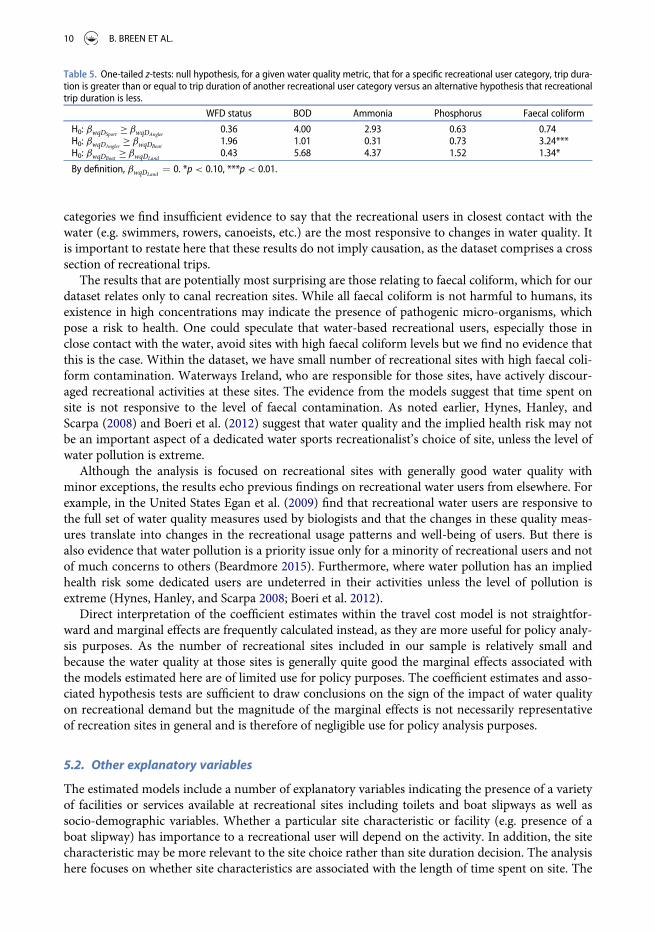
categories we find insufficient evidence to say that the recreational users in closest contact with thewater (e.g. swimmers, rowers, canoeists, etc.) are the most responsive to changes in water quality. Itis important to restate here that these results do not imply causation, as the dataset comprises a crosssection of recreational trips.
The results that are potentially most surprising are those relating to faecal coliform, which for ourdataset relates only to canal recreation sites. While all faecal coliform is not harmful to humans, itsexistence in high concentrations may indicate the presence of pathogenic micro-organisms, whichpose a risk to health. One could speculate that water-based recreational users, especially those inclose contact with the water, avoid sites with high faecal coliform levels but we find no evidence thatthis is the case. Within the dataset, we have small number of recreational sites with high faecal coli-form contamination. Waterways Ireland, who are responsible for those sites, have actively discour-aged recreational activities at these sites. The evidence from the models suggest that time spent onsite is not responsive to the level of faecal contamination. As noted earlier, Hynes, Hanley, andScarpa (2008) and Boeri et al. (2012) suggest that water quality and the implied health risk may notbe an important aspect of a dedicated water sports recreationalist’s choice of site, unless the level ofwater pollution is extreme.
Although the analysis is focused on recreational sites with generally good water quality withminor exceptions, the results echo previous findings on recreational water users from elsewhere. Forexample, in the United States Egan et al. (2009) find that recreational water users are responsive tothe full set of water quality measures used by biologists and that the changes in these quality meas-ures translate into changes in the recreational usage patterns and well-being of users. But there isalso evidence that water pollution is a priority issue only for a minority of recreational users and notof much concerns to others (Beardmore 2015). Furthermore, where water pollution has an impliedhealth risk some dedicated users are undeterred in their activities unless the level of pollution isextreme (Hynes, Hanley, and Scarpa 2008; Boeri et al. 2012).
Direct interpretation of the coefficient estimates within the travel cost model is not straightfor-ward and marginal effects are frequently calculated instead, as they are more useful for policy analy-sis purposes. As the number of recreational sites included in our sample is relatively small andbecause the water quality at those sites is generally quite good the marginal effects associated withthe models estimated here are of limited use for policy purposes. The coefficient estimates and asso-ciated hypothesis tests are sufficient to draw conclusions on the sign of the impact of water qualityon recreational demand but the magnitude of the marginal effects is not necessarily representativeof recreation sites in general and is therefore of negligible use for policy analysis purposes.
5.2. Other explanatory variables
The estimated models include a number of explanatory variables indicating the presence of a varietyof facilities or services available at recreational sites including toilets and boat slipways as well associo-demographic variables. Whether a particular site characteristic or facility (e.g. presence of aboat slipway) has importance to a recreational user will depend on the activity. In addition, the sitecharacteristic may be more relevant to the site choice rather than site duration decision. The analysishere focuses on whether site characteristics are associated with the length of time spent on site. The
Table 5. One-tailed z-tests: null hypothesis, for a given water quality metric, that for a specific recreational user category, trip dura-tion is greater than or equal to trip duration of another recreational user category versus an alternative hypothesis that recreationaltrip duration is less.
WFD status BOD Ammonia Phosphorus Faecal coliform
H0: bwqDSport�bwqDAngler
0.36 4.00 2.93 0.63 0.74H0: bwqDAngler
�bwqDBoat1.96 1.01 0.31 0.73 3.24***
H0: bwqDBoat�bwqDLand
0.43 5.68 4.37 1.52 1.34*
By definition, bwqDLand¼ 0. *p < 0.10, ***p < 0.01.
10 B. BREEN ET AL.

estimated coefficients on these variables vary across the models estimated but there are a number ofclear results. The first is that the length of time spent on site is higher at sites with toilet facilities.One potentially counter-intuitive result are the estimated coefficients on the Slipway variable. Notall water-based users, including many boat users, require the use of slipway facilities but it is surpris-ing to find negative coefficients on this variable. In most instances where a slipway is required (e.g.to launch a boat) it should not materially affect the duration of a trip and hence finding statisticalinsignificance for this variable might be more reasonable.
The travel cost model allows us to examine the sensitivity of water site users to the cost of engag-ing in their recreational activity. The estimated coefficient on the travel cost variable, DailyCost, isnegative and statistically significant in almost all models estimated. Consumer surplus, which is thevalue of the trip in excess of trip cost is a welfare measure indicating the benefit associated with rec-reational trips. From Hellerstein and Mendelsohn (1993), mean consumer surplus per day is givenby ¡1/bp, where bp is the estimated coefficient on the DailyCost variable. Across the five models theminimum estimated consumer surplus per day for Irish users is €66 (s.e. €11) and for internationalvisitors it is €76 (s.e. €12), though there is a wide variation across models. We note the consumersurplus to illustrate the potential scale of the recreational benefit to users, though given the widevariety of recreational activities considered within the user survey further research is required toquantify welfare benefits in more precision. However, these consumer surplus estimates are compa-rable with the existing literature on the value of benefits from water-based recreational activity. Forexample, estimates of per trip consumer surplus or willingness to pay for boating trips in the UnitedStates exceed several hundred dollars (Bockstael, Hanemann, and Kling 1987; Park, Bowker, andLeeworthy 2002; Bhat 2003), though estimates can be substantially lower. For example, Vesterinenet al. (2010) estimate WTP/trip of approximately €23 for swimming, fishing or boating trips in Fin-land. Previous studies of Irish recreational water users include WTP estimates for swimming ofapproximately €102/trip and €35/trip for boating (Curtis 2003); €22/trip for beach visits (Barry,van Rensburg, and Hynes 2011); €152/trip for white-water kayaking (Hynes and Hanley 2006), and€371/day for angling (Curtis and Stanley 2016).
Other socio-economic explanatory variables in the models enable us to distinguish differences indemand preferences among various types of recreational users. For example, the estimated coeffi-cient on Male is positive and statistically significant in all of the models, indicating that men takerecreational trips of longer duration than women. The coefficient on VisitIreland is positive and sig-nificant, indicating that international tourists take trips to waterway sites of longer duration thatpeople living in Ireland. The user survey captures two types of waterway visit; those as part of a lon-ger annual holiday and shorter weekend-type trips. People resident in Ireland are more likely toengage in both types of trip, whereas international tourist visitors are less likely to incur such travelexpense for short trips. The Professional variable may be capturing an income effect, but the effect isnot significant across all models. The Experience variable is a respondent assessment of their skill orability level in their recreational activity. We had an ex ante intuition that highly skilled individualsspend more time pursuing their activity which would be reflected in trip length (or equally in tripfrequency for which we have no data). We find evidence that that is the case but only in three of thefive models.
6. Conclusion
This paper sought to identify if recreational water users’ demand for recreational activities at keywaterway sites around Ireland is responsive to the level of water quality at those sites. This issue haswider policy significance within the context of the European Union’s ambition for all water bodiesto achieve ‘good’ status and the associated benefits to stakeholders. As outlined in Section 1, thepaper had a number of purposes. First, the analysis was intended to inform water managers aboutpotential public health risks (in the event that users appear to ignore changes in the presence of dan-gerous pollutants in public waterways) and possibly pre-emptively avoid them. Second, identify
JOURNAL OF ENVIRONMENTAL ECONOMICS AND POLICY 11

which water quality measures are incorporated into the utility function of recreational users, thuspartially driving recreation demand. This information can equip waterway managers with a betterunderstanding of the water body characteristics which, if successfully controlled, will benefit water-way-user welfare and improve demand for public waterway use.
The most important finding from the analysis in the context of WFD and associated water qualitymonitoring is the finding that there appears to be no association between trip duration and WFDstatus. The result is based on a narrow empirical study and therefore further research elsewhere isnecessary to confirm the finding. However, it does indicate that WFD status as a measure of waterquality is not particularly useful for recreational users. The result is not unsurprising, as WFD bio-logical status, which is unlikely to be of relevance to most recreational users, is an important deter-minant of overall WFD status. Another reason why WFD status is of limited practical use torecreational users is that WFD status does not include any measure for faecal coliform, which is ametric that should be of particular interest to recreational users concerned about health risk. Wefind that some, though not all, recreational users are responsive in terms of trip duration to the levelof faecal coliform contamination.
While there is no evidence from the estimated models of an association between trip durationand overall WFD status, we find sufficient evidence to say that recreational users are responsive tothe chemical status of water bodies. Across all four categories of recreational user, longer trip dura-tion is associated with recreational sites with better water quality. This provides clear evidence thatrecreational users benefit from efforts to improve the water quality in line with WFD ambitions.The consumer surplus estimates are indicative of the high value users place on water-based recrea-tional sites, which are at risk if water quality hinders recreational activity. Contrary to our ex anteexpectation, we were unable to find evidence that recreational users in the closest contact with thewater (e.g. swimmers, rowers, canoeists, etc.) are the most responsive to changes in water quality,though we conjecture that result may be specific to this dataset.
From the perspective of waterway managers, a number of other policy implications arise. Thefirst is that there is clear evidence that recreational users spend more time at sites with toilet facili-ties, which provides support or justification for investment in such facilities at recreational sites.Waterways Ireland have actively discouraged activities at sites experiencing high levels of faecal coli-form, which may have caused users to visit alternative sites. However, for users that actually visitedsuch sites, the models find no evidence that the duration of recreational activity is curtailed at siteswith high faecal coliform measurements. Depending on the nature of such recreational activity, thisis likely to be a concern to waterway managers. It is not obvious whether users lack or disregardinformation on faecal coliform measurements and its risk to health. More generally, faecal coliformmeasurements are taken at relatively few recreation sites (i.e. just at canal sites) and considerationshould be given to extending such measurements to all popular recreation sites.
The paper focuses on demand for recreation time at water sites conditional on the site choicedecision. Factors such as water quality or site facilities may have an equally important influence onsite choice decisions and consequently the current analysis only partially examines the importanceof water quality and other site characteristics in recreation demand. Future research should examinerecreational site choice decisions as a function of the site attributes at waterway sites in Ireland.
Notes
1. For example, see http://www.fao.org/docrep/w2598e/w2598e06.htm.2. SI 272/2009 - European Communities Environmental Objectives (Surface Waters) Regulations 2009. http://
www.irishstatutebook.ie/2009/en/si/0272.html.3. Phosphates arise in waterways in organic or inorganic form. Sources of the former include sewage and the break-
down of organic pesticides. Inorganic phosphates are made up of orthophosphates and polyphosphates. Ortho-phosphates are commonly referred to as reactive phosphorous, and it is this form of phosphorous directly takenup by plant cells to grow. Polyphosphates, commonly used in detergents, are unstable and eventually convert toorthophosphates.
12 B. BREEN ET AL.

4. Hilbe (2014) discusses the derivation of the negative binomial as a Poisson-gamma mixture model in which thedispersion parameter is gamma shaped. The gamma PDF is pliable, allowing for a wide variety of shapes mean-ing most count data can be appropriately modelled.
5. One exception is WFD status, which was only available for 2010. At the time of the analysis, a WFD status hadnot been assigned for 2014.
Acknowledgments
We thank Katrina McGirr, Waterways Ireland, for facilitating access to the survey data, and Paula Treacy and KieranMcQuinn for helpful comments and suggestions.
Disclosure statement
No potential conflict of interest was reported by the authors.
Funding
This research has been financially supported by the Environmental Protection Agency (EPA), Ireland [project number2015-SE-DS-6].
ORCID
John Curtis http://orcid.org/0000-0002-6957-5684
References
Aminu, M., A.-N. Matori, K.W. Yusof, A. Malakahmad, and R.B. Zainol. 2014. “A GIS-Based Water Quality Model forSustainable Tourism Planning of Bertam River in Cameron Highlands, Malaysia.” Environmental Earth Sciences 73(10): 6525–6537.
Arnold, B.F., K.C. Schiff, J.F. Griffith, J.S. Gruber, V. Yau, C.C. Wright, T.J. Wade, et al. 2013. “Swimmer Illness Asso-ciated with Marine Water Exposure and Water Quality Indicators: Impact of Widely Used Assumptions.” Epide-miology 24 (6): 845–853.
Barry, L., T.M. van Rensburg, and S. Hynes. 2011. “Improving the Recreational Value of Ireland’s Coastal Resources: AContingent Behavioural Application.”Marine Policy 35 (6): 764–771.
Beardmore, B. 2015. “Boater Perceptions of Environmental Issues Affecting Lakes in Northern Wisconsin.” Journal ofthe American Water Resources Association 51 (2): 537–549.
Bhat, M. G. 2003. “Application of Non-Market Valuation to the Florida Keys Marine Reserve Management.” Journalof Environmental Management 67 (4): 315–325.
Binkley, C.S., and W.M. Hanemann. 1978. The Recreation Benefits of Water Quality Improvement: Analysis of DayTrips in an Urban Setting. Vol. 1. Washington, DC: Environmental Protection Agency.
Bockstael, N.E., W.M. Hanemann, and C.L. Kling. 1987. “Estimating the Value of Water Quality Improvements in aRecreational Demand Framework.”Water Resources Research 23 (5): 951–960.
Boeri, M., A. Longo, E. Doherty, and S. Hynes. 2012. “Site Choices in Recreational Demand: A Matter of Utility Maxi-mization or Regret Minimization?” Journal of Environmental Economics and Policy 1 (1): 32–47.
Burger, J., K. Staine, and M. Gochfeld. 1993. “Fishing in Contaminated Waters: Knowledge and Risk Perception ofHazards by Fishermen in New York City.” Journal of Toxicology and Environmental Health, Part A Current Issues39 (1): 95–105.
Carson, R. 1991. “Models for Truncated Counts.” Journal of Applied Econometrics 6 (3): 225–238.Curtis, J.A. 2003. “Demand for Water-Based Leisure Activity.” Journal of Environmental Planning and Management
46 (1): 65–77.Curtis, J., and B. Stanley. 2016. “Water Quality and Recreational Angling Demand in Ireland.” Journal of Outdoor
Recreation and Tourism 14: 27–34.Directive 75/440/EEC 1975. “Council Directive 75/440/eec of 16 June 1975 Concerning the Quality Required of Sur-
face Water Intended for the Abstraction of Drinking Water in the Member States.” Official Journal of the EuropeanCommunities L194/26.
JOURNAL OF ENVIRONMENTAL ECONOMICS AND POLICY 13

Directive 2000/60/EC 2000. “Directive 2000/60/EC of the European Parliament and of the Council of 23 October 2000Establishing a Framework for Community Action in the Field of Water Policy.” Official Journal of the EuropeanCommunities L327/1.
Dodds, W.K., W.W. Bouska, J.L. Eitzmann, T.J. Pilger, K.L. Pitts, A.J. Riley, J.T. Schloesser, and D.J. Thornbrugh.2008. “Eutrophication of US Freshwaters: Analysis of Potential Economic Damages.” Environmental Science &Technology 43 (1): 12–19.
Dorevitch, S., S. DeFlorio-Barker, R.M. Jones, and L. Liu. 2015. “Water Quality as a Predictor of Gastrointestinal Ill-ness Following Incidental Contact Water Recreation.”Water Research 83: 94–103.
Dorevitch, S., S. Panthi, Y. Huang, H. Li, A.M. Michalek, P. Pratap, M. Wroblewski, L. Liu, P.A. Scheff, and A. Li.2011. “Water Ingestion During Water Recreation.”Water Research 45 (5): 2020–2028.
Eddy, F. 2005. “Ammonia in Estuaries and Effects on Fish.” Journal of Fish Biology 67 (6): 1495–1513.Egan, K.J., J.A. Herriges, C.L. Kling, and J.A. Downing. 2009. “Valuing Water Quality as a Function of Water Quality
Measures.” American Journal of Agricultural Economics 91 (1): 106–123.Englin, J., and J.S. Shonkwiler. 1995. “Estimating Social Welfare Using Count Data Models: An Application to Long-
Run Recreation Demand Under Conditions of Endogenous Stratification and Truncation.” The Review of Econom-ics and Statistics 77 (1): 104–112.
Environment Agency 2009. Enjoying Water: Strategic Priorities for Water Related Recreation in the East of England2009–2014. Environment Agency. http://www.gov.uk/government/publications/enjoying-water
Food and Agriculture Organisation 1996. “Fertilizers as Water Pollutants.” http://www.fao.org/docrep/w2598e/w2598e06.htm
G€url€uk, S., and E. Rehber. 2008. “A Travel Cost Study to Estimate Recreational Value for a Bird Refuge at LakeManyas, Turkey.” Journal of Environmental Management 88 (4): 1350–1360.
Hanley, N., D. Bell, and B. Alvarez-Farizo. 2003. “Valuing the Benefits of Coastal Water Quality Improvements UsingContingent and Real Behaviour.” Environmental and Resource Economics 24 (3): 273–285.
Hellerstein, D., and R. Mendelsohn. 1993. “A Theoretical Foundation for Count Data Models.” American Journal ofAgricultural Economics 75 (3): 604–611.
Hilbe, J.M. 2014.Modeling Count Data. New York, NY: Cambridge University Press.Hynes, S., and W. Greene. 2013. “A Panel Travel Cost Model Accounting for Endogenous Stratification and Trunca-
tion: A Latent Class Approach.” Land Economics 89 (1): 177–192.Hynes, S., and N. Hanley. 2006. “Preservation Versus Development on Irish Rivers: Whitewater Kayaking and Hydro-
Power in Ireland.” Land Use Policy 23 (2): 170–180.Hynes, S., N. Hanley, and R. Scarpa. 2008. “Effects on Welfare Measures of Alternative Means of Accounting for Pref-
erence Heterogeneity in Recreational Demand Models.” American Journal of Agricultural Economics 90 (4): 1011–1027.
Korpela, K., K. Borodulin, M. Neuvonen, O. Paronen, and L. Tyrv€ainen. 2014. “Analyzing the Mediators BetweenNature-Based Outdoor Recreation and Emotional Well-Being.” Journal of Environmental Psychology 37: 1–7.
Lee, L.-H., and Y.-D. Lee. 2015. “The Impact of Water Quality on the Visual and Olfactory Satisfaction of Tourists.”Ocean & Coastal Management 105: 92–99.
Lipton, D. 2004. “The Value of Improved Water Quality to Chesapeake Bay Boaters.” Marine Resource Economics 19(2): 265–270.
Mart�ınez-Espi~neira, R., and J. Amoako-Tuffour. 2008. “Recreation Demand Analysis under Truncation, Overdisper-sion, and Endogenous Stratification: An Application to Gros Morne National Park.” Journal of EnvironmentalManagement 88 (4): 1320–1332.
Mart�ınez-Espi~neira, R., J.B. Loomis, J. Amoako-Tuffour, and J.M. Hilbe. 2008. “Comparing Recreation Benefits fromOn-Site Versus Household Surveys in Count Data Travel Cost Demand Models with Overdispersion.” TourismEconomics 14 (3): 567–576.
Mendes, I., and I. Proenca. 2011. “Measuring the Social Recreation Per-Day Net Benefit of the Wildlife Amenities of aNational Park: A Count-Data Travel-Cost Approach.” Environmental Management 48 (5): 920.
Needelman, M.S., and M.J. Kealy. 1995. “Recreational Swimming Benefits of New Hampshire Lake Water Quality Pol-icies: An Application of a Repeated Discrete Choice Model.” Agricultural and Resource Economics Review 24 (1):78–87.
Nutsford, D., A.L. Pearson, S. Kingham, and F. Reitsma. 2016. “Residential Exposure to Visible Blue Space (But NotGreen Space) Associated with Lower Psychological Distress in a Capital City.” Health & Place 39: 70–78.
Outdoor Foundation. 2013. Outdoor Participation Report 2013. Outdoor Foundation. http://www.outdoorfoundation.org/pdf/ResearchParticipation2013.pdf
Ovaskainen, V., M. Neuvonen, and E. Pouta. 2012. “Modelling Recreation Demand with Respondent-Reported Driv-ing Cost and Stated Cost of Travel Time: A Finnish Case.” Journal of Forest Economics 18 (4): 303–317.
Park, T., J.M. Bowker, and V.R. Leeworthy. 2002. “Valuing Snorkeling Visits to the Florida Keys with Stated andRevealed Preference Models.” Journal of Environmental Management 65 (3): 301–312.
14 B. BREEN ET AL.

Paudel, K.P., R.H. Caffey, and N. Devkota. 2011. “An Evaluation of Factors Affecting the Choice of Coastal Recrea-tional Activities.” Journal of Agricultural and Applied Economics 43 (2): 167–179.
Reinhard, E., and T. Pouli. 2011. “Colour Spaces for Colour Transfer.” In Computational Color Imaging. CCIW 2011.Lecture Notes in Computer Science, vol. 6626, 1–15. Berlin: Springer.
Shaw, D. 1988. “On-Site Sample Regression: Problems of Non-Negative Integers, Truncation, and Endogenous Strati-fication.” Journal of Econometrics 37 (2): 211–223.
Vesterinen, J., E. Pouta, A. Huhtala, and M. Neuvonen. 2010. “Impacts of Changes in Water Quality on RecreationBehavior and Benefits in Finland.” Journal of Environmental Management 91 (4): 984–994.
V€olker, S., and T. Kistemann, 2011. “The Impact of Blue Space on Human Health and Well-Being–SalutogeneticHealth Effects of Inland Surface Waters: A Review.” International Journal of Hygiene and Environmental Health214 (6): 449–460.
V€olker, S., and T. Kistemann. 2013. ““I’m Always Entirely Happy When I’m Here!” Urban Blue Enhancing HumanHealth and Well-Being in Cologne and D€usseldorf, Germany.” Social Science & Medicine 78: 113–124.
Wade, T.J., E. Sams, K.P. Brenner, R. Haugland, E. Chern, M. Beach, L. Wymer, et al. 2010. “Rapidly Measured Indica-tors of Recreational Water Quality and Swimming-Associated Illness at Marine Beaches: A Prospective CohortStudy.” Environmental Health 9 (66): 1–14.
Westphal, L.M., M. Longoni, C.L. LeBlanc, and A. Wali. 2008. “Anglers’ Appraisals of the Risks of Eating Sport-Caught Fish from Industrial Areas: Lessons from Chicago’s Calumet Region.” Human Ecology Review 15 (1): 46.
White, M.P., S. Pahl, K.J. Ashbullby, F. Burton, and M.H. Depledge. 2015. “The Effects of Exercising in Different Nat-ural Environments on Psycho-Physiological Outcomes in Post-Menopausal Women: A Simulation Study.” Inter-national Journal of Environmental Research and Public Health 12 (9): 11929–11953.
Williams, J., and B. Ryan. 2004. A National Survey of Water-Based Leisure Activities in Ireland 2003. Marine Institute.https://www.esri.ie/pubs/BKMNEXT62.pdf
JOURNAL OF ENVIRONMENTAL ECONOMICS AND POLICY 15