Embed Size (px)
Citation preview

Water Quality Assessments ofSelected Lakes within
Washington State
1997
March 2000
Publication No. 00-03-009

This report is available on Ecology’s home page on the world wide web athttp://www.wa.gov/ecology/biblio/0003009.html
For additional copies of this publication, please contact:
Department of Ecology Publications Distributions OfficeAddress: PO Box 47600, Olympia WA 98504-7600E-mail: [email protected]: (360) 407-7472
Refer to Publication Number 00-03-009
The Department of Ecology is an equal opportunity agency and does not discriminate on thebasis of race, creed, color, disability, age, religion, national origin, sex, marital status, disabledveteran's status, Vietnam Era veteran's status, or sexual orientation.
If you have special accommodation needs or require this document in alternative format,please contact the Environmental Assessment Program, Michelle Ideker at (360)-407-6677(voice). Ecology's telecommunications device for the deaf (TDD) number at EcologyHeadquarters is (360) 407-6006.

Water Quality Assessments ofSelected Lakes within
Washington State
1997
prepared byA. Kirk SmithJenifer ParsonsDavid Hallock
Washington State Department of EcologyEnvironmental Assessment ProgramOlympia, Washington 98504-7710
March 2000
Publication No. 00-03-009


Page i
Table of Contents
List of Tables .................................................................................................................................... ii
List of Individual Lake Assessments................................................................................................ ii
Acknowledgments ............................................................................................................................ iii
Abstract ............................................................................................................................................. v
Introduction....................................................................................................................................... 1Program Objectives ................................................................................................................... 1History of LWQA Program....................................................................................................... 1
Methods............................................................................................................................................. 3Volunteer Recruitment and Lake Selection.............................................................................. 3Field Methods............................................................................................................................ 3Sample Analysis Methods......................................................................................................... 6Methods Used for Estimating Trophic Status........................................................................... 7
Quality Assurance/Quality Control Evaluation................................................................................ 8
Conclusions....................................................................................................................................... 9
References......................................................................................................................................... 10
Appendix A. Individual Lake AssessmentsAppendix B. Quality Assurance/Quality Control Results and Discussion for 1997Appendix C. Water Quality QA/QC Data from Lakes Monitored by Ecology Staff in 1997Appendix D. Hydrolab Postcalibration Data for 1997

Page ii
List of Tables
Table 1. Analytical methods used for samples collected for the LWQA Program ..................... 6
Table 2. Summary of data quality objectives for the LWQA Program ....................................... 8
List of Individual Lake Assessments
Lake Alice (King County)Bay (Pierce County)Big Meadow Lake (Pend Oreille County)Black Lake (Stevens County)Lake Bosworth (Snohomish County)Cascade Lake (San Juan County)Clear Lake (Spokane)Conconully Lake (Okanogan County)Crawfish Lake (Okanogan County)Curlew Lake (Ferry County)Deep Lake (Stevens County)Duck Lake (Grays Harbor County)Fish Lake (Chelan County)Gillette Lake (Stevens County)Gravelly Lake (Pierce County)Haven Lake (Mason County)Hicks Lake (Thurston County)Horseshoe Lake (Kitsap County)Hummel Lake (San Juan County)Isabella Lake (Mason County)Island Lake (Mason County)Lake Ki (Snohomish County)Lacamas Lake (Clark County)Lavender Lake (Kittitas County)Leland Lake (Jefferson County)Lake Lenore (Grant County)Lake Limerick (Mason County)Long Lake (Kitsap County)Long Lake (Thurston County)Loomis Lake (Pacific County)Loon Lake (Stevens County)Lake Martha (Snohomish County)Martha Lake (Snohomish County)Mason Lake (Mason County)Mill Creek Lake (Walla Walla County)Mountain Lake (San Juan County)
Lake Nahwatzel (Mason County)Newman Lake (Spokane County)Lake Osoyoos (Okanogan County)Lake Padden (Whatcom County)Palmer Lake (Okanogan County)North Pattison Lake (Thurston County)Phillips Lake (Mason County)Rock Lake (Whitman County)North Lake Roesiger (Snohomish County)South Lake Roesiger (Snohomish County)Roses Lake (Chelan County)Lake Samish (Whatcom County)Silver Lake (Spokane County)Lake Spanaway (Pierce County)Sportsman Lake (San Juan County)Lake St. Clair (Thurston County)Sullivan Lake (Pend Oreille County)Summit Lake (Thurston County)Sylvia Lake (Grays Harbor County)Lake Tapps (Pierce County)Terrell Lake (Whatcom County)Lake Thomas (Stevens County)Tiger Lake (Kitsap/Mason Counties)Toad (Emerald) Lake (Whatcom County)Trails End (Mason County)Wapato Lake (Chelan County)Ward Lake (Thurston County)Lake Wenatchee (Chelan County)Lake Whatcom (Whatcom County)Wildcat Lake (Kitsap County)Williams Lake (Spokane County)Wiser Lake (Whatcom County)Lake Wooten (Mason County)Wye Lake (Kitsap County)

Page iii
Acknowledgments
The following people volunteered their time to collect lake data during 1997. Their contributionsto Ecology’s Lake Water Quality Assessment (LWQA) Program are greatly appreciated.
Judy and Jan BaldwinAl BernhardJim BlakeCharles BlightJames CarletonKaren CarlsenDon CaseM.E. ChristophersonGary CraigA.B. DavisLarry DavisSue DavisNancy DeanRod FeykDave FowbleBob FreestadDoug GeigerSandra GoldJohn GuentzRay HawkHarold HolmRaema HickeySteven HillJ. David JenkinsAllen JohnsonAntony JohnsonJames KeeleyDennis KelloggGaylord KidneyRusty KidrickNorman S. LaVigneAndy Loch
Paula LoweEd MarchbankDick McFaddenGene McTeeLee MooreCathy NairnJerry NelsonDon OlsonDon PetersonMadilane PerryA. PetersRuby PrawitzDan PupoJim ScottNathan SessionsKathy SmithLyle SmithElsie SorgenfreiVictor SoulesKristin StewartEric StorySue ThompsonWalter UllrichLoraine VaaKit WeaverJeannette WebbBill WestonTerry WilliamsKathey WyckoffDolly and David YatesBill Young
Collecting field samples and training volunteers is a particularly intensive portion of the LWQAProgram. Thanks go to Dave Hallock for conducting both the May and August 1997 surveys ineastern Washington lakes. Without Dave’s assistance with the field work, fewer lakes andvolunteers would have been included in the LWQA Program. Additional field support wasprovided by Jenifer Parsons. Jenifer was also instrumental in providing technical assistance inidentifying aquatic macrophytes. Bryan Chris Farmer and Stewart Lombard were instrumental in

Page iv
reviewing and partially conducting the quality assurance for this project. Their efforts are greatlyappreciated. Sue Davis, Thurston County Environmental Health, provided nutrient and profiledata on many Thurston County lakes. Analytical contracts were overseen by Stuart Magoon atManchester Environmental Laboratory. Sample analysis was overseen by Dave Thomson atManchester Environmental Laboratory. Thanks go to David Hallock and Bill Ehinger forpersevering through their review of the manuscript, and for offering valuable comments.Additional comments were provided by Will Kendra and Glenn Merritt. Michelle Idekerprovided assistance with the word processing of this report.
The project was funded by a Federal Clean Water Act 319 grant of $42,000 and the remainderwith state monies. With the termination of the 314 program, Ecology will have to seekadditional funding for future activities as state funding is no longer available. Recontinuedfederal support of this program would be greatly appreciated by Ecology staff, as well as by thevolunteers who participate in the program.

Page v
Abstract
The objectives of the Washington State Department of Ecology (Ecology) Lake Water QualityAssessment Program are to identify lakes that are exhibiting water quality problems, to assesssignificant, publicly-owned lakes by estimating the trophic status of monitored lakes, and topromote public awareness of lake ecology and protection.
In 1997, Ecology staff collected data from 70 lakes. Water samples were collected in May andAugust 1997 from both the epilimnion and the hypolimnion of stratified lakes except thoseThurston County lakes where the Thurston County Environmental Health were monitoring waterquality. Samples were analyzed for total phosphorus, total nitrogen, and chlorophyll a. Becauseof budget shortfalls, chlorophyll samples were not collected in the spring. Samples for turbidityand fecal coliform bacteria were also collected from basin lakes and lakes with suspected orknown sedimentation and/or bacterial contamination problems. To supplement data collected byEcology staff, volunteers participating in Washington’s Citizen Lake Monitoring Programmeasured Secchi disk transparency and surface water temperature in 52 of the 70 lakes.Volunteers monitored their lakes twice a month from May through October. Most volunteersalso completed a questionnaire on lake and watershed uses.
Carlson’s Trophic State Index (1977), tempered with professional judgement, was used toevaluate volunteer-collected Secchi depth data and Ecology-collected phosphorus andchlorophyll a data. Trophic state estimations were assigned to the lakes assessed using datacollected by Ecology professionals, citizen volunteers, and data supplied by Sue Davis with theThurston County Environmental Health.
Of the 70 lakes evaluated, 12 were oligotrophic, 24 were oligo-mesotrophic, 13 weremesotrophic, 9 were meso-eutrophic, and 12 were eutrophic.

Page vi
.

Page 1
Introduction
The purpose of this report is to describe the 1997 Lake Water Quality Assessment (LWQA)Program, and to present data and individual lake assessments from 70 lakes which weremonitored by volunteers and Ecology staff during 1997.
Program Objectives
The goals of the LWQA Program are to assess the current water quality of publicly-owned lakesin Washington, and to maintain a relationship with volunteers of monitored lakes for dataexchange, education, and technical assistance. Specific objectives for the 1997 program were to:
1) determine the trophic status of monitored lakes,2) assess water quality in chosen lakes not evaluated in the last five years,3) promote public awareness of lake processes and lake protection measures and foster a
conservation ethic, and4) establish a data set for analysis and dissemination.
History of LWQA Program
Ecology’s Lake Water Quality Assessment Program was established in 1989 to gather generalwater quality information from significant, publicly-owned lakes. Data collected from theprogram are used primarily to assess each monitored lake for the state’s biennial WaterQuality Assessment (305 (b)) Report. Lake water quality assessments are required underSection 314 (a)(2) of the Clean Water Act, as amended by the Water Quality Act of 1987. Forthe purposes of reporting water quality assessments, significant, publicly-owned lakes cover atleast 20 acres, have a public access, and support or have the potential to support the fishable-swimmable goals of the Clean Water Act (Rector and Hallock, 1995).
The 1989 lake monitoring program was funded from a Federal 314 Water Quality Assessmentgrant. The program consisted of volunteer monitoring on 48 lakes, a supplemental water qualitysurvey conducted by Ecology staff on 25 lakes (Brower and Kendra, 1990), and a toxics surveyconducted by Ecology staff on fish tissues and sediments from 10 lakes (Johnson and Norton,1990). Results from the 1989 program are discussed in Lake Water Quality Assessment Project,1989 (Rector and Hallock, 1991).
In 1990, a Water Quality Management and Planning (205 (j)) grant funded the majority of theprogram. The volunteer monitoring program was expanded to include additional lakes (for atotal of 73 lakes), and Ecology staff met with each of the volunteers during May and August tocollect water samples and vertical profile data. A supplemental water quality survey wasconducted on 15 lakes (Coots, 1991). Results of all data collected from 1990 are discussed inLake Water Quality Assessment Project, 1990 (Rector and Hallock, 1993).

Page 2
In 1991, the program was reduced because of insecure funding. A Federal 314 grant maintainedthe program through 1991. Volunteers collected data from 41 lakes, and Ecology staff collectedone set of water samples and vertical profile data from each of the volunteer-monitored lakes.No supplemental surveys were conducted.
In 1992, additional 314 and 205(j) grants were obtained. Volunteers collected data from41 lakes, and Ecology staff collected two sets of water samples and profile data from these lakes.Five lakes were surveyed for various contaminants in sediment and fish tissues, and fiveadditional lakes were surveyed for copper in sediments (Serdar et al., 1994). Results from the1991 and 1992 monitoring years are discussed in Lake Water Quality Assessment Program,1991-1992 (Rector, 1994).
In 1993, volunteers collected data from 65 lakes, and Ecology staff collected two sets of watersamples and profile data from most of the volunteer-monitored lakes. Ecology staff collectedwater samples and profile data from 15 additional lakes, to support the monitoring phase ofEcology’s watershed approach to water quality management. In 1993, watershed approachmonitoring focused on the Kitsap, Lower Columbia, Upper Yakima, and Mid-Columbia basins.The program was funded largely through 314 grants and matching funds.
In 1994 volunteers monitored approximately 60 lakes. Ecology staff collected water samples andprofile data from 73 lakes, which included six lakes which were sampled in support of thewatershed approach to water quality management, as well as other lakes of interest to Ecology’sregional permit writers and inspectors. In 1994, watershed approach monitoring focused on theEastern Olympics, Cedar/Green, Spokane, and Lower Yakima basins. The program was fundedlargely through 314 grants and matching funds.
In 1995, funds allocated through the 314 grant process were rescinded by Congress and no longeravailable to states as of October 1995. This, however, did not impact the field season for 1995and all went as planned for a normal sampling year. The watershed approach monitoring focusedon the Skagit/Stillaguamish, Upper Columbia, Columbia Gorge and the Horseheaven/Klickitatbasins.
In 1996 the LWQA Program received its first 319 grant which enabled the program to continuefor an additional year. The EPA 319 Non-point program has fewer requirements than 314 anddoes not require matching funds. Conversely, the funding is only for a year with no guarantee ofa grant award the following year. The watershed approach monitoring focused on South PugetSound, Island/Snohomish, Esquatzel, Crab Creek and Okanogan basins.

Page 3
Methods
Methods for lake selection, data collection, sample analysis, and data analysis are describedbelow. Methods for quality assurance and quality control (QA/QC) of data collected for theprogram are discussed in the “QA/QC Evaluation and Results” section that follows this“Methods” section.
Volunteer Recruitment and Lake Selection
All Washington lakes that cover at least 20 acres and have a public access are eligible forinclusion in the volunteer monitoring program. Approximately 1,000 lakes in Washington Statemeet these criteria, although the exact number is unknown (Rector and Hallock, 1995).
The main factor for selecting lakes was whether someone volunteered to monitor a lake for theprogram. In previous years volunteers were recruited through press releases or were referred tothe program by Ecology staff, county offices, or from other volunteers. In 1997, most of the newvolunteers were recruited to the program by referrals from other volunteers. Potential volunteerswere accepted into the program if they indicated that they (1) wanted to monitor an eligible lake,(2) were willing and able to collect monitoring data for the six-month monitoring period, and(3) had access to a boat to use while collecting data.
Ecology coordinated lake selection with local volunteer lake monitoring programs inKing County (coordinated by METRO) and Snohomish County (coordinated by SnohomishCounty Department of Public Works). The Snohomish County program was developed in 1993,so several volunteers who responded to Ecology’s press release were referred to the newSnohomish County program. Some lakes were monitored by Ecology as well as King County’sSmall Lakes Program and Snohomish County’s Volunteer Lake Monitoring Project. Datacollected from these lakes may be compared in the future for QA/QC purposes.
In summary, each year of monitoring includes a group of lakes which have been monitored byvolunteers over a long period (which allows for trend analysis), a group of lakes relatively new tothe program, the volunteers for which may or may not continue over a long period, and a groupof lakes monitored by Ecology staff for watershed-based permitting and planning purposes. Thelatter group of lakes are selected primarily because of a lack of data and geographicalconsiderations.
Field Methods
There were two separate field data collection efforts for the program: (1) volunteers measuredSecchi depth and surface water temperature on a relatively frequent basis (generally once everytwo weeks); and (2) Ecology staff collected water samples, profiles, and qualitative informationon algae and macrophytes during two “onsite visits” with the volunteers.
Page 4
Volunteer-Collected Data
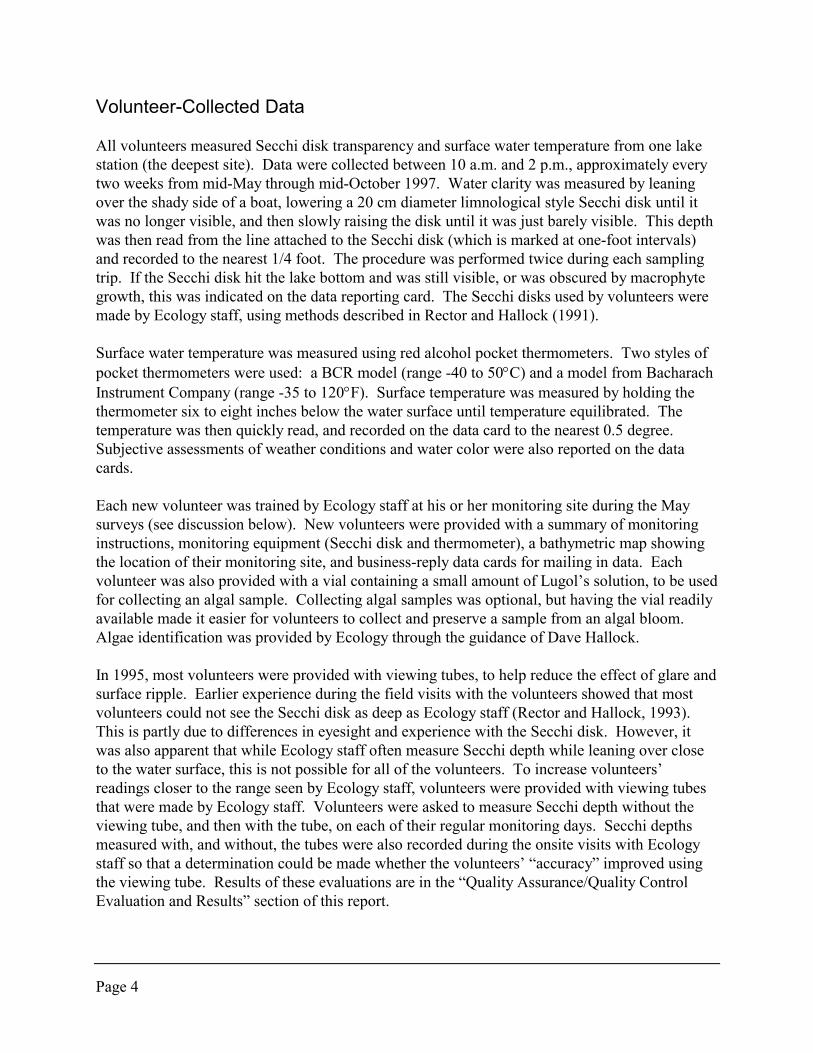
All volunteers measured Secchi disk transparency and surface water temperature from one lakestation (the deepest site). Data were collected between 10 a.m. and 2 p.m., approximately everytwo weeks from mid-May through mid-October 1997. Water clarity was measured by leaningover the shady side of a boat, lowering a 20 cm diameter limnological style Secchi disk until itwas no longer visible, and then slowly raising the disk until it was just barely visible. This depthwas then read from the line attached to the Secchi disk (which is marked at one-foot intervals)and recorded to the nearest 1/4 foot. The procedure was performed twice during each samplingtrip. If the Secchi disk hit the lake bottom and was still visible, or was obscured by macrophytegrowth, this was indicated on the data reporting card. The Secchi disks used by volunteers weremade by Ecology staff, using methods described in Rector and Hallock (1991).
Surface water temperature was measured using red alcohol pocket thermometers. Two styles ofpocket thermometers were used: a BCR model (range -40 to 50!C) and a model from BacharachInstrument Company (range -35 to 120!F). Surface temperature was measured by holding thethermometer six to eight inches below the water surface until temperature equilibrated. Thetemperature was then quickly read, and recorded on the data card to the nearest 0.5 degree.Subjective assessments of weather conditions and water color were also reported on the datacards.
Each new volunteer was trained by Ecology staff at his or her monitoring site during the Maysurveys (see discussion below). New volunteers were provided with a summary of monitoringinstructions, monitoring equipment (Secchi disk and thermometer), a bathymetric map showingthe location of their monitoring site, and business-reply data cards for mailing in data. Eachvolunteer was also provided with a vial containing a small amount of Lugol’s solution, to be usedfor collecting an algal sample. Collecting algal samples was optional, but having the vial readilyavailable made it easier for volunteers to collect and preserve a sample from an algal bloom.Algae identification was provided by Ecology through the guidance of Dave Hallock.
In 1995, most volunteers were provided with viewing tubes, to help reduce the effect of glare andsurface ripple. Earlier experience during the field visits with the volunteers showed that mostvolunteers could not see the Secchi disk as deep as Ecology staff (Rector and Hallock, 1993).This is partly due to differences in eyesight and experience with the Secchi disk. However, itwas also apparent that while Ecology staff often measure Secchi depth while leaning over closeto the water surface, this is not possible for all of the volunteers. To increase volunteers’readings closer to the range seen by Ecology staff, volunteers were provided with viewing tubesthat were made by Ecology staff. Volunteers were asked to measure Secchi depth without theviewing tube, and then with the tube, on each of their regular monitoring days. Secchi depthsmeasured with, and without, the tubes were also recorded during the onsite visits with Ecologystaff so that a determination could be made whether the volunteers’ “accuracy” improved usingthe viewing tube. Results of these evaluations are in the “Quality Assurance/Quality ControlEvaluation and Results” section of this report.

Page 5
All volunteers were mailed a questionnaire on lake and watershed uses near the end of eachmonitoring season. The purpose of these questionnaires was to gather additional informationfrom the monitored lakes that may be used when assessing the lakes. Several questions requiredthe volunteers to make additional observations around their lakes (e.g., counting the number ofnearshore homes). Questionnaire results for each lake are presented with the individual lakeassessments at the end of this report.
Data Collected by Ecology Staff
Ecology staff visited most of the volunteers twice in 1997; the first visit occurred during late Mayor early June, and the second occurred during late August or early September. The purpose ofthese visits was to (1) observe the volunteer’s Secchi disk reading technique and compare to theEcology staff reading, to determine whether the volunteer needed suggestions for improving hisor her technique; (2) collect profile data and water samples from the volunteers’ sampling sites;(3) collect macrophyte and/or algae samples for identification; and (4) answer questions ordiscuss lake issues with each of the volunteers.
During each field visit, the volunteer escorted Ecology personnel to their monitoring site, andanchored if possible. The volunteers and Ecology staff each measured Secchi depth.Temperature, pH, dissolved oxygen, and conductivity were profiled using a Hydrolab®Surveyor II or Sonde 3/Surveyor III. Temperature profile data were used to determine whetherthe lakes were stratified, and if they were, to determine depths within the epilimnion andhypolimnion for collecting water samples. Weather conditions, water color, and generalobservations about the lake were recorded. If an obvious algal bloom was occurring at thesurface or at depth (indicated by a large increase in dissolved oxygen with no concurrent decreasein temperature), a sample was collected for later identification. Plant samples were eitheridentified onsite, or collected for later identification. Algae and macrophyte samples werecollected for qualitative purposes only, and results are not inclusive of all species present.
During each onsite visit, water samples for TP, total persulfate nitrogen (TN), and chlorophyll awere collected using a Kemmerer or Van Dorn style water sampler, and were composited fromtwo to three equidistant depths within the strata (epilimnion or hypolimnion) sampled (Table 1).Samples for turbidity were collected from epilimnion of 16 lakes, at the same sites and sampledepths as the nutrient samples. Most lakes sampled for turbidity were selected because in theprevious year of sampling, they did not exhibit the expected relationship between Secchi depth,TP, and chlorophyll a. For some lakes, non-algal turbidity can interfere with these relationships.

Page 6
Table 1. Analytical methods used for samples collected for the LWQA Program.
MethodParameter Strata Sample Analytical Detection Holding Analytical
Sampled1 Preservation2 Method Limit Time Lab3
Total epilimnion, H2SO4 SM 4500-P D 3 "g/L 28 days MELPhosphorus hypolimnion to pH < 2
Total epilimnion, H2 SO4 EPA 353.2 0.010 mg/L 28 days MELNitrogen hypolimnion to pH < 2
Chloro- epilimnion MgCO3 SM 10200H 0.05 mg/L 28 days MELphyll a4 (2,B)
Turbidity epilimnion SM 2540D,E 1 mg/L 7 days MEL
Fecal nearshore grab SM 9222D 1 colony/ 30h MELColiform samples (2 sites) 100 mLBacteria
1 All samples except fecal coliform bacteria were composited.2 All samples kept on ice or stored at 4!C until delivery to the lab, or until filtered.3 Manchester Environmental Laboratory (MEL)4 Corrected for pheophytin.5 Approximately 2 mL saturated MgCO3 added with last of filtrate onto filter. Filters were iced, or frozen, until
delivered to lab.
Fecal samples were collected approximately 20-35 feet from shore in areas which appeared (tothe sampling staff) of having some potential source of bacteria. Fecal coliform bacteria samplebottles were filled by “scooping” water from about eight inches below the water surface, to avoidsurface films.
All samples, except those for chlorophyll a, were transported on ice to the lab and stored at 4!C.Chlorophyll a samples were filtered through Whatman 4.7 cm GF/C filters as soon as possibleafter collection. For most samples, 500 mL aliquots were filtered. About 2 mL of saturatedCaCO3 was added to the last of the filtrate to preserve the sample on the filter. Filters wereplaced in small plastic petri dishes, then wrapped in foil, and the lab number and volume ofsample filtered were written on the foil. Packaged filters were bagged and stored in ice while inthe field, and kept in a freezer until transported to the lab for analysis.
Sample Analysis Methods
Methods used for sample analyses are listed in Table 1. Sample preservation and analyticalmethods used by Manchester Environmental Laboratory (MEL) are from Huntamer and Hyre(1991).

Page 7
Keys used for algal identifications were Smith (1950), Edmondson (1959), Prescott (1962; 1978),and VanLandingham (1982). Keys used for macrophyte identifications were Tarver et al. (1978),and Prescott (1980).
Methods Used for Estimating Trophic Status
Carlson’s (1977) trophic state indices (TSI) for Secchi depth (TSISD), total phosphorus (TSITP),and chlorophyll a (TSICHL), tempered with some professional judgment, were used to estimatethe trophic status of the monitored lakes. In general, TSIs of 40 or less indicate oligotrophy, TSIsgreater than 40 indicate mesotrophy, and TSIs greater than 50 indicate eutrophy (Carlson, 1979).To describe lakes which appeared to be between trophic states, the terms “oligo-mesotrophic”and “meso-eutrophic” were used.
TSISD values were calculated from a time-weighted mean Secchi depth calculated from all Secchidata collected between May and October 1997. The rationale for using a time-weighted TSISD isdiscussed in Rector (1994). A minimum of five Secchi depth measurements separated by at leasttwo weeks were used to calculate the TSISD for each lake. Data invalidated by the QA/QCevaluation (below) were excluded from the TSISD calculations. TSITP and TSICHL values werecalculated separately for each of the May and August results.
It is not legitimate to average TSI values from different trophic state parameters, and to use thataverage to summarize a lake’s trophic status. According to Carlson (1977), “the best indicator oftrophic status may vary from lake to lake and also seasonally, so the best index to use should bechosen on pragmatic grounds.” Therefore, a subjective assessment of all data collected duringthe monitoring season was used to determine which index to use for assigning trophic states.Then monitoring data, other available survey information (short-term lake surveys conducted byEcology or universities, and consultant reports from Ecology-funded lake restoration activities),and information from the volunteers (e.g., information on aquatic herbicide use), were used totemper the trophic state assessment for most lakes. As a result, the trophic state estimations werenot based on TSI alone, and were not necessarily based on the same parameters for all lakes. Thebasis for each trophic state assessment is discussed in the “Summary” section of the individuallake assessments at the end of this report.

Page 8
Quality Assurance/Quality Control Evaluation
All data collected for the Lake Water Quality Assessment (LWQA) Program were evaluated todetermine whether data quality objectives for the program (Table 2) were met. Methods used fordata quality evaluations are described in Lake Water Quality Assessment Program QualityAssurance Project Plan (Hallock, 1995). Laboratory QA/QC results for all parameters arediscussed in Appendix B and listed in Appendix C. Hydrolab QC data are in Appendix D. Thesummary of QA/QC requirements is listed below in Table 2.
Table 2. Summary of data quality objectives for the LWQA Program.
Parameter Detection Precision AccuracyLimit (Bias)
Secchi Depth -- < 10% CV (daily pairs) < 10% CV < 5% CV (all pairs/lake) (volunteer/Ecology)
Total Phosphorus 5 "g/L < 7.5% CV (10 lab splits) < 2.5% relative bias(lab check standards)
Total Persulfate 0.050 mg/L < 5% CV (lab splits) < 5% relative bias Nitrogen (lab check standards)
Chlorophyll a 0.5 "g/L < 10% CV (field dups) < 2.5% relative bias< 45% CV (May/August) (lab check standard)
Profile parameters Temp. -- -- ± 0.5°C pH -- -- ± 0.2 SU D.O. -- -- ± 0.50 mg/L spec. cond. -- -- ± 5 "mho/cm
Fecal Coliforms 1 colony/100 mL < 35% CV (lab splits) --
Solids 1 mg/L ± 1 mg/L (field splits) --
Source of information: Hallock (1995)

Page 9
Conclusions
A total of 70 publicly-owned lakes were sampled in 1997 by Ecology staff and volunteers. Totalphosphorus, total nitrogen, and chlorophyll a were assessed for 63 of the lakes. Fecal coliformbacteria levels were evaluated for 20 of the lakes with known contamination problems andturbidity levels were evaluated for 18 of the lakes with known sedimentation problems; 452surface temperature and Secchi depth readings were measured; 32 volunteer surveys regardinglake and watershed uses were completed. These and other factors, including Ecology staffobservations and aquatic plant surveys, were combined to estimate the trophic states of each ofthe 70 lakes. Of those, twelve were oligotrophic, twenty-four were oligo-mesotrophic, thirteenwere mesotrophic, nine were meso-eutrophic, and twelve were eutrophic.
Ecology’s Lake Water Quality Assessment Program is the only lake management programstatewide. It is effective in assessing the water quality of Washington’s lakes and valuable for itspromotion of public awareness of lake processes and lake protection measures. Because of itsimportance, the Program should be permanently funded.
Although quality control data indicated good quality data from the laboratories, more informationis needed from the laboratories in order to determine whether data quality objectives for theprogram are met. Based on data quality review in 1997, the following recommendations weremade for the 1998 program: The laboratory should report total phosphorus data to the nearest 0.1"g/L so that variability in precision, accuracy, and detection limits can be calculated and thedetection limit for total phosphorus can be computed independent of the lab. Additionally,because dissolved oxygen concentrations during Hydrolab® calibrations may be biased as fieldWinkler checks often do not meet QAPP standards, further research is needed to determine ifthere is a bias and how to correct the bias if it does exist.

Page 10
References
Bortleson, G.C., N.P. Dion, J.B. McConnell, and L.M. Nelson, 1976a. Reconnaissance Data onLakes in Washington, Volume 1: Clallam, Island, Jefferson, San Juan, Skagit, andWhatcom Counties. Washington State Department of Ecology, Water-Supply Bulletin43, 248 pp.
------, 1976b. Reconnaissance Data on Lakes in Washington, Volume 2: King and SnohomishCounties. Washington State Department of Ecology, Water-Supply Bulletin 43, vol 2,424 pp.
------, 1976c. Reconnaissance Data on Lakes in Washington, Volume 3: Kitsap, Mason, andPierce Counties. Washington State Department of Ecology, Water-Supply Bulletin 43,vol. 3, 259 pp.
------, 1976d. Reconnaissance Data On Lakes In Washington, Volume 4: Clark, Cowlitz, GraysHarbor, Lewis, Pacific, Skamania, and Thurston Counties. Washington State Departmentof Ecology, Water-Supply Bulletin 43, vol. 4, 197 pp.
Bortleson, G.C., G.T. Higgins, and G.W. Hill, 1974. Data On Selected Lakes In Washington,Part 2. Washington State Department of Ecology, Water-Supply Bulletin, Part 2.
Bortleson, G.C., G.T. Higgins, J.B. McConnell, and J.K. Innes, 1976. Data On Selected Lakes inWashington, Part 3. Washington State Department of Ecology, Water-Supply Bulletin42, Part 3, 143 pp.
Brower, C. and W. Kendra, 1990. Water Quality Survey of 25 “Citizen-Volunteer” Lakes fromWashington State. Washington State Department of Ecology, EnvironmentalInvestigations and Laboratory Services Program, Olympia, WA, 114 pp.
Carlson, R.E., 1977. A Trophic State Index for Lakes. Limnol. Oceanogr. 22:361-369.
-----, 1979. A Review of the Philosophy and Construction of Trophic State Indices In Maloney,T.E. Lake and Reservoir Classification Systems. U.S. Environmental Protection AgencyReport No. EPA-600/3-79-074, pp. 1-52.
Coots, R., 1991. Water Quality Survey of 15 “Volunteer-Monitored” Lakes In Washington State.Washington State Department of Ecology, Environmental Investigations and LaboratoryServices Program, 95 pp.
Dion, N.P., G.C. Bortleson, and J.K. Innes, 1980. Data on Selected Lakes in Washington, Part 6.Washington State Department of Ecology, Water-Supply Bulletin 42, Part 6, 125 pp.
Page 11
Dion, N. P., G. C. Bortleson, J. B. McConnell, and J. K. Innes, 1976. Data On Selected Lakes inWashington, Part 5. Washington State Department of Ecology, Water-Supply Bulletin42, Part 5.
Dion, N.P., G.C. Bortleson, J.B. McConnell, and L.M. Nelson, 1976a. Reconnaissance Data onLakes in Washington, Volume 5: Chelan, Ferry, Kittitas, Klickitat, Okanogan, andYakima Counties. Washington Sate Department of Ecology, Water-Supply Bulletin 43,vol. 5, 264 pp.
Dion, N.P., G.C. Bortleson, J.B. McConnell, and L.M. Nelson, 1976b. ReconnaissanceData on Lakes in Washington, Volume 7: Pend Oreille, Spokane, and StevensCounties. Washington State Department of Ecology, Water-Supply Bulletin 43,vol. 7, 267 pp.
Edmondson, W.T. (ed.), 1959. Fresh-Water Biology, 2nd ed. John Wiley and Sons, Inc., NY,1248 pp.
Hallock, D., 1995 (in draft). Lake Water Quality Assessment Project Quality Assurance ProjectPlan. Washington State Department of Ecology, Environmental Investigations andLaboratory Services Program, , Olympia, WA.
Huntamer, D., and J. Hyre, 1991. Manchester Environmental Laboratory, Laboratory User’sManual, Third Edition. Washington State Department of Ecology, EnvironmentalInvestigations and Laboratory Services Program, Olympia, WA, 342 pp.
Johnson, A. and D. Norton, 1990. 1989 Lakes and Reservoir Water Quality AssessmentProgram: Survey of Chemical Contaminants in Ten Washington Lakes. WashingtonState Department of Ecology, Environmental Investigations and Laboratory ServicesProgram, Olympia, WA.
Prescott, G.W., 1962. Algae of the Western Great Lakes Area. Wm. C. Brown, Co., Dubuque,IA, 977 pp.
-----, 1978. How to Know the Freshwater Algae. 3rd ed., Wm C. Brown Co., Dubuque, IA,293 pp.
-----, 1980. How to Know the Aquatic Plants. 2nd ed. Wm C. Brown Co., Dubuque, IA,158 pp.
Rector, J., 1994. Lake Water Quality Assessment Program, 1991-1992. Washington StateDepartment of Ecology, Environmental Investigations and Laboratory Services Program,Olympia, WA, 342 pp.

Page 12
Rector, J. and D. Hallock, 1995. 1994 Statewide Water Quality Assessment Lakes Chapter,Companion Document to Washington State’s 305(b) Report. Washington StateDepartment of Ecology, Environmental Investigations and Laboratory Services Program,Olympia, WA, 60 pp.
Rector, J. and D. Hallock, 1993. Lake Water Quality Assessment Project, 1990. WashingtonState Department of Ecology, Environmental Investigations and Laboratory ServicesProgram, Olympia, WA, 337 pp.
Rector, J. and D. Hallock, 1991. Lake Water Quality Assessment Project, 1989. WashingtonState Department of Ecology, Environmental Investigations and Laboratory ServicesProgram, Olympia, WA, 209 pp.
Serdar, D., A. Johnson, and D. Davis, 1994. Survey of Chemical Contaminants in TenWashington Lakes. Washington State Department of Ecology, EnvironmentalInvestigations and Laboratory Services Program, Olympia, WA, 25 pp.
Smith, G.S., 1950. The Freshwater Algae of the United States. 2nd ed. McGraw-Hill BookCompany, Inc., 719 pp.
Tarver, D.P., J.A. Rodgers, M.J. Mahler and R.L. Lazor, 1978. Aquatic and Wetland Plants ofFlorida. Florida Department of Natural Resources, 128 pp.
VanLandingham, S.L., 1982. Guide to the Identification, Environmental Requirements andPollution Tolerance of Freshwater Blue-Green Algae (Cyanophyta). EnvironmentalProtection Agency EPA-600/3-82-073. 341 pp.
Wolcott, E.E., 1973. Lakes of Washington Volume II, Eastern Washington. Washington StateDepartment of Ecology, Water-Supply Bulletin No. 14, third ed

Appendix A
Individual Lake Assessments
The 70 individual lake assessments presented here were written primarily for the volunteers whoparticipated in Washington’s Citizen Lake Monitoring Project. As a result, layperson terms are
used, and many basic limnological concepts are discussed or described.

Appendix B
Quality Assurance/Quality Control Results andDiscussion for 1997
Volunteer-Collected Secchi Data
On each sampling date, volunteers measured the Secchi depth two times. The coefficient ofvariation (CV) was calculated for each pair of Secchi depth readings, to evaluate the volunteers’abilities to reproduce their measurements. Although this is summarized as “precision” in Table2, it should be apparent that the two sets of readings cannot be collected independently of eachother, so the estimation of precision may be biased. Pairs which exceeded the requirements inthe data quality objectives were not used in calculations of trophic state indices (TSISD).
All CVs for each volunteer’s data set for the year were pooled using the coefficient of variation(CV) to determine the overall variability in each volunteers’ readings.
During at least one of the two field visits with the volunteers, Secchi depth was measured by bothEcology staff and the volunteers. The CV was calculated for Secchi depths measured duringthese field visits to evaluate the “accuracy” of the volunteers’ measurements , assuming theEcology staff reading was the “true” reading (Accuracy evaluation, Appendix C). Daily(Precision evaluation) and yearly (Median evaluation) precision assessments are also listed inAppendix C.
Overall, it was apparent that the majority of volunteers cannot see the disk as deep as Ecologystaff. (This was also documented in 1990; Rector and Hallock, 1993.) In an attempt to improveSecchi depth readings collected by volunteers, viewing tubes were made by Ecology staff anddistributed to volunteers in 1993. Using the tubes helps to reduce glare and surface ripple.Comparisons between volunteer-measured Secchi depths and Ecology staff-measured Secchidepths were made during the field visits. Based on improved “accuracy” using the viewing tubesvolunteers with view tubes were asked to use a viewing tube for all their Secchi disk readings.Except for those volunteers who need to use the tube to increase “accuracy,” most measurementsmade without tubes were used when both “with” and “without” readings were reported. Thisallows for readings collected before 1993 (including historical data) to be compared to readingscollected for the current program. One exception is Lake Wenatchee, which is frequently choppydue to high winds in the area. The viewing tube has made it much easier for the volunteer tomeasure Secchi depth at this lake.

Profile Data
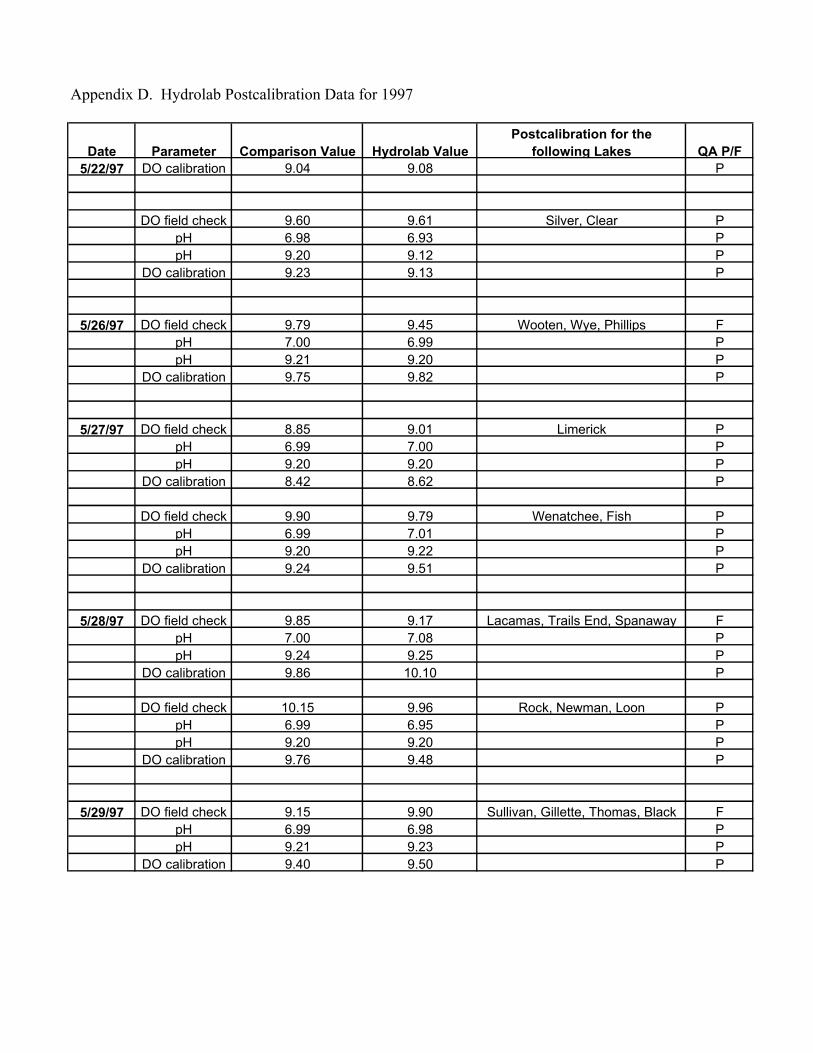
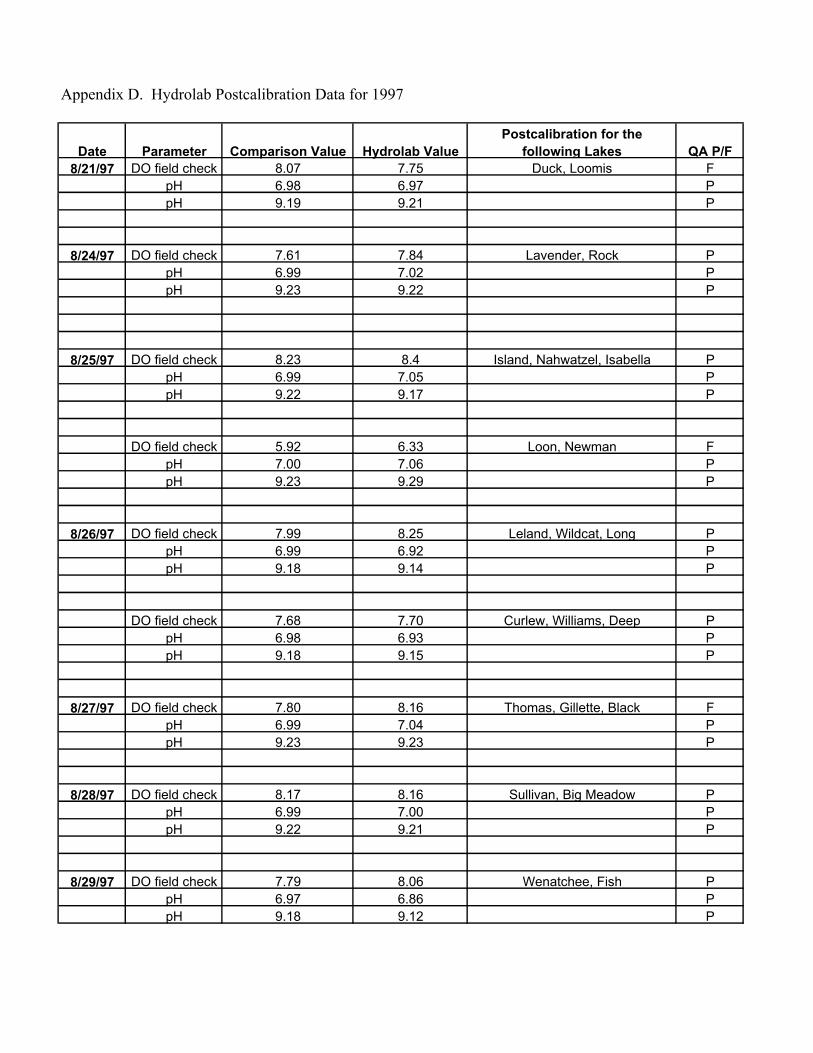
The Hydrolabs were pre- and postcalibrated daily for pH and dissolved oxygen. Themanufacturer’s instructions were followed for pH calibration, using pH 7 (low ionic strength)and pH 10 (regular, i.e., high, ionic strength) standard buffer solutions. Postcalibration readingswithin 0.2 pH unit of the standard buffer values were considered acceptable. Dissolved oxygenconcentrations from the Reporter unit were checked against the theoretical water-saturated airmethod as well as field samples collected at depth for Winkler titrations. Postcalibration resultswithin 0.5 mg/L of the comparison method was considered acceptable. Specific conductance, amore stable parameter on the Hydrolab, was checked periodically using the manufacturer’sinstructions. Potassium chloride standards used for conductivity calibration ranged from 101 to147 "mhos/cm at 25!C (the molarity varied between individual solutions used). Postcalibrationvalues within 5 "mhos/cm of the standard value were considered acceptable. Temperature wasalso checked periodically against a National Bureau of Standards (NBS) mercury thermometer.Values within 0.5!C were considered acceptable. Pre and post-calibration results are listed inAppendix D.
Total Phosphorus Data
Laboratory QC
Results from all lab blanks were reported as 0 "g/L, although absorbances varied betweenindividual blank samples. Based on the reported concentrations, the detection limit would be0 "g/L. However, using the absorbances reported for each lab blank sample, the calculateddetection limit was below 3 "g/L for 1997.
These detection limits were acceptable for the program, but also illustrate the need to have thelab report TP data to the nearest 0.1 "g/L (instead of the nearest whole "g/L) for QA/QCpurposes. For the LWQA Program, all analytical results should be reported to one decimal placebeyond the reporting limits, to allow for thorough (and easier) QA/QC evaluations.
Laboratory precision was calculated by pooling the coefficient for all pairs of lab splits. Results(Appendix C) were in the acceptable range specified in Table 2. Bias due to calibration error wasestimated from the difference between the results for lab check standards and the trueconcentration. All spring data failed the QA requirements. The 40 "g/L standards failed for thesummer survey. Interference effect (bias) due to the sample matrix was calculated as the percentrecovery for matrix spikes. Bias due to matrix effects was considered acceptable if meanrecoveries of matrix spikes were within 80-120%. Results from matrix spikes from both surveyswere acceptable.
An additional check on laboratory quality control was to submit diluted standards as “blind”samples. However, because the standards had to be diluted considerably to be in the expectedrange of lake samples, the ranges of the extrapolated confidence intervals (calculated fromequations provided with the standards) were extremely wide (e.g., 6.9 "g/L to 53.8 "g/L for aknown TP concentration of 15 "g/L). Therefore, this QA test has been discontinued due to therelatively little value provided by the results.

Field Variability Evaluated from TP Field Duplicates
TP samples were collected at a second site from at least 10 lakes during each survey. Thesesamples were collected to evaluate the representativeness of collecting epilimnetic data from asingle lake station. The draft Quality Assurance Project Plan (QAPP) for the LWQA Program(Hallock, 1995) states that total precision of these field duplicates should be evaluated by poolingthe CVs for each pair and if the median CV% exceeds 21% then collecting from a single lakestation is not representative of epilimnetic phosphorous.
Results (Appendix C) show that the median CV% did not exceed 21%, therefore, sampling atone site is representative. As stated in the QAPP, to achieve spatial plus analytical variabilitywithin ± 3 TSI units using one sample per lake, the median CV% from at least 10 duplicatesamples must be < 21%. Laboratory precision (CV%), which was calculated from results of fieldduplicate samples which were analyzed by the lab in duplicate, was 3.2% for the May survey, and4.1% for the August survey. Both meet the criteria of less than 7.5%. Therefore results for totalphosphorus meet the criteria set in the QAPP for representativeness and precision.
Other Water Chemistry Data
Hydrolab postcalibration data are compiled in Appendix D.
QA/QC evaluations for total nitrogen, chlorophyll a, solids, and fecal coliform bacteria followedthe methods described in Hallock (1995). All available lab QC data results are listed inAppendix C.
Total Nitrogen
Results from field and laboratory duplicates were within acceptable ranges specified in Table 2.
Chlorophyll a
Total precision of chlorophyll a was reported as the median CV% of field duplicates. Results forthe spring and summer were within the 10% limit (Appendix C).
Fecal Coliform Bacteria
It is not possible to conduct quality assurance calculations on fecal coliform data due to the widevariability in fecal concentrations detected in the field.
Turbidity
With one exception, all turbidity readings were within 0.5 NTUs (Appendix C).


Appendix C
Water Quality QA/QC Data from Lakes Monitoredby Ecology Staff in 1997


Appendix C. Laboratory Quality Assurance/Quality Control Data for 1997
1997 TOTAL PHOSPHORUS DATA
May Lab Splits August Lab Splits
Lake #1 (ug/L) #2 (ug/L) Mean S CV% Lake #1 (ug/L) #2 (ug/L) Mean S CV%Long 34 34.2 34.1 0.1414214 0.414725 Sylvia 12.6 11.7 12.15 0.6363961 5.237828Palmer 33 29.4 31.2 2.5455844 8.158924 Tapps 25.1 26.2 25.65 0.7778175 3.032427Roses 24.6 25.2 24.9 0.4242641 1.703872 Palmer 14.8 17.1 15.95 1.6263456 10.19652Clear 59.6 56.2 57.9 2.4041631 4.152268 Slear 153 152 152.5 0.7071068 0.463677Clear 37.2 38.1 37.65 0.6363961 1.690295 Island 6.9 6.9 6.9 0 0Limerick 9.2 8.8 9 0.2828427 3.142697 Long 36.5 44.5 40.5 5.6568542 13.96754Spanaway 8.8 9.8 9.3 0.7071068 7.603299 Loon 5.8 6.7 6.25 0.6363961 10.18234Newman 19.3 21.2 20.25 1.3435029 6.634582 Thomas 18.9 18.7 18.8 0.1414214 0.752241Thomas 10.6 11.1 10.85 0.3535534 3.258557 Lacamas 25.7 24.7 25.2 0.7071068 2.805979Williams 12.8 11.2 12 1.1313708 9.42809 Martha Lake 5.6 6.4 6 0.5656854 9.42809Tiger 3.9 4.1 4 0.1414214 3.535534 Samish 7.9 7.3 7.6 0.4242641 5.582422Mason 4.9 5.5 5.2 0.4242641 8.158924 Lake Martha 14.1 13.9 14 0.1414214 1.010153Mason 3.9 3.8 3.85 0.0707107 1.836641 Spanaway 14.4 14.6 14.5 0.1414214 0.97532Padden 10.3 9.9 10.1 0.2828427 2.800423 Toad 9.4 12.2 10.8 1.979899 18.3324Duck 53.7 52 52.85 1.2020815 2.274516 Bosworth 6.4 6.3 6.35 0.0707107 1.113554Horseshoe 12.7 12.9 12.8 0.1414214 1.104854 Wooten 4 4.7 4.35 0.4949747 11.37873
Median CV% 3.200627 Median CV% 4.135127
All lab split median CV% are < 7.5 so the QAPP standard is met

Appendix C. Laboratory Quality Assurance/Quality Control Data for 1997May Field Duplicates August Field Duplicates
Lake #1 (ug/L) #2 (ug/L) Mean S CV% Lake #1 (ug/L) #2 (ug/L) Mean S CV%Long 27 34 30.50 4.9497475 16.22868 Palmer 40.7 14.8 27.75 18.314066 65.99663Palmer 33 30.6 31.8 1.6970563 5.336655 Silver 23.9 35 29.45 7.8488853 26.65156Phillips 7.9 7.6 7.75 0.212132 2.737188 Newman 33.3 31.5 32.4 1.2727922 3.928371Limerick 8.2 9.2 8.7 0.7071068 8.127664 Black 8.8 7.8 8.3 0.7071068 8.519359Spanaway 10.4 8.8 9.6 1.1313708 11.78511 Sullivan 3.7 3.3 3.5 0.2828427 8.08122Newman 19.3 19.2 19.25 0.0707107 0.367328 Trails End 5.7 3.7 4.7 1.4142136 30.08965Deep 20.1 10 15.05 7.1417785 47.45368 Limerick 14.2 14.5 14.35 0.212132 1.478272Tiger 4.4 3.9 4.15 0.3535534 8.519359 Lacamas 39 25.7 32.35 9.4045202 29.07116Mason 4 3.9 3.95 0.0707107 1.790144 Martha Lake 5.2 5.6 5.4 0.2828427 5.237828Black 8.80 9.90 9.35 0.7778175 8.318903 Spanaway 13.70 14.40 14.05 0.4949747 3.522952
Bosworth 7.6 6.4 7 0.8485281 12.12183
Median CV% 8.223284 Median CV% 8.519359
All field duplicate CV% medians are < 21 so the QAPP standard is met
May Matrix Spikes August Matrix Spikes
Date % Recovery Date % Recovery5/19 102 8/18 86.65/28 94.2 8/20 1135/30 89.5 8/20 1186/05 92.4 8/26 92.36/10 122 9/02 94.46/19 82.5 9/02 83.3
9/02 95.1Mean 97.1 9/08 122
Bias % -2.9 9/15 1069/17 95.910/14 82.6
Mean 99.01818
Bias % -0.981818

Appendix C. Laboratory Quality Assurance/Quality Control Data for 1997May data August data
Total Phosphorouscheck standards 5ug/L 25ug/L 40ug/L check standards 5ug/L 25ug/L 40ug/L
5 41.9 5.8 24.6 40.24.6 5.4 24.8 39.2
4.8 26.8 43.24.6 26.3 394.5 504.54.9
Total 9.6 0 41.9 Total 34.5 102.5 211.6mean 4.8 #DIV/0! 41.9 mean 4.928571 25.625 42.32
bias -4 #DIV/0! 4.75 bias -1.428571 2.5 5.8
All >2.5% so fails QA requirements. Insufficient lab data. 40 ug/L standard >2.5% so fails the requirements of the QAPP.
Phosphorous LOD phosphorous LOD
blank 1 blank 2 D D2
blank 1 blank 2 D D2
-0.196 0.077 -0.273 0.074529 -0.234 -0.96 0.726 0.527076-0.93 -1.716 0.786 0.617796 0.858 0.058 0.8 0.64
-0.036 0.787 -0.823 0.677329 -0.422 -0.613 0.191 0.0364810.866 0.99 -0.124 0.015376
sum of D2= 1.369654 -0.906 0.539 -1.445 2.088025
0.273 -0.068 0.341 0.116281spring LOD = 1.12 ug/L -0.011 0.793 -0.804 0.646416
0.204 0.725 -0.521 0.271441
LOD= (square root of sum of D squared/2*number of observations)*t distribution (alpha = 0.1) sum of D2= 4.341096
fall LOD = 0.97 ug/L
Appendix C. Laboratory Quality Assurance/Quality Control Data for 1997
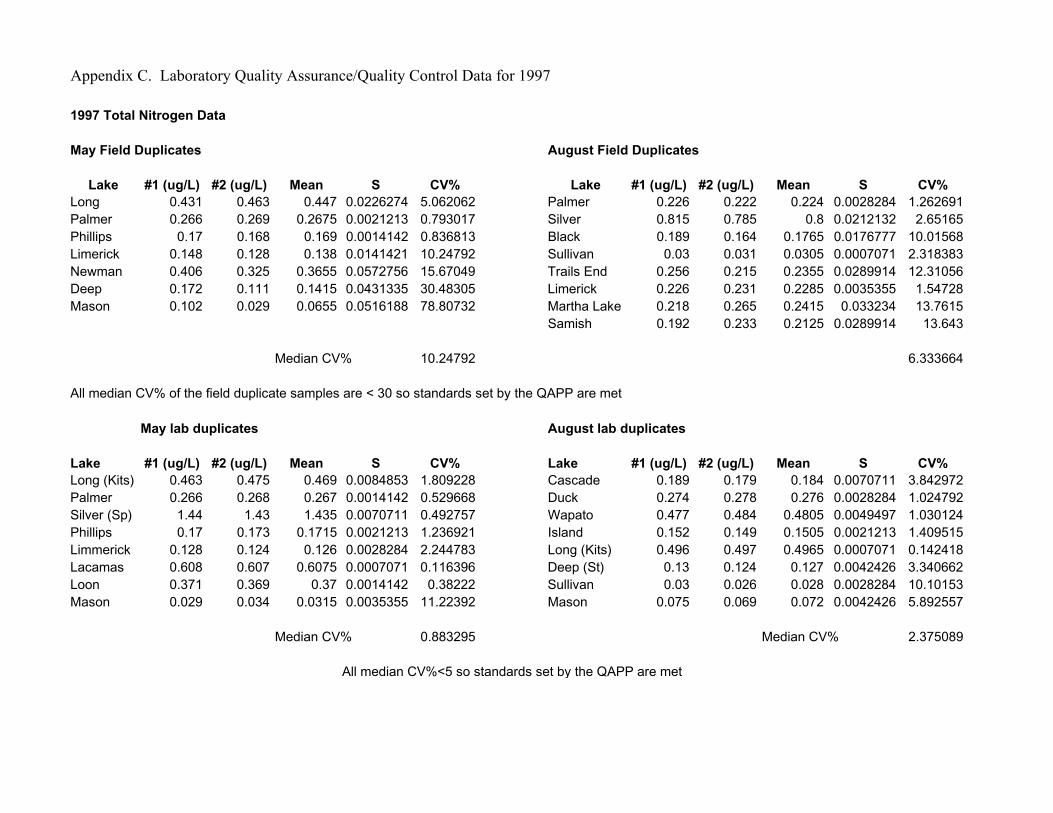
1997 Total Nitrogen Data
May Field Duplicates August Field Duplicates
Lake #1 (ug/L) #2 (ug/L) Mean S CV% Lake #1 (ug/L) #2 (ug/L) Mean S CV%Long 0.431 0.463 0.447 0.0226274 5.062062 Palmer 0.226 0.222 0.224 0.0028284 1.262691Palmer 0.266 0.269 0.2675 0.0021213 0.793017 Silver 0.815 0.785 0.8 0.0212132 2.65165Phillips 0.17 0.168 0.169 0.0014142 0.836813 Black 0.189 0.164 0.1765 0.0176777 10.01568Limerick 0.148 0.128 0.138 0.0141421 10.24792 Sullivan 0.03 0.031 0.0305 0.0007071 2.318383Newman 0.406 0.325 0.3655 0.0572756 15.67049 Trails End 0.256 0.215 0.2355 0.0289914 12.31056Deep 0.172 0.111 0.1415 0.0431335 30.48305 Limerick 0.226 0.231 0.2285 0.0035355 1.54728Mason 0.102 0.029 0.0655 0.0516188 78.80732 Martha Lake 0.218 0.265 0.2415 0.033234 13.7615
Samish 0.192 0.233 0.2125 0.0289914 13.643
Median CV% 10.24792 6.333664
All median CV% of the field duplicate samples are < 30 so standards set by the QAPP are met
May lab duplicates August lab duplicates
Lake #1 (ug/L) #2 (ug/L) Mean S CV% Lake #1 (ug/L) #2 (ug/L) Mean S CV%Long (Kits) 0.463 0.475 0.469 0.0084853 1.809228 Cascade 0.189 0.179 0.184 0.0070711 3.842972Palmer 0.266 0.268 0.267 0.0014142 0.529668 Duck 0.274 0.278 0.276 0.0028284 1.024792Silver (Sp) 1.44 1.43 1.435 0.0070711 0.492757 Wapato 0.477 0.484 0.4805 0.0049497 1.030124Phillips 0.17 0.173 0.1715 0.0021213 1.236921 Island 0.152 0.149 0.1505 0.0021213 1.409515Limmerick 0.128 0.124 0.126 0.0028284 2.244783 Long (Kits) 0.496 0.497 0.4965 0.0007071 0.142418Lacamas 0.608 0.607 0.6075 0.0007071 0.116396 Deep (St) 0.13 0.124 0.127 0.0042426 3.340662Loon 0.371 0.369 0.37 0.0014142 0.38222 Sullivan 0.03 0.026 0.028 0.0028284 10.10153Mason 0.029 0.034 0.0315 0.0035355 11.22392 Mason 0.075 0.069 0.072 0.0042426 5.892557
Median CV% 0.883295 Median CV% 2.375089
All median CV%<5 so standards set by the QAPP are met

Appendix C. Laboratory Quality Assurance/Quality Control Data for 1997
Chlorophyll a Data
No chlorophyll collected in the spring August field duplicatesLake Site # 1 Site # 2 Mean s CV %
August site duplicate Palmer 3.2 3.7 3.45 0.3535534 10.24792Lake sample#1 sample#2 Mean s CV % Silver (Sp) 5.4 4.7 5.05 0.4949747 9.80148
Palmer 3.7 4.2 3.95 0.3535534 8.950719 Newman 9.2 9.1 9.15 0.0707107 0.772794Silver (Sp) 4.7 4.9 4.8 0.1414214 2.946278 Trails End 0.99 1.4 1.195 0.2899138 24.26057Newman 9.1 13.4 11.25 3.0405592 27.02719 Samish 6.1 5.2 5.65 0.6363961 11.26365Trails End 1.4 1.4 1.4 0 0 Bosworth 4.8 4.3 4.55 0.3535534 7.770404Samish 5.2 4.8 5 0.2828427 5.656854Bosworth 4.3 3.9 4.1 0.2828427 6.898603 Median CV% 10.0247
QAPP standards set for chlorophyll are met for 1997samplingMedian CV% 6.277728
TurbidityMay August
Lake sample duplicate difference Lake sample duplicate differenceTapps 3.4 3.3 0.1 Sylvia 1.7 1.7 0Island 0.9 1 0.1 Roses 3 3.1 0.1Conconully 13 13 0 Mill Creek 45 45 0Newman 2.1 2.2 0.1 Isabella 0.8 0.8 0Bay 4.3 4.2 0.1 Black (Stev) 0.8 0.7 0.1Padden 1.5 1.3 0.2 Wiser 16 15 1Whatcom 0.9 0.9 0 Whatcom 0.9 0.8 0.1Hummel 4.4 4.3 0.1 Bay 3 3 0
All duplicates, except for Wiser Lake (fall), are within 0.5 NTUs so all but Wiser pass QA.
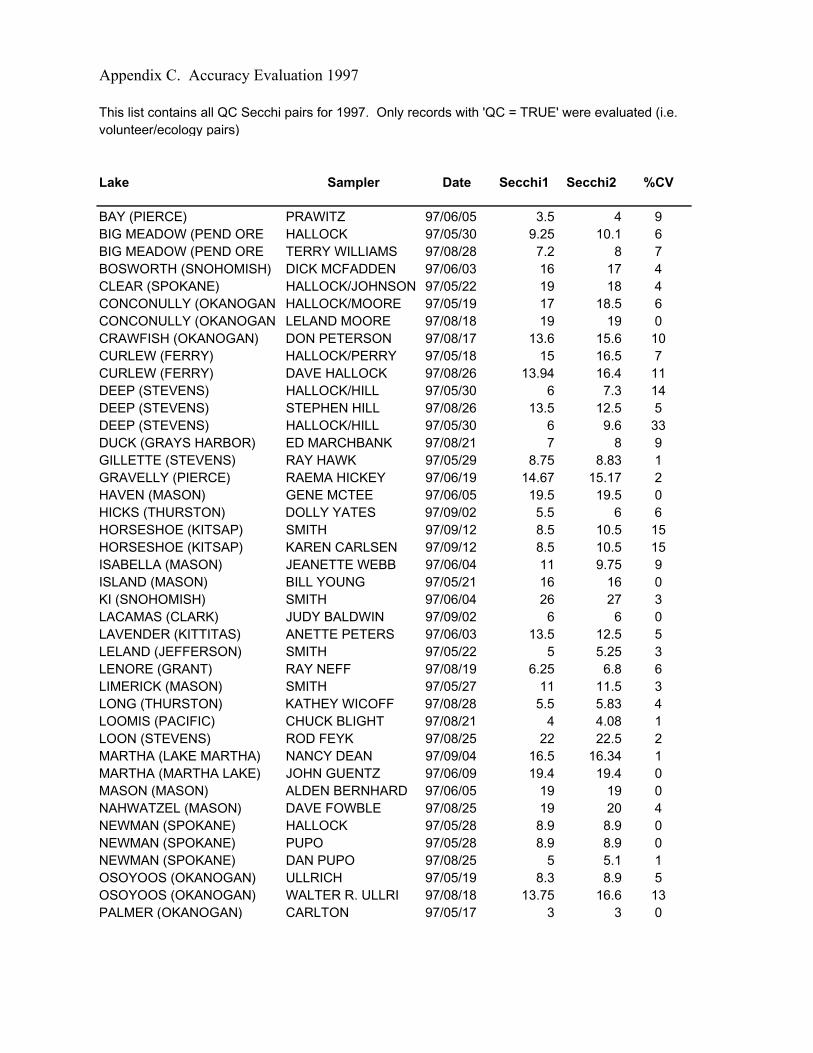
Appendix C. Accuracy Evaluation 1997
Lake Sampler Date Secchi1 Secchi2 %CV
BAY (PIERCE) PRAWITZ 97/06/05 3.5 4 9BIG MEADOW (PEND ORE HALLOCK 97/05/30 9.25 10.1 6BIG MEADOW (PEND ORE TERRY WILLIAMS 97/08/28 7.2 8 7BOSWORTH (SNOHOMISH) DICK MCFADDEN 97/06/03 16 17 4CLEAR (SPOKANE) HALLOCK/JOHNSON 97/05/22 19 18 4CONCONULLY (OKANOGAN HALLOCK/MOORE 97/05/19 17 18.5 6CONCONULLY (OKANOGAN LELAND MOORE 97/08/18 19 19 0CRAWFISH (OKANOGAN) DON PETERSON 97/08/17 13.6 15.6 10CURLEW (FERRY) HALLOCK/PERRY 97/05/18 15 16.5 7CURLEW (FERRY) DAVE HALLOCK 97/08/26 13.94 16.4 11DEEP (STEVENS) HALLOCK/HILL 97/05/30 6 7.3 14DEEP (STEVENS) STEPHEN HILL 97/08/26 13.5 12.5 5DEEP (STEVENS) HALLOCK/HILL 97/05/30 6 9.6 33DUCK (GRAYS HARBOR) ED MARCHBANK 97/08/21 7 8 9GILLETTE (STEVENS) RAY HAWK 97/05/29 8.75 8.83 1GRAVELLY (PIERCE) RAEMA HICKEY 97/06/19 14.67 15.17 2HAVEN (MASON) GENE MCTEE 97/06/05 19.5 19.5 0HICKS (THURSTON) DOLLY YATES 97/09/02 5.5 6 6HORSESHOE (KITSAP) SMITH 97/09/12 8.5 10.5 15HORSESHOE (KITSAP) KAREN CARLSEN 97/09/12 8.5 10.5 15ISABELLA (MASON) JEANETTE WEBB 97/06/04 11 9.75 9ISLAND (MASON) BILL YOUNG 97/05/21 16 16 0KI (SNOHOMISH) SMITH 97/06/04 26 27 3LACAMAS (CLARK) JUDY BALDWIN 97/09/02 6 6 0LAVENDER (KITTITAS) ANETTE PETERS 97/06/03 13.5 12.5 5LELAND (JEFFERSON) SMITH 97/05/22 5 5.25 3LENORE (GRANT) RAY NEFF 97/08/19 6.25 6.8 6LIMERICK (MASON) SMITH 97/05/27 11 11.5 3LONG (THURSTON) KATHEY WICOFF 97/08/28 5.5 5.83 4LOOMIS (PACIFIC) CHUCK BLIGHT 97/08/21 4 4.08 1LOON (STEVENS) ROD FEYK 97/08/25 22 22.5 2MARTHA (LAKE MARTHA) NANCY DEAN 97/09/04 16.5 16.34 1MARTHA (MARTHA LAKE) JOHN GUENTZ 97/06/09 19.4 19.4 0MASON (MASON) ALDEN BERNHARD 97/06/05 19 19 0NAHWATZEL (MASON) DAVE FOWBLE 97/08/25 19 20 4NEWMAN (SPOKANE) HALLOCK 97/05/28 8.9 8.9 0NEWMAN (SPOKANE) PUPO 97/05/28 8.9 8.9 0NEWMAN (SPOKANE) DAN PUPO 97/08/25 5 5.1 1OSOYOOS (OKANOGAN) ULLRICH 97/05/19 8.3 8.9 5OSOYOOS (OKANOGAN) WALTER R. ULLRI 97/08/18 13.75 16.6 13PALMER (OKANOGAN) CARLTON 97/05/17 3 3 0
This list contains all QC Secchi pairs for 1997. Only records with 'QC = TRUE' were evaluated (i.e. volunteer/ecology pairs)
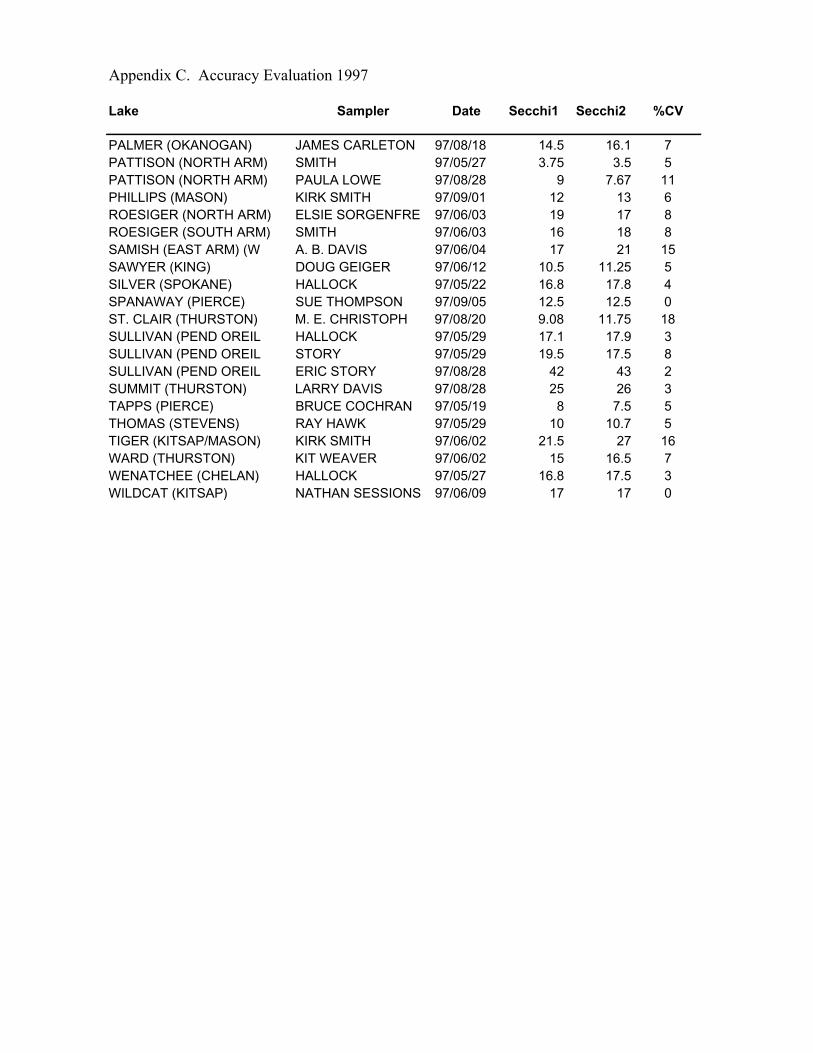
Appendix C. Accuracy Evaluation 1997
Lake Sampler Date Secchi1 Secchi2 %CV
PALMER (OKANOGAN) JAMES CARLETON 97/08/18 14.5 16.1 7PATTISON (NORTH ARM) SMITH 97/05/27 3.75 3.5 5PATTISON (NORTH ARM) PAULA LOWE 97/08/28 9 7.67 11PHILLIPS (MASON) KIRK SMITH 97/09/01 12 13 6ROESIGER (NORTH ARM) ELSIE SORGENFRE 97/06/03 19 17 8ROESIGER (SOUTH ARM) SMITH 97/06/03 16 18 8SAMISH (EAST ARM) (W A. B. DAVIS 97/06/04 17 21 15SAWYER (KING) DOUG GEIGER 97/06/12 10.5 11.25 5SILVER (SPOKANE) HALLOCK 97/05/22 16.8 17.8 4SPANAWAY (PIERCE) SUE THOMPSON 97/09/05 12.5 12.5 0ST. CLAIR (THURSTON) M. E. CHRISTOPH 97/08/20 9.08 11.75 18SULLIVAN (PEND OREIL HALLOCK 97/05/29 17.1 17.9 3SULLIVAN (PEND OREIL STORY 97/05/29 19.5 17.5 8SULLIVAN (PEND OREIL ERIC STORY 97/08/28 42 43 2SUMMIT (THURSTON) LARRY DAVIS 97/08/28 25 26 3TAPPS (PIERCE) BRUCE COCHRAN 97/05/19 8 7.5 5THOMAS (STEVENS) RAY HAWK 97/05/29 10 10.7 5TIGER (KITSAP/MASON) KIRK SMITH 97/06/02 21.5 27 16WARD (THURSTON) KIT WEAVER 97/06/02 15 16.5 7WENATCHEE (CHELAN) HALLOCK 97/05/27 16.8 17.5 3WILDCAT (KITSAP) NATHAN SESSIONS 97/06/09 17 17 0

Appendix C. Median Evaluation 1997
This list contains the median CV for volunteer Secchi pairs for 1997.Only records where both readings were taken either with or without a viewtube were evaluated (I.e. w/tube1=wtube2). Entries with 'QC = TRUE' were not included. Pairs with CV > 10% were not included. N2 is the number of pairsthat meet these criteria, n1 is the total number of pairs (should be >5).
Lake Station Median CV n1 n2
ALICE (KING) 1 2.4 15 13BAY (PIERCE) 1 N/A 2 0BIG MEADOW (PEND OREILLE) 0 N/A 1 0BIG MEADOW (PEND OREILLE) 1 0 12 11BLACK (STEVENS) 1 4.9 1 1BOSWORTH (SNOHOMISH) 1 0 11 9CASCADE (SAN JUAN) 1 N/A 1 0CLEAR (SPOKANE) 1 3.8 8 6CLEAR (SPOKANE) 2 N/A 1 0CONCONULLY (OKANOGAN) 0 N/A 1 0CONCONULLY (OKANOGAN) 1 0 5 4CRAWFISH (OKANOGAN) 1 3.3 9 5CURLEW (FERRY) 0 N/A 1 0CURLEW (FERRY) 1 N/A 10 0DEEP (STEVENS) 1 N/A 10 0DEEP (STEVENS) 2 N/A 1 0DUCK (GRAYS HARBOR) 1 0 8 7DUCK (GRAYS HARBOR) 2 4.2 6 6DUCK (GRAYS HARBOR) 3 0 8 8FISH (CHELAN) 1 N/A 2 0GILLETTE (STEVENS) 1 0 8 7GRAVELLY (PIERCE) 0 4.9 1 1GRAVELLY (PIERCE) 1 4.9 4 3HAVEN (MASON) 1 1.6 12 7HICKS (THURSTON) 1 6.2 7 3HORSESHOE (KITSAP) 0 N/A 1 0HORSESHOE (KITSAP) 1 3.6 8 7HUMMEL (SAN JUAN) 1 N/A 1 0ISABELLA (MASON) 1 0 5 3ISLAND (MASON) 1 2 9 8KI (SNOHOMISH) 2 0 8 5LACAMAS (CLARK) 1 2.4 7 5LAVENDER (KITTITAS) 0 N/A 2 0LAVENDER (KITTITAS) 1 N/A 4 0LELAND (JEFFERSON) 1 0 10 5LENORE (GRANT) 1 N/A 2 0LIMERICK (MASON) 1 1.3 10 7LIMERICK (MASON) 8 0 1 1LONG (KITSAP) 1 N/A 1 0

Appendix C. Median Evaluation 1997
Lake Station Median CV n1 n2
LONG (THURSTON) 1 1.4 14 10LOOMIS (PACIFIC) 1 0 11 7LOON (STEVENS) 0 N/A 2 0LOON (STEVENS) 1 0 10 7MARTHA (LAKE MARTHA) (SNOHO 1 0 12 11MARTHA (MARTHA LAKE) (SNOHO 1 1.8 9 2MASON (MASON) 2 3.1 9 9MASON (MASON) 3 2.9 8 7MASON (MASON) 4 0 11 10MILL CREEK (WALLA WALLA) 1 N/A 1 0MOUNTAIN (SAN JUAN) 1 N/A 1 0NAHWATZEL (MASON) 1 0 6 5NEWMAN (SPOKANE) 0 N/A 2 0NEWMAN (SPOKANE) 1 0.6 7 4OSOYOOS (OKANOGAN) 0 N/A 2 0OSOYOOS (OKANOGAN) 1 0 10 8PADDEN (WHATCOM) 1 N/A 1 0PALMER (OKANOGAN) 0 N/A 2 0PALMER (OKANOGAN) 1 2.6 7 6PATTISON (NORTH ARM) (THURS 1 6.4 10 5PHILLIPS (MASON) 1 0 8 7ROCK (WHITMAN) 0 N/A 1 0ROCK (WHITMAN) 1 N/A 1 0ROESIGER (NORTH ARM) (SNOHO 1 4 6 4ROESIGER (SOUTH ARM) (SNOHO 3 2 8 6ROSES (ALKALI) (CHELAN) 1 N/A 2 0SAMISH (EAST ARM) (WHATCOM) 1 2 8 5SAMISH (WEST ARM) (WHATCOM) 2 0 8 7SAWYER (KING) 1 N/A 5 0SILVER (SPOKANE) 1 1.1 7 6SPANAWAY (PIERCE) 1 0 13 2SPORTSMAN (SAN JUAN) 1 N/A 1 0ST. CLAIR (THURSTON) 1 2.5 14 13SULLIVAN (PEND OREILLE) 0 5.4 4 2SULLIVAN (PEND OREILLE) 1 2.6 3 1SUMMIT (THURSTON) 1 0 7 6SYLVIA (GRAYS HARBOR) 0 N/A 2 0SYLVIA (GRAYS HARBOR) 1 N/A 1 0TAPPS (PIERCE) 1 0 7 4TAPPS (PIERCE) 2 N/A 2 0TERRELL (WHATCOM) 1 N/A 1 0THOMAS (STEVENS) 1 0 10 7TIGER (KITSAP/MASON) 0 N/A 1 0TIGER (KITSAP/MASON) 1 4.2 10 8TOAD (EMERALD) (WHATCOM) 1 N/A 1 0

Appendix C. Median Evaluation 1997
Lake Station Median CV n1 n2
TRAILS END (MASON) 1 N/A 2 0WAPATO (CHELAN) 0 N/A 2 0WAPATO (CHELAN) 1 N/A 1 0WARD (THURSTON) 1 5.7 11 8WENATCHEE (CHELAN) 1 0 10 9WHATCOM (WHATCOM) 1 N/A 1 0WILDCAT (KITSAP) 1 0 4 2WILLIAMS (SPOKANE) 1 2.6 1 1WILLIAMS (STEVENS) 1 N/A 1 0WISER (WHATCOM) 1 3.9 1 1WOOTEN (MASON) 1 2.8 12 9WYE (KITSAP) 1 0 10 9

Appendix C. Precision Evaluation
This list contains Secchi pairs with CV > 10 percent for 1997. Only records where both readings were taken either with or without a view tube were evaluated (i.e., wtube1=wtube2). Entries with 'QC=TRUE' were not included.
Lake Sampler Date Secchi1 Secchi2 CV%
LONG (THURSTON) KATHEY WICOFF 97/05/10 6 7 11MASON (MASON) JIM SCOTT 97/10/04 15 18 13PATTISON (NORTH ARM) LORAINE VAA 97/05/20 3 2.5 13SAMISH (EAST ARM) (W A. B. DAVIS 97/06/18 18 24 20TAPPS (PIERCE) BRUCE COCHRAN 97/08/17 0.25 0.34 22TAPPS (PIERCE) BRUCE COCHRAN 97/08/31 0.5 0.67 21


Appendix D
Hydrolab Postcalibration Data for 1997


Appendix D. Hydrolab Postcalibration Data for 1997
Date Parameter Comparison Value Hydrolab ValuePostcalibration for the
following Lakes QA P/F5/16/97 DO field check 10.10 9.80 Sylvia P
pH 6.97 6.83 PpH 9.16 9.16 P
K (uS/cm) 100.90 110.50DO calibration 8.01 7.87 P
5/18/97 DO field check 9.85 10.00 Curlew PpH 7.01 7.07 PpH 9.25 9.25 P
DO calibration 9.61 8.90 F
5/19/97 DO field check 9.50 8.87 Tapps, McIntosh FpH 7.00 6.84 PpH 9.22 9.05 P
DO calibration 8.59 8.59 PK 96.40 100.90
T (oC) 22.70 22.12 P
DO field check 9.75 9.80 Osoyoos, Palmer, Conconully PpH 7.00 7.05 PpH 9.23 9.24 P
DO calibration 9.73 9.75 P
5/20/97 pH 6.98 7.01 Wapato, Roses PpH 9.27 9.25 P
DO calibration 10.89 10.87 P
5/21/97 DO field check 9.60 9.54 Island, Isabella PpH 7.00 6.94 PpH 9.24 9.18 P
DO calibration 9.01 8.99 P
DO field check 8.15 8.17 Lenore, Mill PpH 7.00 7.01 PpH 9.25 9.25 P
DO calibration 10.21 10.22 P
5/22/97 DO field check 9.54 9.24 Leland, Long (Kitsap) PpH 9.31 9.24 P
Appendix D. Hydrolab Postcalibration Data for 1997
Date Parameter Comparison Value Hydrolab ValuePostcalibration for the
following Lakes QA P/F5/22/97 DO calibration 9.04 9.08 P
DO field check 9.60 9.61 Silver, Clear PpH 6.98 6.93 PpH 9.20 9.12 P
DO calibration 9.23 9.13 P
5/26/97 DO field check 9.79 9.45 Wooten, Wye, Phillips FpH 7.00 6.99 PpH 9.21 9.20 P
DO calibration 9.75 9.82 P
5/27/97 DO field check 8.85 9.01 Limerick PpH 6.99 7.00 PpH 9.20 9.20 P
DO calibration 8.42 8.62 P
DO field check 9.90 9.79 Wenatchee, Fish PpH 6.99 7.01 PpH 9.20 9.22 P
DO calibration 9.24 9.51 P
5/28/97 DO field check 9.85 9.17 Lacamas, Trails End, Spanaway FpH 7.00 7.08 PpH 9.24 9.25 P
DO calibration 9.86 10.10 P
DO field check 10.15 9.96 Rock, Newman, Loon PpH 6.99 6.95 PpH 9.20 9.20 P
DO calibration 9.76 9.48 P
5/29/97 DO field check 9.15 9.90 Sullivan, Gillette, Thomas, Black FpH 6.99 6.98 PpH 9.21 9.23 P
DO calibration 9.40 9.50 P

Appendix D. Hydrolab Postcalibration Data for 1997
Date Parameter Comparison Value Hydrolab ValuePostcalibration for the
following Lakes QA P/F5/30/97 DO field check 9.40 9.31 Williams, Big Meadow, Deep P
pH 6.98 6.95 PpH 9.19 9.18 P
DO calibration 8.70 8.74 P
6/2/97 DO field check 11.50 9.12 Tiger FpH 6.99 6.90 PpH 9.17 9.21 P
DO calibration 9.49 9.58 P
6/3/97 DO field check 10.50 9.56 Bosworth, Roesiger FpH 6.99 7.01 PpH 9.24 9.23 P
DO calibration 10.00 10.00 P
6/4/97 pH 7.00 7.05 Samish, Ki PpH 9.24 9.26 P
DO calibration 10.49 10.48 P
6/10/97 DO field check 10.18 10.31 Toad, Padden PpH 6.98 6.98 PpH 9.19 9.19 P
DO calibration 8.42 8.46 P
6/11/97 DO field check 11.15 9.82 Whatcom, Terrell,Wiser, Alice FpH 6.99 6.98 PpH 9.23 9.42 P
DO calibration 9.24 9.19 P
6/12/97 DO field check 9.29 9.37 Lake Martha PpH 6.97 7.08 PpH 9.17 9.27 P
DO calibration 8.66 8.78 P
6/16/97 DO field check 8.78 9.02 Duck, Nahwatzel FpH 6.97 6.85 PpH 9.18 9.20 P
DO calibration 9.08 9.10 P

Appendix D. Hydrolab Postcalibration Data for 1997
Date Parameter Comparison Value Hydrolab ValuePostcalibration for the
following Lakes QA P/F6/17/97 pH 7.00 7.02 Sportsman P
pH 9.23 9.25 PDO calibration 8.20 8.38 P
8/15/97 DO field check 7.37 8.01 Sylvia FpH 6.96 6.86 PpH 9.14 9.11 P
8/17/97 DO field check 7.38 7.96 Crawfish FpH 6.98 7.00 PpH 9.19 9.18 P
8/18/97 DO field check 8.87 9.20 Cascade, Mountain FpH 6.98 7.05 PpH 9.18 9.33 P
DO field check 8.28 8.67 Osoyoos, Conconully, Palmer FpH 6.98 7.03 PpH 9.18 9.14 P
8/19/97 DO field check 3.45 3.60 Hummel, Sportsman PpH 7.00 6.91 P
DO field check 11.41 12.86 Wapato, Roses, Lenore FpH 6.97 6.99 PpH 9.16 9.15 P
8/20/97 DO field check 8.63 8.42 Tapps PpH 6.98 6.99 PpH 9.19 9.21 P
DO field check 7.39 7.70 Mill, Clear FpH 6.99 7.05 PpH 9.20 9.15 P
Appendix D. Hydrolab Postcalibration Data for 1997
Date Parameter Comparison Value Hydrolab ValuePostcalibration for the
following Lakes QA P/F8/21/97 DO field check 8.07 7.75 Duck, Loomis F
pH 6.98 6.97 PpH 9.19 9.21 P
8/24/97 DO field check 7.61 7.84 Lavender, Rock PpH 6.99 7.02 PpH 9.23 9.22 P
8/25/97 DO field check 8.23 8.4 Island, Nahwatzel, Isabella PpH 6.99 7.05 PpH 9.22 9.17 P
DO field check 5.92 6.33 Loon, Newman FpH 7.00 7.06 PpH 9.23 9.29 P
8/26/97 DO field check 7.99 8.25 Leland, Wildcat, Long PpH 6.99 6.92 PpH 9.18 9.14 P
DO field check 7.68 7.70 Curlew, Williams, Deep PpH 6.98 6.93 PpH 9.18 9.15 P
8/27/97 DO field check 7.80 8.16 Thomas, Gillette, Black FpH 6.99 7.04 PpH 9.23 9.23 P
8/28/97 DO field check 8.17 8.16 Sullivan, Big Meadow PpH 6.99 7.00 PpH 9.22 9.21 P
8/29/97 DO field check 7.79 8.06 Wenatchee, Fish PpH 6.97 6.86 PpH 9.18 9.12 P

Appendix D. Hydrolab Postcalibration Data for 1997
Date Parameter Comparison Value Hydrolab ValuePostcalibration for the
following Lakes QA P/F9/1/97 DO field check 8.03 8.48 Trails End, Phillips, Limerick, Mason F
pH 6.99 6.95 PpH 9.21 9.12 P
9/2/97 DO field check 10.69 11.38 Lacamas FpH 6.97 7.07 PpH 9.17 9.30 P
9/3/97 DO field check 8.22 8.81 Alice, Martha Lake FpH 6.98 6.92 PpH 9.18 9.13 P
9/4/97 DO field check 9.01 9.61 Samish, Lake Martha FpH 6.97 7.04 PpH 9.18 9.14 P
9/5/97 DO field check 11.51 12.19 Spanaway, Gravelly FpH 6.97 6.99 PpH 9.15 9.15 P
9/8/97 DO field check 8.80 8.89 Toad, Terrell, Wiser PpH 6.97 7.12 PpH 9.20 9.18 P
9/10/97 DO field check 8.64 8.65 Whatcom, Padden PpH 6.97 6.89 PpH 9.16 9.10 P
9/11/97 DO field check 8.15 9.00 Roesiger, Bosworth FpH 6.98 6.99 PpH 9.19 9.19 P
9/12/97 DO field check 7.51 8.05 Horseshoe, Bay, Wye FpH 6.97 7.00 PpH 9.18 9.15 P

Appendix D. Hydrolab Postcalibration Data for 1997
Date Parameter Comparison Value Hydrolab ValuePostcalibration for the
following Lakes QA P/F9/16/97 pH 7.00 7.01 Tiger, Woten, Haven P
pH 9.23 9.23 P