Embed Size (px)
Citation preview
Appendix B
Water Quality Modeling Using CE-QUAL-W2
Introduction CE-QUAL-W2 (W2) is a two dimensional, longitudinal/vertical, hydrodynamic, and water quality model. Because the model assumes lateral homogeneity, it is best suited for relatively long and narrow waterbodies exhibiting longitudinal and vertical water quality gradients (Cole 2003). Development and evolution of CE-QUAL-W2 has spanned three decades. The USACE, J.E. Edinger and Associates (Edinger), and Dr. Scott Wells at Portland State University working with Mr. Tom Cole (USACE), have been the major developers in recent years. Capabilities and Limitations The CE-QUAL-W2 model is capable of predicting water surface elevations, velocities, temperatures, and a number of water quality constituents. Water is routed through cells in a computational grid where each cell acts as a completely mixed reactor for each time-step. Geometrically complex waterbodies can be represented through multiple branches and cells. Multiple inflows and outflows to the waterbody are represented through point/nonpoint sources, branches, precipitation, and other methods. Tools for modeling hydraulic structures, such as spillways and pipes are available. Output from the model provides options for detailed and convenient analyses. The model uses several assumptions and approximations to simulate hydrodynamics, transport, and water quality processes. The model solves for gradients in the longitudinal and vertical directions and assumes lateral gradients are negligible. This assumption may be inappropriate for waterbodies with significant lateral variations. Turbulence is modeled through eddy coefficients of which the user must decide which scheme is most appropriate for an application. An algorithm for vertical momentum is not included and results may be inaccurate in waterbodies with significant vertical acceleration. Water quality processes are extremely complex and the model uses simplified approaches to reach solutions. Several water quality processes are not simulated including zooplankton, macrophytes, and a dynamic sediment oxygen demand (Cole, 2003). Input Data The model is limited by the quality and availability of input data. This includes meteorological, inflow and outflow, water temperature, water quality, and calibration data. These data most often determine the accuracy and usefulness of the application. Bathymetry
87
The bathymetry file of a CE-QUAL-W2 model is the two-dimensional numeric representation of a waterbody and is also referred to as the computational grid. The two dimensions represented are the longitudinal and vertical dimensions, or the length and depth of a waterbody which are divided into longitudinal segments and vertical layers. The lateral dimension, or width, is not represented in the grid but an average width is computed and used to determine volume. Since the model grid is two-dimensional, all modeled parameters such as temperature, velocity, and water quality constituents can only vary in the longitudinal and vertical directions. This assumes that modeled parameters do not vary significantly in the lateral direction. This assumption has been found appropriate in relatively long and narrow waterbodies. The components of the grid are from smallest to largest cells, segments, branches, and waterbodies. The cell is a single vertical layer within a single segment. Segments consist of one or more cells, branches are one or more longitudinal segments, and a waterbody is one or more branches. Bathymetry files are dimensions from a single waterbody. The volume of the grid is computed by multiplying a cell’s length, thickness, and width. The sum of all cells within the grid is then the total storage for the waterbody. The computational grid storage is compared to actual storage-capacity charts to verify the model bathymetry accuracy. Calibration Model calibration involves comparing observed data to modeled, or predicted, results. The observed values are typically vertical profile and reservoir discharge observations for temperature and other water quality parameters. Calibration statistics are generated by computing the absolute mean error (AME). This computation is the sum of the absolute value of the predicted value, minus the observed value divided by the total number of observations. This describes, on average, the difference between predicted and observed values. East Canyon Reservoir Model General Description The East Canyon model used to simulate the no action and action alternatives is built from a model calibrated to the historic time period 1991-2007. The time period 1991-2007 was chosen to calibrate the model to because of the availability of input and calibration data needed to support the model. The historic model simulates reservoir hydrodynamics, thermal stratification, nutrient cycling, and phytoplankton growth and decay. It is calibrated for water surface elevations, reservoir temperatures, dissolved oxygen, and nutrient concentrations over the simulation time period. The model uses a geometric, computational grid and various input data to simulate these processes. Model input data were collected by several agencies including the U.S. Geological Survey (USGS), DWQ, Reclamation, and WBWCD.
88
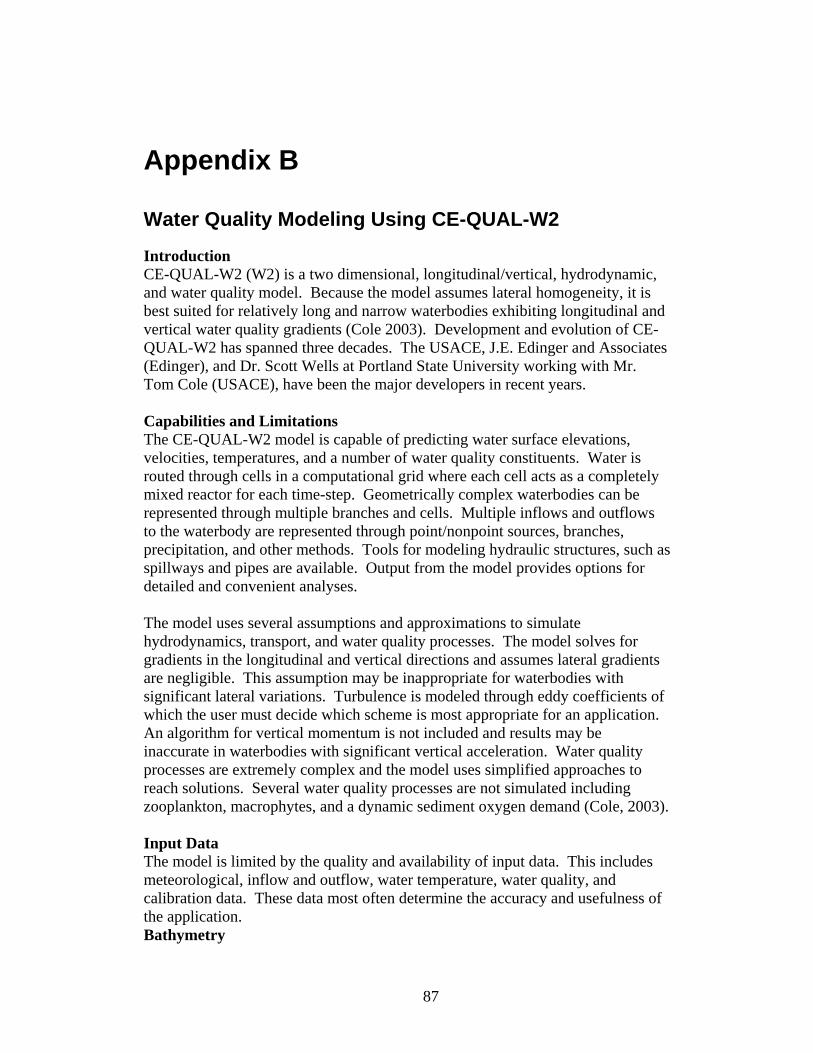
Model development and calibration were performed by the Water Quality Group, Upper Colorado Region, of the Bureau of Reclamation. Model development is an ongoing process and is continuously updated as new CE-QUAL-W2 versions are released, more data is made available and better methods of simulating hydrodynamics and water quality are established. The current East Canyon Reservoir W2 model generally reproduces hydrodynamic and water quality patterns and processes as observed historically, and is a useful tool for evaluating possible reservoir water quality associated with the action and no action alternatives. East Canyon Bathymetry The CE-QUAL-W2 computational grid was generated from a 2008 bathymetric survey of East Canyon Reservoir. It consists of 4 branches, 35 segments, and 64 layers. Each layer is 1 meter thick. The computational grid is displayed in plan, profile, and cross section views in Figure B-1. In the figure, green segments and cells are upstream boundaries, blue segments and cells are downstream boundaries, and red segments and cells are tributary branch connections.
89
Figure B-1: East Canyon Reservoir W2 Bathymetry (plan, profile, and cross section views) Modeling Assumptions The input data used in the model are the best available and are assumed to be accurate representations of meteorology, flow, and water quality parameters. Additional assumptions and the impacts to model accuracy and reliability are described below. Meteorology Meteorological data in the immediate vicinity of East Canyon Reservoir is not available during the time period of model simulation. The nearest site with hourly observations is the Salt Lake City International Airport, which is 22 miles southwest of the reservoir and sits at an elevation 1,500 feet below the reservoir. Additionally, the reservoir is an a narrow valley with mountains rising abruptly on all sides of the reservoir to elevations over 8,000 feet, while the airport is near the
90

north end of the 500 square mile Salt Lake Valley. Additional meteorological data was available beginning in 1999 at Snake Creek near Heber City, Utah, 30 miles south of East Canyon Reservoir. This site is situated in a valley at an elevation near that of East Canyon Reservoir, and the valley size is much more similar to East Canyon than the Salt Lake Valley. However, because East Canyon lacks hourly and even daily weather observations, it is impossible to determine if air and dewpoint temperature, wind speeds and directions, and cloud cover used in the model, are accurate representations of conditions at East Canyon Reservoir. The dataset used in the W2 model is adjusted based on statistical regressions of Salt Lake City International Airport and Snake Creek meteorological data. Wind directions are then further adjusted to the orientation of the East Canyon Reservoir valley. Additionally, numerous changes were made to the meteorological dataset and tests made to improve model accuracy. After several months, it was concluded that local conditions at East Canyon Reservoir varied enough from conditions at the Salt Lake Airport and Snake Creek, that collecting actual data near the reservoir would be needed to improve the dataset. Water Balance Daily inflows to East Canyon Reservoir are calculated by determining the difference between reservoir discharges and changes to reservoir storage. Reservoir discharge and storage changes are determined once a day. This method of calculating reservoir inflow, does not take into account fluctuations in pool elevation or discharge, evaporation, or seepage not captured by discharge measurements. During times of low flows in East Canyon Creek, this method also calculates a negative inflow to the reservoir. The W2 model inflow assumes a minimum flow rate of 5 cfs in East Canyon Creek inflows to the reservoir. The model is then calibrated to reproduce observed water surface elevations. An additional input known as the distributed tributary is created to handle the positive and negative flows needed to match the observed water surface elevations. These flows represent precipitation, ungaged flows, bank storage, and other source/sinks. CE-QUAL-W2 distributes this flow evenly over the water surface in a simulation. Large flows can have water quality impacts. Reasonable assumptions are made for assigning water quality constituent concentrations to these flows. Dam Discharge Water is discharged from East Canyon Dam through one of three features, a spillway, the outlet works, and a bypass. The spillway is an uncontrolled crest at elevation 5,705 feet. The outlet works withdraws water from an elevation of 5,535 feet. The bypass is at elevation 5,540.75 feet. Records of outflow from East Canyon Dam capture the total discharge and do not separate flows over or through the individual features. Properly capturing the points (spillway, outlet works, bypass, and seepage) and volume of discharges is an important part of accurately modeling the reservoir hydrodynamics. Guidelines were used to divide the total outflow between the individual features. Discharge over the spillway
91
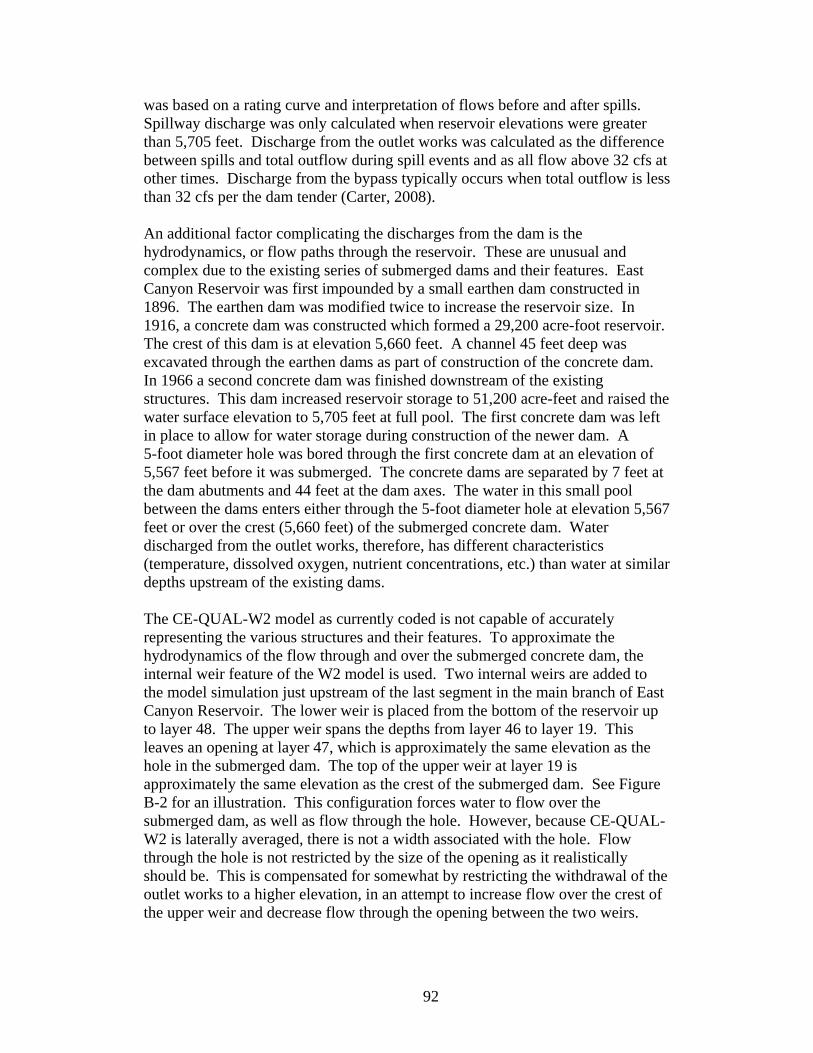
was based on a rating curve and interpretation of flows before and after spills. Spillway discharge was only calculated when reservoir elevations were greater than 5,705 feet. Discharge from the outlet works was calculated as the difference between spills and total outflow during spill events and as all flow above 32 cfs at other times. Discharge from the bypass typically occurs when total outflow is less than 32 cfs per the dam tender (Carter, 2008). An additional factor complicating the discharges from the dam is the hydrodynamics, or flow paths through the reservoir. These are unusual and complex due to the existing series of submerged dams and their features. East Canyon Reservoir was first impounded by a small earthen dam constructed in 1896. The earthen dam was modified twice to increase the reservoir size. In 1916, a concrete dam was constructed which formed a 29,200 acre-foot reservoir. The crest of this dam is at elevation 5,660 feet. A channel 45 feet deep was excavated through the earthen dams as part of construction of the concrete dam. In 1966 a second concrete dam was finished downstream of the existing structures. This dam increased reservoir storage to 51,200 acre-feet and raised the water surface elevation to 5,705 feet at full pool. The first concrete dam was left in place to allow for water storage during construction of the newer dam. A 5-foot diameter hole was bored through the first concrete dam at an elevation of 5,567 feet before it was submerged. The concrete dams are separated by 7 feet at the dam abutments and 44 feet at the dam axes. The water in this small pool between the dams enters either through the 5-foot diameter hole at elevation 5,567 feet or over the crest (5,660 feet) of the submerged concrete dam. Water discharged from the outlet works, therefore, has different characteristics (temperature, dissolved oxygen, nutrient concentrations, etc.) than water at similar depths upstream of the existing dams. The CE-QUAL-W2 model as currently coded is not capable of accurately representing the various structures and their features. To approximate the hydrodynamics of the flow through and over the submerged concrete dam, the internal weir feature of the W2 model is used. Two internal weirs are added to the model simulation just upstream of the last segment in the main branch of East Canyon Reservoir. The lower weir is placed from the bottom of the reservoir up to layer 48. The upper weir spans the depths from layer 46 to layer 19. This leaves an opening at layer 47, which is approximately the same elevation as the hole in the submerged dam. The top of the upper weir at layer 19 is approximately the same elevation as the crest of the submerged dam. See Figure B-2 for an illustration. This configuration forces water to flow over the submerged dam, as well as flow through the hole. However, because CE-QUAL-W2 is laterally averaged, there is not a width associated with the hole. Flow through the hole is not restricted by the size of the opening as it realistically should be. This is compensated for somewhat by restricting the withdrawal of the outlet works to a higher elevation, in an attempt to increase flow over the crest of the upper weir and decrease flow through the opening between the two weirs.
92
Upper Weir
Breach
Lower Weir
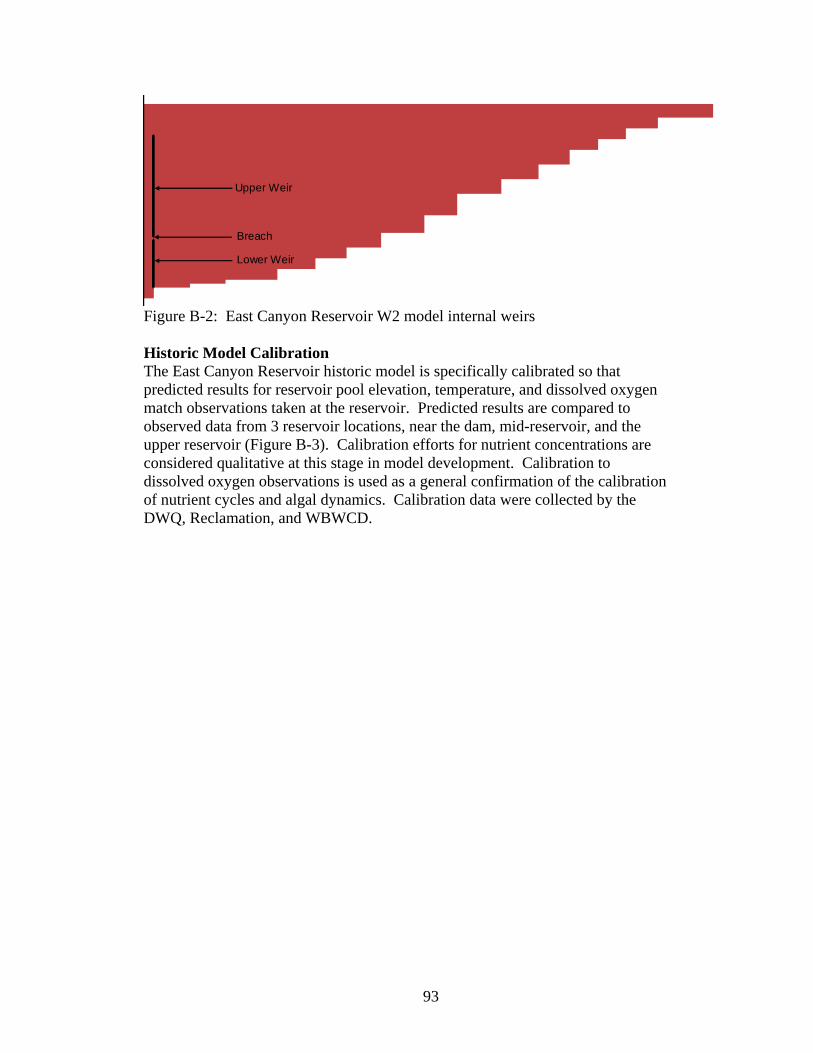
Figure B-2: East Canyon Reservoir W2 model internal weirs Historic Model Calibration The East Canyon Reservoir historic model is specifically calibrated so that predicted results for reservoir pool elevation, temperature, and dissolved oxygen match observations taken at the reservoir. Predicted results are compared to observed data from 3 reservoir locations, near the dam, mid-reservoir, and the upper reservoir (Figure B-3). Calibration efforts for nutrient concentrations are considered qualitative at this stage in model development. Calibration to dissolved oxygen observations is used as a general confirmation of the calibration of nutrient cycles and algal dynamics. Calibration data were collected by the DWQ, Reclamation, and WBWCD.
93
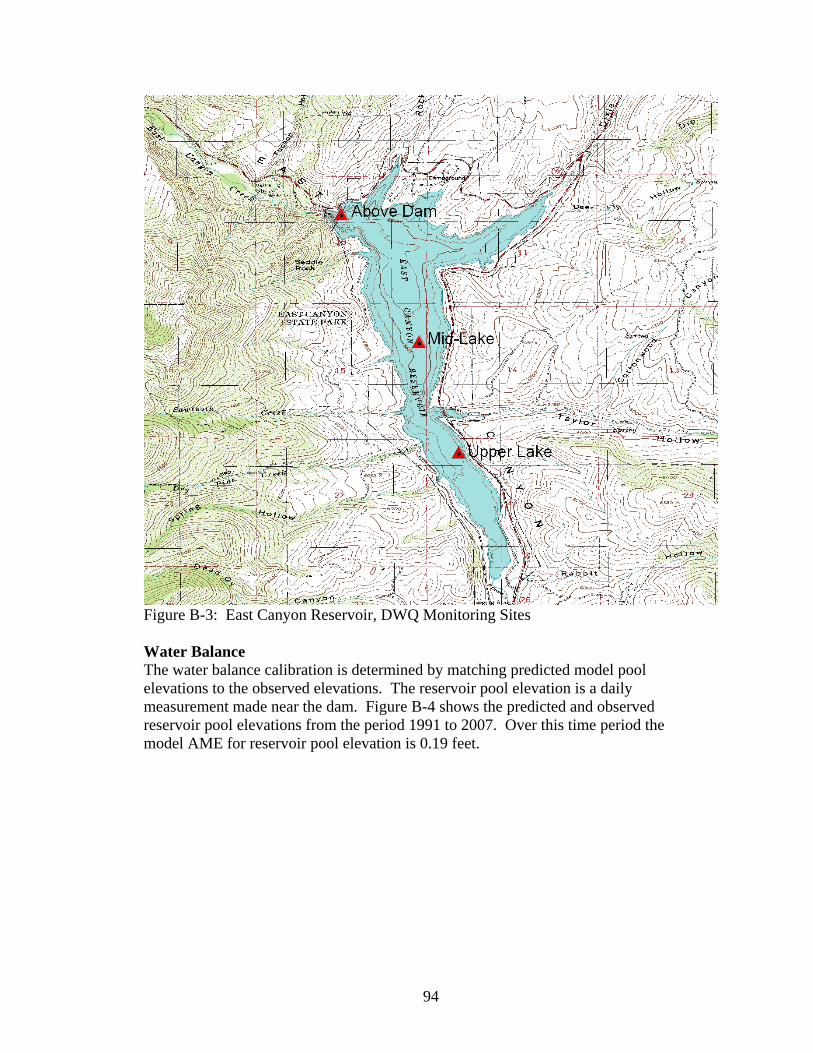
Figure B-3: East Canyon Reservoir, DWQ Monitoring Sites Water Balance The water balance calibration is determined by matching predicted model pool elevations to the observed elevations. The reservoir pool elevation is a daily measurement made near the dam. Figure B-4 shows the predicted and observed reservoir pool elevations from the period 1991 to 2007. Over this time period the model AME for reservoir pool elevation is 0.19 feet.
94
East Canyon Reservoir Historic Model Water Surface ElevationObserved & Modeled
5640
5650
5660
5670
5680
5690
5700
5710
Jan-91 Dec-92 Jan-95 Dec-96 Jan-99 Dec-00 Jan-03 Dec-04 Jan-07
Date, mmm-yy
Elev
atio
n, fe
et
Observed WSE
Model WSE
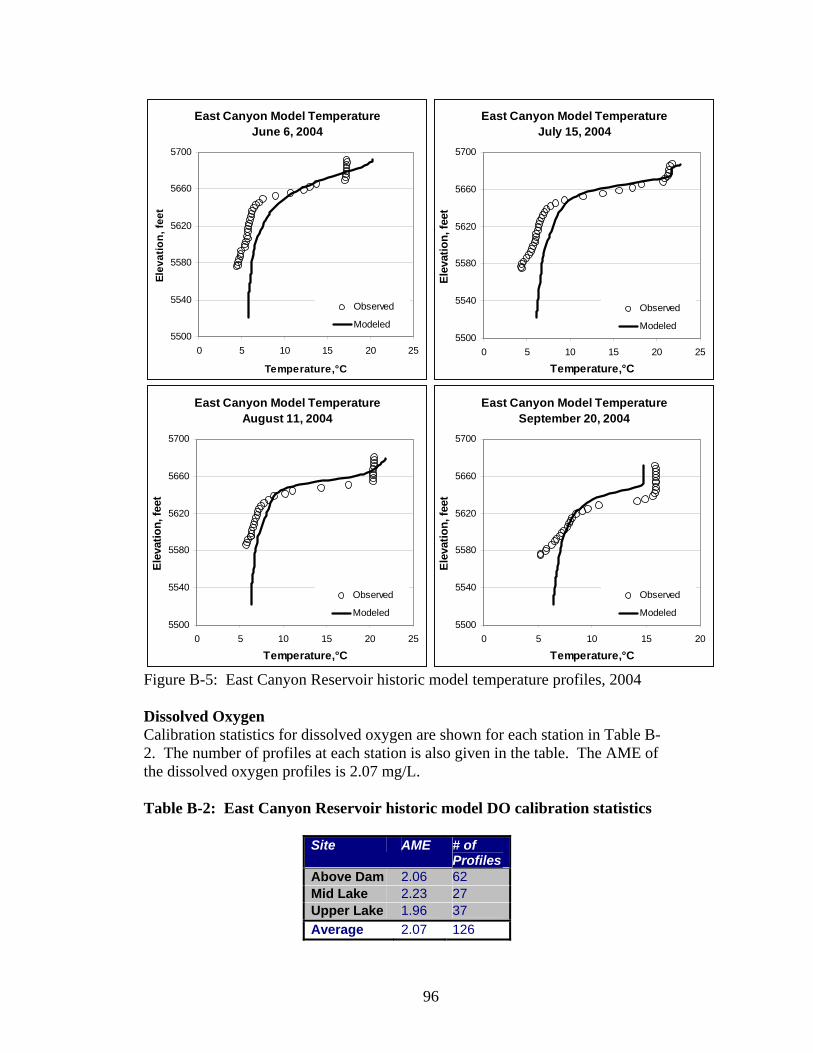
Figure B-4: East Canyon Reservoir historic model pool elevation vs. observed pool elevation, 1991-2007 Temperature Calibration statistics for temperature profiles are shown for each station in Table B-1. The number of profiles at each station is also reported in the table. The AME of the temperature profiles is 1.46°C. Table B-1: East Canyon Reservoir historic model temperature calibration statistics
Site AME # of Profiles
Above Dam 1.35 62 Mid Lake 1.55 27 Upper Lake 1.59 37 Average 1.46 126
There are a total of 126 temperature profiles from the three sampling stations in East Canyon Reservoir between 1992 and 2007. Figure B-5 displays model results compared to observed temperature profiles near the dam during 2004.
95
East Canyon Model TemperatureJune 6, 2004
5500
5540
5580
5620
5660
5700
0 5 10 15 20 25
Temperature,°C
Elev
atio
n, fe
et
Observed
Modeled
East Canyon Model TemperatureJuly 15, 2004
5500
5540
5580
5620
5660
5700
0 5 10 15 20 25
Temperature,°C
Elev
atio
n, fe
et
Observed
Modeled
East Canyon Model TemperatureAugust 11, 2004
5500
5540
5580
5620
5660
5700
0 5 10 15 20 25
Temperature,°C
Elev
atio
n, fe
et
Observed
Modeled
East Canyon Model TemperatureSeptember 20, 2004
5500
5540
5580
5620
5660
5700
0 5 10 15 20
Temperature,°C
Elev
atio
n, fe
et
Observed
Modeled
Figure B-5: East Canyon Reservoir historic model temperature profiles, 2004 Dissolved Oxygen Calibration statistics for dissolved oxygen are shown for each station in Table B-2. The number of profiles at each station is also given in the table. The AME of the dissolved oxygen profiles is 2.07 mg/L. Table B-2: East Canyon Reservoir historic model DO calibration statistics
Site AME # of Profiles
Above Dam 2.06 62 Mid Lake 2.23 27 Upper Lake 1.96 37 Average 2.07 126
96
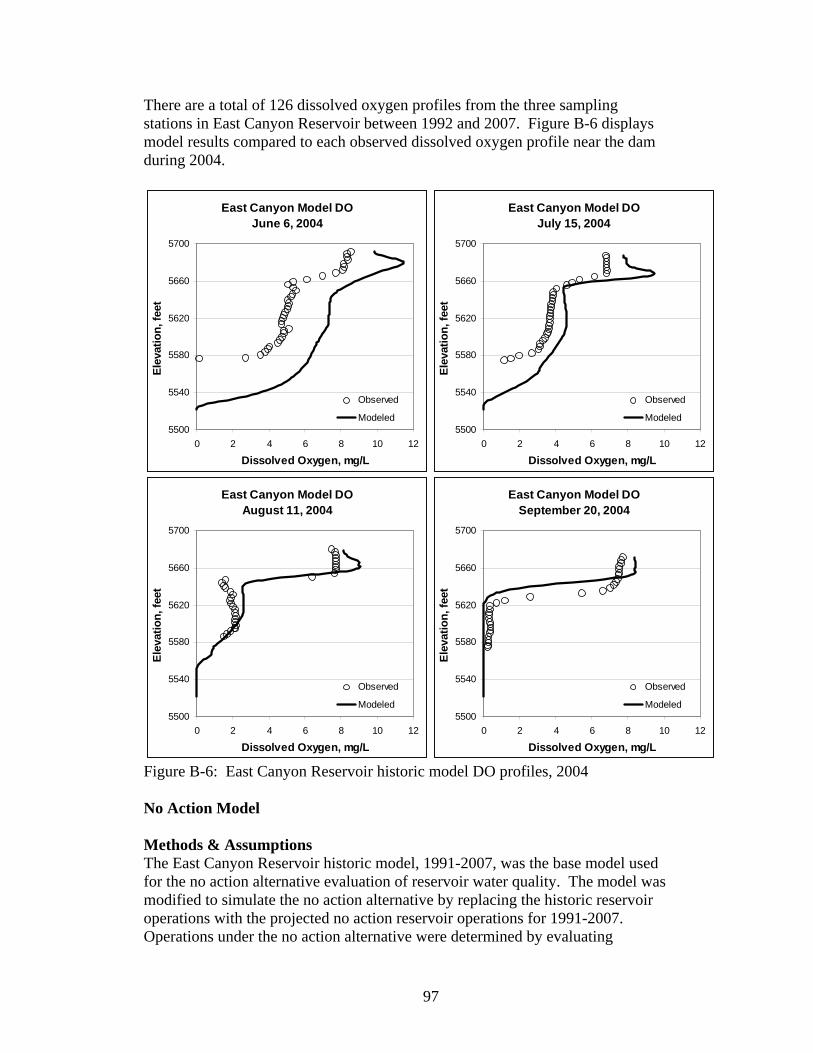
There are a total of 126 dissolved oxygen profiles from the three sampling stations in East Canyon Reservoir between 1992 and 2007. Figure B-6 displays model results compared to each observed dissolved oxygen profile near the dam during 2004.
East Canyon Model DOJune 6, 2004
5500
5540
5580
5620
5660
5700
0 2 4 6 8 10 12
Dissolved Oxygen, mg/L
Elev
atio
n, fe
et
Observed
Modeled
East Canyon Model DOJuly 15, 2004
5500
5540
5580
5620
5660
5700
0 2 4 6 8 10 12
Dissolved Oxygen, mg/LEl
evat
ion,
feet
Observed
Modeled
East Canyon Model DOAugust 11, 2004
5500
5540
5580
5620
5660
5700
0 2 4 6 8 10 12
Dissolved Oxygen, mg/L
Elev
atio
n, fe
et
Observed
Modeled
East Canyon Model DOSeptember 20, 2004
5500
5540
5580
5620
5660
5700
0 2 4 6 8 10 12
Dissolved Oxygen, mg/L
Elev
atio
n, fe
et
Observed
Modeled
Figure B-6: East Canyon Reservoir historic model DO profiles, 2004 No Action Model Methods & Assumptions The East Canyon Reservoir historic model, 1991-2007, was the base model used for the no action alternative evaluation of reservoir water quality. The model was modified to simulate the no action alternative by replacing the historic reservoir operations with the projected no action reservoir operations for 1991-2007. Operations under the no action alternative were determined by evaluating
97
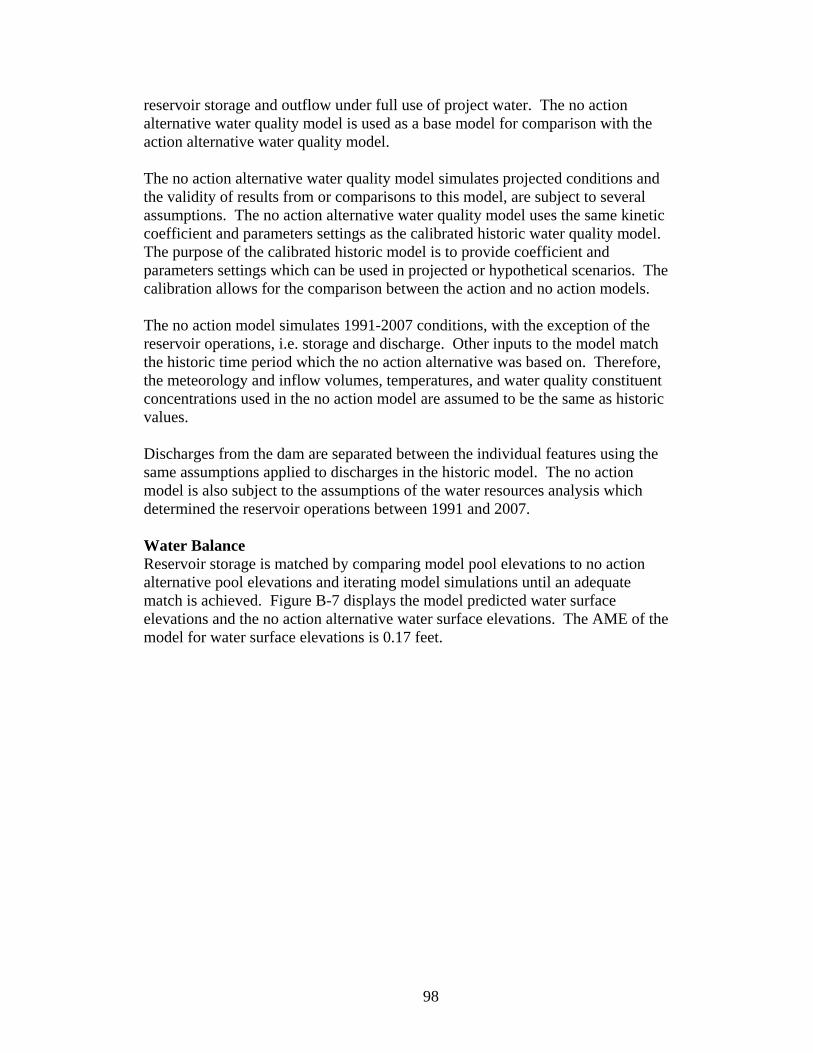
reservoir storage and outflow under full use of project water. The no action alternative water quality model is used as a base model for comparison with the action alternative water quality model. The no action alternative water quality model simulates projected conditions and the validity of results from or comparisons to this model, are subject to several assumptions. The no action alternative water quality model uses the same kinetic coefficient and parameters settings as the calibrated historic water quality model. The purpose of the calibrated historic model is to provide coefficient and parameters settings which can be used in projected or hypothetical scenarios. The calibration allows for the comparison between the action and no action models. The no action model simulates 1991-2007 conditions, with the exception of the reservoir operations, i.e. storage and discharge. Other inputs to the model match the historic time period which the no action alternative was based on. Therefore, the meteorology and inflow volumes, temperatures, and water quality constituent concentrations used in the no action model are assumed to be the same as historic values. Discharges from the dam are separated between the individual features using the same assumptions applied to discharges in the historic model. The no action model is also subject to the assumptions of the water resources analysis which determined the reservoir operations between 1991 and 2007. Water Balance Reservoir storage is matched by comparing model pool elevations to no action alternative pool elevations and iterating model simulations until an adequate match is achieved. Figure B-7 displays the model predicted water surface elevations and the no action alternative water surface elevations. The AME of the model for water surface elevations is 0.17 feet.
98
East Canyon Reservoir Model Water Surface ElevationNo Action Scenario
5560
5580
5600
5620
5640
5660
5680
5700
5720
Jan-91 Dec-92 Jan-95 Dec-96 Jan-99 Dec-00 Jan-03 Dec-04 Jan-07
Date, mmm-yy
Elev
atio
n, fe
et
No Action ScenarioWSEModel WSE
Figure B-7: East Canyon Reservoir No Action Alternative reservoir pool elevations, 1991-2007 Action Model Methods & Assumptions The East Canyon Reservoir historic model, 1991-2007, was the base model used for the action alternative evaluation of reservoir water quality. The model was modified to simulate the action alternative by replacing the historic reservoir operations with the projected action reservoir operations for 1991-2007. Operations under the action alternative were determined by evaluating reservoir storage, outflow, and full development of the 12,500 acre-foot diversion from East Canyon Reservoir plus pumping of 2 cfs, which is discharged to East Canyon Creek for instream flow purposes. Results from the action alternative water quality model are compared with the no action alternative for interpretation and conclusions. The action alternative water quality model simulates projected conditions and the validity of results from or comparisons to this model are subject to several assumptions. The action alternative model uses the same kinetic coefficient and parameters settings as the calibrated historic water quality model. The purpose of the calibrated historic model is to provide coefficient and parameter settings which can be used in projected or hypothetical scenarios. The calibration allows for the comparison between the action and no action models.
99
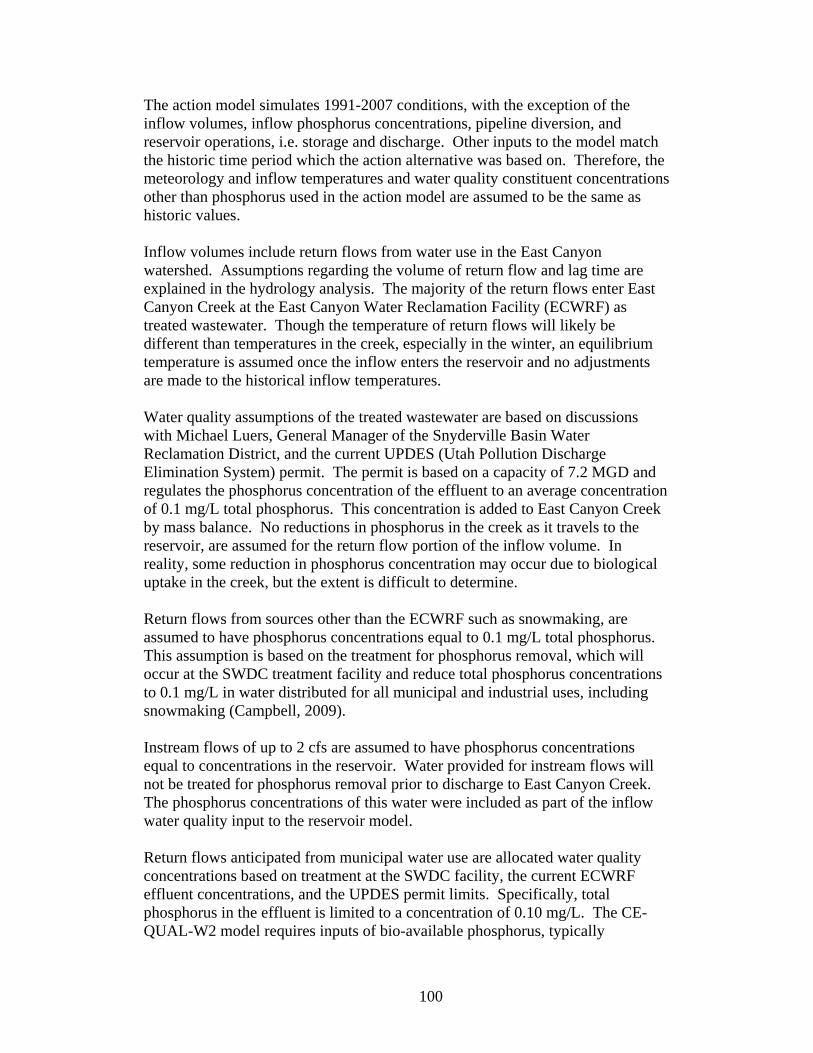
The action model simulates 1991-2007 conditions, with the exception of the inflow volumes, inflow phosphorus concentrations, pipeline diversion, and reservoir operations, i.e. storage and discharge. Other inputs to the model match the historic time period which the action alternative was based on. Therefore, the meteorology and inflow temperatures and water quality constituent concentrations other than phosphorus used in the action model are assumed to be the same as historic values. Inflow volumes include return flows from water use in the East Canyon watershed. Assumptions regarding the volume of return flow and lag time are explained in the hydrology analysis. The majority of the return flows enter East Canyon Creek at the East Canyon Water Reclamation Facility (ECWRF) as treated wastewater. Though the temperature of return flows will likely be different than temperatures in the creek, especially in the winter, an equilibrium temperature is assumed once the inflow enters the reservoir and no adjustments are made to the historical inflow temperatures. Water quality assumptions of the treated wastewater are based on discussions with Michael Luers, General Manager of the Snyderville Basin Water Reclamation District, and the current UPDES (Utah Pollution Discharge Elimination System) permit. The permit is based on a capacity of 7.2 MGD and regulates the phosphorus concentration of the effluent to an average concentration of 0.1 mg/L total phosphorus. This concentration is added to East Canyon Creek by mass balance. No reductions in phosphorus in the creek as it travels to the reservoir, are assumed for the return flow portion of the inflow volume. In reality, some reduction in phosphorus concentration may occur due to biological uptake in the creek, but the extent is difficult to determine. Return flows from sources other than the ECWRF such as snowmaking, are assumed to have phosphorus concentrations equal to 0.1 mg/L total phosphorus. This assumption is based on the treatment for phosphorus removal, which will occur at the SWDC treatment facility and reduce total phosphorus concentrations to 0.1 mg/L in water distributed for all municipal and industrial uses, including snowmaking (Campbell, 2009). Instream flows of up to 2 cfs are assumed to have phosphorus concentrations equal to concentrations in the reservoir. Water provided for instream flows will not be treated for phosphorus removal prior to discharge to East Canyon Creek. The phosphorus concentrations of this water were included as part of the inflow water quality input to the reservoir model. Return flows anticipated from municipal water use are allocated water quality concentrations based on treatment at the SWDC facility, the current ECWRF effluent concentrations, and the UPDES permit limits. Specifically, total phosphorus in the effluent is limited to a concentration of 0.10 mg/L. The CE-QUAL-W2 model requires inputs of bio-available phosphorus, typically
100
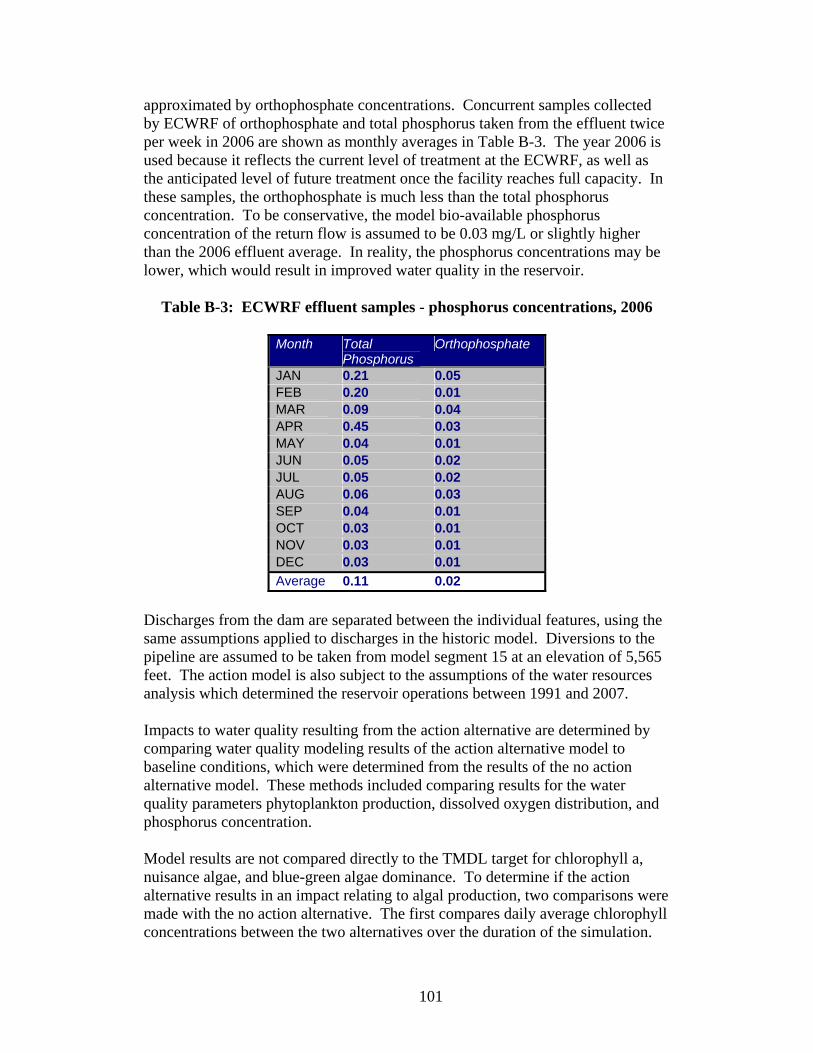
approximated by orthophosphate concentrations. Concurrent samples collected by ECWRF of orthophosphate and total phosphorus taken from the effluent twice per week in 2006 are shown as monthly averages in Table B-3. The year 2006 is used because it reflects the current level of treatment at the ECWRF, as well as the anticipated level of future treatment once the facility reaches full capacity. In these samples, the orthophosphate is much less than the total phosphorus concentration. To be conservative, the model bio-available phosphorus concentration of the return flow is assumed to be 0.03 mg/L or slightly higher than the 2006 effluent average. In reality, the phosphorus concentrations may be lower, which would result in improved water quality in the reservoir.
Table B-3: ECWRF effluent samples - phosphorus concentrations, 2006
Month Total Phosphorus
Orthophosphate
JAN 0.21 0.05 FEB 0.20 0.01 MAR 0.09 0.04 APR 0.45 0.03 MAY 0.04 0.01 JUN 0.05 0.02 JUL 0.05 0.02 AUG 0.06 0.03 SEP 0.04 0.01 OCT 0.03 0.01 NOV 0.03 0.01 DEC 0.03 0.01 Average 0.11 0.02
Discharges from the dam are separated between the individual features, using the same assumptions applied to discharges in the historic model. Diversions to the pipeline are assumed to be taken from model segment 15 at an elevation of 5,565 feet. The action model is also subject to the assumptions of the water resources analysis which determined the reservoir operations between 1991 and 2007. Impacts to water quality resulting from the action alternative are determined by comparing water quality modeling results of the action alternative model to baseline conditions, which were determined from the results of the no action alternative model. These methods included comparing results for the water quality parameters phytoplankton production, dissolved oxygen distribution, and phosphorus concentration. Model results are not compared directly to the TMDL target for chlorophyll a, nuisance algae, and blue-green algae dominance. To determine if the action alternative results in an impact relating to algal production, two comparisons were made with the no action alternative. The first compares daily average chlorophyll concentrations between the two alternatives over the duration of the simulation.
101
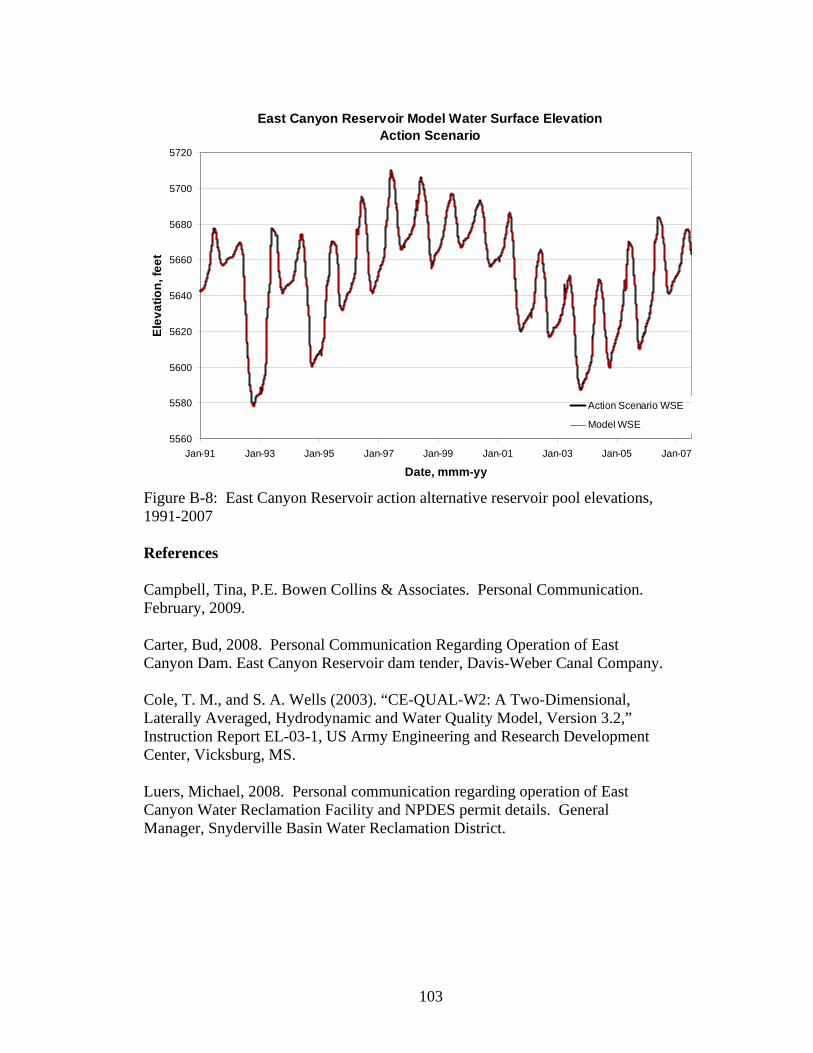
The second compares daily average blue-green algal biomass between the two alternatives over the duration of the simulation. The TMDL targets of dissolved oxygen are used to compare results from the action and no action alternatives. These results are generated by evaluating monthly profiles for the mixed and stratified periods. The three sample locations monitored by the DWQ during monitoring are used in the model to generate the profiles. The mixed periods were determined to be the months of January-April and November-December. The stratified periods were determined to be the months of May-October. During the mixed periods, the monthly profiles which failed to meet the targets were compared between the two alternatives. During the stratified periods, the profiles which failed to meet the targets were compared between the two alternatives. Daily average concentrations of dissolved phosphorus were compared between the two alternatives. Total phosphorus is not included as it is not an input in the model. Dissolved phosphorus is a component of total phosphorus; therefore, total phosphorus is at least as great as the dissolved component and is typically greater. Water Balance Reservoir storage is matched by comparing model pool elevations to action alternative pool elevations and iterating model simulations until an adequate match is achieved. Figure 3-7 displays the model predicted water surface elevations and the action alternative water surface elevations. The AME of the model for water surface elevations is 0.25 feet.
102
103
East Canyon Reservoir Model Water Surface ElevationAction Scenario
5560
5580
5600
5620
5640
5660
5680
5700
5720
Jan-91 Jan-93 Jan-95 Jan-97 Jan-99 Jan-01 Jan-03 Jan-05 Jan-07
Date, mmm-yy
Elev
atio
n, fe
et
Action Scenario WSE
Model WSE
Figure B-8: East Canyon Reservoir action alternative reservoir pool elevations, 1991-2007 References Campbell, Tina, P.E. Bowen Collins & Associates. Personal Communication. February, 2009. Carter, Bud, 2008. Personal Communication Regarding Operation of East Canyon Dam. East Canyon Reservoir dam tender, Davis-Weber Canal Company. Cole, T. M., and S. A. Wells (2003). “CE-QUAL-W2: A Two-Dimensional, Laterally Averaged, Hydrodynamic and Water Quality Model, Version 3.2,” Instruction Report EL-03-1, US Army Engineering and Research Development Center, Vicksburg, MS. Luers, Michael, 2008. Personal communication regarding operation of East Canyon Water Reclamation Facility and NPDES permit details. General Manager, Snyderville Basin Water Reclamation District.
![· 178 w2~uz− 179 w2~− 182 w2¶a 183 w2,v0 185 w2fl 186 w2,´‡ 187 w2,^M 188 w2,â 190 w2,˛− 195 w2,ðg− 196 w2,ðg! 198 w2,ð¾ 200 w2,ð−a 201 w2,ðgG Ž ]* Z˜ ß9ü](https://img.pdfslide.net/doc/110x75/5ec4169f9cf111271f3cdc4b/178-w2uza-179-w2a-182-w2a-183-w2v0-185-w2i-186-w2a-187-w2m-188.jpg)


![[Unlocked]2 Engineer Wale (ways Experi1ttetlL Station ( WES ) ICE-QUAL-W2j CWQUA1>W2 WORKING REPORT 023 REPORT CALS CALS CALS XML 7— Title [Unlocked]](https://img.pdfslide.net/doc/110x75/60eab5e1d284cc7d816c9464/unlocked-2-engineer-wale-ways-experi1ttetll-station-wes-ice-qual-w2j-cwqua1w2.jpg)