Embed Size (px)
Citation preview
ORIGINAL PAPER
Water quality of tropical reservoir based on spatio-temporalvariation in phytoplankton composition and physico-chemicalanalysis
W. O. Wan Maznah • A. Makhlough
Received: 1 August 2012 / Revised: 17 February 2014 / Accepted: 28 April 2014 / Published online: 15 May 2014
� Islamic Azad University (IAU) 2014
Abstract This study assessed the water quality of Men-
gkuang Reservoir, Penang, Malaysia, by its trophic status
according to a Carlson Modified Trophic Index (CMTSI)
and by its biological parameters using Shannon–Wiener
diversity index (H0) and saprobic index. The study con-
ducted from August 2005 to July 2006 showed that mean
values of CMTSI (nutrients), CMTSI (chlorophyll a) and
CMTSI (Secchi depth) were 27.18 ± 8.73, 40.63 ± 7.12
and 41.74 ± 6.38, respectively. The mean values of
CMTSI indicated that the reservoir was oligotrophic. Mean
value of H0 was 2.15 bits/individual, showing that the waterquality based on H0 value was in class III (slightly pol-
luted). Saprobic index value (2.24) also revealed that the
reservoir was moderately polluted (class II). The occur-
rence of Anabaena, Microcystis, Oscillatoria, Nostoc, Di-
nobryon, Chroococcus, Staurastrum paradoxum and
Mallomonas which are indicators of toxic and polluted
waters was also recorded. This study therefore showed the
importance of phytoplankton composition and community
structure as a reliable and important tool to assess the
degree of pollution in Mengkuang Reservoir. Long-term
assessments of biological and chemical parameters in the
reservoir are necessary, and phytoplankton community
structure as bioindicator provides unique information about
the ecosystem. This information is potentially useful as an
early warning sign of deteriorating condition and thus gives
insight into the overall ecology of lakes and will assist in
the future conservation and management of this lentic
ecosystem.
Keywords Trophic status � Shannon–Wiener diversity
index � Saprobic index � Mengkuang Reservoir � Malaysia
Introduction
Economic development in Malaysia has increased in the
recent 20 years. This development has been accompanied
with more land use, increase in population urbanization,
industrialization and the expansion of irrigated agriculture.
The quantity and quality of water supply are affected by
these factors and polluted by them (Ho 1994). Knowledge
of the current status of water conditions and determination
of its mechanism are prerequisites to devising a sound
solution to the problem (Le et al. 2010). The increasing of
population increases the demand for water, while fresh-
water resources are limited. Multiple reservoir uses and
human activities at the watershed change the nutrient
inputs that induce modifications of the reservoir’s trophic
status, biotic assemblages and chemical–physical condi-
tions (Molisani et al. 2010). Therefore, it is important to
protect the existing freshwater resources.
There are only two natural lakes in Malaysia, namely
Tasik Chini and Tasik Bera (Ali and Lee 1995). Man-made
lakes or reservoir dominates the Malaysian lentic envi-
ronment. In Malaysia, there are 63 large impoundments
with a total storage of 25 billion m3, ranging in size from
10 ha (Mahang dam) to 37,000 ha (Kenyir dam). The roles
W. O. Wan Maznah (&)
School of Biological Sciences, Universiti Sains Malaysia,
11800 Penang, Malaysia
e-mail: [email protected]
W. O. Wan Maznah
Centre for Marine and Coastal Studies (CEMACS), Universiti
Sains Malaysia, 11800 Penang, Malaysia
A. Makhlough
Ecology Department, Ecology Centre of the Caspian Sea,
Post box 961, 48471-53948 Sari, Mazandaran Province, Iran
123
Int. J. Environ. Sci. Technol. (2015) 12:2221–2232
DOI 10.1007/s13762-014-0610-3
of these dams are hydro-electric power generation, irriga-
tion, drinking water supply, fisheries and recreational and
tourist promotion (Ho 1994). Appropriate management and
monitoring of drinking water supply is crucial. Monitoring
of physico-chemical parameters is a routine water quality
assessment in drinking water supply in Malaysia (Azrina
et al. 2006). Chemical analysis has some inadequacy such
as time, cost and technical limitations (Wu et al. 2005).
Meanwhile, biological studies are able to provide contin-
uous temporal and spatial information in water ecosystem
without aforementioned limitations (Swaminathan 2003).
In Malaysia, biological monitoring in water supplies nor-
mally involved total coliform count for detection of fecal
pollution, while bloom of phytoplankton (eutrophication) is
important as well as fecal pollution in the reservoirs. High
phytoplankton density poses problems in drinking water
treatment processes and recreational activities. Therefore,
biomonitoring based on algal studies is necessary to pro-
vide sufficient information in water quality deterioration in
reservoirs (Yap 1997; Swaminathan 2003). The advantages
of employing algae in biomonitoring of aquatic environ-
ment are based on the fact that these organisms reflect the
concentration of physico-chemical parameters in the water
ecosystems (Zbikowski et al. 2007). Algal communities
quickly reflected environmental stressors because of their
short life cycles (McCormic and Cairns 1994). Therefore,
changes in the algal community can reflect the occurrence
of pollutants or other environmental stressors (Johnstone
et al. 2006), especially nutrients, which cause dramatic
increase in algae. This event led to low oxygen concen-
tration that affects other organisms in aquatic food chain
(Camargo and Alonso 2006).
Studies on water ecosystems in Malaysia have pro-
gressed in the last 30 years (Yeng 2006) through many
organizations which include local universities, government
departments, research centers and non-governmental
organizations (Ho 1994). Stobutzki et al. (2006) reported
that water quality deterioration and habitat modification in
Malaysia reduced the fish production to 4–20 % of the
original yields. Meor Hussain et al. (2002) studied water
quality parameters and distribution of zooplankton in
Chenderoh Reservoir which was built for power genera-
tion. They found that the reservoir, especially in embay-
ment area, was at risk of eutrophication event, because
some of the chemical and biological factors (chlorophyll,
primary productivity and nutrients) were increased com-
pared to earlier studies in the area.
However, a few studies have been conducted on water
quality in relation to distribution and species composition
of algae (Yap 1997; Wan Maznah and Mansor 2002). In
many European developed countries, the algological stud-
ies and the use of this branch of science in water supply
have increased (Stevenson and Smol 2003). In fact, the
growth of this science in waterworks practice shows the
importance of algal metabolism and algal events in relation
to physico-chemical parameters and water quality (Cam-
argo and Alonso 2006). Hence, Malaysia as a developing
country needs a comprehensive and continuous biological
monitoring of water supplies to predict and prevent the
occurrences of water pollution and eutrophication event
(Ho 1994), especially in drinking water supply. Therefore,
due to the importance of Mengkuang Reservoir as a supply
of drinking water in Penang State and lack of biological
study in this area, this reservoir was chosen to be studied.
This paper provides the first comprehensive evaluation
and scaling of the levels of the phytoplankton and physical
and chemical parameters in this reservoir using various
classification criteria. The research was undertaken from
August 2005 to July 2006, to provide detailed information
on the water quality of Mengkuang Reservoir, which was
located in the northeast of Penang Island, Peninsular
Malaysia, with emphasis on temporal trophic conditions in
surface layer. The Shannon–Wiener diversity index (H0)and saprobic index of phytoplankton were determined to
test its suitability as bioindicator of reservoir ecosystem
health.
Materials and methods
Study site and sample collection
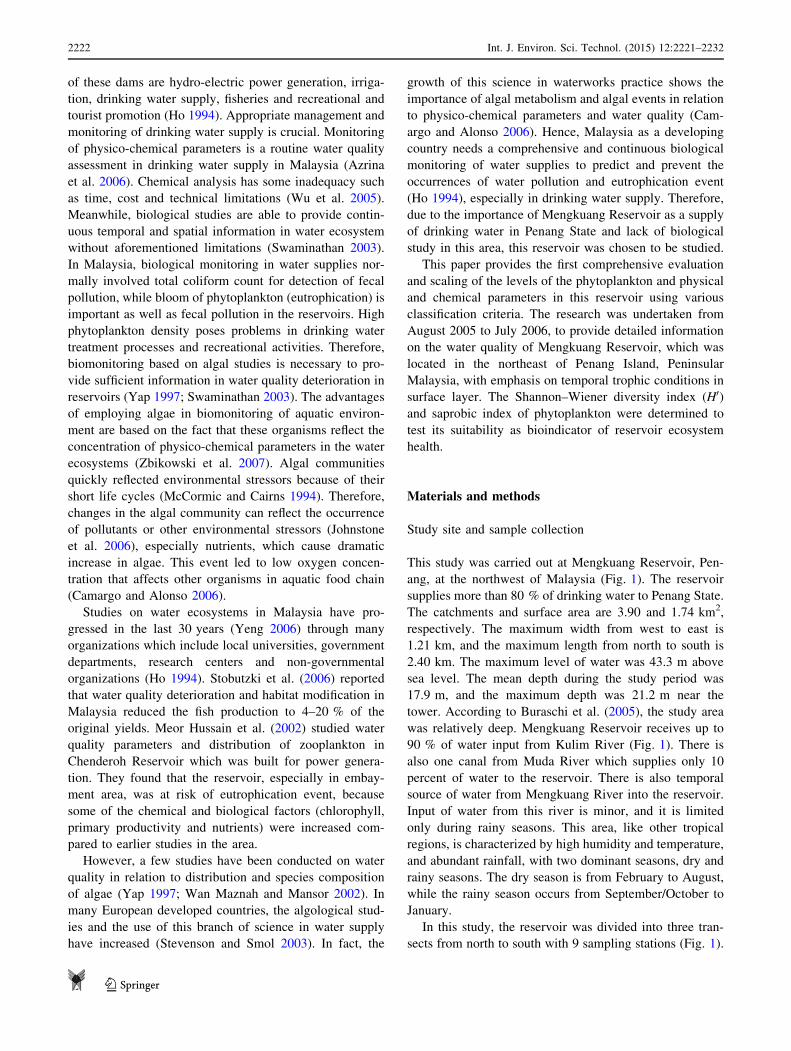
This study was carried out at Mengkuang Reservoir, Pen-
ang, at the northwest of Malaysia (Fig. 1). The reservoir
supplies more than 80 % of drinking water to Penang State.
The catchments and surface area are 3.90 and 1.74 km2,
respectively. The maximum width from west to east is
1.21 km, and the maximum length from north to south is
2.40 km. The maximum level of water was 43.3 m above
sea level. The mean depth during the study period was
17.9 m, and the maximum depth was 21.2 m near the
tower. According to Buraschi et al. (2005), the study area
was relatively deep. Mengkuang Reservoir receives up to
90 % of water input from Kulim River (Fig. 1). There is
also one canal from Muda River which supplies only 10
percent of water to the reservoir. There is also temporal
source of water from Mengkuang River into the reservoir.
Input of water from this river is minor, and it is limited
only during rainy seasons. This area, like other tropical
regions, is characterized by high humidity and temperature,
and abundant rainfall, with two dominant seasons, dry and
rainy seasons. The dry season is from February to August,
while the rainy season occurs from September/October to
January.
In this study, the reservoir was divided into three tran-
sects from north to south with 9 sampling stations (Fig. 1).
2222 Int. J. Environ. Sci. Technol. (2015) 12:2221–2232
123
The middle transect was located in the limnetic zone, from
the tower (the place where water withdrawal occurs) to the
end of the reservoir. Two other transects (littoral stations)
were at the west and east of the middle transect. Three
sampling stations established on the middle transect were
A2, B2 and C2 (Fig. 1). Station A2 with maximum depth
21.2 m and mean depth 17.9 m was near to the tower.
Station B2 located at the middle of the reservoir has
maximum and mean depths of 19.0 and 17.9 m, respec-
tively, and it is also far from fishing and other human
activities and thus was served as a reference station for this
study. In the south part, station C2 with the maximum and
Fig. 1 Geographical position of
Mengkuang Reservoir
Int. J. Environ. Sci. Technol. (2015) 12:2221–2232 2223
123
mean depths of 16.0 and 12.6 m, respectively, was the last
station of limnetic zone. Stations A1, B1 and C1 were
located in the west zone. Station C1 was situated near a
fishing site, thus representing a station with human activity.
Stations A3, B3 and C3 were located in the east zone and
surrounded by corridor vegetation. The maximum depth at
littoral stations was from 2 to 3.5 m.
Field samplings were carried out monthly from August
2005 to July 2006 for water quality variables and phyto-
plankton collection. The mean values of the variables and
parameters, namely chlorophyll a, total phosphorus, total
nitrogen and Secchi disk depth (SD), were used for the
computation of the Carlson Modified Trophic State Index
(CMTSI) (Sigua et al. 2006; Begliutti et al. 2007; Rob-
ertson et al. 2008: Offem et al. 2011). Chlorophyll a was
measured according to Boyd and Tucker (1992), while
in situ measurement of Secchi disk depth was taken using a
standard Secchi disk (22 cm diameter) (Wetzel 1995).
Unfiltered water samples were used to measure total
phosphorus by the ascorbic acid method (Boyd and Tucker
1992). Total nitrogen (TN) was determined from unfiltered
water samples using the reduction column and diazotiza-
tion method (Boyd and Tucker 1992). Water quality clas-
sification based on CMTSI was adapted from Begliutti
et al. (2007) and Molisani et al. (2010).
Phytoplankton samples were obtained by filtering four
liters of water through phytoplankton net with mesh size of
35 lm. The water was prefixed in 4 % formalin and Lu-
gol’s solution for further examination in the laboratory.
Microalgal enumeration was carried out by sedimentation
method in a counting chamber using inverted microscope
(Edler 1979; Lobban et al. 1998). Phytoplankton was
identified with the help of taxonomic keys, drawings and
descriptions given in Habit and Pankow (1976), Pentecost
(1984), Round et al. (1990), Nygaard (1991), Salleh (1996)
and Wehr and Sheath (2003). The relative numbers and
percentage of each phytoplankton species per unit volume
of water were calculated according to APHA (1998).
Statistical analysis
Importance species indices (ISIs) were calculated for each
taxon by multiplying the percent frequency of the taxon by
its average relative density. This index is preferable com-
paring average density since it reflects both the distribution
and abundance of a taxon in the ecosystem (Rushforth and
Brock 1991).
The concept of bioindicators and the specific saprobic
zone of algal species were used to assess the extent of
organic pollution in the reservoir and expressed in the form
of biotic index. The index of saprobic condition (S) was
calculated according to the index of saprobity suggested by
Pantle and Buck (1955). The Saprobian system employs
the concept of indicator species with the assumption that
the presence of certain species indicates a particular set of
environmental conditions. The concept defines the niche
space of an organism, that is, each organism has a partic-
ular set of environmental prerequisites essential to its sur-
vival. Classification of surface water based on saprobic
index (SI) values was according to Ansbaek and Valatka
(2001).
Species diversity for each site was determined using
Shannon–Wiener Index (H0) (Shannon and Weaver 1963;
Brower et al. 1998). A water quality classification based on
the diversity index of phytoplankton was applied according
to Wilhm and Dorris (1968), Wilhm (1970) and Kitsiou
and Karydis (2000). Based on the range of H0 values
obtained in this study, a five-class classification system was
computed to assess the water quality of the sampling sta-
tions during the study period. Pearson’s correlation was
performed to indicate relationships between physical and
biological parameters.
Prior to analysis, environmental variables were log-
transformed (log10 x) and algal density was log10 (x ?1)-
transformed (Zar 1974; Delong and Brusven 1993; Dixon
and Chiswell 1996). One-way ANOVA was used to detect
statistically significant differences in environmental
parameters and abundance of phytoplankton between
months and sampling stations. The t test (independent-
samples test) was used to test the difference in diatom
community structure between dry and wet seasons. The
principal component analysis (PCA) was used to under-
stand the correlation structure of the collected data and
identify the most important factors such as saprobic index,
phytoplankton community and the environmental parame-
ters contributing to the data structure (Padro et al. 1993).
PCA is also applied to find associations between parame-
ters so that the number of measured parameters can be
reduced. The calculation of PCA in R-mode was carried
out using Multivariate Statistical Package (MVSP), version
3.13d. PCA in Q-mode was carried out using SPSS.
Results and discussion
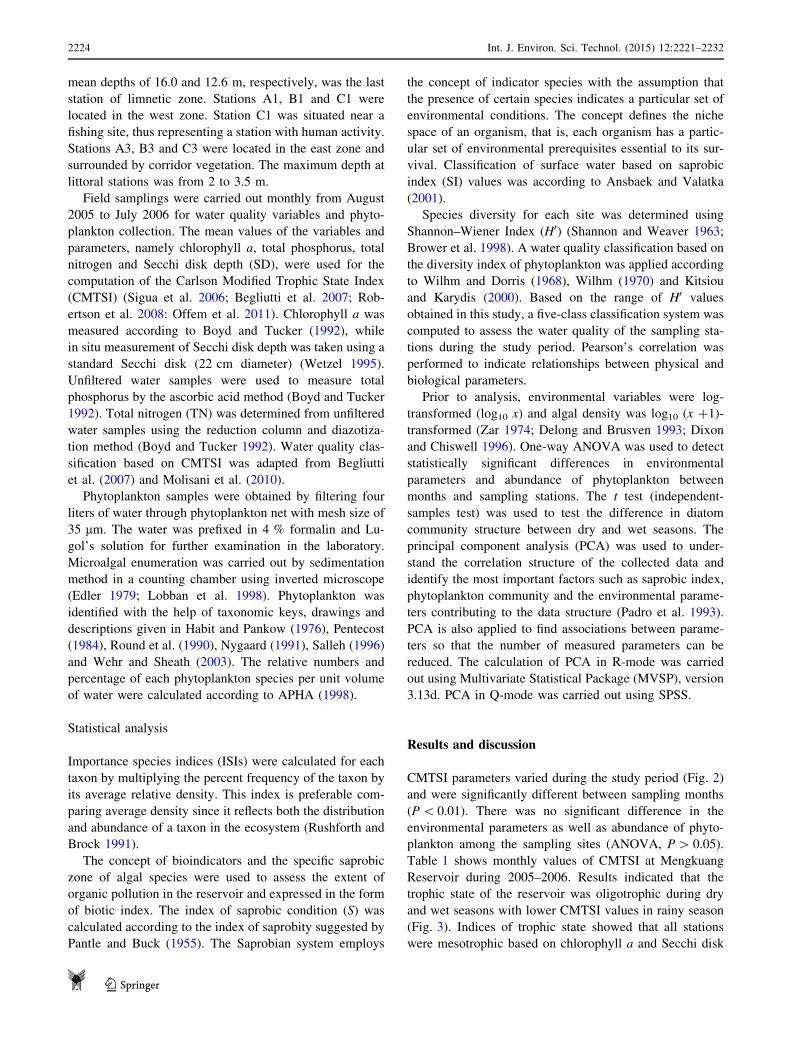
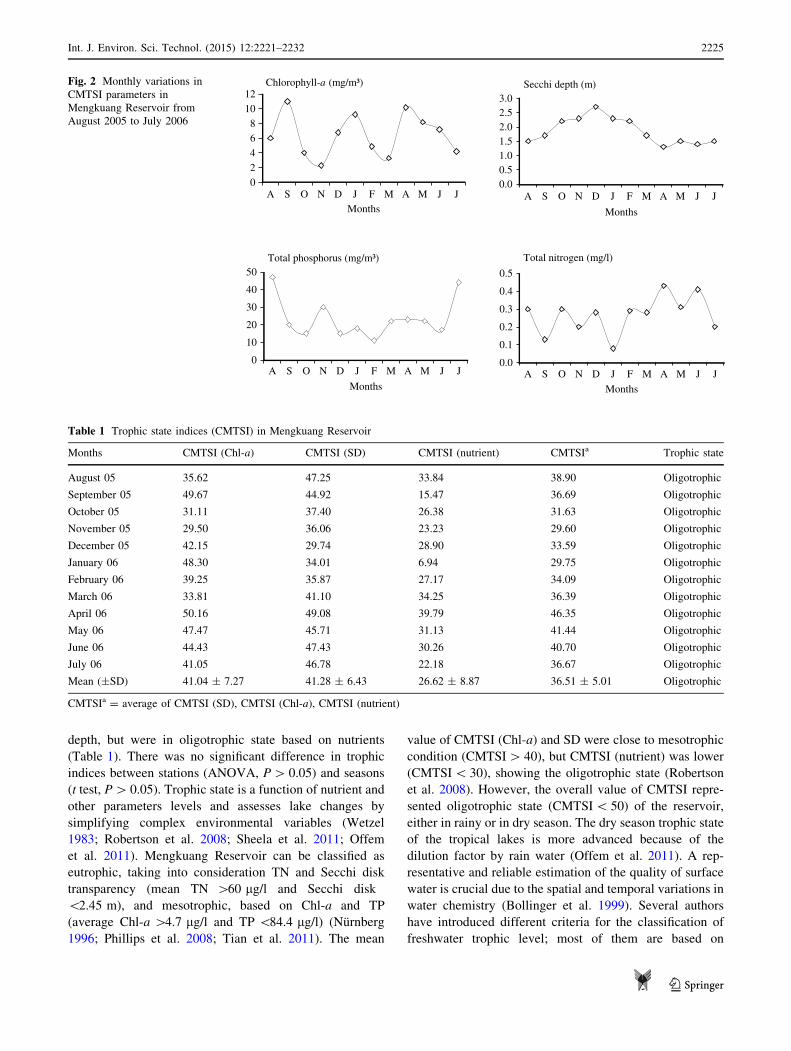
CMTSI parameters varied during the study period (Fig. 2)
and were significantly different between sampling months
(P\ 0.01). There was no significant difference in the
environmental parameters as well as abundance of phyto-
plankton among the sampling sites (ANOVA, P[ 0.05).
Table 1 shows monthly values of CMTSI at Mengkuang
Reservoir during 2005–2006. Results indicated that the
trophic state of the reservoir was oligotrophic during dry
and wet seasons with lower CMTSI values in rainy season
(Fig. 3). Indices of trophic state showed that all stations
were mesotrophic based on chlorophyll a and Secchi disk
2224 Int. J. Environ. Sci. Technol. (2015) 12:2221–2232
123
depth, but were in oligotrophic state based on nutrients
(Table 1). There was no significant difference in trophic
indices between stations (ANOVA, P[ 0.05) and seasons
(t test, P[ 0.05). Trophic state is a function of nutrient and
other parameters levels and assesses lake changes by
simplifying complex environmental variables (Wetzel
1983; Robertson et al. 2008; Sheela et al. 2011; Offem
et al. 2011). Mengkuang Reservoir can be classified as
eutrophic, taking into consideration TN and Secchi disk
transparency (mean TN [60 lg/l and Secchi disk
\2.45 m), and mesotrophic, based on Chl-a and TP
(average Chl-a [4.7 lg/l and TP \84.4 lg/l) (Nurnberg
1996; Phillips et al. 2008; Tian et al. 2011). The mean
value of CMTSI (Chl-a) and SD were close to mesotrophic
condition (CMTSI[ 40), but CMTSI (nutrient) was lower
(CMTSI\ 30), showing the oligotrophic state (Robertson
et al. 2008). However, the overall value of CMTSI repre-
sented oligotrophic state (CMTSI\ 50) of the reservoir,
either in rainy or in dry season. The dry season trophic state
of the tropical lakes is more advanced because of the
dilution factor by rain water (Offem et al. 2011). A rep-
resentative and reliable estimation of the quality of surface
water is crucial due to the spatial and temporal variations in
water chemistry (Bollinger et al. 1999). Several authors
have introduced different criteria for the classification of
freshwater trophic level; most of them are based on
02468
1012
A S O N D J F M A M J JMonths
Chlorophyll-a (mg/m³)
0.00.51.01.52.02.53.0
A S O N D J F M A M J J
Months
Secchi depth (m)
0
10
20
30
40
50
A S O N D J F M A M J J
Months
Total phosphorus (mg/m³)
0.0
0.1
0.2
0.3
0.4
0.5
A S O N D J F M A M J J
Months
Total nitrogen (mg/l)
Fig. 2 Monthly variations in
CMTSI parameters in
Mengkuang Reservoir from
August 2005 to July 2006
Table 1 Trophic state indices (CMTSI) in Mengkuang Reservoir
Months CMTSI (Chl-a) CMTSI (SD) CMTSI (nutrient) CMTSIa Trophic state
August 05 35.62 47.25 33.84 38.90 Oligotrophic
September 05 49.67 44.92 15.47 36.69 Oligotrophic
October 05 31.11 37.40 26.38 31.63 Oligotrophic
November 05 29.50 36.06 23.23 29.60 Oligotrophic
December 05 42.15 29.74 28.90 33.59 Oligotrophic
January 06 48.30 34.01 6.94 29.75 Oligotrophic
February 06 39.25 35.87 27.17 34.09 Oligotrophic
March 06 33.81 41.10 34.25 36.39 Oligotrophic
April 06 50.16 49.08 39.79 46.35 Oligotrophic
May 06 47.47 45.71 31.13 41.44 Oligotrophic
June 06 44.43 47.43 30.26 40.70 Oligotrophic
July 06 41.05 46.78 22.18 36.67 Oligotrophic
Mean (±SD) 41.04 ± 7.27 41.28 ± 6.43 26.62 ± 8.87 36.51 ± 5.01 Oligotrophic
CMTSIa = average of CMTSI (SD), CMTSI (Chl-a), CMTSI (nutrient)
Int. J. Environ. Sci. Technol. (2015) 12:2221–2232 2225
123
phosphorus, nitrogen compounds and chlorophyll a con-
centrations (e.g., Vollenwieder 1998; Wetzel 1983; Moli-
sani et al. 2010; Sheela et al. 2011). In January, CMTSI
(Chl-a) was relatively high, while CMTSI (nutrient)
recorded the lowest value. This may be due to consumption
of nutrients resulting from high abundance of phyto-
plankton, and chlorophyll a is a reliable measure of phy-
toplankton biomass (Behrenfeld and Boss 2006). Trophic
state index based on chlorophyll a has been found to be a
reliable means for quantifying trophic state in tropical lakes
(Offem et al. 2011).
The occurrence and relative abundance of certain phy-
toplankton species can be related to water quality and can
be indicators of water pollution (Wan Maznah and Mansor
2002; Unuoha et al. 2011), for example, Anabaena, Mi-
crocystis, Oscillatoria and Nostoc were rare in Mengkuang
Reservoir, but could be considered as potential toxic and
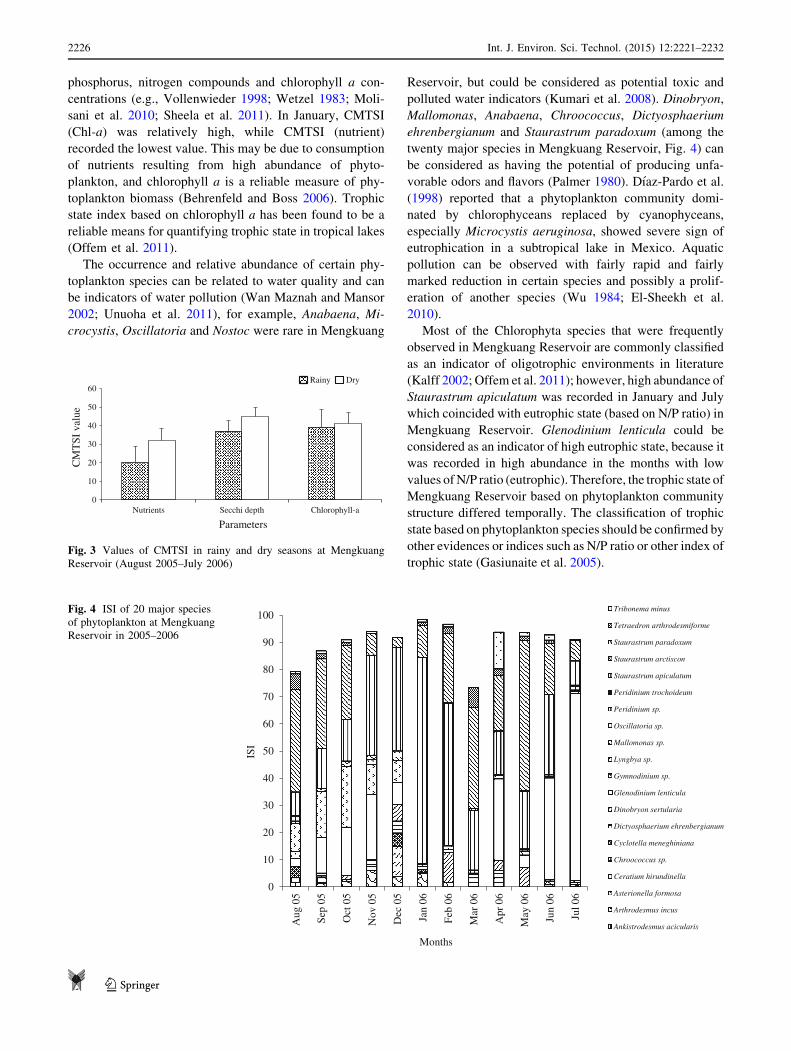
polluted water indicators (Kumari et al. 2008). Dinobryon,
Mallomonas, Anabaena, Chroococcus, Dictyosphaerium
ehrenbergianum and Staurastrum paradoxum (among the
twenty major species in Mengkuang Reservoir, Fig. 4) can
be considered as having the potential of producing unfa-
vorable odors and flavors (Palmer 1980). Dıaz-Pardo et al.
(1998) reported that a phytoplankton community domi-
nated by chlorophyceans replaced by cyanophyceans,
especially Microcystis aeruginosa, showed severe sign of
eutrophication in a subtropical lake in Mexico. Aquatic
pollution can be observed with fairly rapid and fairly
marked reduction in certain species and possibly a prolif-
eration of another species (Wu 1984; El-Sheekh et al.
2010).
Most of the Chlorophyta species that were frequently
observed in Mengkuang Reservoir are commonly classified
as an indicator of oligotrophic environments in literature
(Kalff 2002; Offem et al. 2011); however, high abundance of
Staurastrum apiculatum was recorded in January and July
which coincided with eutrophic state (based on N/P ratio) in
Mengkuang Reservoir. Glenodinium lenticula could be
considered as an indicator of high eutrophic state, because it
was recorded in high abundance in the months with low
values ofN/P ratio (eutrophic). Therefore, the trophic state of
Mengkuang Reservoir based on phytoplankton community
structure differed temporally. The classification of trophic
state based on phytoplankton species should be confirmed by
other evidences or indices such as N/P ratio or other index of
trophic state (Gasiunaite et al. 2005).
0
10
20
30
40
50
60
Nutrients Secchi depth Chlorophyll-a
CM
TSI
val
ue
Parameters
Rainy Dry
Fig. 3 Values of CMTSI in rainy and dry seasons at Mengkuang
Reservoir (August 2005–July 2006)
0
10
20
30
40
50
60
70
80
90
100
Aug
05
Sep
05
Oct
05
Nov
05
Dec
05
Jan
06
Feb
06
Mar
06
Apr
06
May
06
Jun
06
Jul 0
6
ISI
Months
Tribonema minus
Tetraedron arthrodesmiforme
Staurastrum paradoxum
Staurastrum arctiscon
Staurastrum apiculatum
Peridinium trochoideum
Peridinium sp.
Oscillatoria sp.
Mallomonas sp.
Lyngbya sp.
Gymnodinium sp.
Glenodinium lenticula
Dinobryon sertularia
Dictyosphaerium ehrenbergianum
Cyclotella meneghiniana
Chroococcus sp.
Ceratium hirundinella
Asterionella formosa
Arthrodesmus incus
Ankistrodesmus acicularis
Fig. 4 ISI of 20 major species
of phytoplankton at Mengkuang
Reservoir in 2005–2006
2226 Int. J. Environ. Sci. Technol. (2015) 12:2221–2232
123
According to ISI, there were 20 major species of phy-
toplankton in Mengkuang Reservoir for the period
2005–2006 (Fig. 4). Staurastrum paradoxum, Staurastrum
apiculatum, Glenodinium lenticula and Lyngbya sp.
showed the highest values of ISI and were the dominant
species during the study period. Diversity (H0) and even-
ness were slightly higher during the rainy season (Sep-
tember to December 2005, Table 2). Statistical analysis
indicated that H0 and evenness values were significantly
different between months (P[ 0.01), but were not spa-
tially significantly different (ANOVA, P[ 0.05). Based on
H0 values, most of the sampling stations were in class III
(slightly polluted) during rainy season and in class IV
(moderately polluted) and class V (polluted) during dry
season (Table 3). Overall water quality of Mengkuang
Reservoir based on H0 was in class III (slightly polluted)
(Table 3). Staurastrum paradoxum, Staurastrum apicula-
tum and Glenodinium lenticula that occurred in high
abundance during dry period could be indicators of pol-
luted waters.
Evenness and H0 decreased in July, due to high abun-
dance of one particular species (Glenodinium lenticula).
Tracanna et al. (2006) reported that population maximum
values are parallel with diversity minimum values, where
population growth is generally due to the excessive pro-
liferation of very few species. Offem et al. (2011) con-
cluded that the presence of species (quality enumeration) is
insufficient for the assessment of water quality, and the
whole community structure is important to characterize the
water condition. The percentage contribution of the dom-
inant species in structuring the community is also impor-
tant to supplement the importance of species composition
in defining the water conditions. Predominance of one
group or one particular species indicates a sign of possible
problem. In January and July 2006, a very high abundance
of certain species (Staurastrum apiculatum and Glenodi-
nium lenticula) indicated that the phytoplankton commu-
nity structure was not balanced biologically. In Mengkuang
Reservoir, high abundance of Pyrrophyta increased the
trophic state and the class of pollution in some stations
based on Shannon–Wiener diversity index (from class III to
IV and V, Table 3). Early detection of such condition can
therefore help in controlling these algae before any serious
problem emerges, and identification of species that have
the tendency to form bloom is useful to predict eutrophi-
cation. Bloom of Pyrrophyta in Malaysian reservoir has
been reported by Tan and Anton (1992) in Pansoon
Reservoir.
Diversity indices of microalgae have been used as an
indicator of the water quality and trophic status of aquatic
environments (Shanthala et al. 2009). In this study, diver-
sity index values showed moderate contamination of the
Table 2 Phytoplankton species diversity (H0), evenness and richness
in Mengkuang Reservoir in 2005–2006
Months Richness Evenness H0 (bits/individual)
August 05 47 0.573 2.40
September 05 59 0.580 2.71
October 05 55 0.624 2.80
November 05 52 0.581 2.59
December 05 49 0.604 2.76
January 06 58 0.254 1.28
February 06 52 0.327 1.75
March 06 48 0.390 1.85
April 06 51 0.597 2.54
May 06 44 0.387 1.77
June 06 36 0.400 1.70
July 06 48 0.213 1.60
Rainy 54.6 ± 3.7 0.529 ± 0.138 2.43 ± 0.58
Dry 46.6 ± 5.4 0.412 ± 0.134 1.94 ± 0.37
Table 3 Water quality classification based on phytoplankton Shannon–Wiener diversity index (H0) values in Mengkuang Reservoir from August
2005 to July 2006
Stations Aug 05 Sept 05 Oct 05 Nov 05 Dec 05 Jan 06 Feb 06 Mar 06 Apr 06 May 06 Jun 06 Jul 06
A1 IV III III III III II V III IV III IV III
A2 III IV III III III IV II III II IV III V
A3 III IV III III III IV III III II III III V
B1 IV III II III III III III III II III IV V
B2 II III III III III IV IV V III IV II IV
B3 II IV III III III III II III III IV III II
C1 III III II III III II I I III III III III
C2 IV III IV III III III IV IV III II II I
C3 II II III III III II IV II II IV IV III
Reservoir III III III III III III III III III III III III
I = excellent; II = good quality; III = slightly polluted; IV = moderately polluted; V = polluted
Int. J. Environ. Sci. Technol. (2015) 12:2221–2232 2227
123
reservoir (Salusso and Morana 2002) during the sampling
months (1\H0 \ 3, Table 3). This classification was
made based on the assumptions that the number of species
and diversity decreased in response to anthropogenic stress
(Stewart 1995; Offem et al. 2011), and a pollution stress
would simplify the structure of the community (Rogozin
2000). However, some researchers reported that species
richness and diversity increased under moderate stress
(Wan Maznah and Mansor 2002; Nather Khan ISA 1991;
Hill et al. 2000). Ho and Peng (1997)classified three rivers
in northern Peninsular Malaysia as slightly polluted (class
III) based on H0. They believed that communities with low
species diversity do not necessarily indicative of polluted
waters. Many studies concluded that the relationship
between diversity and environmental quality is complex
(Podani 1992), and the diversity changes can be related to
changes in water quality when the diversities of commu-
nities with similar species pool are compared (Stevenson
1984).
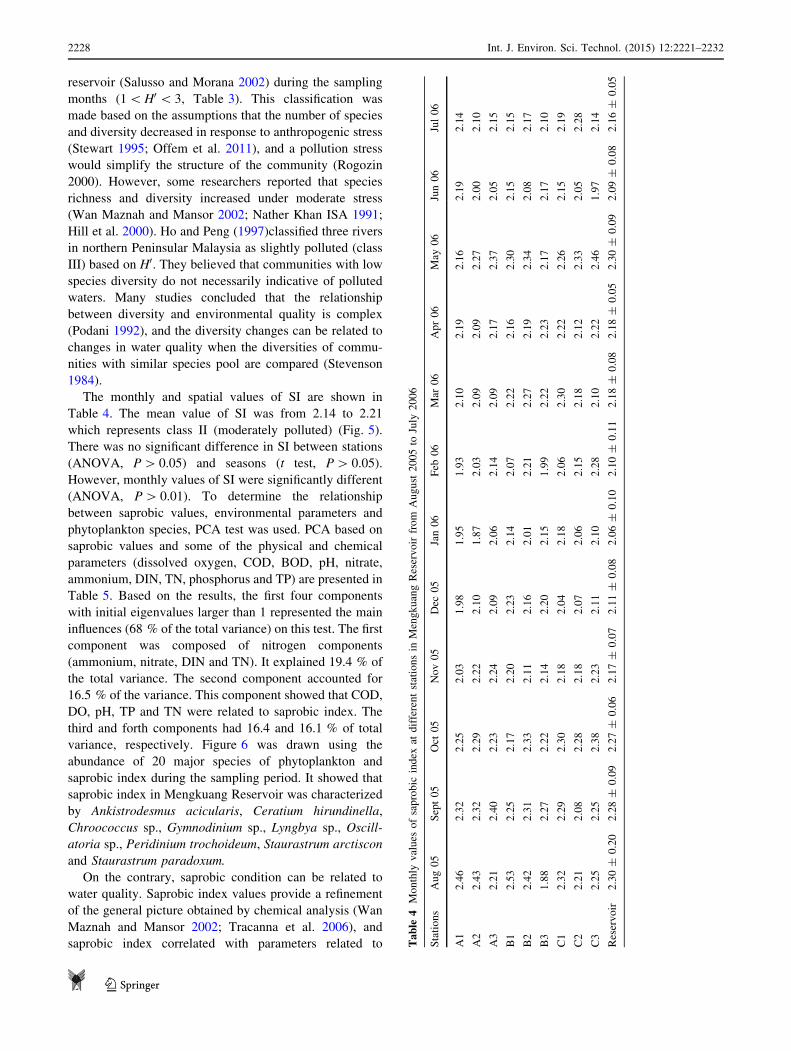
The monthly and spatial values of SI are shown in
Table 4. The mean value of SI was from 2.14 to 2.21
which represents class II (moderately polluted) (Fig. 5).
There was no significant difference in SI between stations
(ANOVA, P[ 0.05) and seasons (t test, P[ 0.05).
However, monthly values of SI were significantly different
(ANOVA, P[ 0.01). To determine the relationship
between saprobic values, environmental parameters and
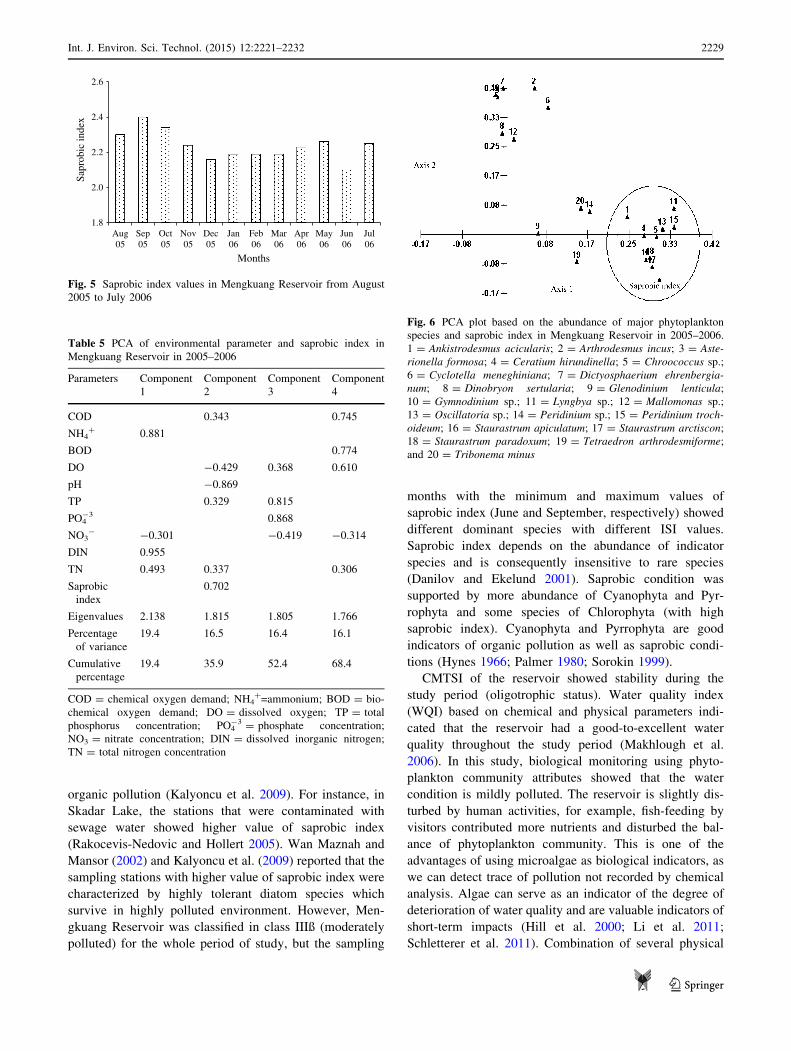
phytoplankton species, PCA test was used. PCA based on
saprobic values and some of the physical and chemical
parameters (dissolved oxygen, COD, BOD, pH, nitrate,
ammonium, DIN, TN, phosphorus and TP) are presented in
Table 5. Based on the results, the first four components
with initial eigenvalues larger than 1 represented the main
influences (68 % of the total variance) on this test. The first
component was composed of nitrogen components
(ammonium, nitrate, DIN and TN). It explained 19.4 % of
the total variance. The second component accounted for
16.5 % of the variance. This component showed that COD,
DO, pH, TP and TN were related to saprobic index. The
third and forth components had 16.4 and 16.1 % of total
variance, respectively. Figure 6 was drawn using the
abundance of 20 major species of phytoplankton and
saprobic index during the sampling period. It showed that
saprobic index in Mengkuang Reservoir was characterized
by Ankistrodesmus acicularis, Ceratium hirundinella,
Chroococcus sp., Gymnodinium sp., Lyngbya sp., Oscill-
atoria sp., Peridinium trochoideum, Staurastrum arctiscon
and Staurastrum paradoxum.
On the contrary, saprobic condition can be related to
water quality. Saprobic index values provide a refinement
of the general picture obtained by chemical analysis (Wan
Maznah and Mansor 2002; Tracanna et al. 2006), and
saprobic index correlated with parameters related to Table
4Monthly
values
ofsaprobic
index
atdifferentstationsin
MengkuangReservoirfrom
August
2005to
July
2006
Stations
Aug05
Sept05
Oct
05
Nov05
Dec
05
Jan06
Feb
06
Mar
06
Apr06
May
06
Jun06
Jul06
A1
2.46
2.32
2.25
2.03
1.98
1.95
1.93
2.10
2.19
2.16
2.19
2.14
A2
2.43
2.32
2.29
2.22
2.10
1.87
2.03
2.09
2.09
2.27
2.00
2.10
A3
2.21
2.40
2.23
2.24
2.09
2.06
2.14
2.09
2.17
2.37
2.05
2.15
B1
2.53
2.25
2.17
2.20
2.23
2.14
2.07
2.22
2.16
2.30
2.15
2.15
B2
2.42
2.31
2.33
2.11
2.16
2.01
2.21
2.27
2.19
2.34
2.08
2.17
B3
1.88
2.27
2.22
2.14
2.20
2.15
1.99
2.22
2.23
2.17
2.17
2.10
C1
2.32
2.29
2.30
2.18
2.04
2.18
2.06
2.30
2.22
2.26
2.15
2.19
C2
2.21
2.08
2.28
2.18
2.07
2.06
2.15
2.18
2.12
2.33
2.05
2.28
C3
2.25
2.25
2.38
2.23
2.11
2.10
2.28
2.10
2.22
2.46
1.97
2.14
Reservoir
2.30±
0.20
2.28±
0.09
2.27±
0.06
2.17±
0.07
2.11±
0.08
2.06±
0.10
2.10±
0.11
2.18±
0.08
2.18±
0.05
2.30±
0.09
2.09±
0.08
2.16±
0.05
2228 Int. J. Environ. Sci. Technol. (2015) 12:2221–2232
123
organic pollution (Kalyoncu et al. 2009). For instance, in
Skadar Lake, the stations that were contaminated with
sewage water showed higher value of saprobic index
(Rakocevis-Nedovic and Hollert 2005). Wan Maznah and
Mansor (2002) and Kalyoncu et al. (2009) reported that the
sampling stations with higher value of saprobic index were
characterized by highly tolerant diatom species which
survive in highly polluted environment. However, Men-
gkuang Reservoir was classified in class IIIß (moderately
polluted) for the whole period of study, but the sampling
months with the minimum and maximum values of
saprobic index (June and September, respectively) showed
different dominant species with different ISI values.
Saprobic index depends on the abundance of indicator
species and is consequently insensitive to rare species
(Danilov and Ekelund 2001). Saprobic condition was
supported by more abundance of Cyanophyta and Pyr-
rophyta and some species of Chlorophyta (with high
saprobic index). Cyanophyta and Pyrrophyta are good
indicators of organic pollution as well as saprobic condi-
tions (Hynes 1966; Palmer 1980; Sorokin 1999).
CMTSI of the reservoir showed stability during the
study period (oligotrophic status). Water quality index
(WQI) based on chemical and physical parameters indi-
cated that the reservoir had a good-to-excellent water
quality throughout the study period (Makhlough et al.
2006). In this study, biological monitoring using phyto-
plankton community attributes showed that the water
condition is mildly polluted. The reservoir is slightly dis-
turbed by human activities, for example, fish-feeding by
visitors contributed more nutrients and disturbed the bal-
ance of phytoplankton community. This is one of the
advantages of using microalgae as biological indicators, as
we can detect trace of pollution not recorded by chemical
analysis. Algae can serve as an indicator of the degree of
deterioration of water quality and are valuable indicators of
short-term impacts (Hill et al. 2000; Li et al. 2011;
Schletterer et al. 2011). Combination of several physical
1.8
2.0
2.2
2.4
2.6
Aug05
Sep05
Oct05
Nov05
Dec05
Jan06
Feb06
Mar06
Apr06
May06
Jun06
Jul06
Sapr
obic
inde
x
Months
Fig. 5 Saprobic index values in Mengkuang Reservoir from August
2005 to July 2006
Table 5 PCA of environmental parameter and saprobic index in
Mengkuang Reservoir in 2005–2006
Parameters Component
1
Component
2
Component
3
Component
4
COD 0.343 0.745
NH4? 0.881
BOD 0.774
DO -0.429 0.368 0.610
pH -0.869
TP 0.329 0.815
PO4-3 0.868
NO3- -0.301 -0.419 -0.314
DIN 0.955
TN 0.493 0.337 0.306
Saprobic
index
0.702
Eigenvalues 2.138 1.815 1.805 1.766
Percentage
of variance
19.4 16.5 16.4 16.1
Cumulative
percentage
19.4 35.9 52.4 68.4
COD = chemical oxygen demand; NH4?=ammonium; BOD = bio-
chemical oxygen demand; DO = dissolved oxygen; TP = total
phosphorus concentration; PO4-3 = phosphate concentration;
NO3 = nitrate concentration; DIN = dissolved inorganic nitrogen;
TN = total nitrogen concentration
Fig. 6 PCA plot based on the abundance of major phytoplankton
species and saprobic index in Mengkuang Reservoir in 2005–2006.
1 = Ankistrodesmus acicularis; 2 = Arthrodesmus incus; 3 = Aste-
rionella formosa; 4 = Ceratium hirundinella; 5 = Chroococcus sp.;
6 = Cyclotella meneghiniana; 7 = Dictyosphaerium ehrenbergia-
num; 8 = Dinobryon sertularia; 9 = Glenodinium lenticula;
10 = Gymnodinium sp.; 11 = Lyngbya sp.; 12 = Mallomonas sp.;
13 = Oscillatoria sp.; 14 = Peridinium sp.; 15 = Peridinium troch-
oideum; 16 = Staurastrum apiculatum; 17 = Staurastrum arctiscon;
18 = Staurastrum paradoxum; 19 = Tetraedron arthrodesmiforme;
and 20 = Tribonema minus
Int. J. Environ. Sci. Technol. (2015) 12:2221–2232 2229
123
and chemical parameters with biological monitoring is
essential to assess the degree of pollution and to reflect the
lake condition (Noges and Noges 2006). Since different
indices reveal different aspects of a water body, managers
of such a resource would be able to identify the source of
disturbance on a water body. Mengkuang Reservoir is at
the risk of anthropogenic source of pollution. The water
authorities should monitor any possible bloom of pollutant
or toxic species of phytoplankton (Oscillatoria sp. and
Lyngbya sp.), which are already occurred in the lake in
moderate abundance in certain months during the study
period. It is important to shift the environmental monitor-
ing from solely reliance on chemical indicators toward the
increasing use of biological condition (McCormic and
Cairns 1994; Yap 1997; O’Farrell et al. 2002; Kalyoncu
et al. 2009; Offem et al. 2011). Biomonitoring can be a tool
for quick and reliable identification of local impacts on
biota, which stay undetected using routine chemical and
physical monitoring (Danilov and Ekelund 2001). Under-
standing phytoplankton community structure provides
insight into the overall ecology of lakes and will assist in
the future conservation and management of this lentic
ecosystem (Salm et al. 2009).
The reservoir, being a source of drinking water, should
meet the criteria of good water quality and should be in low
level of pollution. A continuous biological monitoring
program will help the manager and local authority to
identify potential pollutants and toxic species in the area.
Conclusion
Mengkuang Reservoir was oligotrophic based on CMTSI.
However, the classification of water quality based on
diversity index (H0) of phytoplankton showed that the
reservoir was slightly polluted. Diversity index is a com-
munity structural analysis, so its application in environ-
mental monitoring should be supplemented by other
indices and parameters. Saprobic index also showed that
the reservoir was moderately polluted. Microalgal species
composition and abundance was a reliable and important
tool to assess the degree of pollution in Mengkuang Res-
ervoir. Long-term assessments of biological and chemical
parameters in the reservoir are necessary for an effective
prediction and management of excessive algal growth
(eutrophication).
Acknowledgments We thank the staffs and students of School of
Biological Sciences, Universiti Sains Malaysia (USM), for their help
in the field and laboratory analysis. Thanks are also due to Penang
Water Resource Authority (Perbadanan Bekalan Air (PBA), Pulau
Pinang) for their logistic support and for giving us basic information
on Mengkuang Reservoir. This research was funded by the Universiti
Sains Malaysia (USM) Short-term Research Grant (Grant No.
304/PBIOLOGI/637062). Asieh Makhlough was supported by Eco-
logical Academy of Caspian Sea, Iran, during her graduate studies in
USM.
References
Ali AB, Lee KY (1995) Chenderoh Reservoir, Malaysia: a charac-
terization of a small-scale, multigear and multispecies artisanal
fishery in the tropics. Fish Res 23:267–281
Ansbaek J, Valatka S (2001) Surface water classification and
implementation strategy. Danish Environmental Protection
Agency, DANCEE and the Ministry of Environment of Lithu-
ania, Technical Report No. 1.1, pp 54
APHA (American Public Health Association) (1998) Standard
methods for the examination of water and wastewater, 20th
edn, American Public Health Association
Azrina MZ, Yap CK, Ismail AR, Ismail A, Tan SG (2006)
Anthropogenic impacts on the distribution and biodiversity of
benthic macroinvertebrates and water quality of the Langat
River, Peninsular Malaysia. Ecotox Environ Safe 64:337–347
Begliutti B, Buscarinu P, Marras G, Sechi GM, Sulis A (2007)
Reservoirs water-quality characterization for optimization mod-
elling under drought conditions. Part 1—reservoirs trophic state
characterization. In: Rossi G, Vega T, Bonaccorso B (eds)
Methods and Tools for Drought Analysis and Management.
Springer, The Netherlands, pp 239–261
Behrenfeld MJ, Boss E (2006) Beam attenuation and chlorophyll
concentration as alternative optical indices of phytoplankton
biomass. J Mar Res 64:431–451
Bollinger JE, Steinberg LJ, Harrison MJ, Crews JP, Englande AJ,
Velasco-Gonzalez C, White LE, George WJ (1999) Comparative
analysis of nutrient data in the lower Mississippi River. Wat Res
33:2627–2632
Boyd CE, Tucker CS (1992) Water quality and pond soil analyses for
aquaculture. Auburn University, Birmingham, Alabama, Ala-
bama agricultural experiment station
Brower JE, Zar JH, von Ende CN (1998) Field and laboratory
methods for general ecology, 4th edn. WCB McGraw-Hill, New
York, p 273
Buraschi E, Salerno F, Monguzzi C, Barbiero B, Tartari G (2005)
Characterization of the Italian lake-types and identification of
their reference sites using anthropogenic pressure factors.
J Limnol 64(1):75–84
Camargo JA, Alonso A (2006) Ecological and toxicological effects of
inorganic nitrogen pollution in aquatic ecosystems: a global
assessment. Environ Int 32(6):831–849
Danilov RA, Ekelund NGA (2001) Comparative studies on the
usefulness of seven ecological indices for the marine coastal
monitoring close to the shore on the Swedish East Coast.
Environ Monit Assess 66:265–279
Delong MD, Brusven MA (1993) Storage and decomposition of
particulate organic matter along the longitudinal gradient of an
agriculturally-impacted stream. Hydrobiologia 258:77–88
Dıaz-Pardo E, Vazquez G, Lopez- Lopez E (1998) The phytoplankton
community as a bioindicator of health conditions of Atezca
Lake, Mexico. Aquat Ecosyst Health Manag 1:257–266
Dixon W, Chiswell B (1996) Review of aquatic monitoring program
design. Wat Res 30(9):1935–1948
Edler L (1979) Recommendations for marine biological studies in the
Baltic Sea. Phytoplankton and Chlorophyll. National Swedish
Environment Protection Board, pp 1–38
2230 Int. J. Environ. Sci. Technol. (2015) 12:2221–2232
123
El-Sheekh MM, Deyab MAI, Desouki SS, Eladl M (2010) Phyto-
plankton compositions as a response of water quality in El Salam
canal, Hadous drain and Damietta branch of River Nile, Egypt.
Pak J Bot 42(4):2621–2633
Gasiunaite ZR, Cardoso AC, Heiskanen AS, Henriksen P, Kauppila P,
Olenina I, Pilkaityte R, Purina R, Razinkovas I, Sagert A,
Schubert S, Wasmund N (2005) Seasonality of coastal phyto-
plankton in the Baltic Sea: influence of salinity and eutrophi-
cation. Est Coast Shelf Sci 65(1–2):239–252
Habit RN, Pankow H (1976) Algenoflora der Ostsee II. Gustav
Fischer Verlag, Jena University Rostock Publication, Germany,
Plankton
Hill BH, Herlihy AT, Kaufmann PR, Stevenson RJ, McCormick FH,
Johnson CB (2000) Use of periphyton assemblage data as an
index of biotic integrity. J N Am Benthol Soc 19(1):50–67
Ho SC (1994) Status of limnological research training in Malaysia. In:
D Dudgeon, PKS Lam (eds), Inland waters of tropical Asia and
Australia: conservation and management, Mitt Int Ver Limnol,
vol 24, pp 129–145
Ho SC, Peng T (1997) The use of river plankton and fish in the water
quality classification of Sungai Perai, Sungai Juru and Sungai
Perlis. J Ensearch 10:115–124
Hynes HBN (1966) The biology of polluted waters. Liverpool
University Press, UK
Johnstone C, Day JG, Staines H, Benson EE (2006) The development
of a 2,20-azinobis-(3-ethyl-benzothiazoline-6-sulfonic acid) rad-
ical cation decolourisation essay for evaluating total antioxidant
status in an alga used to monitor environmental impacts in urban
aquatic habitats. Ecol Indic 6(2):280–289
Kalff J (2002) Limnology of inland water ecosystems. Printed Hall,
New Jersey, USA, Upper Saddle River
Kalyoncu H, Cicek NL, Akkoz C, Yorulmaz B (2009) Comparative
performance of diatom indices in aquatic pollution assessment.
Afr J Agric Res 4(10):1032–1040
Kitsiou D, Karydis M (2000) Categorical mapping of marine
eutrophication based on ecological indices. Sci Total Environ
255:113–127
Kumari P, Dhadse S, Chaudhari PR, Wate SR (2008) A biomonitor-
ing of plankton to assess quality of water in the lakes of Nagpur
City. In: Sengupta M, Dalwani R (eds) Proceedings of Taal
2007: the 12th Lake conference, pp 160–164
Le C, Zha Y, Li Y, Sun D, Lu H, Yin B (2010) Eutrophication of lake
waters in China: cost, causes, and control. Environ Manag
45:662–668
Li Y, Li J, Liang Z, Yin W, Hu L, Shi J, Wang Y (2011) Planktonic
algae and epilithic algae in typical rivers of Danjingkou
Reservoir. Adv Mat Res 356–360:59–62
Lobban CS, Chapman DJ, Kremer BP (1998) An experimental
phycology laboratory manual. Cambridge University Press, UK
Makhlough A, Wan Maznah WO, Mansor M (2006) Water quality of
Mengkuang Dam based on WQI (Water Quality Index) model.
In: Proceedings of ICENV (International Conference of Envi-
ronment), pp 60
McCormic PVJ, Cairns JR (1994) Algae as indicators of environ-
mental change. J Appl Phycol 6:50–526
Meor Hussain MAF, Ahyaudin A, Amir Shah R, Shah M (2002) The
structure and dynamics of net-zooplankton communities of the
littoral versus limnetic zone of a typical embayment in a small
flow through tropical reservoir. J Biosains 13(2):23–34
Molisani MM, de Sousa Barroso H, Becker H, Moreira MOP, Hijo
CAG, do Monte TM, Vasconcellos GH (2010) Trophic state,
phytoplankton assemblages and limnological diagnosis of the
Castanhao Reservoir, CE Brazil. Acta Limnol Bras 22(1):1–12
Nather Khan ISA (1991) Effect of urban and industrial wastes on
species diversity of the diatom community in a tropical river,
Malaysia. Hydrobiologia 224:175–184
Noges and Noges (2006) Indicators and criteria to assess ecological
status of the large shallow temperate lakes Peipsi (Estonia/
Russia) and Vortsjarv (Estonia). Boreal Environ Res 11:67–80
Nurnberg GK (1996) Trophic state of clear and colored, soft- and
hardwater lakes with special consideration of nutrients, anoxia,
phytoplankton and fish, Lake. Reserv Manag 12:432–447
Nygaard G (1991) Seasonal periodicity of planktonic desmids in
oligotrophic lake Grane Langsø, Denmark. Hydrobiologia
211:195–226
O’Farrell I, Lombardo R, Tezanos PP, Loez C (2002) The assessment
of water quality in the lower Lujan river (Buenos Aires,
Argentina): phytoplankton and algal bioassays. Environ Pollut
120:207–218
Offem BO, Ayotunde EO, Ikpi GU, Ada FB, Ochang SN (2011)
Plankton-based assessment of the trophic state of three tropical
lakes. J Environ Protect 2:304–315
Padro R, Barrado E, Castrillejo Y, Valasco MA, Vaga M (1993)
Study of the contents and speciation of heavy metals in river
sediments by factor analysis. Anal Lett 26:1719–1739
Palmer CM (1980) Algae and water pollution. The identification,
significance, and control of Algae in water supplies and in
polluted water. Castle House Publication, London
Pantle R, Buck H (1955) Die biologische Uberwachung der Gewasser
und die Darstellung der Ergebnisse. Gas Wasserfach 96:604
Pentecost A (1984) Introduction to Freshwater Algae. Richmond
Publishing Co., Ltd., England
Phillips G, Pietilainen OP, Carvalho L, Solimini A, Solheim AL,
Cardoso AC (2008) Chlorophyll—nutrient relationships of
different lake types using a large European dataset. Aquat Ecol
42:213–226
Podani J (1992) Monitoring system. In: Kovacs M (ed) Biological
indicators in environmental protection. Ellis Horwood Series in
Environmental Management, Science and Technology, UK,
pp 12–18
Rakocevis-Nedovic J, Hollert H (2005) Phytoplankton community
and chlorophyll a as trophic state indices of Lake Skadar
(Montenegro, Balkan). Environ Sci Pollut R 12:146–152
Robertson DM, Schladow SG, Holdren GC (2008) Long-term
changes in the phosphorus loading to and trophic state of the
Salton, Sea, California. Hydrobiologia 604:21–36
Round FE, Crawford RM, Mann DG (1990) The Diatoms Biology
and Morphology of the Genera. Cambridge University Press,
Cambridge, p 747
Rushforth SR, Brock JT (1991) Attached diatom communities from
the lower Truckee River, summer and fall, 1986. Hydrobiologia
224:49–64
Salleh A (1996) Alga Air Tawar. Dewan Bahasa dan Pustaka Kuala
Lumpur, Ampang/Hulu Kelang, Selangor Darul Ehsan
Salm CR, Saros JE, Martin CS, Erickson JM (2009) Patterns of
seasonal phytoplankton distribution in prairie saline lakes on the
northern great plains (USA). Saline Syst 5:1–13
Salusso MM, Morana LB (2002) Comparison of indices in the
monitoring of two lotic systems in the northwest Argentina. Rev
Biol Trop 50:327–336
Schletterer M, Schonhuber M, Fureder L (2011) Biodiversity of
diatoms and macroinvertebrates in an east European lowland
river, the Tudovka River (Tver Region, Russia). Boreal Environ
Res 16:79–90
Shannon CE, Weaver W (1963) The Mathematical Theory of
Communication. University of Illinois Press, Urbana, p 117
Shanthala M, Hosmani S, Hosetti B (2009) Diversity of phytoplank-
ton in a waste stabilization pond at Shimoga Town, Karnataka
State, India. Environ Monit Assess 151:437–443
Sheela AM, Letha J, Joseph S, Ramachandran KK, Sanalkumar SP(2011) Trophic state index of a lake system using IRS (P6-LISS
III) satellite imagery. Environ Monit Assess 177(1–4):575–592
Int. J. Environ. Sci. Technol. (2015) 12:2221–2232 2231
123
Sigua GC, Williams MJ, Coleman SW, Starks R (2006) Nitrogen and
Phosphorus Status of Soils and Trophic State of Lakes Associ-
ated with Forage-Based Beef Cattle Operations in Florida.
J Environ Qual 35:240–252
Sorokin Y (1999) Aquatic microbial ecology, a textbook for students
in the environmental sciences. Backhuys Publishers, Leiden
Stevenson RJ (1984) Epilithic and epipelic diatoms in the Sandusky
River with emphasis on species diversity and water pollution.
Hydrobiologia 114:161–175
Stevenson RJ, Smol JP (2003) Use of algae in environmental
assessments. In: Wehr JD, Sheath RG (eds) Freshwater algae of
North America, ecology and classification. Academic Press,
USA, pp 775–804
Stewart PM (1995) Use of algae in aquatic pollution assessment. Nat
Area J 15(3):234–239
Stobutzki IC, Silvestre GT, Abu Talib A, Krongprom A, Supongpan
M, Khemakorn P, Armada N, Garces L (2006) Decline of
demersal coastal fisheries resources in three developing Asian
countries. Fish Res 78(2–3):130–142
Swaminathan MS (2003) Biodiversity: an effective safety net against
environmental pollution. Environ Pollut 126:287–291
Tan S, Anton A (1992) The ecology of dinoflagellate blooms in a
tropical reservoir. In: Hussein MY, Sajap AS, Japar SB (eds)
Status ecologi semasa menjelang 2020. Universiti Kebangsaan
Malaysia, Persidangan Ecology Malaysia, pp 169–172
Tian C, Pei H, Hu W, Xie J (2011) Assessment of trophic status for
Dongping Lake using comprehensive trophic state index and
diversity indices. Bioinformatics and biomedical engineering,
(iCBBE) 2011 5th international conference on, pp 1–4
Tracanna BC, Martınez de Marco SN, Amoroso MJ, Romero N,
Chaile P, Mangeaud A (2006) Physical, chemical and biological
variability in the Dr. C. Gelsi reservoir (NW Argentine): a
temporal and spatial approach. Limnetica 25(3):787–808
Unuoha PC, Nwankwo DI, Chukwu LO, Wim V (2011) Spatio-
temporal variations in phytoplankton biomass and diversity in a
tropical eutrophic lagoon, Nigeria. J Am Sci 7(8):33–46
Vollenwieder RA (1998) The scientific basis of lake and stream
eutrophication with particular reference to phosphorus and
nitrogen as eutrophication factors. OECD Tech Rep 27:1–182
Wan Maznah WO, Mansor M (2002) Aquatic pollution assessment
based on attached diatom communities in the Pinang River Basin
Malaysia. Hydrobiologia 487:229–241
Wehr JD, Sheath RG (2003) Freshwater algae of North America:
ecology and classification. Academic Press, New York, p 918
Wetzel RG (1983) Limnology. WB Saunders Co, Philadelphia
Wetzel RG (1995) Limnological Analyses, 2nd edn. Spring, New York
Wilhm JL (1970) Range of diversity index in benthic macro-
invertebrate populations. Water Poll Control Fed 42:221–224
Wilhm JL, Dorris TC (1968) Biological parameters for water quality
criteria. Bioscience 18:477–481
Wu JT (1984) Phytoplankton as bioindicator for water quality in
Taipei. Bot Bull Acad Sinica 25:205–214
Wu RSS, Siu WHL, Shin PKS (2005) Induction, adaptation and
recovery of biological responses: implications for environmental
monitoring. Mar Pollut Bull 51:623–634
Yap SY (1997) Classification of a Malaysian river using biological
indices: a preliminary attempt. Environmentalist 17(2):79–86
Yeng CK (2006) A study on limnology and phytoplankton biodiver-
sity of Ahning Reservoir. Dissertation, University Sains Malay-
sia, Kedah
Zar JH (1974) Biostatistical analysis, 1st edn. Prentice-Hall Inc, New
York, p 620
Zbikowski R, Szefer P, Latala A (2007) Comparison of green algae
Cladophora sp. and Enteromorpha sp. as potential biomonitors
of chemical elements in the Southern Baltic. Sci Total Environ
387:320–332
2232 Int. J. Environ. Sci. Technol. (2015) 12:2221–2232
123