Embed Size (px)
Citation preview
March21,1999 Price: $2.80
Division of Geological & Geophysical Surveys
PUBLIC-DATA FILE 99-21
WATER QUALITY STUDY OF RICHARDSON CLEARWATER CREEK NEAR BIG DELTA, ALASKA
Mary A. Maurer Alaska Division of Mining & Water Management
Alaska Hydrological Survey
March 1999
THIS REPORT HAS NOT BEEN REVIEWED FOR TECHNICAL CONTENT (EXCEPT AS NOTED IN TEXT) OR FOR
CONFORMEY TO THE EDITORIAL STANDARDS OF DGGS.
Released by
STATE OF ALASKA DEPARTMENT OF NATURAL RESOURCES
Division of Geological & Geophysical Surveys 794 University Avenue, Suite 200
Fairbanks, Alaska 99709-3645

TABLE OF CONTENTS Page
Introduction .............................................................................................................................. 1 Acknowledgments .................................................................................................................... 2 Methods ................................................................................................................................... 2 Results and Discussion ............................................................................................................. 3
..................................................................................................... Chemical Water Quality 3 Biological Water Quality .................................................................................................... 5
Conclusions .............................................................................................................................. 6 References Cited ...................................................................................................................... 6 Appendix: U.S. Geological Survey water-quality data for the Delta River and Tanana
Rivers ................................................................................................................................. 9
FIGURES
..... Figure 1 . Location of the Richardson Clearwater Creek study area near Big Delta. Alaska 10 ................... Figure 2 . Location of sampling sites. Richardson Clearwater Creek area. Alaska 11
............. Figure 3 . Water temperature at three Richardson Clearwater Creek sites during 1983 12 Figure 4 . Trilinear diagram of water analyses from eight sites in the Richardson
................................................................................. Clearwater Creek area. 1983 13 ............... Figure 5 . Trilinear diagram of surface-water analyses in the Big Delta area. Alaska 14
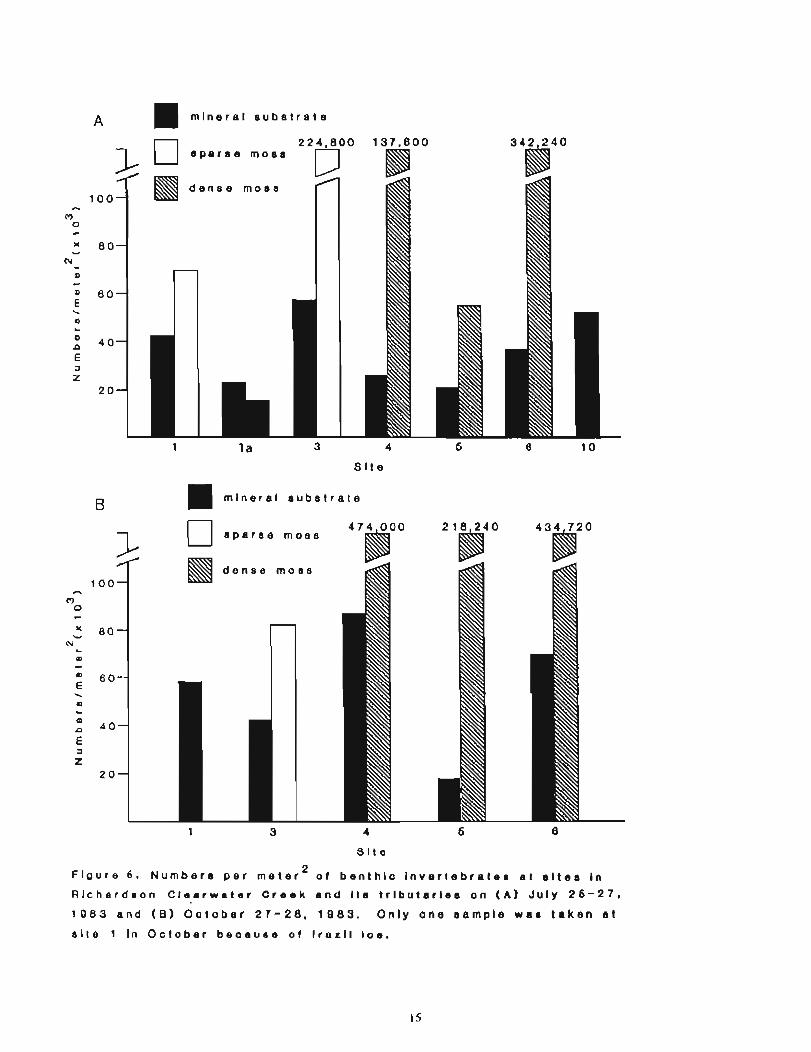
Figure 6 . Numbers per meter2 of benthic invertebrates at sites in Richardson Clearwater Creek and its tributaries. July and October 1983 .................................................. 15
TABLES
Table 1 .
Table 2 .
Table 3 .
Table 4 .
Table 5 .
Table 6 .
Table 7 .
Table 8 .
Streamflow and on-site water-quality measurements taken in the Richardson ................................................................................... Clearwater Creek area. 1983 16
Laboratory analyses of major inorganic constituents for surface waters in the Richardson Clearwater Creek area, 1983 ................................................................. 18 Laboratory analyses of nutrients for surface waters in the Richardson
................................................................................... Clearwater Creek area, 1983 20 Laboratory analyses of total trace elements for surface waters in the Richardson
...................................................................... Cleanvater Creek area, July 6, 1983 21 Laboratory analyses of organic compounds for surface waters in the Richardson Clearwater Creek area, 1983 ................................................................. 23 Taxa and number of organisms per meter2 of benthic invertebrates collected in Richardson Clearwater Creek, July 25-27, 1983 ...................................................... 24 Taxa and number of organisms per meter2 of benthic invertebrates collected in Richardson Clearwater Creek, October 27-28, 1983 ................................................ 25 Taxonomic composition and mean number of organisms per meter2 of benthic invertebrates collected in Richardson Clearwater Creek in mineral substrate and
..................... ..................................................... moss, July and October 1983 .. 26
INTRODUCTION
Richardson Clearwater Creek is a pristine, spring-fed, perennial stream that flows northwestward for 14 miles to the Tanana River, approximately 80 miles southeast of Fairbanks, Alaska. The creek is identified as Clear Creek on the U.S. Geological Survey Big Delta (A-5) Quadrangle (fig. I), but is known locally as Richardson Clearwater Creek to differentiate it from Delta Clearwater Creek, a spring-fed stream east of Delta Junction, Alaska.
The Richardson Clearwater Creek receives the majority of its flow from ground water rather than surface water runoff Consequently, streamflow fluctuates within a very narrow range. The stream's headwaters are formed by numerous springs that emanate from a low bank at the 1000 foot elevation contour line in section 4 of Township 9 South, Range 9 East, Fairbanks Meridian (near site 10 in fig. 2). The largest of these springs contributes approximately 12 cubic feet per second of flow. The stream also receives flow from small springs along its length and two spring-fed tributaries.
Richardson Clearwater Creek is an unusual Interior Alaska stream because of its short length, laminar flow, stable channel, and exceptional clarity. The streambed is composed of gravel and cobble-sized rock which is underlain by fine-grained sand. The aquatic moss Cratoneuronfilicinum grows in long, sinuous submerged clumps or mats attached to the streambed. Stream banks are vegetated and show no sign of erosion. The riparian habitat is a mature spruce and birch forest. Ice scar marks on mature spruce trees along the creek's lower reaches indicate ice jams occur during spring breakup. Beavers are active near the headwaters and have impounded the tributaries in the recent past.
Richardson Clearwater Creek supports populations of coho salmon, chum salmon, Arctic grayling, round whitefish, and longnose suckers. Of these species, only coho salmon spawn and overwinter in the creek. The other species utilize the stream as a summer feeding area (Ridder, 1980). The Arctic grayling fishery is popular with local summer residents who have recreational cabins along the lower reaches of the creek. Summer access is by boat or floatplane.
State lands in the Richardson Clearwater Creek area are managed for recreational use and fish and wildlife habitat protection, according to the Delta-Salcha Area Plan (Alaska Department of Natural Resources, 1982). In the early 1980's agricultural development was proposed for lands that lay to the south and upgradient of Richardson Clearwater Creek. However, no lands have been cleared for agriculture in the area during the last 20 years.
In May 1998 the Carla Lake forest fire started as the result of a lightening strike on the Fort Greeley military reservation, about 15 miles southwest of Delta Junction. The fire spread north and crossed Richardson Clearwater Creek (fig. 1). Firefighters successfblly defended the threatened cabins along the creek, and suppressed the fire in the late summer of 1998. The fire burned a total of 53,720 acres. Presently, the State is proposing timber salvage operations in the burn area.
Carla Lake forest fire effects on Richardson Clearwater Creek are unknown. Forest fires can produce changes in a stream's flow regime, organic matter content, turbidity, color, chemical oxygen demand, and potassium concentration (Lotspeich and others, 1970). Fire control efforts such as trail and ditch construction in permafrost areas also have the potential to produce erosion and increase sediment loading.
In 1983 the Alaska Department of Natural Resources, Alaska Hydrologic Survey (AHS) collected streamflow and water-quality data on Richardson Clearwater Creek to document baseline conditions within the proposed agricultural area. In hindsight these data also document pre-fire water quality conditions. This report presents the data collected in the 1983 AHS investigation. The purpose of the report is to make previously unpublished data available to land managers and the public.
ACKNOWLEDGEMENTS
The State of Alaska and the Agricultural Action Council hnded this study. Steve Mack (formerly of AHS) was project manager. Roy Ireland (AHS), Steve Mack, George McCoy, Roger Allely, and Larry Dearborn (all formerly of AHS) assisted with field data collection. Barbara Murray (University of Alaska Museum Herbarium, Fairbanks, AK) identified the aquatic moss. Dave Hendren (Alaska Department of Natural Resources, Division of Forestry) provided a map of the Carla Lake fire. Jim Vohden (AHS) reviewed the report.
METHODS
Streamflow was measured with a Marsh McBirney current meter according to U.S. Geological Survey methods (Carter and Davidian, 1968). Water temperature, dissolved oxygen, and specific conductance were measured in the field with a Model 4041 Hydrolab that was pre- and post-calibrated according to the user manual. On-site pH was measured with an Orion Research model 201 digital pH meter. Bicarbonate alkalinity was measured on-site by titrating an untreated, unfiltered 100-ml water sample with 0.01639N sulfuric acid to an endpoint of pH 4.5 (U.S. Environmental Protection Agency, 1983).
Although no water-quality assurance plan was written, sampling and treatment was in general accordance with U.S. Geological Survey (1977) procedures. Grab samples were obtained at mid-channel and mid-depth of the stream. All samples were processed in the field. Water for dissolved inorganic constituent analysis and dissolved nutrient analysis was filtered through a 0.45-pm membrane filter and poured into pre-cleaned plastic bottles. Water for total nutrient analysis was collected in pre-cleaned plastic bottles. Nutrient samples were frozen within eight hours of returning from the field. Water for organic compound analysis was collected in 1-liter amber glass bottles. Water for total metal analysis was poured into pre-cleaned plastic bottles, and acidified with double-
distilled 70-percent nitric acid. All samples were placed in a cooler with ice while in transit from the field to the laboratory.
Anatec Laboratories in Santa Rosa, California analyzed dissolved inorganic constituent and trace metal samples according to the methods of the American Public Health Association (1980) or the U.S. Environmental Protection Agency (1983). The Alaska Department of Fish and Game Limnology Laboratory in Soldotna, Alaska analyzed nutrient samples according to methods described in Koenings and others (1987). Northern Testing Laboratories, Inc. in Fairbanks, Alaska analyzed tannin and lignin samples according to the methods of the American Public Health Association and others (1980). Water Analysis and Consultants in Eugene, Oregon analyzed pesticide and herbicide samples under contract to Northern Testing Laboratories, Inc. according to the methods of the U.S. Environmental Protection Agency (198 1).
Benthic invertebrate samples were collected from mineral substrate and the aquatic moss Cratoneuronfilicinum with a 0. 1-meter2 cylindrical substrate sampler, similar to a modified-Hess sampler. The sampler is 2 feet in height and is constructed of heavy gauge aluminum. Netting fits over the frame and is held in place by aluminum rim bands. The netting that faces the water current has 600-micron NITEX nylon mesh, whereas the backside and attached bag has 300-micron mesh. Mineral substrate samples were obtained by working the sampler into the streambed and rubbing the rocks to dislodge invertebrates. Moss samples were obtained by placing the sampler over the moss, detaching the moss from the streambed, and placing the moss in the net bag. Organisms were preserved in a 70 percent alcohol solution. Rose bengal bacteriological stain was added to facilitate sorting. All organisms were hand-picked from mineral substrate samples. A one-eighth or one-sixteenth subsample was taken from moss samples. Benthic invertebrates were identified to the lowest practicable level using the taxonomic keys of Pennak (1978), Usinger (1956), Flint (1960), Jensen (1966), Smith (1968), Edmunds and others (1976), Baumann and others (1977), Wiggins (1977), and Merritt and Cummins (1978).
RESULTS AND DISCUSSION
Chemical Water Quality
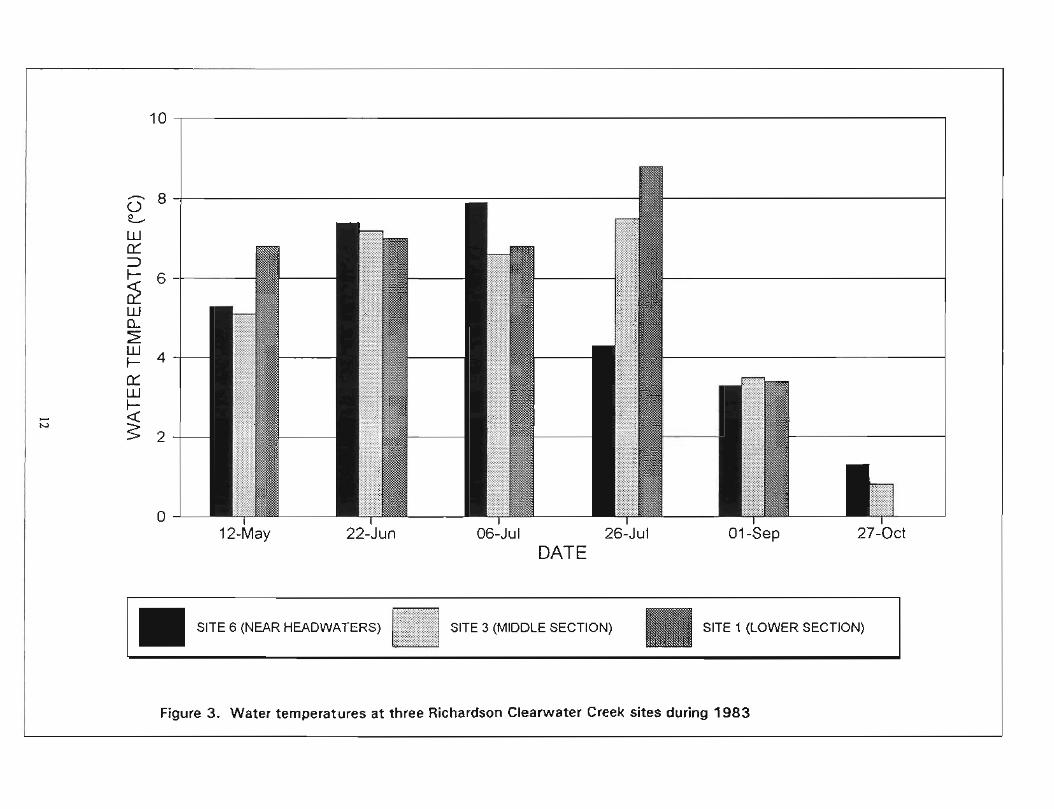
Streamflow and on-site water-quality measurements are shown on table 1. Streamflow fluctuates within a very narrow range at each site. Water temperature ranges from -O.l°C in October to 12.4"C in July. Mainstem water temperatures are generally similar among sites, except on July 26 when water temperatures near the stream's headwaters (site 6) dropped significantly (fig. 3). By mid-summer, water held in seasonally frozen soils probably recharges the shallow groundwater. Discharge of this colder ground water at headwater springs may account for the lower water temperature at site 6. The pH ranges from near neutral (pH 6.9 at site 9) to basic (pH 8.2 at site 7). Specific conductance ranges from 193 to 285 pS/cm @ 25°C. Dissolved oxygen concentrations are generally
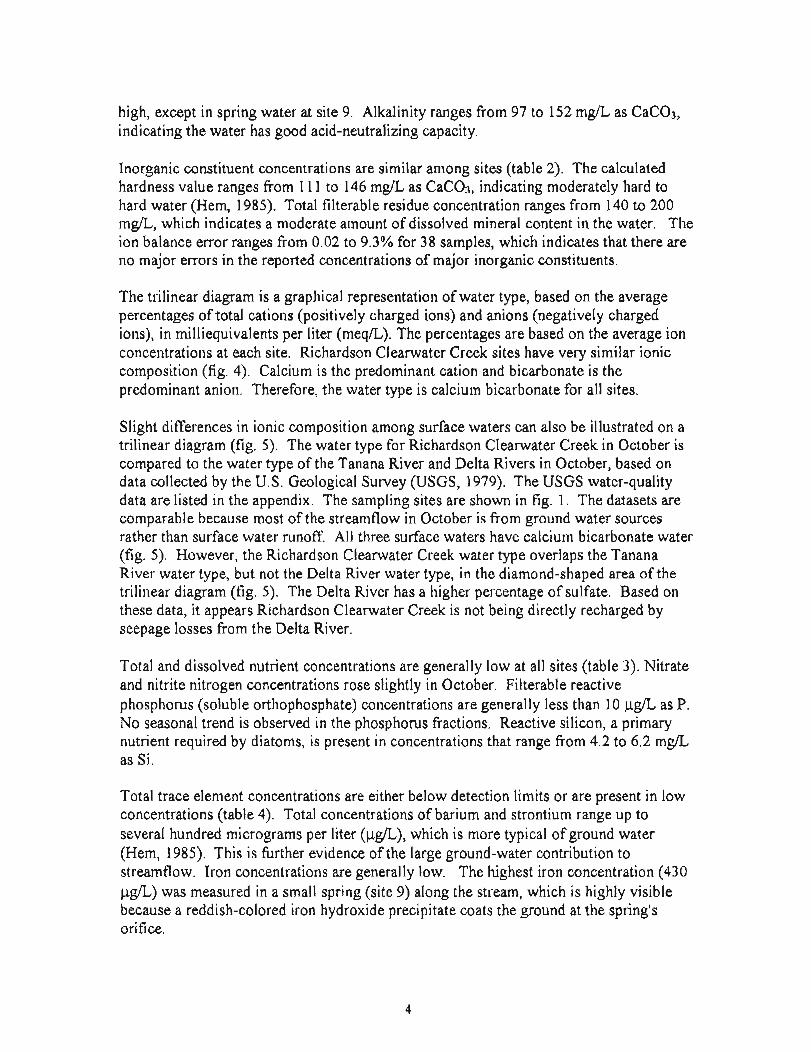
high, except in spring water at site 9. Alkalinity ranges from 97 to 152 mgL as CaC03, indicating the water has good acid-neutralizing capacity.
Inorganic constituent concentrations are similar among sites (table 2). The calculated hardness value ranges from 11 1 to 146 mg/L as CaC03, indicating moderately hard to hard water (Hem, 1985). Total filterable residue concentration ranges from 140 to 200 mg/L, which indicates a moderate amount of dissolved mineral content in the water. The ion balance error ranges from 0.02 to 9.3% for 38 samples, which indicates that there are no major errors in the reported concentrations of major inorganic constituents.
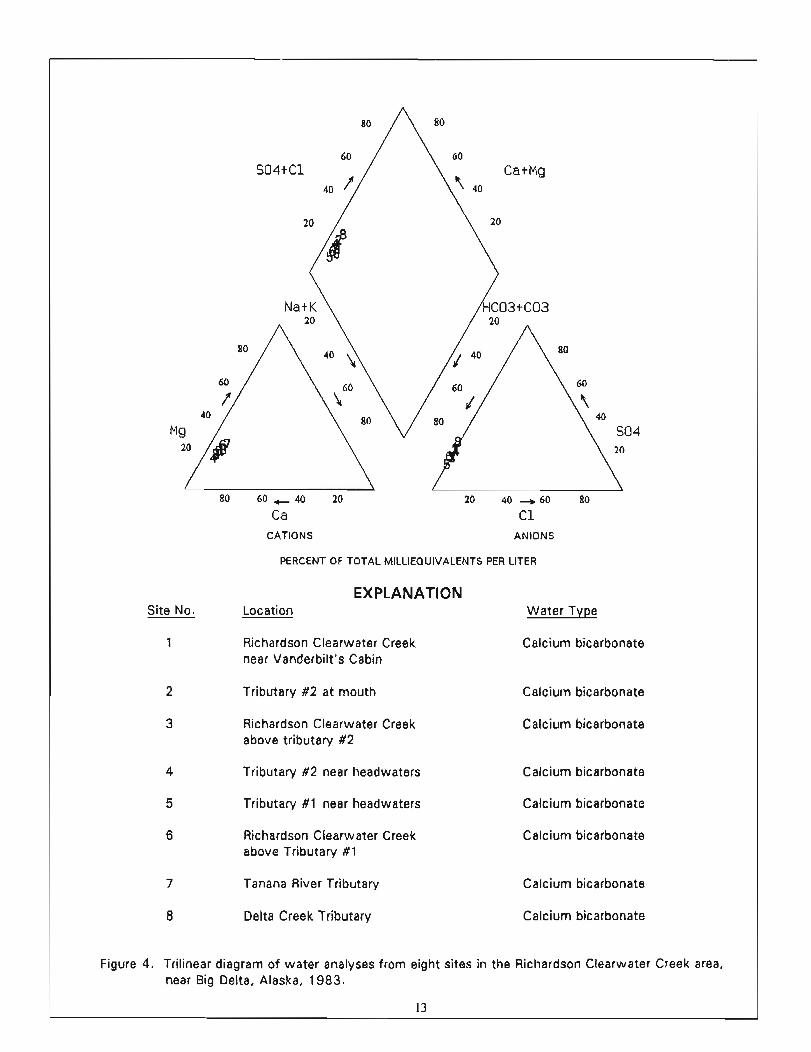
The trilinear diagram is a graphical representation of water type, based on the average percentages of total cations (positively charged ions) and anions (negatively charged ions), in milliequivalents per liter (meq/L). The percentages are based on the average ion concentrations at each site. Richardson Cleanvater Creek sites have very similar ionic composition (fig. 4). Calcium is the predominant cation and bicarbonate is the predominant anion. Therefore, the water type is calcium bicarbonate for all sites.
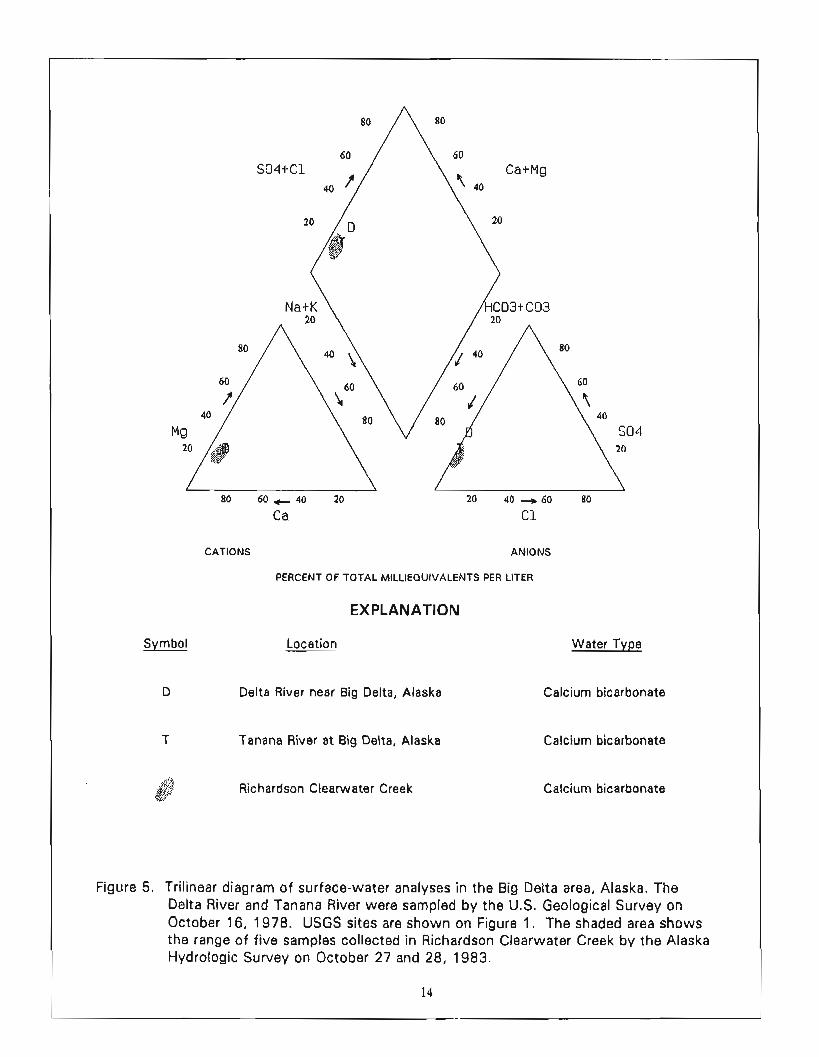
Slight differences in ionic composition among surface waters can also be illustrated on a trilinear diagram (fig. 5). The water type for Richardson Cleanvater Creek in October is compared to the water type of the Tanana River and Delta Rivers in October, based on data collected by the U.S. Geological Survey (USGS, 1979). The USGS water-quality data are listed in the appendix. The sampling sites are shown in fig. 1. The datasets are comparable because most of the streamflow in October is from ground water sources rather than surface water runoff. All three surface waters have calcium bicarbonate water (fig. 5). However, the Richardson Cleanvater Creek water type overlaps the Tanana River water type, but not the Delta River water type, in the diamond-shaped area of the trilinear diagram (fig. 5). The Delta River has a higher percentage of sulfate. Based on these data, it appears Richardson Clearwater Creek is not being directly recharged by seepage losses from the Delta River.
Total and dissolved nutrient concentrations are generally low at all sites (table 3). Nitrate and nitrite nitrogen concentrations rose slightly in October. Filterable reactive phosphorus (soluble orthophosphate) concentrations are generally less than 10 p g L as P. No seasonal trend is observed in the phosphorus fractions. Reactive silicon, a primary nutrient required by diatoms, is present in concentrations that range from 4.2 to 6.2 mg/L as Si.
Total trace element concentrations are either below detection limits or are present in low concentrations (table 4). Total concentrations of barium and strontium range up to several hundred micrograms per liter (pg/L), which is more typical of ground water (Hem, 1985). This is fbrther evidence ofthe large ground-water contribution to streamflow. Iron concentrations are generally low. The highest iron concentration (430 pgL) was measured in a small spring (site 9) along the stream, which is highly visible because a reddish-colored iron hydroxide precipitate coats the ground at the spring's orifice.
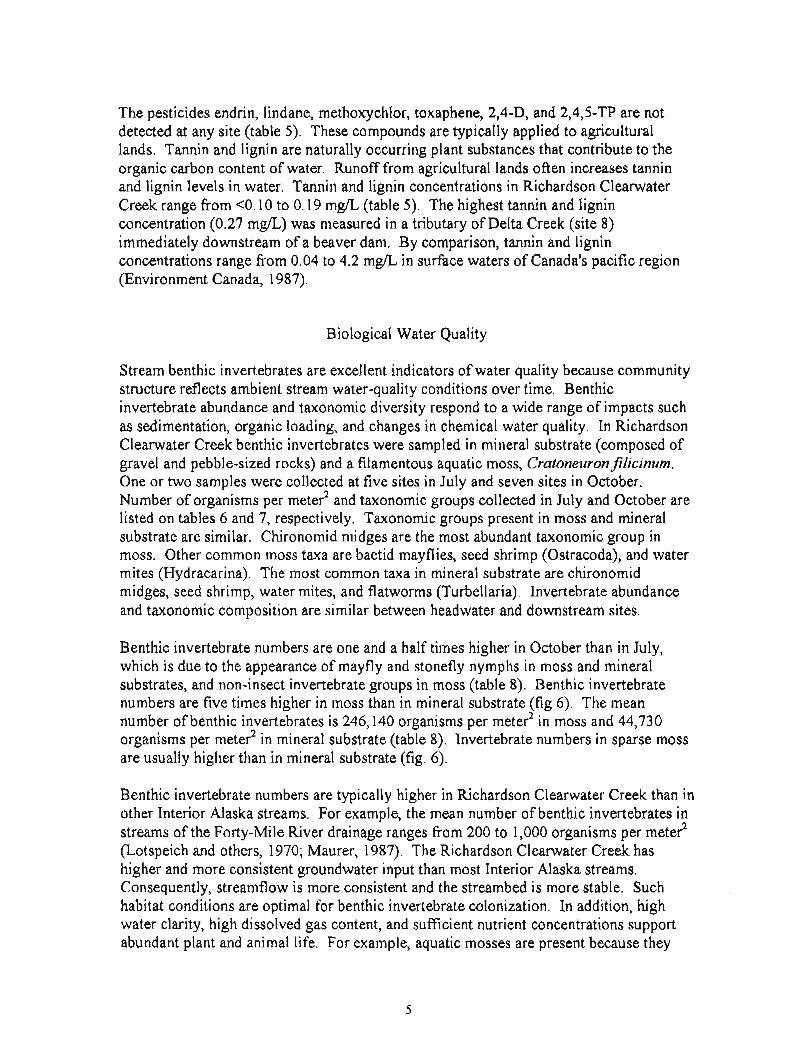
The pesticides endrin, lindane, methoxychlor, toxaphene, 2,4-D, and 2,4,5-TP are not detected at any site (table 5). These compounds are typically applied to agricultural lands. Tannin and lignin are naturally occurring plant substances that contribute to the organic carbon content of water. Runoff from agricultural lands often increases tannin and lignin levels in water. Tannin and lignin concentrations in Richardson Clearwater Creek range from <O.lO to 0.19 mg/L (table 5). The highest tannin and lignin concentration (0.27 mg/L) was measured in a tributary of Delta Creek (site 8) immediately downstream of a beaver dam. By comparison, tannin and lignin concentrations range from 0.04 to 4.2 mg/L in surface waters of Canada's pacific region (Environment Canada, 1987).
Biological Water Quality
Stream benthic invertebrates are excellent indicators of water quality because community structure reflects ambient stream water-quality conditions over time. Benthic invertebrate abundance and taxonomic diversity respond to a wide range of impacts such as sedimentation, organic loading, and changes in chemical water quality. In Richardson Clearwater Creek benthic invertebrates were sampled in mineral substrate (composed of gravel and pebble-sized rocks) and a filamentous aquatic moss, Cratoneuronfilicinum. One or two samples were collected at five sites in July and seven sites in October. Number of organisms per meter2 and taxonomic groups collected in July and October are listed on tables 6 and 7, respectively. Taxonomic groups present in moss and mineral substrate are similar. Chironomid midges are the most abundant taxonomic group in moss. Other common moss taxa are baetid mayflies, seed shrimp (Ostracoda), and water mites (Hydracarina). The most common taxa in mineral substrate are chironomid midges, seed shrimp, water mites, and flatworms (Turbellaria). Invertebrate abundance and taxonomic composition are similar between headwater and downstream sites.
Benthic invertebrate numbers are one and a half times higher in October than in July, which is due to the appearance of mayfly and stonefly nymphs in moss and mineral substrates, and non-insect invertebrate groups in moss (table 8). Benthic invertebrate numbers are five times higher in moss than in mineral substrate (fig 6). The mean number of benthic invertebrates is 246,140 organisms per meter2 in moss and 44,730 organisms per meter2 in mineral substrate (table 8). Invertebrate numbers in sparse moss are usually higher than in mineral substrate (fig. 6).
Benthic invertebrate numbers are typically higher in Richardson Clearwater Creek than in other Interior Alaska streams. For example, the mean number of benthic invertebrates in streams of the Forty-Mile River drainage ranges from 200 to 1,000 organisms per meter2 (Lotspeich and others, 1970; Maurer, 1987). The Richardson Clearwater Creek has higher and more consistent groundwater input than most Interior Alaska streams. Consequently, streamflow is more consistent and the streambed is more stable. Such habitat conditions are optimal for benthic invertebrate colonization. In addition, high water clarity, high dissolved gas content, and sufficient nutrient concentrations support abundant plant and animal life. For example, aquatic mosses are present because they
require free carbon dioxide for photosynthesis, which is abundant in spring-fed streams (Ruttner, 1963).
High benthic invertebrate numbers in moss are the result of form and fbnction. Long, thickly vegetated moss mats provides the invertebrates with more surface area for attachment and protection from predators. Few benthic invertebrates feed directly on moss. Instead, moss acts as a food trap. Benthic invertebrates, especially chironomid midges, feed on the epiphytic algae, diatoms, and fine particulate organic matter that adhere to the moss.
CONCLUSIONS
Chemical water quality in Richardson Cleanvater Creek is good, characterized by highly oxygenated water, basic pH, moderate hardness, good acid-neutralizing capacity, and low concentrations of trace metals and nutrients.
Biological water quality, based on benthic invertebrate abundance, is very good in Richardson Cleanvater Creek. The number of organisms per meter2 is substantially higher in the creek than in other Interior Alaska streams. Chrionomid midges are the most abundant taxa. The presence of aquatic moss enhances benthic invertebrate abundance.
REFERENCES CITED
Alaska Department of Natural Resources, 1982, Delta-Salcha Area Plan: Division of Land and Water management, Northcental District Planning Section, 2 volumes.
American Public Health Association, American Water Works Association, and Water Pollution Control Federation, 1980, Standard methods for the examination of water and wastes (1 5'h ed.): American Public Health Association, Washington, D.C., 1134 p.
Baumann, R.W., Gaufin, A.R., and Surdick, R.F., 1977, The stoneflies (Plecoptera) of the Rocky Mountains: Memoirs of the American Entomological Society, no. 3 1, Philadelphia, 208 p.
Carter, R.W., and Davidian, J., 1968, General procedures for gaging streams: U.S. Geological Survey Techniques of Water-Resources Investigations, book 3, chapter A6, 13 p.
Edmunds, G.F., Jr., Jensen, S.L., and Berner, L., 1976, The mayflies of North and Central America: University of Minnesota Press, Minneapolis, MN, 330 p.
Environment Canada, 1987, Canadian water quality guidelines: Canandian Council of Resource and Environmental Ministers, Ottawa, Ontario.
Flint, O.S., Jr., 1960, Taxonomy and biology of nearctic limnephelid larvae (Trichoptera), with special reference to species in eastern United States: Entomologica Americana, v. 40, p. 1-1 17.
Hem, J.D., 1985, Study and interpretation of the chemical characteristics of natural water (3" ed.): U.S. Geological survey Water-Supply Paper 2254, 263 p.
Jensen, S.L., 1966, The mayflies of Idaho: University of Utah M.S. thesis, Salt Lake City, UT, 367 p.
Koenings, J.P., Edmundson, J.A., Edmundson, J.M., and Kyle, G.B., 1987, Limnology field and laboratory manual: methods for assessing aquatic production: Alaska Department of Fish and Game, FRED Division Report 71,212 p.
Lotspeich, F.B., Mueller, E.W., and Frey, P.J., 1970, Effects of large scale forest fires on water quality in Interior Alaska: Federal Water Pollution Control Administration, Alaska Water Laboratory, College, AK, 1 15 p.
Maurer, M.A., 1987, Compilation of stream macroinvertebrate data for the Birch Creek, Beaver Creek, Fortymile River, and Minto Flats drainages, Alaska: Alaska Division of Geological and Geophysical Surveys Public-Data File Report 87-30, 56 p.
Merritt, R.W., and Cummins, K.W., eds., 1978, An introduction to the aquatic insects of North America: Kendallhlunt Publishing Company, Dubuque, IA, 441 p.
Pennak, R.W., 1978, Freshwater invertebrates of the United States (2"d ed.): Ronald Press Company, New York, 803 p.
Ridder, W.P., 1983, A study of a typical spring-fed stream of Interior Alaska in Investigations of Interior Waters: Alaska Department of Fish and Game, Federal Aid in Fish Restoration and Anadromous Fish Studies, v. 24, July 1, 1982 - June 30, 1983, p. 1-54.
Ruttner, R., 1963, Fundamentals of Limnology: University of Toronto Press, Toronto, Ontario, 295 p.
Smith, S.D., 1968, The Rhyacophila of the Salmon River drainage of Idaho with special reference to larvae: Annuals of the Entomological Society of America, v. 61, no. 3, p. 655-674.

U. S. Environmental Protection Agency, 198 1, Methods for organochlorine pesticides and chloro phenoxy acid herbicides in drinking water and raw source water: U.S. Environmental Protection Agency, EPA-60014-8 1-053.
p7 1983, Methods for chemical analysis of water and wastes: U.S. Environmental Protection Agency, Cincinnati, OH, EPA-60014-79-020.
U.S. Geological Survey, 1977, National handbook of recommended methods for water- data acquisition: U.S. Geological Survey Office of Water Data Coordination, Reston, VA, 2 volumes.
, 1979, Water resources data for Alaska, water year 1979: U. S. Geological Survey Water-Data Report AK-79-1, Anchorage, AK, 374 p.
Usinger, R.L., ed., 1956, Aquatic insects of California: University of California, Berkeley, 508 p.
Wiggins, G.B., 1977, Larvae of the North American caddisfly genera (Trichoptera): University of Toronto Press, Toronto, Ontario, 401 p.

Appendix: U.S. Geological Survey water-quality data for the Delta and Tanana Rivers
(Ref. Source: Water resource data for Alaska, water year 1979: U.S. Geological Survey Water-Data Report AK-79-1, Anchorage, AK, p. 318)
ANALYSES OF SAMPLES COLLECTED AT MISCELLANEOUS S I T E S
YUKON A L A S K A - - C o n t i n u e d
WATER QUALITY DATA, WATER YEAR OCTOBER 1 9 7 8 TO SEPTEMBER 1979
SPE- C I F I C CON- DUCT- ANCE PH
T I M E (MICRO- DATE MHOSI (UNITS)
OCT 16.e. 1 5 3 0 2 5 5 A.2
JUN 20.a. 1 E 0 5 1 8 6 7.0
DELTA R IOR B I G DELTA AK (LAT 6 4 0 7 5 5 LONG 1 4 5 50 00)
H A W - MIONE- HARD- NESS* CALCIUM SlUMe S001UMv NESS NONCAR- 0 1 s - 0 1 s - D I S -
TEMPER- (wG/L RONATE SOLVED SOLVED SOLVED ATURE AS IMG/L fMG/L (MG/L (M6/L
(OFG C) CACO3l CAC031 AS CAI AS MG) AS N 4 )
POTAS- SIUMI RICPR- 0 1 s - 8ONATE
SOLVED (MG/L (MG/L 4 S AS K I HC03)
SOLIDSv S n L l D S * NITRO- CHLO- FLUO- S I L I C A . RESI9UE SllM OF GEN* PHOS- MAYGI-
SULFATE R I D E * R I D E * D I S - AT 1 8 0 CONSTI- N02*N03 PHORUS* IROYr YES€* 01s- P I S - D I S - SOLVED DEG. C TUENTS* 0 1 s - 0 1 s - 0 1 5 - 0 1 s - SOLVED SOLVEO SOLVEO fMG/L D I S - O I S - SOLVED SOLVED SOLVED SOLVED (MG/L (MG/L (wG/L AS SOLVED SOLVE9 (MG/L (MG/L (UG/L (uGIL
DATE AS 5 0 4 1 AS CL) A5 F l 5 1 0 2 1 fYG/L) (MG/L) 1s N l AS P ) AS FE) AS MNI
OCT 16.a. 4 5 1.0 .1 5.6 1 4 8 1 5 6 - 2 8 - 0 0 ( 1 0 2
JUN 2 0 . ~ . 2 7 1 .Z .1 4.3 103 1 0 3 .11 .oo 4 n 4
1 5 4 7 8 0 0 0 0 - TANANA R AT B I G DELTA AK (LAT 6 4 09 20
SPE- C I F I C HIRO- CON- HARD- NESSI CALCIUM DUCT- NES5 NONCAR- OIS- 4NCE PH TEMPER- (MG/L BDNITE SOLVED
T IME IMICRO- ATURE AS IMG/L (MG/L D I T E MHOS) (UNITS) (OEG C l CAC03) CAC03) AS C A I
LONG 1 4 5 5 1 0 0 1
MIGNE- POTAS- S IUM* SODIUM* SIUM. BICAR- D I S - D I S - DTS- 80N4TE
SOLVED SOLVED SOLVED (MG/L IMG/L (MG/L tMG/L AS 4 S M G l I S N I ) A S K ) HC03)
SOLIDS* SOLIDS* NITRO- CHLO- FLUD- S I L I C A . RESIDIJE SUM OF GEN* PHOS-
SULFATE R I D E * R I D E * 0 1 s - 4 1 1 8 0 CONSTI- N 0 2 + N 0 3 PHORUS* IROYv D I S - D I S - D I S - SOLVED DEG. C TUENTSr D I S - D I S - O I S - SOLVED SOLVED SOLVED (MG/L DIS- 151s; SOLVED SOLVED SOLVED (MG/L (MG/L (MG/L AS SOLVED SOLVED tMG/L (MG/L tUG/L
DATE AS 5 0 4 ) AS CL) AS F ) S I O Z I (MG/LI (MG/Ll 1 S N ) A S PI A S F E )
OCT 16... 3? 1.4 .1 1 0 1 S* 1 SA 0 2 1 a00 < 1 0
JUN 20..* 2 9 2.7 . I 8.R I24 131 .15 .OO 1 7 0
MANGA- NESE v
0 1 s - SOLVED (IIGIL I S MN)
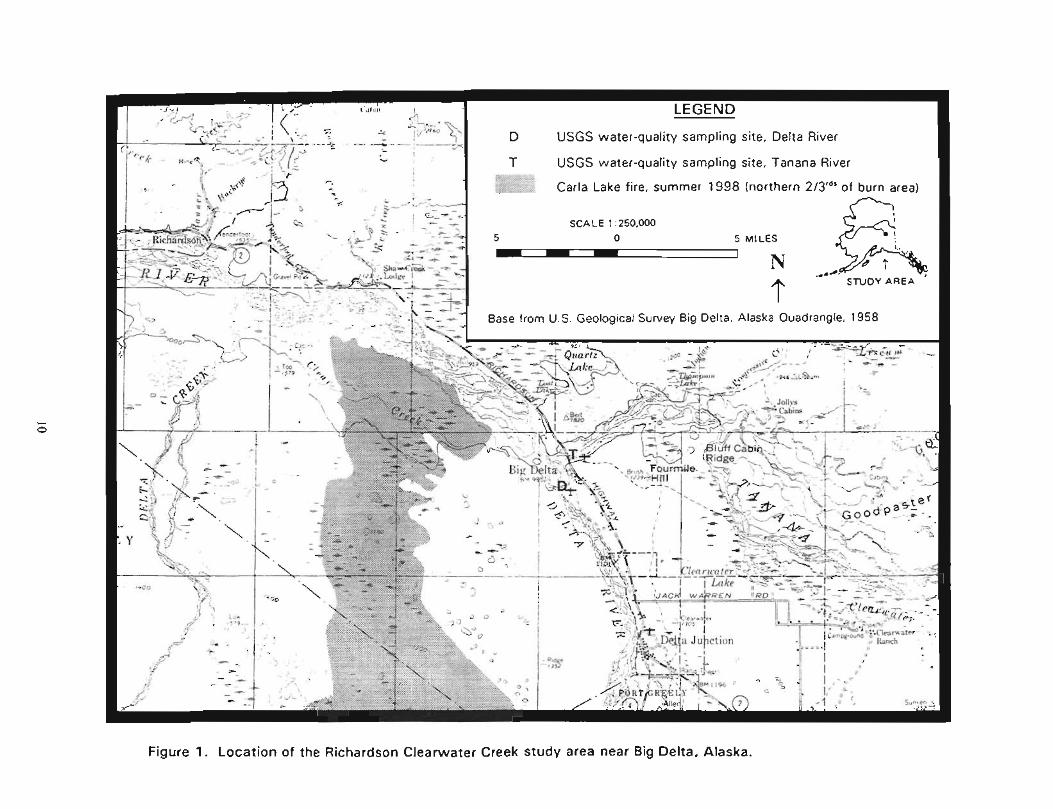
Figure 1. Location of the Richardson Clearwater Creek study area near Big Delta. Alaska.

Figure 2. Location of sampling sites, Richardson Clearwater Creek area, near Big Delta, Alaska, 1983.
06-JUI DATE
. . . . . . . . . . . . . . . . . . . . . . . . . . . . . . . . . . . . . . . . . . . . . . . . . . . . . . . . . . . . . . . . . . . . . . . . . . . . . . . . . . . . . . . . . . . . . . . . . . . . . . . . . . . . . . . . . . . . . . . . . . . . . . . . . . . . . . . . . . . . . . . . . . . . . SITE 6 (NEAR HEADWATERS) . . . . . . . . . . . . . . . . SITE 3 (MIDDLE SECTION) . . . . . . . . . . . . . . . . . . . . . . . . . . . . . . . . . . . . . . . . . . . . . . . . . . . . . . . . . . . . . . . . . . . . . . . . . . . . . . . . . . . . . . . . . . . . . . . . . . .
SITE 1 (LOWER SECTION) . . . . . . . . . . . . . . . . . . . . . . . . . . . . . . . .
Figure 3. Water temperatures at three Richardson Clearwater Creek sites during 1983
80 60 + 40 20
C a CATIONS ANIONS
PERCENT OF TOTAL MILLIEQUIVALENTS PER LITER
EXPLANATION Site No. Location Water Type
1 Richardson Clearwater Creek near Vanderbilt's Cabin
Calcium bicarbonate
2 Tributary #2 at mouth Calcium bicarbonate
3 Richardson Clearwater Creek above tributary #2
Calcium bicarbonate
4 Tributary #2 near headwaters Calcium bicarbonate
5 Tributary #I near headwaters Calcium bicarbonate
6 Richardson Clearwater Creek above Tributary # I
Calcium bicarbonate
7 Tanana River Tributary Calcium bicarbonate
8 Delta Creek Tributary Calcium bicarbonate
Figure 4. Trilinear diagram of water analyses from eight sites in the Richardson Clearwater Creek area, near Big Delta, Alaska, 1983.
CATIONS ANIONS
PERCENT OF TOTAL MILLIEQUIVALENTS PER LITER
EXPLANATION
Symbol Location
D Delta River near Big Delta, Alaska
T Tanana River at Big Delta, Alaska
..c: ; ... :* :*y:<. *,vp \;;;.>'
Richardson Clearwater Creek
Water Type
Calcium bicarbonate
Calcium bicarbonate
Calcium bicarbonate
Figure 5. Trilinear diagram of surface-water analyses in the Big Delta area, Alaska. The Delta River and Tanana River were sampled by the U.S. Geological Survey on October 1 6 , 1978. USGS sites are shown on Figure 1. The shaded area shows the range of five samples collected in Richardson Clearwater Creek by the Alaska
I Hydrologic Survey on October 27 and 28, 1 9 8 3 .
m i n e r a l s u b s t r a t e
224,800 s p a r s e m o s s
@ d e n s e m o s s R
s i t e
s p a r s e m o s s
BSl d e n s e m o s s
i n i n e r a l s u b s t r a t e
s i t e
F i g u r e 6. N u m b e r s p e r m e t e r 2 o f b e n t h i c i n v e r t e b r a t e s a t s l t e s I n
R i c h a r d s o n C l e a r w a t e r C r e e k a n d I t s t r i b u t a r i e s o n ( A ) J u l y 2 5 - 2 7 .
1 9 8 3 a n d ( 8 ) O c t o b e r 2 7 - 2 8 . 1883. O n l y o n e s a m p l e w a s t a k e n a t
s l t e 1 i n O c t o b e r b e c a u s e o f f r a z l l I ce .

Table 1. Streamflow and on-site water-quality measurements taken in the Richardson Clearwater Creek area, 1983
-- = no measurement made IM = instrument malfunction
Site No.
1
2
3a
3
4
PH (units)
IM --
7.9 7.9 7.9 7.6 7.6
-- 7.4 7.5 7.9 7.4 7.3
I M
-- 8.1 7.9 8.0 7.7 7.6
7.7 8.0 8.0 7.7 7.6
Site
Richardson Clearwater Cr near Vanderbilt's Cabin
Tributary #2, above confluence with
Richardson Clearwater Cr
Richardson Clearwater Cr below Tributary #2
Richardson Clearwater Cr above Tributary #2
Tributary #2, near headwaters
Specific Conductance
(pS/cm @25OC)
238 --
228 21 3 201 262 IM
-- 230 225 23 1 263 273
249
-- 242 227 193 268 276
253 24 1 21 0 269 274
Date
12 MAY 1983 1 9 MAY 1983 22 JUN 1983 06 JUL 1983 27 JUL 1983 01 SEP 1983 27OCT1983
12 MAY 1983 22 JUN 1983 06 JUL 1983 26 JUL 1983 01SEP1983 27 OCT 1983
12 MAY 1983
12 MAY 1983 22JUN1983 06 JUL 1983 26 JUL 1983 01SEP1983 27 OCT 1983
22JUN1983 06 JUL 1983 25 JUL1983 01 SEP 1983 27 OCT 1983
Dissolved Oxygen (mglL)
12.6 --
11.3 12.3 I M
13.4 13.9
-- 8.6 10.0 EM
12.0 13.0
10.2
-- 10.0 10.8 IM
12.8 13.2
9.2 10.7 IM
12.8 13.0
Time
-- --
1030 1025 1355 1000 1105
-- 11 30 1205 171 5 1110 1200
1300
1315 1215 1 130 1350 1137 1205
1310 1255 1 155 1230 1355
Dissolved Oxygen (percent
saturation)
1 00 -- 96 1 00 --
1 00 99
-- 70 84 -- 92 95
8 2
-- 86 9 1 --
1 00 96
8 1 95 --
100 96
Alkalinity (mglL as CaC03 )
-- --
102 107 97 110 110
-- 101 109 105 108 98
--
-- 107 121 102 121 11 1
1 04 116 113 112 102
Streamflow (cfs)
-- 41 5 434 429 43 1 442
--
78 7 7 72 75 77 7 6
--
21 8 25 6 25 9 244 237 238
42 43 42 43 43
Water Temper-
ature (OC)
6.8 --
7.0 6.8 8.8 3.4 -0.1
-- 5.7 6.7 7.7 3.0 0.9
5.1
-- 7.2 6.6 7.5 3.5 0.8
8.7 8.9 7.0 3.6 1 .O

Table 1 (con). Streamflow and on-site water water-quality measurements taken in the Richardson Clearwater Creek area, 1983
-- = no measurement made IM = instrument malfunction
= streamflow measurement affected by shore ice
Site No.
5
6
7
8
9
10
Site
Tributary # l , near headwaters
Richardson Clearwater Cr. above Tributary #1
Tanana River Tributary
Delta Creek Tributary
Red-stain spring along Richardson Clearwater Cr
Big spring, at headwaters
Date
12MAY1983 22 JUN 1983 06 JUL 1983 25 JUL 1983 01 SEP 1983 27 OCT 1983
12MAY1983 22 JUN 1983 06 JUL 1983 26 JUL 1983 01SEP1983 28 OCT 1983
22 JUN 1983 06 JUL 1 983 25 JUL 1983 01 SEP 1983 28 OCT 1983
22 JUN 1983 06 JUL 1983 25 JUL 1983 01 SEP 1983 28 OCT 1983
27 JUL 1983
25 JUL 1 983
Time
1130 --
1405 1335 1318 1520
1216 1440 1505 1020 1417 101 0
1520 1645 1507 1500 1 120
1600 1645 1 100 1540 1220
0830
1845
Streamflow (cfs)
12 17 21 23 19 22
-- 7 9 8 1 82 84 8 2
6 1 66 84 7 2 5 9'
3.7 4.8 7.8 8.3 4.3'
--
12
Water Temper-
ature ("C)
5.1 8.7 9.8 8.3 4.0 1.4
5.3 7.4 7.9 4.3 3.3 1.3
11.3 12.4 8.9 4.2 0.1
7.2 12.4 8.2 4.9 -0.1
2.3
1.9
PH (units)
7.6 7.7 7.7 7.9 7.7 7.5
IM 7.4 7.9 7.8 7.9 7.7
8.2 8.0 8.0 7.9 7.9
7.7 7.7 7.8 7.6 7.3
6.9
7.5
Specific Conductance
(pS/cm @25'C)
268 264 249 209 276 285
267 260 23 1 239 279 266
264 257 24 1 268 274
280 257 248 278 269
227
21 2
Dissolved Oxygen (mg/L)
7.4 6.2 7.8 IM 9.8 9.1
8.3 8.5 9.5 IM
12.1 12.1
9.7 10.9 IM
13.8 15.2
9.4 10.0 10.7 13.4 14.3
2.8
I M
Dissolved Oxygen (percent
saturation)
5 9 55 7 1 -- 78 67
67 73 83 --
95 91
9 1 1 00 --
100 100
8 1 97 94 1 00 1 00
21
--
Alkalinity (mglL as CaC03 )
-- 123 136 125 134
--
-- 112 1 24 117 125 152
105 121 116 119 117
102 109 107 110 108
--
--

Table 2. Laboratory analyses of major inorganic constituents for surface waters in the Richardson Clearwater Creek area, 1983
Sampling locations: Site 1 : Richardson Clearwater Creek near Vanderbilt's Cabin Site 2: Tributary #2 above confluence with Richardson Clearwater Creek Site 3: Richardson Clearwater Creek above Tributary #2 Site 4: Tributary #2 near headwaters Site 5: Tributary #1 near headwaters
Hardness, Calculated (mglL as CaC03)
11 1 111 1 25 129 133
114 117 136 136 131
114 118 135 134 135
120 118 140 140 135
128 122 136 138 143
Chloride, Dissolved
Img/L)
41.0 < 1 .O 41.0 < 1 .O 4 1 .O
41.0 41.0 41.0 41.0 41.0
< 1 .O 41.0 41.0 < 1 .O 41.0
41.0 41.0 < 1 .O 41.0 < 1 .O
41.0 41.0 47.0 41.0 <1.0
Sodium Dissolved
(mglL)
3.4 3.2 3.2 3.7 3.1
2.1 2.1 2.2 2.2 2.2
4.1 3.9 3.9 4.2 4.1
2.9 2.1 2.0 2.0 2.1
3.7 2.9 3.0 3.0 3.0
Site No.
1
2
3
4
5
Sulfate, Dissolved
(mglL)
30 28 3 1 30 3 6
3 2 33 33 30 33
23 24 27 25 3 1
29 29 33 30 3 2
20 20 21 20 22
Potassium, Dissolved
(mg/L)
3.3 3.3 2.5 2.9 3.7
3.6 3.6 2.5 2.9 3.7
2.6 2.7 2.0 2.0 2.5
3.3 3.4 2.4 2.5 2.8
2.3 2.5 2.0 1.9 2.0
Calcium, Dissolved
(mg/L)
33 33 38 40 41
3 5 3 6 43 43 41
34 35 41 40 41
38 3 7 45 45 43
3 9 37 42 43 44
Date
22 JUN 1983 06 JUL 1983 27 JUL 1983 01 SEP 1983 27 OCT 1983
22 JUN 1983 06 JUL 1983 26 JUL 1983 01 SEP 1983 27 OCT 1983
22 JUN 1983 06 JUL 1983 26 JUL 1983 01 SEP 1983 27 OCT 1983
22 JUN 1983 06 JUL 1983 25 JUL 1983 01 SEP 1983 27 OCT 1983
22 JUN 1983 06 JUL 1983 25 JUL 1983 01 SEP 1983 27 OCT 1983
Magnesium, Dissolved
(mg/L)
6.9 6.9 7.3 7.2 7.5
6.5 6.5 6.9 6.9 6.9
7.2 7.4 8.0 8.2 7.9
6.2 6.2 6.7 6.7 6.7
7.4 7.3 7.7 7.4 8.1
Fluoride, Dissolved
(mglL)
0.16 0.13 0.1 6 0.13 0.13
0.13 0.12 0.14 0.12 0.13
0.13 0.1 3 0.14 0.1 2 0.1 3
0.13 0.13 0.14 0.1 1 0.13
0.13 0.13 0.13 0.1 1 0.12
Total Filterable Residue,
at 180 OC (mg/L)
180 180 180 140 200
180 180 170 160 200
180 180 160 150 170
180 170 160 150 180
190 180 170 140 180

Table 2 (con). Laboratory analyses of major inorganic constituents for surface waters in the Richardson Clearwater Creek area, 1983
-- = no measurement made
Sampling locations: Site 6: Richardson Clearwater Creek above Tributary #1 Site 7: Tanana River Tributary Site 8: Delta Creek Tributary Site 9: Red-stain spring along Richardson Clearwater Creek
Hardness, Calculated (mglL as CaC03 )
-- 122 140 138 140
120 117 133 131 133
121 121 146 141 144
108
Chloride, Dissolved
(mgll-1
-- < 1 .O <1.0 <1.0 <1.0
< 1 .O <1.0 <1.0 < 1 .O < 1 .O
<1.0 <1.0 <1.0 <1.0 <1.0
<1.0
Site No.
6
7
8
9
Magnesium, Dissolved
(mg/L)
-- 8.4 8.7 9.2 9.1
8.5 8.5 8.7 9.3 8.8
6.3 6.4 8.7 6.9 7.0
7.4
Sulfate, Dissolved
(mglL)
-- 26 29 27 29
26 25 28 26 31
3 9 34 43 42 42
42
Date
22 JUN 1983 06 JUL 1983 26 JUL 1983 01 SEP 1983 28 OCT 1983
22 JUN 1983 06 JUL 1983 25 JUL 1983 01 SEP 1983 28 OCT 1983
22 JUN 1983 06 JUL 1983 25 JUL 1983 01 SEP 1983 27 OCT 1983
27 JUL 1983
Sodium Dissolved
(mglL)
-- 3.5 3.6 3.6 4.1
4.0 3.3 3.4 2.8 3.5
1.6 1.5 1 .O 1.4 1.7
2.0
Calcium, Dissolved
(mg/L)
-- 35 42 40 41
34 3 3 3 9 3 7 3 9
38 38 44 45 46
3 1
Fluoride, Dissolved
(mglL)
-- 0.1 2 0.1 2 0.1 1 0.12
0.12 0.12 0.12 0.1 1 0.1 2
0.1 2 0.1 2 0.1 2 0.10 0.1 2
0.1 2
Potassium, Dissolved
(mglL)
-- 2.8 1.9 2.0 2.1
2.8 2.9 2.4 2.4 2.1
4.7 4.8 3.8 4.0 4.3
3.3
Total Filterable Residue,
at 180 OC (mglL)
-- 180 1 60 140 180
180 170 160 150 170
190 180 160 1 60 180
150
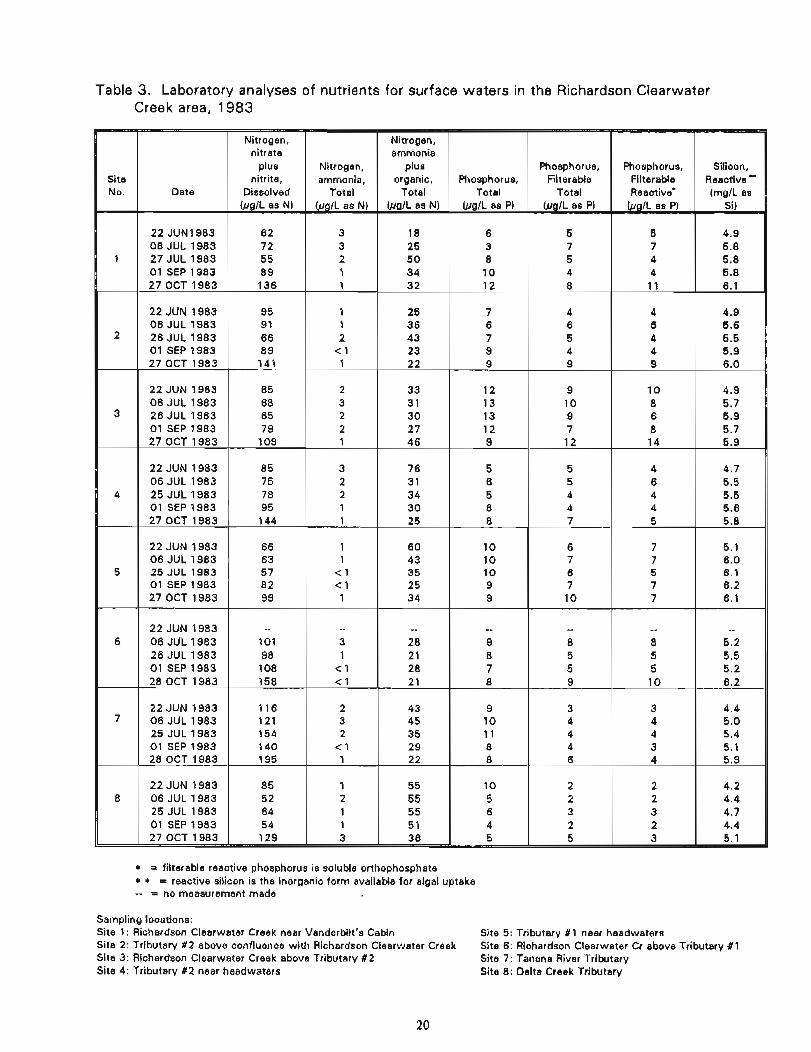
Table 3. Laboratory analyses of nutrients for surface waters in the Richardson Clearwater Creek area, 1983
* = filterable reactive phosphorus is soluble orthophosphate * * = reactive silicon is the inorganic form available for algal uptake -- = no measurement made
Site No.
1
2
3
4
5
6
7
8
Sampling locations: Site 1 : Richardson Clearwater Creek near Vanderbilt's Cabin Site 5: Tributary #1 near headwaters Site 2: Tributary #2 above confluence with Richardson Clearwater Creek Site 6: Richardson Clearwater Cr above Tributary #1 Site 3: Richardson Clearwater Creek above Tributary #2 Site 7: Tanana River Tributary Site 4: Tributary #2 near headwaters Site 8: Delta Creek Tributary
Date
22 JUN1983 06 JUL 1983 27 JUL 1983 01 SEP 1983 27 OCT 1983
22 JUN 1983 06 JUL 1983 26 JUL 1983 01 SEP 1983 27 OCT 1983
22 JUN 1983 06 JUL 1983 26 JUL 1983 01 SEP 1983 27 OCT 1983
22 JUN 1983 06 JUL 1983 25 JUL 1983 01 SEP 1983 27 OCT 1983
22 JUN 1983 06 JUL 1983 25 JUL 1983 01 SEP 1983 27 OCT 1983
22 JUN 1983 06 JUL 1983 26 JUL 1983 01 SEP 1983 28 OCT 1983
22 JUN 1983 06 JUL 1983 25 JUL 1983 01 SEP 1983 28 OCT 1983
22 JUN 1983 06 JUL 1983 25 JUL 1983 01 SEP 1983
, 27 0CT 1983
Nitrogen, nitrate
plus nitrite,
Dissolved (flglL as N)
6 2 7 2 5 5 8 9 136
95 91 66 8 9 141
65 68 65 7 9 109
8 5 7 5 7 8 95 144
66 63 5 7 8 2 99
-- 101 98 108 158
116 121 154 140 195
85 5 2 64 5 4
, 129
Nitrogen, ammonia,
Total (pglL as N)
3 3 2 1 1
1 1 2
< 1 1
2 3 2 2 1
3 2 2 1 1
1 1
< 1 < 1 1
-- 3 1
< 1 < 1
2 3 2
< 1 1
1 2 1 1 3
Nitrogen, ammonia
plus organic,
Total @g/L as N)
18 25 50 34 32
25 3 6 43 23 2 2
33 3 1 30 2 7 4 6
7 6 3 1 34 30 25
60 43 35 25 34
-- 28 2 1 28 2 1
43 45 35 2 9 2 2
55 55 55 5 1 3 6
Phosphorus, Total
(flg/L as PI
6 3 8 10 12
7 6 7 9 9
12 13 13 12 9
5 6 5 8 8
10 10 10 9 9
-- 9 8 7 8
9 10 11 8 8
10 5 6 4 5
Phosphorus, Filterable
Total (flg/L as P)
5 7 5 4 8
4 6 5 4 9
9 10 9 7 12
5 5 4 4 7
6 7 6 7 10
-- 8 5 5 9
3 4 4 4 6
2 2 3 2 5
Phosphorus, Filterable Reactive*
(pglL as P)
5 7 4 4 11
4 6 4 4 9
10 8 6 8 14
4 6 4 4 5
7 7 5 7 7
-- 8 5 5 10
3 4 4 3 4
2 2 3 2 3
Silicon, Reactive " (mglL as
Si)
4.9 5.8 5.8 5.8 6.1
4.9 5.6 5.5 5.9 6.0
4.9 5.7 5.9 5.7 5.9
4.7 5.5 5.5 5.6 5.8
5.1 6.0 6.1 6.2 6.1
-- 5.2 5.5 5.2 6.2
4.4 5.0 5.4 5.1 5.9
4.2 4.4 4.7 4.4 5.1

Table 4. Laboratory analyses of total trace elements for surface waters in the Richardson Clearwater Creek area, July 6, 1983
-- = no measurement made = sampled on July 27, 1983
Sampling locations: Site 1 : Richardson Clearwater Creek near Vanderbilt's Cabin Site 2: Tributary #2 above confluence with Richardson Clearwater Cr Site 3: Richardson Clearwater Creek above Tributary #2
Site4: Tributary #2 near headwaters Site 7: Tanana River Tributary Site 5: Tributary #1 near headwaters Site 8: Delta Creek Tributary Site 6: Richardson Clearwater Cr above Tributary #1 Site 9: Spring along Richardson Clearwater Cr
Barium, Total (pglL)
150
160
170
170
1 60
110
8 1
94
--
Arsenic, Total
(pg/L)
< 2
< 2
< 2
< 2
< 2
< 2
< 2
Site No.
1
2
3
4
5
6
7
Beryllium, Total
(pglL)
< 2
< 2
< 2
< 2
< 2
< 2
< 2
< 2
--
8
9
Aluminum, Total (pglL)
< 75
< 75
< 75
< 75
< 75
< 75
< 75
Antimony, Total (pglL)
<10
<10
<10
< 10
< 10
<10
Boron, Total (pg/L)
< 50
50
< 50
< 50
< 50
65
< 50
< 50
--
< 75
--
Cadmium, Total (pg/L)
<0.5
<0.5
<0.5
<0.5
<0.5
<0.5
<0.5
<0.5
--
<lo 1 <10
--
Chromium, Total (pg1L)
< 5
< 5
<5
< 5
< 5
<5
< 5
< 5
--
< 2
--
Copper, Total (pglL)
<5
<5
< 5
<5
<5
< 5
<5
<5
--
Iron, Total (pgIL)
12
9.8
9.3
15
13
7.3
9 1
49
430'
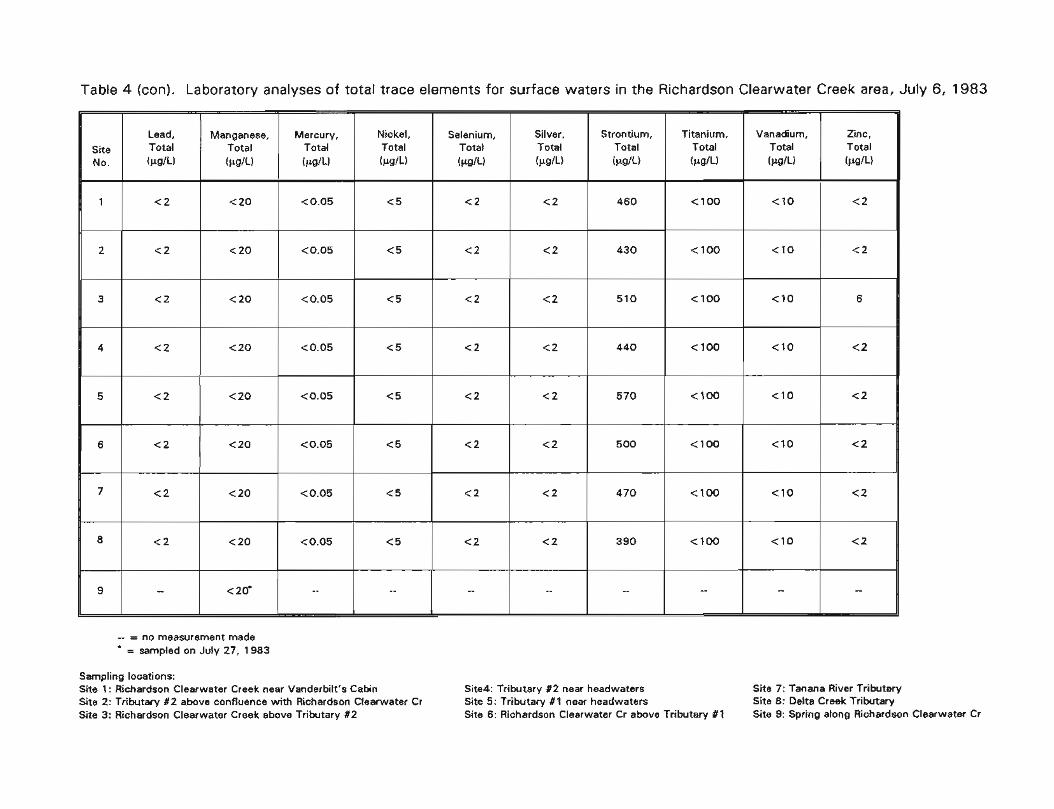
Table 4 (con). Laboratory analyses of total trace elements for surface waters in the Richardson Clearwater Creek area, July 6, 1983
-- = no measurement made = sampled on July 27, 1983
Sampling locations: Site 1 : Richardson Clearwater Creek near Vanderbilt's Cabin Site 2: Tributary #2 above confluence with Richardson Clearwater Cr Site 3: Richardson Clearwater Creek above Tributary #2
Zinc, Total (pg/L)
< 2
< 2
6
< 2
< 2
< 2
< 2
< 2
--
Site4: Tributary #2 near headwaters Site 7: Tanana River Tributary Site 5: Tributary #1 near headwaters Site 8: Delta Creek Tributary Site 6: Richardson Clearwater Cr above Tributary #1 Site 9: Spring along Richardson Clearwater Cr
Vanadium, Total (pg/L)
<10
<10
< 10
<10
<10
<10
<10
<10
--
Selenium, Total (pg/L)
< 2
< 2
< 2
< 2
< 2
< 2
< 2
< 2
--
Site No.
1
2
3
4
5
6
7
8
9
Manganese, Total
(pg/L)
< 20
< 20
< 20
< 20
< 20
< 20
< 20
< 20
< 20'
Lead, Total (pg/L)
< 2
< 2
< 2
< 2
< 2
<2
< 2
< 2
--
Silver, Total (pg/L)
< 2
< 2
< 2
< 2
< 2
< 2
< 2
< 2
--
Mercury, Total
(pg/L)
<0.05
<0.05
<0.05
<0.05
<0.05
<0.05
< 0.05
<0.05
--
Strontium, Total (pg/L)
460
430
510
440
570
500
470
390
--
Nickel, Total (pg/L)
<5
< 5
< 5
< 5
<5
< 5
< 5
< 5
--
Titanium, Total (pglL)
<I00
<lo0
<lo0
<I00
<I00
<I00
<I00
<I00
--
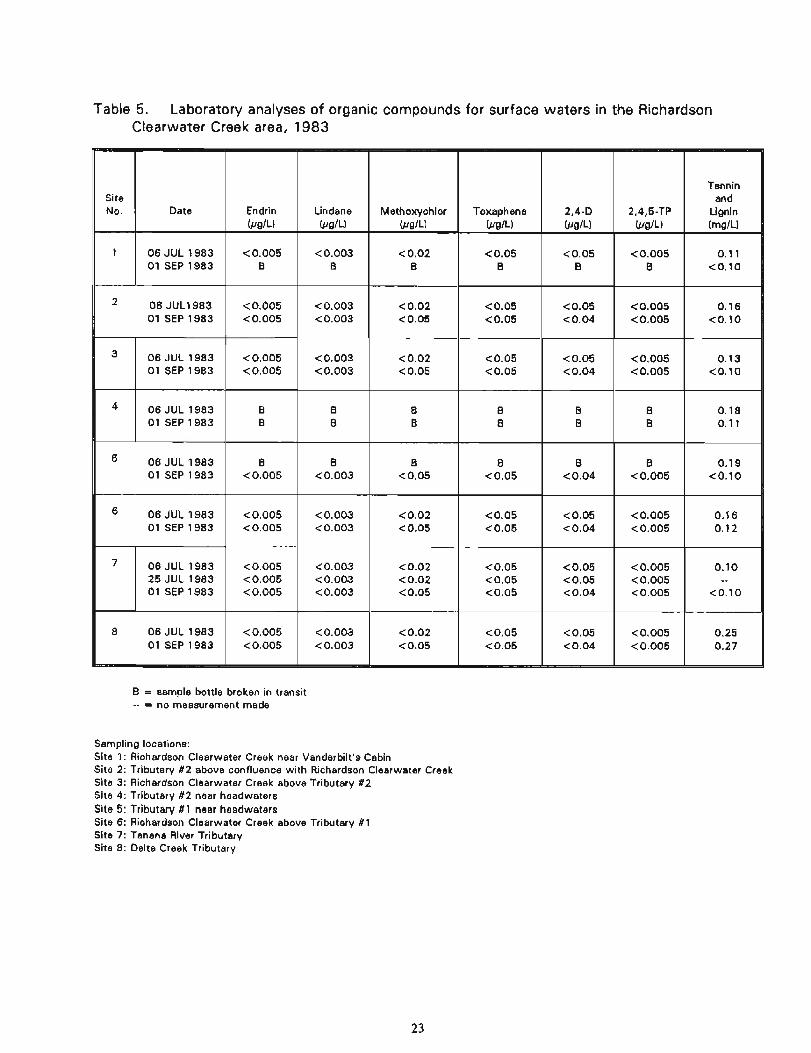
Table 5. Laboratory analyses of organic compounds for surface waters in the Richardson Clearwater Creek area, 1983
B = sample bottle broken in transit -- = no measurement made
1
'
8
Sampling locations: Site 1: Richardson Clearwater Creek near Vanderbilt's Cabin Site 2: Tributary #2 above confluence with Richardson Clearwater Creek Site 3: Richardson Clearwater Creek above Tributary #2 Site 4: Tributary #2 near headwaters Site 5: Tributary #1 near headwaters Site 6: Richardson Clearwater Creek above Tributary #1 Site 7: Tanana River Tributary Site 8: Delta Creek Tributary
06 JUL 1983 01 SEP 1983
06JUL1983 01 SEP 1983
06 JUL 1983 01 SEP 1983
06 JUL 1983 01 SEP 1983
06 JUL 1983 01 SEP 1983
06 JUL 1983 01 SEP 1983
06 JUL 1983 25 JUL 1983 01 SEP 1983
06 JUL 1983 01 SEP 1 983
<0.005 B
<0.005 <0.005
<0.005 <0.005
B B
B <0.005
<0.005 <0.005
<0.005 <0.005 <0.005
<0.005 < 0.005
<0.003 B
<0.003 <0.003
<0.003 <0.003
B B
B <0.003
< 0.003 <0.003
< 0.003 < 0.003 < 0.003
< 0.003 < 0.003
< 0.02 B
<0.02 <0.05
<0.02 <0.05
B B
B <0.05
<0.02 <0.05
<0.02 <0.02 <0.05
<0.02 <0.05
< 0.05 B
< 0.05 < 0.05
<0.05 <0.05
B B
B <0.05
<0.05 <0.05
<0.05 < 0.05 <0.05
<0.05 <0.05
<0.05 B
<0.05 <0.04
<0.05 <0.04
B B
B <0.04
<0.05 <0.04
<0.05 <0.05 <0.04
<0.05 <0.04
<0.005 B
<0.005 < 0.005
<0.005 <0.005
B B
B < 0.005
<0.005 <0.005
<0.005 <0.005 <0.005
< 0.005 <0.005
0.1 1 <0.10
0.16 CO.10
0.13 <0.10
0.18 0.1 1
0.19 <0.10
0.16 0.1 2
0.10 --
<0.10
0.25 0.27

Table 6. Taxa and number of organisms per meter2 of benthic invertebrates collected in Richardson Clearwater Creek, July 25-27, 1983 Sampling sites are shown in Figure 2. Mineral = Mineral Substrate; S Moss = Sparse Moss; D Moss = Dense Moss.
Turbellaria (flatworms) Nematoda (roundworms)
Oligochaeta (earthworms) Hirudinea (leeches) Pelecypoda (clams)
Hydracarina (water mites) Ostracoda (seed shrimp)
Copepoda Amphipoda (scuds)
Ephemeroptera (mayflies) Baetis bicaudatus Cin ygmula sp. Ephernerella doddsi
Plecoptera (stoneflies)
Chloroperlidae Perlodidae lsoperla ebria Capniidae Zapada cinctipes Zapata oregonensis
Trichoptera (caddisflies) Limnephilidae Apatania sp. Ecclisom yia sp. Glossosoma sp. Rh yacophila vepulsa
Diptera (true flies)
Empididae Chelifera sp. Chironomidae Dicranota sp. Atherix sp. Palpornvia sp. Pericoma sp. Limnophora sp. Simu/ium sp. Prosimuliurn sp.
Total organisms/meter2
260 10
5350 3650
940 1930
10 10 90
170 11960
10
80 210 770
10
410 14400
30
40
42840
220 10
10330 690
1720 1580
70
90
380 13970
10
470 360 410
30
1580 35900
10
40 10
170
69740
290
1510 1 540
4180 1020
20 180 100
10 1 80
4780
60 9 60 30
580 6090
10
23660
100
1100 110
10 4130 1720
240
10 50
2530
10 30
1 700 60
580 1 980
10
10
1 5780
40
1940 38120
2940 1370 220
60 50
120 1570
90 380
10
1 50 9410
30
57370
1 60
10720 8480
1 60 1 60
4960 1 280 1 280
480
6880 6400
1120 1 60
480 176160
1 60
1 440 320
224800
370
2200 1 60
220 10
200 10
890
10 30
230 5 60 950
60 2000
16180 30 10
10 20 80 20
2581 0
640
4640 2400 480
800
1 60
480
1 600 13280
1 60
1 280
320 104000
1 60
480 2880
1 37600
2780
130 31 90
10
30
290
90
60 10970
360
10
20690
1 60
480 2560 800 640 9 60
1120
480
46720 480
54720
250
3200 1270
260
2630 1070 700
10 150
1 920 4030
10 30
290
1 40 17790
30 1 790
36840
3520
20000 22080 41 60
7040 800
640
9 60
9920 5600
480
320
640 243840
1 60
160
342240
7780 1570
10
330 10
270
40430 10
51 850

Table 7. Taxa and number of organisms per meter2 of benthic invertebrates collected in Richardson Clearwater Creek, October 27-28, 1983 Sampling sites are shown in Figure 2. Mineral = Mineral Substrate; S Moss = Sparse Moss; D Moss = Dense Moss.
Ecclisom yia sp. Glossosoma sp.
Chironomidae
Hesperoconopa sp.
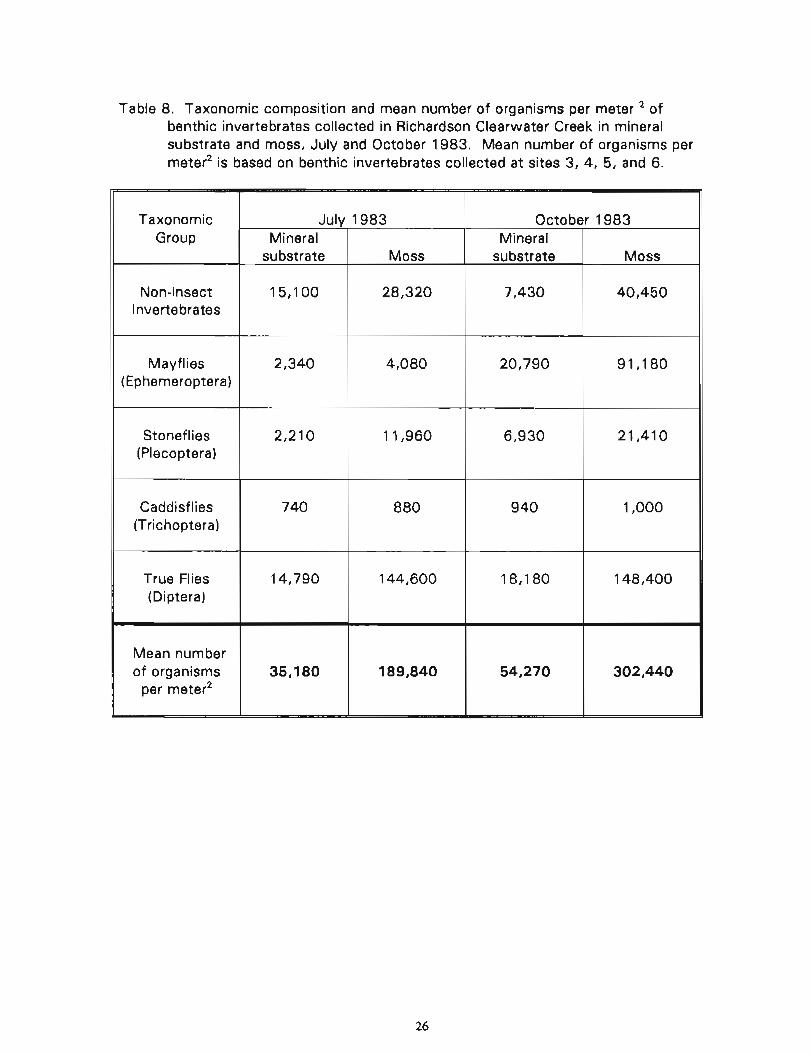
Table 8. Taxonomic composition and mean number of organisms per meter of benthic invertebrates collected in Richardson Clearwater Creek in mineral substrate and moss, July and October 1983. Mean number of organisms per meter2 is based on benthic invertebrates collected at sites 3, 4, 5, and 6.
Taxonomic Group
Non-insect Invertebrates
Mayflies (Ephemeroptera)
Stoneflies (Plecoptera)
Caddisflies (Trichoptera)
True Flies (Diptera)
Mean number of organisms
per meter2
July Mineral
substrate
15,100
2,340
2,210
740
14,790
35,180
1983
Moss
28,320
4,080
1 1,960
880
144,600
189,840
October Mineral
substrate
7,430
20,790
6,930
940
18,180
54,270
1983
Moss
40,450
91 ,I 80
21,410
1,000
1 48,400
302,440