Embed Size (px)
Citation preview
MINISTRY OF LANDS & NATURAL RESOURCES
Water Quality Test Results Post TC Gita Water Quality Assessment – ‘EUA
Water Resources Section
Natural Resources Division— Ministry of Lands, Survey and Natural Resources
T: 22709 E: [email protected]
POST TC GITA WATER QUALITY RESULTS IN ‘EUA
Water Resources Section Ministry of Lands & Natural Resources
1
Introduction The purpose of this report is to present the results of water quality testing of water sources of ‘Eua
following the Tropical Cyclone Gita. This is a joint assessment with NEMO and WASH cluster. This report
also aims to provide awareness of the existing conditions of the water quality of water sources across
Tongatapu during and after Tropical Cyclone Gita.
It provides information on the background of the water sources, procedures, results and discussions of
the water quality tests that had been carried out. Water Quality testing of water samples are
undertaken at the Natural Resources Division and most information is extracted from Hydrogeological
monitoring data from the Water Resources Section (WRS) of the Natural Resources Division of the
Ministry of Lands, Survey and Natural Resources.
The interpretation of the data is theoretical and backed by examples both within the Kingdom and
abroad. The Ministry, WRS or the author of this document shall not be held liable to any impacts for the
use of the content of this document.
Table of Contents
INTRODUCTION 1
TABLE OF CONTENTS 1
BACKGROUND 2
PROCEDURES 6
RESULTS & DISCUSSIONS 8
SALINITY & PH TESTING RESULTS 8
NUTRIENT TESTING RESULTS 11
MICROBIOLOGICAL TESTING RESULTS 15
RECOMMENDATIONS 16
REFERENCES 16
POST TC GITA WATER QUALITY RESULTS IN ‘EUA
Water Resources Section Ministry of Lands & Natural Resources
2
Background Tropical Cyclone Gita struck the mainland Tongatapu and neighboring island of ‘Eua and the most South
Eastern islands of the Ha’apai Group evening of 12th of February to the early morning of the 13th of
February. Cyclone Gita classified as a category 4 Tropical Cyclone and one of the worst to have struck
the islands in past ten years.
This joint assessment into the status of water, health and sanitation of the people on the mainland
required water quality testing which was carried out by the Water Resources Section. There had been an
assessment of water quality in the mainland Tongatapu had been carried out on from the 15th -18th of
February with results reported out. The assessment of water quality of water sources in ’Eua had been
carried out from the 24th of February to the 3rd of March. This
water quality assessment was carried out by a team of 4 Water
Resources Section staff and a New Zealand volunteer from the
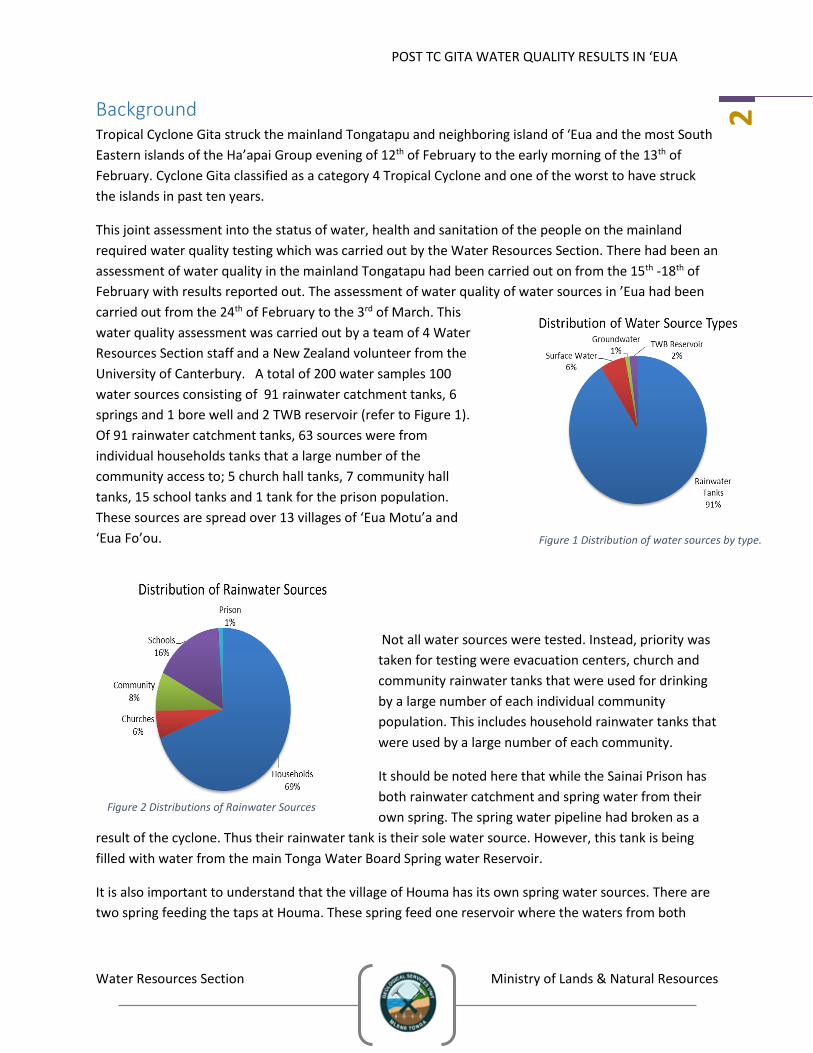
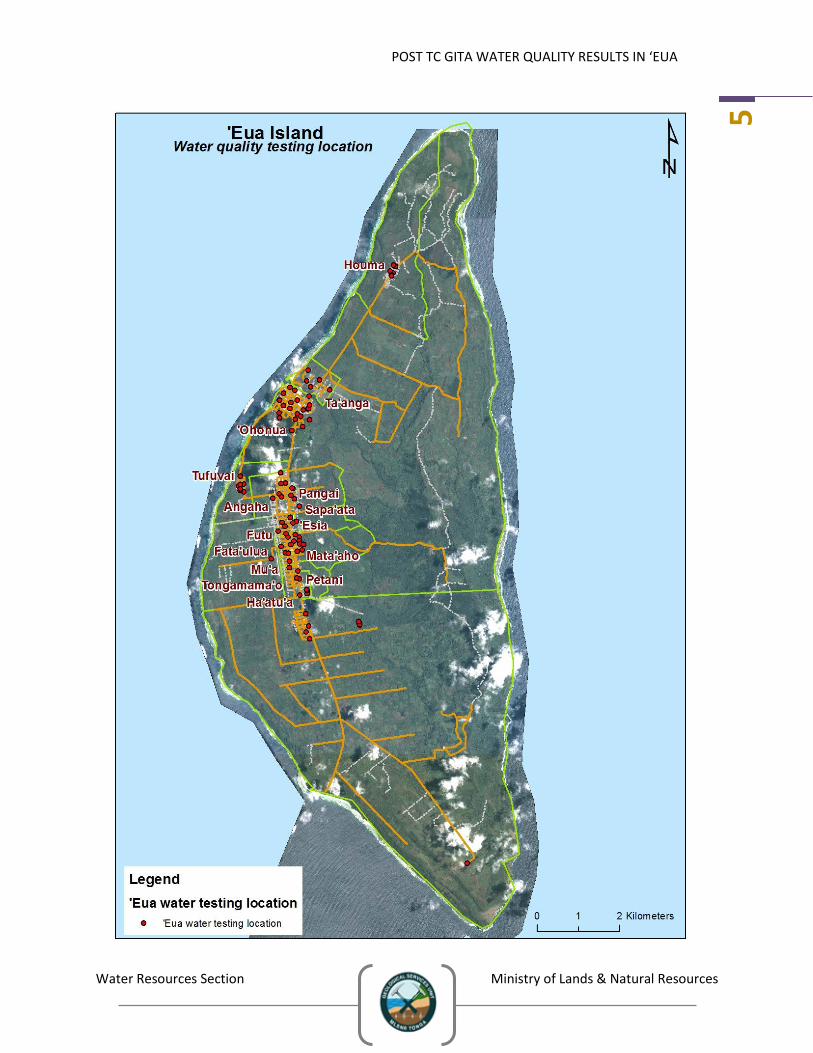
University of Canterbury. A total of 200 water samples 100
water sources consisting of 91 rainwater catchment tanks, 6
springs and 1 bore well and 2 TWB reservoir (refer to Figure 1).
Of 91 rainwater catchment tanks, 63 sources were from
individual households tanks that a large number of the
community access to; 5 church hall tanks, 7 community hall
tanks, 15 school tanks and 1 tank for the prison population.
These sources are spread over 13 villages of ‘Eua Motu’a and
‘Eua Fo’ou.
Not all water sources were tested. Instead, priority was
taken for testing were evacuation centers, church and
community rainwater tanks that were used for drinking
by a large number of each individual community
population. This includes household rainwater tanks that
were used by a large number of each community.
It should be noted here that while the Sainai Prison has
both rainwater catchment and spring water from their
own spring. The spring water pipeline had broken as a
result of the cyclone. Thus their rainwater tank is their sole water source. However, this tank is being
filled with water from the main Tonga Water Board Spring water Reservoir.
It is also important to understand that the village of Houma has its own spring water sources. There are
two spring feeding the taps at Houma. These spring feed one reservoir where the waters from both
Figure 1 Distribution of water sources by type.
Figure 2 Distributions of Rainwater Sources

POST TC GITA WATER QUALITY RESULTS IN ‘EUA
Water Resources Section Ministry of Lands & Natural Resources
3
springs are blended together prior to distribution to the village. The team was only able to sample this
spring water at a household tap in the village as the road and paths to the spring were inaccessible.
Furthermore, the 4 springs
Pekepeka, Matavai, Fern Gully
and Saoa were sampled at
each of the main pipeline that
brings water from the springs
into the TWB reservoir field in
Petani. Again this was due to
inaccessible roads.
The springs at Hango
Agriculture School was also
tested in the same manner.
There are currently 3 bore wells in ‘Eua but only two have pumps installed and are operating. The two
bore wells operating belong to the Tonga Water Board (TWB). These two bore wells are located in
‘Ohonua and is pumped into its own reservoir whereby the groundwater is blended with spring water
from the reservoirs in Petani. Only one of these bore well was accessible for measurements and testing.
Fecal coliform is a specific subgroup of a collection of relatively harmless microorganisms that live in
large number in the intestines of the warm and cold blooded animals. The most common member
being Escherichia coli. These organisms may be repeated from the total coliform group by their ability to
grow at elevated temperatures and are associated only with the fecal material of warm blooded
animals.
The presence of fecal coliform bacteria in water sources indicate that the water has been contaminated
with the fecal material of man or other animals. When this occurs, the source water may have been
contaminated by pathogens or disease-producing bacteria or viruses which can also exist in fecal
material. Some water-borne pathogenic diseases include typhoid fever, viral, and bacterial
gastroenteritis and hepatitis A. The presence of fecal contamination is an indicator that a potential
health risk exists for individuals exposed to this water.
Although there are a few indicators of various forms of pollution readily available to be tested for in
water. The WRS perform tests for levels of Nitrate, Phosphate and Ammonia as an indicator of possible
pollutions in water sources. These three nutrients are normally occurring in water sources and only
when water sources are comprised that they occur in high levels (WHO, 2008).
High levels of nitrate detected in drinking water could be due to excessive use of agriculture fertilizers,
domestic effluent, and sewage disposal industrial discharges contaminating water sources. It is
recommended that Nitrate not exceed 10mg per litre in water sources (WHO, 2008).
Figure 3 TWB reservoir field. Assistant geologist 'Amelia Sili is standing in front of the individual pipeline from different springs.
POST TC GITA WATER QUALITY RESULTS IN ‘EUA
Water Resources Section Ministry of Lands & Natural Resources
4
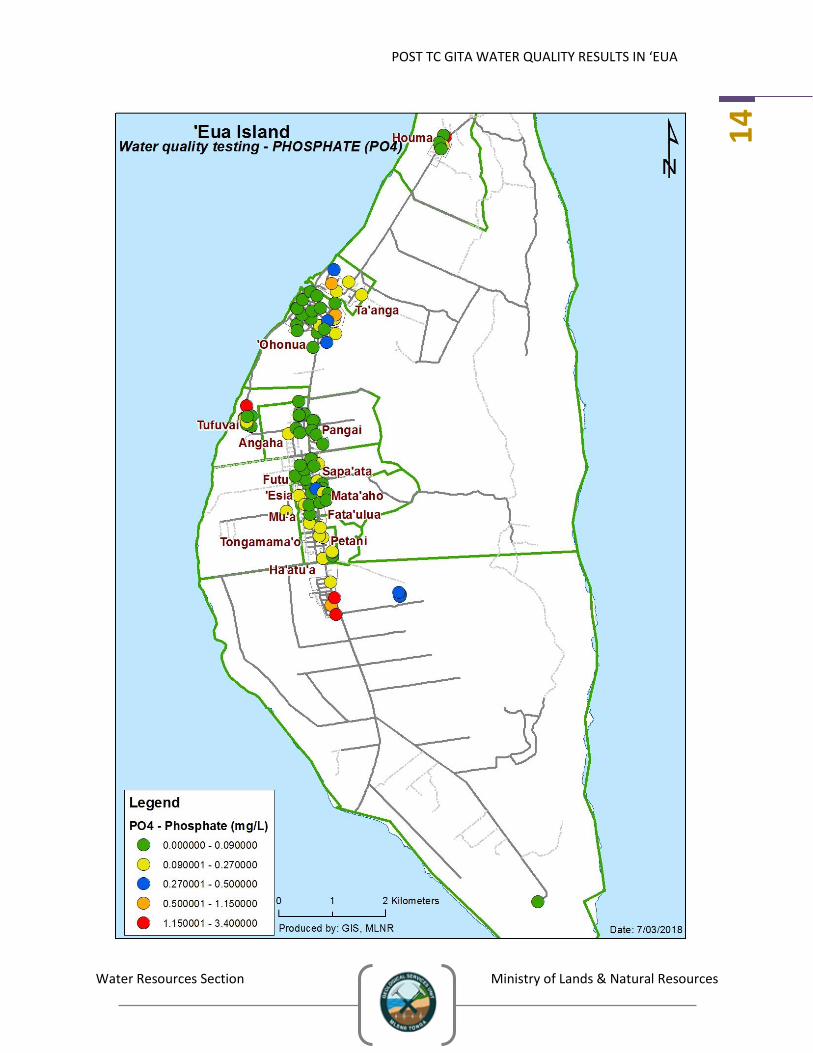
High levels of Phosphate may result from the breakdown of organic pesticides which contain
phosphates. High levels of phosphate in water sources is a major concern in terms of eutrophication in
waterways and algae growth in storage tanks, but not a major concern in terms of health risks. It is
recommended that phosphate remain at relatively low levels to ensure no eutrophication is occurring in
and at water sources and storage (WHO, 2008).
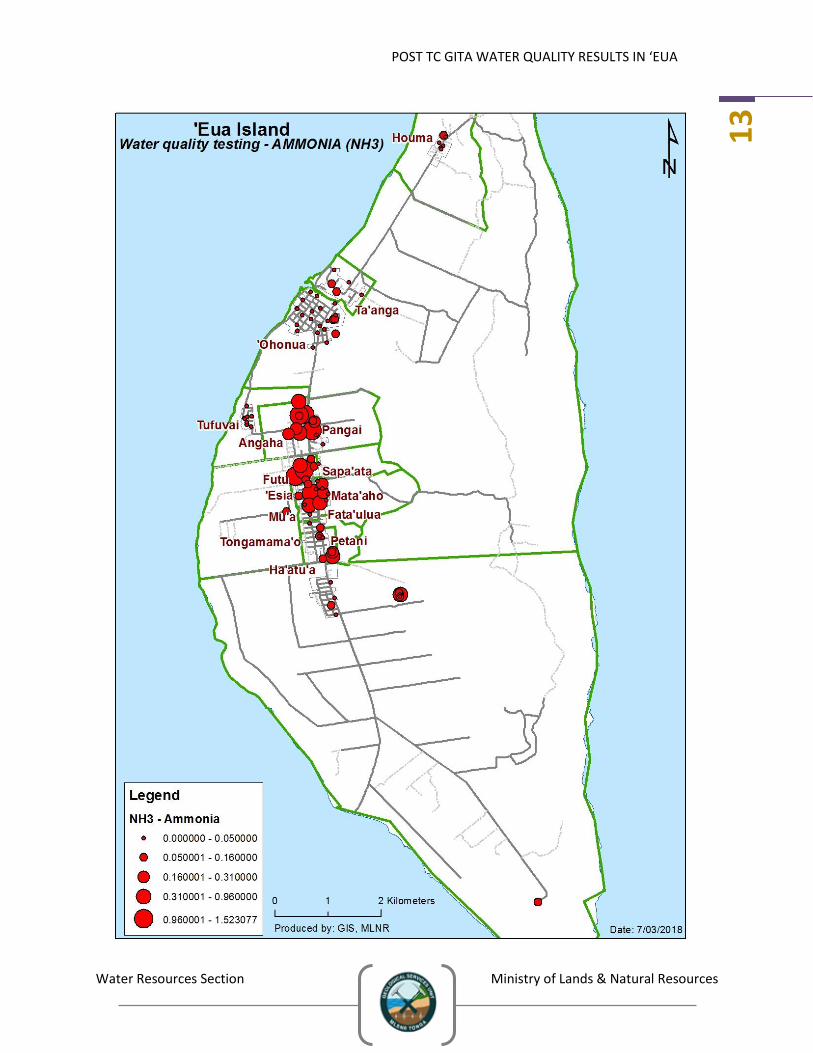
High levels of Ammonia also, indicate pollution of water sources. The acceptable limit of Ammonia in
water is 0.5mg per litre in water sources (WHO, 2008).
Apart from directly affecting the taste of water, these nutrients are more than often readily available in
many water sources.
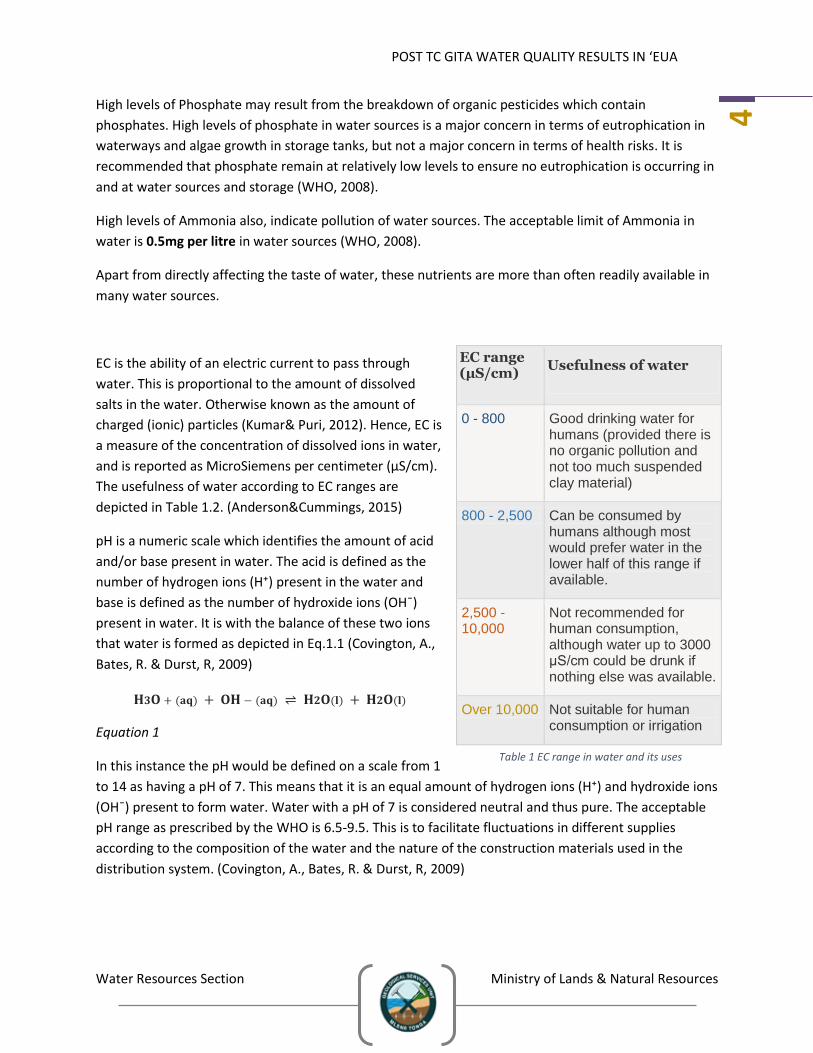
EC is the ability of an electric current to pass through
water. This is proportional to the amount of dissolved
salts in the water. Otherwise known as the amount of
charged (ionic) particles (Kumar& Puri, 2012). Hence, EC is
a measure of the concentration of dissolved ions in water,
and is reported as MicroSiemens per centimeter (μS/cm).
The usefulness of water according to EC ranges are
depicted in Table 1.2. (Anderson&Cummings, 2015)
pH is a numeric scale which identifies the amount of acid
and/or base present in water. The acid is defined as the
number of hydrogen ions (H⁺) present in the water and
base is defined as the number of hydroxide ions (OH¯)
present in water. It is with the balance of these two ions
that water is formed as depicted in Eq.1.1 (Covington, A.,
Bates, R. & Durst, R, 2009)
𝐇𝟑𝐎 + (𝐚𝐪) + 𝐎𝐇 − (𝐚𝐪) ⇌ 𝐇𝟐𝐎(𝐥) + 𝐇𝟐𝐎(𝐥)
Equation 1
In this instance the pH would be defined on a scale from 1
to 14 as having a pH of 7. This means that it is an equal amount of hydrogen ions (H⁺) and hydroxide ions
(OH¯) present to form water. Water with a pH of 7 is considered neutral and thus pure. The acceptable
pH range as prescribed by the WHO is 6.5-9.5. This is to facilitate fluctuations in different supplies
according to the composition of the water and the nature of the construction materials used in the
distribution system. (Covington, A., Bates, R. & Durst, R, 2009)
EC range (μS/cm)
Usefulness of water
0 - 800 Good drinking water for humans (provided there is no organic pollution and not too much suspended clay material)
800 - 2,500 Can be consumed by humans although most would prefer water in the lower half of this range if available.
2,500 - 10,000
Not recommended for human consumption, although water up to 3000 μS/cm could be drunk if nothing else was available.
Over 10,000 Not suitable for human consumption or irrigation
Table 1 EC range in water and its uses
POST TC GITA WATER QUALITY RESULTS IN ‘EUA
Water Resources Section Ministry of Lands & Natural Resources
5
POST TC GITA WATER QUALITY RESULTS IN ‘EUA
Water Resources Section Ministry of Lands & Natural Resources
6
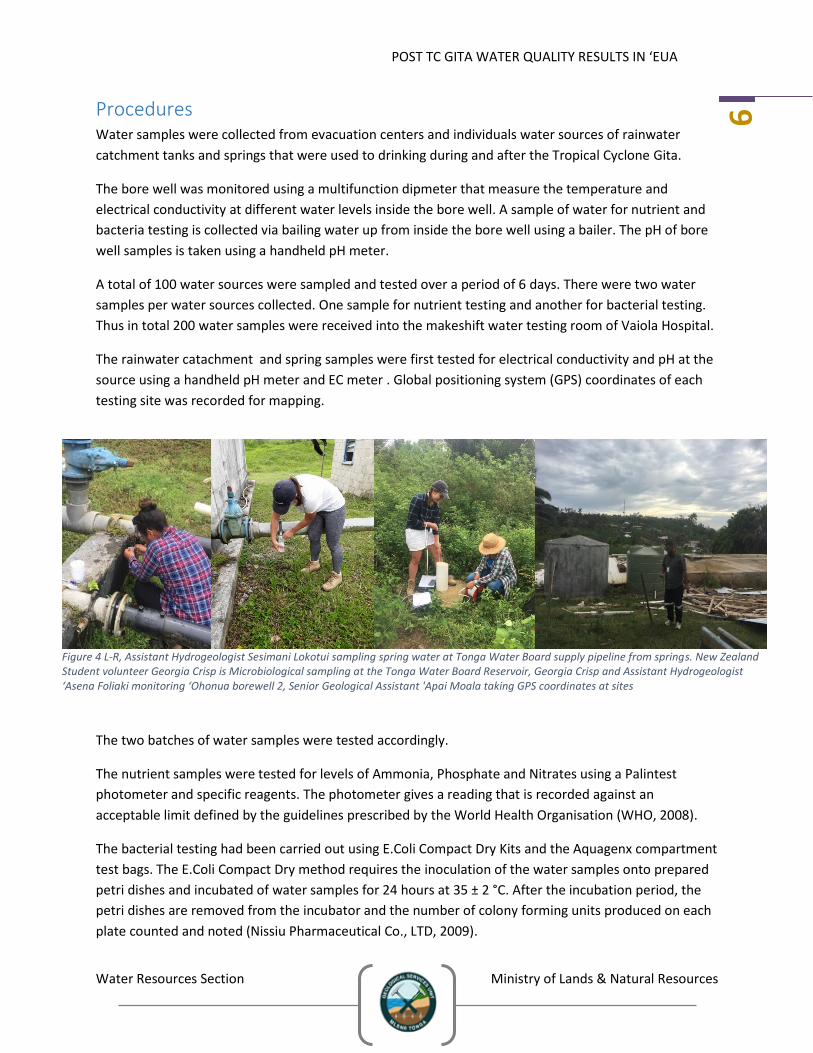
Procedures Water samples were collected from evacuation centers and individuals water sources of rainwater
catchment tanks and springs that were used to drinking during and after the Tropical Cyclone Gita.
The bore well was monitored using a multifunction dipmeter that measure the temperature and
electrical conductivity at different water levels inside the bore well. A sample of water for nutrient and
bacteria testing is collected via bailing water up from inside the bore well using a bailer. The pH of bore
well samples is taken using a handheld pH meter.
A total of 100 water sources were sampled and tested over a period of 6 days. There were two water
samples per water sources collected. One sample for nutrient testing and another for bacterial testing.
Thus in total 200 water samples were received into the makeshift water testing room of Vaiola Hospital.
The rainwater catachment and spring samples were first tested for electrical conductivity and pH at the
source using a handheld pH meter and EC meter . Global positioning system (GPS) coordinates of each
testing site was recorded for mapping.
The two batches of water samples were tested accordingly.
The nutrient samples were tested for levels of Ammonia, Phosphate and Nitrates using a Palintest
photometer and specific reagents. The photometer gives a reading that is recorded against an
acceptable limit defined by the guidelines prescribed by the World Health Organisation (WHO, 2008).
The bacterial testing had been carried out using E.Coli Compact Dry Kits and the Aquagenx compartment
test bags. The E.Coli Compact Dry method requires the inoculation of the water samples onto prepared
petri dishes and incubated of water samples for 24 hours at 35 ± 2 °C. After the incubation period, the
petri dishes are removed from the incubator and the number of colony forming units produced on each
plate counted and noted (Nissiu Pharmaceutical Co., LTD, 2009).
Figure 4 L-R, Assistant Hydrogeologist Sesimani Lokotui sampling spring water at Tonga Water Board supply pipeline from springs. New Zealand Student volunteer Georgia Crisp is Microbiological sampling at the Tonga Water Board Reservoir, Georgia Crisp and Assistant Hydrogeologist ‘Asena Foliaki monitoring ‘Ohonua borewell 2, Senior Geological Assistant 'Apai Moala taking GPS coordinates at sites
POST TC GITA WATER QUALITY RESULTS IN ‘EUA
Water Resources Section Ministry of Lands & Natural Resources
7
The Aquagenx compartment test bag requires 100ml of sample water. 100ml of sampled water was
collected using specified sampling bags that readily comes with a pill form reagent and a nutrient bud
that is added at testing site. The sampling bag will gradually change color leaving the immersed bud
colorless. The colored sample water is then tipped into a testing bag that is readily compartmentalized
into various milliliters. The color change of sample water in each compartment is noted after 24 hours of
forming units (cfu) was then counted and noted.
0100200300400500600
Ele
ctri
cal C
on
du
ctiv
ity
(μS/
cm)
Springs
Electrical Conductivity in Springs - 'Eua
Feb-18
Nov-17
Results & Discussions
Salinity & pH Testing Results
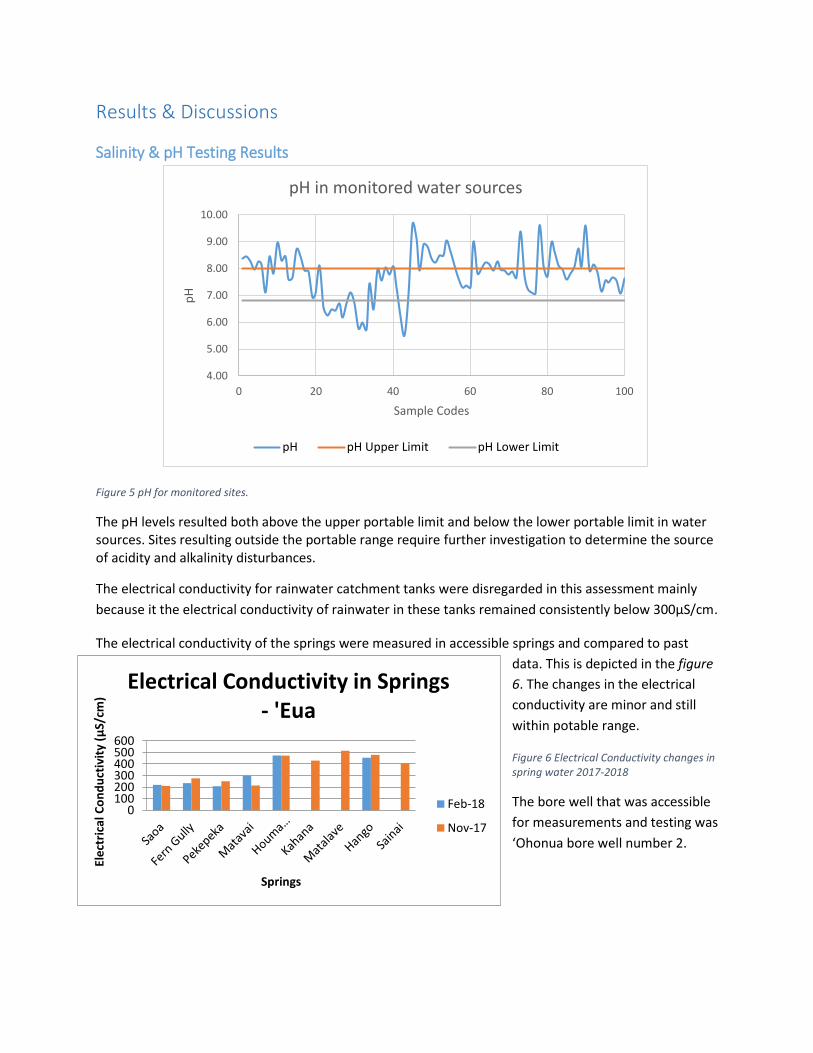
Figure 5 pH for monitored sites.
The pH levels resulted both above the upper portable limit and below the lower portable limit in water sources. Sites resulting outside the portable range require further investigation to determine the source of acidity and alkalinity disturbances.
The electrical conductivity for rainwater catchment tanks were disregarded in this assessment mainly
because it the electrical conductivity of rainwater in these tanks remained consistently below 300μS/cm.
The electrical conductivity of the springs were measured in accessible springs and compared to past
data. This is depicted in the figure
6. The changes in the electrical
conductivity are minor and still
within potable range.
Figure 6 Electrical Conductivity changes in spring water 2017-2018
The bore well that was accessible
for measurements and testing was
‘Ohonua bore well number 2.
4.00
5.00
6.00
7.00
8.00
9.00
10.00
0 20 40 60 80 100
pH
Sample Codes
pH in monitored water sources
pH pH Upper Limit pH Lower Limit

POST TC GITA WATER QUALITY RESULTS IN ‘EUA
Water Resources Section Ministry of Lands & Natural Resources
9
TWB Borewell 2
Depth to
Water level
(DWL) (m)
EC (μS/cm)Temp
(⁰C)
Total Depth
(m)
EC
(μS/cm)
Temp
(⁰C)
0.5m from
Total depth
(m)
EC
(μS/cm)
Temp
(⁰C)
1m from total
depth (m)
EC
(μS/cm)
Temp
(⁰C)
Feb-18 65.38 707 23.6 75.62 899 23.2 75.12 918 23.2 74.62 910 23.2
Nov-17 65.46 642 23.5 75.65 829 23.02
The Electrical Conductivity of the bore well number 2 was very similar to the bore well number 1 located
50m away. This means that the results from one bore well can be said to define the conditions
surrounding the neighbouring bore well.
The schematic diagram of these measurements in
the bore well seen on the left further describes the
testing sites for electrical conductivity within the
bore well.
The electrical conductivity was compared to
previous monitoring data (refer to figure 7) shows
that the electrical conductivity of Bore well 2 is only
slightly different which we refer to as no change.
The water table is also similar to last monitoring
data.
It can be said that there are no changes that can
found in this bore well that might have been the
result of the Tropical Cyclone Gita.
Figure 7 schematic diagram of measuring sites within 'Ohonua bore well 2
Figure 8. Comparative data table for 'Ohonua bore well 2
POST TC GITA WATER QUALITY RESULTS IN ‘EUA
Water Resources Section Ministry of Lands & Natural Resources
10
POST TC GITA WATER QUALITY RESULTS IN ‘EUA
Water Resources Section Ministry of Lands & Natural Resources
11
0.000
2.000
4.000
6.000
8.000
10.000
12.000
0 20 40 60 80 100
Nit
rate
Co
nce
ntr
atio
n (
mg/
L)
Sample Codes
Nitrate concentration in monitored water sources
NO3 NO₃ potable Limit
0.00
2.00
4.00
6.00
0 20 40 60 80 100
Ph
osp
hat
e (
mg/
L)
Sample Codes
Phosphate Concentration in monitored water sources
PO4 PO₄ potable limit
0.00
0.50
1.00
1.50
2.00
0 20 40 60 80 100
Am
mo
nia
(m
g/L)
Sample Codes
Ammonia Concentration in monitored water sources
NH₃ NH₃ potable limit
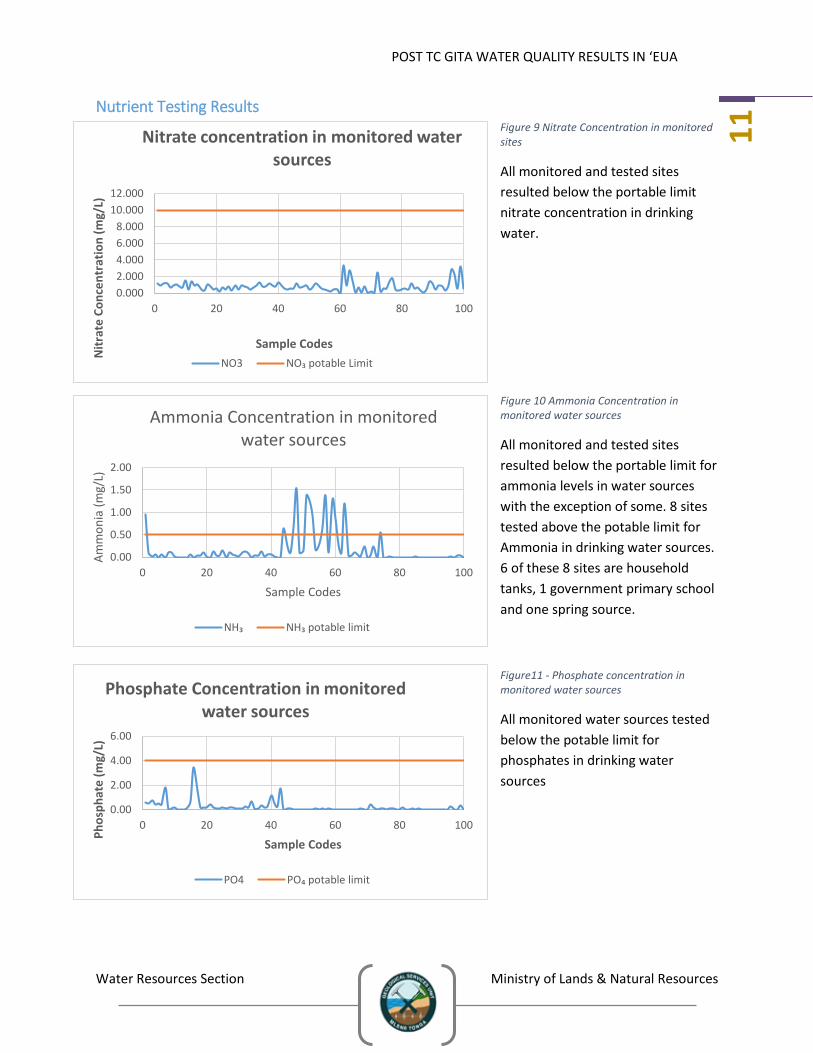
Nutrient Testing Results Figure 9 Nitrate Concentration in monitored sites
All monitored and tested sites
resulted below the portable limit
nitrate concentration in drinking
water.
Figure 10 Ammonia Concentration in monitored water sources
All monitored and tested sites
resulted below the portable limit for
ammonia levels in water sources
with the exception of some. 8 sites
tested above the potable limit for
Ammonia in drinking water sources.
6 of these 8 sites are household
tanks, 1 government primary school
and one spring source.
Figure11 - Phosphate concentration in monitored water sources
All monitored water sources tested
below the potable limit for
phosphates in drinking water
sources
POST TC GITA WATER QUALITY RESULTS IN ‘EUA
Water Resources Section Ministry of Lands & Natural Resources
12
POST TC GITA WATER QUALITY RESULTS IN ‘EUA
Water Resources Section Ministry of Lands & Natural Resources
13
POST TC GITA WATER QUALITY RESULTS IN ‘EUA
Water Resources Section Ministry of Lands & Natural Resources
14
POST TC GITA WATER QUALITY RESULTS IN ‘EUA
Water Resources Section Ministry of Lands & Natural Resources
15
0
200
400
600
800
1000
1200
1400
46 56 59 62 65 68 71 74 77 80 83 86 89 92 95 98
e.c
oli
(cfu
/10
0 m
l)
Sample Codes
E.Coli concentration in monitored water sources
0
10
20
30
40
50
60
70
80
90
100
1 4 7 10 13 16 19 22 25 28 31 34 37 40 43 47 50 53
e.c
oli
(MP
N/1
00
ml)
Sample Codes
E.Coli counts in monitored water sources
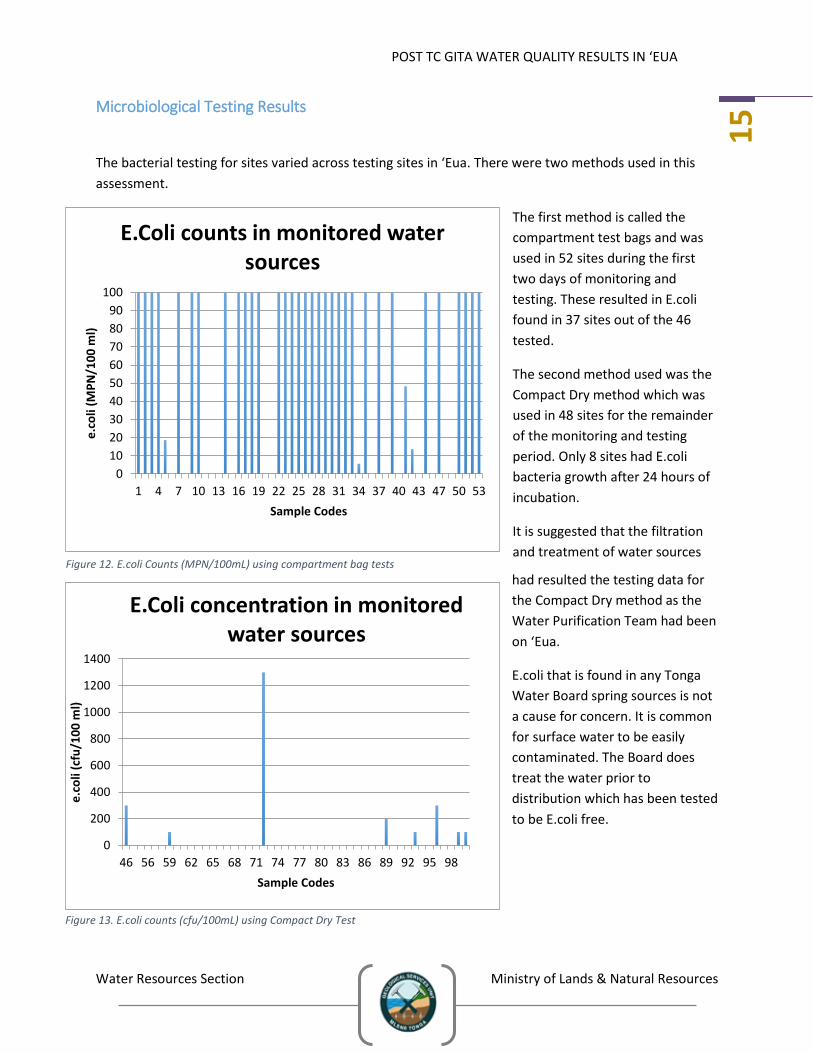
Microbiological Testing Results
The bacterial testing for sites varied across testing sites in ‘Eua. There were two methods used in this
assessment.
The first method is called the
compartment test bags and was
used in 52 sites during the first
two days of monitoring and
testing. These resulted in E.coli
found in 37 sites out of the 46
tested.
The second method used was the
Compact Dry method which was
used in 48 sites for the remainder
of the monitoring and testing
period. Only 8 sites had E.coli
bacteria growth after 24 hours of
incubation.
It is suggested that the filtration
and treatment of water sources
had resulted the testing data for
the Compact Dry method as the
Water Purification Team had been
on ‘Eua.
E.coli that is found in any Tonga
Water Board spring sources is not
a cause for concern. It is common
for surface water to be easily
contaminated. The Board does
treat the water prior to
distribution which has been tested
to be E.coli free.
Figure 12. E.coli Counts (MPN/100mL) using compartment bag tests
Figure 13. E.coli counts (cfu/100mL) using Compact Dry Test

Recommendations It is conclusive from the results that the water quality across the island varies but there is no evidence to
suggest that the water quality in ‘Eua was much affected by the Tropical Cyclone Gita
The Salinity indicated by the EC measurements coupled with the pH measurements places the water at a
very good range with the exception of some sites.
The nutrient test results dispute any possible contaminations in could and would have occurred during
the cyclone. However some sites should be investigated for point contamination for ammonia.
Although the E.coli counts are variable, it is from experience that the colony forming unit counts for rain
catchment tanks vary between 100-300 cfu/mL in Tonga. This has been attributed to the guttering and
catchment tanks conditions. There usually none found in groundwater unless contaminated.
References Anderson, H., & Cummings, D. (2015, November 17). Measuring the Salinity of Water. Retrieved January
25, 2017, from http://agriculture.vic.gov.au/agriculture/farm-management/soil-and-
water/salinity/measuring-the-salinity-of-water
Covington, A., Bates, R. & Durst, R. (2009). Definition of pH scales, standard reference values,
measurement of pH and related terminology (Recommendations 1984). Pure and Applied
Chemistry, 57(3), pp. 531-542. Retrieved 25 Jan. 2017, from doi: 10.1351/pac198557030531
Kumar, M., & Puri, A. (2012). A review of permissible limits of drinking water. Indian Journal of
Occupational and Environmental Medicine, 16(1), 40–44. http://doi.org/10.4103/0019-
5278.99696
Nissiu Pharmaceutical Co., LTD. (2009). User Mannual for Compact Dry 'Nissiu' EC for Coliform and E.Coli.
Tokyo: Nissiu Pharmaceutical Co., td.
State Water Resources Control Board. (2016). GROUNDWATER INFORMATION SHEET Salinity. California:
GAMA Program.
WHO. (2003). Ammonia in Drinking-water. Geneva: World Health Organisation.
WHO. (2003). Total dissolved solids in Drinking-water. Geneva: World Health Organisation.
WHO. (2008). Guidelines for Drinking Water Quality. Geneva: World Health Organisation.
WHO. (2011). Nitrate and Nitrite in Drinking-water. Geneva: World Health Organisation.

POST TC GITA WATER QUALITY RESULTS IN ‘EUA
Water Resources Section Ministry of Lands & Natural Resources
17