Embed Size (px)
Citation preview
WATER RESOURCES ASSESSMENT
Laura, Majuro, Marshall Islands

[2]
[SOPAC Technical Report 342 : Overmars]
[3]
[SOPAC Technical Report 342 : Overmars]
TABLE OF CONTENTS
Page
1 INTRODUCTION................................................................................................................. 5 1.1 Climate ......................................................................................................................... 6 1.2 Geology ........................................................................................................................ 6 1.3 Vegetation and Agriculture............................................................................................ 7 1.4 Population..................................................................................................................... 7 1.5 Water Demand ............................................................................................................. 8 1.6 Water Supply ................................................................................................................ 9 1.7 Wastewater................................................................................................................. 10 1.8 Sanitation Services and Extension Services ............................................................... 11 2 HYDROGEOLOGY............................................................................................................ 12 2.1 Water Balance and Recharge..................................................................................... 12 2.2 Geo-electrical Soundings............................................................................................ 13 2.3 Freshwater Lens......................................................................................................... 17 3 RECOMMENDATIONS AND FOLLOW UP ....................................................................... 19 4 REFERENCES.................................................................................................................. 20
[4]
[SOPAC Technical Report 342 : Overmars]
LIST OF FIGURES & TABLES
Figure Page
1 Majuro atoll ................................................................................................................... 6
2 Population graph of Majuro........................................................................................... 7
3 Runway rainwater catchment........................................................................................ 8
4 Freshwater-saltwater relationship under oceanic island.............................................. 12
5 Geo-electrical sounding with current flow and equipotentials ...................................... 13
6 Geophysical detection method.................................................................................... 14
7 Geo-electrical soundings Laura .................................................................................. 15
8 Depth to saline water boundary .................................................................................. 17
Table Page
1 Typical resistivity values ............................................................................................. 14
2 Five-layer model for Laura soundings ......................................................................... 16
3 Geophysical models lens ............................................................................................ 16
4 Laura freshwater lens ................................................................................................. 17
5 Laura freshwater lens USGS 1998 survey .................................................................. 18
[5]
[SOPAC Technical Report 342 : Overmars]
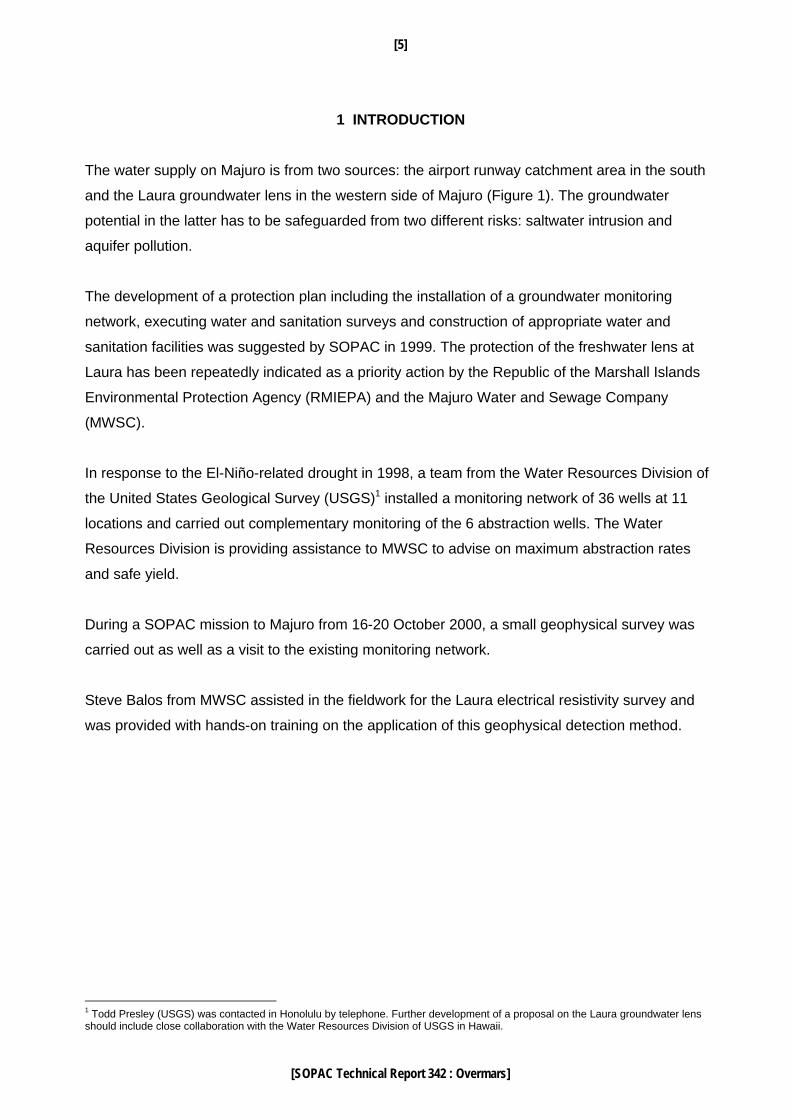
1 INTRODUCTION
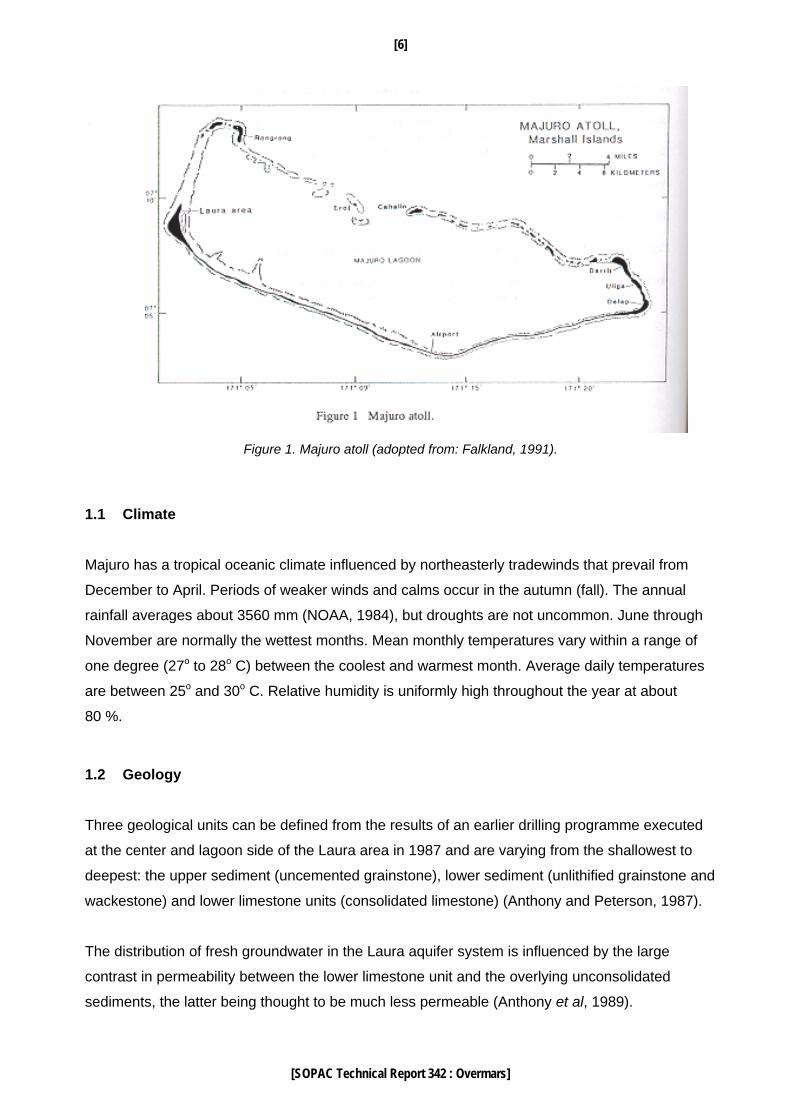
The water supply on Majuro is from two sources: the airport runway catchment area in the south
and the Laura groundwater lens in the western side of Majuro (Figure 1). The groundwater
potential in the latter has to be safeguarded from two different risks: saltwater intrusion and
aquifer pollution.
The development of a protection plan including the installation of a groundwater monitoring
network, executing water and sanitation surveys and construction of appropriate water and
sanitation facilities was suggested by SOPAC in 1999. The protection of the freshwater lens at
Laura has been repeatedly indicated as a priority action by the Republic of the Marshall Islands
Environmental Protection Agency (RMIEPA) and the Majuro Water and Sewage Company
(MWSC).
In response to the El-Niño-related drought in 1998, a team from the Water Resources Division of
the United States Geological Survey (USGS)1 installed a monitoring network of 36 wells at 11
locations and carried out complementary monitoring of the 6 abstraction wells. The Water
Resources Division is providing assistance to MWSC to advise on maximum abstraction rates
and safe yield.
During a SOPAC mission to Majuro from 16-20 October 2000, a small geophysical survey was
carried out as well as a visit to the existing monitoring network.
Steve Balos from MWSC assisted in the fieldwork for the Laura electrical resistivity survey and
was provided with hands-on training on the application of this geophysical detection method.
1 Todd Presley (USGS) was contacted in Honolulu by telephone. Further development of a proposal on the Laura groundwater lens should include close collaboration with the Water Resources Division of USGS in Hawaii.
[6]
[SOPAC Technical Report 342 : Overmars]
Figure 1. Majuro atoll (adopted from: Falkland, 1991).
1.1 Climate
Majuro has a tropical oceanic climate influenced by northeasterly tradewinds that prevail from
December to April. Periods of weaker winds and calms occur in the autumn (fall). The annual
rainfall averages about 3560 mm (NOAA, 1984), but droughts are not uncommon. June through
November are normally the wettest months. Mean monthly temperatures vary within a range of
one degree (27o to 28o C) between the coolest and warmest month. Average daily temperatures
are between 25o and 30o C. Relative humidity is uniformly high throughout the year at about
80 %.
1.2 Geology
Three geological units can be defined from the results of an earlier drilling programme executed
at the center and lagoon side of the Laura area in 1987 and are varying from the shallowest to
deepest: the upper sediment (uncemented grainstone), lower sediment (unlithified grainstone and
wackestone) and lower limestone units (consolidated limestone) (Anthony and Peterson, 1987).
The distribution of fresh groundwater in the Laura aquifer system is influenced by the large
contrast in permeability between the lower limestone unit and the overlying unconsolidated
sediments, the latter being thought to be much less permeable (Anthony et al, 1989).
[7]
[SOPAC Technical Report 342 : Overmars]
1.3 Vegetation and Agriculture
The vegetation in the Laura area includes coconut trees, palms and vegetation and babai
(swamp taro) pits, all of which are potential sources of organic matter input to the lens.
High-nitrate levels were found in shallow groundwater in the Laura area, probably as a result of
human-waste disposal and agricultural activities (pig pens and vegetable gardens). Two farms
are present in the Laura area (vegetable and fruit) and are known to apply fertilisers and a variety
of pesticides that may affect the groundwater quality.
1.4 Population
The rapid increase in population in Majuro (67 % since 1980) as a result of reduced infant death
rates, increased fertility rates and immigration from outer islands has surpassed the capacity of
existing water supplies, solid and sewage waste disposal facilities. Over 50 % of the registered
deaths in 1991 were due to diseases commonly associated with lifestyle and poor living
conditions (Barber, 1994).
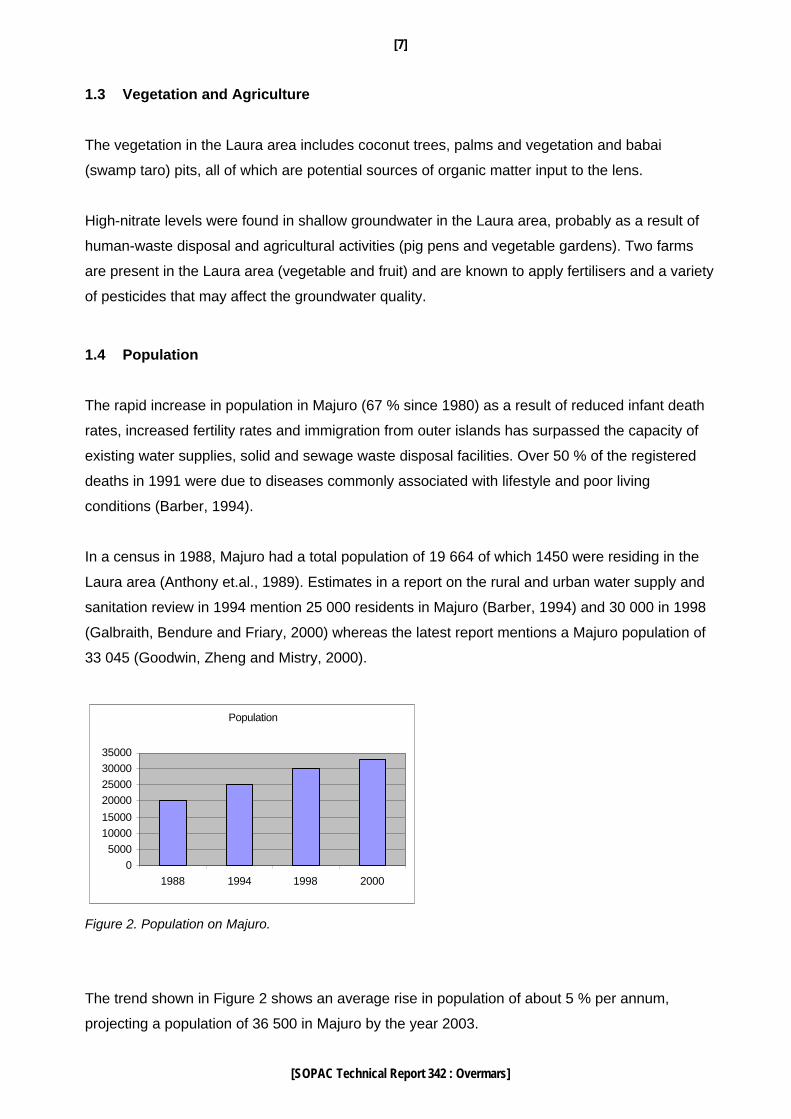
In a census in 1988, Majuro had a total population of 19 664 of which 1450 were residing in the
Laura area (Anthony et.al., 1989). Estimates in a report on the rural and urban water supply and
sanitation review in 1994 mention 25 000 residents in Majuro (Barber, 1994) and 30 000 in 1998
(Galbraith, Bendure and Friary, 2000) whereas the latest report mentions a Majuro population of
33 045 (Goodwin, Zheng and Mistry, 2000).
Population
05000
1000015000
20000250003000035000
1988 1994 1998 2000
Figure 2. Population on Majuro.
The trend shown in Figure 2 shows an average rise in population of about 5 % per annum,
projecting a population of 36 500 in Majuro by the year 2003.
[8]
[SOPAC Technical Report 342 : Overmars]
1.5 Water Demand
The Majuro Water and Sewage Company (MWSC) is a private company under contract to the
Government to provide piped water to the entire atoll; and sewerage services in the urban areas.
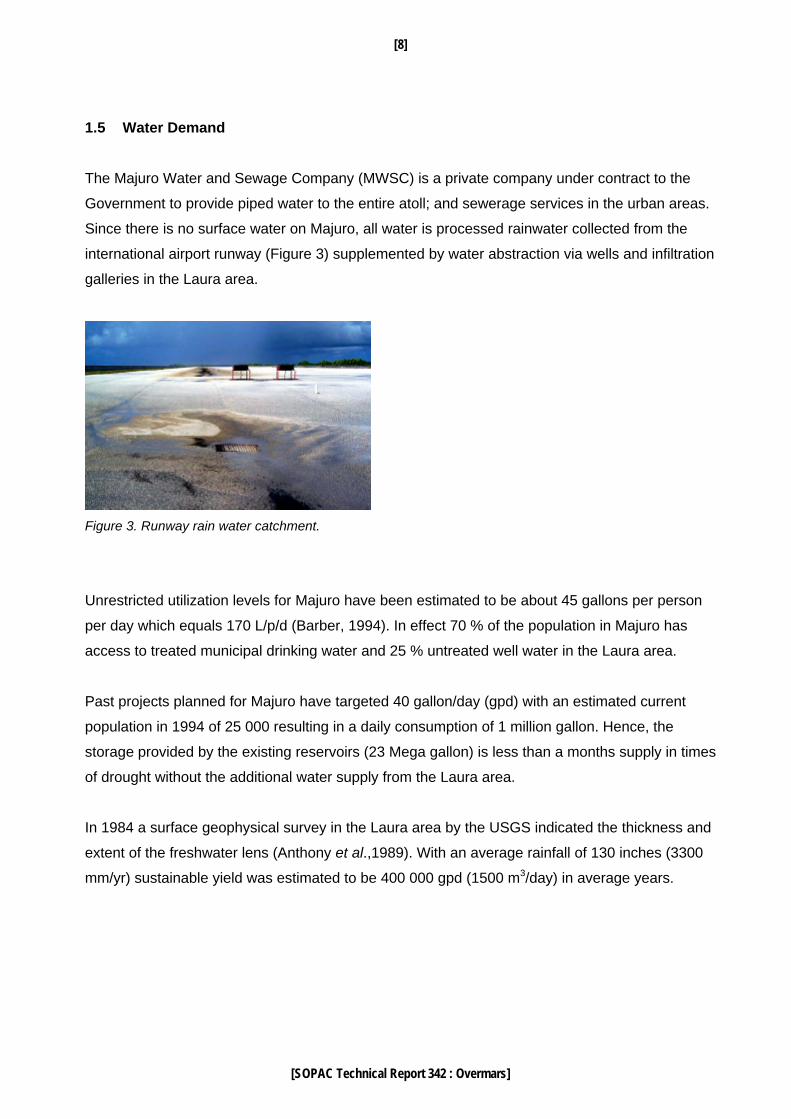
Since there is no surface water on Majuro, all water is processed rainwater collected from the
international airport runway (Figure 3) supplemented by water abstraction via wells and infiltration
galleries in the Laura area.
Figure 3. Runway rain water catchment.
Unrestricted utilization levels for Majuro have been estimated to be about 45 gallons per person
per day which equals 170 L/p/d (Barber, 1994). In effect 70 % of the population in Majuro has
access to treated municipal drinking water and 25 % untreated well water in the Laura area.
Past projects planned for Majuro have targeted 40 gallon/day (gpd) with an estimated current
population in 1994 of 25 000 resulting in a daily consumption of 1 million gallon. Hence, the
storage provided by the existing reservoirs (23 Mega gallon) is less than a months supply in times
of drought without the additional water supply from the Laura area.
In 1984 a surface geophysical survey in the Laura area by the USGS indicated the thickness and
extent of the freshwater lens (Anthony et al.,1989). With an average rainfall of 130 inches (3300
mm/yr) sustainable yield was estimated to be 400 000 gpd (1500 m3/day) in average years.
[9]
[SOPAC Technical Report 342 : Overmars]
1.6 Water Supply
The runway rainwater is conveyed through a gravity collection system to a pump station and
stored in three 5-million and two 3-million gallon2 capacity open storage ponds. Water is treated
using rapid sand filtration, chlorination and then stored in a 2-million gallon covered reservoir and
distributed to the households in the urban area known as DUD (Delap, Uliga and Darritt). The
total storage capacity is 23 million gallons (87 000 m3).
Since 1992 water is being pumped from 6 abstraction wells and infiltration galleries using low
pressure pumps which were originally rated at 70 000 gpd (circa 50 gallon/minute) each. A
seventh well (well no. 4) has not been used since 1994 because of lease problems with the
landowner. During the 6-month drought in 1992 the Laura lens was the only source of water for
all of Majuro’s residents (Barber, 1994).
Consultants discovered in 1995, that 5 wells were operational (one pump failed and was non-
operational) at a rate of only 20 gallon/minute each. The situation was corrected by repositioning
the pumps and installation of float switches after which each well delivered 50-60 gallon/minute
each for a total of about 400 000 gpd (Parsons Engineering Science, 1995).
A distribution main transports water from Laura to the airport reservoirs for treatment and
supplies water to homes and businesses along the way via a pipe to a meter on the property. An
ADB loan to improve Majuro’s water supply provided a small water treatment plant in Laura.
The Pacific Management Services Company developed a Laura Lens Monitoring Program
(PMSC, 1992) for the monitoring network that existed in 1992 following the recommendations by
USGS. The borehole sites have since been lost and a new network was installed in May 1998 by
USGS.
Data collected in the 36 monitoring wells and the 6 abstraction wells were analysed by USGS in
1998. Production wells will be shut down when chloride levels are 240 mg/l and above. During
the time of the SOPAC mission (October 2000) well no. 6 was out of production as a result of
excessive chloride levels found since 1999. Monitoring of the network has not been carried out
since 1998 but sampling and analysis of the 5 remaining abstraction wells is continued by MWSC
on a monthly basis.
2 U.S. units are used throughout the report and US gallons are meant when gallons are mentioned. Note: 1 US gallon equals 3.79 Litres.
[10]
[SOPAC Technical Report 342 : Overmars]
The assumption of 50 % evapotranspiration loss by USGS in 1984 was reviewed in 1992 by ADB
indicating that an actual loss of 25 % would be more appropriate due to the extensive coconut
tree cover. However, other studies show that coconut trees can reduce the amount of rain
reaching the aquifer. They consume high amounts of water and with a full tree cover the recharge
can reduce to about 30 % of the rainfall (Falkland, 1992).
Concern was expressed by Parsons Engineering Science (contracted by ADB) on the
Government practice of the leasing land in the Laura well field area and it was recommended to
acquire the land occupied by the facilities and to develop legislation to control the use of the land
containing the aquifer. In addition they recommended that the Government develop a building
code with a section devoted to water supply (plumbing) and roof catchments (Parsons
Engineering Science, 1995).
Data to evaluate the lens performance and capacity is not available due to a lack of monitoring at
observation wells. In the position statement on the Rural and Urban Water and Sanitation
Review, it was indicated that the potential existed to increase the daily supply from the Laura lens
but suggested that a detailed study would be necessary to redefine sustainable yield (Barber,
1994).
Recommendations for technical assistance mentioned in the Water and Sanitation Sector
Strategy and Action Plan, mention the setting up of a long term continuing monitoring programme
and investigation into the effects of land use on the quality of the groundwater (Doig, 1996).
1.7 Wastewater
In Laura the USEPA provided a grant to install a wastewater system. The project, designed to
protect the groundwater lens, consisted of a septic tank and leach field for every family in the
immediate area from which water was withdrawn.
Clusters of houses were connected to the same gravity-flow transmission lines to remote leach
fields along the ocean and lagoon sides of the island. Unfortunately due to design flaws many of
these systems were not functioning properly and raw sewage backs up into the toilets and
overflows. In addition these systems have a limited life expectancy of 5 years. There are no
septic system cleaning companies or facilities, such as sewage pump-out trucks to maintain
these systems.
[11]
[SOPAC Technical Report 342 : Overmars]
Power, water and tv-cable are now available in Laura, leading to increased development in that
area with many new homes and businesses being constructed requiring additional sanitation
facilities. At present without a centralized sewerage system and ocean outfall, septic systems or
pit latrines are used. Since soil conditions are not favourable for septic tanks due to the shallow
water table and high permeabilities a real potential for pollution of the aquifer exists (Barber,
1994).
1.8 Sanitation Services and Extension Services
Republic of the Marshall Islands Environmental Protection Agency (RMIEPA) has developed
Toilet Facilities and Sewage Disposal Guidelines for the Marshall Islands. The regulation has
taken effect in 1994 but enforcement of these rules by RMIEPA has continuously been
problematic.
The College of Micronesia has provided through its Cooperative Extension Program a Water
Quality Extension Agent based in Majuro. At the time of the mission a new Agent just took up his
duties (Mr Almat Kaleman).
The main objective of this program is raising awareness among communities on hygiene and
sanitation, providing information on best practices, assisting in facilitation of regulations and
organising workshops and seminars in the urban and rural setting.
SOPAC provided an overview to the Marshall Islands on the application of small-scale
wastewater treatment plants in 1999 and an appraisal of feasible options to alleviate drought
impacts in the Majuro area in 1998.
[12]
[SOPAC Technical Report 342 : Overmars]
2 HYDROGEOLOGY
2.1 Water Balance and Recharge
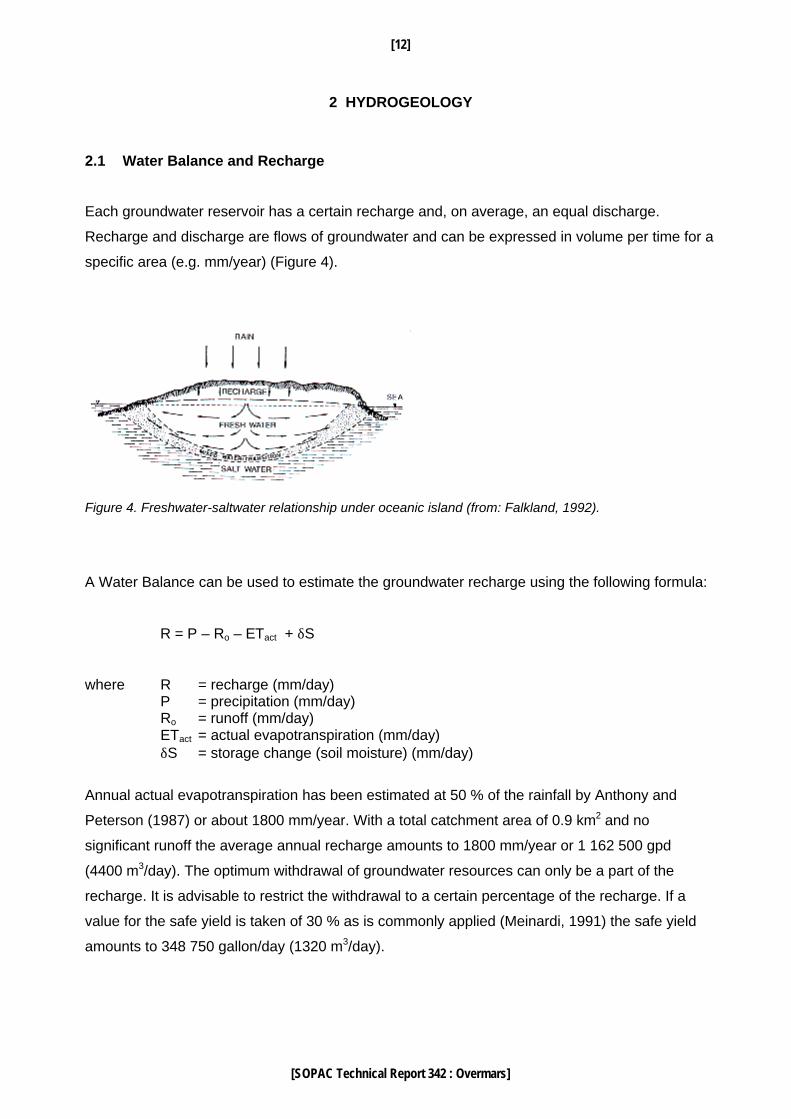
Each groundwater reservoir has a certain recharge and, on average, an equal discharge.
Recharge and discharge are flows of groundwater and can be expressed in volume per time for a
specific area (e.g. mm/year) (Figure 4).
Figure 4. Freshwater-saltwater relationship under oceanic island (from: Falkland, 1992).
A Water Balance can be used to estimate the groundwater recharge using the following formula:
R = P – Ro – ETact + δS
where R = recharge (mm/day) P = precipitation (mm/day) Ro = runoff (mm/day) ETact = actual evapotranspiration (mm/day) δS = storage change (soil moisture) (mm/day)
Annual actual evapotranspiration has been estimated at 50 % of the rainfall by Anthony and
Peterson (1987) or about 1800 mm/year. With a total catchment area of 0.9 km2 and no
significant runoff the average annual recharge amounts to 1800 mm/year or 1 162 500 gpd
(4400 m3/day). The optimum withdrawal of groundwater resources can only be a part of the
recharge. It is advisable to restrict the withdrawal to a certain percentage of the recharge. If a
value for the safe yield is taken of 30 % as is commonly applied (Meinardi, 1991) the safe yield
amounts to 348 750 gallon/day (1320 m3/day).
[13]
[SOPAC Technical Report 342 : Overmars]
Accurate rainfall data is required to estimate the changes in the recharge and determine the
potential effect of groundwater abstraction on the freshwater lens. Additional data should be
collected including pan evaporation, temperature (max, min) etc.
2.2 Geo-electrical Soundings
Fresh groundwater underneath small islands normally takes the form of a lens, “floating” upon
more dense saline water with a transition zone in between. The transition zone between fresh
and brackish groundwater is relatively thin. Because saline water is more conductive than
freshwater, geo-electrical soundings can be used to detect the interface between freshwater and
brackish water.
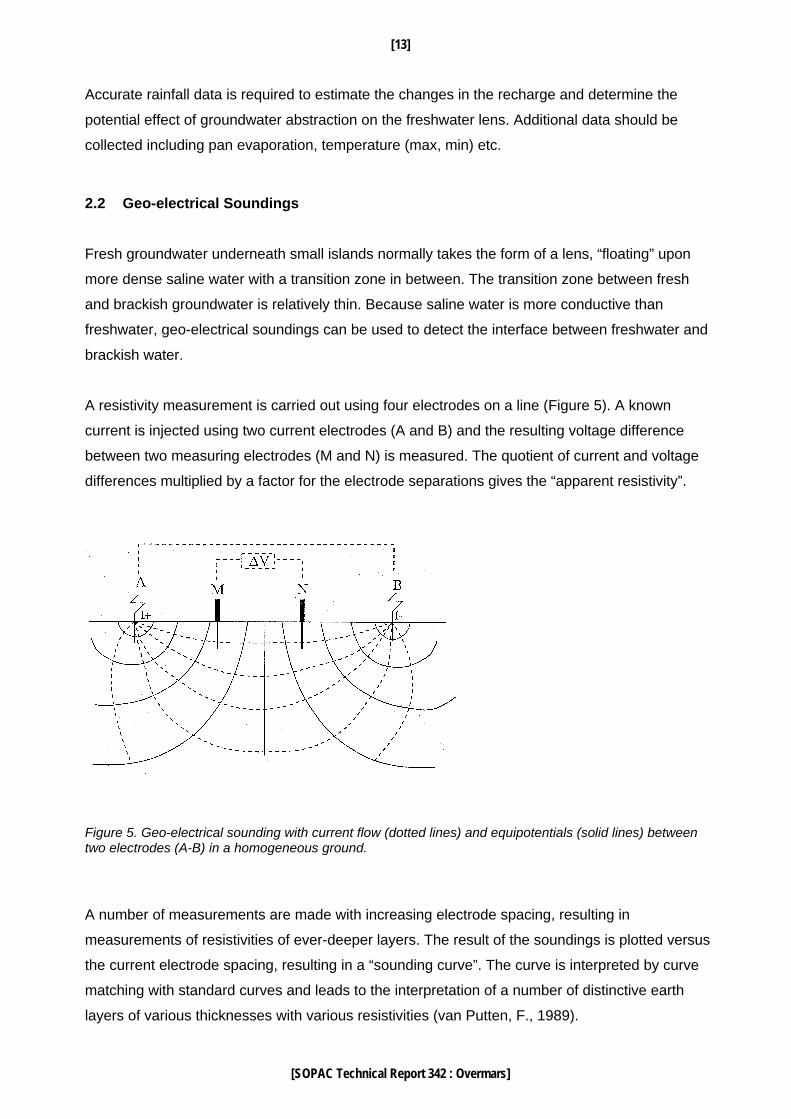
A resistivity measurement is carried out using four electrodes on a line (Figure 5). A known
current is injected using two current electrodes (A and B) and the resulting voltage difference
between two measuring electrodes (M and N) is measured. The quotient of current and voltage
differences multiplied by a factor for the electrode separations gives the “apparent resistivity”.
Figure 5. Geo-electrical sounding with current flow (dotted lines) and equipotentials (solid lines) between two electrodes (A-B) in a homogeneous ground.
A number of measurements are made with increasing electrode spacing, resulting in
measurements of resistivities of ever-deeper layers. The result of the soundings is plotted versus
the current electrode spacing, resulting in a “sounding curve”. The curve is interpreted by curve
matching with standard curves and leads to the interpretation of a number of distinctive earth
layers of various thicknesses with various resistivities (van Putten, F., 1989).
[14]
[SOPAC Technical Report 342 : Overmars]
The electrical resistivity is a function of the composition of the deposits, the degree of water
saturation and the salinity of the water. Typical resistivity values for rock/water mixtures are
provided in Table 1.
Table 1. Typical resistivity values.
Coral sand saturated with sea water 2-10 ohm m Hard coral saturated with sea water 5-15 ohm m Sand or rock saturated with fresh water 50-300 ohm m Dry sand or rock with very little water 500-3000 ohm m (From: Dale, D., 1986).
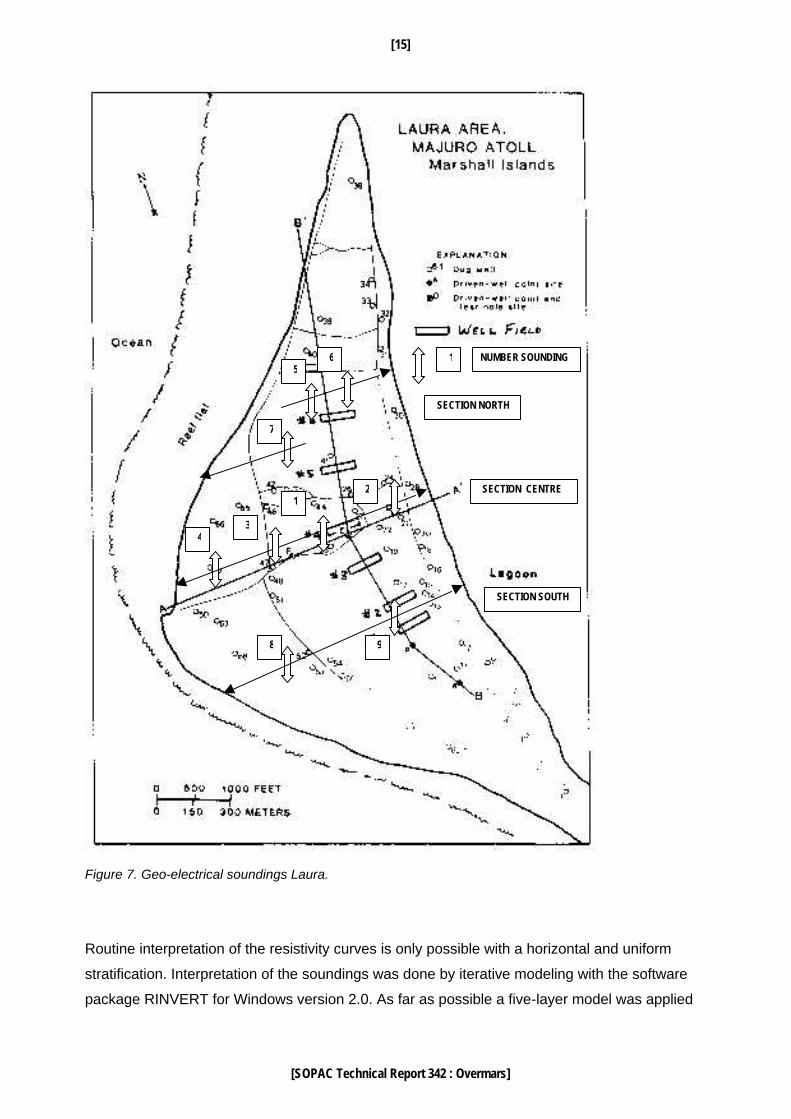
Nine geo-electrical soundings were executed to determine the depth and thickness of a possible
freshwater lens which is expected to have its water table at or around mean sea level. The
soundings were taken in a North-South direction oriented parallel to the coastline where a more
uniform lithology can be expected. Figure 7 shows the location of the soundings.
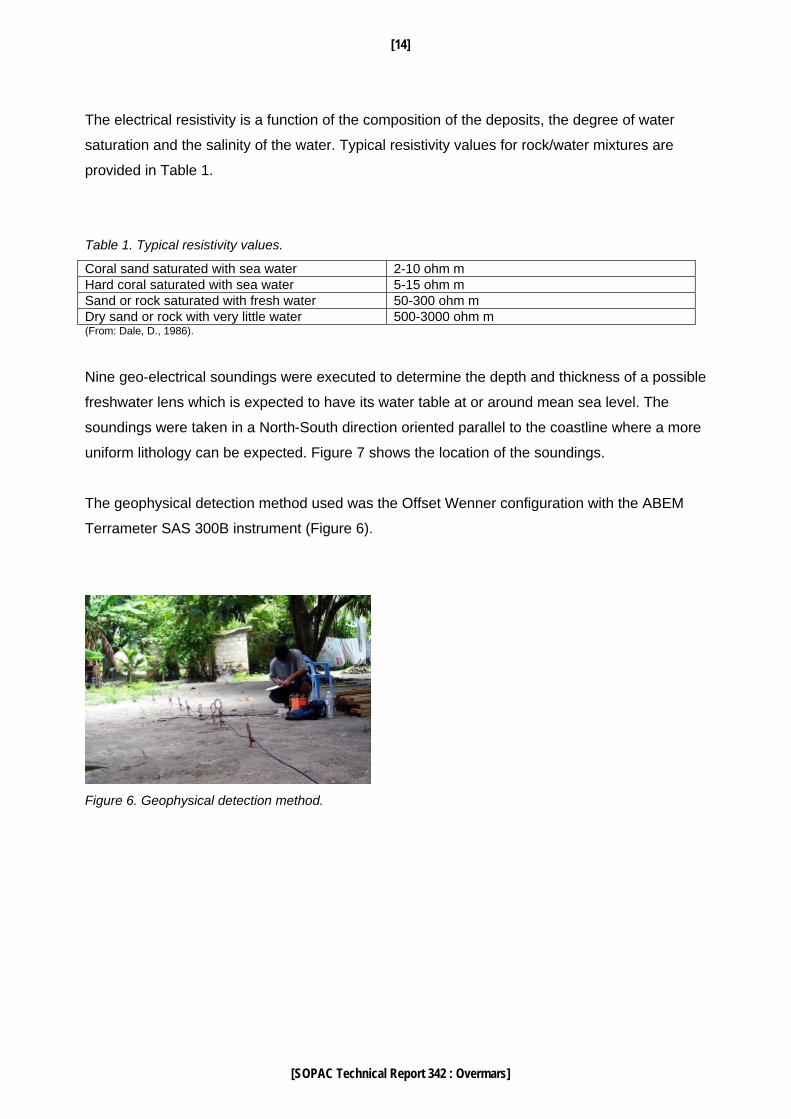
The geophysical detection method used was the Offset Wenner configuration with the ABEM
Terrameter SAS 300B instrument (Figure 6).
Figure 6. Geophysical detection method.
[15]
[SOPAC Technical Report 342 : Overmars]
Figure 7. Geo-electrical soundings Laura.
Routine interpretation of the resistivity curves is only possible with a horizontal and uniform
stratification. Interpretation of the soundings was done by iterative modeling with the software
package RINVERT for Windows version 2.0. As far as possible a five-layer model was applied
SECTION NORTH
SECTION CENTRE
SECTION SOUTH
8 9
21
34
7
56 1 NUMBER SOUNDING
[16]
[SOPAC Technical Report 342 : Overmars]
with the characteristics shown in Table 2. Table 3 shows the models interpreted from the data for
the nine soundings.
Table 2. Five-layer model for Laura soundings.
thickness range (m) resistivity range (ohm m) 1 Topsoil 0.05 – 0.2 100 – 200 2 Dry zone 0.5 – 1.5 200 – 1000 3 Fresh water zone 1.0 – 10 50 – 300 4 Brackish water zone 5 – 15 15 – 50 5 Saline water zone ∞ < 15
Table 3. Geophysical models Laura.
No. of Sounding 1 2 3 thickness resistivity thickness resistivity thickness resistivity (m) (ohm m) (m) (ohm m) (m) (ohm m) Layer 1 0.12 140 0.1 86 0.9 146 Layer 2 1.1 490 0.9 61 2.6 286 Layer 3 2.6 66 Layer 4 11.5 30 10.1 25 2.6 27 Layer 5 ∞ < 1 ∞ <1 ∞ <1
No. of Sounding 4 5 6 thickness resistivity thickness resistivity thickness resistivity (m) (ohm m) (m) (ohm m) (m) (ohm m) Layer 1 0.3 77 0.1 52 0.5 98 Layer 2 0.4 820 0.8 187 Layer 3 2.6 5 5.2 105 0 66 Layer 4 11.1 2 17 35 10.3 23 Layer 5 ∞ < 1 ∞ 7 ∞ <1
No. of Sounding 7 8 9 thickness resistivity thickness resistivity thickness resistivity (m) (ohm m) (m) (ohm m) (m) (ohm m) Layer 1 0.3 140 0.4 774 1.7 593 Layer 2 0.6 486 0.7 497 Layer 3 1.9 66 1.1 49 7.3 31 Layer 4 7.5 28 3.8 8 13.6 4.8 Layer 5 ∞ 10 ∞ 10 ∞ <1
The elevation of each survey site was not accurately measured nor was the depth to the water
table at each site due to time constraints. Data from 1998 was used to estimate the top of the
freshwater zone (layer 3). In future geophysical surveys these essential data should be
determined and taken into account in the modeling.
[17]
[SOPAC Technical Report 342 : Overmars]
2.3 Freshwater Lens
The average thickness of the freshwater lens is crudely estimated from the geophysical
interpretations and are provided in Table 4.
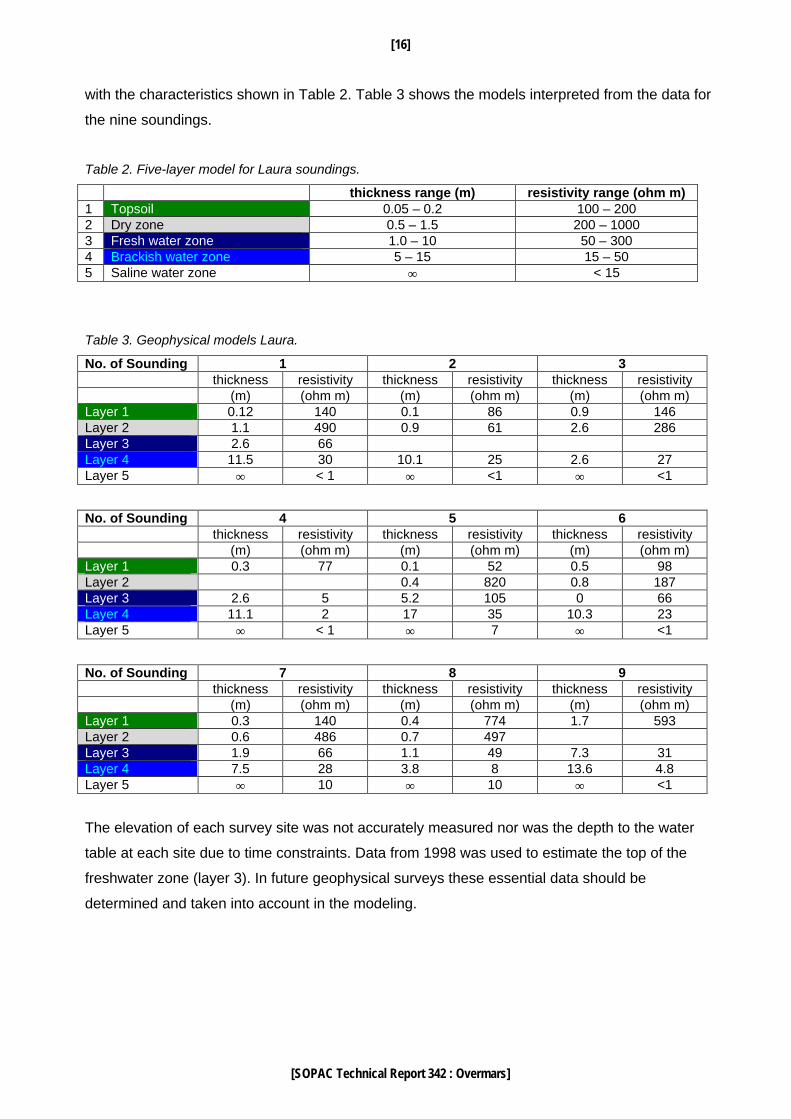
Figure 8 shows three cross sections through the island indicating the depth to the saline water
zone in the centre of Laura lens area (I), the northern side (II) and the south side (III).
Table 4. Laura freshwater lens.
Site 1 2 3 4 5 6 7 8 9 Cross section I
(centre) II
(north) III
(south) Depth to freshwater zone (m) 1.2 1.0 0.9 0.3 0.5 1.3 0.9 1.1 1.7 Depth to brackish zone (m) 3.8 1.9 3.5 2.9 5.7 1.3 2.8 2.2 9.0 Depth to saline zone (m) 15.3 11.1 6.1 14.0 22.7 11.6 11.3 6.0 22.6 Lens thickness (m) 14.1 10.1 5.2 13.7 22.2 10.3 10.4 4.9 20.9
Ocean side (West) Lagoon side (East)
-25
-20
-15
-10
-5
0
Figure 8. Depth to saline water boundary (m below MSL).
Electrical conductivity was measured at abstraction well no. 1 with 696 µS/cm and the
neighbouring monitoring well was 548 µS/cm; well no. 2 showed a conductivity of 634 µS/cm and
a Taro pond near the location of sounding Lau003 was measured at 590 µS/cm. These
conductivity levels indicate acceptable chloride concentrations of 20 to 75 mg/l (comparison with
1998 USGS data).
III SOUTH
I CENTRE
II NORTH
[18]
[SOPAC Technical Report 342 : Overmars]
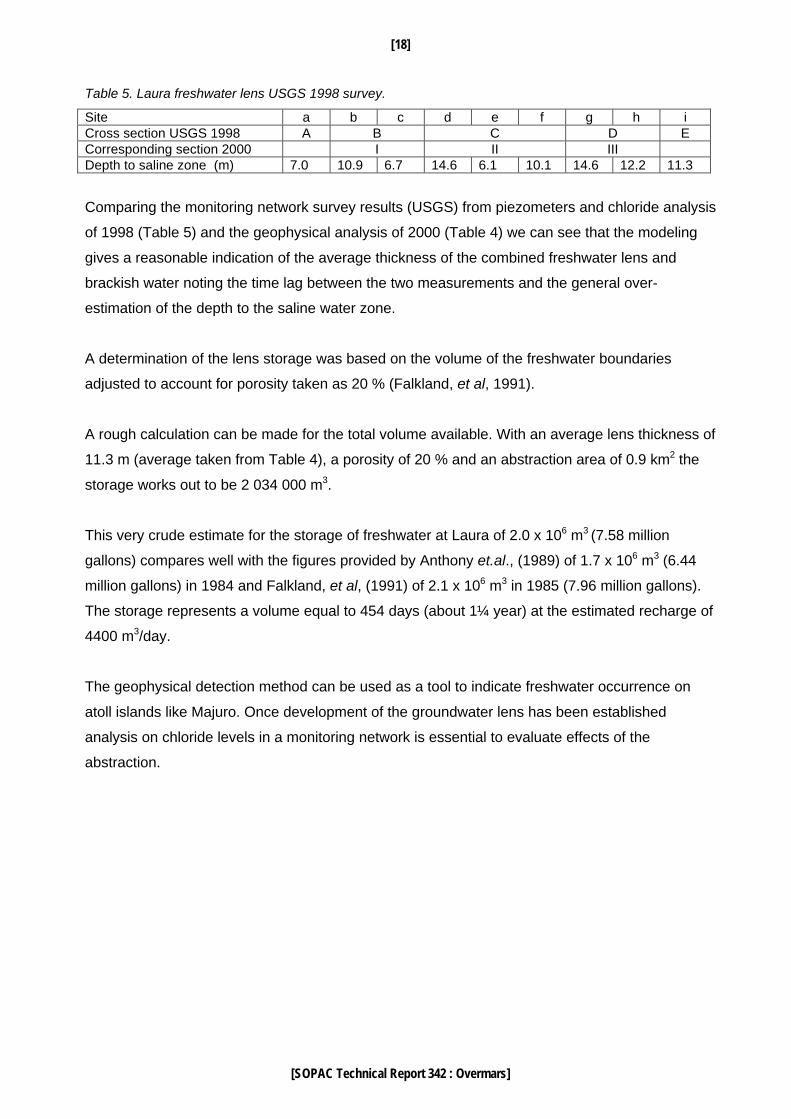
Table 5. Laura freshwater lens USGS 1998 survey.
Site a b c d e f g h i Cross section USGS 1998 A B C D E Corresponding section 2000 I II III Depth to saline zone (m) 7.0 10.9 6.7 14.6 6.1 10.1 14.6 12.2 11.3
Comparing the monitoring network survey results (USGS) from piezometers and chloride analysis
of 1998 (Table 5) and the geophysical analysis of 2000 (Table 4) we can see that the modeling
gives a reasonable indication of the average thickness of the combined freshwater lens and
brackish water noting the time lag between the two measurements and the general over-
estimation of the depth to the saline water zone.
A determination of the lens storage was based on the volume of the freshwater boundaries
adjusted to account for porosity taken as 20 % (Falkland, et al, 1991).
A rough calculation can be made for the total volume available. With an average lens thickness of
11.3 m (average taken from Table 4), a porosity of 20 % and an abstraction area of 0.9 km2 the
storage works out to be 2 034 000 m3.
This very crude estimate for the storage of freshwater at Laura of 2.0 x 10⁶ m3 (7.58 million
gallons) compares well with the figures provided by Anthony et.al., (1989) of 1.7 x 10⁶ m3 (6.44
million gallons) in 1984 and Falkland, et al, (1991) of 2.1 x 10⁶ m3 in 1985 (7.96 million gallons).
The storage represents a volume equal to 454 days (about 1¼ year) at the estimated recharge of
4400 m3/day.
The geophysical detection method can be used as a tool to indicate freshwater occurrence on
atoll islands like Majuro. Once development of the groundwater lens has been established
analysis on chloride levels in a monitoring network is essential to evaluate effects of the
abstraction.
[19]
[SOPAC Technical Report 342 : Overmars]
3 RECOMMENDATIONS AND FOLLOW UP
The monitoring network of 36 wells at 11 locations and 6 monitoring wells in Laura should be
maintained and data on the monitoring network, the water quality in abstraction wells and rainfall
should be accurately stored and analysed. USGS was providing assistance to MWSC to advise
on maximum abstraction rates but missions are carried out on an irregular basis. Close links
should be maintained between USGS, MWSC and RMIEPA to ensure follow-up. USGS should
leave collected data in hard copy and digital format in the Marshall Islands with the responsible
authorities.
Capacity should be improved at both institutes MWSC and RMIEPA to guarantee the sustainable
exploitation of the Laura groundwater lens (i.e. safeguarding groundwater quality from pollution
and intrusion of saline water).
MWSC should monitor the indicated parameters at abstraction wells and monitoring boreholes
with fixed intervals.
Capacity (manpower and computers) is lacking at MWSC to store the data adequately in a
database and make the appropriate interpretations. A database can be specifically developed to
store data on abstraction rates; water levels; chloride content; conductivity; and nitrate. Only one
computer is currently available for this purpose at MWSC.
Sanitation practices can be improved to protect the freshwater lens from domestic pollution.
RMIEPA should carry out sanitation surveys in the Laura area to determine potential sources of
pollution and organise awareness-raising campaigns for the resident community of Laura.
Collaboration with the Community Liaison Extension Agent of the College of the Marshall Islands
or other specialised NGO’s could be highly beneficial.
Demonstration projects can help to introduce appropriate wastewater technology. A study should
be executed to evaluate the effects of pesticides and fertilizers used on the two farms on the
groundwater quality in general.
A groundwater protection plan should be developed including upgrading of the groundwater
monitoring network, executing water and sanitation surveys and construction and installation of
appropriate water and sanitation facilities with the community in Laura. The development of the
protection plan could well serve as demonstration project for the Strategic Action Programme for
International Waters of the Global Environmental Facility (GEF).
[20]
[SOPAC Technical Report 342 : Overmars]
4 REFERENCES
Anthony, S.S., and Peterson F.L., 1987, Carbonate geochemistry and hydrogeological relationships, Laura, Majuro atoll, Marshall Islands, University of Hawaii, Water Resources Centre.
Anthony, S.S., et al, 1989, Geohydrology of the Laura freshwater lens, a hydrogeochemical approach,
Geol. Soc. of America Bull. 101. Barber, B., 1994, Rural and Urban Water Supply and Sanitation Review Republic of the Marshall Islands,
RMIEPA/UNDP. Dale, D., 1986, Coral Island Hydrology, DSIR, Commonwealth Science Council. Doig, K.D., 1996, Water and Sanitation Sector Strategy and Action Plan, SOPAC Technical Report 236. Falkland, T., 1992 Small Tropical Islands, Water resources of paradises lost, IHP Humid Tropics
Programme Series No.2, UNESCO, Paris. Falkland, T., et al, 1991, Hydrology and water resources of small islands: a practical guide, International
Hydrological Programme IHP-III, Project 4.6, UNESCO, Paris. Galbraith, K., Bendure, G., Friary, N., 2000, Micronesia. Melbourne, Lonely Planet Publications. Goodwin, R., Zheng, K., Mistry, R., 2000, Summary Report on Water Resource Evaluation and Proposed
Water Development plan for ten atolls, Marshall Islands. Majuro, Island Economic and Environment Co. (Island Eco), September 2000. US Federal Emergency Management Agency (FEMA), FEMA-0932-DR-MH Hazard Mitigation Grant Program #0004 : Outer Island Water Resources Planning and Development Project.
Meinardi, C.R., 1991, A Groundwater Primer, IRC Technical Paper Series Nr 21, The Hague. NOAA, 1984, Local climatological data, annual summary with comparative data, Majuro, Marshall Islands,
U.S. National Oceanic and Atmospheric Administration. Parsons Engineering Science, 1995, Institutional Strengthening of the Majuro Water and Sewer Company
Republic of the Marshall Islands, Asian Development Bank (ADB). PMSC (Pacific Management Services Company), 1992, Laura Lens Monitoring Program. Van Putten, F., 1989, The viability of groundwater development on the outer islets of the Tarawa atoll,
Tech. Rep. KIR/5, UNDP, Suva.