Embed Size (px)
Citation preview
Full Terms & Conditions of access and use can be found athttps://www.tandfonline.com/action/journalInformation?journalCode=rael20
Applied Economics Letters
ISSN: (Print) (Online) Journal homepage: https://www.tandfonline.com/loi/rael20
Water scarcity reduces the efficiency of themanufacturing industry in the valley of MexicoBasin: DEA-based two-stage efficiency analysis
Daniel Alfredo Revollo-Fernández & Lilia Rodríguez-Tapia
To cite this article: Daniel Alfredo Revollo-Fernández & Lilia Rodríguez-Tapia (2021):Water scarcity reduces the efficiency of the manufacturing industry in the valley ofMexico Basin: DEA-based two-stage efficiency analysis, Applied Economics Letters, DOI:10.1080/13504851.2021.1918623
To link to this article: https://doi.org/10.1080/13504851.2021.1918623
Published online: 03 May 2021.
Submit your article to this journal
Article views: 16
View related articles
View Crossmark data
Water scarcity reduces the efficiency of the manufacturing industry in the valley of Mexico Basin: DEA-based two-stage efficiency analysisDaniel Alfredo Revollo-Fernándeza and Lilia Rodríguez-Tapiab
aCONACYT-UAM, Área de Crecimiento y Medio Ambiente, Departamento de Economía, Universidad Autónoma Metropolitana, Unidad Azcapotzalco, Ciudad de México, México; bDepartamento de Economía, Universidad Autónoma Metropolitana, Unidad Azcapotzalco, Ciudad de México, México
ABSTRACTThis study analysed the impact of a series of socioeconomic variables on the efficiency of produc-tion processes used by different economic units belonging to the manufacturing industry in a hydrological basin with water scarcity problems. The main finding is that the economic units that used water from overexploited aquifers had lower efficiency scores than those that used water from non-exploited aquifers. Thus, the design of public policies for this sector, which is highly dependent on this natural resource, should take into account that actions to conserve water supply sources greatly affect the efficiency of the manufacturing industry.
KEYWORDS Manufacturing industry; efficiency; water; shortage
JEL codes L6; L25; Q25; Q55
I. Introduction
While Mexico’s water supply is considered to be abundant in absolute terms, the country faces a serious problem with relative water scarcity (Conagua 2012). This problem is demonstrated by the inability to meet water demand in some of the country’s basins, especially where populations and economic activity have experienced more growth over the years (Conagua 2016). While the Valley of Mexico Basin (VMB) occupies less than 1% of the nation’s territory, it is home to 20% of the country’s population and produces roughly 31.3% of the national Gross National Product (GNP) (Conagua 2012; Consejo de Cuenca Valle de México 2014). Meanwhile, the Relative Water Stress Index (ratio of total water volume use to mean freshwater avail-ability) in the VMB is 140.4%, making it one of the regions in the world with the highest water stress (Conagua 2016). Currently, the main sectors in the VMB that consume water are public urban- domestic, agriculture, and industry. The manufac-turing industry plays a key role in the dynamics of economic activity in the VMB, since it represents one-fifth of the total GNP, generating employment and goods and services (Conagua 2012). Given the production processes that are used by the
manufacturing industry, this sector extracts the majority of the water from the aquifers, whose current overexploitation is so high that they have been declared closed (Conagua 2012).
Therefore, it is important to study whether vari-ables related to water scarcity are among the deter-minants that affect the efficiency of the manufacturing sector (Gumus et al. 2016). While many studies have investigated the determinants of efficiency for various sectors of the economy using different models (Soni, Mittal, and Kapshe 2017; Hu et al. 2018; Guarani et al. 2018; Yao et al. 2018; Lombardi et al. 2019; Liu, Yang, and Yang 2020; Walheer and He 2020), virtually no studies have included water used in production in the context of scarcity or problems with overexploitation in hydrographic basins (Korattukudy-Varghese et al. 2013; Long and Pijanowski 2017). As indicated by Korattukudy-Varghese et al. (2013), investigators have not reached consensus as to the influence of water scarcity and efficiency on the use of water from groundwater sources. Some suggest that scar-city leads to prudent use while others suggest that it will cause the overexploitation of resources.
This article includes four more sections, in addition to the introduction. The next section describes the
CONTACT Daniel Alfredo Revollo-Fernández [email protected]; [email protected] CONACYT-UAM, Área de Crecimiento y Medio Ambiente, Departamento de Economía, Universidad Autónoma Metropolitana, Unidad Azcapotzalco, Av. San Pablo No. 180, Col. Reynosa Tamaulipas, Del. Azcapotzalco, Ciudad de México 02200, México
APPLIED ECONOMICS LETTERS https://doi.org/10.1080/13504851.2021.1918623
© 2021 Informa UK Limited, trading as Taylor & Francis Group
study area (VMB), which is followed by a presentation of the methodology and the results obtained. Lastly, the fifth section presents the conclusions.
II. Valley of Mexico Basin (VMB)
Location of the VMB
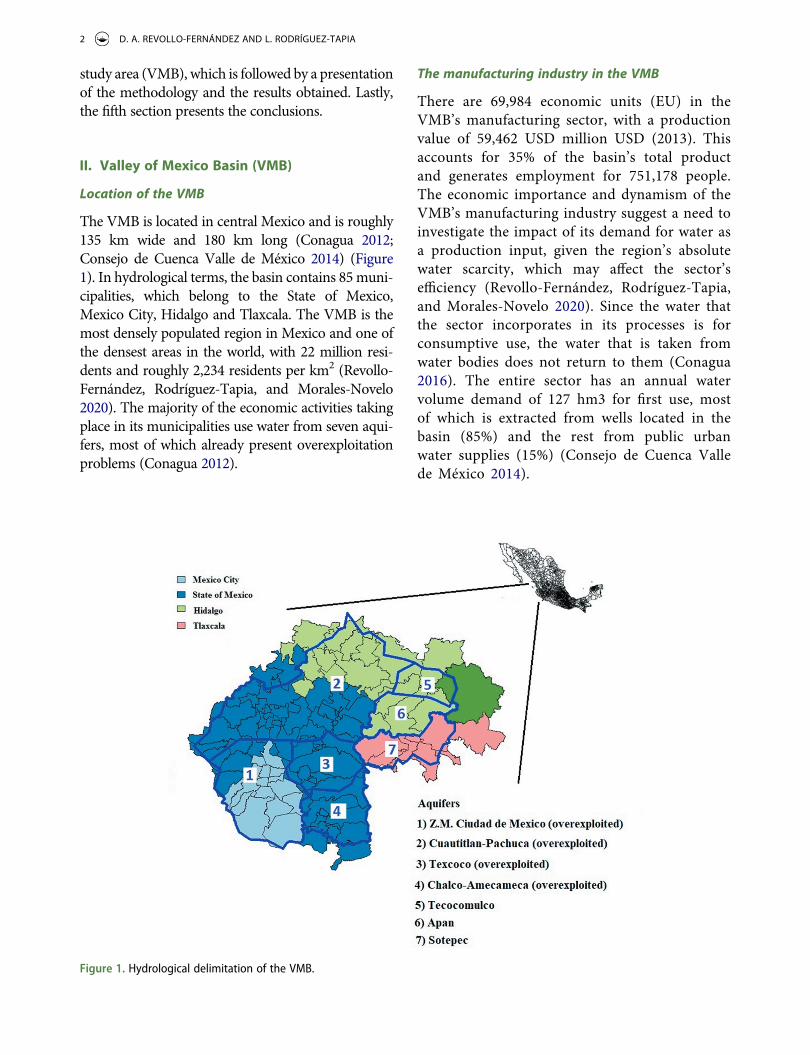
The VMB is located in central Mexico and is roughly 135 km wide and 180 km long (Conagua 2012; Consejo de Cuenca Valle de México 2014) (Figure 1). In hydrological terms, the basin contains 85 muni-cipalities, which belong to the State of Mexico, Mexico City, Hidalgo and Tlaxcala. The VMB is the most densely populated region in Mexico and one of the densest areas in the world, with 22 million resi-dents and roughly 2,234 residents per km2 (Revollo- Fernández, Rodríguez-Tapia, and Morales-Novelo 2020). The majority of the economic activities taking place in its municipalities use water from seven aqui-fers, most of which already present overexploitation problems (Conagua 2012).
The manufacturing industry in the VMB
There are 69,984 economic units (EU) in the VMB’s manufacturing sector, with a production value of 59,462 USD million USD (2013). This accounts for 35% of the basin’s total product and generates employment for 751,178 people. The economic importance and dynamism of the VMB’s manufacturing industry suggest a need to investigate the impact of its demand for water as a production input, given the region’s absolute water scarcity, which may affect the sector’s efficiency (Revollo-Fernández, Rodríguez-Tapia, and Morales-Novelo 2020). Since the water that the sector incorporates in its processes is for consumptive use, the water that is taken from water bodies does not return to them (Conagua 2016). The entire sector has an annual water volume demand of 127 hm3 for first use, most of which is extracted from wells located in the basin (85%) and the rest from public urban water supplies (15%) (Consejo de Cuenca Valle de México 2014).
Figure 1. Hydrological delimitation of the VMB.
2 D. A. REVOLLO-FERNÁNDEZ AND L. RODRÍGUEZ-TAPIA
III. Methodology
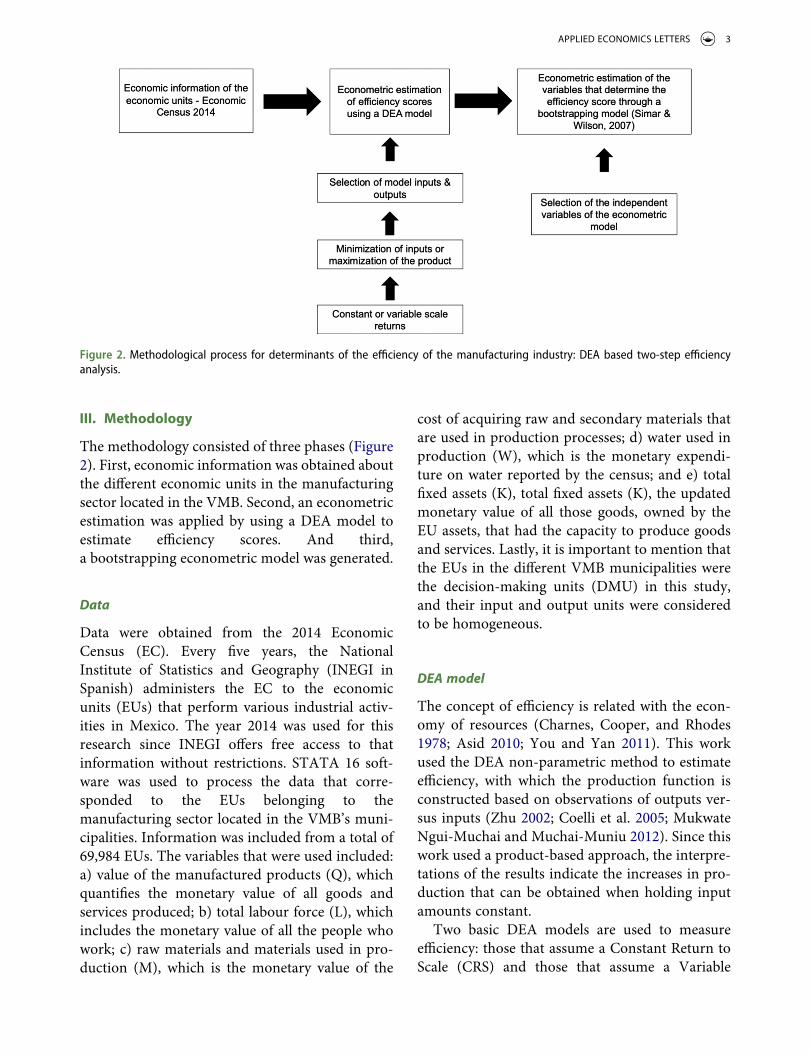
The methodology consisted of three phases (Figure 2). First, economic information was obtained about the different economic units in the manufacturing sector located in the VMB. Second, an econometric estimation was applied by using a DEA model to estimate efficiency scores. And third, a bootstrapping econometric model was generated.
Data
Data were obtained from the 2014 Economic Census (EC). Every five years, the National Institute of Statistics and Geography (INEGI in Spanish) administers the EC to the economic units (EUs) that perform various industrial activ-ities in Mexico. The year 2014 was used for this research since INEGI offers free access to that information without restrictions. STATA 16 soft-ware was used to process the data that corre-sponded to the EUs belonging to the manufacturing sector located in the VMB’s muni-cipalities. Information was included from a total of 69,984 EUs. The variables that were used included: a) value of the manufactured products (Q), which quantifies the monetary value of all goods and services produced; b) total labour force (L), which includes the monetary value of all the people who work; c) raw materials and materials used in pro-duction (M), which is the monetary value of the
cost of acquiring raw and secondary materials that are used in production processes; d) water used in production (W), which is the monetary expendi-ture on water reported by the census; and e) total fixed assets (K), total fixed assets (K), the updated monetary value of all those goods, owned by the EU assets, that had the capacity to produce goods and services. Lastly, it is important to mention that the EUs in the different VMB municipalities were the decision-making units (DMU) in this study, and their input and output units were considered to be homogeneous.
DEA model
The concept of efficiency is related with the econ-omy of resources (Charnes, Cooper, and Rhodes 1978; Asid 2010; You and Yan 2011). This work used the DEA non-parametric method to estimate efficiency, with which the production function is constructed based on observations of outputs ver-sus inputs (Zhu 2002; Coelli et al. 2005; Mukwate Ngui-Muchai and Muchai-Muniu 2012). Since this work used a product-based approach, the interpre-tations of the results indicate the increases in pro-duction that can be obtained when holding input amounts constant.
Two basic DEA models are used to measure efficiency: those that assume a Constant Return to Scale (CRS) and those that assume a Variable
Figure 2. Methodological process for determinants of the efficiency of the manufacturing industry: DEA based two-step efficiency analysis.
APPLIED ECONOMICS LETTERS 3
Return to Scale (VRS) (Adeoti 2013). It is appro-priate to use the CRS assumption when all of the companies operate at an optimal scale. Nevertheless, in some circumstances this does not occur, for example, when there is imperfect com-petition or financial limitations, such as in the case of the VMB. Therefore, the following variables were used by the DEA model for the VMB, with a product-oriented approach and considering the VRS: i) Q (output), ii) L (input), iii) M (input), iv) W (input), and v) K (input).
Bootstrapping model (BM)
The BM proposed by Simar and Wilson (2007) was used in order to identify the determinants of the manufacturing sector’s efficiency. This step used the efficiency scores that were estimated in the previous stage as the dependent variable, in addi-tion to the independent variables, which were divided into three groups: i) agglomeration econo-mies, in order to identify whether the formation of clusters or industrial specialization impacted effi-ciency (Porter 1998), which included both the Gini Index and Specialization Index for the production value; ii) water scarcity in the production process, which included whether the EUs used water from overexploited aquifers and the Gini Index for water consumption; and iii) the socioeconomic group, which was defined by the size of the economic unit based on the production value per worker and the percentage of the total labour force that was economically active. Unlike the censured or truncated models that are typically reported in the literature, the main advantage of the bootstrapping model is a lower risk of analysis bias, that is, it estimates the variance based on a random resam-pling of the initial sample rather than on the popu-lation, thereby obtaining more reliable and robust results (Simar and Wilson 2007).
IV. Results
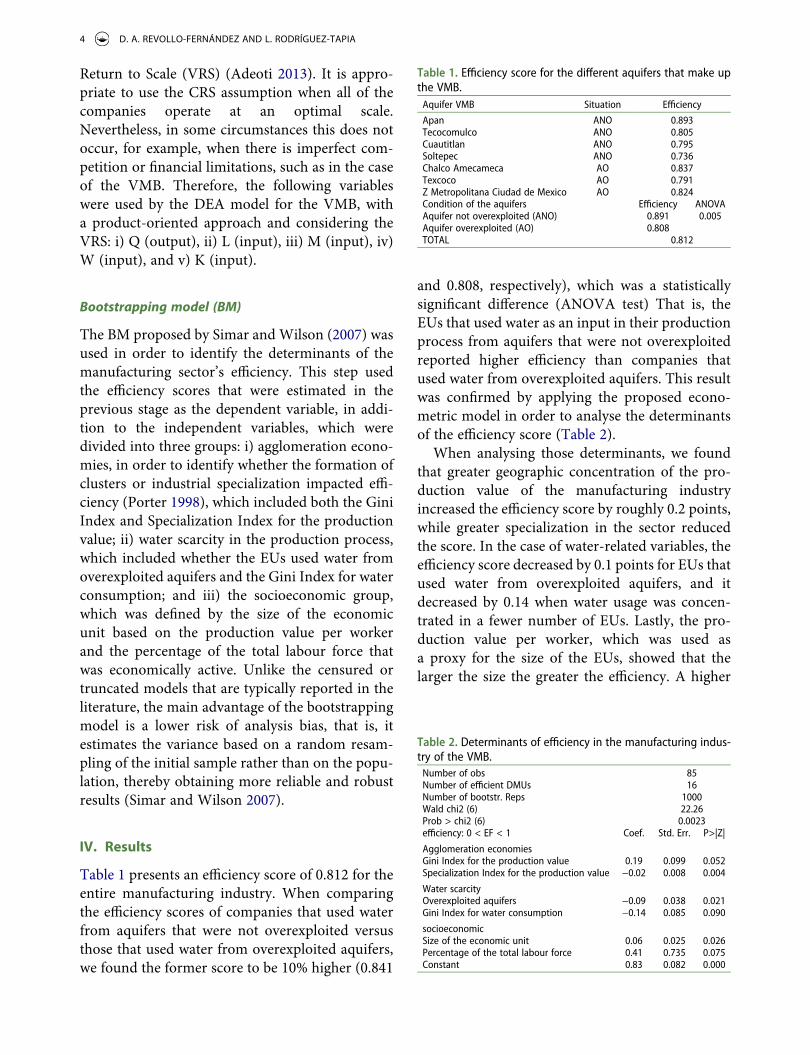
Table 1 presents an efficiency score of 0.812 for the entire manufacturing industry. When comparing the efficiency scores of companies that used water from aquifers that were not overexploited versus those that used water from overexploited aquifers, we found the former score to be 10% higher (0.841
and 0.808, respectively), which was a statistically significant difference (ANOVA test) That is, the EUs that used water as an input in their production process from aquifers that were not overexploited reported higher efficiency than companies that used water from overexploited aquifers. This result was confirmed by applying the proposed econo-metric model in order to analyse the determinants of the efficiency score (Table 2).
When analysing those determinants, we found that greater geographic concentration of the pro-duction value of the manufacturing industry increased the efficiency score by roughly 0.2 points, while greater specialization in the sector reduced the score. In the case of water-related variables, the efficiency score decreased by 0.1 points for EUs that used water from overexploited aquifers, and it decreased by 0.14 when water usage was concen-trated in a fewer number of EUs. Lastly, the pro-duction value per worker, which was used as a proxy for the size of the EUs, showed that the larger the size the greater the efficiency. A higher
Table 1. Efficiency score for the different aquifers that make up the VMB.
Aquifer VMB Situation Efficiency
Apan ANO 0.893Tecocomulco ANO 0.805Cuautitlan ANO 0.795Soltepec ANO 0.736Chalco Amecameca AO 0.837Texcoco AO 0.791Z Metropolitana Ciudad de Mexico AO 0.824Condition of the aquifers Efficiency ANOVAAquifer not overexploited (ANO) 0.891 0.005Aquifer overexploited (AO) 0.808TOTAL 0.812
Table 2. Determinants of efficiency in the manufacturing indus-try of the VMB.
Number of obs 85Number of efficient DMUs 16Number of bootstr. Reps 1000Wald chi2 (6) 22.26Prob > chi2 (6) 0.0023efficiency: 0 < EF < 1 Coef. Std. Err. P>|Z|
Agglomeration economiesGini Index for the production value 0.19 0.099 0.052Specialization Index for the production value −0.02 0.008 0.004
Water scarcityOverexploited aquifers −0.09 0.038 0.021Gini Index for water consumption −0.14 0.085 0.090
socioeconomicSize of the economic unit 0.06 0.025 0.026Percentage of the total labour force 0.41 0.735 0.075Constant 0.83 0.082 0.000
4 D. A. REVOLLO-FERNÁNDEZ AND L. RODRÍGUEZ-TAPIA
score was also found when there were more eco-nomically active people in the total labour market.
In this sense, the results show that water scarcity problems and the importance of this resource for production are factors that lead to inefficiencies in production. This is of crucial importance since various economic sectors in many of the world’s hydrographic basins that are important in socio-economic terms are already experiencing signifi-cant problems with access to water and its quality. Therefore, from the public policy perspective, more and better conservation measures need to be con-sidered for aquifer recharge zones, including the implementation of conservation measures for scarce production inputs and raising awareness among all economic sectors of the importance of the value of water.
V. Discussion and further reflections
The present econometric analysis used a two-stage DEA-based efficiency analysis. While this type of analysis has recently been used in the literature, it has not been widely applied to the manufacturing sector. This analysis made it possible to determine that agglomeration variables positively affected effi-ciency scores while specialization variables nega-tively affected it. In addition, the score was negatively affected by water scarcity, measured as accessing water from an overexploited aquifer. And lastly, the size of the economic units and the num-ber of people available to be employed by the market positively affected efficiency. The new con-tribution provided by this study is the inclusion of the water scarcity variable as one of the main pro-duction inputs for one of the most important eco-nomic sectors in the VMB, the manufacturing sector, and for a sector located in a very densely populated zone with problems involving the over-exploitation of aquifers. The literature reports very few studies on DEA that include this variable, espe-cially for this sector. Consequently, the design of future public policies, particularly for hydrographic basins with water scarcity problems, should focus on good management of the conservation of aqui-fers so as to affect both the environment as well as adverse economic factors that reduce the efficiency and competitiveness of economic sectors that are important to the economy, as in the case of the
manufacturing industry in the VMB. Lastly, it is recommended that more DEA studies be con-ducted that include socio-environmental variables such as water scarcity or quality for economies where those variables already present problems involving overexploitation, or where there is com-petition for their use and consumption among different sectors.
Disclosure statement
No potential conflict of interest was reported by the author(s).
Funding
This article was prepared with the financial support of the Valley of Mexico Basin’s Water and Economic Model Project, as part of the “Programa de Cátedras CONACYT” [Nº 1812].
References
Adeoti, J. 2013. “Explaining the Characteristic and Efficiency of Manufacturing Firms in Lagos.” European Journal of Social Sciences 37 (1): 121–138.
Asid, R. 2010. “The Technical Efficiency Analysis of Manufacturing Sector in Malaysia: Evidence from the First Industrial Master Plan (1986–1995).” Asian Social Science 6 (2): 99–120. doi:10.5539/ass.v6n2p99.
Charnes, A., W. W. Cooper, and E. Rhodes. 1978. “Measuring the Efficiency of Decision Making Units.” European Journal of Operational Research 2 (6): 429–444. doi:10.1016/0377- 2217(78)90138-8.
Coelli, T. J., D. S. P. Rao, C. J. O´Donnell, and G. E. Battesse. 2005. An Introduction to Efficiency and Productivity Analysis. USA: Springer. doi:10.1007/b136381
Conagua. 2012. “Programa Hídrico Regional, Región Hidrológico-administrativa XIII Aguas del Valle de México, México”. Accessed 04 October 2019. http://www. pronacose.gob.mx/pronacose14/contenido/documentos/ XIII%20PHOCAVM.pdf
Conagua. 2016. “Estadísticas del Agua en México, edición 2016”. CDMX, México. Accessed 25 October 2019. http:// 201.116.60.25/publicaciones/EAM_2016.pdf
Consejo de Cuenca Valle de México. 2014. “Programa de Medidas Preventivas y de Mitigación de la sequía, México”. Accessed 01 October 2019. http://www.gob.mx/ cms/uploads/attachment/file/99971/PMPMS_CC_Valle_ de_M_xico_Acta_aprobaci_n.pdf
Guarani, D. S., I. Pacheco-Lacerda, D. Riehs-Camargo, L. F. Dresch, and A. And Sartori-Piran. 2018. “Do the Improvement Programs Really Matter? An Analysis Using Data Envelopment Analysis.” BRQ Business Research Quarterly 21: 225–237. doi:10.1016/j.brq.2018.08.002.
APPLIED ECONOMICS LETTERS 5
Gumus, S., G. Egilmez, M. Kucukvar, and Y. Shin Park. 2016. “Integrating Expert Weighting and Multi-criteria Decision Making into Eco-efficiency Analysis: The Case of US Manufacturing.” Journal of the Operational Research Society 67 (4): 616–628. doi:10.1057/jors.2015.88.
Hu, Z., S. Yan, L. Yao, and M. Moudi. 2018. “Efficiency Evaluation with Feedback for Regional Water Use and Wastewater Treatment.” Journal of Hydrology 562: 703–711. doi:10.1016/j.jhydrol.2018.05.032.
Korattukudy-Varghese, S., P. Chellattan-Veettil, S. Speelman, J. Buysee, and G. Van Huylenbroeck. 2013. “Estimating the Causal Effect of Water Scarcity on the Groundwater Use Efficiency of Rice Farming in South India.” Ecological Economics 86: 55–64. doi:10.1016/j.ecolecon.2012.10.005.
Liu, K., G. Yang, and D. Yang. 2020. “Investigating Industrial Water-use Efficiency in Mainland China: An Improved SBM-DEA Model.” Journal of Environmental Management 270: 110859. doi:10.1016/j.jenvman.2020.110859.
Lombardi, G. V., G. Stefani, A. Paci, C. Becagli, M. Miliacca, M. Gastaldi, B. F. Gianeetti, and C. M. V. B. Ameida. 2019. “The Sustainability of the Italian Water Sector: An Empirical Analysis by DEA.” Journal of Cleaner Production 227: 1035–1043. doi:10.1016/j.jclepro.2019.04.283.
Long, K., and B. C. Pijanowski. 2017. “Is There A Relationship between Water Scarcity and Water Use Efficiency in China? A National Decadal Assessment across Spatial Scales.” Land Use Policy 69: 502–511. doi:10.1016/j.landusepol.2017.09.055.
Mukwate Ngui-Muchai, D., and J. Muchai-Muniu. 2012. “Firm Efficiency Differences and Distribution in the Kenyan Manufacturing Sector.” African Development Review 24 (1): 52–66. doi:10.1111/j.1467-8268.2011.00309.x.
Porter, M. E. 1998. Clusters and the New Economics of Competition. Harvard Business Review 76, no. 6
(November–December 1998): 77–90. https://www.hbs. edu/faculty/Pages/item.aspx?num=46852
Revollo-Fernández, D., L. Rodríguez-Tapia, and J. A. Morales-Novelo. 2020. “Economic Value of Water in the Manufacturing Industry in the Valley of México Basin, Mexico.” Water Resources and Economics 30: 100138. (https://www.sciencedirect.com/science/article/pii/ S2212428418300598 .
Simar, L., and P. W. Wilson. 2007. “Estimation and Inference in Two-stage, Semi-parametric Models of Production Processes.” Journal of Econometrics 136 (1): 31–64. doi:10.1016/j.jeconom.2005.07.009.
Soni, A., A. Mittal, and M. Kapshe. 2017. “Energy Intensity Analysis of Indian Manufacturing Industries.” Resource- Efficient Technologies 3: 353–357. doi:10.1016/j. reffit.2017.04.009.
Walheer, B., and M. He. 2020. “Technical Efficiency and Technology Gap of the Manufacturing Industry in China: Does Firm Ownership Matter?” World Development 127: 104769. doi:10.1016/j.worlddev.2019.104769.
Yao, X., W. Feng, X. Zhang, W. Wang, C. Zhang, and S. You. 2018. “Measurement and Decomposition of Industrial Green Total Factor Water Efficiency in China.” Journal of Cleaner Production 198: 1144–1156. doi:10.1016/j. jclepro.2018.07.138.
You, S., and H. Yan. 2011. “A New Approach in Modelling Undesirable Output in DEA Model.” Journal of the Operational Research Society 62 (12): 2146–2156. doi:10.1057/jors.2011.1.
Zhu, J. 2002. Quantitative Models for Performance Evaluation and Benchmarking: Data Envelopment Analysis with Spreadsheets and DEA Excel Solver. Boston: Kluwer Academic Publishers.
6 D. A. REVOLLO-FERNÁNDEZ AND L. RODRÍGUEZ-TAPIA