Embed Size (px)
Citation preview

WATER SENSITIVE ROAD DESIGN -DESIGN OPTIONS FOR IMPROVINGSTORMWATER QUALITY OF ROAD RUNOFF
TECHNICAL REPORTReport 00/1August 2000
Tony Wong / Peter Breen / Sara Lloyd
C O O P E R A T I V E R E S E A R C H C E N T R E F O R C A T C H M E N T H Y D R O L O G Y
i
Preface
This report investigates opportunities forincorporating stormwater quality improvementmeasures into road design practices for protectingaquatic ecosystems. The Cooperative ResearchCentre for Catchment Hydrology (CRCCH) hasundertaken this work, with contribution from theCRC for Freshwater Ecology (CRCFE), to provideenvironmentally sensitive drainage elements for roaddesigners.
The report provides worked examples for a number ofpossible options for the implementation of watersensitive road design practices, to help facilitate theadoption of multi-purpose stormwater managementpractices in road design and construction. Thisresearch has been undertaken for the Australian RoadResearch Board (ARRB) and AustRoads. Thisinitiative has largely been in response to growingcommunity awareness for environmental effects ofurbanisation on the quality of water in the urbanenvironment.
Tom McMahonProgram Leader, Urban Hydrology
Cooperative Research Centre for Catchment Hydrology
COOPERAT IVE RESEARCH CENTRE FOR CATCHMENT HYDROLOGY
Water SensitiveRoad Design -Design Options forImprovingStormwaterQuality of RoadRunoff
Tony H F Wong1, Peter F Breen2 andSara D Lloyd1
1Cooperative Research Centre for Catchment Hydrology2Cooperative Research Centre for Freshwater Ecology
August, 2000

COOPERAT IVE RESEARCH CENTRE FOR CATCHMENT HYDROLOGY
COOPERAT IVE RESEARCH CENTRE FOR CATCHMENT HYDROLOGY
ii
Abstract
A significant amount of pollutants ranging from grosspollutants to particulate and soluble toxins aregenerated from urban catchments. There is increasingpublic concern that stormwater from urbancatchments can cause signif icant ecologicaldisturbance to receiving waters, often leading to adecrease in ecological health and a loss of habitatdiversity. Roads and other tranport related surfacescan constitute up to 70% of the total impervious areasin an urban catchment; these road surfaces contributeconsiderably larger pollutant loads compared withother land uses. In many studies, correlations havebeen made between the amount of pollutantsgenerated and the road traffic volume.
This report provides a broad overview of the effectsof urbanisation on catchment hydrology and thequality of the stormwater generated from thecatchment. It presents typical geomorphological andecological responses of aquatic ecosystems receivingstormwater runoff from urban areas, and the basis onwhich the health of these ecosystems can be definedand assessed. The aim is to facilitate a betterappreciation of the causes and effects of aquaticecosystem health deterioration, and the goals andobjectives in developing strategies for protecting andimproving aquatic ecosystem health of receivingwaters. The report also discusses the likelycontribution of runoff generated from roads andhighways to the deterioration of ecological health inreceiving waters. Current approaches adopted tomitigate the impacts of catchment urbanisation andmore specifically impacts directly related to runofffrom roads and highways on the ecological health ofreceiving waters are addressed.
Many of the stormwater quality improvementmeasures that could be incorporated into road designinvolve the use of vegetation in grassed swales, bufferstrips or constructed wetlands. Other options includethe promotion of infiltration through a ‘bioretention’media. The report includes a number of hypotheticalcase studies and worked examples, demonstratinghow many of these options can be sized andincorporated into road design.

COOPERAT IVE RESEARCH CENTRE FOR CATCHMENT HYDROLOGY
iii
Acknowledgements
The authors of this report would like to acknowledgethe assistance and support provided by the AustralianRoad Research Board (ARRB) and in particular theefforts of Jencie McRobert. Thanks are due to thosewho assisted in the project from the CRC forFreshwater Ecology and Austroads.

iv
COOPERAT IVE RESEARCH CENTRE FOR CATCHMENT HYDROLOGY
Preface i
Abstract iii
Acknowledgements iv
1 Introduction 1
1.1 Overview 1
2 Effects of Catchment Urbanisation on Stormwater
Characteristics 3
2.1 Background 3
2.2 Catchment Hydrology 4
Catchment Imperviousness 4
Effects on Stormwater Runoff 4
Factors Contributing to Increased Runoff 6
2.3 Stormwater Quality 7
Gross Pollutants and Litter 8
Suspended Solids 10
Metals 11
Toxic Organics, Oils and Surfactants 11
Nutrients 11
Micro-organisms 12
Oxygen Demanding Materials 12
2.4 Temporal Distribution of Stormwater Pollutants 13
2.5 Comparison of Australian Data with Global Data 14
2.6 Receiving Water Geomorphology and Ecology 15
Geomorphological Impact 15
Ecological Response 17
3 Ecosystem Health - Definition and Assessment 19
3.1 Introduction 19
What is Ecosystem Health? 19
3.2 Factors Influencing Biological Communities
and Ecosystem Health 19
Biological Interactions 20
Geomorphology 21
In-stream Habitat 21
COOPERAT IVE RESEARCH CENTRE FOR CATCHMENT HYDROLOGY
v
Hydrology 22
Hydraulics 22
Water Quality 23
Sediment Quality 24
Riparian Habitat 25
Continuity and Barriers 26
3.3 Bio-monitoring and Assessment of Health
in Stream Ecosystems 26
4 Characteristics of Stormwater Pollutants from
Roads and Highways 29
4.1 Overview 29
4.2 Pollutant Concentrations in Road Runoff 29
4.3 Physical Characteristics of Suspended Solids 31
4.4 Association Between Suspended Solids and
Absorbed Pollutants 32
Heavy Metals 32
4.5 Soluble Polutants 34
Petroleum By-products 35
5 Water Sensitive Design Practices 37
5.1 Water Sensitive Urban Design 37
Best Planning Practices 38
Stormwater Best Management Practices 38
5.2 Treatment of Road Runoff 38
Porous Pavements 39
Swale Drains 39
Buffer strips 40
Flow Detention by Infiltration 41
Flow Retention by Infiltration 42
Wetlands and Ponds 43
Oil and Grease Removal 44
5.3 Chemical Spill Containment 45
6 Water Sensitive Road Design 47
6.1 Introduction 47
6.2 Scenario 1 50
Selection of Design Event 50
COOPERAT IVE RESEARCH CENTRE FOR CATCHMENT HYDROLOGY
vii
Computing the Design Flows 51
Assessment of Stream Ecological Health 51
Establishing Runoff Management Targets 53
Option 1-Buffer Strips 53
Option 2-Kerb and Channel / Buffer Strip 54
Option 3-Swale Drains and Discharge Pits 55
Option 4-Swale Drain and Bioretention Zone 56
Worked Examples –Swale Drains
and Bioretention Zone 58
6.3 Scenario 2 60
Computing the Design Flows 60
Option 1-Swale Drain and Underground Pipe 60
Option 2-Swale Drains and Bioretention Zone 62
Option 3-Kerb and Channel and
Treatment Systems 62
Swale Drains and Buffer Strips 63
Constructed wetlands 63
Worked Examples-Constructed Wetlands 65
7 Conclusion 69
References 71

COOPERAT IVE RESEARCH CENTRE FOR CATCHMENT HYDROLOGY
viii
1 Introduction
1.1 Overview
This report is intended to facilitate the developmentof water sensitive road design practices, to addressgrowing community awareness of the environmentaleffects of urbanisation on the quality of water in theurban environment. The Cooperative Research Centrefor Catchment Hydrology (CRCCH) and CooperativeResearch Centre for Freshwater Ecology (CRCFE)have worked, in collaboration with the AustralianRoad Research Board (ARRB), to develop a series ofBest Management Practice options for improving thehydrology and quality of stormwater runoff fromroads and transport related impervious surfaces. Thisproject forms part of a larger commission undertakenby ARRB for Austroads to examine ecologicalsustainable road deign and construction practices.
It is well established that stormwater generated frombuilt-up or developing catchments can causesignif icant ecological disturbance to downstreamreceiving waters, often leading to a decrease inecological health and a loss of habitat diversity.Storm runoff generated from urban catchments affectsthe ecology of receiving waters due to the (i)disturbance of aquatic habitats through increasedmagnitude, frequency and duration of highdischarges; and (ii) poorer water quality due to theexport of pollutants generated from landuse activitiesassociated with a developing or fully urbanisedcatchment.
Studies from overseas have identified that up to 70%of the impervious areas of an urban catchment istransport-related, ie. roads, driveways and car-parks(Schueler, 1987a). A significant amount of pollutantsranging from gross pollutants to particulate andsoluble contaminants (eg. trace metals andhydrocarbons, especially polycyclic aromatichydrocarbons) are generated from road surfaces, withsome studies indicating correlation between theamount of pollutants and road traff ic volume.Stormwater runoff from highways with traffic volumeexceeding 30,000 vehicles per day contains pollutantswhich are up to four times that generated fromhighways of traffic volume less than 30,000 vehiclesper day (Driscoll et al., 1990).
There are currently a number of initiatives promotedby state environmental, waterway and drainageauthorities to facilitate best practice in stormwatermanagement; these meet a number of objectivesbeyond the eff icient drainage of stormwater andassociated public safety elements of stormwatermanagement. Case studies and experiences fromAustralia and overseas have demonstrated thefeasibility of managing stormwater for ecological andother environmental objectives, withoutcompromising public safety and drainage economics.In Victoria and NSW, guidelines have been developedto provide a framework for local government anddevelopers to implement ecologically sustainablestormwater management strategies (VictorianStormwater Committee, 1999; NSWEPA, 1997).
This report begins with a broad overview of the effectof catchment urbanisation on the hydrology of thecatchment and the quality of the stormwatergenerated from the catchment. Section 3 is intendedto provide a better appreciation of the causes andeffects of aquatic ecosystem health deterioration, andthe goals and objectives in developing strategies forprotecting and improving aquatic ecosystem health ofreceiving waters. Section 4 discusses, in more detail,the contribution of roads and highways to thedeterioration of ecological health in receiving waters.Section 5 examines current approaches adopted inAustralia and overseas to mitigate the impacts ofcatchment urbanisation (in particular runoff fromroads and highways) on the ecological health ofreceiving waters is examined. Worked examples/casestudies are provided in Section 6.
COOPERAT IVE RESEARCH CENTRE FOR CATCHMENT HYDROLOGY
1

COOPERAT IVE RESEARCH CENTRE FOR CATCHMENT HYDROLOGY
2
a hydraulically efficient stormwater drainage system,has resulted in progressive deterioration of theenvironmental values of the aquatic ecosystem inurban environments.
The impact of poor stormwater quality is becomingan increasing issue of concern amongst catchmentmanagers. The impacts can include increasedturbidity and suspended solid concentrations,deposition of suspended material including litter,increased concentrations of nutrients and metals,increased numbers of micro-organisms, changes inwater temperature and pH and decreased dissolvedoxygen levels.
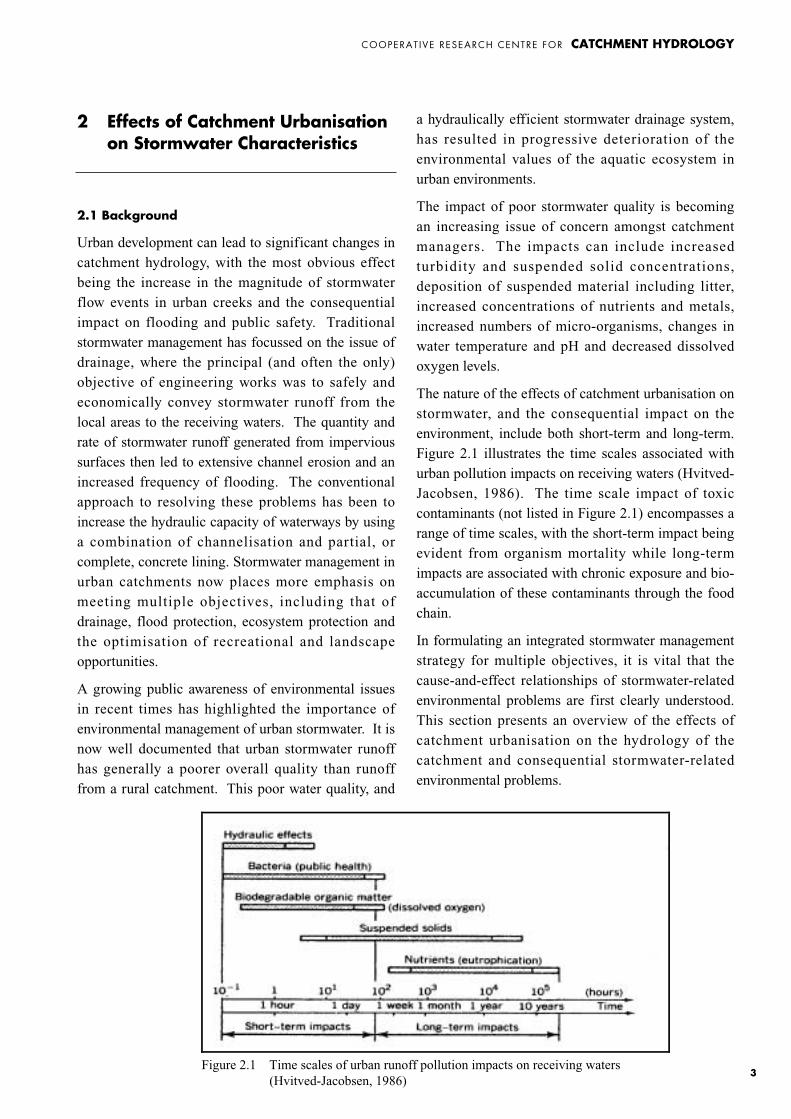
The nature of the effects of catchment urbanisation onstormwater, and the consequential impact on theenvironment, include both short-term and long-term.Figure 2.1 illustrates the time scales associated withurban pollution impacts on receiving waters (Hvitved-Jacobsen, 1986). The time scale impact of toxiccontaminants (not listed in Figure 2.1) encompasses arange of time scales, with the short-term impact beingevident from organism mortality while long-termimpacts are associated with chronic exposure and bio-accumulation of these contaminants through the foodchain.
In formulating an integrated stormwater managementstrategy for multiple objectives, it is vital that thecause-and-effect relationships of stormwater-relatedenvironmental problems are first clearly understood.This section presents an overview of the effects ofcatchment urbanisation on the hydrology of thecatchment and consequential stormwater-relatedenvironmental problems.
COOPERAT IVE RESEARCH CENTRE FOR CATCHMENT HYDROLOGY
3
2 Effects of Catchment Urbanisation on Stormwater Characteristics
2.1 Background
Urban development can lead to significant changes incatchment hydrology, with the most obvious effectbeing the increase in the magnitude of stormwaterflow events in urban creeks and the consequentialimpact on flooding and public safety. Traditionalstormwater management has focussed on the issue ofdrainage, where the principal (and often the only)objective of engineering works was to safely andeconomically convey stormwater runoff from thelocal areas to the receiving waters. The quantity andrate of stormwater runoff generated from impervioussurfaces then led to extensive channel erosion and anincreased frequency of flooding. The conventionalapproach to resolving these problems has been toincrease the hydraulic capacity of waterways by usinga combination of channelisation and partial, orcomplete, concrete lining. Stormwater management inurban catchments now places more emphasis onmeeting multiple objectives, including that ofdrainage, flood protection, ecosystem protection andthe optimisation of recreational and landscapeopportunities.
A growing public awareness of environmental issuesin recent times has highlighted the importance ofenvironmental management of urban stormwater. It isnow well documented that urban stormwater runoffhas generally a poorer overall quality than runofffrom a rural catchment. This poor water quality, and
Figure 2.1 Time scales of urban runoff pollution impacts on receiving waters (Hvitved-Jacobsen, 1986)
2.2 Catchment Hydrology
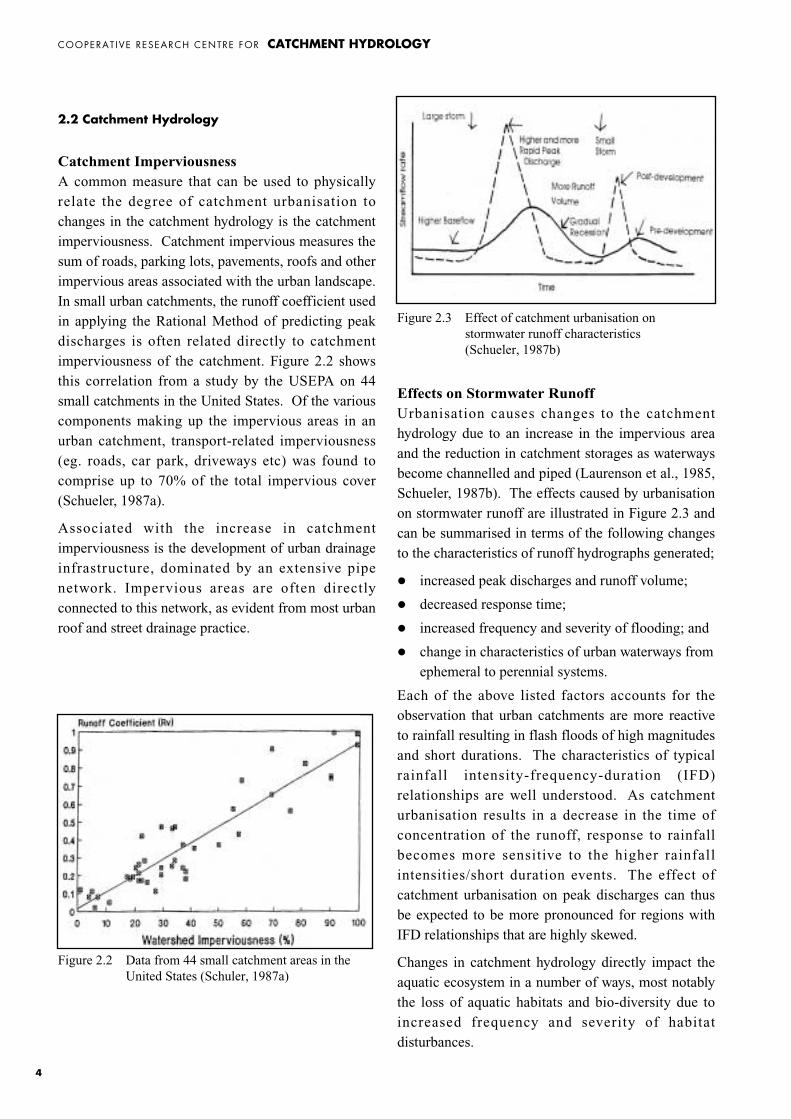
Catchment ImperviousnessA common measure that can be used to physicallyrelate the degree of catchment urbanisation tochanges in the catchment hydrology is the catchmentimperviousness. Catchment impervious measures thesum of roads, parking lots, pavements, roofs and otherimpervious areas associated with the urban landscape.In small urban catchments, the runoff coefficient usedin applying the Rational Method of predicting peakdischarges is often related directly to catchmentimperviousness of the catchment. Figure 2.2 showsthis correlation from a study by the USEPA on 44small catchments in the United States. Of the variouscomponents making up the impervious areas in anurban catchment, transport-related imperviousness(eg. roads, car park, driveways etc) was found tocomprise up to 70% of the total impervious cover(Schueler, 1987a).
Associated with the increase in catchmentimperviousness is the development of urban drainageinfrastructure, dominated by an extensive pipenetwork. Impervious areas are often directlyconnected to this network, as evident from most urbanroof and street drainage practice.
Effects on Stormwater RunoffUrbanisation causes changes to the catchmenthydrology due to an increase in the impervious areaand the reduction in catchment storages as waterwaysbecome channelled and piped (Laurenson et al., 1985,Schueler, 1987b). The effects caused by urbanisationon stormwater runoff are illustrated in Figure 2.3 andcan be summarised in terms of the following changesto the characteristics of runoff hydrographs generated;
� increased peak discharges and runoff volume;
� decreased response time;
� increased frequency and severity of flooding; and
� change in characteristics of urban waterways fromephemeral to perennial systems.
Each of the above listed factors accounts for theobservation that urban catchments are more reactiveto rainfall resulting in flash floods of high magnitudesand short durations. The characteristics of typicalrainfall intensity-frequency-duration (IFD)relationships are well understood. As catchmenturbanisation results in a decrease in the time ofconcentration of the runoff, response to rainfallbecomes more sensitive to the higher rainfallintensities/short duration events. The effect ofcatchment urbanisation on peak discharges can thusbe expected to be more pronounced for regions withIFD relationships that are highly skewed.
Changes in catchment hydrology directly impact theaquatic ecosystem in a number of ways, most notablythe loss of aquatic habitats and bio-diversity due toincreased frequency and severity of habitatdisturbances.
COOPERAT IVE RESEARCH CENTRE FOR CATCHMENT HYDROLOGY
4
Figure 2.2 Data from 44 small catchment areas in theUnited States (Schuler, 1987a)
Figure 2.3 Effect of catchment urbanisation onstormwater runoff characteristics(Schueler, 1987b)
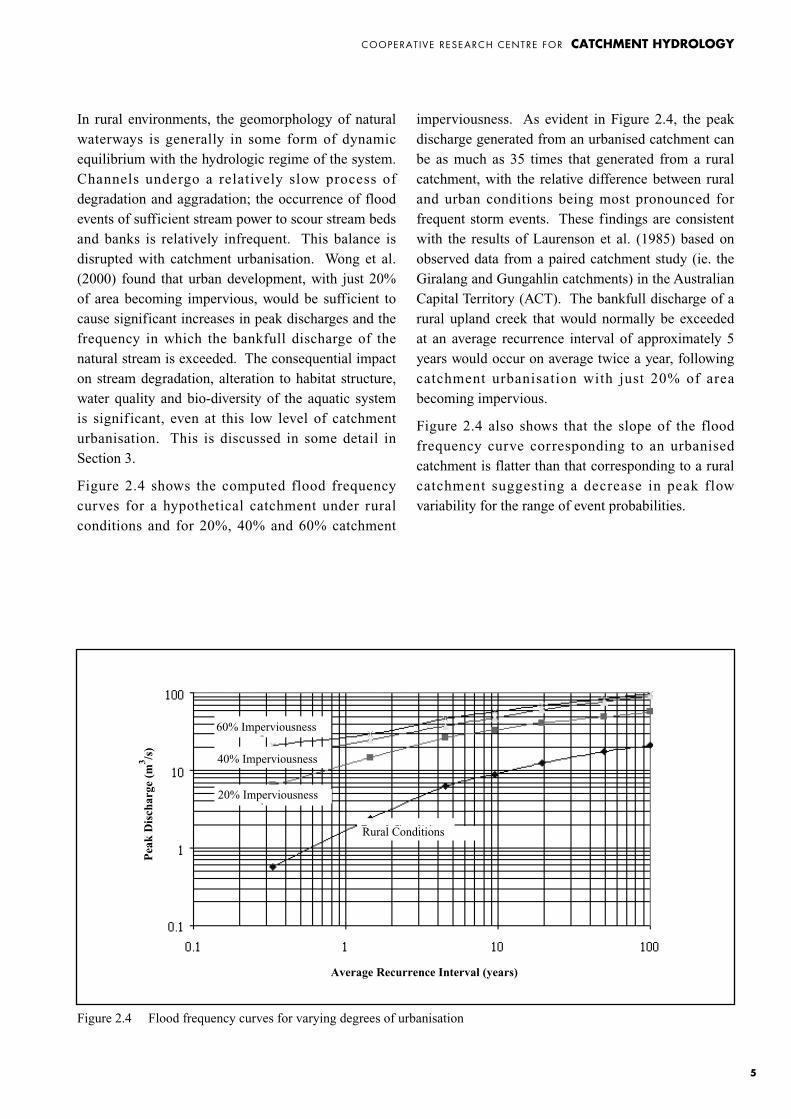
imperviousness. As evident in Figure 2.4, the peakdischarge generated from an urbanised catchment canbe as much as 35 times that generated from a ruralcatchment, with the relative difference between ruraland urban conditions being most pronounced forfrequent storm events. These findings are consistentwith the results of Laurenson et al. (1985) based onobserved data from a paired catchment study (ie. theGiralang and Gungahlin catchments) in the AustralianCapital Territory (ACT). The bankfull discharge of arural upland creek that would normally be exceededat an average recurrence interval of approximately 5years would occur on average twice a year, followingcatchment urbanisation with just 20% of areabecoming impervious.
Figure 2.4 also shows that the slope of the floodfrequency curve corresponding to an urbanisedcatchment is flatter than that corresponding to a ruralcatchment suggesting a decrease in peak flowvariability for the range of event probabilities.
COOPERAT IVE RESEARCH CENTRE FOR CATCHMENT HYDROLOGY
5
In rural environments, the geomorphology of naturalwaterways is generally in some form of dynamicequilibrium with the hydrologic regime of the system.Channels undergo a relatively slow process ofdegradation and aggradation; the occurrence of floodevents of sufficient stream power to scour stream bedsand banks is relatively infrequent. This balance isdisrupted with catchment urbanisation. Wong et al.(2000) found that urban development, with just 20%of area becoming impervious, would be sufficient tocause significant increases in peak discharges and thefrequency in which the bankfull discharge of thenatural stream is exceeded. The consequential impacton stream degradation, alteration to habitat structure,water quality and bio-diversity of the aquatic systemis significant, even at this low level of catchmenturbanisation. This is discussed in some detail inSection 3.
Figure 2.4 shows the computed flood frequencycurves for a hypothetical catchment under ruralconditions and for 20%, 40% and 60% catchment
Figure 2.4 Flood frequency curves for varying degrees of urbanisation
60% Imperviousness
40% Imperviousness
20% Imperviousness
Rural Conditions
Average Recurrence Interval (years)
Pea
k D
isch
arge
(m
3 /s)
degree of waterway hydraulic eff iciencies. Therelative significance of channel modification reducesfor more frequent flood events, with improvedhydraulic efficiency in watercourses accounting for80% of the increase in peak discharge.
COOPERAT IVE RESEARCH CENTRE FOR CATCHMENT HYDROLOGY
6
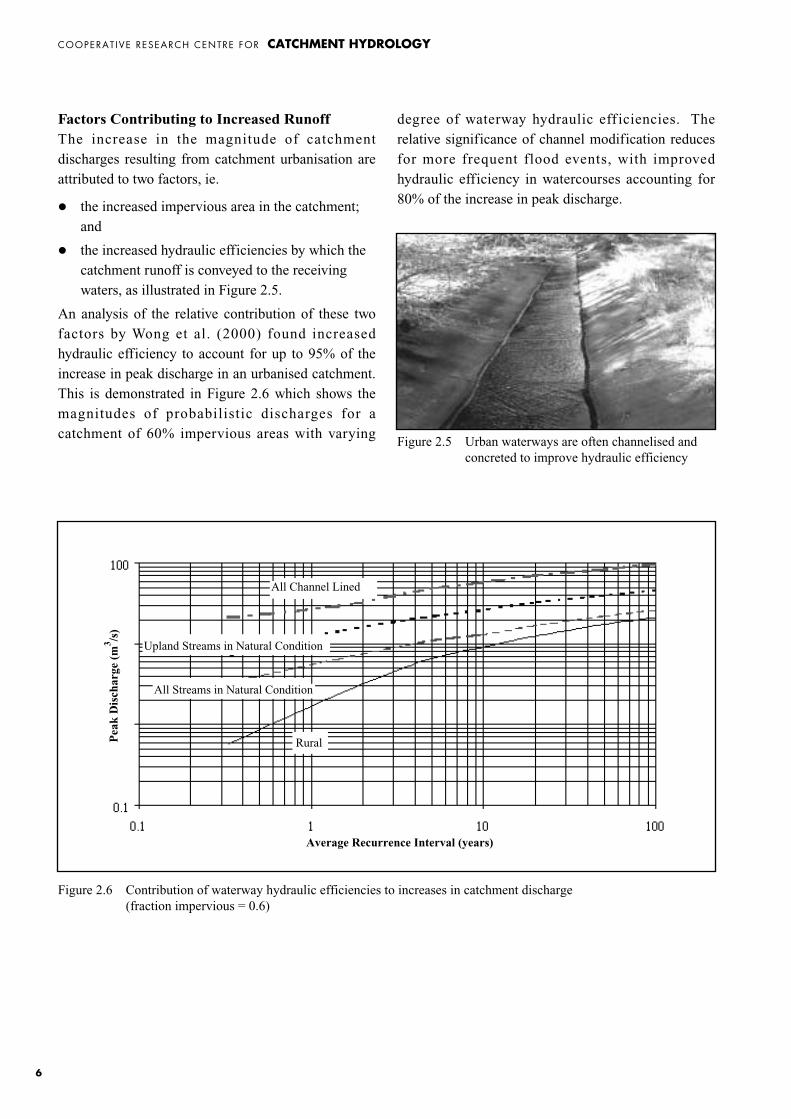
Factors Contributing to Increased RunoffThe increase in the magnitude of catchmentdischarges resulting from catchment urbanisation areattributed to two factors, ie.
� the increased impervious area in the catchment;and
� the increased hydraulic efficiencies by which thecatchment runoff is conveyed to the receivingwaters, as illustrated in Figure 2.5.
An analysis of the relative contribution of these twofactors by Wong et al. (2000) found increasedhydraulic efficiency to account for up to 95% of theincrease in peak discharge in an urbanised catchment.This is demonstrated in Figure 2.6 which shows themagnitudes of probabilistic discharges for acatchment of 60% impervious areas with varying
Figure 2.5 Urban waterways are often channelised andconcreted to improve hydraulic efficiency
Figure 2.6 Contribution of waterway hydraulic efficiencies to increases in catchment discharge(fraction impervious = 0.6)
All Channel Lined
Upland Streams in Natural Condition
Rural
Average Recurrence Interval (years)
Pea
k D
isch
arge
(m
3 /s)
All Streams in Natural Condition
It follows, from consideration of the results presentedin Figure 2.6, that prioritisation of available flowmanagement measures should f irst consideraddressing the impact of increased hydrauliceff iciency in the flow conveyance system of thecatchment. It may be possible to sustain a relativelyhigh catchment imperviousness if steps are taken tode-couple these impervious areas from thehydraulically eff icient drainage elements of thestormwater management infrastructure. This is ofparticular relevance when planning the stormwaterdrainage network of new developments in agreenfield site. Naturally, in a built-up catchment,there is little scope for rehabilitating "urbanised"waterways without first facilitating a reduction inflow magnitudes of the frequent events.
2.3 Stormwater Quality
Stormwater pollutants from urban developmentsoriginate from a variety of sources in the catchment.The most common sources include motor vehicles,construction activities, erosion and surfacedegradation, spills and leachates, miscellaneoussurface deposits and atmospheric deposition. The
pollutants that originate from these sources aregrouped according to their impact on water qualityand include:
� Gross pollutants and litter
� Sediment and suspended solids
� Nutrients (primarily phosphorous and nitrogen)
� BOD and COD
� Micro-organisms
� Metals
� Toxic organics, oils and surfactants
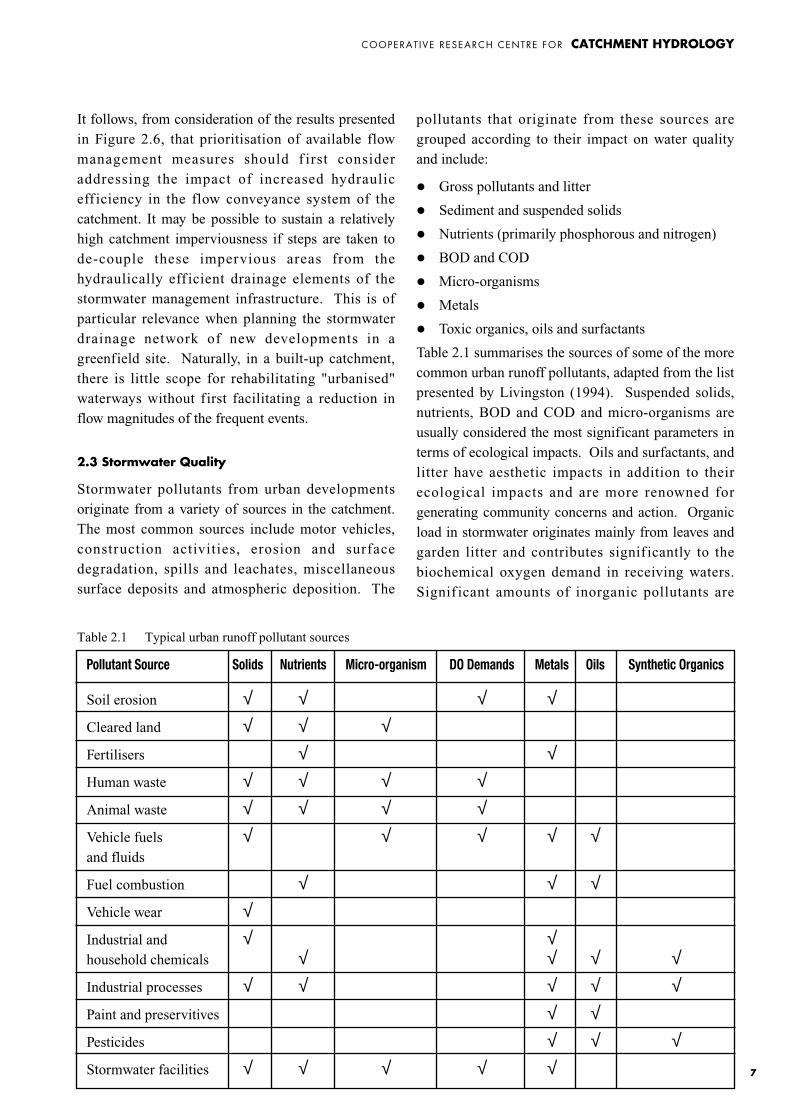
Table 2.1 summarises the sources of some of the morecommon urban runoff pollutants, adapted from the listpresented by Livingston (1994). Suspended solids,nutrients, BOD and COD and micro-organisms areusually considered the most significant parameters interms of ecological impacts. Oils and surfactants, andlitter have aesthetic impacts in addition to theirecological impacts and are more renowned forgenerating community concerns and action. Organicload in stormwater originates mainly from leaves andgarden litter and contributes signif icantly to thebiochemical oxygen demand in receiving waters.Signif icant amounts of inorganic pollutants are
COOPERAT IVE RESEARCH CENTRE FOR CATCHMENT HYDROLOGY
7
Pollutant Source Solids Nutrients Micro-organism DO Demands Metals Oils Synthetic Organics
Soil erosion √ √ √ √Cleared land √ √ √Fertilisers √ √Human waste √ √ √ √Animal waste √ √ √ √Vehicle fuels √ √ √ √ √and fluids
Fuel combustion √ √ √Vehicle wear √Industrial and √ √household chemicals √ √ √ √Industrial processes √ √ √ √ √Paint and preservitives √ √Pesticides √ √ √Stormwater facilities √ √ √ √ √
Table 2.1 Typical urban runoff pollutant sources
There is no formal protocol for the monitoring ofgross pollutants. A recent study by the CooperativeResearch Centre for Catchment Hydrology (Allison etal., 1997) has found organic material (ie. vegetationparticularly twigs, grass clippings and leaves) toconstitute the largest proportion of gross pollutantscarried by stormwater as shown in Figure 2.8. Thiswas found to be the case for all landuse types.Human-derived litter makes up approximately 25% to30% of the total gross pollutant load. Of the human-derived litter, paper was found to be the dominantpollutant type as shown in Figure 2.9. A related studyof litter on urban streets resulted in similar findingsby the Moreland City Council and Merri CreekManagement Committee (1997).
Pollution of the environment from the export of litterand other urban-derived gross pollutants hasintensif ied over the last 30 years due to theproduction of easily disposable, non-biodegradablepackaging of household, commercial and industrialitems. The sources of litter are varied, and includedropping of rubbish, overflows of rubbish containersand material blown away from tips and other rubbishsources as evident from Figure 2.10.
sediment bound. It is for this reason that effectivetreatment of suspended solids is often a minimumcriterion in stormwater quality management, with theexpectation that a significant amount of organic andinorganic pollutant will also be treated.
With as much as 70% of the catchment impervioussurface area associated with transport-relatedfunctions such as roads, driveway, car-parks etc., thiscomponent is a prominent source of suspended solidsand associated trace metals, polycyclic aromatichydrocarbons and nutrients. Urban commercialactivities have also been identified as the main sourceof litter generation.
With catchment urbanisation, it can be expected thattypical concentration levels of most of thesepollutants will be elevated, and there have beenextensive data collected from overseas catchmentswhich clearly demonstrates this.
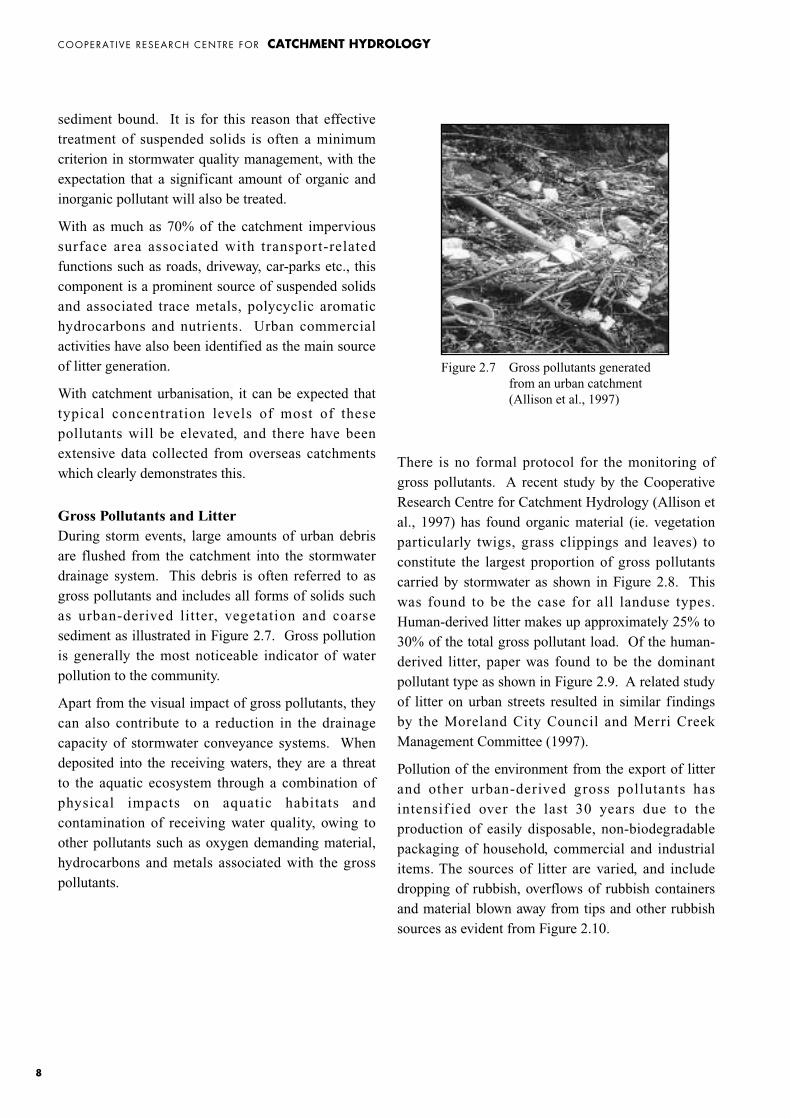
Gross Pollutants and LitterDuring storm events, large amounts of urban debrisare flushed from the catchment into the stormwaterdrainage system. This debris is often referred to asgross pollutants and includes all forms of solids suchas urban-derived litter, vegetation and coarsesediment as illustrated in Figure 2.7. Gross pollutionis generally the most noticeable indicator of waterpollution to the community.
Apart from the visual impact of gross pollutants, theycan also contribute to a reduction in the drainagecapacity of stormwater conveyance systems. Whendeposited into the receiving waters, they are a threatto the aquatic ecosystem through a combination ofphysical impacts on aquatic habitats andcontamination of receiving water quality, owing toother pollutants such as oxygen demanding material,hydrocarbons and metals associated with the grosspollutants.
COOPERAT IVE RESEARCH CENTRE FOR CATCHMENT HYDROLOGY
8
Figure 2.7 Gross pollutants generatedfrom an urban catchment(Allison et al., 1997)
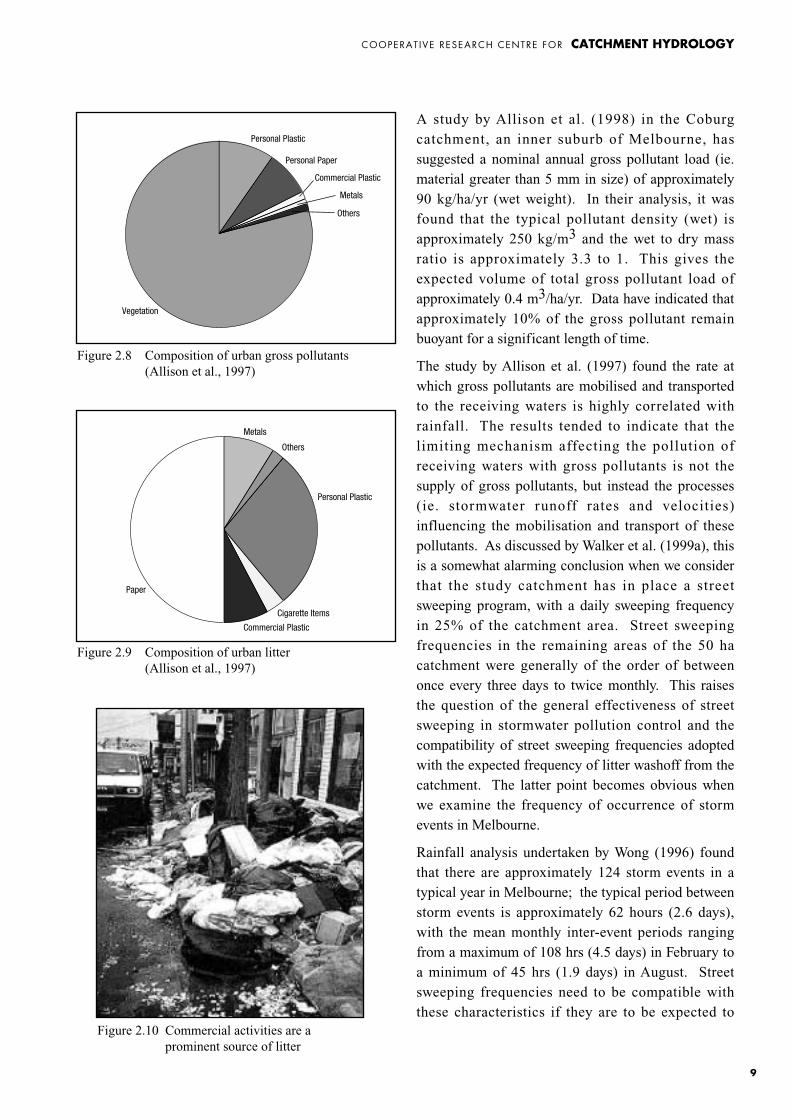
A study by Allison et al. (1998) in the Coburgcatchment, an inner suburb of Melbourne, hassuggested a nominal annual gross pollutant load (ie.material greater than 5 mm in size) of approximately90 kg/ha/yr (wet weight). In their analysis, it wasfound that the typical pollutant density (wet) isapproximately 250 kg/m3 and the wet to dry massratio is approximately 3.3 to 1. This gives theexpected volume of total gross pollutant load ofapproximately 0.4 m3/ha/yr. Data have indicated thatapproximately 10% of the gross pollutant remainbuoyant for a significant length of time.
The study by Allison et al. (1997) found the rate atwhich gross pollutants are mobilised and transportedto the receiving waters is highly correlated withrainfall. The results tended to indicate that thelimiting mechanism affecting the pollution ofreceiving waters with gross pollutants is not thesupply of gross pollutants, but instead the processes(ie. stormwater runoff rates and velocities)influencing the mobilisation and transport of thesepollutants. As discussed by Walker et al. (1999a), thisis a somewhat alarming conclusion when we considerthat the study catchment has in place a streetsweeping program, with a daily sweeping frequencyin 25% of the catchment area. Street sweepingfrequencies in the remaining areas of the 50 hacatchment were generally of the order of betweenonce every three days to twice monthly. This raisesthe question of the general effectiveness of streetsweeping in stormwater pollution control and thecompatibility of street sweeping frequencies adoptedwith the expected frequency of litter washoff from thecatchment. The latter point becomes obvious whenwe examine the frequency of occurrence of stormevents in Melbourne.
Rainfall analysis undertaken by Wong (1996) foundthat there are approximately 124 storm events in atypical year in Melbourne; the typical period betweenstorm events is approximately 62 hours (2.6 days),with the mean monthly inter-event periods rangingfrom a maximum of 108 hrs (4.5 days) in February toa minimum of 45 hrs (1.9 days) in August. Streetsweeping frequencies need to be compatible withthese characteristics if they are to be expected to
COOPERAT IVE RESEARCH CENTRE FOR CATCHMENT HYDROLOGY
9
Figure 2.8 Composition of urban gross pollutants(Allison et al., 1997)
Figure 2.9 Composition of urban litter(Allison et al., 1997)
Figure 2.10 Commercial activities are aprominent source of litter
Personal Plastic
Others
Metals
Cigarette Items
Commercial Plastic
Personal Paper
Paper
Personal Plastic
Metals
Others
Commercial Plastic
Vegetation
COOPERAT IVE RESEARCH CENTRE FOR CATCHMENT HYDROLOGY
10
potential of the sediment and water column becomesfavourable for their release. This mechanism providesthe opportunity for pollutant re-mobilisation in laterflow events enhancing the risk of furtherenvironmental degradation of downstream aquaticecosystems. Levels of inorganic soil particlesgenerated from these activities are at least two to sixtimes, and can often be up to several hundred times,pre-development levels.
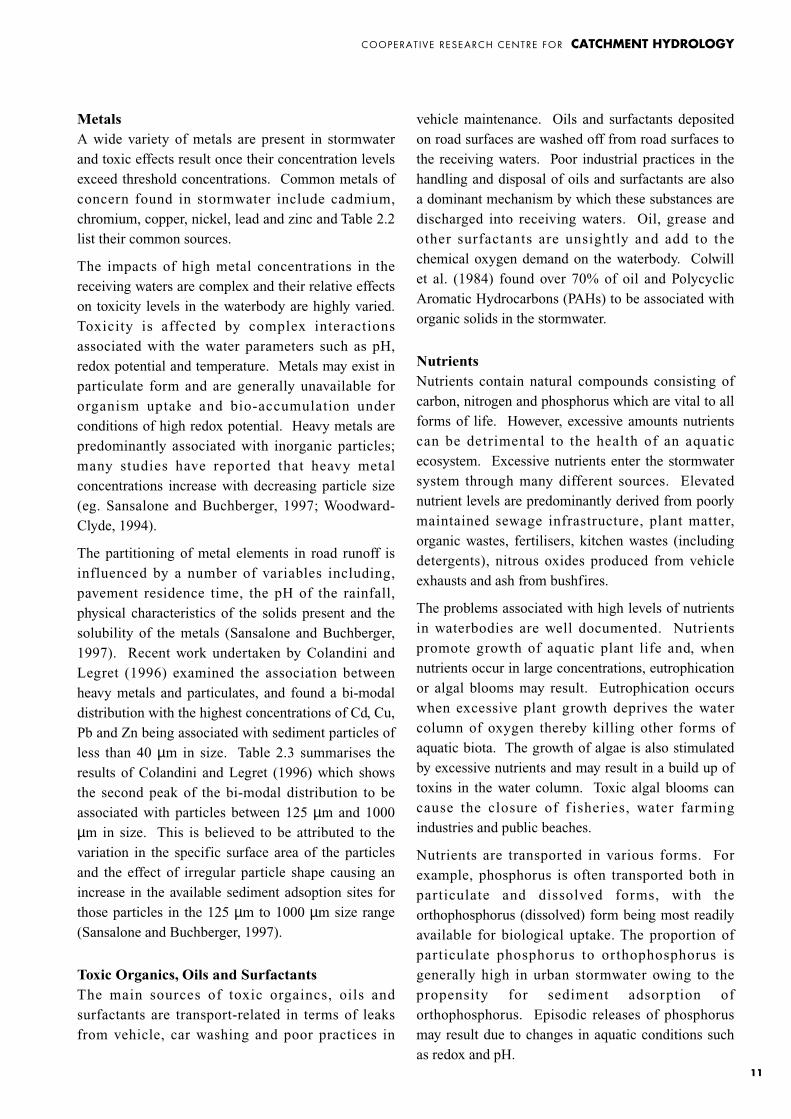
Turbid waters (Figure 2.12) often result from thepresence of suspended solids; this has the effect ofreducing the penetration of light through water withthe consequential impact on the feeding andrespiration of aquatic biota. In general thecommunity associates turbid waters withenvironmental pollution and degradation of thewater's aesthetic value. Data provided by Willing andPartners (1992) on the amount of expected sediment(particle size > 0.01 µm) export from urbancatchments in the Canberra region suggest a ratebetween 1.2 tonnes/ha/yr and 2.5 tonnes/ha/yr,depending on the degree of urbanisation in thecatchment. The density of sediment is approximately2.65 tonnes/m3 and the sediment porosity was foundto be approximately 0.42. The expected volume ofsediment exported from an urban catchment in theCanberra region is thus approximately 1.6 m3/ha/yr.
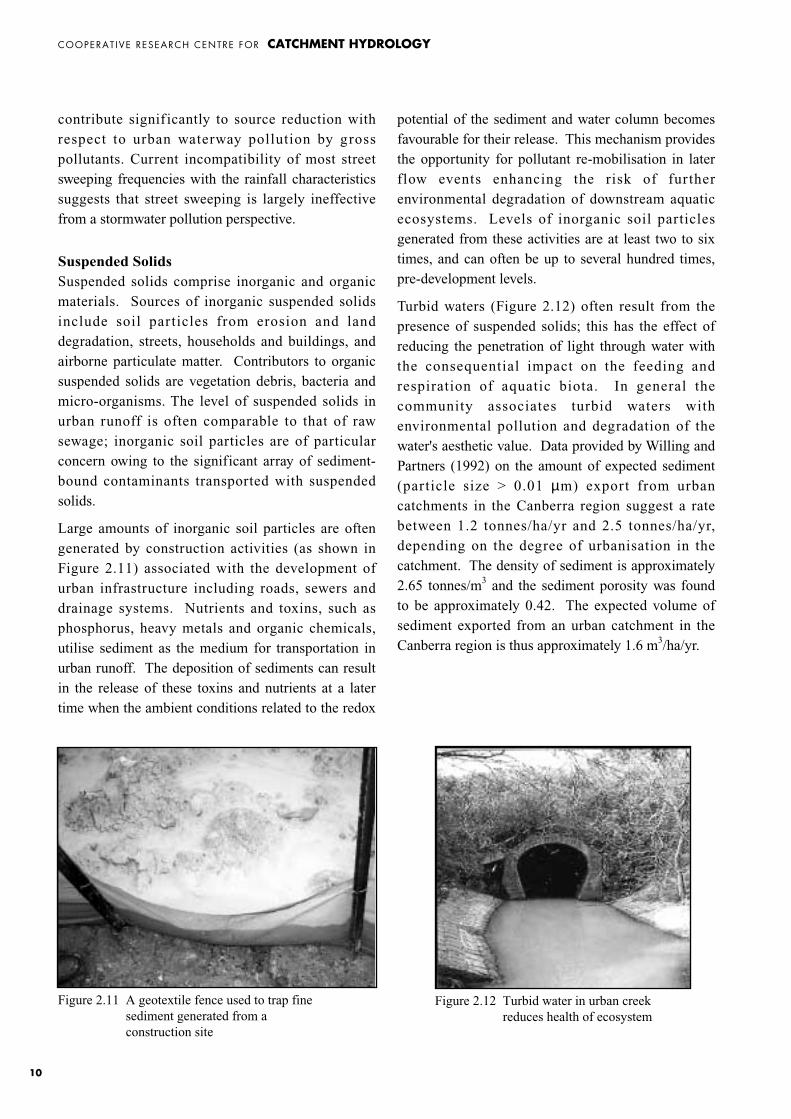
Figure 2.11 A geotextile fence used to trap finesediment generated from aconstruction site
Figure 2.12 Turbid water in urban creekreduces health of ecosystem
contribute signif icantly to source reduction withrespect to urban waterway pollution by grosspollutants. Current incompatibility of most streetsweeping frequencies with the rainfall characteristicssuggests that street sweeping is largely ineffectivefrom a stormwater pollution perspective.
Suspended SolidsSuspended solids comprise inorganic and organicmaterials. Sources of inorganic suspended solidsinclude soil particles from erosion and landdegradation, streets, households and buildings, andairborne particulate matter. Contributors to organicsuspended solids are vegetation debris, bacteria andmicro-organisms. The level of suspended solids inurban runoff is often comparable to that of rawsewage; inorganic soil particles are of particularconcern owing to the significant array of sediment-bound contaminants transported with suspendedsolids.
Large amounts of inorganic soil particles are oftengenerated by construction activities (as shown inFigure 2.11) associated with the development ofurban infrastructure including roads, sewers anddrainage systems. Nutrients and toxins, such asphosphorus, heavy metals and organic chemicals,utilise sediment as the medium for transportation inurban runoff. The deposition of sediments can resultin the release of these toxins and nutrients at a latertime when the ambient conditions related to the redox
vehicle maintenance. Oils and surfactants depositedon road surfaces are washed off from road surfaces tothe receiving waters. Poor industrial practices in thehandling and disposal of oils and surfactants are alsoa dominant mechanism by which these substances aredischarged into receiving waters. Oil, grease andother surfactants are unsightly and add to thechemical oxygen demand on the waterbody. Colwillet al. (1984) found over 70% of oil and PolycyclicAromatic Hydrocarbons (PAHs) to be associated withorganic solids in the stormwater.
NutrientsNutrients contain natural compounds consisting ofcarbon, nitrogen and phosphorus which are vital to allforms of life. However, excessive amounts nutrientscan be detrimental to the health of an aquaticecosystem. Excessive nutrients enter the stormwatersystem through many different sources. Elevatednutrient levels are predominantly derived from poorlymaintained sewage infrastructure, plant matter,organic wastes, fertilisers, kitchen wastes (includingdetergents), nitrous oxides produced from vehicleexhausts and ash from bushfires.
The problems associated with high levels of nutrientsin waterbodies are well documented. Nutrientspromote growth of aquatic plant life and, whennutrients occur in large concentrations, eutrophicationor algal blooms may result. Eutrophication occurswhen excessive plant growth deprives the watercolumn of oxygen thereby killing other forms ofaquatic biota. The growth of algae is also stimulatedby excessive nutrients and may result in a build up oftoxins in the water column. Toxic algal blooms cancause the closure of f isheries, water farmingindustries and public beaches.
Nutrients are transported in various forms. Forexample, phosphorus is often transported both inparticulate and dissolved forms, with theorthophosphorus (dissolved) form being most readilyavailable for biological uptake. The proportion ofparticulate phosphorus to orthophosphorus isgenerally high in urban stormwater owing to thepropensity for sediment adsorption oforthophosphorus. Episodic releases of phosphorusmay result due to changes in aquatic conditions suchas redox and pH.
COOPERAT IVE RESEARCH CENTRE FOR CATCHMENT HYDROLOGY
11
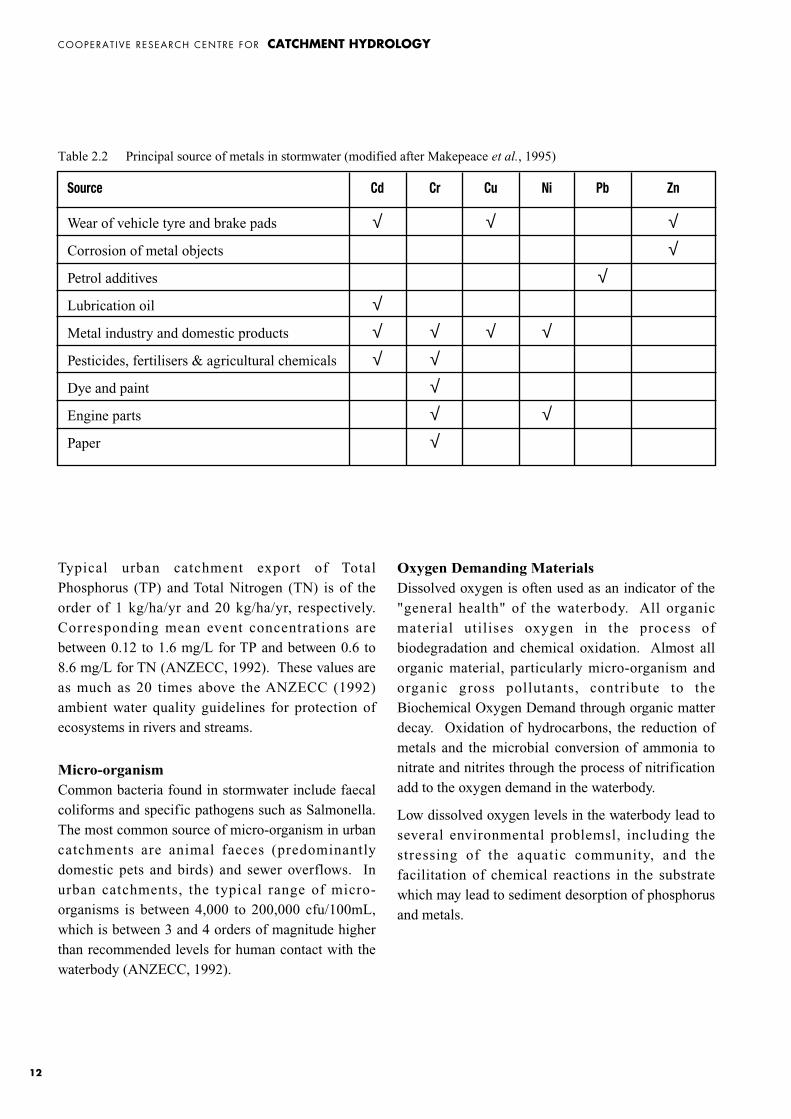
MetalsA wide variety of metals are present in stormwaterand toxic effects result once their concentration levelsexceed threshold concentrations. Common metals ofconcern found in stormwater include cadmium,chromium, copper, nickel, lead and zinc and Table 2.2list their common sources.
The impacts of high metal concentrations in thereceiving waters are complex and their relative effectson toxicity levels in the waterbody are highly varied.Toxicity is affected by complex interactionsassociated with the water parameters such as pH,redox potential and temperature. Metals may exist inparticulate form and are generally unavailable fororganism uptake and bio-accumulation underconditions of high redox potential. Heavy metals arepredominantly associated with inorganic particles;many studies have reported that heavy metalconcentrations increase with decreasing particle size(eg. Sansalone and Buchberger, 1997; Woodward-Clyde, 1994).
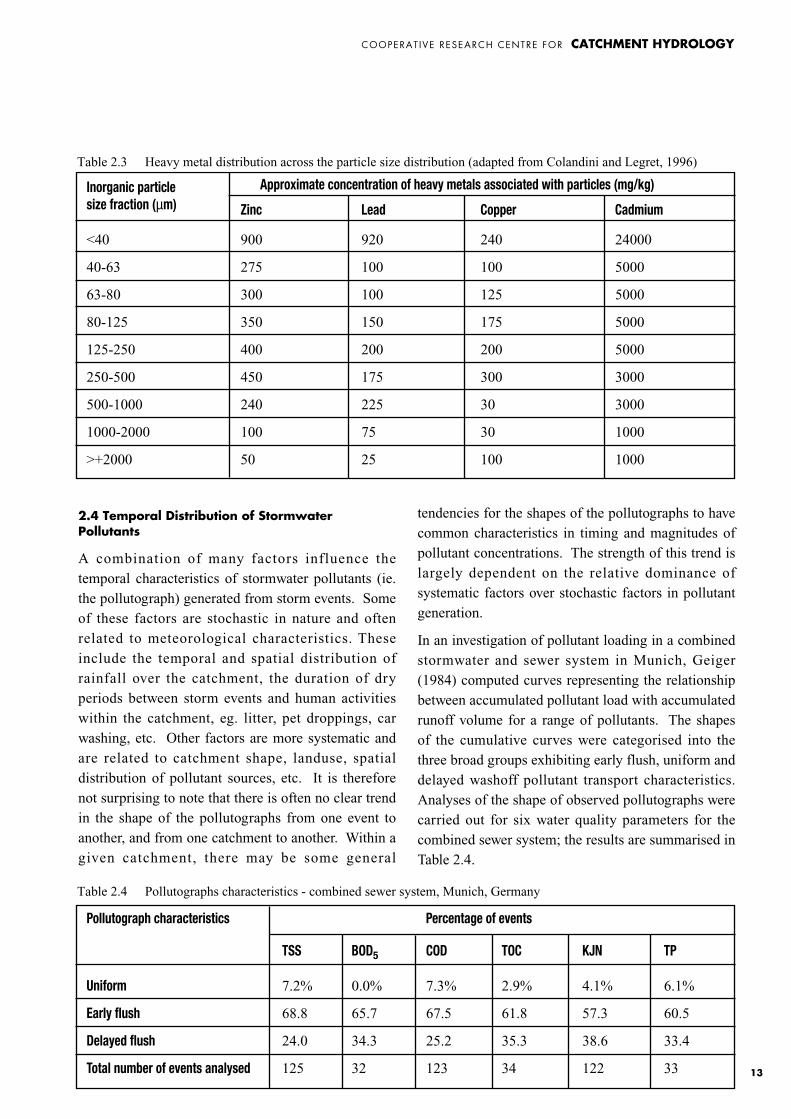
The partitioning of metal elements in road runoff isinfluenced by a number of variables including,pavement residence time, the pH of the rainfall,physical characteristics of the solids present and thesolubility of the metals (Sansalone and Buchberger,1997). Recent work undertaken by Colandini andLegret (1996) examined the association betweenheavy metals and particulates, and found a bi-modaldistribution with the highest concentrations of Cd, Cu,Pb and Zn being associated with sediment particles ofless than 40 µm in size. Table 2.3 summarises theresults of Colandini and Legret (1996) which showsthe second peak of the bi-modal distribution to beassociated with particles between 125 µm and 1000µm in size. This is believed to be attributed to thevariation in the specific surface area of the particlesand the effect of irregular particle shape causing anincrease in the available sediment adsoption sites forthose particles in the 125 µm to 1000 µm size range(Sansalone and Buchberger, 1997).
Toxic Organics, Oils and SurfactantsThe main sources of toxic orgaincs, oils andsurfactants are transport-related in terms of leaksfrom vehicle, car washing and poor practices in
Typical urban catchment export of Total Phosphorus (TP) and Total Nitrogen (TN) is of theorder of 1 kg/ha/yr and 20 kg/ha/yr, respectively.Corresponding mean event concentrations arebetween 0.12 to 1.6 mg/L for TP and between 0.6 to8.6 mg/L for TN (ANZECC, 1992). These values areas much as 20 times above the ANZECC (1992)ambient water quality guidelines for protection ofecosystems in rivers and streams.
Micro-organismCommon bacteria found in stormwater include faecalcoliforms and specific pathogens such as Salmonella.The most common source of micro-organism in urbancatchments are animal faeces (predominantlydomestic pets and birds) and sewer overflows. Inurban catchments, the typical range of micro-organisms is between 4,000 to 200,000 cfu/100mL,which is between 3 and 4 orders of magnitude higherthan recommended levels for human contact with thewaterbody (ANZECC, 1992).
Oxygen Demanding MaterialsDissolved oxygen is often used as an indicator of the"general health" of the waterbody. All organicmaterial utilises oxygen in the process ofbiodegradation and chemical oxidation. Almost allorganic material, particularly micro-organism andorganic gross pollutants, contribute to theBiochemical Oxygen Demand through organic matterdecay. Oxidation of hydrocarbons, the reduction ofmetals and the microbial conversion of ammonia tonitrate and nitrites through the process of nitrificationadd to the oxygen demand in the waterbody.
Low dissolved oxygen levels in the waterbody lead toseveral environmental problemsl, including thestressing of the aquatic community, and thefacilitation of chemical reactions in the substratewhich may lead to sediment desorption of phosphorusand metals.
COOPERAT IVE RESEARCH CENTRE FOR CATCHMENT HYDROLOGY
12
Source Cd Cr Cu Ni Pb Zn
Wear of vehicle tyre and brake pads √ √ √Corrosion of metal objects √Petrol additives √Lubrication oil √Metal industry and domestic products √ √ √ √Pesticides, fertilisers & agricultural chemicals √ √Dye and paint √Engine parts √ √Paper √
Table 2.2 Principal source of metals in stormwater (modified after Makepeace et al., 1995)
COOPERAT IVE RESEARCH CENTRE FOR CATCHMENT HYDROLOGY
13
2.4 Temporal Distribution of StormwaterPollutants
A combination of many factors influence thetemporal characteristics of stormwater pollutants (ie.the pollutograph) generated from storm events. Someof these factors are stochastic in nature and oftenrelated to meteorological characteristics. Theseinclude the temporal and spatial distribution ofrainfall over the catchment, the duration of dryperiods between storm events and human activitieswithin the catchment, eg. litter, pet droppings, carwashing, etc. Other factors are more systematic andare related to catchment shape, landuse, spatialdistribution of pollutant sources, etc. It is thereforenot surprising to note that there is often no clear trendin the shape of the pollutographs from one event toanother, and from one catchment to another. Within agiven catchment, there may be some general
tendencies for the shapes of the pollutographs to havecommon characteristics in timing and magnitudes ofpollutant concentrations. The strength of this trend islargely dependent on the relative dominance ofsystematic factors over stochastic factors in pollutantgeneration.
In an investigation of pollutant loading in a combinedstormwater and sewer system in Munich, Geiger(1984) computed curves representing the relationshipbetween accumulated pollutant load with accumulatedrunoff volume for a range of pollutants. The shapesof the cumulative curves were categorised into thethree broad groups exhibiting early flush, uniform anddelayed washoff pollutant transport characteristics.Analyses of the shape of observed pollutographs werecarried out for six water quality parameters for thecombined sewer system; the results are summarised inTable 2.4.
Inorganic particle Approximate concentration of heavy metals associated with particles (mg/kg)size fraction (µm) Zinc Lead Copper Cadmium
<40 900 920 240 24000
40-63 275 100 100 5000
63-80 300 100 125 5000
80-125 350 150 175 5000
125-250 400 200 200 5000
250-500 450 175 300 3000
500-1000 240 225 30 3000
1000-2000 100 75 30 1000
>+2000 50 25 100 1000
Table 2.3 Heavy metal distribution across the particle size distribution (adapted from Colandini and Legret, 1996)
Pollutograph characteristics Percentage of events
TSS BOD5 COD TOC KJN TP
Uniform 7.2% 0.0% 7.3% 2.9% 4.1% 6.1%
Early flush 68.8 65.7 67.5 61.8 57.3 60.5
Delayed flush 24.0 34.3 25.2 35.3 38.6 33.4
Total number of events analysed 125 32 123 34 122 33
Table 2.4 Pollutographs characteristics - combined sewer system, Munich, Germany
COOPERAT IVE RESEARCH CENTRE FOR CATCHMENT HYDROLOGY
14
The catchment analysed by Geiger (1984) wastypically flat, so the pollutant generation mechanismwas expected to be signif icantly influenced bysystematic factors related to catchment shape, landusedistribution and sewer network characteristics. Thestochastic influence of meteorological factors wasexpected to be attenuated by the generally flat terrainin the catchment. The systematic factors wereconsidered to be conducive to the occurrence of firstflush in pollutant transport with the tendency for thepollutograph to peak before the hydrograph. This waslargely confirmed by the data, which showed that over60% of the pollutographs analysed exhibited atendency of an early flush mechanism. However, theremaining events showed a direct reversal of thistrend, with about 30% of the events showing atendency for pollutant transport to be delayedcompared to corresponding runoff hydrographs.Without detailed and substantial monitoring andanalysis of water quality and quantity data, it wouldnot be possible to ascertain the relative significance
of the stochastic and systematic factors which canaffect the pollutant generation characteristics of acatchment.
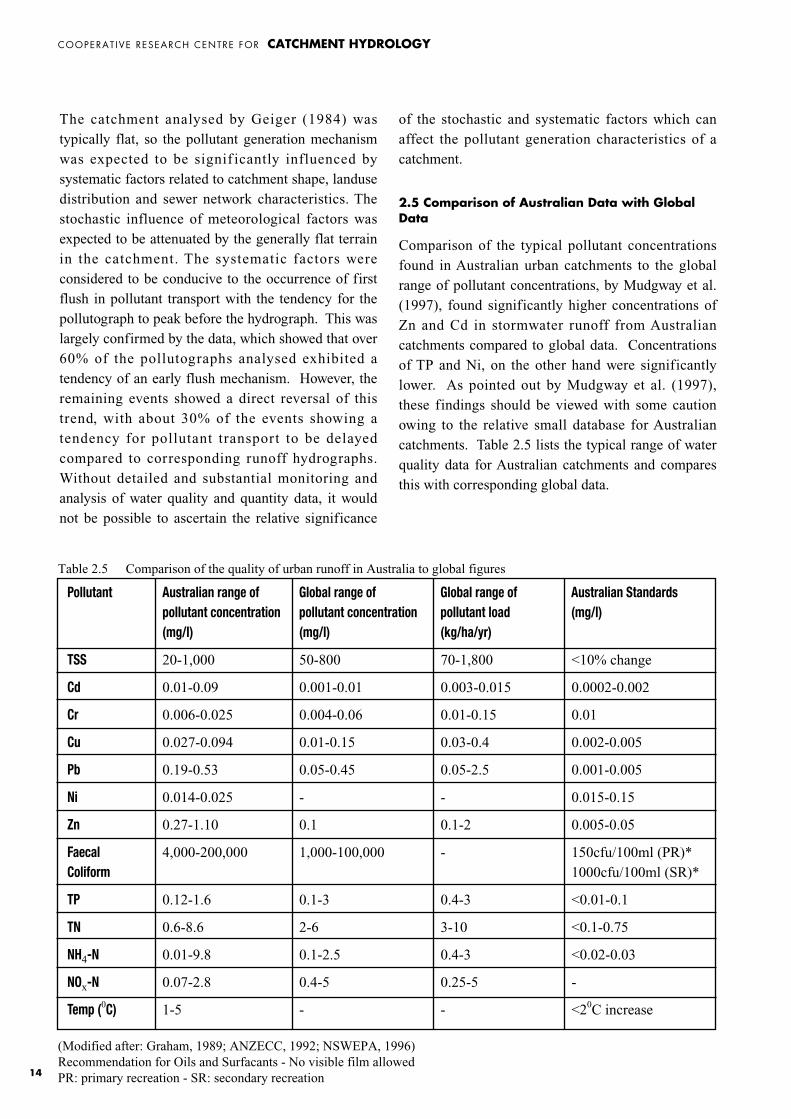
2.5 Comparison of Australian Data with GlobalData
Comparison of the typical pollutant concentrationsfound in Australian urban catchments to the globalrange of pollutant concentrations, by Mudgway et al.(1997), found significantly higher concentrations ofZn and Cd in stormwater runoff from Australiancatchments compared to global data. Concentrationsof TP and Ni, on the other hand were significantlylower. As pointed out by Mudgway et al. (1997),these findings should be viewed with some cautionowing to the relative small database for Australiancatchments. Table 2.5 lists the typical range of waterquality data for Australian catchments and comparesthis with corresponding global data.
Pollutant Australian range of Global range of Global range of Australian Standardspollutant concentration pollutant concentration pollutant load (mg/l)(mg/l) (mg/l) (kg/ha/yr)
TSS 20-1,000 50-800 70-1,800 <10% change
Cd 0.01-0.09 0.001-0.01 0.003-0.015 0.0002-0.002
Cr 0.006-0.025 0.004-0.06 0.01-0.15 0.01
Cu 0.027-0.094 0.01-0.15 0.03-0.4 0.002-0.005
Pb 0.19-0.53 0.05-0.45 0.05-2.5 0.001-0.005
Ni 0.014-0.025 - - 0.015-0.15
Zn 0.27-1.10 0.1 0.1-2 0.005-0.05
Faecal 4,000-200,000 1,000-100,000 - 150cfu/100ml (PR)*Coliform 1000cfu/100ml (SR)*
TP 0.12-1.6 0.1-3 0.4-3 <0.01-0.1
TN 0.6-8.6 2-6 3-10 <0.1-0.75
NH4-N 0.01-9.8 0.1-2.5 0.4-3 <0.02-0.03
NOx-N 0.07-2.8 0.4-5 0.25-5 -
Temp (0C) 1-5 - - <20C increase
(Modified after: Graham, 1989; ANZECC, 1992; NSWEPA, 1996)Recommendation for Oils and Surfacants - No visible film allowedPR: primary recreation - SR: secondary recreation
Table 2.5 Comparison of the quality of urban runoff in Australia to global figures
COOPERAT IVE RESEARCH CENTRE FOR CATCHMENT HYDROLOGY
15
Mudgway et al. (1997) presented analyses of globaldata pollutant concentrations according to thedifferent landuses, and found no signif icantdifferences in concentrations between residential,commercial and industrial areas. This is due to thewide range of pollutant concentrations experiencedacross all landuses when global data are pooledtogether. The data indicated that no single landusetype dominated as a major source of contaminants.However, within individual regions, a dominantpollutant source may be present. Numerous studiesincluding that by Mudgway et al. (1997) haveindicated that concentrations of suspended solids,total phosphorus and total nitrogen from agriculturallanduse are higher than for all urban catchmentlanduses, although the volume of runoff, and thus thepollutant load, may be significantly less.
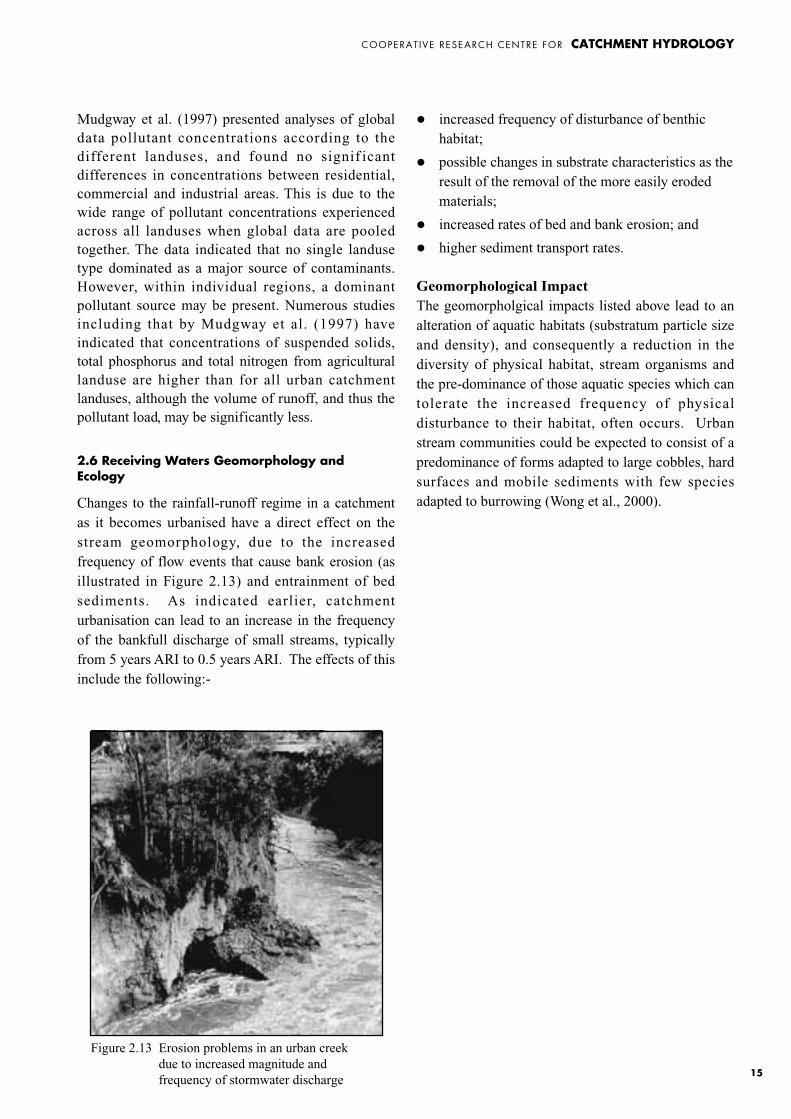
2.6 Receiving Waters Geomorphology andEcology
Changes to the rainfall-runoff regime in a catchmentas it becomes urbanised have a direct effect on thestream geomorphology, due to the increasedfrequency of flow events that cause bank erosion (asillustrated in Figure 2.13) and entrainment of bedsediments. As indicated earlier, catchmenturbanisation can lead to an increase in the frequencyof the bankfull discharge of small streams, typicallyfrom 5 years ARI to 0.5 years ARI. The effects of thisinclude the following:-
� increased frequency of disturbance of benthichabitat;
� possible changes in substrate characteristics as theresult of the removal of the more easily erodedmaterials;
� increased rates of bed and bank erosion; and
� higher sediment transport rates.
Geomorphological ImpactThe geomorpholgical impacts listed above lead to analteration of aquatic habitats (substratum particle sizeand density), and consequently a reduction in thediversity of physical habitat, stream organisms andthe pre-dominance of those aquatic species which cantolerate the increased frequency of physicaldisturbance to their habitat, often occurs. Urbanstream communities could be expected to consist of apredominance of forms adapted to large cobbles, hardsurfaces and mobile sediments with few speciesadapted to burrowing (Wong et al., 2000).
Figure 2.13 Erosion problems in an urban creekdue to increased magnitude andfrequency of stormwater discharge
COOPERAT IVE RESEARCH CENTRE FOR CATCHMENT HYDROLOGY
16
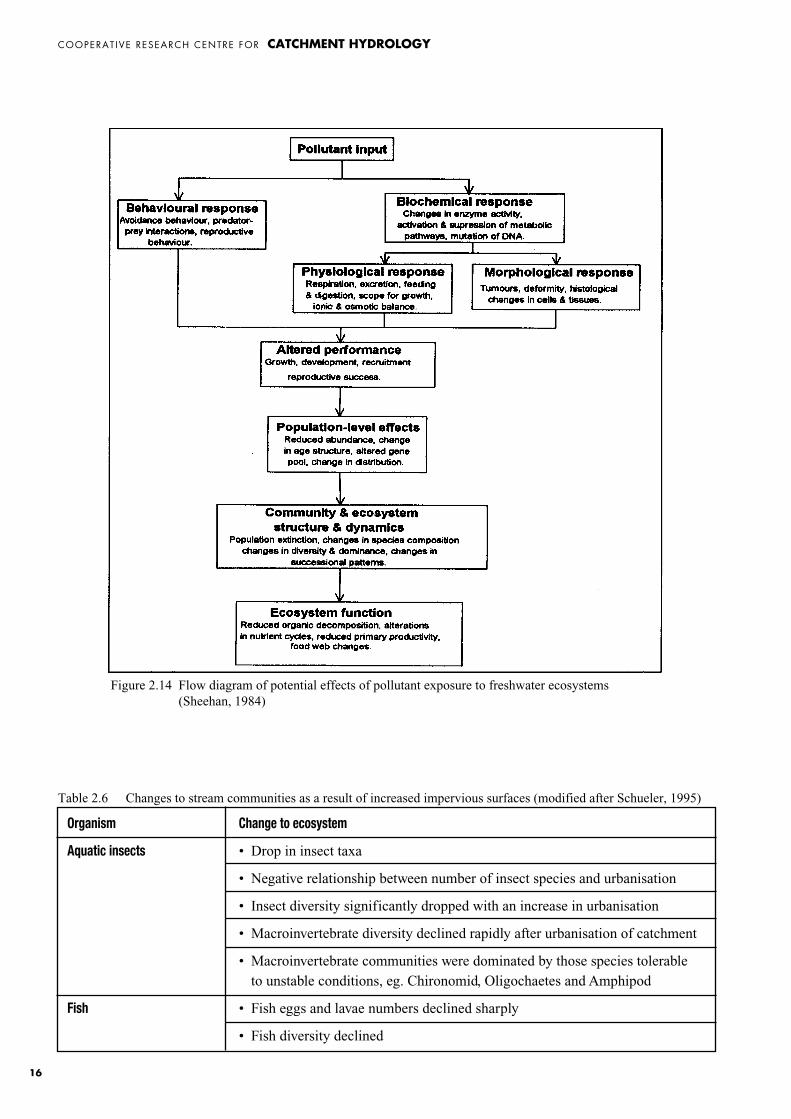
Figure 2.14 Flow diagram of potential effects of pollutant exposure to freshwater ecosystems(Sheehan, 1984)
Organism Change to ecosystem
Aquatic insects • Drop in insect taxa
• Negative relationship between number of insect species and urbanisation
• Insect diversity significantly dropped with an increase in urbanisation
• Macroinvertebrate diversity declined rapidly after urbanisation of catchment
• Macroinvertebrate communities were dominated by those species tolerableto unstable conditions, eg. Chironomid, Oligochaetes and Amphipod
Fish • Fish eggs and lavae numbers declined sharply
• Fish diversity declined
Table 2.6 Changes to stream communities as a result of increased impervious surfaces (modified after Schueler, 1995)
COOPERAT IVE RESEARCH CENTRE FOR CATCHMENT HYDROLOGY
17
Ecological ResponseThe exposure of pollutants to freshwater ecosystemsare numerous and varied. Figure 2.14 and Table 2.6summarise the broad effects stormwater pollutantshave on freshwater organisms at a species level andcommunity or ecosystem level. The characteristics ofthe pollutant loading and the types of pollutantslargely determine the level of response in theecosystem; the frequency and duration of pollutantexposure will govern the degree of recovery.
Behavioural and physiological responses are expectedat the species level. In turn, population structure andcommunities alter. Table 2.6 lists some of thepotential effects on fish and aquatic insects. Thebehavioural and population/community effectsinclude avoidance behaviour by some species, adecline in species diversity, changes in dominantspecies which results in a change in the communitystructure.
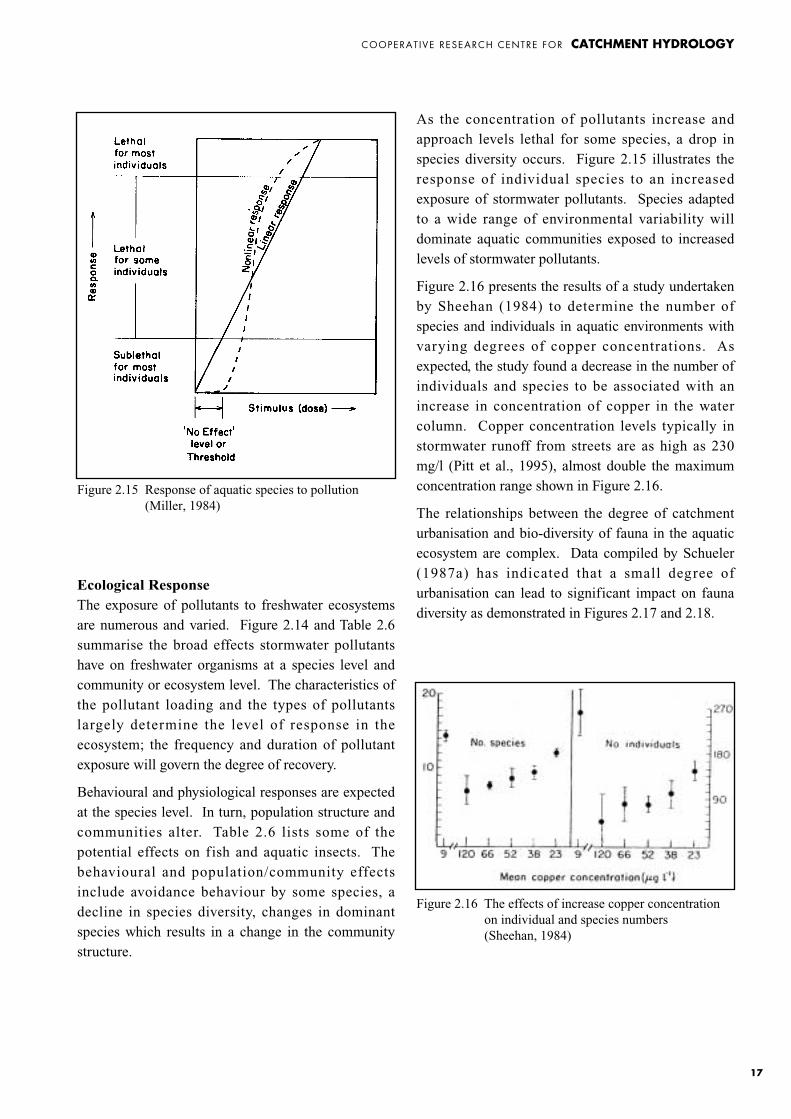
As the concentration of pollutants increase andapproach levels lethal for some species, a drop inspecies diversity occurs. Figure 2.15 illustrates theresponse of individual species to an increasedexposure of stormwater pollutants. Species adaptedto a wide range of environmental variability willdominate aquatic communities exposed to increasedlevels of stormwater pollutants.
Figure 2.16 presents the results of a study undertakenby Sheehan (1984) to determine the number ofspecies and individuals in aquatic environments withvarying degrees of copper concentrations. Asexpected, the study found a decrease in the number ofindividuals and species to be associated with anincrease in concentration of copper in the watercolumn. Copper concentration levels typically instormwater runoff from streets are as high as 230mg/l (Pitt et al., 1995), almost double the maximumconcentration range shown in Figure 2.16.
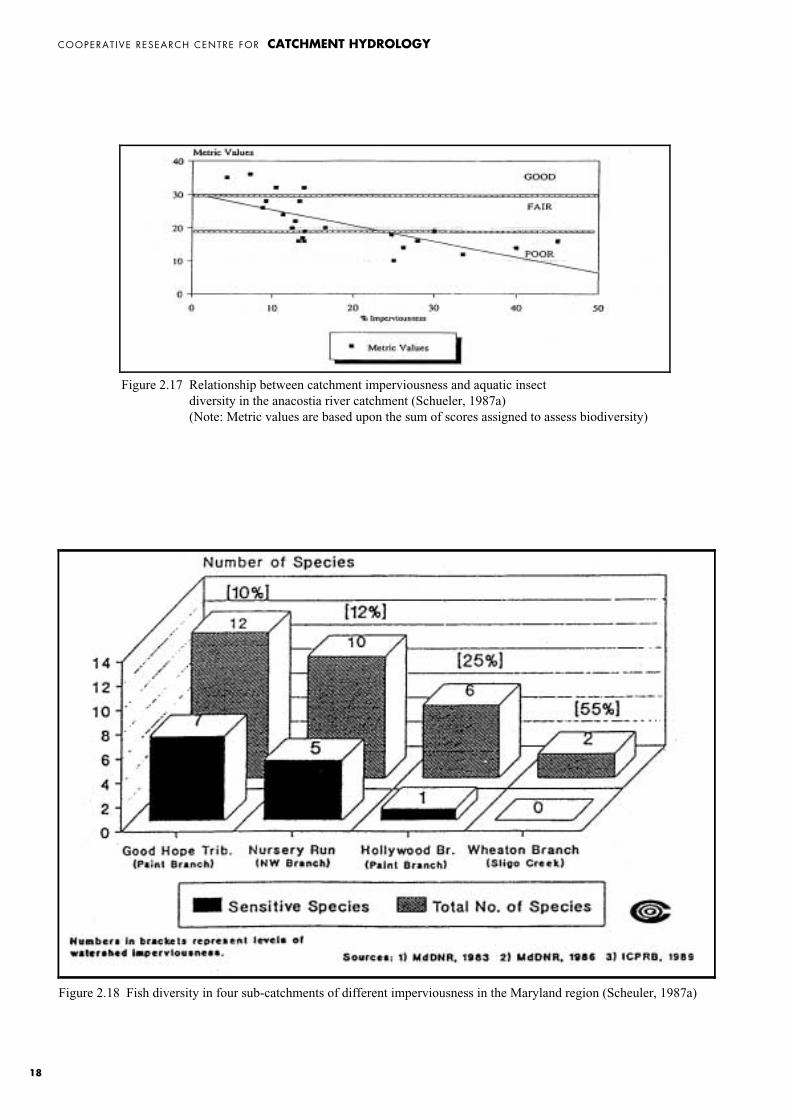
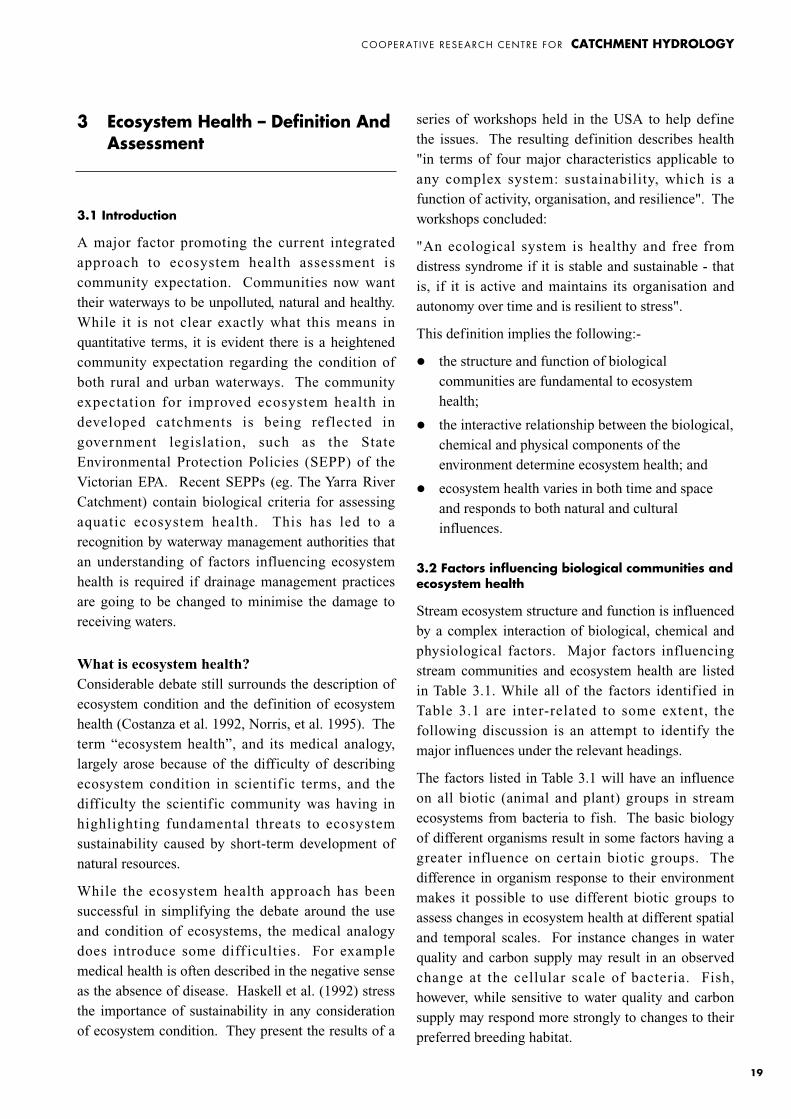
The relationships between the degree of catchmenturbanisation and bio-diversity of fauna in the aquaticecosystem are complex. Data compiled by Schueler(1987a) has indicated that a small degree ofurbanisation can lead to significant impact on faunadiversity as demonstrated in Figures 2.17 and 2.18.
Figure 2.15 Response of aquatic species to pollution (Miller, 1984)
Figure 2.16 The effects of increase copper concentrationon individual and species numbers (Sheehan, 1984)
COOPERAT IVE RESEARCH CENTRE FOR CATCHMENT HYDROLOGY
18
Figure 2.17 Relationship between catchment imperviousness and aquatic insectdiversity in the anacostia river catchment (Schueler, 1987a)(Note: Metric values are based upon the sum of scores assigned to assess biodiversity)
Figure 2.18 Fish diversity in four sub-catchments of different imperviousness in the Maryland region (Scheuler, 1987a)
COOPERAT IVE RESEARCH CENTRE FOR CATCHMENT HYDROLOGY
19
3 Ecosystem Health – Definition AndAssessment
3.1 Introduction
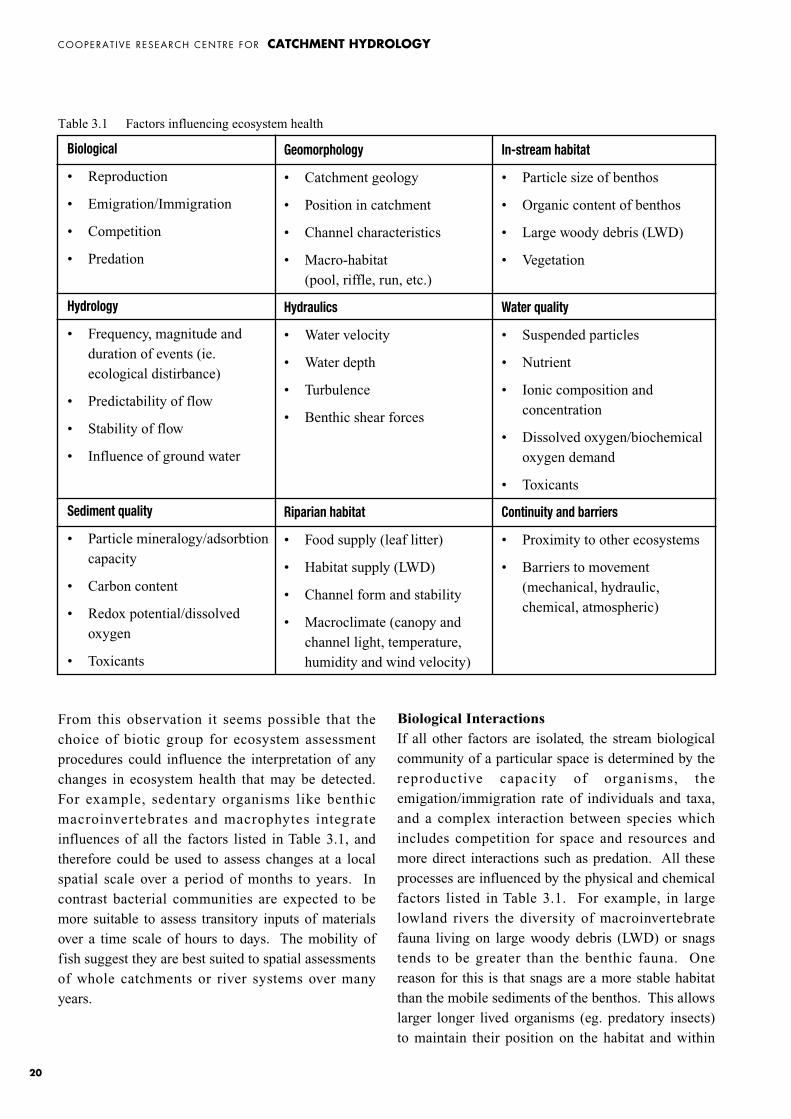
A major factor promoting the current integratedapproach to ecosystem health assessment iscommunity expectation. Communities now wanttheir waterways to be unpolluted, natural and healthy.While it is not clear exactly what this means inquantitative terms, it is evident there is a heightenedcommunity expectation regarding the condition ofboth rural and urban waterways. The communityexpectation for improved ecosystem health indeveloped catchments is being reflected ingovernment legislation, such as the StateEnvironmental Protection Policies (SEPP) of theVictorian EPA. Recent SEPPs (eg. The Yarra RiverCatchment) contain biological criteria for assessingaquatic ecosystem health. This has led to arecognition by waterway management authorities thatan understanding of factors influencing ecosystemhealth is required if drainage management practicesare going to be changed to minimise the damage toreceiving waters.
What is ecosystem health?Considerable debate still surrounds the description ofecosystem condition and the definition of ecosystemhealth (Costanza et al. 1992, Norris, et al. 1995). Theterm “ecosystem health”, and its medical analogy,largely arose because of the difficulty of describingecosystem condition in scientif ic terms, and thedifficulty the scientific community was having inhighlighting fundamental threats to ecosystemsustainability caused by short-term development ofnatural resources.
While the ecosystem health approach has beensuccessful in simplifying the debate around the useand condition of ecosystems, the medical analogydoes introduce some diff iculties. For examplemedical health is often described in the negative senseas the absence of disease. Haskell et al. (1992) stressthe importance of sustainability in any considerationof ecosystem condition. They present the results of a
series of workshops held in the USA to help definethe issues. The resulting definition describes health"in terms of four major characteristics applicable toany complex system: sustainability, which is afunction of activity, organisation, and resilience". Theworkshops concluded:
"An ecological system is healthy and free fromdistress syndrome if it is stable and sustainable - thatis, if it is active and maintains its organisation andautonomy over time and is resilient to stress".
This definition implies the following:-
� the structure and function of biologicalcommunities are fundamental to ecosystemhealth;
� the interactive relationship between the biological,chemical and physical components of theenvironment determine ecosystem health; and
� ecosystem health varies in both time and spaceand responds to both natural and culturalinfluences.
3.2 Factors influencing biological communities andecosystem health
Stream ecosystem structure and function is influencedby a complex interaction of biological, chemical andphysiological factors. Major factors influencingstream communities and ecosystem health are listedin Table 3.1. While all of the factors identified inTable 3.1 are inter-related to some extent, thefollowing discussion is an attempt to identify themajor influences under the relevant headings.
The factors listed in Table 3.1 will have an influenceon all biotic (animal and plant) groups in streamecosystems from bacteria to fish. The basic biologyof different organisms result in some factors having agreater influence on certain biotic groups. Thedifference in organism response to their environmentmakes it possible to use different biotic groups toassess changes in ecosystem health at different spatialand temporal scales. For instance changes in waterquality and carbon supply may result in an observedchange at the cellular scale of bacteria. Fish,however, while sensitive to water quality and carbonsupply may respond more strongly to changes to theirpreferred breeding habitat.
COOPERAT IVE RESEARCH CENTRE FOR CATCHMENT HYDROLOGY
20
From this observation it seems possible that thechoice of biotic group for ecosystem assessmentprocedures could influence the interpretation of anychanges in ecosystem health that may be detected.For example, sedentary organisms like benthicmacroinvertebrates and macrophytes integrateinfluences of all the factors listed in Table 3.1, andtherefore could be used to assess changes at a localspatial scale over a period of months to years. Incontrast bacterial communities are expected to bemore suitable to assess transitory inputs of materialsover a time scale of hours to days. The mobility offish suggest they are best suited to spatial assessmentsof whole catchments or river systems over manyyears.
Biological InteractionsIf all other factors are isolated, the stream biologicalcommunity of a particular space is determined by thereproductive capacity of organisms, theemigation/immigration rate of individuals and taxa,and a complex interaction between species whichincludes competition for space and resources andmore direct interactions such as predation. All theseprocesses are influenced by the physical and chemicalfactors listed in Table 3.1. For example, in largelowland rivers the diversity of macroinvertebratefauna living on large woody debris (LWD) or snagstends to be greater than the benthic fauna. Onereason for this is that snags are a more stable habitatthan the mobile sediments of the benthos. This allowslarger longer lived organisms (eg. predatory insects)to maintain their position on the habitat and within
Biological
• Reproduction
• Emigration/Immigration
• Competition
• Predation
Hydrology
• Frequency, magnitude andduration of events (ie.ecological distirbance)
• Predictability of flow
• Stability of flow
• Influence of ground water
Sediment quality
• Particle mineralogy/adsorbtioncapacity
• Carbon content
• Redox potential/dissolvedoxygen
• Toxicants
Geomorphology
• Catchment geology
• Position in catchment
• Channel characteristics
• Macro-habitat(pool, riffle, run, etc.)
Hydraulics
• Water velocity
• Water depth
• Turbulence
• Benthic shear forces
Riparian habitat
• Food supply (leaf litter)
• Habitat supply (LWD)
• Channel form and stability
• Macroclimate (canopy andchannel light, temperature,humidity and wind velocity)
In-stream habitat
• Particle size of benthos
• Organic content of benthos
• Large woody debris (LWD)
• Vegetation
Water quality
• Suspended particles
• Nutrient
• Ionic composition andconcentration
• Dissolved oxygen/biochemicaloxygen demand
• Toxicants
Continuity and barriers
• Proximity to other ecosystems
• Barriers to movement(mechanical, hydraulic,chemical, atmospheric)
Table 3.1 Factors influencing ecosystem health
Any changes to natural channel geomorphologythrough human activities (eg. increases in hydraulicefficiency, straightening, rock lining, erosion, etc.)can be expected to have an impact on stream biotaand ecosystem health.
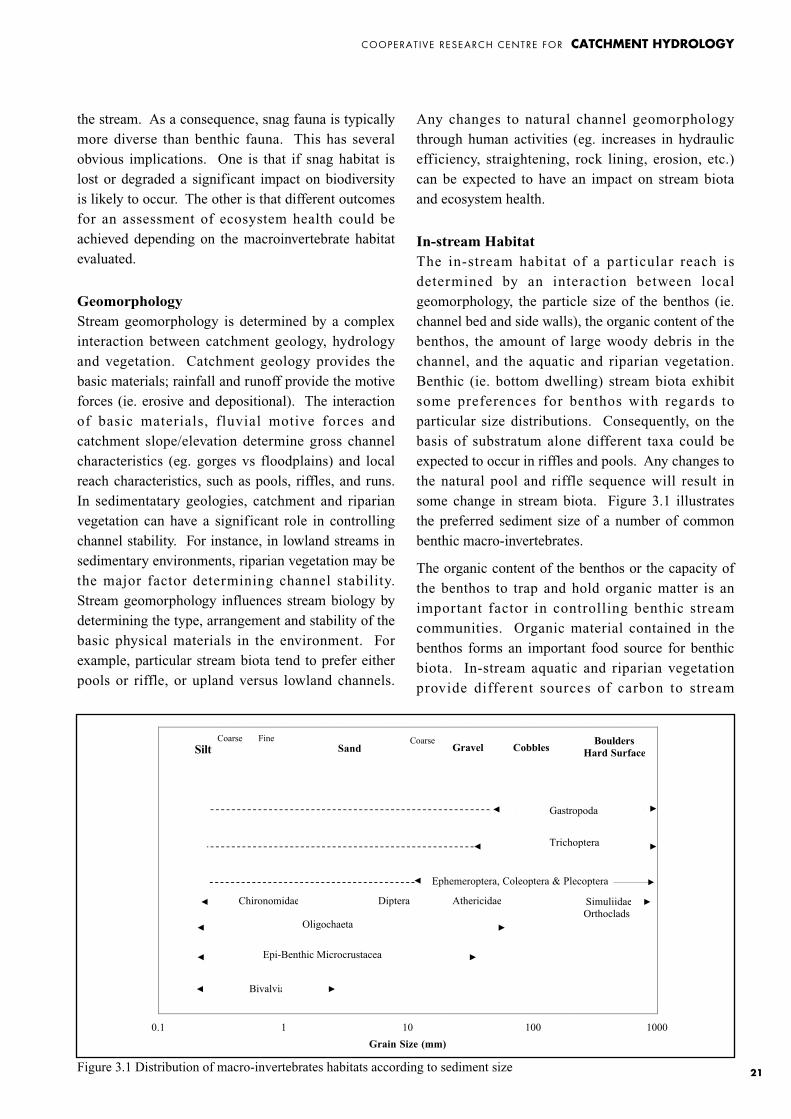
In-stream HabitatThe in-stream habitat of a particular reach isdetermined by an interaction between localgeomorphology, the particle size of the benthos (ie.channel bed and side walls), the organic content of thebenthos, the amount of large woody debris in thechannel, and the aquatic and riparian vegetation.Benthic (ie. bottom dwelling) stream biota exhibitsome preferences for benthos with regards toparticular size distributions. Consequently, on thebasis of substratum alone different taxa could beexpected to occur in riffles and pools. Any changes tothe natural pool and riffle sequence will result insome change in stream biota. Figure 3.1 illustratesthe preferred sediment size of a number of commonbenthic macro-invertebrates.
The organic content of the benthos or the capacity ofthe benthos to trap and hold organic matter is animportant factor in controlling benthic streamcommunities. Organic material contained in thebenthos forms an important food source for benthicbiota. In-stream aquatic and riparian vegetationprovide different sources of carbon to stream
COOPERAT IVE RESEARCH CENTRE FOR CATCHMENT HYDROLOGY
21
the stream. As a consequence, snag fauna is typicallymore diverse than benthic fauna. This has severalobvious implications. One is that if snag habitat islost or degraded a significant impact on biodiversityis likely to occur. The other is that different outcomesfor an assessment of ecosystem health could beachieved depending on the macroinvertebrate habitatevaluated.
GeomorphologyStream geomorphology is determined by a complexinteraction between catchment geology, hydrologyand vegetation. Catchment geology provides thebasic materials; rainfall and runoff provide the motiveforces (ie. erosive and depositional). The interactionof basic materials, fluvial motive forces andcatchment slope/elevation determine gross channelcharacteristics (eg. gorges vs floodplains) and localreach characteristics, such as pools, riffles, and runs.In sedimentatary geologies, catchment and riparianvegetation can have a significant role in controllingchannel stability. For instance, in lowland streams insedimentary environments, riparian vegetation may bethe major factor determining channel stability.Stream geomorphology influences stream biology bydetermining the type, arrangement and stability of thebasic physical materials in the environment. Forexample, particular stream biota tend to prefer eitherpools or riffle, or upland versus lowland channels.
0.1 1 10 100 1000
Grain Size (mm)
SiltCoarse
SandFine Coarse
Gravel CobblesBoulders
Hard Surface
Bivalvia
Gastropoda
Oligochaeta
Epi-Benthic Microcrustacea
Trichoptera
Ephemeroptera, Coleoptera & Plecoptera
Chironomidae Diptera Athericidae SimuliidaeOrthoclads
Figure 3.1 Distribution of macro-invertebrates habitats according to sediment size
ecosystems. Aquatic vegetation in the channel ofstreams provides both small scale shelter and a readilyavailable seasonal or periodic source of food forstream fauna through the senesence anddecomposition of macrophytes.
On a larger scale riparian vegetation provides food ona regular, but less readily available basis (eg. leaf andlitter fall), and the provision of large scale habitatthrough the fall of large woody debris into thechannel. In lowland streams large woody debris(snags) forms a very significant component of theavailable in-stream habitat. For an ecosystem tofunction normally it requires a reasonably predictablesupply of carbon. Change to supply of carbon bychanges through the input from in-stream or riparianplant communities or any physical changes to thestream which reduce its ability to hold or trap organicmaterial washed down from up stream will impact onstream biota and ecosystem health.
HydrologyHydrology not only combines with catchmentgeology to create the morphology of stream channels,but it also provides the major source of disturbance tostream ecosystems in the form of event or floodflows. Event flows (eg. 1.5 - 2.0 year ARI event) innatural catchments provide an important ‘re-set’mechanism for stream communities. Such eventsdisturb stream habitat by the periodic flushing ofbenthos material and biotic communities, creating anun-occupied space for subsequent re-colonisation.These events determine the balance betweenreproduction and emigation/immigration (generallyan increase in species richness and individualabundance), and competition and predation (generallya decrease in species richness and abundance).Changes in stream hydrology brought about byurbanisation, and changes to flow magnitude andfrequency (as described in Section 2.2), can have avery dramatic influence on the biota of streamcommunities. For example, any increase in theprobability of a community re-setting event (ie. 1.5 -2.0 year ARI event) will effect the ability oforganisms with a long life cycle to maintain theirpopulations (Wong et al., 2000). Consequently anycatchment landuse developments should aim to
minimise the increase in the frequency at which thepre-development 1.5 year ARI event discharge isexceeded.
The predictability of stream flow is important to biotathat have breeding cycles syncronised with particularseasonal flow conditions (eg. summer versus winterrainfall patterns, coastal versus inland regions).Predictability of flow determines how f inely anorganisms’ reproduction cycle can be tuned to thepattern of stream flow. Similarly the source of streaminflow determines how permanent the flow is overtime. For instance, groundwater or spring fed streamshave very stable flows compared to streams moredependent on runoff. In some areas streamsdependant on rainfall for inflow are commonlyephemeral whereas groundwater or spring fed streamsgenerally are characterised by a permanent base flow.These variables can have a major influence onreproductive strategies and the composition of streambiota, in particular the distribution of fish can beinfluenced by these factors.
HydraulicsWater velocity is a primary factor in gas and materialexchanges between water and biota. As watervelocity increases, boundary layers decrease anddiffusion rates increase. This is an important factorfor smaller organisms like algae. For instance, in lownutrient environments in particular, maximumbiomass will develop in high velocity areas whereconcentration gradients and diffusion rates aregreatest. However, as discharge increases within aconfined channel, the shear forces will increase.Consequently, in channel sections where high watervelocities can occur, high shear forces will beexperienced at the channel bed. The adaptation toshear forces is an important feature in determining thecomposition of stream biota in high shear channels.An important factor in balancing the influence of highshear force is the turbulence created by channel bedroughness. As the roughness of the bed increases, thespatial uniformity of the shear forces decrease,resulting in greater refuge area for biota.
COOPERAT IVE RESEARCH CENTRE FOR CATCHMENT HYDROLOGY
22
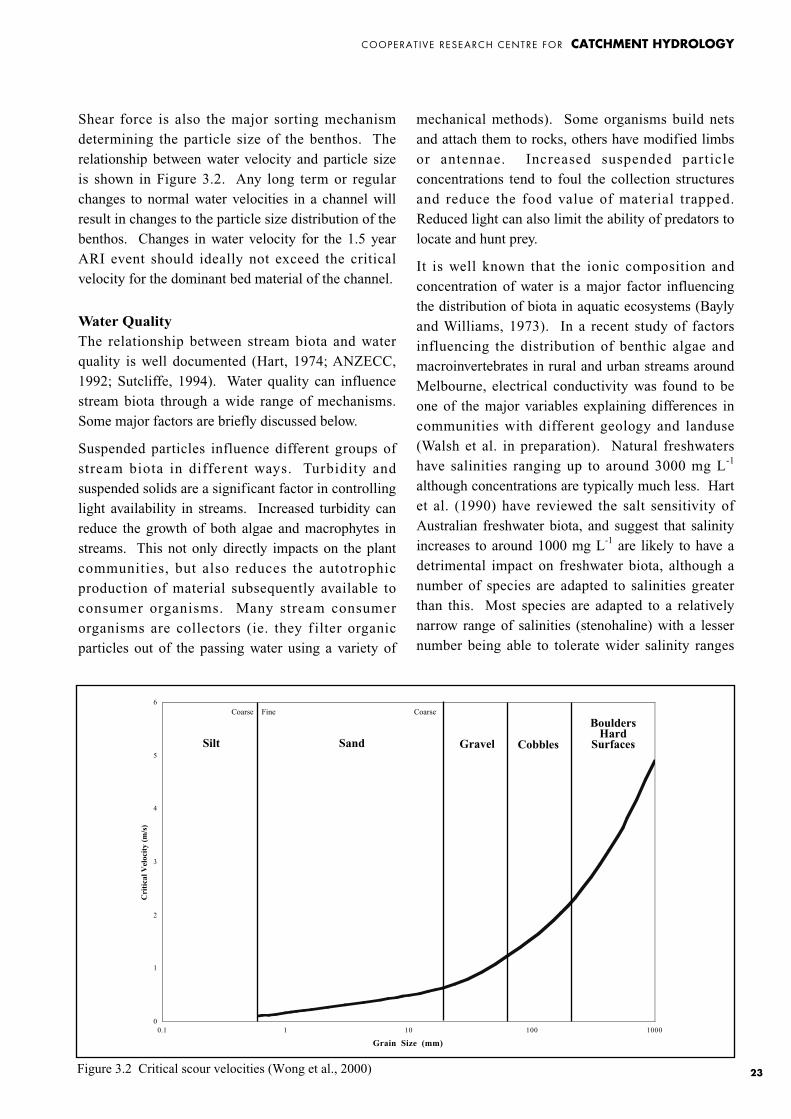
mechanical methods). Some organisms build netsand attach them to rocks, others have modified limbsor antennae. Increased suspended particleconcentrations tend to foul the collection structuresand reduce the food value of material trapped.Reduced light can also limit the ability of predators tolocate and hunt prey.
It is well known that the ionic composition andconcentration of water is a major factor influencingthe distribution of biota in aquatic ecosystems (Baylyand Williams, 1973). In a recent study of factorsinfluencing the distribution of benthic algae andmacroinvertebrates in rural and urban streams aroundMelbourne, electrical conductivity was found to beone of the major variables explaining differences incommunities with different geology and landuse(Walsh et al. in preparation). Natural freshwatershave salinities ranging up to around 3000 mg L-1
although concentrations are typically much less. Hartet al. (1990) have reviewed the salt sensitivity ofAustralian freshwater biota, and suggest that salinityincreases to around 1000 mg L-1 are likely to have adetrimental impact on freshwater biota, although anumber of species are adapted to salinities greaterthan this. Most species are adapted to a relativelynarrow range of salinities (stenohaline) with a lessernumber being able to tolerate wider salinity ranges
COOPERAT IVE RESEARCH CENTRE FOR CATCHMENT HYDROLOGY
23
Shear force is also the major sorting mechanismdetermining the particle size of the benthos. Therelationship between water velocity and particle sizeis shown in Figure 3.2. Any long term or regularchanges to normal water velocities in a channel willresult in changes to the particle size distribution of thebenthos. Changes in water velocity for the 1.5 yearARI event should ideally not exceed the criticalvelocity for the dominant bed material of the channel.
Water QualityThe relationship between stream biota and waterquality is well documented (Hart, 1974; ANZECC,1992; Sutcliffe, 1994). Water quality can influencestream biota through a wide range of mechanisms.Some major factors are briefly discussed below.
Suspended particles influence different groups ofstream biota in different ways. Turbidity andsuspended solids are a significant factor in controllinglight availability in streams. Increased turbidity canreduce the growth of both algae and macrophytes instreams. This not only directly impacts on the plantcommunities, but also reduces the autotrophicproduction of material subsequently available toconsumer organisms. Many stream consumerorganisms are collectors (ie. they f ilter organicparticles out of the passing water using a variety of
0
1
2
3
4
5
6
0.1 1 10 100 1000
Grain Size (mm)
Cri
tica
l V
eloc
ity
(m/s
)
Figure 3.2 Critical scour velocities (Wong et al., 2000)
Silt Sand Gravel Cobbles
BouldersHard
Surfaces
Cri
tica
l Vel
ocit
y (m
/s)
Coarse Fine Coarse
COOPERAT IVE RESEARCH CENTRE FOR CATCHMENT HYDROLOGY
24
availability (eg. limited riparian canopy), a suitableflow regime (eg. a normal recurrence interval for highvelocity scouring flows), and a substratum of suitablesize and stability (eg. absence of significant erosion).
Toxicants in aquatic ecosystems are a result of thegeneration and mobilisation of abnormalconcentrations of natural elements (eg. heavy metals)or the synthesis and production of anthropogeniccompounds (eg. petroleum products, herbicides,pesticides, plasisizers, etc). Acute impacts of toxicantpollution is well documented (Skidmore & Firth,1983) and management responsibilities forminimising such risks are clearly outlined inenvironmental legislation (eg. VIC EPA StateEnvironment Protection Policies). One important riskassociated with toxicants is the sub-lethal effects (eg.exposure in situations where the toxicity is not lethalbut may disadvantage the viability of particularspecies). In theses situations the health of ecosystemsmay be changed over time by small impacts to thesuccess of susceptible species. These impacts cansometimes be evaluated by the assessment ofbiomarkers, such as morphologic and biochemicalsignatures left in living organisms as a result ofexperiencing toxicants. Any exposure to toxicantsmay impact ecosystem health either over the shortterm through lethal impacts or over the longer termthrough sub-lethal effects which can influencecommunity structure and ecosystem health.
Sediment QualitySediment quality (including organic and inorganicparticulates) is a critical element in determiningecosystem health. Many pollutants are associatedwith, and transported in, the particulate form.Consequently, the particulate material is a sink formany pollutants (eg. phosphorus, metals, organics).This association between sediments and pollutants isimportant for all benthic organisms, as the sedimentsrepresent both their habitat and for many a foodsource. Due to the contact between benthic biota andsediments, the concentration and availability ofpollutants in the sediments is an important factor inecosystem health. As for all pollutants, the risk ofimpact is associated with both the pollutant
(euryhaline), eg. up to 10,000 – 15,000 mg L-1
(ANZECC, 1992). Consequently, Hart et al. (1991),consider fluctuating or pulsed changes to salinity tohave a greater impact on freshwater biota than slowchanges and natural variation. In general any changesto ion composition and concentration are likely toinfluence the community structure of freshwaterecosystems.
Nutrients are a vital component of any healthyecosystem. However, anthropogenic nutrientenrichment leading to eutrophication is a widelydocumented impact to ecosystem health (Cullen,1986). In a broad sense there is a very clearrelationship between increased nutrientconcentrations and nuisance aquatic plant growth(Harris, 1994; 1996). While mild nutrient enrichmentmay slightly increase species richness and abundance,continued enrichment ultimately leads to theexcessive growth of just a few plant species. Nutrientenrichment encourages the growth of bothmicrophytes and macrophytes. Excessive growth ofmicrophytes such as phytoplankton can result inmajor diurnal fluctuations of dissolved oxygen andincrease organic loads entering the sediments. Boththese results can have an adverse effect on other biota,principally animals that require a minimum dissolvedoxygen concentrations to maintain normalmetabolism. Excessive growth of macrophytes canmarkedly change the physical habitat of anenvironment. Macrophyte growth in aquatic systemscan influence flow velocities, substratum size andcomposition and in-stream habitat surface area andtype. As a result nutrient enrichment can have amajor impact on ecosystem health.
For nutrient enrichment to result in eutrophication arange of factors need to be satisfied to generate theresponse, and other physical requirements need to benon-limiting (Reynolds, 1992). For example, todevelop nuisance phytoplankton growths it isnecessary to have sufficient light availability (eg. lowturbidity), sufficient time for a population to develop(eg. long hydraulic detention time), satisfactorytemperature regime (eg. high metabolic rate).Similarly, to develop nuisance macrophyte growth, itis normally necessary to have adequate light
COOPERAT IVE RESEARCH CENTRE FOR CATCHMENT HYDROLOGY
25
concentration and availability. Sediment pollutantavailability is controlled by a range of physical,chemical and biological factors. For example:
� Physical particle size, surface characteristics andmineralogy are important in determiningpollutant–particle associations. The clay (<2 µm)and silt (<63 µm) fractions have high surfaceareas and typically adsorb a higher fraction ofpollutants, particularly in urban areas wherestormwater runoff can deliver high particulate andpollutant concentrations.
� Particle surface chemistry and sediment matrixchemistry are important in determining thepollutant load on particles and its availability onceit enters the sediments. The organic coating ofparticles is instrumental in the adsorption ofhydrophobic organic pollutants, whereas thepresence of iron and manganese oxides isimportant in the adsorption of phosphorus andmetals onto particles. Once pollutants areintroduced to the sediments, their availability isoften controlled by the redox state of thesediments and pore water. Sediment redoxcondition is broadly controlled by the balancebetween the supply of oxygen and organic carbonto the sediments. While the surface of sedimentsmay be aerobic and oxidising, conditions only 1-2mm below the surface may be anaerobic andreducing. The balance between these conditionscan strongly influence the availability ofpollutants resulting in the release of these oxidesas soluble pollutants into the pore water andsubsequently back into the water column.
� Biological interactions like trophic level dynamicsmay influence the availability and impact ofsediment pollutants. For example, while pollutantlevels in the sediments may not be directly toxicto burrowing organisms, when these organismsare eaten by predators the pollutants canaccumulate in higher trophic levels of the foodchain where the impacts may become evident.Additionally, the action of burrowing can movesediment and pollutants from within the sedimentprofile to the surface while the irrigation ofburrows can flush out pore water and introduceoxygen to greater depths within the sediment.Consequently biotubation can both increase anddecrease pollutant availability.
Riparian HabitatRiparian vegetation influences stream function andhealth in a variety of ways. It acts as a transitionalzone between the aquatic habitats and the surroundingterrestrial habitat. The importance of the riparianzone in stream health management is increasinglybeing recognised (Bunn et al. 1993, Collier et al.1995).
The riparian zone represents an important source offood and energy to stream ecosystems through leafand litter fall. Shredders are a group of benthicmacroinvertebrates that directly utilise plant materialfrom the riparian zone, and represent a direct linkagebetween the terrestrial riparian zone and the streamaquatic ecosystem (Cummins, 1993). As part of leafand litter processing in streams, organic matter getsbroken and reduced in size (coarse particulate organicmatter (CPOM) is reduced to fine particulate organicmatter (FPOM) over time). FPOM is readilytransported in stream flow and can become animportant carbon source for downstream ecosystems.Leaf and litter fall can also be a source of dissolvedorganic carbon, which is a substrate for microbialbiofilms. In turn, biofilms are consumed by a rangeof macroinvertebrates either directly or as acomponent of other food items.
Branches, logs and whole trees entering the streamfrom the riparian habitat is known as Large WoodyDebris (LWD). LWD provides a reasonably stablesurface in the stream and increases the diversity offlow patterns in streams. LWD acts as a substratumfor biof ilms and a range of macroinvertebrateswhereas fish use it as protection from predators andflow. LWD can also influence channel morphology.Large snags are able to divert flows and causelocalised bed and bank erosion. At natural rates LWDinduced erosion is an important factor in increasingthe physical diversity of the channel.
While LWD derived from the riparian zone maysometimes act to increased localised erosion, riparianvegetation is a major factor controlling bank stabilityin many streams. Riparian vegetation acts to stabilisebanks in two ways. The roots of riparian plants tendto bind soils together and strong growth (eg.Melaleuca ericifolia) can even amour the surface. Byincreasing the hydraulic roughness of channelsriparian vegetation reduces flow velocity and stream
COOPERAT IVE RESEARCH CENTRE FOR CATCHMENT HYDROLOGY
26
power. While bank stability is an important localhabitat factor (eg. stable undercuts, etc.) it also hasimportant influence on the health of downstreamecosystems. For instance bank stability can influencestream sediment loads, substratum type andavailability, and water quality.
The vegetation of the riparian zone can stronglyinfluence the microclimate of the stream corridor.The riparian canopy provides shade to the channel,which reduces light and regulates water temperature,regulates humidity and controls wind velocity overthe surface of the water. Stream microclimate isimportant for both in-stream and riparian processes.Light and temperature are major factors controllingautotrophic organisms in streams. Consequently theriparian zone influences the trophic status of a streamnot only by providing an external carbon source, butalso by controlling internal sources by regulating thelight available for in-stream plant growth. Riparianzone microclimate is an important factor in themovement and dispersal of stream biota. For example,many benthic stream macroinvertebrates are insectsthat have terrestrial adult stages during which up-stream dispersal can occur. This dispersal isinfluenced by longitudinal wind direction andhumidity gradients created within the riparian zone.
Continuity and BarriersContinuity is an important factor in ecosystem health.A healthy ecosystem is resilient and able to recoverfrom stress, maintaining its activity and organisationover time. A component of an ecosystems ability tocope with stress is its size. For streams the lowestspatial scale of concern may be continuity of thestream. If reaches of a stream are separated by a damor a long pipeline, the continuity of stream processesare interrupted and the size of the ecosystem and itsability to recover from stress is reduced. In thisexample up-stream migration may be preventedresulting in change to the organisational structure ofthe up-stream community.
The importance of proximity to other similarecosystems is important in considering the impacts ofstream barriers on ecosystem health. For example,the ability of an ecosystem to recover from stresswould be greater if colonisation from similar un-
impacted sites were possible. Barriers limiting themigration or dispersal of organisms in streams occurin many forms. Barriers may include:
� Mechanical – drop structures, culverts, weirs ordams.
� Hydraulic – shallow and/or high velocity flows inconcrete drains and pipelines.
� Chemical – persistent or regular poor waterquality caused by a point source discharge orpolluted tributary.
� Atmospheric – unfavorable humidity or windconditions caused by the loss of vegetation.
3.3 Bio-monitoring and assessment of health instream ecosystems
Most structural assessments of biologicalcommunities are based on measures of speciesrichness and abundance. While a great range of biotacould be used for bio-monitoring and healthassessment in stream ecosystems (bacteria, algae,macrophytes, invertebrates, fish, birds, mammals),most attention to date has focused on benthicmacroinvertebrates (Rosenberg and Resh 1993,Norris et al. 1995). Fish (Karr, 1981; Harris; 1995)and algae (Round, 1993; Whitton and Kelly, 1995)have received relatively less attention, particularly inAustralia, and other groups have received very littleattention with respect to stream health assessment.
In general, assessments based on the wholecommunity rather than particular indicator species areviewed as being most desirable (Haskell et al., 1992;Norris and Norris, 1995). An example of acommunity index using fish is the Index of BioticIntegrity (IBI) developed by Karr (1981). Examplesof multivariate statistical approaches are those byWright (1995) and Reynoldson et al. (1995) usingbenthic macroinvertebrate communities (RIVPACSand BEAST).
While ecosystem function has been recognised(Haskell et al. 1992) as an important aspect ofecosystem health, few functional measures have beenused in ecosystem health assessments (Reice andWohlenberg, 1993). The Index of Stream Condition(ISC) is an integrated system assessing a range offactors (eg. water quality, physical habitat, riparian
habitat, physical form, hydrology, and aquatic biota)that influence stream health (Ladson et al., 1996;Ladson and Doolan, 1997).
At the biochemical level, biomarkers in organismsand populations are indicative of biochemicalresponses to environmental conditions. Biomarkerscan indicate stress at the organism level and henceused as a measure of ecosystem disfunction.Biomarkers may range from morphologicalabnormalities through to enzymatic (eg. mixedfunction oxidases) responses as a result of exposure toxenobiotic chemicals such as pesticides or heavymetals (Holdway et al., 1995).
Although there is no commonly accepted measure ofecosystem health there is agreement that measuresshould adequately reflect the complexity ofecosystems and the conceptual basis of ecosystemhealth. Some guidelines have been suggested bySchaeffer et al. (1988) for ecosystem healthassessment.
Ecosystem health measures:
� Should not be based on the presence or abundanceof single species.
� Should reflect our knowledge of normalsuccessional processes or sequential change.
� Do not have to be single numbers. While optimalhealth measures should be single-valued and varyin a systematic way, single numbers potentiallycompress a large number of dimensions to asingle point.
� Should have a defined range.
� Should be responsive to change in data values, butnot show discontinuities.
� Should be dimensionless or share a commondimension.
� Should be insensitive to the number ofobservations, greater than some minimumnumber.
COOPERAT IVE RESEARCH CENTRE FOR CATCHMENT HYDROLOGY
27

COOPERAT IVE RESEARCH CENTRE FOR CATCHMENT HYDROLOGY
28
4 Stormwater Pollutants From Roads and Highways
4.1 Overview
Road infrastructure is an integral part of urbandevelopment. The relative contribution roadinfrastructure makes to changes in catchmenthydrology and pollutant export is directly related toits contribution to total catchment imperviousness;transport related surfaces can account for up to 70%.In most urbanised catchments, the local road network(eg. major and minor roads, residential streets,parking areas, and driveways) represents the majorproportion of transport related imperviousness andtherefore significantly alters the catchment hydrology.The quality of runoff from the local road networkdepends on traffic density. The responsibility for thedesign and maintenance of this infrastructure lies withlocal authorities. Stormwater management optionsfor the local road network needs to be integrated intothe overall catchment planning and management(landuse planning, residential design, drainage design,etc.) as part of water sensitive urban design (seeSection 5).
Although highways and freeways may only representa minor proportion of catchment imperviousness andonly have a moderate influence on catchmenthydrology, the quality of runoff from highways andfreeways can be a significant source of pollutants.There is evidence to suggest that the contribution ofthese road types to increased pollutant concentrationsin runoff, is similar to that found in industrial andcommercial areas and an order of magnitude higherthan medium density residential areas.
4.2 Pollutant Concentrations in Road Runoff
A signif icant amount of pollutants, ranging fromgross pollutants to particulate and solublecontaminants, accumulate on transport relatedsurfaces and are conveyed into stormwater drainagenetworks during runoff events. Between runoffevents, pollutants, primarily particulates and attachedpollutants, enter drainage networks as a result ofineffective street sweeping, wind action and vehiclemovement. It is expected that the movement of
coarse sediment during dry weather conditions will belimited, with coarse material accumulating intemporary sinks until subsequent flushing duringrunoff events. Finer particulates generated as a resultof transport related infrastructure however, mayundergo considerable remobilisation andredistribution as a result of atmospheric and vehiclerelated winds. As a consequence it is likely there issome dry weather movement of pollutants from areasof high traffic movement to areas of lower trafficmovement. This process of redistribution tends toblur the distinction between sources of gaseous andfine particulate pollutants in catchments.
In highways and freeways, gross pollutantmanagement is probably of less importance, as it isanticipated that the load generation will be small incomparison to streets and parking areas in typicalcommercial and industrial areas. The emphasis instormwater quality management for the protection ofaquatic ecosystems in the receiving water is that ofmanaging the export of suspended solids andassociated contaminants.
COOPERAT IVE RESEARCH CENTRE FOR CATCHMENT HYDROLOGY
29
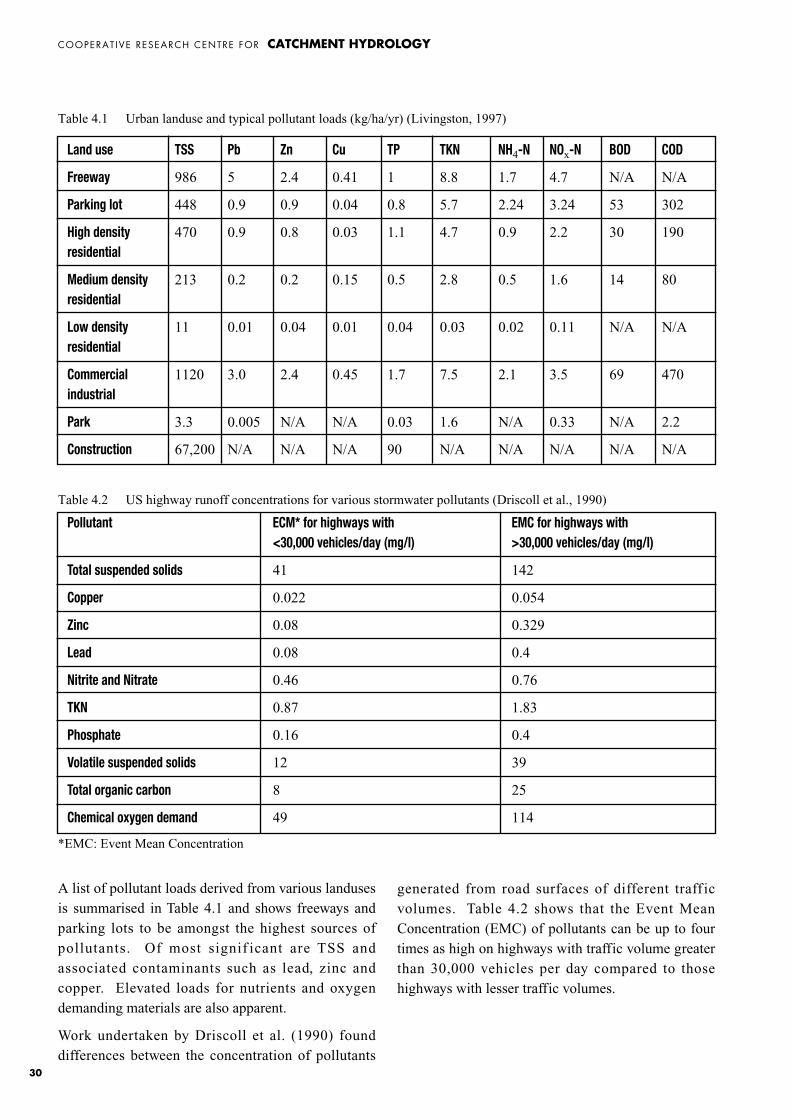
A list of pollutant loads derived from various landusesis summarised in Table 4.1 and shows freeways andparking lots to be amongst the highest sources ofpollutants. Of most signif icant are TSS andassociated contaminants such as lead, zinc andcopper. Elevated loads for nutrients and oxygendemanding materials are also apparent.
Work undertaken by Driscoll et al. (1990) founddifferences between the concentration of pollutants
generated from road surfaces of different traff icvolumes. Table 4.2 shows that the Event MeanConcentration (EMC) of pollutants can be up to fourtimes as high on highways with traffic volume greaterthan 30,000 vehicles per day compared to thosehighways with lesser traffic volumes.
COOPERAT IVE RESEARCH CENTRE FOR CATCHMENT HYDROLOGY
30
Land use TSS Pb Zn Cu TP TKN NH4-N NOx-N BOD COD
Freeway 986 5 2.4 0.41 1 8.8 1.7 4.7 N/A N/A
Parking lot 448 0.9 0.9 0.04 0.8 5.7 2.24 3.24 53 302
High density 470 0.9 0.8 0.03 1.1 4.7 0.9 2.2 30 190residential
Medium density 213 0.2 0.2 0.15 0.5 2.8 0.5 1.6 14 80residential
Low density 11 0.01 0.04 0.01 0.04 0.03 0.02 0.11 N/A N/Aresidential
Commercial 1120 3.0 2.4 0.45 1.7 7.5 2.1 3.5 69 470industrial
Park 3.3 0.005 N/A N/A 0.03 1.6 N/A 0.33 N/A 2.2
Construction 67,200 N/A N/A N/A 90 N/A N/A N/A N/A N/A
Table 4.1 Urban landuse and typical pollutant loads (kg/ha/yr) (Livingston, 1997)
Pollutant ECM* for highways with EMC for highways with<30,000 vehicles/day (mg/l) >30,000 vehicles/day (mg/l)
Total suspended solids 41 142
Copper 0.022 0.054
Zinc 0.08 0.329
Lead 0.08 0.4
Nitrite and Nitrate 0.46 0.76
TKN 0.87 1.83
Phosphate 0.16 0.4
Volatile suspended solids 12 39
Total organic carbon 8 25
Chemical oxygen demand 49 114
*EMC: Event Mean Concentration
Table 4.2 US highway runoff concentrations for various stormwater pollutants (Driscoll et al., 1990)
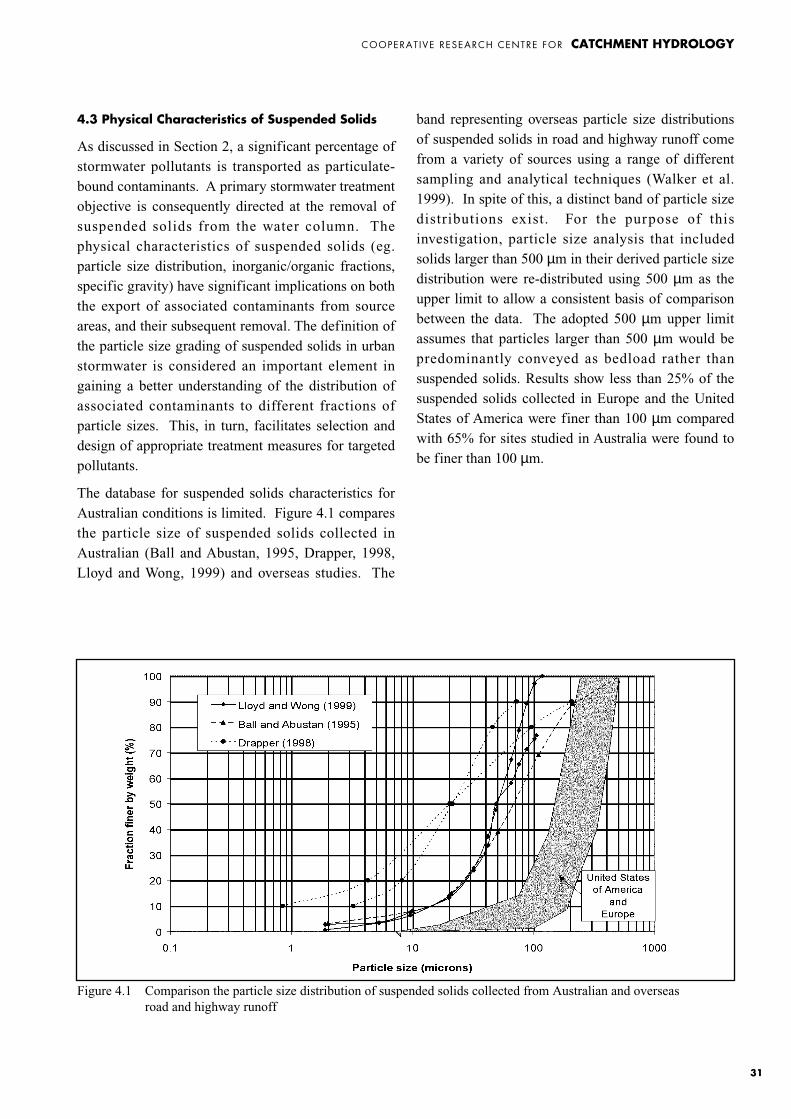
4.3 Physical Characteristics of Suspended Solids
As discussed in Section 2, a significant percentage ofstormwater pollutants is transported as particulate-bound contaminants. A primary stormwater treatmentobjective is consequently directed at the removal ofsuspended solids from the water column. Thephysical characteristics of suspended solids (eg.particle size distribution, inorganic/organic fractions,specific gravity) have significant implications on boththe export of associated contaminants from sourceareas, and their subsequent removal. The definition ofthe particle size grading of suspended solids in urbanstormwater is considered an important element ingaining a better understanding of the distribution ofassociated contaminants to different fractions ofparticle sizes. This, in turn, facilitates selection anddesign of appropriate treatment measures for targetedpollutants.
The database for suspended solids characteristics forAustralian conditions is limited. Figure 4.1 comparesthe particle size of suspended solids collected inAustralian (Ball and Abustan, 1995, Drapper, 1998,Lloyd and Wong, 1999) and overseas studies. The
band representing overseas particle size distributionsof suspended solids in road and highway runoff comefrom a variety of sources using a range of differentsampling and analytical techniques (Walker et al.1999). In spite of this, a distinct band of particle sizedistributions exist. For the purpose of thisinvestigation, particle size analysis that includedsolids larger than 500 µm in their derived particle sizedistribution were re-distributed using 500 µm as theupper limit to allow a consistent basis of comparisonbetween the data. The adopted 500 µm upper limitassumes that particles larger than 500 µm would bepredominantly conveyed as bedload rather thansuspended solids. Results show less than 25% of thesuspended solids collected in Europe and the UnitedStates of America were finer than 100 µm comparedwith 65% for sites studied in Australia were found tobe finer than 100 µm.
COOPERAT IVE RESEARCH CENTRE FOR CATCHMENT HYDROLOGY
31
Figure 4.1 Comparison the particle size distribution of suspended solids collected from Australian and overseasroad and highway runoff
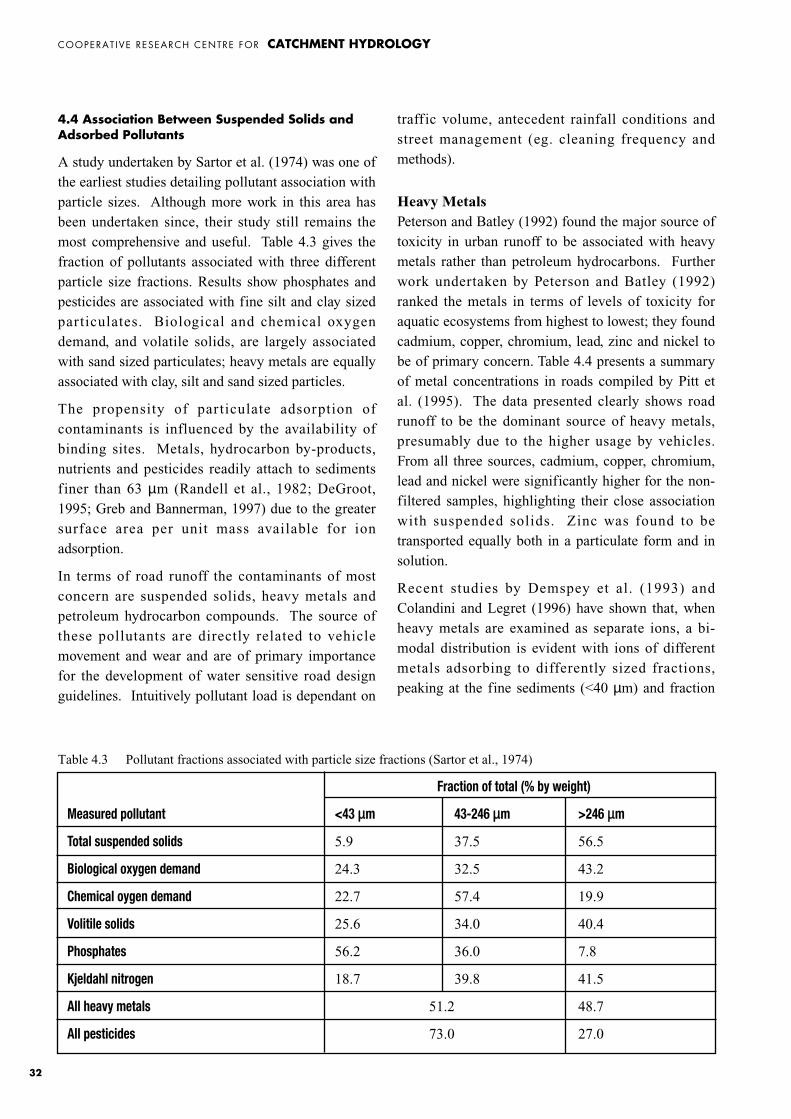
4.4 Association Between Suspended Solids andAdsorbed Pollutants
A study undertaken by Sartor et al. (1974) was one ofthe earliest studies detailing pollutant association withparticle sizes. Although more work in this area hasbeen undertaken since, their study still remains themost comprehensive and useful. Table 4.3 gives thefraction of pollutants associated with three differentparticle size fractions. Results show phosphates andpesticides are associated with fine silt and clay sizedparticulates. Biological and chemical oxygendemand, and volatile solids, are largely associatedwith sand sized particulates; heavy metals are equallyassociated with clay, silt and sand sized particles.
The propensity of particulate adsorption ofcontaminants is influenced by the availability ofbinding sites. Metals, hydrocarbon by-products,nutrients and pesticides readily attach to sedimentsfiner than 63 µm (Randell et al., 1982; DeGroot,1995; Greb and Bannerman, 1997) due to the greatersurface area per unit mass available for ionadsorption.
In terms of road runoff the contaminants of mostconcern are suspended solids, heavy metals andpetroleum hydrocarbon compounds. The source ofthese pollutants are directly related to vehiclemovement and wear and are of primary importancefor the development of water sensitive road designguidelines. Intuitively pollutant load is dependant on
traffic volume, antecedent rainfall conditions andstreet management (eg. cleaning frequency andmethods).
Heavy MetalsPeterson and Batley (1992) found the major source oftoxicity in urban runoff to be associated with heavymetals rather than petroleum hydrocarbons. Furtherwork undertaken by Peterson and Batley (1992)ranked the metals in terms of levels of toxicity foraquatic ecosystems from highest to lowest; they foundcadmium, copper, chromium, lead, zinc and nickel tobe of primary concern. Table 4.4 presents a summaryof metal concentrations in roads compiled by Pitt etal. (1995). The data presented clearly shows roadrunoff to be the dominant source of heavy metals,presumably due to the higher usage by vehicles.From all three sources, cadmium, copper, chromium,lead and nickel were significantly higher for the non-filtered samples, highlighting their close associationwith suspended solids. Zinc was found to betransported equally both in a particulate form and insolution.
Recent studies by Demspey et al. (1993) andColandini and Legret (1996) have shown that, whenheavy metals are examined as separate ions, a bi-modal distribution is evident with ions of differentmetals adsorbing to differently sized fractions,peaking at the fine sediments (<40 µm) and fraction
COOPERAT IVE RESEARCH CENTRE FOR CATCHMENT HYDROLOGY
32
Table 4.3 Pollutant fractions associated with particle size fractions (Sartor et al., 1974)
Fraction of total (% by weight)
Measured pollutant <43 µm 43-246 µm >246 µm
Total suspended solids 5.9 37.5 56.5
Biological oxygen demand 24.3 32.5 43.2
Chemical oygen demand 22.7 57.4 19.9
Volitile solids 25.6 34.0 40.4
Phosphates 56.2 36.0 7.8
Kjeldahl nitrogen 18.7 39.8 41.5
All heavy metals 51.2 48.7
All pesticides 73.0 27.0
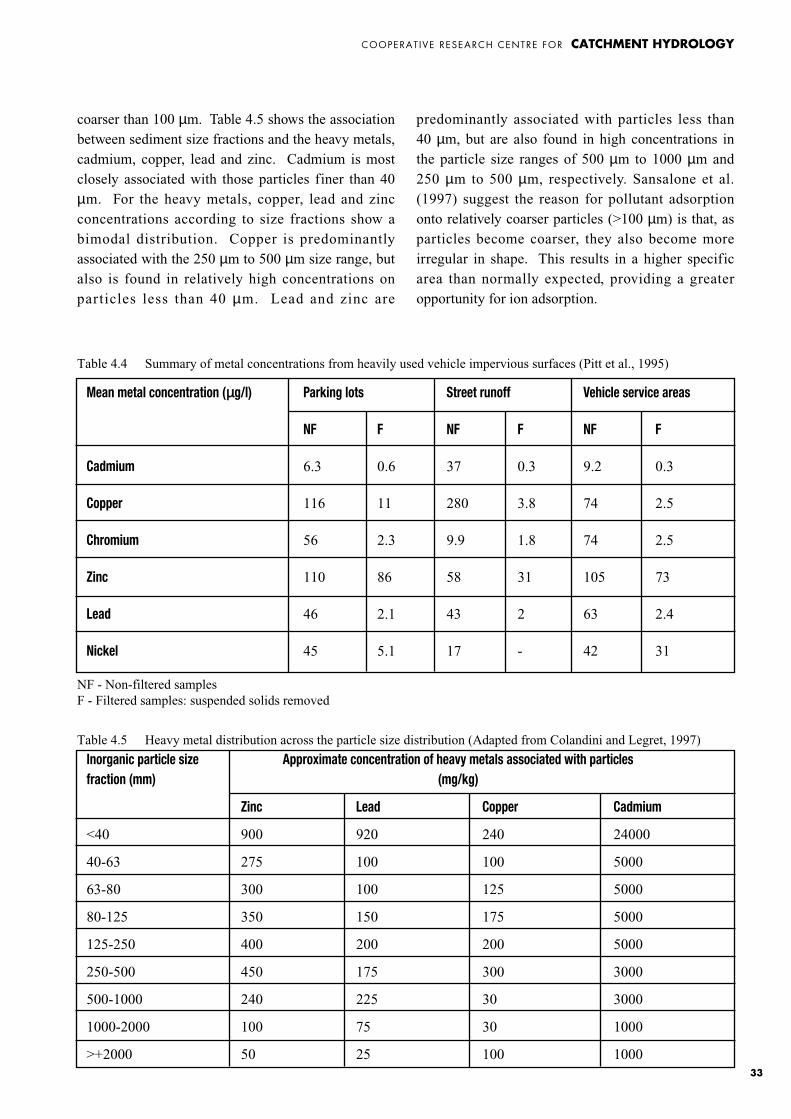
coarser than 100 µm. Table 4.5 shows the associationbetween sediment size fractions and the heavy metals,cadmium, copper, lead and zinc. Cadmium is mostclosely associated with those particles finer than 40µm. For the heavy metals, copper, lead and zincconcentrations according to size fractions show abimodal distribution. Copper is predominantlyassociated with the 250 µm to 500 µm size range, butalso is found in relatively high concentrations onparticles less than 40 µm. Lead and zinc are
predominantly associated with particles less than 40 µm, but are also found in high concentrations inthe particle size ranges of 500 µm to 1000 µm and250 µm to 500 µm, respectively. Sansalone et al.(1997) suggest the reason for pollutant adsorptiononto relatively coarser particles (>100 µm) is that, asparticles become coarser, they also become moreirregular in shape. This results in a higher specificarea than normally expected, providing a greateropportunity for ion adsorption.
COOPERAT IVE RESEARCH CENTRE FOR CATCHMENT HYDROLOGY
33
Table 4.4 Summary of metal concentrations from heavily used vehicle impervious surfaces (Pitt et al., 1995)
Mean metal concentration (µg/l) Parking lots Street runoff Vehicle service areas
NF F NF F NF F
Cadmium 6.3 0.6 37 0.3 9.2 0.3
Copper 116 11 280 3.8 74 2.5
Chromium 56 2.3 9.9 1.8 74 2.5
Zinc 110 86 58 31 105 73
Lead 46 2.1 43 2 63 2.4
Nickel 45 5.1 17 - 42 31
NF - Non-filtered samplesF - Filtered samples: suspended solids removed
Table 4.5 Heavy metal distribution across the particle size distribution (Adapted from Colandini and Legret, 1997)
Inorganic particle size Approximate concentration of heavy metals associated with particlesfraction (mm) (mg/kg)
Zinc Lead Copper Cadmium
<40 900 920 240 24000
40-63 275 100 100 5000
63-80 300 100 125 5000
80-125 350 150 175 5000
125-250 400 200 200 5000
250-500 450 175 300 3000
500-1000 240 225 30 3000
1000-2000 100 75 30 1000
>+2000 50 25 100 1000
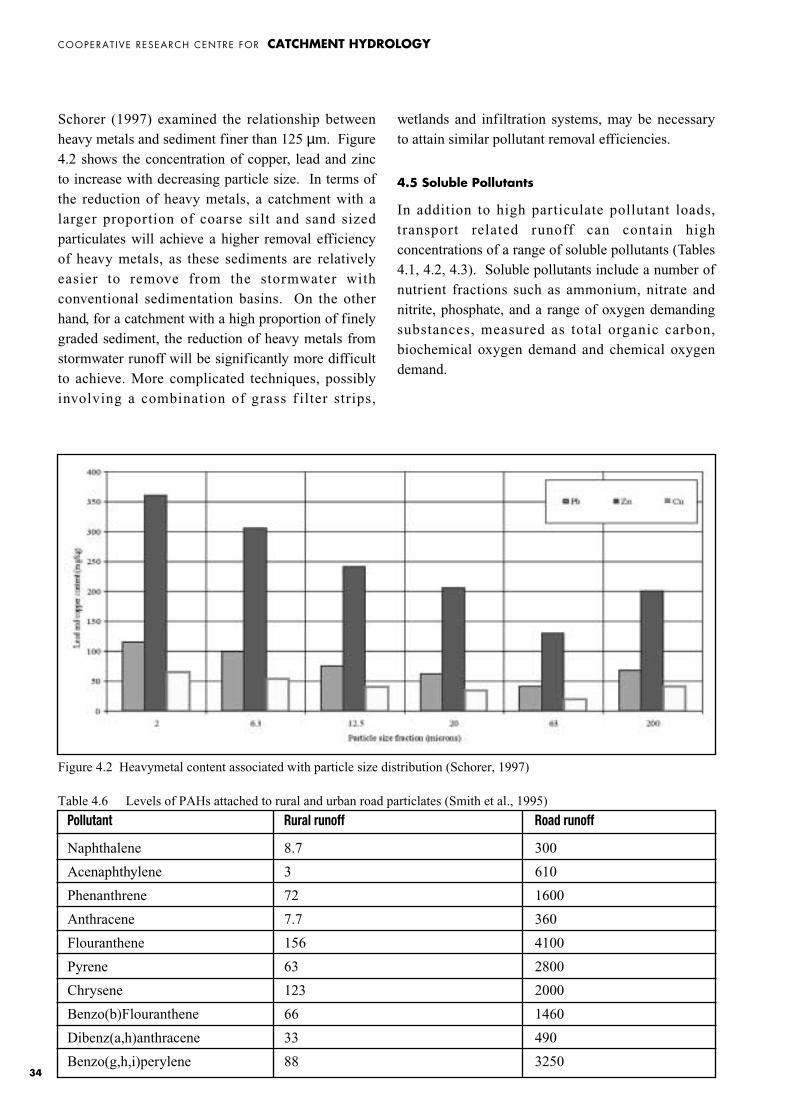
wetlands and infiltration systems, may be necessaryto attain similar pollutant removal efficiencies.
4.5 Soluble Pollutants
In addition to high particulate pollutant loads,transport related runoff can contain highconcentrations of a range of soluble pollutants (Tables4.1, 4.2, 4.3). Soluble pollutants include a number ofnutrient fractions such as ammonium, nitrate andnitrite, phosphate, and a range of oxygen demandingsubstances, measured as total organic carbon,biochemical oxygen demand and chemical oxygendemand.
COOPERAT IVE RESEARCH CENTRE FOR CATCHMENT HYDROLOGY
34
Schorer (1997) examined the relationship betweenheavy metals and sediment finer than 125 µm. Figure4.2 shows the concentration of copper, lead and zincto increase with decreasing particle size. In terms ofthe reduction of heavy metals, a catchment with alarger proportion of coarse silt and sand sizedparticulates will achieve a higher removal efficiencyof heavy metals, as these sediments are relativelyeasier to remove from the stormwater withconventional sedimentation basins. On the otherhand, for a catchment with a high proportion of finelygraded sediment, the reduction of heavy metals fromstormwater runoff will be significantly more difficultto achieve. More complicated techniques, possiblyinvolving a combination of grass f ilter strips,
Figure 4.2 Heavymetal content associated with particle size distribution (Schorer, 1997)
Table 4.6 Levels of PAHs attached to rural and urban road particlates (Smith et al., 1995)
Pollutant Rural runoff Road runoff
Naphthalene 8.7 300
Acenaphthylene 3 610
Phenanthrene 72 1600
Anthracene 7.7 360
Flouranthene 156 4100
Pyrene 63 2800
Chrysene 123 2000
Benzo(b)Flouranthene 66 1460
Dibenz(a,h)anthracene 33 490
Benzo(g,h,i)perylene 88 3250
Nutrients can stimulate weed growth in receivingwaters resulting in an increased internal organic loadfor the ecosystem to process. When combined withthe additional oxygen demand caused by organicmatter and other oxygen depleting pollutantsdelivered to the system by runoff, the increased loadcan affect the nutrient cycling processes of thesediments. Significant depletion of oxygen in thereceiving waters may cause the sediments to becomeanoxic, releasing both nutrients and metals in a toxicform. Consequently it is important to consider howboth soluble and particulate pollutants may impact onreceiving water ecosystems and how differentpollutants interact over time.
Petroleum By-productsRoad runoff often contains high concentrations ofpetroleum by-products, as a result of poor vehiclemaintenance, leaks, wear and tear and generalvehicular activities. Contaminants include oils, tarproducts and Polycyclic Aromatic Hydrocarbons(PAHs). Table 4.6 highlights the significant increasein the levels of PAHs in road runoff compared withrunoff from a rural catchment. Schorer (1997) foundPAHs were highly associated with the presence oforganic materials, and more specifically the chemicalcomposition of the organic material.
COOPERAT IVE RESEARCH CENTRE FOR CATCHMENT HYDROLOGY
35

COOPERAT IVE RESEARCH CENTRE FOR CATCHMENT HYDROLOGY
36
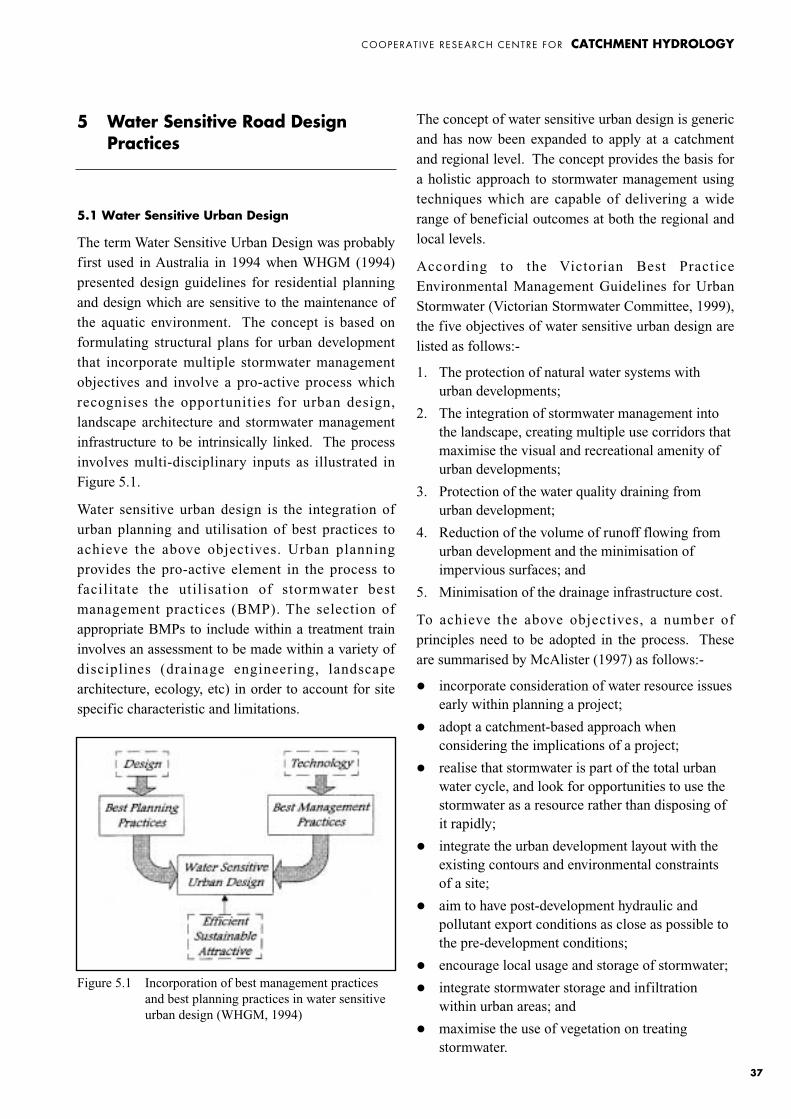
5 Water Sensitive Road Design Practices
5.1 Water Sensitive Urban Design
The term Water Sensitive Urban Design was probablyfirst used in Australia in 1994 when WHGM (1994)presented design guidelines for residential planningand design which are sensitive to the maintenance ofthe aquatic environment. The concept is based onformulating structural plans for urban developmentthat incorporate multiple stormwater managementobjectives and involve a pro-active process whichrecognises the opportunities for urban design,landscape architecture and stormwater managementinfrastructure to be intrinsically linked. The processinvolves multi-disciplinary inputs as illustrated inFigure 5.1.
Water sensitive urban design is the integration ofurban planning and utilisation of best practices toachieve the above objectives. Urban planningprovides the pro-active element in the process tofacilitate the utilisation of stormwater bestmanagement practices (BMP). The selection ofappropriate BMPs to include within a treatment traininvolves an assessment to be made within a variety ofdisciplines (drainage engineering, landscapearchitecture, ecology, etc) in order to account for sitespecific characteristic and limitations.
The concept of water sensitive urban design is genericand has now been expanded to apply at a catchmentand regional level. The concept provides the basis fora holistic approach to stormwater management usingtechniques which are capable of delivering a widerange of beneficial outcomes at both the regional andlocal levels.
According to the Victorian Best PracticeEnvironmental Management Guidelines for UrbanStormwater (Victorian Stormwater Committee, 1999),the five objectives of water sensitive urban design arelisted as follows:-
1. The protection of natural water systems withurban developments;
2. The integration of stormwater management intothe landscape, creating multiple use corridors thatmaximise the visual and recreational amenity ofurban developments;
3. Protection of the water quality draining fromurban development;
4. Reduction of the volume of runoff flowing fromurban development and the minimisation ofimpervious surfaces; and
5. Minimisation of the drainage infrastructure cost.
To achieve the above objectives, a number ofprinciples need to be adopted in the process. Theseare summarised by McAlister (1997) as follows:-
� incorporate consideration of water resource issuesearly within planning a project;
� adopt a catchment-based approach whenconsidering the implications of a project;
� realise that stormwater is part of the total urbanwater cycle, and look for opportunities to use thestormwater as a resource rather than disposing ofit rapidly;
� integrate the urban development layout with theexisting contours and environmental constraintsof a site;
� aim to have post-development hydraulic andpollutant export conditions as close as possible tothe pre-development conditions;
� encourage local usage and storage of stormwater;
� integrate stormwater storage and infiltrationwithin urban areas; and
� maximise the use of vegetation on treatingstormwater.
Figure 5.1 Incorporation of best management practicesand best planning practices in water sensitiveurban design (WHGM, 1994)
COOPERAT IVE RESEARCH CENTRE FOR CATCHMENT HYDROLOGY
37
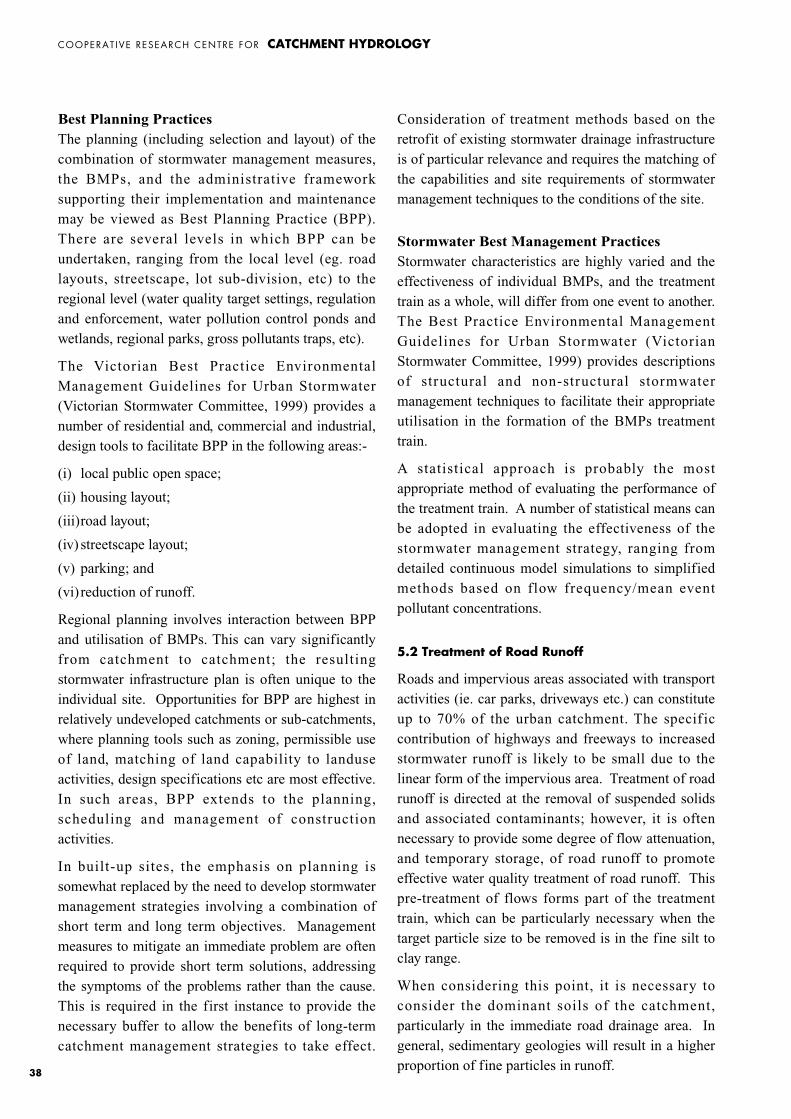
Best Planning PracticesThe planning (including selection and layout) of thecombination of stormwater management measures,the BMPs, and the administrative frameworksupporting their implementation and maintenancemay be viewed as Best Planning Practice (BPP).There are several levels in which BPP can beundertaken, ranging from the local level (eg. roadlayouts, streetscape, lot sub-division, etc) to theregional level (water quality target settings, regulationand enforcement, water pollution control ponds andwetlands, regional parks, gross pollutants traps, etc).
The Victorian Best Practice EnvironmentalManagement Guidelines for Urban Stormwater(Victorian Stormwater Committee, 1999) provides anumber of residential and, commercial and industrial,design tools to facilitate BPP in the following areas:-
(i) local public open space;
(ii) housing layout;
(iii)road layout;
(iv) streetscape layout;
(v) parking; and
(vi) reduction of runoff.
Regional planning involves interaction between BPPand utilisation of BMPs. This can vary significantlyfrom catchment to catchment; the resultingstormwater infrastructure plan is often unique to theindividual site. Opportunities for BPP are highest inrelatively undeveloped catchments or sub-catchments,where planning tools such as zoning, permissible useof land, matching of land capability to landuseactivities, design specifications etc are most effective.In such areas, BPP extends to the planning,scheduling and management of constructionactivities.
In built-up sites, the emphasis on planning issomewhat replaced by the need to develop stormwatermanagement strategies involving a combination ofshort term and long term objectives. Managementmeasures to mitigate an immediate problem are oftenrequired to provide short term solutions, addressingthe symptoms of the problems rather than the cause.This is required in the first instance to provide thenecessary buffer to allow the benefits of long-termcatchment management strategies to take effect.
Consideration of treatment methods based on theretrofit of existing stormwater drainage infrastructureis of particular relevance and requires the matching ofthe capabilities and site requirements of stormwatermanagement techniques to the conditions of the site.
Stormwater Best Management PracticesStormwater characteristics are highly varied and theeffectiveness of individual BMPs, and the treatmenttrain as a whole, will differ from one event to another.The Best Practice Environmental ManagementGuidelines for Urban Stormwater (VictorianStormwater Committee, 1999) provides descriptionsof structural and non-structural stormwatermanagement techniques to facilitate their appropriateutilisation in the formation of the BMPs treatmenttrain.
A statistical approach is probably the mostappropriate method of evaluating the performance ofthe treatment train. A number of statistical means canbe adopted in evaluating the effectiveness of thestormwater management strategy, ranging fromdetailed continuous model simulations to simplifiedmethods based on flow frequency/mean eventpollutant concentrations.
5.2 Treatment of Road Runoff
Roads and impervious areas associated with transportactivities (ie. car parks, driveways etc.) can constituteup to 70% of the urban catchment. The specif iccontribution of highways and freeways to increasedstormwater runoff is likely to be small due to thelinear form of the impervious area. Treatment of roadrunoff is directed at the removal of suspended solidsand associated contaminants; however, it is oftennecessary to provide some degree of flow attenuation,and temporary storage, of road runoff to promoteeffective water quality treatment of road runoff. Thispre-treatment of flows forms part of the treatmenttrain, which can be particularly necessary when thetarget particle size to be removed is in the fine silt toclay range.
When considering this point, it is necessary toconsider the dominant soils of the catchment,particularly in the immediate road drainage area. Ingeneral, sedimentary geologies will result in a higherproportion of fine particles in runoff.
COOPERAT IVE RESEARCH CENTRE FOR CATCHMENT HYDROLOGY
38
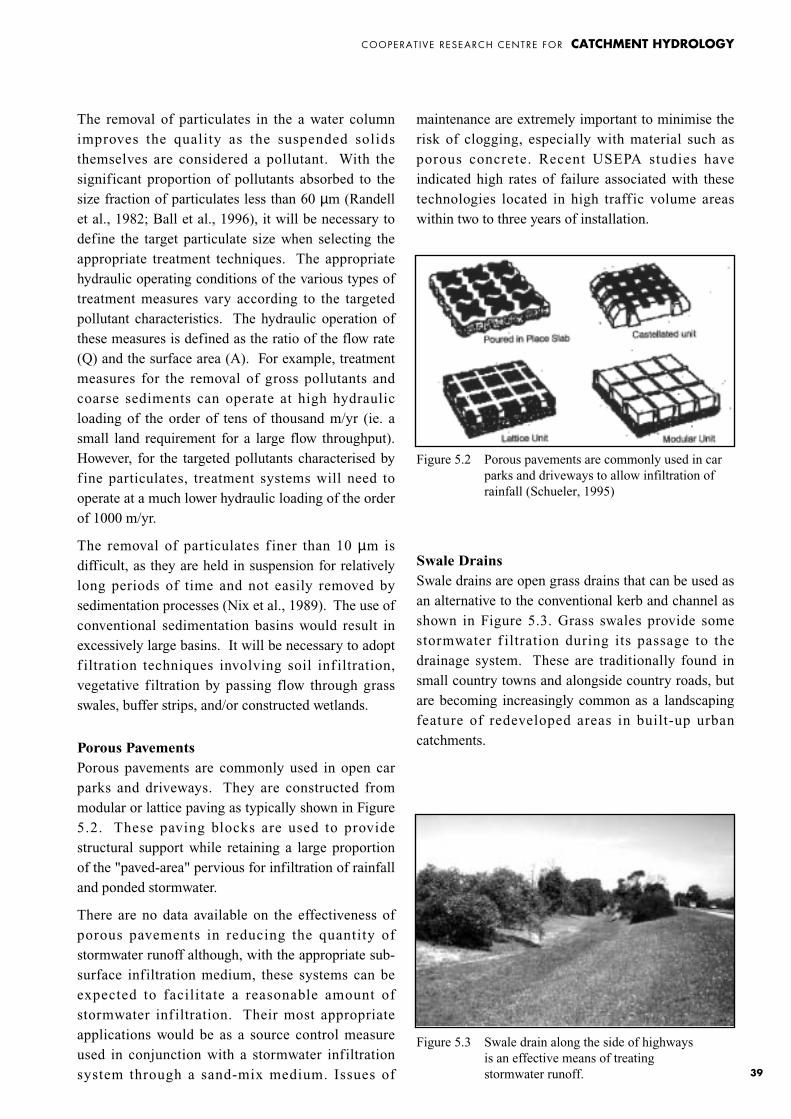
COOPERAT IVE RESEARCH CENTRE FOR CATCHMENT HYDROLOGY
39
maintenance are extremely important to minimise therisk of clogging, especially with material such asporous concrete. Recent USEPA studies haveindicated high rates of failure associated with thesetechnologies located in high traff ic volume areaswithin two to three years of installation.
Swale Drains Swale drains are open grass drains that can be used asan alternative to the conventional kerb and channel asshown in Figure 5.3. Grass swales provide somestormwater f iltration during its passage to thedrainage system. These are traditionally found insmall country towns and alongside country roads, butare becoming increasingly common as a landscapingfeature of redeveloped areas in built-up urbancatchments.
The removal of particulates in the a water columnimproves the quality as the suspended solidsthemselves are considered a pollutant. With thesignificant proportion of pollutants absorbed to thesize fraction of particulates less than 60 µm (Randellet al., 1982; Ball et al., 1996), it will be necessary todefine the target particulate size when selecting theappropriate treatment techniques. The appropriatehydraulic operating conditions of the various types oftreatment measures vary according to the targetedpollutant characteristics. The hydraulic operation ofthese measures is defined as the ratio of the flow rate(Q) and the surface area (A). For example, treatmentmeasures for the removal of gross pollutants andcoarse sediments can operate at high hydraulicloading of the order of tens of thousand m/yr (ie. asmall land requirement for a large flow throughput).However, for the targeted pollutants characterised byf ine particulates, treatment systems will need tooperate at a much lower hydraulic loading of the orderof 1000 m/yr.
The removal of particulates f iner than 10 µm isdifficult, as they are held in suspension for relativelylong periods of time and not easily removed bysedimentation processes (Nix et al., 1989). The use ofconventional sedimentation basins would result inexcessively large basins. It will be necessary to adoptf iltration techniques involving soil inf iltration,vegetative filtration by passing flow through grassswales, buffer strips, and/or constructed wetlands.
Porous PavementsPorous pavements are commonly used in open carparks and driveways. They are constructed frommodular or lattice paving as typically shown in Figure5.2. These paving blocks are used to providestructural support while retaining a large proportionof the "paved-area" pervious for infiltration of rainfalland ponded stormwater.
There are no data available on the effectiveness ofporous pavements in reducing the quantity ofstormwater runoff although, with the appropriate sub-surface infiltration medium, these systems can beexpected to facilitate a reasonable amount ofstormwater inf iltration. Their most appropriateapplications would be as a source control measureused in conjunction with a stormwater infiltrationsystem through a sand-mix medium. Issues of
Figure 5.2 Porous pavements are commonly used in carparks and driveways to allow infiltration ofrainfall (Schueler, 1995)
Figure 5.3 Swale drain along the side of highwaysis an effective means of treating stormwater runoff.
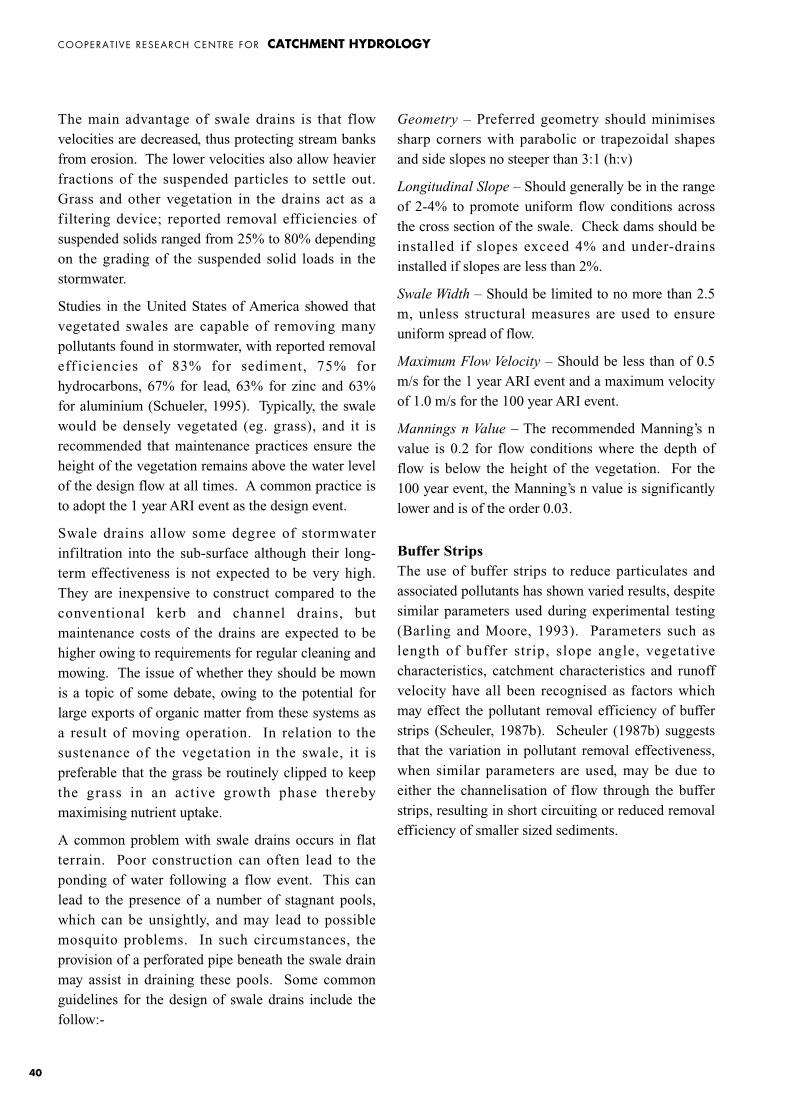
COOPERAT IVE RESEARCH CENTRE FOR CATCHMENT HYDROLOGY
40
The main advantage of swale drains is that flowvelocities are decreased, thus protecting stream banksfrom erosion. The lower velocities also allow heavierfractions of the suspended particles to settle out.Grass and other vegetation in the drains act as af iltering device; reported removal eff iciencies ofsuspended solids ranged from 25% to 80% dependingon the grading of the suspended solid loads in thestormwater.
Studies in the United States of America showed thatvegetated swales are capable of removing manypollutants found in stormwater, with reported removaleff iciencies of 83% for sediment, 75% forhydrocarbons, 67% for lead, 63% for zinc and 63%for aluminium (Schueler, 1995). Typically, the swalewould be densely vegetated (eg. grass), and it isrecommended that maintenance practices ensure theheight of the vegetation remains above the water levelof the design flow at all times. A common practice isto adopt the 1 year ARI event as the design event.
Swale drains allow some degree of stormwaterinfiltration into the sub-surface although their long-term effectiveness is not expected to be very high.They are inexpensive to construct compared to theconventional kerb and channel drains, butmaintenance costs of the drains are expected to behigher owing to requirements for regular cleaning andmowing. The issue of whether they should be mownis a topic of some debate, owing to the potential forlarge exports of organic matter from these systems asa result of moving operation. In relation to thesustenance of the vegetation in the swale, it ispreferable that the grass be routinely clipped to keepthe grass in an active growth phase therebymaximising nutrient uptake.
A common problem with swale drains occurs in flatterrain. Poor construction can often lead to theponding of water following a flow event. This canlead to the presence of a number of stagnant pools,which can be unsightly, and may lead to possiblemosquito problems. In such circumstances, theprovision of a perforated pipe beneath the swale drainmay assist in draining these pools. Some commonguidelines for the design of swale drains include thefollow:-
Geometry – Preferred geometry should minimisessharp corners with parabolic or trapezoidal shapesand side slopes no steeper than 3:1 (h:v)
Longitudinal Slope – Should generally be in the rangeof 2-4% to promote uniform flow conditions acrossthe cross section of the swale. Check dams should beinstalled if slopes exceed 4% and under-drainsinstalled if slopes are less than 2%.
Swale Width – Should be limited to no more than 2.5m, unless structural measures are used to ensureuniform spread of flow.
Maximum Flow Velocity – Should be less than of 0.5m/s for the 1 year ARI event and a maximum velocityof 1.0 m/s for the 100 year ARI event.
Mannings n Value – The recommended Manning’s nvalue is 0.2 for flow conditions where the depth offlow is below the height of the vegetation. For the100 year event, the Manning’s n value is significantlylower and is of the order 0.03.
Buffer StripsThe use of buffer strips to reduce particulates andassociated pollutants has shown varied results, despitesimilar parameters used during experimental testing(Barling and Moore, 1993). Parameters such aslength of buffer strip, slope angle, vegetativecharacteristics, catchment characteristics and runoffvelocity have all been recognised as factors whichmay effect the pollutant removal efficiency of bufferstrips (Scheuler, 1987b). Scheuler (1987b) suggeststhat the variation in pollutant removal effectiveness,when similar parameters are used, may be due toeither the channelisation of flow through the bufferstrips, resulting in short circuiting or reduced removalefficiency of smaller sized sediments.
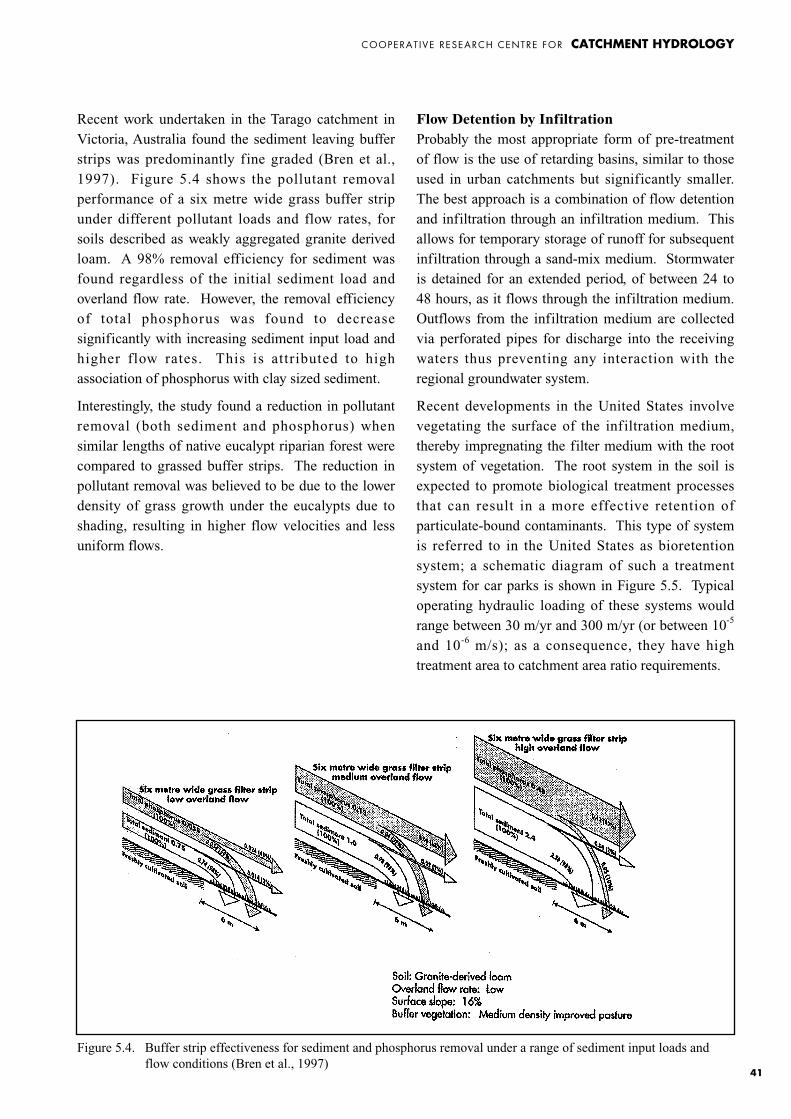
COOPERAT IVE RESEARCH CENTRE FOR CATCHMENT HYDROLOGY
41
Recent work undertaken in the Tarago catchment inVictoria, Australia found the sediment leaving bufferstrips was predominantly fine graded (Bren et al.,1997). Figure 5.4 shows the pollutant removalperformance of a six metre wide grass buffer stripunder different pollutant loads and flow rates, forsoils described as weakly aggregated granite derivedloam. A 98% removal efficiency for sediment wasfound regardless of the initial sediment load andoverland flow rate. However, the removal efficiencyof total phosphorus was found to decreasesignificantly with increasing sediment input load andhigher flow rates. This is attributed to highassociation of phosphorus with clay sized sediment.
Interestingly, the study found a reduction in pollutantremoval (both sediment and phosphorus) whensimilar lengths of native eucalypt riparian forest werecompared to grassed buffer strips. The reduction inpollutant removal was believed to be due to the lowerdensity of grass growth under the eucalypts due toshading, resulting in higher flow velocities and lessuniform flows.
Flow Detention by InfiltrationProbably the most appropriate form of pre-treatmentof flow is the use of retarding basins, similar to thoseused in urban catchments but significantly smaller.The best approach is a combination of flow detentionand infiltration through an infiltration medium. Thisallows for temporary storage of runoff for subsequentinfiltration through a sand-mix medium. Stormwateris detained for an extended period, of between 24 to48 hours, as it flows through the infiltration medium.Outflows from the infiltration medium are collectedvia perforated pipes for discharge into the receivingwaters thus preventing any interaction with theregional groundwater system.
Recent developments in the United States involvevegetating the surface of the infiltration medium,thereby impregnating the filter medium with the rootsystem of vegetation. The root system in the soil isexpected to promote biological treatment processesthat can result in a more effective retention ofparticulate-bound contaminants. This type of systemis referred to in the United States as bioretentionsystem; a schematic diagram of such a treatmentsystem for car parks is shown in Figure 5.5. Typicaloperating hydraulic loading of these systems wouldrange between 30 m/yr and 300 m/yr (or between 10-5
and 10-6 m/s); as a consequence, they have hightreatment area to catchment area ratio requirements.
Figure 5.4. Buffer strip effectiveness for sediment and phosphorus removal under a range of sediment input loads andflow conditions (Bren et al., 1997)
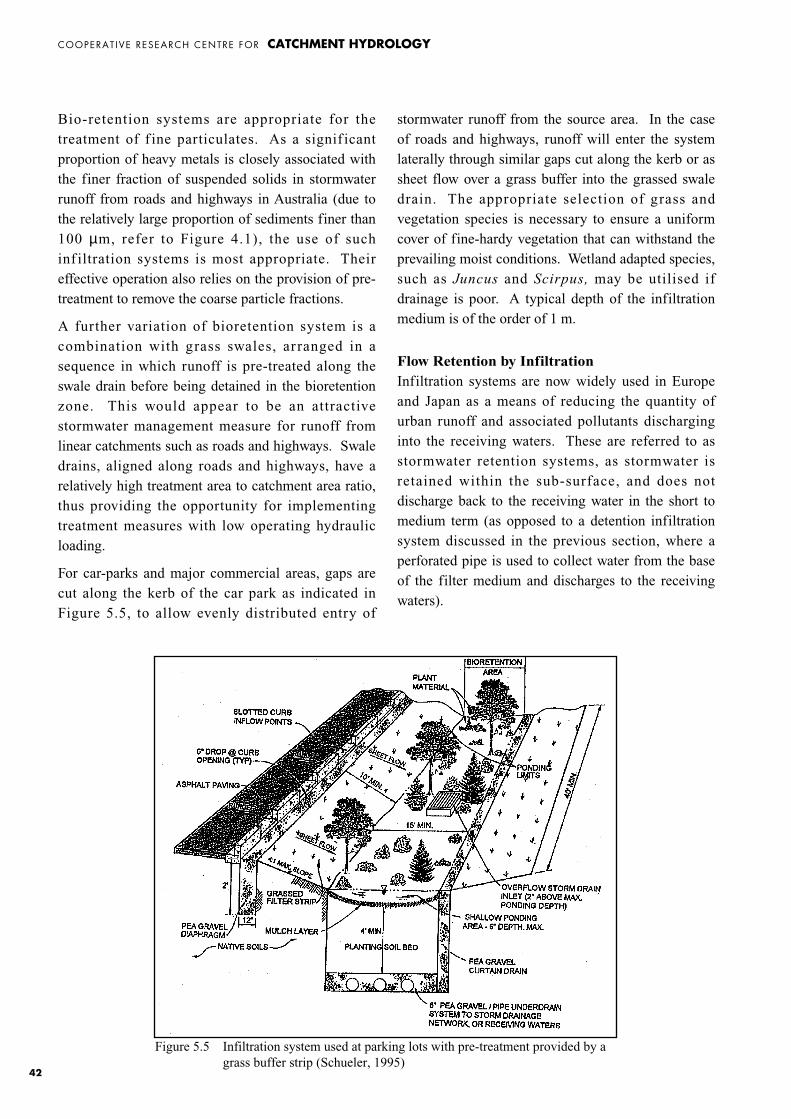
COOPERAT IVE RESEARCH CENTRE FOR CATCHMENT HYDROLOGY
42
Bio-retention systems are appropriate for thetreatment of f ine particulates. As a signif icantproportion of heavy metals is closely associated withthe finer fraction of suspended solids in stormwaterrunoff from roads and highways in Australia (due tothe relatively large proportion of sediments finer than100 µm, refer to Figure 4.1), the use of suchinf iltration systems is most appropriate. Theireffective operation also relies on the provision of pre-treatment to remove the coarse particle fractions.
A further variation of bioretention system is acombination with grass swales, ar ranged in asequence in which runoff is pre-treated along theswale drain before being detained in the bioretentionzone. This would appear to be an attractivestormwater management measure for runoff fromlinear catchments such as roads and highways. Swaledrains, aligned along roads and highways, have arelatively high treatment area to catchment area ratio,thus providing the opportunity for implementingtreatment measures with low operating hydraulicloading.
For car-parks and major commercial areas, gaps arecut along the kerb of the car park as indicated inFigure 5.5, to allow evenly distributed entry of
stormwater runoff from the source area. In the caseof roads and highways, runoff will enter the systemlaterally through similar gaps cut along the kerb or assheet flow over a grass buffer into the grassed swaledrain. The appropriate selection of grass andvegetation species is necessary to ensure a uniformcover of fine-hardy vegetation that can withstand theprevailing moist conditions. Wetland adapted species,such as Juncus and Scirpus, may be utilised ifdrainage is poor. A typical depth of the infiltrationmedium is of the order of 1 m.
Flow Retention by InfiltrationInfiltration systems are now widely used in Europeand Japan as a means of reducing the quantity ofurban runoff and associated pollutants discharginginto the receiving waters. These are referred to asstormwater retention systems, as stormwater isretained within the sub-surface, and does notdischarge back to the receiving water in the short tomedium term (as opposed to a detention infiltrationsystem discussed in the previous section, where aperforated pipe is used to collect water from the baseof the filter medium and discharges to the receivingwaters).
Figure 5.5 Infiltration system used at parking lots with pre-treatment provided by agrass buffer strip (Schueler, 1995)
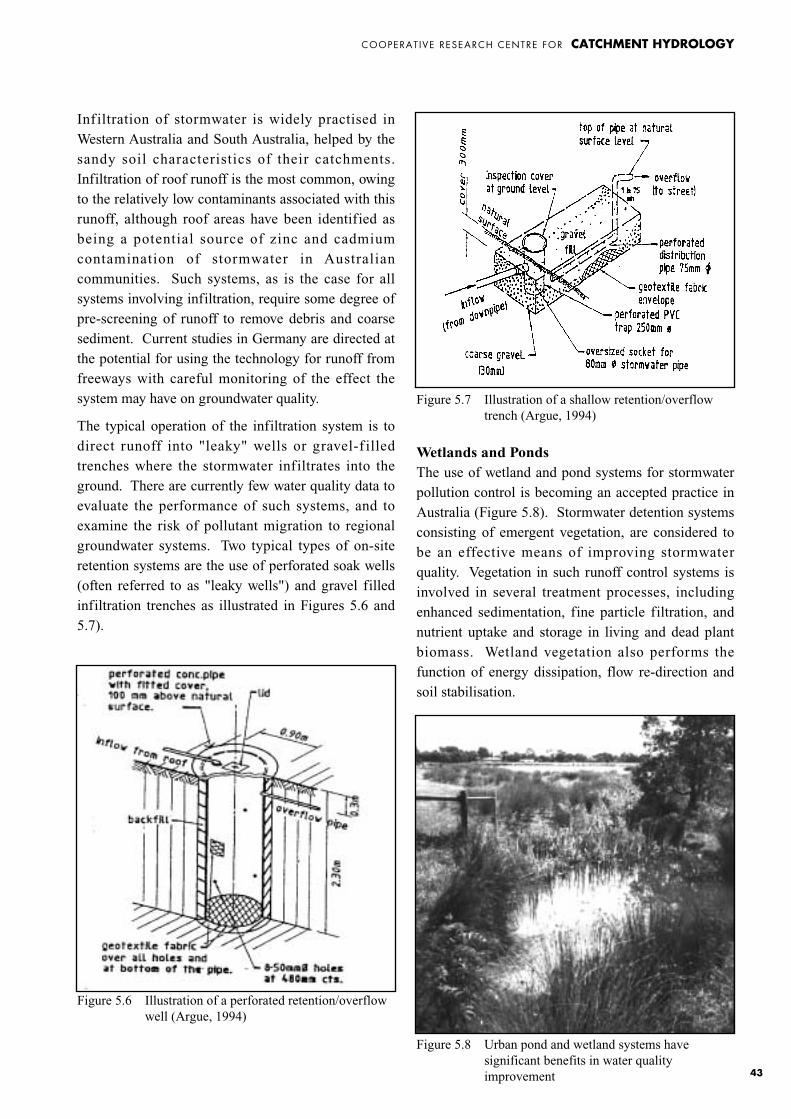
COOPERAT IVE RESEARCH CENTRE FOR CATCHMENT HYDROLOGY
43
Inf iltration of stormwater is widely practised inWestern Australia and South Australia, helped by thesandy soil characteristics of their catchments.Infiltration of roof runoff is the most common, owingto the relatively low contaminants associated with thisrunoff, although roof areas have been identified asbeing a potential source of zinc and cadmiumcontamination of stormwater in Australiancommunities. Such systems, as is the case for allsystems involving infiltration, require some degree ofpre-screening of runoff to remove debris and coarsesediment. Current studies in Germany are directed atthe potential for using the technology for runoff fromfreeways with careful monitoring of the effect thesystem may have on groundwater quality.
The typical operation of the infiltration system is todirect runoff into "leaky" wells or gravel-f illedtrenches where the stormwater infiltrates into theground. There are currently few water quality data toevaluate the performance of such systems, and toexamine the risk of pollutant migration to regionalgroundwater systems. Two typical types of on-siteretention systems are the use of perforated soak wells(often referred to as "leaky wells") and gravel filledinfiltration trenches as illustrated in Figures 5.6 and5.7).
Wetlands and Ponds The use of wetland and pond systems for stormwaterpollution control is becoming an accepted practice inAustralia (Figure 5.8). Stormwater detention systemsconsisting of emergent vegetation, are considered tobe an effective means of improving stormwaterquality. Vegetation in such runoff control systems isinvolved in several treatment processes, includingenhanced sedimentation, fine particle filtration, andnutrient uptake and storage in living and dead plantbiomass. Wetland vegetation also performs thefunction of energy dissipation, flow re-direction andsoil stabilisation.
Figure 5.6 Illustration of a perforated retention/overflowwell (Argue, 1994)
Figure 5.7 Illustration of a shallow retention/overflowtrench (Argue, 1994)
Figure 5.8 Urban pond and wetland systems havesignificant benefits in water qualityimprovement
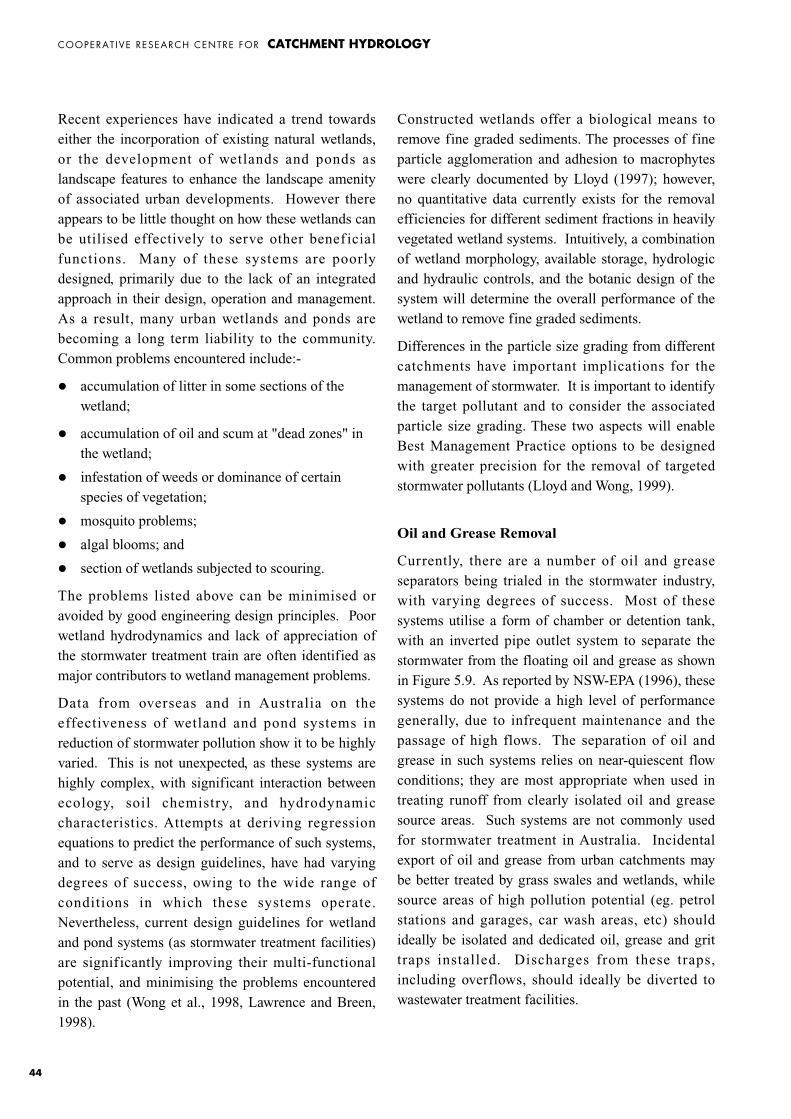
COOPERAT IVE RESEARCH CENTRE FOR CATCHMENT HYDROLOGY
44
Recent experiences have indicated a trend towardseither the incorporation of existing natural wetlands,or the development of wetlands and ponds aslandscape features to enhance the landscape amenityof associated urban developments. However thereappears to be little thought on how these wetlands canbe utilised effectively to serve other benef icialfunctions. Many of these systems are poorlydesigned, primarily due to the lack of an integratedapproach in their design, operation and management.As a result, many urban wetlands and ponds arebecoming a long term liability to the community.Common problems encountered include:-
� accumulation of litter in some sections of thewetland;
� accumulation of oil and scum at "dead zones" inthe wetland;
� infestation of weeds or dominance of certainspecies of vegetation;
� mosquito problems;
� algal blooms; and
� section of wetlands subjected to scouring.
The problems listed above can be minimised oravoided by good engineering design principles. Poorwetland hydrodynamics and lack of appreciation ofthe stormwater treatment train are often identified asmajor contributors to wetland management problems.
Data from overseas and in Australia on theeffectiveness of wetland and pond systems inreduction of stormwater pollution show it to be highlyvaried. This is not unexpected, as these systems arehighly complex, with significant interaction betweenecology, soil chemistry, and hydrodynamiccharacteristics. Attempts at deriving regressionequations to predict the performance of such systems,and to serve as design guidelines, have had varyingdegrees of success, owing to the wide range ofconditions in which these systems operate.Nevertheless, current design guidelines for wetlandand pond systems (as stormwater treatment facilities)are significantly improving their multi-functionalpotential, and minimising the problems encounteredin the past (Wong et al., 1998, Lawrence and Breen,1998).
Constructed wetlands offer a biological means toremove fine graded sediments. The processes of fineparticle agglomeration and adhesion to macrophyteswere clearly documented by Lloyd (1997); however,no quantitative data currently exists for the removalefficiencies for different sediment fractions in heavilyvegetated wetland systems. Intuitively, a combinationof wetland morphology, available storage, hydrologicand hydraulic controls, and the botanic design of thesystem will determine the overall performance of thewetland to remove fine graded sediments.
Differences in the particle size grading from differentcatchments have important implications for themanagement of stormwater. It is important to identifythe target pollutant and to consider the associatedparticle size grading. These two aspects will enableBest Management Practice options to be designedwith greater precision for the removal of targetedstormwater pollutants (Lloyd and Wong, 1999).
Oil and Grease Removal
Currently, there are a number of oil and greaseseparators being trialed in the stormwater industry,with varying degrees of success. Most of thesesystems utilise a form of chamber or detention tank,with an inverted pipe outlet system to separate thestormwater from the floating oil and grease as shownin Figure 5.9. As reported by NSW-EPA (1996), thesesystems do not provide a high level of performancegenerally, due to infrequent maintenance and thepassage of high flows. The separation of oil andgrease in such systems relies on near-quiescent flowconditions; they are most appropriate when used intreating runoff from clearly isolated oil and greasesource areas. Such systems are not commonly usedfor stormwater treatment in Australia. Incidentalexport of oil and grease from urban catchments maybe better treated by grass swales and wetlands, whilesource areas of high pollution potential (eg. petrolstations and garages, car wash areas, etc) shouldideally be isolated and dedicated oil, grease and grittraps installed. Discharges from these traps,including overflows, should ideally be diverted towastewater treatment facilities.
Figure 5.9 Component of an oil and grease trap
COOPERAT IVE RESEARCH CENTRE FOR CATCHMENT HYDROLOGY
45
5.3 Chemical Spill Containment
In the design of highways and freeways, considerationshould be given to the provision for chemical spillcontainment resulting from road accidents. Thesefacilities are not dissimilar to the use of wetlandsystems for road runoff other than the recognition thatthe macrophyte system could be destroyed in theevent of a chemical spill. The outlet structure mostappropriate for spill containment wetland systems is asiphon structure. These are inverted U-shapedconduits in which the water level in the upstream poolneeds to exceed the crest of the conduit before beingprimed by water pressure. They have the advantagethat they operate at near constant discharge rate oncethe siphon has been primed until the siphonmechanism is broken by air entrainment when waterlevel upstream falls below the level of the inlet end ofthe siphon. The priming level (ie. crest of the siphonoutlet) can be set above the permanent pool level suchthat it is sufficient to fully contain a typical tankervolume allowing for full containment under dryweather conditions.

COOPERAT IVE RESEARCH CENTRE FOR CATCHMENT HYDROLOGY
46
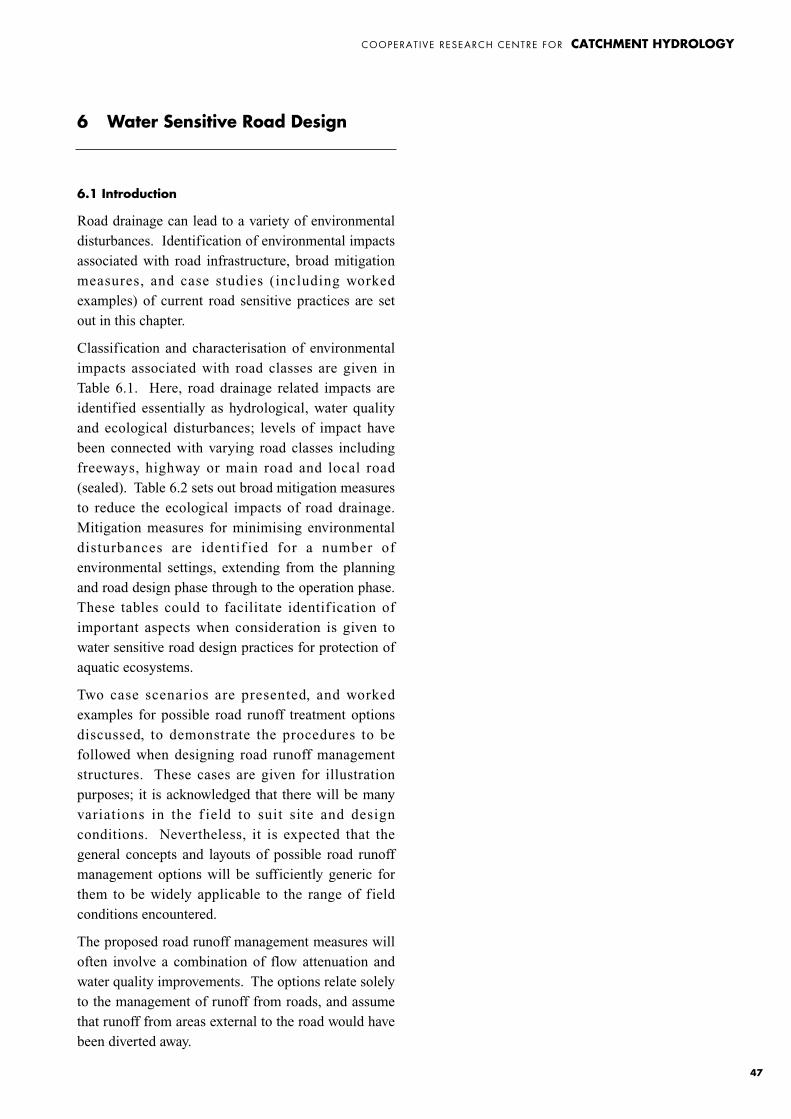
COOPERAT IVE RESEARCH CENTRE FOR CATCHMENT HYDROLOGY
47
6 Water Sensitive Road Design
6.1 Introduction
Road drainage can lead to a variety of environmentaldisturbances. Identification of environmental impactsassociated with road infrastructure, broad mitigationmeasures, and case studies (including workedexamples) of current road sensitive practices are setout in this chapter.
Classification and characterisation of environmentalimpacts associated with road classes are given inTable 6.1. Here, road drainage related impacts areidentified essentially as hydrological, water qualityand ecological disturbances; levels of impact havebeen connected with varying road classes includingfreeways, highway or main road and local road(sealed). Table 6.2 sets out broad mitigation measuresto reduce the ecological impacts of road drainage.Mitigation measures for minimising environmentaldisturbances are identif ied for a number ofenvironmental settings, extending from the planningand road design phase through to the operation phase.These tables could to facilitate identif ication ofimportant aspects when consideration is given towater sensitive road design practices for protection ofaquatic ecosystems.
Two case scenarios are presented, and workedexamples for possible road runoff treatment optionsdiscussed, to demonstrate the procedures to befollowed when designing road runoff managementstructures. These cases are given for illustrationpurposes; it is acknowledged that there will be manyvariations in the f ield to suit site and designconditions. Nevertheless, it is expected that thegeneral concepts and layouts of possible road runoffmanagement options will be sufficiently generic forthem to be widely applicable to the range of fieldconditions encountered.
The proposed road runoff management measures willoften involve a combination of flow attenuation andwater quality improvements. The options relate solelyto the management of runoff from roads, and assumethat runoff from areas external to the road would havebeen diverted away.

CO
OPE
RA
TIVE
RE
SE
AR
CH
CE
NTR
E FO
R C
ATC
HM
ENT H
YD
RO
LOG
Y
48
Table 6.1 Road drainage related impacts accourding to road class - potential impacts (operational or on-going)
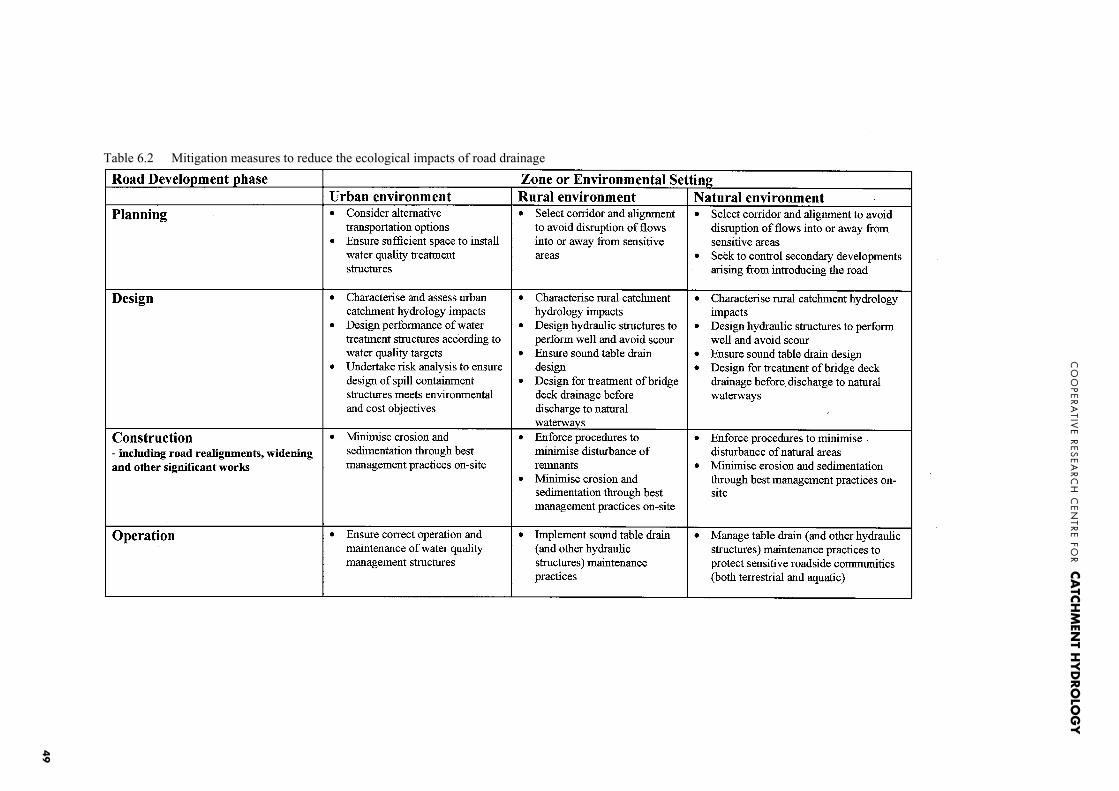
CO
OPE
RA
TIVE
RE
SE
AR
CH
CE
NTR
E FO
R C
ATC
HM
ENT H
YD
RO
LOG
Y
49
Table 6.2 Mitigation measures to reduce the ecological impacts of road drainage
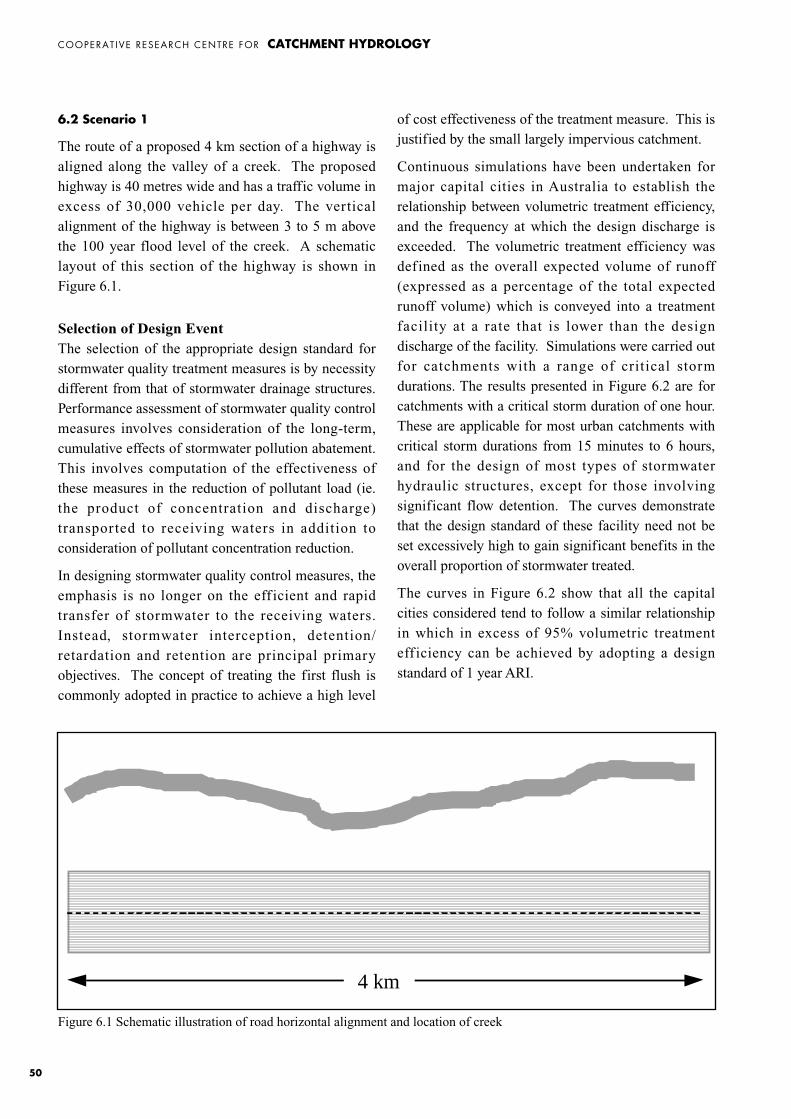
COOPERAT IVE RESEARCH CENTRE FOR CATCHMENT HYDROLOGY
50
6.2 Scenario 1
The route of a proposed 4 km section of a highway isaligned along the valley of a creek. The proposedhighway is 40 metres wide and has a traffic volume inexcess of 30,000 vehicle per day. The verticalalignment of the highway is between 3 to 5 m abovethe 100 year flood level of the creek. A schematiclayout of this section of the highway is shown inFigure 6.1.
Selection of Design EventThe selection of the appropriate design standard forstormwater quality treatment measures is by necessitydifferent from that of stormwater drainage structures.Performance assessment of stormwater quality controlmeasures involves consideration of the long-term,cumulative effects of stormwater pollution abatement.This involves computation of the effectiveness ofthese measures in the reduction of pollutant load (ie.the product of concentration and discharge)transported to receiving waters in addition toconsideration of pollutant concentration reduction.
In designing stormwater quality control measures, theemphasis is no longer on the eff icient and rapidtransfer of stormwater to the receiving waters.Instead, stormwater interception, detention/retardation and retention are principal primaryobjectives. The concept of treating the first flush iscommonly adopted in practice to achieve a high level
of cost effectiveness of the treatment measure. This isjustified by the small largely impervious catchment.
Continuous simulations have been undertaken formajor capital cities in Australia to establish therelationship between volumetric treatment efficiency,and the frequency at which the design discharge isexceeded. The volumetric treatment efficiency wasdefined as the overall expected volume of runoff(expressed as a percentage of the total expectedrunoff volume) which is conveyed into a treatmentfacility at a rate that is lower than the designdischarge of the facility. Simulations were carried outfor catchments with a range of critical stormdurations. The results presented in Figure 6.2 are forcatchments with a critical storm duration of one hour.These are applicable for most urban catchments withcritical storm durations from 15 minutes to 6 hours,and for the design of most types of stormwaterhydraulic structures, except for those involvingsignificant flow detention. The curves demonstratethat the design standard of these facility need not beset excessively high to gain significant benefits in theoverall proportion of stormwater treated.
The curves in Figure 6.2 show that all the capitalcities considered tend to follow a similar relationshipin which in excess of 95% volumetric treatmenteff iciency can be achieved by adopting a designstandard of 1 year ARI.
4 km
Figure 6.1 Schematic illustration of road horizontal alignment and location of creek
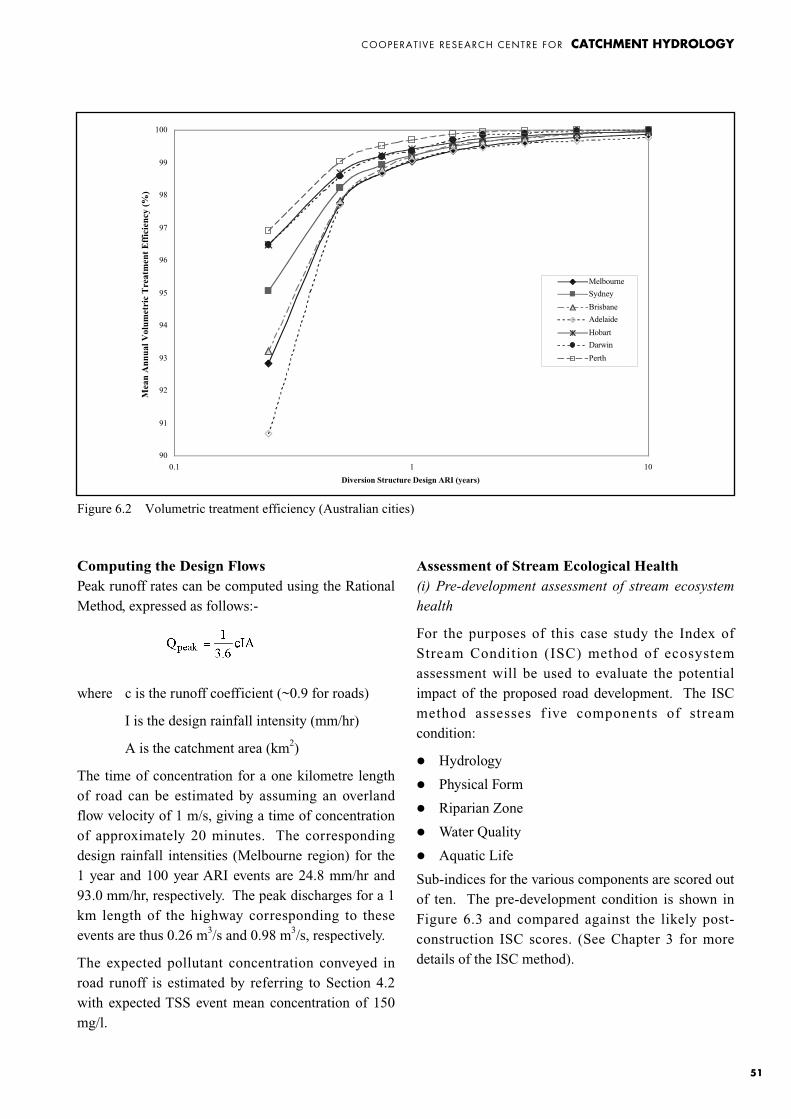
COOPERAT IVE RESEARCH CENTRE FOR CATCHMENT HYDROLOGY
51
Computing the Design FlowsPeak runoff rates can be computed using the RationalMethod, expressed as follows:-
where c is the runoff coefficient (~0.9 for roads)
I is the design rainfall intensity (mm/hr)
A is the catchment area (km2)
The time of concentration for a one kilometre lengthof road can be estimated by assuming an overlandflow velocity of 1 m/s, giving a time of concentrationof approximately 20 minutes. The correspondingdesign rainfall intensities (Melbourne region) for the1 year and 100 year ARI events are 24.8 mm/hr and93.0 mm/hr, respectively. The peak discharges for a 1km length of the highway corresponding to theseevents are thus 0.26 m3/s and 0.98 m3/s, respectively.
The expected pollutant concentration conveyed inroad runoff is estimated by referring to Section 4.2with expected TSS event mean concentration of 150mg/l.
Assessment of Stream Ecological Health(i) Pre-development assessment of stream ecosystem
health
For the purposes of this case study the Index ofStream Condition (ISC) method of ecosystemassessment will be used to evaluate the potentialimpact of the proposed road development. The ISCmethod assesses f ive components of streamcondition:
� Hydrology
� Physical Form
� Riparian Zone
� Water Quality
� Aquatic Life
Sub-indices for the various components are scored outof ten. The pre-development condition is shown inFigure 6.3 and compared against the likely post-construction ISC scores. (See Chapter 3 for moredetails of the ISC method).
90
91
92
93
94
95
96
97
98
99
100
0.1 1 10
Diversion Structure Design ARI (years)
Mea
n A
nnua
l Vol
umet
ric
Tre
atm
ent
Eff
icie
ncy
(%)
Melbourne
Sydney
Brisbane
Adelaide
Hobart
Darwin
Perth
Figure 6.2 Volumetric treatment efficiency (Australian cities)
Mea
n A
nnua
l Vol
umet
ric
Tre
atm
ent
Eff
icie
ncy
(%)
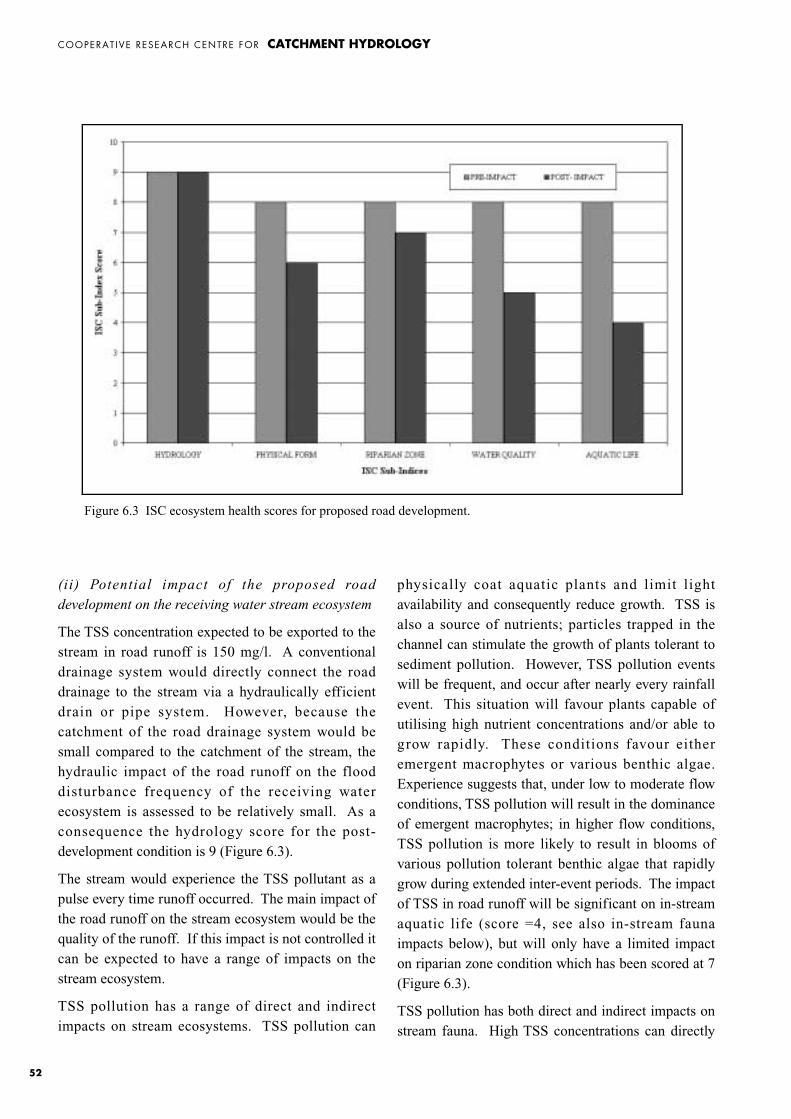
COOPERAT IVE RESEARCH CENTRE FOR CATCHMENT HYDROLOGY
52
(ii) Potential impact of the proposed road
development on the receiving water stream ecosystem
The TSS concentration expected to be exported to thestream in road runoff is 150 mg/l. A conventionaldrainage system would directly connect the roaddrainage to the stream via a hydraulically efficientdrain or pipe system. However, because thecatchment of the road drainage system would besmall compared to the catchment of the stream, thehydraulic impact of the road runoff on the flooddisturbance frequency of the receiving waterecosystem is assessed to be relatively small. As aconsequence the hydrology score for the post-development condition is 9 (Figure 6.3).
The stream would experience the TSS pollutant as apulse every time runoff occurred. The main impact ofthe road runoff on the stream ecosystem would be thequality of the runoff. If this impact is not controlled itcan be expected to have a range of impacts on thestream ecosystem.
TSS pollution has a range of direct and indirectimpacts on stream ecosystems. TSS pollution can
physically coat aquatic plants and limit lightavailability and consequently reduce growth. TSS isalso a source of nutrients; particles trapped in thechannel can stimulate the growth of plants tolerant tosediment pollution. However, TSS pollution eventswill be frequent, and occur after nearly every rainfallevent. This situation will favour plants capable ofutilising high nutrient concentrations and/or able togrow rapidly. These conditions favour eitheremergent macrophytes or various benthic algae.Experience suggests that, under low to moderate flowconditions, TSS pollution will result in the dominanceof emergent macrophytes; in higher flow conditions,TSS pollution is more likely to result in blooms ofvarious pollution tolerant benthic algae that rapidlygrow during extended inter-event periods. The impactof TSS in road runoff will be significant on in-streamaquatic life (score =4, see also in-stream faunaimpacts below), but will only have a limited impacton riparian zone condition which has been scored at 7(Figure 6.3).
TSS pollution has both direct and indirect impacts onstream fauna. High TSS concentrations can directly
Figure 6.3 ISC ecosystem health scores for proposed road development.
COOPERAT IVE RESEARCH CENTRE FOR CATCHMENT HYDROLOGY
53
affect fauna by fouling invertebrate and fish gills andinterrupting gas exchange processes. Many streamfauna feed by capturing particles from the watercolumn; high TSS concentrations can seriouslyinterrupt this process and reduce the effectiveness offilter feeding strategies. Fauna that graze on surfacesin the stream may also have the quantity of surfaceavailable food decreased by excessive TSS deposition.Predatory animals that rely on visual cues are alsodisadvantages by frequent increases in turbidity thatreduce the success of visual predatory activities.
Stream fauna are also indirectly impacted by TSSpollution because of its effect on their habitat. Instreams with riffles, the spaces between the rifflesubstrata tend to trap particles and get filled up. Thisseverely affects the hydraulic and gaseous exchangerates in riffles and favours animals capable oftolerating low DO conditions. Similarly, stream faunaalso respond to the TSS pollution induced changes instream flora. For example, where a riffle has trappedsediment and been over-growing by f ilamentousalgae, much of the benthic fauna will be utilising thealgae as both food and habitat. However this is a verytemporary habitat, which gets washed away in stormevents.
TSS pollution from roads is also a transport mediumfor toxic pollutants such as heavy metals. Clearly,when TSS from road runoff is deposited or trapped inthe channel there will be some impact from the toxicmaterials adsorbed to the particles. While the roadrunoff TSS would have some impact on the conditionof riffle habitats, its overall impact on the physicalform of the channel is moderate; hence, post-development physical form has been scored at 6.However, from the above discussion above it is clearthat the physical impact of TSS on specific in-streambiota and their habitat can be severe; hence, the post-development aquatic life score has been reduced to 4(Figure 6.3).
From theory and practical experience it is quite clearthat, if TSS concentrations of 150 mg/l fromintermittent road runoff was allowed to enter a streamecosystem, signif icant impact would occur.Experience suggests that, if concentrations entering
the stream in events less than 0.5 year ARI event arecontrolled to 25 mg/l, major impacts can be reduced(ANZECC 1992, EPA SEPPs).
Establishing Runoff Management TargetsIt is evident from the above assessment of streamecological health that the likely impact of theproposed road is the degradation of water quality inthe receiving waters. The contribution of theproposed road to any increase in flows in the creek isexpected to be marginal, owing to the proposed roadconstituting only a small percentage of the totalcatchment area of the creek. The frequency in habitatdisturbance is not expected to be significantly altered;it will be confined to the immediate vicinity of thestormwater discharge points, as a result of theproposed road. However, the road will be a highpollutant source; the possible impact of this on theecological health downstream was clearly outlined inthe previous section. There is a public goodobligation on road authorities to implement roadmanagement measures to reduce the export of roadrunoff contaminants to the receiving waters. Thesemeasures will often have an inherent flow attenuationfunction. They will therefore have the added effect ofreducing any increase in flows, and consequentlyhabitat disturbances, in the immediate vicinity of thestormwater discharge points in the creek.
Target water quality will follow that recommended inthe ANZECC guidelines. For this case study, TSS isused as a reference water quality constituent and thetarget TSS outflow concentration is 25 mg/l.
Option 1 – Buffer StripStormwater management with this option involve thedischarge of road runoff laterally to the creek via abuffer strip, as illustrated in Figures 6.4 and 6.5.Stormwater flows as overland sheet flow over adensely vegetated buffer strip; the strip can beexpected to promote removal efficiency of TSS inroad runoff of the order of 30% to 60% whendesigned appropriately. Conditions limiting theeffectiveness of buffer strips are the slope and terrainof the buffer zone. Removal eff iciency of f ineparticulates by buffer strips is expected to be low (lessthan 30% under design flow conditions); buffer strips
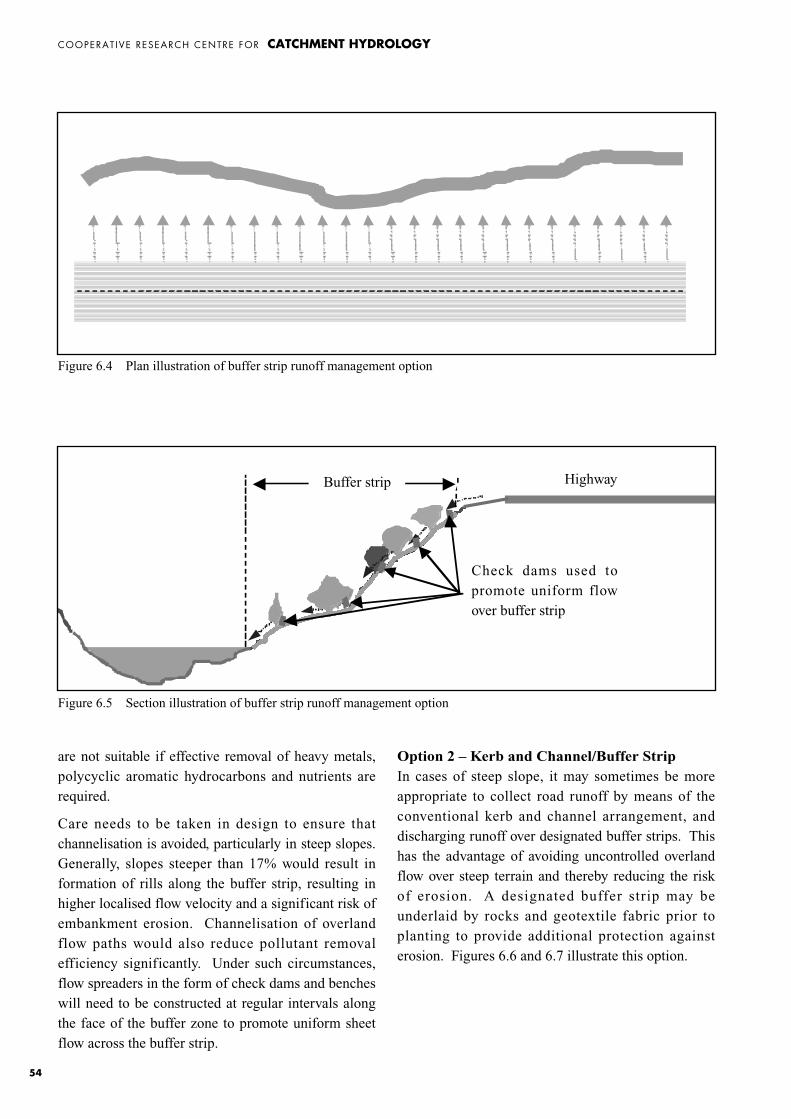
COOPERAT IVE RESEARCH CENTRE FOR CATCHMENT HYDROLOGY
54
are not suitable if effective removal of heavy metals,polycyclic aromatic hydrocarbons and nutrients arerequired.
Care needs to be taken in design to ensure thatchannelisation is avoided, particularly in steep slopes.Generally, slopes steeper than 17% would result information of rills along the buffer strip, resulting inhigher localised flow velocity and a significant risk ofembankment erosion. Channelisation of overlandflow paths would also reduce pollutant removalefficiency significantly. Under such circumstances,flow spreaders in the form of check dams and bencheswill need to be constructed at regular intervals alongthe face of the buffer zone to promote uniform sheetflow across the buffer strip.
Option 2 – Kerb and Channel/Buffer Strip In cases of steep slope, it may sometimes be moreappropriate to collect road runoff by means of theconventional kerb and channel arrangement, anddischarging runoff over designated buffer strips. Thishas the advantage of avoiding uncontrolled overlandflow over steep terrain and thereby reducing the riskof erosion. A designated buffer strip may beunderlaid by rocks and geotextile fabric prior toplanting to provide additional protection againsterosion. Figures 6.6 and 6.7 illustrate this option.
Figure 6.4 Plan illustration of buffer strip runoff management option
HighwayBufferStrip
Check Dams usedto promote uniformflow over buffert i
Figure 6.5 Section illustration of buffer strip runoff management option
Buffer strip Highway
Check dams used topromote uniform flowover buffer strip
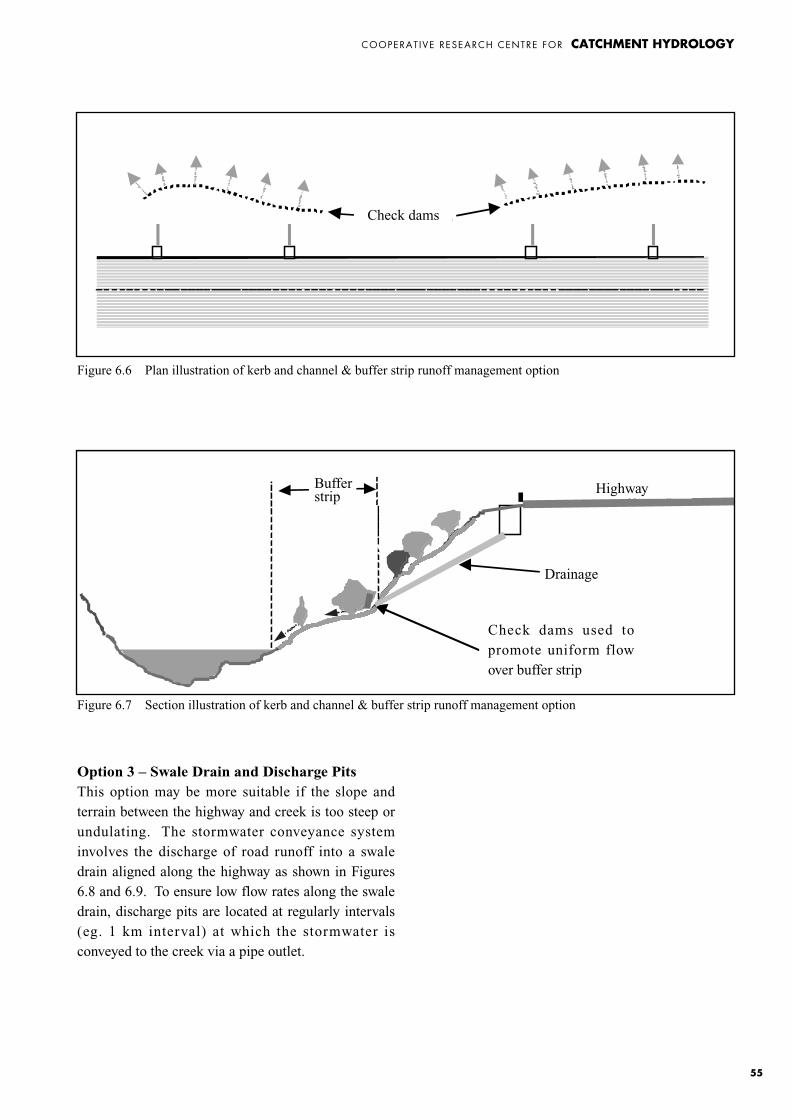
COOPERAT IVE RESEARCH CENTRE FOR CATCHMENT HYDROLOGY
55
Option 3 – Swale Drain and Discharge PitsThis option may be more suitable if the slope andterrain between the highway and creek is too steep orundulating. The stormwater conveyance systeminvolves the discharge of road runoff into a swaledrain aligned along the highway as shown in Figures6.8 and 6.9. To ensure low flow rates along the swaledrain, discharge pits are located at regularly intervals(eg. 1 km interval) at which the stormwater isconveyed to the creek via a pipe outlet.
Check Dams
Figure 6.6 Plan illustration of kerb and channel & buffer strip runoff management option
HighwayBufferStrip
Check Dam used topromote uniformflow over buffer
i
Drainage
Figure 6.7 Section illustration of kerb and channel & buffer strip runoff management option
Bufferstrip
Highway
Check dams used topromote uniform flowover buffer strip
Drainage
Check dams
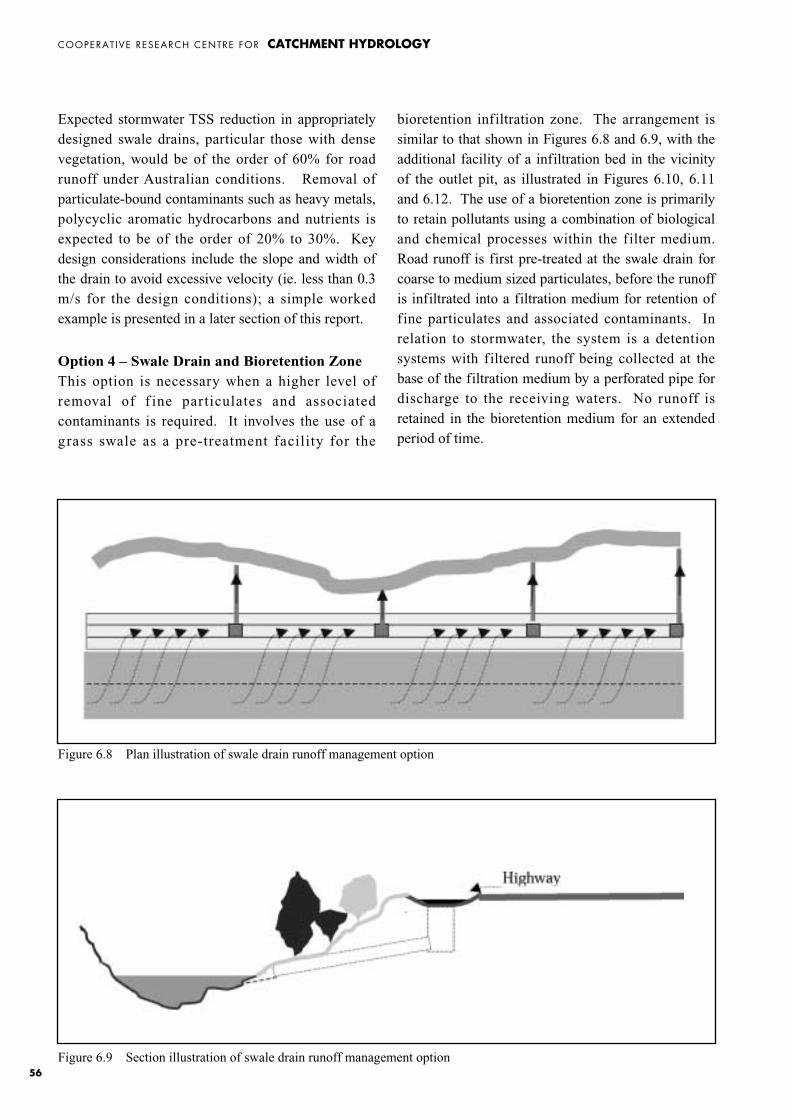
COOPERAT IVE RESEARCH CENTRE FOR CATCHMENT HYDROLOGY
56
Expected stormwater TSS reduction in appropriatelydesigned swale drains, particular those with densevegetation, would be of the order of 60% for roadrunoff under Australian conditions. Removal ofparticulate-bound contaminants such as heavy metals,polycyclic aromatic hydrocarbons and nutrients isexpected to be of the order of 20% to 30%. Keydesign considerations include the slope and width ofthe drain to avoid excessive velocity (ie. less than 0.3m/s for the design conditions); a simple workedexample is presented in a later section of this report.
Option 4 – Swale Drain and Bioretention ZoneThis option is necessary when a higher level ofremoval of f ine particulates and associatedcontaminants is required. It involves the use of agrass swale as a pre-treatment facility for the
bioretention infiltration zone. The arrangement issimilar to that shown in Figures 6.8 and 6.9, with theadditional facility of a infiltration bed in the vicinityof the outlet pit, as illustrated in Figures 6.10, 6.11and 6.12. The use of a bioretention zone is primarilyto retain pollutants using a combination of biologicaland chemical processes within the filter medium.Road runoff is first pre-treated at the swale drain forcoarse to medium sized particulates, before the runoffis infiltrated into a filtration medium for retention offine particulates and associated contaminants. Inrelation to stormwater, the system is a detentionsystems with filtered runoff being collected at thebase of the filtration medium by a perforated pipe fordischarge to the receiving waters. No runoff isretained in the bioretention medium for an extendedperiod of time.
Figure 6.8 Plan illustration of swale drain runoff management option
Figure 6.9 Section illustration of swale drain runoff management option
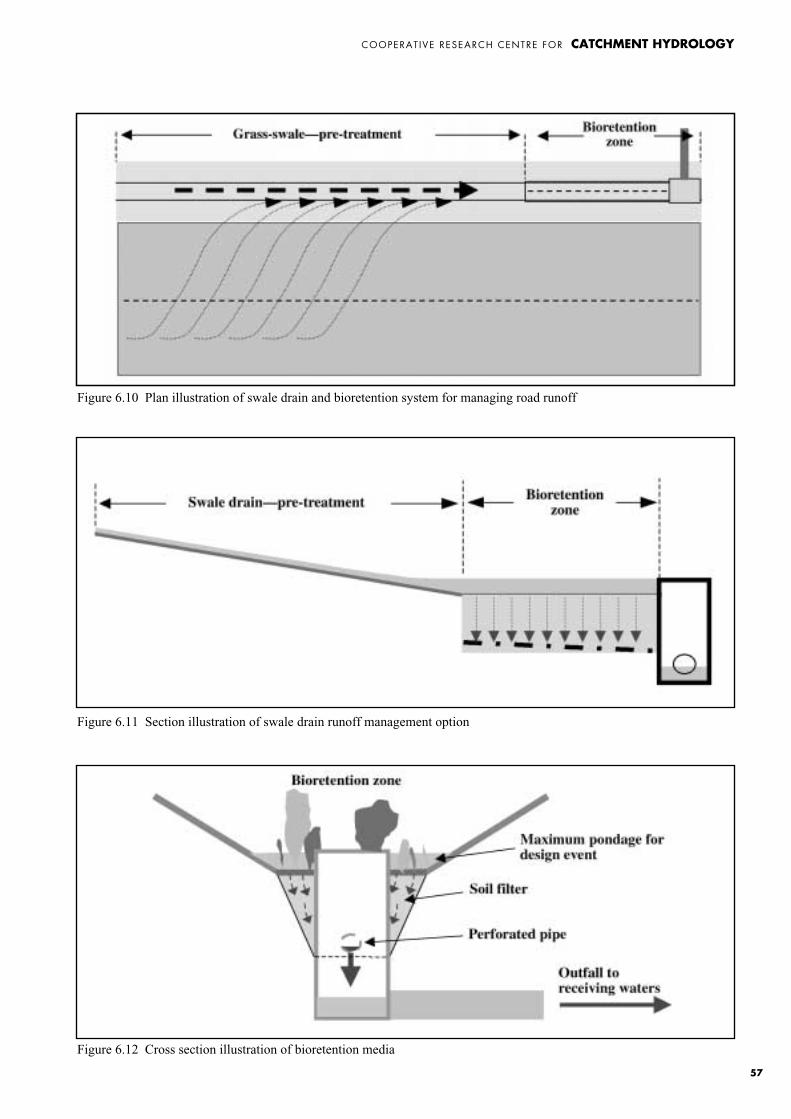
COOPERAT IVE RESEARCH CENTRE FOR CATCHMENT HYDROLOGY
57
Figure 6.10 Plan illustration of swale drain and bioretention system for managing road runoff
Figure 6.11 Section illustration of swale drain runoff management option
Figure 6.12 Cross section illustration of bioretention media
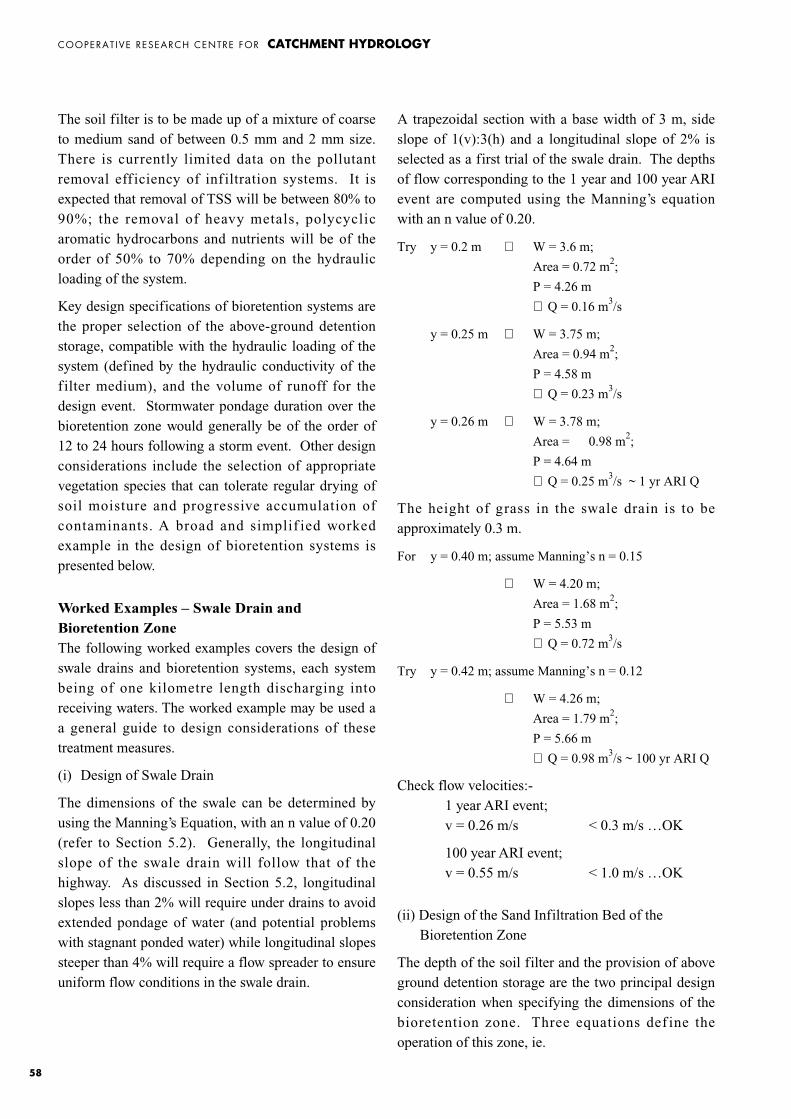
COOPERAT IVE RESEARCH CENTRE FOR CATCHMENT HYDROLOGY
58
The soil filter is to be made up of a mixture of coarseto medium sand of between 0.5 mm and 2 mm size.There is currently limited data on the pollutantremoval eff iciency of inf iltration systems. It isexpected that removal of TSS will be between 80% to90%; the removal of heavy metals, polycyclicaromatic hydrocarbons and nutrients will be of theorder of 50% to 70% depending on the hydraulicloading of the system.
Key design specifications of bioretention systems arethe proper selection of the above-ground detentionstorage, compatible with the hydraulic loading of thesystem (defined by the hydraulic conductivity of thefilter medium), and the volume of runoff for thedesign event. Stormwater pondage duration over thebioretention zone would generally be of the order of12 to 24 hours following a storm event. Other designconsiderations include the selection of appropriatevegetation species that can tolerate regular drying ofsoil moisture and progressive accumulation ofcontaminants. A broad and simplif ied workedexample in the design of bioretention systems ispresented below.
Worked Examples – Swale Drain andBioretention ZoneThe following worked examples covers the design ofswale drains and bioretention systems, each systembeing of one kilometre length discharging intoreceiving waters. The worked example may be used aa general guide to design considerations of thesetreatment measures.
(i) Design of Swale Drain
The dimensions of the swale can be determined byusing the Manning’s Equation, with an n value of 0.20(refer to Section 5.2). Generally, the longitudinalslope of the swale drain will follow that of thehighway. As discussed in Section 5.2, longitudinalslopes less than 2% will require under drains to avoidextended pondage of water (and potential problemswith stagnant ponded water) while longitudinal slopessteeper than 4% will require a flow spreader to ensureuniform flow conditions in the swale drain.
A trapezoidal section with a base width of 3 m, sideslope of 1(v):3(h) and a longitudinal slope of 2% isselected as a first trial of the swale drain. The depthsof flow corresponding to the 1 year and 100 year ARIevent are computed using the Manning’s equationwith an n value of 0.20.
Try y = 0.2 m ⇒ W = 3.6 m;
Area = 0.72 m2;
P = 4.26 m
∴ Q = 0.16 m3/s
y = 0.25 m ⇒ W = 3.75 m;
Area = 0.94 m2;
P = 4.58 m
∴ Q = 0.23 m3/s
y = 0.26 m ⇒ W = 3.78 m;
Area = 0.98 m2;
P = 4.64 m
∴ Q = 0.25 m3/s ~ 1 yr ARI Q
The height of grass in the swale drain is to beapproximately 0.3 m.
For y = 0.40 m; assume Manning’s n = 0.15
⇒ W = 4.20 m;
Area = 1.68 m2;
P = 5.53 m
∴ Q = 0.72 m3/s
Try y = 0.42 m; assume Manning’s n = 0.12
⇒ W = 4.26 m;
Area = 1.79 m2;
P = 5.66 m
∴ Q = 0.98 m3/s ~ 100 yr ARI Q
Check flow velocities:- 1 year ARI event;v = 0.26 m/s < 0.3 m/s …OK
100 year ARI event; v = 0.55 m/s < 1.0 m/s …OK
(ii) Design of the Sand Infiltration Bed of theBioretention Zone
The depth of the soil filter and the provision of aboveground detention storage are the two principal designconsideration when specifying the dimensions of thebioretention zone. Three equations def ine theoperation of this zone, ie.
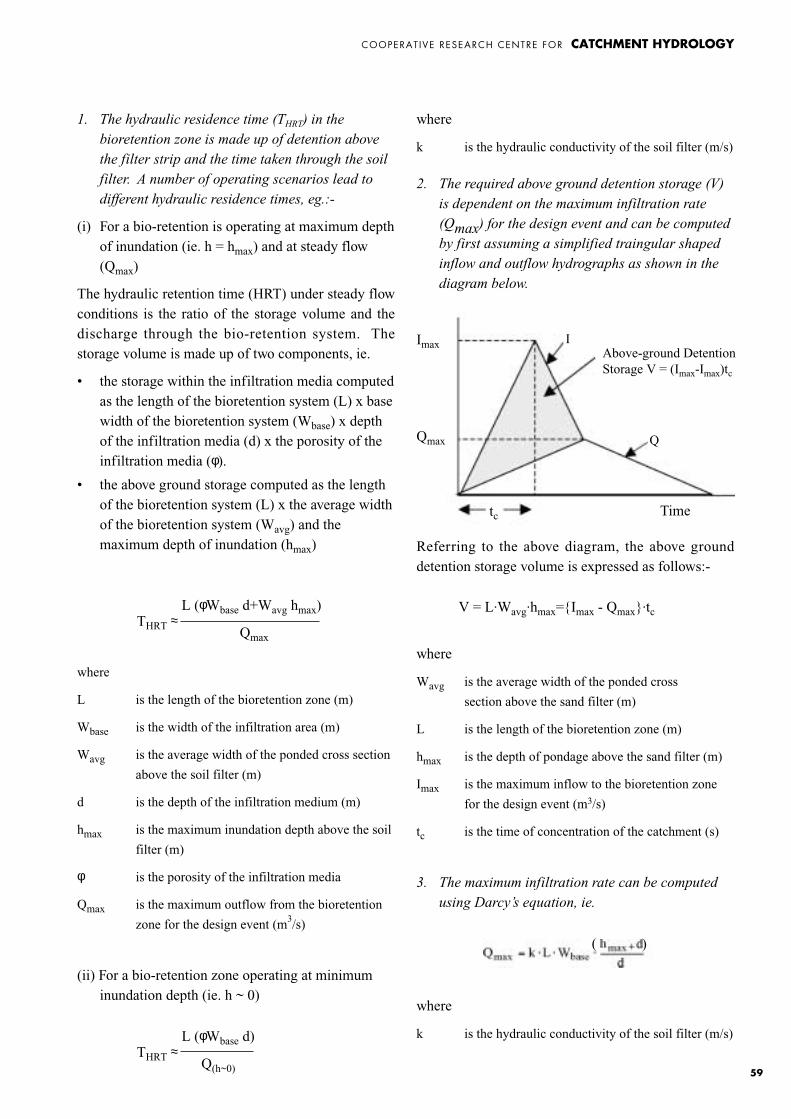
COOPERAT IVE RESEARCH CENTRE FOR CATCHMENT HYDROLOGY
59
1. The hydraulic residence time (THRT) in the
bioretention zone is made up of detention above
the filter strip and the time taken through the soil
filter. A number of operating scenarios lead to
different hydraulic residence times, eg.:-
(i) For a bio-retention is operating at maximum depthof inundation (ie. h = hmax) and at steady flow(Qmax)
The hydraulic retention time (HRT) under steady flowconditions is the ratio of the storage volume and thedischarge through the bio-retention system. Thestorage volume is made up of two components, ie.
• the storage within the infiltration media computedas the length of the bioretention system (L) x basewidth of the bioretention system (Wbase) x depthof the infiltration media (d) x the porosity of theinfiltration media (φ).
• the above ground storage computed as the lengthof the bioretention system (L) x the average widthof the bioretention system (Wavg) and themaximum depth of inundation (hmax)
where
L is the length of the bioretention zone (m)
Wbase is the width of the infiltration area (m)
Wavg is the average width of the ponded cross section
above the soil filter (m)
d is the depth of the infiltration medium (m)
hmax is the maximum inundation depth above the soil
filter (m)
φ is the porosity of the infiltration media
Qmax is the maximum outflow from the bioretention
zone for the design event (m3/s)
(ii) For a bio-retention zone operating at minimuminundation depth (ie. h ~ 0)
where
k is the hydraulic conductivity of the soil filter (m/s)
2. The required above ground detention storage (V)
is dependent on the maximum infiltration rate
(Qmax) for the design event and can be computed
by first assuming a simplified traingular shaped
inflow and outflow hydrographs as shown in the
diagram below.
Referring to the above diagram, the above grounddetention storage volume is expressed as follows:-
where
Wavg is the average width of the ponded cross
section above the sand filter (m)
L is the length of the bioretention zone (m)
hmax is the depth of pondage above the sand filter (m)
Imax is the maximum inflow to the bioretention zone
for the design event (m3/s)
tc is the time of concentration of the catchment (s)
3. The maximum infiltration rate can be computed
using Darcy’s equation, ie.
where
k is the hydraulic conductivity of the soil filter (m/s)
V = L.Wavg.hmax={Imax - Qmax}.tc
THRT ≈L (φWbase d+Wavg hmax)
Qmax
THRT ≈L (φWbase d)
Q(h~0)
Imax
Qmax
tc Time
Above-ground DetentionStorage V = (Imax-Imax)tc
I
Q
( )
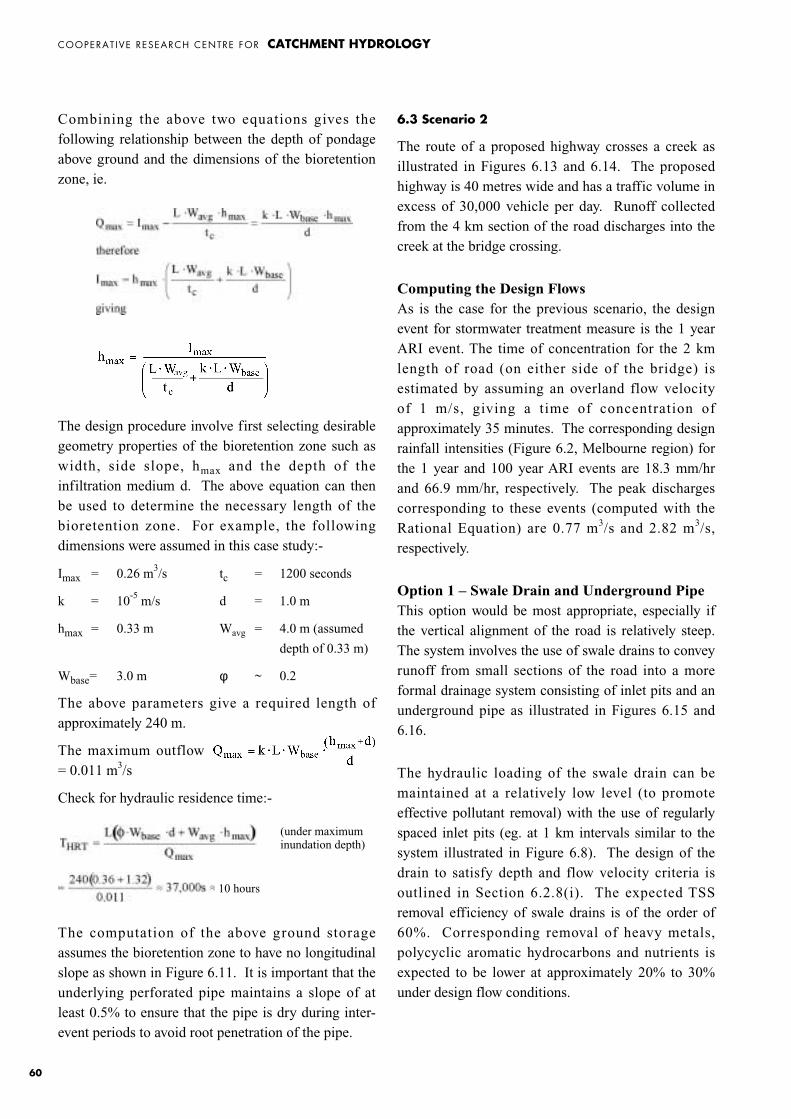
COOPERAT IVE RESEARCH CENTRE FOR CATCHMENT HYDROLOGY
60
Combining the above two equations gives thefollowing relationship between the depth of pondageabove ground and the dimensions of the bioretentionzone, ie.
The design procedure involve first selecting desirablegeometry properties of the bioretention zone such aswidth, side slope, hmax and the depth of theinfiltration medium d. The above equation can thenbe used to determine the necessary length of thebioretention zone. For example, the followingdimensions were assumed in this case study:-
Imax = 0.26 m3/s tc = 1200 seconds
k = 10-5 m/s d = 1.0 m
hmax = 0.33 m Wavg = 4.0 m (assumed
depth of 0.33 m)
Wbase= 3.0 m φ ~ 0.2
The above parameters give a required length ofapproximately 240 m.
The maximum outflow= 0.011 m3/s
Check for hydraulic residence time:-
The computation of the above ground storageassumes the bioretention zone to have no longitudinalslope as shown in Figure 6.11. It is important that theunderlying perforated pipe maintains a slope of atleast 0.5% to ensure that the pipe is dry during inter-event periods to avoid root penetration of the pipe.
6.3 Scenario 2
The route of a proposed highway crosses a creek asillustrated in Figures 6.13 and 6.14. The proposedhighway is 40 metres wide and has a traffic volume inexcess of 30,000 vehicle per day. Runoff collectedfrom the 4 km section of the road discharges into thecreek at the bridge crossing.
Computing the Design FlowsAs is the case for the previous scenario, the designevent for stormwater treatment measure is the 1 yearARI event. The time of concentration for the 2 kmlength of road (on either side of the bridge) isestimated by assuming an overland flow velocityof 1 m/s, giving a time of concentration ofapproximately 35 minutes. The corresponding designrainfall intensities (Figure 6.2, Melbourne region) forthe 1 year and 100 year ARI events are 18.3 mm/hrand 66.9 mm/hr, respectively. The peak dischargescorresponding to these events (computed with theRational Equation) are 0.77 m3/s and 2.82 m3/s,respectively.
Option 1 – Swale Drain and Underground PipeThis option would be most appropriate, especially ifthe vertical alignment of the road is relatively steep.The system involves the use of swale drains to conveyrunoff from small sections of the road into a moreformal drainage system consisting of inlet pits and anunderground pipe as illustrated in Figures 6.15 and6.16.
The hydraulic loading of the swale drain can bemaintained at a relatively low level (to promoteeffective pollutant removal) with the use of regularlyspaced inlet pits (eg. at 1 km intervals similar to thesystem illustrated in Figure 6.8). The design of thedrain to satisfy depth and flow velocity criteria isoutlined in Section 6.2.8(i). The expected TSSremoval efficiency of swale drains is of the order of60%. Corresponding removal of heavy metals,polycyclic aromatic hydrocarbons and nutrients isexpected to be lower at approximately 20% to 30%under design flow conditions.
10 hours
(under maximuminundation depth)
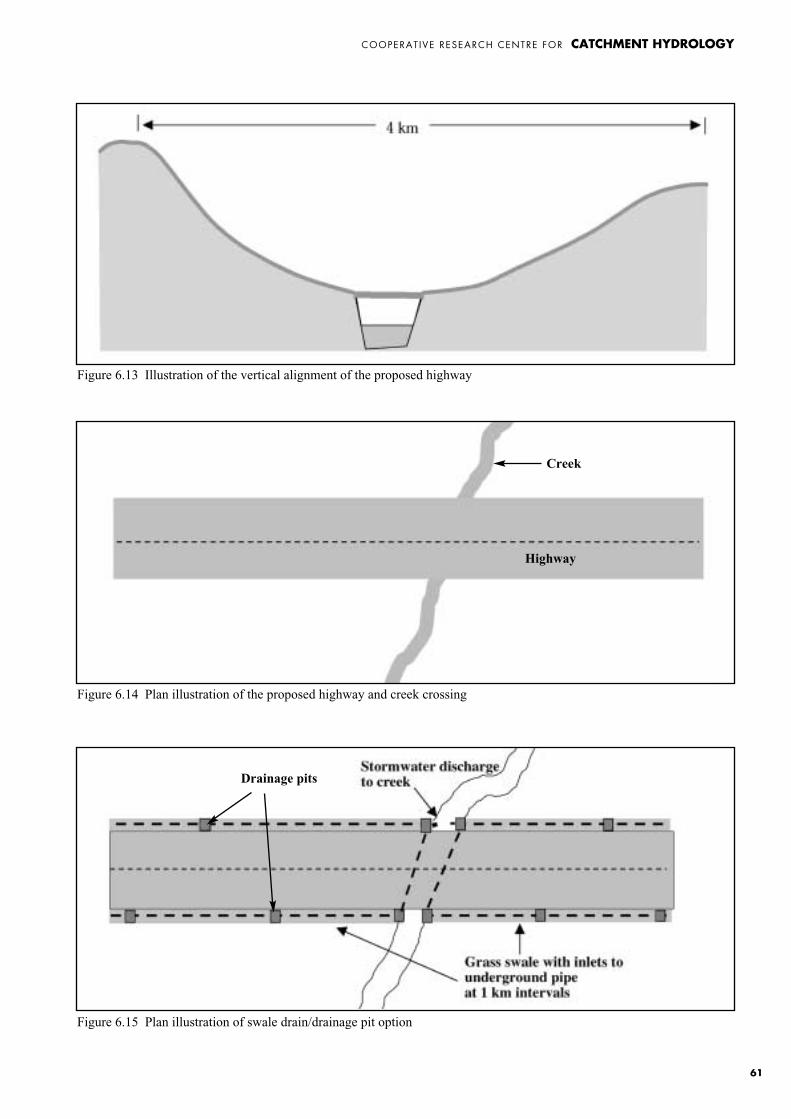
COOPERAT IVE RESEARCH CENTRE FOR CATCHMENT HYDROLOGY
61
Figure 6.13 Illustration of the vertical alignment of the proposed highway
Figure 6.14 Plan illustration of the proposed highway and creek crossing
Figure 6.15 Plan illustration of swale drain/drainage pit option
Creek
Highway
Drainage pits
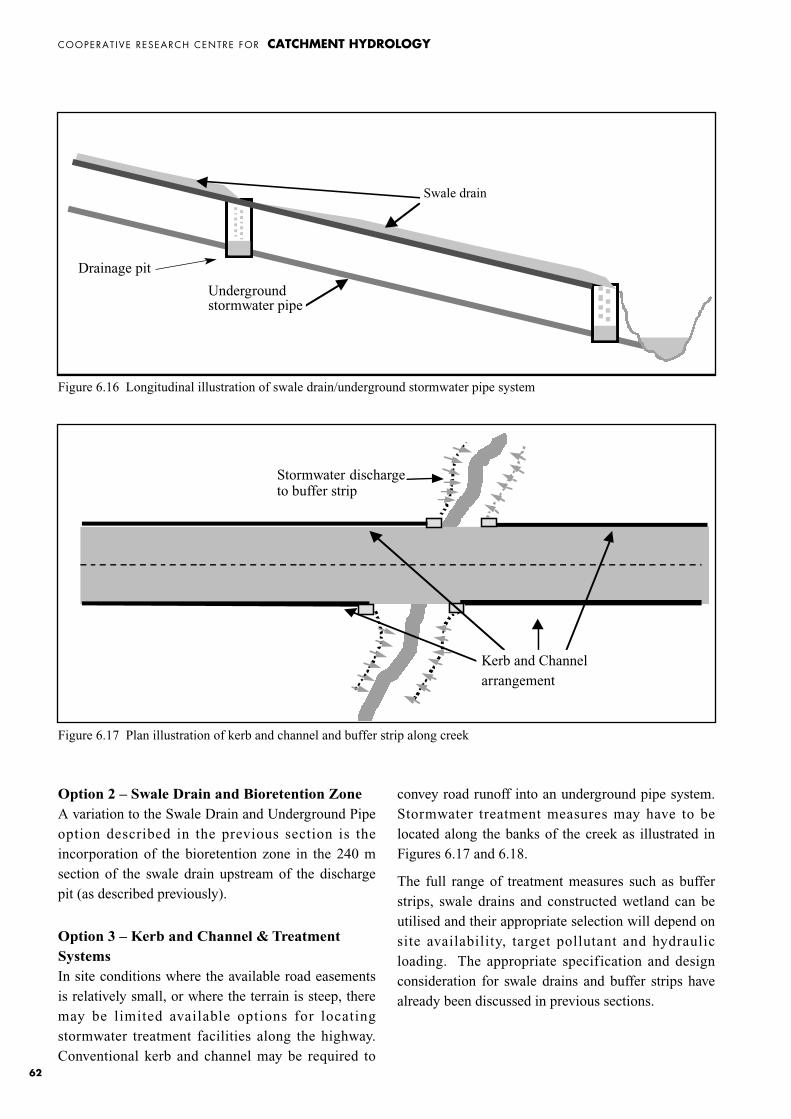
COOPERAT IVE RESEARCH CENTRE FOR CATCHMENT HYDROLOGY
62
Option 2 – Swale Drain and Bioretention ZoneA variation to the Swale Drain and Underground Pipeoption described in the previous section is theincorporation of the bioretention zone in the 240 msection of the swale drain upstream of the dischargepit (as described previously).
Option 3 – Kerb and Channel & TreatmentSystemsIn site conditions where the available road easementsis relatively small, or where the terrain is steep, theremay be limited available options for locatingstormwater treatment facilities along the highway.Conventional kerb and channel may be required to
convey road runoff into an underground pipe system.Stormwater treatment measures may have to belocated along the banks of the creek as illustrated inFigures 6.17 and 6.18.
The full range of treatment measures such as bufferstrips, swale drains and constructed wetland can beutilised and their appropriate selection will depend onsite availability, target pollutant and hydraulicloading. The appropriate specification and designconsideration for swale drains and buffer strips havealready been discussed in previous sections.
Swale Drain
UndergroundStormwaterPipe
Kerb and ChannelArrangement
Stormwater Dischargeto Buffer Strip
Figure 6.16 Longitudinal illustration of swale drain/underground stormwater pipe system
Undergroundstormwater pipe
Swale drain
Stormwater dischargeto buffer strip
Kerb and Channelarrangement
Figure 6.17 Plan illustration of kerb and channel and buffer strip along creek
Drainage pit
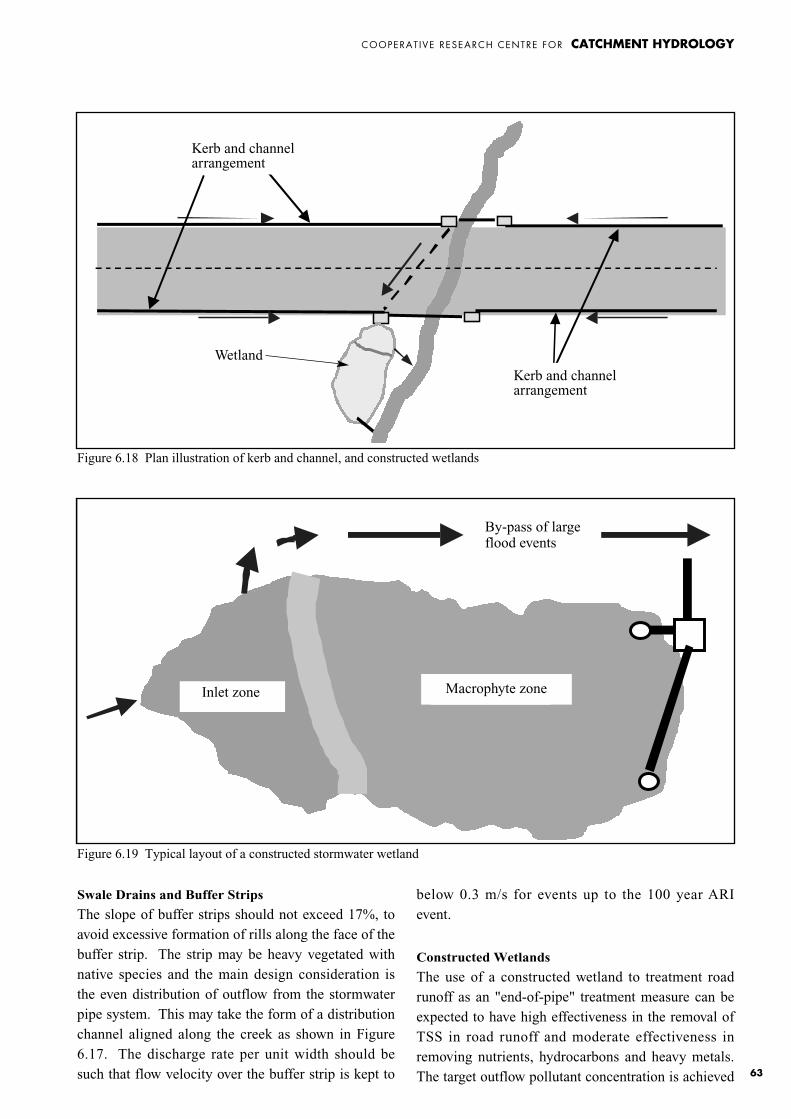
COOPERAT IVE RESEARCH CENTRE FOR CATCHMENT HYDROLOGY
63
Swale Drains and Buffer Strips
The slope of buffer strips should not exceed 17%, toavoid excessive formation of rills along the face of thebuffer strip. The strip may be heavy vegetated withnative species and the main design consideration isthe even distribution of outflow from the stormwaterpipe system. This may take the form of a distributionchannel aligned along the creek as shown in Figure6.17. The discharge rate per unit width should besuch that flow velocity over the buffer strip is kept to
below 0.3 m/s for events up to the 100 year ARIevent.
Constructed Wetlands
The use of a constructed wetland to treatment roadrunoff as an "end-of-pipe" treatment measure can beexpected to have high effectiveness in the removal ofTSS in road runoff and moderate effectiveness inremoving nutrients, hydrocarbons and heavy metals.The target outflow pollutant concentration is achieved
Kerb andChannelArrangement
Kerb and ChannelArrangement
MacrophytesZ
Inlet Zone
By-pass of LargeFlood Events
Kerb and channelarrangement
Kerb and channelarrangement
Figure 6.18 Plan illustration of kerb and channel, and constructed wetlands
Figure 6.19 Typical layout of a constructed stormwater wetland
Inlet zone Macrophyte zone
By-pass of largeflood events
Wetland
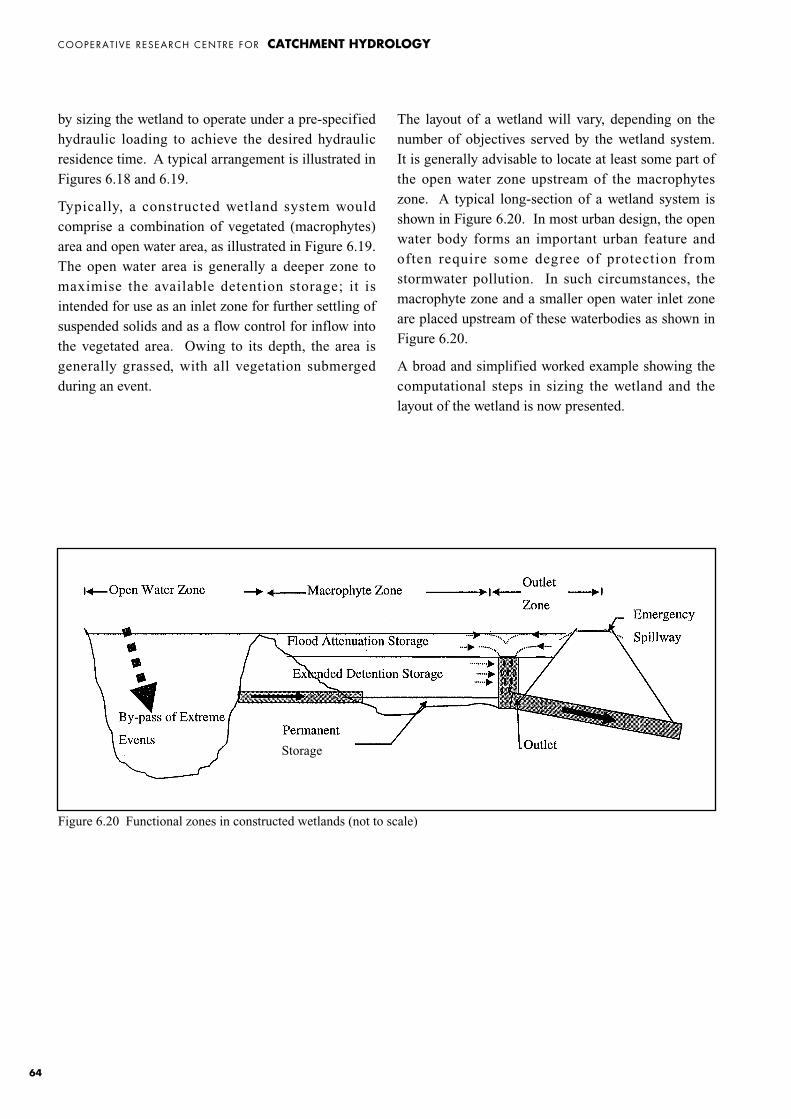
COOPERAT IVE RESEARCH CENTRE FOR CATCHMENT HYDROLOGY
64
by sizing the wetland to operate under a pre-specifiedhydraulic loading to achieve the desired hydraulicresidence time. A typical arrangement is illustrated inFigures 6.18 and 6.19.
Typically, a constructed wetland system wouldcomprise a combination of vegetated (macrophytes)area and open water area, as illustrated in Figure 6.19.The open water area is generally a deeper zone tomaximise the available detention storage; it isintended for use as an inlet zone for further settling ofsuspended solids and as a flow control for inflow intothe vegetated area. Owing to its depth, the area isgenerally grassed, with all vegetation submergedduring an event.
The layout of a wetland will vary, depending on thenumber of objectives served by the wetland system.It is generally advisable to locate at least some part ofthe open water zone upstream of the macrophyteszone. A typical long-section of a wetland system isshown in Figure 6.20. In most urban design, the openwater body forms an important urban feature andoften require some degree of protection fromstormwater pollution. In such circumstances, themacrophyte zone and a smaller open water inlet zoneare placed upstream of these waterbodies as shown inFigure 6.20.
A broad and simplified worked example showing thecomputational steps in sizing the wetland and thelayout of the wetland is now presented.
Figure 6.20 Functional zones in constructed wetlands (not to scale)
Storage
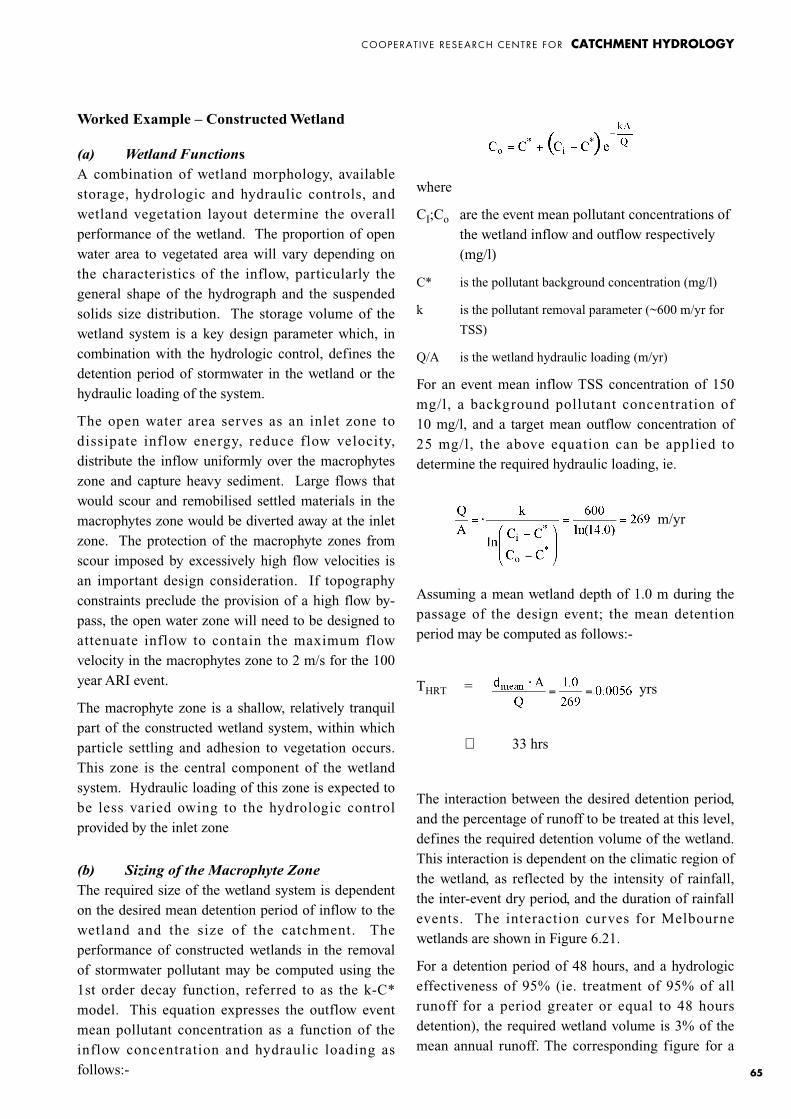
COOPERAT IVE RESEARCH CENTRE FOR CATCHMENT HYDROLOGY
65
Worked Example – Constructed Wetland
(a) Wetland FunctionsA combination of wetland morphology, availablestorage, hydrologic and hydraulic controls, andwetland vegetation layout determine the overallperformance of the wetland. The proportion of openwater area to vegetated area will vary depending onthe characteristics of the inflow, particularly thegeneral shape of the hydrograph and the suspendedsolids size distribution. The storage volume of thewetland system is a key design parameter which, incombination with the hydrologic control, defines thedetention period of stormwater in the wetland or thehydraulic loading of the system.
The open water area serves as an inlet zone todissipate inflow energy, reduce flow velocity,distribute the inflow uniformly over the macrophyteszone and capture heavy sediment. Large flows thatwould scour and remobilised settled materials in themacrophytes zone would be diverted away at the inletzone. The protection of the macrophyte zones fromscour imposed by excessively high flow velocities isan important design consideration. If topographyconstraints preclude the provision of a high flow by-pass, the open water zone will need to be designed toattenuate inflow to contain the maximum flowvelocity in the macrophytes zone to 2 m/s for the 100year ARI event.
The macrophyte zone is a shallow, relatively tranquilpart of the constructed wetland system, within whichparticle settling and adhesion to vegetation occurs.This zone is the central component of the wetlandsystem. Hydraulic loading of this zone is expected tobe less varied owing to the hydrologic controlprovided by the inlet zone
(b) Sizing of the Macrophyte Zone
The required size of the wetland system is dependenton the desired mean detention period of inflow to thewetland and the size of the catchment. Theperformance of constructed wetlands in the removalof stormwater pollutant may be computed using the1st order decay function, referred to as the k-C*model. This equation expresses the outflow eventmean pollutant concentration as a function of theinflow concentration and hydraulic loading asfollows:-
where
CI;Co are the event mean pollutant concentrations of the wetland inflow and outflow respectively (mg/l)
C* is the pollutant background concentration (mg/l)
k is the pollutant removal parameter (~600 m/yr for
TSS)
Q/A is the wetland hydraulic loading (m/yr)
For an event mean inflow TSS concentration of 150mg/l, a background pollutant concentration of 10 mg/l, and a target mean outflow concentration of25 mg/l, the above equation can be applied todetermine the required hydraulic loading, ie.
m/yr
Assuming a mean wetland depth of 1.0 m during thepassage of the design event; the mean detentionperiod may be computed as follows:-
yrs
⇒ 33 hrs
The interaction between the desired detention period,and the percentage of runoff to be treated at this level,defines the required detention volume of the wetland.This interaction is dependent on the climatic region ofthe wetland, as reflected by the intensity of rainfall,the inter-event dry period, and the duration of rainfallevents. The interaction curves for Melbournewetlands are shown in Figure 6.21.
For a detention period of 48 hours, and a hydrologiceffectiveness of 95% (ie. treatment of 95% of allrunoff for a period greater or equal to 48 hoursdetention), the required wetland volume is 3% of themean annual runoff. The corresponding figure for a
THRT =
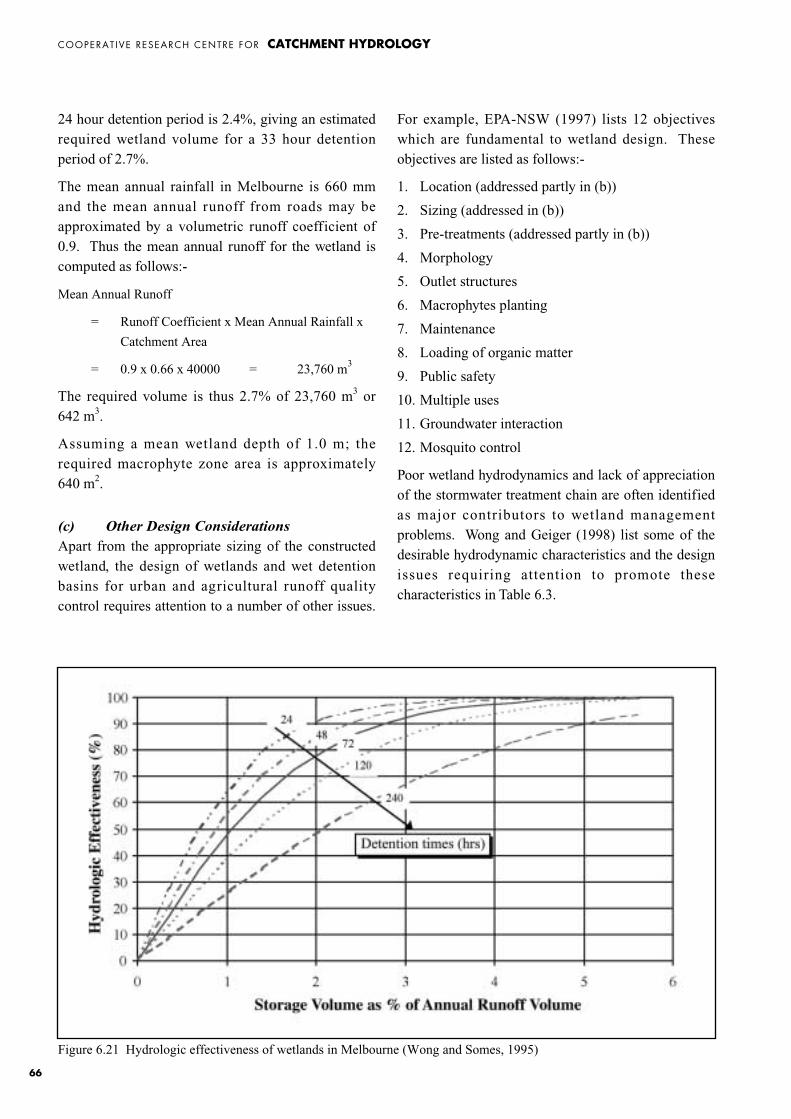
COOPERAT IVE RESEARCH CENTRE FOR CATCHMENT HYDROLOGY
66
24 hour detention period is 2.4%, giving an estimatedrequired wetland volume for a 33 hour detentionperiod of 2.7%.
The mean annual rainfall in Melbourne is 660 mmand the mean annual runoff from roads may beapproximated by a volumetric runoff coefficient of0.9. Thus the mean annual runoff for the wetland iscomputed as follows:-
Mean Annual Runoff
= Runoff Coefficient x Mean Annual Rainfall x
Catchment Area
= 0.9 x 0.66 x 40000 = 23,760 m3
The required volume is thus 2.7% of 23,760 m3 or642 m3.
Assuming a mean wetland depth of 1.0 m; therequired macrophyte zone area is approximately640 m2.
(c) Other Design Considerations
Apart from the appropriate sizing of the constructedwetland, the design of wetlands and wet detentionbasins for urban and agricultural runoff qualitycontrol requires attention to a number of other issues.
For example, EPA-NSW (1997) lists 12 objectiveswhich are fundamental to wetland design. Theseobjectives are listed as follows:-
1. Location (addressed partly in (b))
2. Sizing (addressed in (b))
3. Pre-treatments (addressed partly in (b))
4. Morphology
5. Outlet structures
6. Macrophytes planting
7. Maintenance
8. Loading of organic matter
9. Public safety
10. Multiple uses
11. Groundwater interaction
12. Mosquito control
Poor wetland hydrodynamics and lack of appreciationof the stormwater treatment chain are often identifiedas major contributors to wetland managementproblems. Wong and Geiger (1998) list some of thedesirable hydrodynamic characteristics and the designissues requiring attention to promote thesecharacteristics in Table 6.3.
Figure 6.21 Hydrologic effectiveness of wetlands in Melbourne (Wong and Somes, 1995)
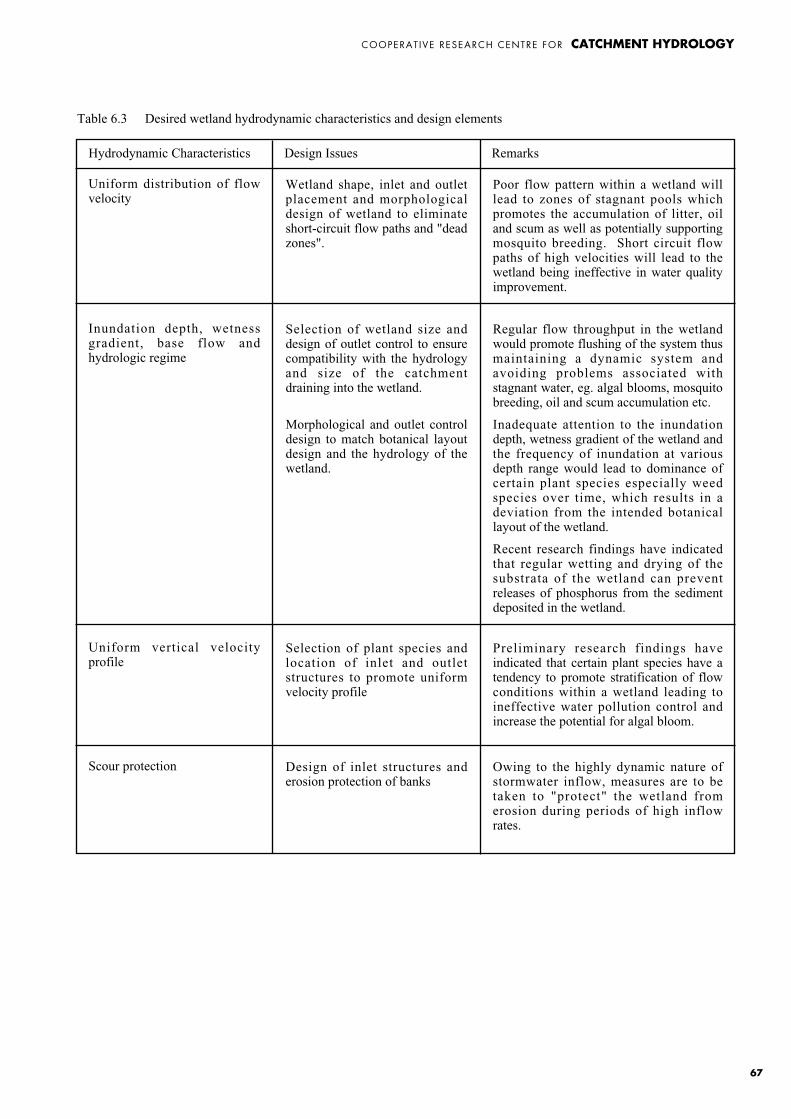
COOPERAT IVE RESEARCH CENTRE FOR CATCHMENT HYDROLOGY
67
Table 6.3 Desired wetland hydrodynamic characteristics and design elements
Hydrodynamic Characteristics Design Issues Remarks
Uniform distribution of flowvelocity
Wetland shape, inlet and outletplacement and morphologicaldesign of wetland to eliminateshort-circuit flow paths and "deadzones".
Poor flow pattern within a wetland willlead to zones of stagnant pools whichpromotes the accumulation of litter, oiland scum as well as potentially supportingmosquito breeding. Short circuit flowpaths of high velocities will lead to thewetland being ineffective in water qualityimprovement.
Inundation depth, wetnessgradient, base flow andhydrologic regime
Selection of wetland size anddesign of outlet control to ensurecompatibility with the hydrologyand size of the catchmentdraining into the wetland.
Morphological and outlet controldesign to match botanical layoutdesign and the hydrology of thewetland.
Regular flow throughput in the wetlandwould promote flushing of the system thusmaintaining a dynamic system andavoiding problems associated withstagnant water, eg. algal blooms, mosquitobreeding, oil and scum accumulation etc.
Inadequate attention to the inundationdepth, wetness gradient of the wetland andthe frequency of inundation at variousdepth range would lead to dominance ofcertain plant species especially weedspecies over time, which results in adeviation from the intended botanicallayout of the wetland.
Recent research findings have indicatedthat regular wetting and drying of thesubstrata of the wetland can preventreleases of phosphorus from the sedimentdeposited in the wetland.
Uniform vertical velocityprofile
Selection of plant species andlocation of inlet and outletstructures to promote uniformvelocity profile
Preliminary research findings haveindicated that certain plant species have atendency to promote stratification of flowconditions within a wetland leading toineffective water pollution control andincrease the potential for algal bloom.
Scour protection Design of inlet structures anderosion protection of banks
Owing to the highly dynamic nature ofstormwater inflow, measures are to betaken to "protect" the wetland fromerosion during periods of high inflowrates.

COOPERAT IVE RESEARCH CENTRE FOR CATCHMENT HYDROLOGY
68
7 Conclusion
Roads and other transport-related impervious surfacescan constitute up to 70% of the total impervious areasin an urban catchment. Road surfaces, including carparks and driveways, contribute a higher proportionof stormwater pollutants than other impervioussurfaces (eg. roof areas, pedestrian, pathways etc.)and monitoring of stormwater quality from thesesurfaces consistently show elevated concentrations ofTSS and associated contaminants such as lead, zincand copper. Limited field studies have also indicatedthat stormwater pollutant concentrations are related totraffic volumes in roads, with mean concentrations ofkey pollutants in highways with traff ic volumesgreater than 30,000 vehicles per day found to be asmuch as four times higher than roads of lower trafficvolumes. Comparison of hydrocarbons generatedfrom rural catchments with that from urban roadsindicated that road runoff hydrocarbon concentrationsare at least an order of magnitude higher. Many ofthe pollutants are associated with inorganicparticulates washed off road surfaces by stormwater.
There is increasing public concern that stormwatergenerated from urban catchments can lead tosignificant degradation of environmental values ofurban aquatic ecosystems. Water Sensitive UrbanDesign practices are being promoted in urbandevelopments to address issues of physical andbiochemical impacts of catchment urbanisation on theaquatic ecosystem. Many factors influence aquaticecosystem health but often changes in catchmenthydrology and poor stormwater quality are the maindriving factors in ecosystem health deterioration.Design options for improving the quality of roadrunoff form an important element in an integratedapproach to Water Sensitive Urban Design. Oftenthese options will also lead to reduction in peakdischarges from road surfaces. This report explored arange of stormwater quality improvement measuresthat could be incorporated into road design practices.
The options examined in this report placed particularemphasis on the removal of suspended solids as theireffective removal can often reduce a signif icantproportion of other contaminants conveyed bystormwater. Many of the options examined involvedthe use of vegetation in grassed swales, buffer strips
or constructed wetlands to facilitate removal ofsuspended solids. The principal pollutant removalmechanisms are that of f iltration, enhancedsedimentation and particle adhesion. These vegetatedsystems represent current best practice and are thesubject of extensive on-going research in Australiaand overseas, directed at further refinement of theirdesign specifications.
Other options which are considered to be effective inimproving stormwater quality of road runoff includethe promotion of infiltration through a "bioretention"media at which the principal pollutant removalmechanisms are filtration and biological uptake ofsoluble pollutants by biof ilms in the inf iltrationmedia. Depending on the site in question, treatedstormwater could either be collected by a perforatedpipe and discharged to the receiving waters or allowedto infiltrate into the surrounding soils. Pre-treatmentof stormwater to remove coarse and medium-sizedparticulates is necessary to ensure continued effectiveoperation of the infiltration system and this can beprovided by conveying stormwater to the system via agrassed swale.
This report has demonstrated, through hypotheticalcase studies and accompanying work examples, howmany stormwater quality improvement measures canbe sized and incorporated into road design. Variationsin design of the same treatment measures are appliedto suit different site conditions and other road designobjectives. Many of these measures are expected toincur marginal incremental cost to the cost of roadconstruction. Their implementation merely requiresthe road designer to consider design objectivesbeyond the traditional objectives of road engineering.
COOPERAT IVE RESEARCH CENTRE FOR CATCHMENT HYDROLOGY
69

COOPERAT IVE RESEARCH CENTRE FOR CATCHMENT HYDROLOGY
70
References
Allison, R.A., Chiew, F.H.S. and McMahon, T.A.(1997) Stormwater Gross Pollutants, CooperativeResearch Centre for Catchment Hydrology IndustryReport No. 97/11, 18p.
Allison, R.A., Walker, T.A., Chiew, F.H.S., O’Neill,I.C. and McMahon, T.A. (1998) From Roads toRivers: Gross Pollutant Removal from UrbanWaterways, Report in preparation, CooperativeResearch Centre for Catchment Hydrology, February,97p.
ANZECC (1992) Australian Water Quality Guidelinesfor Fresh and Marine Waters, Australian and NewZealand Environment and Conservation Council.
Argue, J.R. (1994) Stormwater source controlpractices for arid zone urban developments,Proceedings of the Water Sensitive Urban DesignSeminar, Perth, Australia, September pp.137-161.
Ball, J.E. and Abustan, I. (1995) An Investigation ofParticle Size Distribution during Storm Events froman Urban Catchment, Proceedings of the SecondInternational Symposium on Urban StormwaterManagement, Vol. 2, NCP No .95/03, pp 531-535.
Ball, J.E., Jenks. R. and Aubourg, D. (1996) Dryweather build up of constituents on road surfaces,Proceedings of the 7th International Conference onUrban Storm Drainage, Hannover, Germany, pp. 785-790.
Barling, R.D and Moore, I.D. (1993) The role ofbuffer strips in the management of waterwaypollution, Proceedings of The Role of Buffer Strips inthe Management of Waterway Pollution from DiffuseUrban and Rural Sources, University of Melbourne,Land and Water Resources Research andDevelopment Corporation, pp.1-45.
Bayly & Williams, W.W. (1973) Inland Waters andtheir Ecology. Longman, Australia, 316p.
Bren, L., Dyer, F., Hairsine, P., Riddiford, J.,Siriwardhena, V. And Zierholz, C. (1997) ControllingSediment and Nutrient Movement WithinCatchments, CRC for Catchment Hydrology IndustryReport 97/9, October, 22p.
Bunn, S.E., Pusey, B.J. & Price, P. Eds.(1993)Ecology and Management of Riparian Zones inAustralia. LWRRDC Canberra, Occasional PaperSeries No. 05/93, 212p.
Colandini, V. and Legret, M. (1996) Impacts ofporous pavement with reservoir structure on runoffwaters, Proceeding of the Seventh InternationalConference on Urban Stormwater Drainage,Hannover, Germany, 9-13th Sept., pp.491-496.
Collier, K.J., Cooper, A.B., Davies-Colley, R.J.,Rutherford, J.C., Smith, C.M., and Williamson, R.B.(1995) Managing riparian zones: a contribution toprotecting New Zealand’s rivers and streams. Vol. 1Concepts, New Zealand Department of Conservation,Wellington, 39p.
Colwill, G.M., Peters, C.J. and Perry, R. (1984) WaterQuality of Motorway Runoff, TRRL Supp, Rpt 823,Crowthorne, Berkshire, England.
Costanza, R., Norton, B.G. and Haskell, B.D. (1992)Ecosystem Health: New Goals for EnvironmentalManagement, Island Press, Washington, 269p.
Cullen, P. (1986) Managing nutrients in aquaticsystems: the eutrophication problem. In: De Deckker,P and Williams (Eds). Limnology in Australia,CSIRO Melbourne, pp. 539-554.
Cummins, K.W. (1993) Riparian stream linkages: in-stream issues. In: Bunn, S.E., Pusey, B.J. & Price, P.(Eds.) Ecology and Management of Riparian Zonesin Australia. LWRRDC Canberra, Occasional PaperSeries No. 05/93, pp. 5-20.
DeGroot, A.J. (1995) Metals and sediment: a globalperspective, In: A.E Herbert, Metal ContaminatedAquatic Sediment, Ann Arbor Press, Inc., pp.1-20
Dempsey, B.A., Tai, Y.L. and Harrison, S.G. (1993)Mobilisation and removal of contaminants associatedwith urban dust and dirt, Water Science Technology,28(3-5):225-230.
Drapper, D. (1998) Road Runoff Water Quality inSouth-east Queensland, Progress Report, July 1998,unpublished, report for Dept of Main Roads, Qld.
Driscoll, E., Shelley, P. And Streker, E. (1990)Pollutant Loadings and Impacts from HighwayStormwater Runoff, Vol.1, April, Federal highwayadministration.
COOPERAT IVE RESEARCH CENTRE FOR CATCHMENT HYDROLOGY
71
Geiger, W.F. (1984), Mischwasserabfluss und dessenBeschaffenheit - ein Beitrag zur Kanalnetzplanung,PhD thesis, Technical University of Munich,Publication No. 50.
Graham, R. (1989), Urban Stormwater QualityImprovement in a Detention Pond and WetlandSystem, MEngSc thesis, University of Melbourne.103p.
Greb, S.R. and Bannerman, R.T. (1997) Influence ofparticle size on wet pond effectiveness, Wat. Env. Res.69(6):1134-1138.
Harris, G.P. (1994) Nutrient loadings and algalblooms in Australian waters – a discussion paper.LWRRDC, Canberra, 99p.
Harris, G.P. (1996) Catchments and aquaticecosystems: Nutrient ratios, flow regulation andecosystem impacts in rivers like the Hawkesbury-Nepean. CRC for Freshwater Ecology, Canberra,57p.
Harris, J.H. (1995) The use of f ish in ecologicalassessment, Australian Journal of Ecology, 20 (1):65-80.
Hart, B.T. (1974) A compilation of Australian waterquality criteria. Australian Water Resources Council,Technical Paper No. 7, AGPS, Canberra, 349p.
Hart, B.T., Bailey, P., Edwards, R., Hortle, K., James.K., McMahon, A., Meredith, C. and Swadling, K.(1991) A review of the salt sensitivity of theAustralian freshwater biota. Hydrobiologia,210:105-144.
Haskell, B.D., Norton, B.G. and Costanza, R. (1992)What is ecosystem health and should we worry aboutit? In: Costanza, R., Norton, B. G. and Haskell, B. D.(Eds) Ecosystem Health: New Goals forEnvironmental Management, EdsIsland Press,Washington, pp 3-20.
Holdway, D.A., Brennan, S.E. and Ahokas, J.T. (1995)Short review of selected f ish biomarkers ofxenobiotic exposure with an example using f ishmixed-function oxidase, Australian Journal ofEcology, 20(1):34-44.
Hvitved-Jacobsen, T (1986) Conventional PollutantImpacts on Receiving Water, Proceedings of theNATO Workshop on Urban Runoff Pollution,Springer_verlag, Heidelberg, pp. 345-378.
Institution of Engineers, Australia (1987) AustralianRainfall and Runoff, D H Pilgrim (ed).
Karr, J.R. (1981) Assessment of biotic integrity usingfish communities. Fisheries, 6:21-27.
Ladson, A.R. and Doolan, J. (1997) Integratedmeasures of river health. River Basin ManagementSociety, Winter Conference: Monitoring River Health,7 July, La Trobe University.
Ladson, A.R., Doolan, J., White, L., Metzeling, L. andRobinson, D. (1996) Index of stream condition as atool to aid management of rivers, Hydrology andWater Resources Symposium, 21-24 May, Hobart,Institution of Engineers, Australia.
Laurenson, E.M., Codner, G.P. and Mein, R.G. (1985)Giralang/Gungahalin Paired Catchment Study: AReview, Consulting Report for Department ofHousing and Construction, ACT.
Livingston, E. (1994) Water Quality Consideration inthe Design of Wet Detention and Wetland StormwaterManagement System, IECA Seminar, Liverpool.
Livingston, E.H. (1997) Water quality considerationsin the design and use of wet detention and wetlandstormwater management systems, In: StormwaterBMPs: The Good, the Bad, the Ugly, FloridaDepartment of Environmental Protection and Watershed Management Institute, Inc, 7.41p.
Lloyd, S.D.(1997) Influence of Macrophytes onSediment Deposition and Flow Pattern within aStormwater Pollution Control Wetland, Masters ofEngineering Science thesis, Department of CivilEngineering, Monash University, 161 p.
Lloyd, S.D. and Wong, T.H.F. (1999) Particulates,associated pollutants and urban stormwater treatment,Proceedings of the 8th International Conference onUrban Storm Drainage, 30th August – 3rd September,Sydney.
McAlister, A.B. (1997), Water Sensitive UrbanDesign, Keynote Address, Proceedings of theStormwater and Soil Erosion 1997, Brisbane.
COOPERAT IVE RESEARCH CENTRE FOR CATCHMENT HYDROLOGY
72
Makepeace, D.K., Smith, D.W. and Stanley, S.J.(1995) Urban Stormwater Quality: Summary ofContaminant Data, Critical Reviews in EnvironmentalScience and Technology, 25(2):93-139.
Miller, D.R. (1984) Distinguishing ecotoxic effects,In: P.J Sheehan, D.R. Miller, G.C. Butler and P.Buurdeau (Eds) Effects of Pollutants at the EcosystemLevel, John Wiley and Sons, pp.15-22.
Moreland City Council and Merri Creek ManagementCommittee (1997) The Litter on Our Streets, 32p.
Mudgway, L.B., Duncan, H.P., McMahon, T.A. andChiew, F.H.S. (1997) Best Practice EnvironmentalGuidelines for Urban Stormwater – BackgroundReport,, CRC for Ctachment Hydrology, report 97/7.
Nix, S.J., Heaney, J.P. and Huber, W.C. (1989)Suspended solids removal in detention basins, J.Enviro. Eng., 114(6): 1331-1343.
Norris, R.H. and Norris, K.R. (1995) The need forbiological assessment of water quality: Australianperspective, Australian Journal of Ecology, 20(1):1-6.
Norris, R.H., Hart, B.T., Finlayson, M. and Norris,K.R. (1995) Use of Biota to Assess Water Quality,Australian Journal of Ecology, 20(1):227-231.
NSW-EPA (1996) Managing Urban Stormwater -Treatment Techniques, Draft Report prepared for theState Stormwater Coordinating Committee, 68p.
NSW-EPA (1997) Managing Urban Stormwater -Treatment Techniques, Final Report prepared for theState Stormwater Coordinating Committee, 68p.
Peterson, S.M. and Batley, G.E. (1992) Road Runoffand its Impact on the Aquatic Environment: AReview, CSIRO, Div. Of Coal and Energy Technology,Centre for Advance Analytical Chemistry, Report,CET/LH/IR076.
Peterson, S.M. and Batley, G. E. (1992) Road Runoffand its Impact on the Aquatic Environment: AReview, CSIRO Division of Coal and EnergyTechnology, Investigations Report CET/IR076.
Pitt, R., Field, R., Lalor, M. and Brown, M. (1995).Urban Stormwater Toxic Pollutants: Assessment,Sources, and Treatability. Water EnvironmentResearch 67(3): 260-275.
Randall, W., Ellis, K., Grizzard, T. and Knocke, W.R.(1982) Urban runoff pollutant removal bysedimentation, In: W, DeGroot (Ed), StormwaterRetention Facilities - Planning, Designing, Operationand Maintenance, ASCE, New Hampshire, pp. 205-219.
Reice, S.R. and Wohlenberg, M. (1993) Monitoringfreshwater benthic macroinvertebrates and benthicprocesses: Measures for assessment of ecosystemhealth. In: Rosenberg, D. M. and Resh, V. H. (Eds.)Freshwater Biomonitoring and BenthicMacroinvertebrates, Chapman and Hall, NY, pp 287-305.
Reynolds, C.S. (1992) Eutrophication and themanagement of planktonic algae: What Vollenweidercouldn’t tell us. In Sutcliffe, D.W. & GwynfrynJones, J. (Eds.) Eutrophication: Research andApplication to Water Supply, Freshwater BiologicalAssociation, Cumbria, UK, pp 4-29.
Reynoldson, T.B., Bailey, R.C., Day, K.E. and Norris,R.H. (1995) Biological guidelines for freshwatersediment based on BEnthic Assessment of SedimenT(the BEAST) using a multivariate approach forpredicting biological state, Australian Journal ofEcology, 20(1):198-219.
Rosenberg, D.M. and Resh, V.H. (1993) FreshwaterBiomonitoring and Benthic Macroinvertebrates,Chapman and Hall, NY, 488p.
Round, F.E. (1993) A review and methods for the useof epilithic diatoms for detecting and monitoringchanges in river water quality, Methods for theExamination of Waters and Associated Materials,HMSO, London, 64p.
Sansalone, J.J. and Buchberger, S.G. (1997)Characterisation of solid and metal elementdistributions in urban highway stormwater, WaterScience and Technology, 36(8-9):155-160.
Sanslone, J.J., Karon, J.M., Smithson., J.A. andBuchberger, S.G. (1997) Characterization of solidstransported from an urban roadway surface, WaterEnvironment Federation, Surface Water Quality andEcology, 70th annual conference and exposition,Chicago, Illinois, America, pp. 481-491.
COOPERAT IVE RESEARCH CENTRE FOR CATCHMENT HYDROLOGY
73
Sartor, J.D., Boyd, G.B. and Franklin, J.A. (1974)Water pollution aspects of street surfacecontaminants, Journal WPCF, 46(3):458-467.
Schaeffer, D.J., Herricks, E.E. and Kerster, H.W.(1988) Ecosystem health: 1. Measuring ecosystemhealth, Environmental Management, 12:445-455.
Schorer, M. (1997) Pollutant and organic mattercontent in sediment particle size fractions, FreshwaterContamination, IAHS 243:59-67.
Schueler, T.R. (1987a) Site Planning for UrbanStream Protection, Washington Metropolitan WaterResources Planning Board, 232p.
Schueler, T.R. (1987b) Controlling Urban Runoff: APractical Manual for Planning and Designing UrbanBMPs, Washington Metropolitan Water ResourcesPlanning Board, 185p.
Schueler, T.R. (1995) Environmental Land PlanningSeries: Site Planning for urban Stream Protection,Metropolitan Washington Council of Governmentsand the Centre for Watershed Protection, 232p.
Sheehan, P.J. (1984) Effects of individuals andpollutants, In: P.J Sheehan, D.R. Miller, G.C. Butlerand P. Buurdeau (Eds) Effects of Pollutants at theEcosystem Level, John Wiley and Sons, pp.23-99.
Skidmore, J.F. & Firth, I.C. (1983) Acute sensitivityof selected Australian freshwater animals to copperand zinc. Australian Water Resources Council,Technical Paper No. 81, AGPS, Canberra, 129p.
Smith, D.J.T., Edelhauser, E.C. and Harrison, R.M.(1995) Polynuclear hydrocarbon concentrations inroad dust and soil samples collected in the UnitedKingdom and Pakistan, Environmental Technology,16:45-53.
Sutcliffe, D.W. Ed. (1994) Water Quality and StressIndicators in Marine and Freshwater Systems:Linking levels of organisation. Freshwater BiologicalAssociation, 182p.
Victorian Stormwater Committee (1999). UrbanStormwater: Best Practice EnvironmentalManagement Guidelines. Melbourne, CSIROPublishing.
Walker, T., Wong, T and Wootton, R., (1999).Effectiveness of Street Sweeping for StormwaterPollution Control. Cooperative Research Centre forCatchment Hydrology, ISBN 1 876006 471.
Walsh,C.J., Sharpe, A.K., Breen, P.F., Gippel, T.M.and Sonneman, J.A. (MS in preparation) Effects ofurbanization on streams of the Melbourne region,Victoria, Australia. II. Macroinvertebratecommunities.
WHGM (1994) Planning and ManagementGuidelines for Water Sensitive Urban (Residential)Design, report prepared by Whelans and HalpernGlick Maunsell for the Department of Planning andUrban Development of Western Australia, ISBN 064615 468 0, 1994.
Whitton, B.A. and Kelly, M.G. (1995) Use of algaeand other plants for monitoring rivers, AustralianJournal of Ecology, 20(1):45-56.
Willing and Partners (1992) Design Guidelines forGross Pollutant Traps, report prepared for ACTDepartment of Environment, Land and Planning andthe Department of Urban Services.
Wong, T.H.F. (1996) Synthetic Generation of StormSequence using a Multi-module Data GenerationTechnique, 23rd Hydrology and Water ResourcesSymposium, 21-24 May, Hobart, pp. 439-444.
Wong, T.H.F., Breen, P.F. and Brizga, S. (2000)Hydrological, Geomorphological and EcologicalEffects of Catchment Urbanisation, report inpreparation, Cooperative Research Centre forCatchment Hydrology..
Wong, T. H. F., Breen, P. F., Somes, L. G. and Lloyd,S. D. (1998). Managing Urban Stormwater usingConstructed Wetlands. Melbourne, CooperativeResearch Centre for Catchment Hydrology.
Wong, T.H.F. and Somes N.L.G. (1995) A stochasticapproach to designing wetlands for stormwaterpollution control, Water, Science and. Technology,32(1): 145-151.
Woodward–Clyde (1994) San Jose Street SweepingEquipment Evaluation, report prepared for City ofSan Jose, California, October.
Wright, J.F. (1995) Development and use of a systemfor predicting the macroinvertebrate fauna in flowingwaters, Australian Journal of Ecology, 20(1):181-197.
COOPERAT IVE RESEARCH CENTRE FOR CATCHMENT HYDROLOGY
74