Embed Size (px)
Citation preview

Water Supply and Sanitation in Timor-LesteTurning Finance into Services for the Future
April 2015Service Delivery Assessment

This report is the product of extensive collaboration and information sharing between many government agencies, and Timor-Leste organizations. The National Directorate of Basic Sanitation, National Directorate for Water, Ministry of Health, Australian Government Department of Foreign Affairs and Trade (formerly AusAID) BESIK Water Supply and Sanitation Program, and Asian Development Bank have been key partners, together with the Water and Sanitation Program, in analyz-ing the sector. The authors acknowledge the valuable contributions made by the World Bank Country Management Unit, WaterAid, UNICEF, Japan International Cooperation Agency, Cruz Vermelha de Timor-Leste (Red Cross), and National De-velopment Agency.
The Task Team Leader for the Service Delivery Assessment (SDA) in East Asia and the Pacific is Susanna Smets. The fol-lowing World Bank staff and consultants have contributed to the service delivery assessment process and report: Isabel Blackett, Penny Dutton, Sandra Giltner, Arlindo Marcal, Rosalyn Fernandes, Joao dos Martires, Maria Madeira, and Almud Weitz. The report was reviewed by Alex Grumbley, Country Representative, WaterAid Timor-Leste and Keryn Clark, Program Director, BESIK Water Supply and Sanitation Program Timor-Leste. The report was peer reviewed by the following World Bank staff and sector colleagues: Michel Kerf, Sector Manager; Shyam KC, Disaster Risk Management Specialist; Lilian Pena Pereira Weiss, Senior Water and Sanitation Specialist; Ansye Sopacua, Sanitation Advisor, BESIK Water Supply and Sanitation Program; and Allison Woodruff, Urban Development Specialist, Asian Development Bank. Thanks go to Luis Constantino, Timor-Leste Country Manager; Towfiqua Hoque, Senior Infrastructure Specialist; and Alexander Jett, Research Analyst for providing comments to the report.
The SDA was carried out under the guidance of the World Bank’s Wa ter and Sanitation Program and local partners. This re-gional work, implemented through a country-led process, draws on the experience of water and sanitation SDAs conduct ed in more than 40 countries in Africa, Latin America, and South Asia. An SDA analysis has three main components: a review of past water and sanitation access, a costing model to as sess the ad-equacy of future investments, and a scorecard that allows diagnosis of bottlenecks along the service de livery pathways. SDA’s contribution is to answer not only whether past trends and future finance are sufficient to meet sector targets for infrastructure and hardware but also what specific issues need to be addressed to ensure that fi nance is effectively turned into accelerated and sustainable water supply and sanitation service delivery.
The Water and Sanitation Program is a multi-donor partnership, part of the World Bank Group’s Water Global Practice, sup-porting poor people in obtaining affordable, safe, and sustainable access to water and sanitation services. WSP’s donors include Australia, Austria, Denmark, Finland, France, the Bill & Melinda Gates Foundation, Luxembourg, Netherlands, Nor-way, Sweden, Switzerland, United Kingdom, United States, and the World Bank.
WSP reports are published to communicate the results of WSP’s work to the development community. Some sources cited may be informal documents that are not readily available.
The findings, interpretations, and conclusions expressed herein are entirely those of the author and should not be attributed to the World Bank or its affiliated organizations, or to members of the Board of Executive Directors of the World Bank or the governments they represent. The World Bank does not guarantee the accuracy of the data included in this work. The bound-aries, colors, denominations, and other information shown on any map in this work do not imply any judgment on the part of the World Bank Group concerning the legal status of any territory or the endorsement or acceptance of such boundaries.The material in this publication is copyrighted. Requests for permission to reproduce portions of it should be sent to [email protected]. WSP encourages the dissemination of its work and will normally grant permission promptly. For more information, please visit www.wsp.org.
© 2015 International Bank for Reconstruction and Development/The World Bank

Water Supply and Sanitation in Timor-Leste
Turning Finance into Services for the Future
Water Supply and Sanitation in Timor Lesteiv
In the Democratic Republic of Timor-Leste, remarkable progress in water supply and sanitation coverage in the last 10 years means that the country may meet Millennium De-velopment Goal targets for overall water supply coverage but is unlikely to do so for sanitation. These targets are for 78% of the population to have access to improved drinking water sources, and for 60% to have access to improved sanitation facilities. The latest figures from the Joint Moni-toring Programme (JMP) of WHO and UNICEF indicate that in 2011 access was 69% for water and 39% for sanitation. For urban areas these targets have been met or exceeded, but for rural areas where close to 70% of the country’s pop-ulation lives—many in small remote communities—these targets remain out of reach, particularly for sanitation. Rural residents account for 92% of the 358,000 people nationally that do not have access to improved water supply, while ru-ral residents make up 86% of the 704,000 people nationally without access to an improved toilet.1 Timor-Leste also has one of the highest population growth rates in the region at 2.4% per annum. If Timor-Leste is to meet its Strategic De-velopment Plan vision for 2030—which aims for all citizens to have access to clean water and improved sanitation—then current efforts in sanitation, particularly in rural areas, will need to be more intensively supported and scaled up. With greater attention to maintenance of rural water sup-ply schemes, Timor-Leste can extend scheme life span and achieve the nation’s rural water supply targets.
The analysis of the service delivery pathway for water and sanitation shows that Timor-Leste performs adequately in the ‘enabling’ phase of service delivery across all subsec-tors due to the presence of policy guidelines, national and
Strategic Overview
subsector targets, and relatively clear institutional roles. Structures and processes are in place for ministerial bud-get preparation, however budgets for urban and rural water supply and urban sanitation are unpredictable and fluctuate considerably from year to year, and are almost non-existent for rural sanitation. For ‘developing’ services, which relate to expenditure of funds, systems for allocating them equitably, and securing value-for-money outputs, Timor-Leste needs to improve in the areas of prioritizing budget allocation, budget execution for major capital works, and reporting on expenditure as well as reducing inequality and improving lo-cal participation. At the end of the service delivery pathway, Timor-Leste’s scores show poor performance in sustainabil-ity for all subsectors, especially in the area of maintenance.
The key bottlenecks that currently impede progress in Timor-Leste’s water and sanitation sector mainly relate to institutional capacity and absence of technical support ser-vices, accountability and incentives for sustaining services. There is a lack of funding to pay for water supply operations and maintenance, including no user fees charged in the ur-ban sector and no clear strategy to effectively support op-erations and maintenance in the rural sector. With improved operations and maintenance, water supply systems could last longer, save on replacement costs, and be a more cost effective investment. Sanitation goods and services, water supply spare parts and repair services are difficult to obtain in rural areas. District level planning is not coordinated with all stakeholders. Support and communication from the na-tional level to district offices is erratic. Part of this problem is due to the budget, and administrative constraints and the lack of autonomy and incentives the National Directorate
1 Calculated by authors from JMP coverage and population data

Service Delivery Assessment v
for Water Services (DNSA) has as a government depart-ment to respond to district operational needs, as well as the current lack of sanitation staff at district level. Both the water supply and sanitation sector have a shortage of hu-man resources, especially skilled technical staff. Increased human resources such as community outreach workers are also needed to carry out sanitation promotion activities to motivate households to self-invest in improved sanitation in rural areas.
To achieve government-defined access targets to 2020 for water supply (87%) and sanitation (76%), an average of US$39.4 million each year in capital expenditures on wa-ter supply, and some US$16.4 million per year on capital expenditures for sanitation will be needed.2 These figures include estimated hardware expenditures by households, which, especially for rural sanitation, are expected to self-invest. In addition an average of US$7 million per year (US$5 million for water supply and US$2 million for sanita-tion) will be needed to finance operation and maintenance of rural and urban infrastructure. Critical public funding is necessary for sanitation “software”, such as human and operational resources for behavior change communication campaigns, monitoring and regulation, and private sector development to elicit households to invest in their facilities. For rural sanitation alone, it is estimated that US$976,000 per year is needed for such software spending.
Estimated annual capital expenditure planned for the next three years (2013-15) is US$29.4 million for water supply of which about 20% is from development partners. This is an annual shortfall of US$10 million compared to the US$39.4
million needed to reach the 2020 targets. There is little firm evidence of intentions for capital spending on sanitation from either government or development partners. This is because both urban and rural sanitation in Timor-Leste are overwhelm-ingly on-site technologies and spending is expected by house-holds, rather than government and development partners.
For water supply, the estimated necessary capital expen-ditures amount to approximately 2.4% of the 2013 national budget of US$1.6 billion. Estimated operations and mainte-nance costs are 0.4% of the 2013 budget. In the years 2010-2012, estimated recent public capital expenditures on water and sanitation in Timor-Leste (including donor expenditures) averaged 1.1% of the budget and 1.5% of GDP.
Failure to meet financing gaps and address institutional and sustainability bottlenecks will result in Timor-Leste falling short of meeting its water and sanitation targets. The wider implications are that the country’s progress on economic, health and social development will be hampered.
This Service Delivery Assessment (SDA) takes a long-term view of Timor-Leste’s ambitions. It has been conducted as a multi-stakeholder process under the leadership of the Di-rectorate General for Water and Sanitation within the Min-istry of Public Works. Through a facilitated process, stake-holders have agreed on intermediate targets, and identified bottlenecks in water and sanitation service delivery that need to be addressed. Agreed priority actions to tackle Timor-Leste’s water supply and sanitation challenges have been identified to ensure finance is effectively turned into services. These priority actions are:
2 Authors’ calculations based on SDA financial model

Water Supply and Sanitation in Timor Lestevi
Sector wide priority actions
Institutional1. Increase autonomy, incentives and accountability of DNSA for providing urban water supply services.2. Clarify asset ownership and maintenance roles in rural water supply schemes.3. Strengthen service delivery at district and subdistrict levels by increasing human resources, technical capacity, and im-
proving coordination between programs.4. Continue dialogue on private sector involvement in service provision and review options appropriate for the stage of sec-
tor development to tackle weak capacities in service delivery.
Finance5. Increase capital works budget execution by improving capacities in public procurement, tendering, and contract man-
agement processes and documentation.6 Develop costing guidelines to ensure that future project plans for capital investment (hardware) are accompanied by
budgets for the required level of technical assistance (software), especially for rural water supply and rural sanitation. 7. Improve sector financial coordination by annually reporting in one consolidated place, all sources of capital and non-
capital funds expended on WASH.
Monitoring8. Improve data quality and analytical use of the water, sanitation and hygiene information system (SIBS).9. Improve performance monitoring, and public disclosure for urban water supply to increase accountability.10. Synchronize monitoring data and definitions from different sources into robust national monitoring systems.
Priority Actions for Rural Water Supply
1. Establish clear policies and define government and community responsibilities for O&M of rural water systems.2. Ensure budget is available for technical support systems for O&M services of community-managed schemes.3. Increase functionality of water supply schemes by a) improving the spare parts supply chain, b) increasing numbers and
skills of technical staff in districts, and c) professionalizing management of rural water supply through contracting of NGOs and the private sector.
4. Make district budgets transparent to show water supply funding from DNSA, decentralized projects, development part-ners and NGOs.
Priority Actions for Urban Water Supply
1. Develop a roadmap for urban water sector reform and regulatory framework that will increase the autonomy of DNSA/service providers, introduce incentives to drive performance improvements and establish separate regulatory functions.
2. Roll out wider tariff reform to fund operations and maintenance and increase sustainability of water systems.3. Reinforce coordination between agencies involved in local planning, urbanization, water supply, and drainage including
district coordination. 4. Improve water quality of service provision, including testing regimes and disclosure.

Service Delivery Assessment vii
Priority Actions for Rural Sanitation and Hygiene
1. Increase budget allocation for rural sanitation promotion and marketing (“software”) to implement the National Basic Sanitation Policy.
2. Increase human resources and build capacity of community health workers, sanitation promoters, local volunteers, to achieve open defecation free sucos.
3. Strengthen sanitation markets and ensure supplies of sanitation materials and services in all 13 districts. 4. Strengthen the targeting of sanitation subsidies as part of the vulnerable households program and ensure an appropriate
delivery mechanism that does not undermine a market-based approach.5. Develop integrated national and district plans for increasing sanitation access; monitor and evaluate these plans.
Priority Actions for Urban Sanitation and Hygiene
1. Implement Dili Sanitation and Drainage Master Plan stage 2.2. Prepare Sanitation Master Plans for the remaining 12 district capital towns (excluding Dili).3. Improve septage collection and maintenance of septage facilities.4. Increase the human resources capacity for sanitation in each district capital town (reflecting population size and sanita-
tion needs in district towns).

Water Supply and Sanitation in Timor Lesteviii
Table of Contents
Strategic Overview .............................................................................................................................................................ivTable of Contents ............................................................................................................................................................. viiiAbbreviations and Acronyms ..............................................................................................................................................ix
1. Introduction .................................................................................................................................................................. 12. Sector Overview: Coverage and Finance Trends ......................................................................................................... 43. Reform Context .......................................................................................................................................................... 134. Institutional Framework .............................................................................................................................................. 175. Financing and Its Implementation .............................................................................................................................. 236. Sector Monitoring and Evaluation .............................................................................................................................. 267. Subsector: Rural Water Supply .................................................................................................................................. 298. Subsector: Urban Water Supply ................................................................................................................................ 339. Subsector: Rural Sanitation and Hygiene .................................................................................................................. 3710. Subsector: Urban Sanitation and Hygiene ................................................................................................................. 4111. Conclusion ................................................................................................................................................................. 45
Annex 1: Scorecard and Evidence for Scoring ................................................................................................................. 49Annex 2: Assumptions and Inputs for Financial Model ..................................................................................................... 67

Service Delivery Assessment ix
ADB Asian Development BankADN National Development AgencyAldeia ‘Sub-village’ or hamlet. There are 2,225 aldeias in Timor-Leste. AusAID Former Australian Agency for International Development, now Department of Foreign Affairs and
Trade (DFAT)BESIK Be’e Saneamentu no Ijiene iha Komunidade = AusAID Rural Water Supply and Sanitation ProjectCAP Community Action PlanningCLTS Community Led Total SanitationDNSB Direcção Nacional de Saneamento Básico = National Directorate for Basic SanitationDNSA Direcção Nacional de Serviços de Água = National Directorate for Water GDP Gross Domestic ProductGoTL Government of Timor-LesteIMF International Monetary FundJICA Japan International Cooperation AssistanceJMP Joint Monitoring Programme (for water and sanitation by UNICEF and WHO)MCK Mandi, Cuci, Kakus – [Indonesian] public facility combining bathing, washing, and toilet facilitiesMDG Millennium Development GoalNGO Non-Government OrganizationO&M Operations & MaintenanceODF Open Defecation FreePAKSI Planu Asaun Komunidade ba Saneamentu no Ijiene = Community Action Plan for Sanitation and
HygienePDID Programa Dezenvolvimentu Integradu Distrital = Integrated District Development Program PDD Programa Dezenvolvimentu Desentralizadu = Decentralized Development ProgramPDL Programa Dezenvolvimentu Lokál = Local Development Program Sanitation Sanitation refers to the provision of facilities and services for the safe disposal of human urine and
faeces. It excludes solid waste collection and drainage.SAS Serviço de Água e Saneamento =Water & Sanitation Service (District level)SDA Service Delivery AssessmentSIBS Sistema Informasaun Bee no Saneamentu = water and sanitation information systemSISCa Servisu Integradu da Saúde Komunitária = Integrated Community Health ServicesSuco Lowest level administrative unit equal to town or village. There are 442 in Timor-LesteUNICEF United Nations Children’s FundVIP Ventilated Improved Pit latrineWASH Water, Sanitation, and Hygiene WHO World Health OrganizationWSP World Bank - Water and Sanitation Program
Abbreviations and Acronyms


Service Delivery Assessment 1
1. Introduction
Water and sanitation Service Delivery Assessments (SDAs) are taking place in seven countries in East Asia and the Pacif-ic region under the guidance of the World Bank’s Water and Sanitation Program (WSP) and local partners. This regional work, implemented through a country-led process, draws on experience of water and sanitation SDAs conducted in more than 40 countries in Africa, Latin America and South Asia.3
The SDA analysis has three main components: a review of past water and sanitation coverage, a costing model to as-sess the adequacy of future investments, and a scorecard that allows diagnosis of bottlenecks along the service de-livery pathway. These components are not directly linked to each other, but in combination they produce a picture of the country’s WASH status and critical issues in the sector. The SDA’s contribution is to answer not only whether past trends and future finance are sufficient to meet sector targets for in-frastructure and hardware, but what specific issues or bottle-necks need to be addressed to ensure finance is effectively turned into accelerated and sustainable water supply and sanitation service delivery. Bottlenecks can occur throughout the service delivery pathway—all the institutions, processes and actors that translate sector funding into sustainable ser-vices. Where the pathway is well developed, sector funding should turn into services at the estimated unit costs. Where the pathway is not well developed, the capital investment re-quirements to achieve targets may be gross underestimates as additional finance may be needed to “unblock” the service delivery bottlenecks such as developing institutional capac-ity and improving sustainability.
The scorecard looks at nine building blocks of the service delivery pathway, which are grouped in three categories: three building blocks or functions that refer to enabling conditions for putting services in place (policy develop-ment, planning new undertakings, budgeting processes); three functions that relate to developing the service (ex-penditure of funds, equity in the use of these funds, service output); and three functions that relate to sustaining these services (facility maintenance, expansion of infrastructure, use of the service). Each building block is assessed by stakeholders against usually three specific indicators which are scored from 0 to 1, and then aggregated to provide a score for that building block of between 0 and 3. (Refer An-nex 1 for detailed scoring and criteria). The scorecard uses a simple color code to indicate: building blocks that are largely in place, acting as a driver for service delivery (score >2, green); building blocks that are a drag on service deliv-ery and require attention (score 1–2, yellow); and building blocks that are inadequate, constituting a barrier to service delivery and a priority for reform (score <1, red).
The SDA analysis relies on an intensive, facilitated consul-tation process, with government ownership and self-as-sessment at its core. The assessment is undertaken for four subsectors: rural water, rural sanitation, urban water and urban sanitation. Through the SDA process, an evidence-based participatory analysis has been conducted to better understand what undermines progress in water supply and sanitation and what the Government of Timor-Leste can do to accelerate progress to achieve its 2020 targets.
3 For example refer to: Africa CSO synthesis report: http://www.wsp.org/sites/wsp.org/files/publications/CSO-Synthesis-Report.pdf

Water Supply and Sanitation in Timor Leste2
A series of meetings and sanitation and water supply sub-sector workshops with core stakeholders during 2013, to-gether with reviews of reports and budgets, has provided the information for this SDA. Sources of evidence are pro-vided in footnotes, references section and in Annex 1. The SDA process took place in 2012/2013 with data collection between September 2012 and September 2013. The report reflects the situation at the time and may not include the latest data and information. Figure 1.1 outlines the timeline of the SDA process in Timor-Leste.
The analysis aims to help Timor-Leste assess its own ser-vice delivery pathway for turning finance into water supply and sanitation services in each of the four subsectors. Spe-cific priority actions have been identified through consulta-tion with government and other sector stakeholders.
This report has been produced by WSP and validated by the Government of Timor-Leste and other stakeholders.
Figure 1.1 Timeline of SDA in Timor Leste
September 2012 Introduction of SDA to stakeholders
October 2012 Financial and background data
November 2012 Data collection, stakeholder meetings
February 2013 Data analysis, scorecard assessment
March 2013 Stakeholder workshops on water and sanitation scorecards
May 2013 Data analysis and gap identification
June 2013 Stakeholder workshops to present preliminary findings, identify subsector priority actions
July 2013 Consolidation and checking of data
August 2013 Financial modelling
September 2013 Stakeholder workshop to finalize priority actions; draft preliminary report
October 2013 Internal review of preliminary report
December 2013 Draft report for review by stakeholders and peer reviewers
January 2014 World Bank peer review meeting
March 2014 Final SDA Report

Service Delivery Assessment 3
Figure 1.2 Map of Timor Leste
Comoro
Baucau
Cape Cutcha
CapeIma
CapeDe Loré
CapeDeilubun
CapeCaissae
Luli
CapeSuai
CapeCacetec
CapeMetidot
CapeTafara
CapeFotocapo
CapeBauc
CapeCorimbala
CapeMatolana
Run
CapeBondura
CapeUssoIssi
CapeLutraVali
CapeAimocoMeno
LirahIsland
AtauroIsland
Wetar Island
KisarIsland
JacoIsland
NitibeOe Silo
Kefamenanu
BazarTete
WatulariLacluta
Natarbora
BariqueSoibada
Beaco
QuelicaiBaguia
Uatucarbau
Laga
Com
Bucoli
Loré
TutualaMehara
Fuiloro
Lautem
Maina 1Laivai
IliomarVenilale
Dilor
Ossu
Aba
VemaseLaleia
RailacoMaubara
Atsabe
Bobonaro
Metinaro
Laclo
Atapupu
Atambua
Citrana
WiniKotafun
Halilulik
Mape
Maubisse
Hatolia
Hato Builico
Alas
Turiscai
Fatuberliu
ZumalaiHotu-Udo
ErmeraPunilala
Letefoho
LissapatLaclubar
Lolotoe
FatolulicFatomean
Fohorem
Passabe
Maumeta
Biquele
Berau
Balibo
AtabaeAidabaleten
Atelari Luro
Tilomar
BatugadeMoleana
Cai Rui
Timor Sea
Savu Sea
Strait of Wetar
125o
9o
8o
127o126o125o
8o
9o
126o
124o 30'
127o
124o 30'124o 00'
124o 00'
9o 00'
9o 30'9o 30'
9o 00'
PanteMacasar
Manatuto
Baucau
Lospalos
Liquica
AinaroSame
Aileu
Gleno
Maliana
Suai
Viqueque
COVA LIMA
AINARO
BOBONARO
LIQUICA
OECUSSE
DILI
AILEU
MANUFAHI
MANATUTO
BAUCAULAUTEM
ERMERA
VIQUEQUE
Dili
INDONESIA
INDONESIA
INDONESIA
International boundary
0
0
10 20 30 km
5 10 15 20 mi
Road
District boundary
District capital
National capital
Town, village
Airport
TIMOR-LESTE
Map No. 4111 Rev. 11 UNITED NATIONSNovember 2011 (Colour)
Department of Field SupportCartographic Section
The boundaries and names shown and the designations used on this map do not imply official endorsement or acceptance by the United Nations.

Water Supply and Sanitation in Timor Leste4
Context
Timor-Leste is the second smallest country by population in Southeast Asia with 1.066 million people in 2010.4 Most people—750,000 or 70% of the population—live in rural ar-eas, and 316,000 people (30%) live in urban areas.
Timor-Leste is a post-conflict country, emerging from a 24-year history of occupation and violent struggle for indepen-dence, as well as internal conflicts between 1999 and 2006.5 When the Indonesian army withdrew from Timor-Leste in 1999, as much as 70% of the country’s infrastructure was destroyed.6 Since gaining independence in 2002, Timor-Leste has made strides in restoring stability and rebuild-ing the country. This progress is due to a conscious effort by government to make the provision, and restoration, of key public services and infrastructure a priority for its peo-ple, together with complementary initiatives from NGOs.7
Since 2006 Timor-Leste has experienced strong economic growth, with the country’s real Gross Domestic Product
2. Sector Overview: Coverage and Finance Trends
(GDP) growing by an average of 11.9% per year since 2007. In 2012 Timor-Leste’s GDP was estimated to be US$4.173 billion, with GDP per capita of approximately US$3,730.8
Growth has been underpinned by public spending, how-ever inflation is persistently high at 11%. To improve social development the country has introduced a wide range of social safety net programs and rural labor employment op-portunities. Human development indicators have improved, particularly in the health area, although childhood nutrition status remains severe. At 58%, Timor-Leste has one of the highest incidences in the world of stunting of children un-der age, with 33% severely stunted. Almost half (45%) of children under age 5 are underweight, and 19% are acutely malnourished or wasted.9 Poverty incidence remains high at 41% in 2009.10 Rural poverty is higher than urban poverty owing to low agricultural productivity and limited access to roads and markets. Regional poverty disparities also exist, with poverty being worst in the central region.
4 National Statistics Directorate and United Nations Population Fund (2011) Population and Housing Census 2010, Dili: Government of Timor-Leste. Only Brunei has a smaller population with 434,000 people.5 Timor-Leste is a fragile state, and member and chair of the “g7+” - a voluntary association of countries that are or have been affected by conflict and are now in transition to the next stage of development..Refer: http://www.g7plus.org/6 As much as 70% of Timor-Leste’s infrastructure—houses, schools, shops, offices, irrigation systems, water supplies, and nearly 100% of the country’s electrical grid—were destroyed during the retaliatory withdrawal of the Indonesian military in late 1999. For water supply this included pumping stations, transmission pipes, valves and tanks. Numerous sources describe the level of destruction, including: (1) The World Bank, Timor-Leste Overview, viewed 29 August 2013, <www.worldbank.org/en/country/timor-leste/overview> (2) Government of Timor-Leste (2011) Strategic Development Plan 2011-2030. p.81 (3) ICRC Update No. 99/04 on ICRC activities in Indonesia/East Timor 11-10-1999 Operational Update. Available at: http://www.icrc.org/eng/resources/documents/misc/57jq22.htm [viewed 16/4/2013]. (4) eye witness accounts: ABC 7:30 Report, Transcript 27/9/1999, Indonesia’s scorched earth policy levels East Timor. Available at: http://www.abc.net.au/7.30/stories/s55114.htm. 7 World Bank (2009) Community Based Development and Infrastructure in Timor-Leste: Past Experiences & Future Opportunities. AusAID – East Asia and Pacific Infrastructure for Growth Trust Fund [pdf] Available at: http://documents.worldbank.org/curated/en/2012/01/16414897/timor-leste-comunity-based-development-infrastructure-timor-leste-past-experiences-future-opportunities8 International Monetary Fund, World Economic Outlook Database, April 2013, viewed 2 September 2013, <www.imf.org/external/pubs/ft/weo/2013/01/weodata/index.aspx>; 9 National Statistics Directorate , Ministry of Finance, and ICF Macro. (2010). Timor-Leste Demographic and Health Survey 2009-10. Dili, Timor-Leste: NSD and ICF Macro, UNICEF (2013) Improving Child Nutrition-The achievable imperative for global progress. New York:UNICEF10 International Monetary Fund, (2012) IMF Country Report No. 12/24 Democratic Republic of Timor-Leste: 2011 Article IV Consultation—Staff Report; Informational Annex; Debt Sustainability Analysis; and Public Information Notice. Washington: IMF

Service Delivery Assessment 5
Coverage: Assessing Past Progress
Progress has been made in increasing access to improved water supply, and for sanitation, reducing open defeca-tion according to the Joint Monitoring Programme (JMP) of WHO and UNICEF.11 It is difficult to accurately assess coverage rates during the Indonesian occupation.12 The JMP estimates a gain in access to improved water supply of 15% between 2000 and 2011 (from 54% to 69% access nationally).13 These gains are impressive given the fragility of the country and the high demand for many basic ser-vices and infrastructure immediately after Independence. Piped water systems have contributed to these gains far more in rural areas than in urban areas. Access to im-proved water supply is 93% in urban areas, yet fewer than half of these households (45%) have a piped water con-nection to the yard or house, and for those that do, service quality is often poor. For rural areas, the most common types of improved water source are public tap/standpipe, and household yard connections—typically sourced from gravity fed piped systems, protected well or spring, and boreholes.14
Unlike water supply, national access to sanitation has barely increased. The JMP estimated national access to improved sanitation at 37% in 1995, 37% in 2000, and just 39% in 2011 (see Figure 2.1). Although urban improved sanitation
access has increased, rural improved sanitation access has dropped from 32% in 2000 to 27% in 2011. Importantly, during the same period, rural open defecation reduced from 55% to 37%, indicating an uptake in use of basic sanita-tion facilities in rural areas, but not use of a toilet which is considered “improved” and is more durable. A further 9% of households share improved toilets (generally shared be-tween two households from the same family) however these are not counted in the JMP estimates.15 No sewerage sys-tem exists in Timor-Leste’s urban areas yet, with the most common types of improved toilets being pit latrines with slabs, pour flush to a pit or septic tank, and Ventilated Im-proved Pit (VIP) latrines. Improved toilets in rural areas are typically pit latrines with slabs and VIP latrines.
Population growth hampers increased access to improved sanitation. Timor-Leste has one of the highest population growth rates in the Asia-Pacific region, with an annual growth rate of 2.41% between 2000 and 2010.16 Between 1995 and 2011 the population grew by 300,000 people yet only 135,000 people gained access to improved sanitation during the period. In 2011, 167,000 more people were with-out access to improved sanitation than in 2000, indicating that the absolute number of people without access to im-proved sanitation is increasing. Access to improved water supply has kept ahead of population growth with 344,000 people gaining access during the period.17
11 According to the JMP, an improved drinking-water source is one that, by the nature of its construction, adequately protects the source from outside contamination, particularly fecal matter eg. piped water into dwelling, piped water to yard/plot, public tap or standpipe, tubewell or borehole, protected dug well, protected spring, rainwater. An improved sanitation facility is one that hygienically separates human excreta from human contact eg. flush toilet, piped sewer system, septic tank, flush/pour flush to pit latrine, ventilated improved pit latrine (VIP), pit latrine with slab, composting toilet.12 Prior to Indonesian withdrawal, AusAID estimated national access rates to improved water supply were around 66% in 1999. Refer: Commonwealth of Australia, December 2000. East Timor – Final Report of the Senate Foreign Affairs, Defence and Trade References Committee, p.17 [pdf] Canberra: Commonwealth of Australia. Available at: http://www.aph.gov.au/Parliamentary_Business/Committees/Senate_Committees?url=fadt_ctte/completed_inquiries/1999-02/east_timor/report/index.htm. 13 Based on the 2010 Census figures of 66%14 National Statistics Directorate and United Nations Population Fund (2011) Population and Housing Census 2010, Dili: Government of Timor-Leste. 15 Sharing of toilets is common in Timor-Leste. The 2010 Census indicates about 25% of households using any type of toilet are sharing. 16 National Statistics Directorate and United Nations Population Fund Population and Housing Census of Timor-Leste, 2010. Government of Timor-Leste Vol 2: Population Distribution by Administrative areas p. xxi. Available at http://www.mof.gov.tl/wp-content/uploads/2011/06/Publication-2-English-Web.pdf17 Authors’ calculations using JMP coverage and population data

Water Supply and Sanitation in Timor Leste6
Access: Targets and Future Trends
The national MDG target for access to improved water sup-ply is 78% by 2015, with sub-targets set by national au-thorities of 75% for rural and 81% for urban water supply. The country’s national MDG target for access to improved sanitation is 60%, with sub-targets of 55% for rural areas and 64% for urban areas. (see Table 2.1)
Timor-Leste is likely to meet its overall MDG target for water supply but is unlikely to do so for sanitation. The country has already surpassed its sub-target for urban water supply and for urban sanitation. Rural water supply appears to be on track to meet its sub-target as long as sufficient operations and maintenance (O&M) is provided to keep schemes working. Rural sanitation is lagging and is unlikely to meet the MDG sub-target. However these figures present a simplistic view of progress which does not take into account the quality of services delivered in
urban areas, nor the recent efforts in the rural sector, par-ticularly in rural sanitation, since the last JMP update in 2011. These are discussed more fully in the chapters 7, 8, 9 and 10 of this report.
The National Strategic Development Plan 2011-2030 is clear about the need for universal access to clean water and sanitation for reasons of public health, employment, economic development, and management of water re-sources. The end goal of the Strategic Development Plan is that by 2030 all citizens in Timor-Leste have access to clean water and improved sanitation. Intermediate targets to 2020 are not all articulated in the Strategic Development Plan. Hence to estimate sector financial requirements by 2020, targets have been agreed in consultation with stakehold-ers, which are aligned with the Ministry of Public Works’ Five-Year Water and Sanitation Action Plans (2013-2017) and the targets articulated in the draft Strategic Sanitation Plan (2020). These are presented in table 2.1.
Figure 2.1 Timor-Leste: Progress in water supply and sanitation 1995 – 2020 (estimated)
0%
20%
40%
60%
80%
100%
1995 2000 2005 2010 2015 2020Imp
rove
d w
ater
sup
ply
co
vera
ge
Government estimate Government target
JMP Estimates MDG target
JMP Piped
Water Supply
0%
20%
40%
60%
80%
100%
1995 2000 2005 2010Imp
rove
d s
anita
tion
cove
rag
e
2015 2020
Government estimates Government target
JMP improved estimates MDG target
Sanitation
Source: JMP (2013); MOH (2012); and government targets used for SDA costing analysis.
18 Government of Timor-Leste and UNDP (2009) The Millennium Development Goals, Timor-Leste. Available at: www.undp.org

Service Delivery Assessment 7
Table 2.1 Timor-Leste: Water supply and sanitation targets used for SDA estimates
Sub-sector JMP 2011 data MDG target 2015 Target used in SDA 2020 Source of 2020 target
Proportion of Population with access to an improved water source
National 69% 78% 87%Calculated from Strategic Development Plan targets for 2020; weighted for assumed rural population of 67% of total population and urban population is 33%
Rural 60% 75% 80%Ministry of Public Works’ Water Action Plan 2013-2017 target for 2020 (refers to access to potable, secure and constant supply of water).
Urban 93% 81% 100%Ministry of Public Works’ Water Action Plan 2013-2017 (refers to access to 24-hour supply in Dili and district centers)
Proportion of Population with access to improved sanitation
National 39% 60% 76%Calculated from weighted average of rural target for 2020 and urban target for 2020; assuming rural population is 67% of total population and urban population is 33%
Rural 27% 55% 68%2020 target calculated from the assumed 2030 target from Draft Strategic Sanitation Plan.
Urban 68% 64% 93%Calculated: weighted average of urban targets from Draft Strategic Sanitation Plan which are 100% access in Dili and 82% access in district capitals (assuming that Dili population is 60% of total urban population)
Note: UN-agreed MDG targets apply only to national access to water and sanitation; subsector targets have been set by national authorities for 2015
The Government’s goal for rural water is access to a po-table, secure and constant supply of water.19 The Ministry of Public Works’ strategy to achieve this includes construction of new water supply systems, rehabilitation of non-func-tioning systems, and improving the capacity of O&M staff.20 Public standpipes will remain the dominant technology, and are preferred by government as being suitable and afford-able for Timor-Leste.
The goal for urban water is to provide 24-hour potable wa-ter supply to Dili and district capitals. According to the government’s Five-Year Plan this will be achieved by se-curing water sources, building storage capacity, increas-ing and repairing water transmission networks, connecting households, and introducing user tariffs. In urban areas
the future scenario is that the majority of households will have individual connections, with public taps remaining in low income areas. Baucau, Manatuto, Lospalos and Suai, are high priority district towns where the water situation is critical.21
The draft Sanitation Strategic Plan proposes a goal to make Timor-Leste “open defecation free” (ODF). Stakeholders suggest achieving ODF by 2017 – the end of the current government’s term. Following this, rural areas expect in-creased access to hygienic toilets by moving households up the sanitation ladder i.e move from shared to private latrines, improve pit latrines to pour flush toilets. The pro-portion of pit latrines is expected to fall as people get used to using a toilet and invest resources in improving their
19 Government of Timor-Leste (2011) Strategic Development Plan 2011-203020 Ministry of Public Works (2012) Five Year Action Plans 2013-201721 Government of Timor-Leste (2011) Strategic Development Plan 2011-2030

Water Supply and Sanitation in Timor Leste8
existing basic household toilets, combined with greater access to low cost materials. In urban areas the expected trend will be the increased use of toilets connected to sep-tic tanks, and in Dili to commence connecting households to decentralized wastewater treatment systems. The gov-ernment’s vision is consistent with household aspirations for improved sanitation in urban areas.
The Five-Year Plans of the Ministry of Public Works repre-sent the goals of the current government, but are not fully developed to address institutional development, capacity, and full budget needed to implement the plans. Activities of other ministries, NGOs and donors are part of these plans for the first year only.22 Improving water and sanitation ser-vices in Dili is a high priority for national government, and is where the bulk of the Ministry’s urban water and sanitation budget will be allocated, with district towns largely over-looked for capital investment.
Investment Requirements: Testing the Sufficiency of Finance
Given the assumed 2020 national targets (see Table 2.1), about US$39.4 million needs to be invested each year until 2020 on water supply infrastructure and about US$16.4 million on sanitation infrastructure.23 For water supply, the estimated necessary capital expenditures amount to approximately 2.4% of the 2013 national combined sources budget of US$1.6 billion. In addition to infrastructure capital expenditure, an average of US$6.9 million per year would be needed to finance operation and maintenance of current and future infrastructure (see Table 2.4). Estimated operations and maintenance costs are 0.4% of the 2013 budget. In the years 2010-2012, estimated public capital expenditures on water and sanitation in Timor-Leste (including donor expenditures, which are included in the country’s combined budget) averaged 1.1% of the budget and 1.5% of GDP.
Table 2.2 Timor-Leste: Estimated Annual Capital Spending Needed 2011-2020 to Reach 2020 Coverage Goals, US$ million
Sector/Subsector
Coverage Population requiring access
Investment Requirement
2011 Target 2020 NewCapital
Replacement of Capital
EstimatedOther Total
Capital Cost
Public Share of Total Capital% % ‘000/year $US million/year
Water supply
Rural water supply 60% 80% 41 6.4 12.9 0.0 19.3 15.5
Urban water supply 93% 100% 24 8.9 11.2 0.0 20.1 16.3
Water supply total 69% 87% 65 15.2 24.1 0.0 39.4 31.9
Sanitation
Rural sanitation 27% 68% 44 1.0 1.9 0.0 2.9 0.0
Urban sanitation 68% 93% 37 9.8 3.2 0.5 13.5 11.7
Sanitation total 39% 76% 81 10.8 5.1 0.5 16.4 11.7
Note: Public Expenditures include domestic (government) and external (development partners and NGOs) sources. Estimated Other requirements include rehabilitation, treatment requirements for existing coverage and natural disasters. Totals may not sum due to rounding. Source: SDA estimates based on financial model
22 Contributions from donors and NGOs to the sector targets were developed after the Action Plans were approved, and include NGO and donor contributions and water supply schemes under decentralization programs.23 These figures were calculated from the mid-period year of 2011.

Service Delivery Assessment 9
The Government of Timor-Leste together with the IMF have identified lack of adequate infrastructure as a major constraint to economic development in the country, and a major feature of government budgeting in the period 2012-2016 is anticipated to be infrastructure. A 2012 IMF consul-tation projected a rise in capital spending from about 33% of total government spending in 2010 to about 55% in the period 2013-2016.24 In 2011 the government created an in-frastructure fund for major undertakings. Also, combining infrastructure with decentralization, the country has used local development funds and programs extensively to has-ten construction of local infrastructure in line with commu-nity priorities. The major budget resource for Timor-Leste is its Petroleum Fund, which stood at close to US$12 billion at the end of 2012.
For water supply and sanitation, the implications of an emphasis on infrastructure plus the way it is funded are profound. Water
Table 2.3 Timor-Leste: Anticipated/Proposed Investment (Capital Expenditure) in Water Supply and Sanitation 2013-2015 (US$ million per annum)
Sector/Subsector
Anticipated Public Capital Expenditure 2013-2015Anticipated
household capital expenditure
Annual surplus (deficit)Domestic
(government)% of SDA Estimated
Requirement
External (Development
Partners/ NGOs)Total
US$ million/year
Water supply
Rural 13.0 67% 1.7 14.7 3.6 (1.0)
Urban 10.6 50% 4.1 14.7 3.4 (2.0)
Water Supply Total 23.6 60% 5.8 29.5 6.9 (3.0)
Sanitation
Rural 0.0 0% 0.0 0.0 1.0 (1.9)
Urban 4.7 35% 0.0 4.7 0.8 (8.1)
Sanitation Total 4.7 28% 0.0 4.7 1.7 (10.0)
Notes: Investments that do not expand coverage are not included. While there is NGO investment in water supply, it was not possible to determine comprehensively (many small NGOs operate “off budget”). Most NGO expenditure in sanitation, especially in rural sanitation, is non-capital spending, such as technical assistance and capacity development (“software”). The percentage of estimated requirement is calculated as anticipated government expenditure over total requirements (from Table 2.2). Annual surplus/deficit is the difference between the annual investment required (Table 2.2) and anticipated. Totals may not add up due to rounding. Source: SDA estimates based on information supplied by government, development partners, and NGOs.
supply, particularly rural water supply, has been a priority area in recent government plans, with a corresponding rise in the capital budget of the main institution overseeing water and sanitation, the Directorate General for Water and Sanitation. However, most of the capital for rural water supply has been through various de-concentrated programs and funds such as the Programa Dezen-volvimentu Desentralizadu (PDD). These programs do not provide funding for household toilets, only for public and shared com-munity toilets. Consequently any sanitation investments through decentralization programs have no direct impact on progress to-wards MDG sanitation targets.
The government’s financial commitment to urban and rural water supply and urban sanitation, and taking these de-concentrated funds into account, means that unlike many countries in the region, government funding for water sup-ply and sanitation hardware in Timor-Leste exceeds sup-port from development partners.
24 RDTL 2013 p.19

Water Supply and Sanitation in Timor Leste10
Totalinvestmentrequirement
Anticipatedinvestment2013-2015
Recentinvestment2010-2012
Ann
ual i
nves
tmen
tin
mill
ion
US
D
Other
Replacement
New
Household
External
Domestic
0
1015
202530
4045
Totalinvestmentrequirement
Anticipatedinvestment2013-2015
Recentinvestment2010-2012
Ann
ual i
nves
tmen
tin
mill
ion
US
D
4
12
Total sanitation
Total water supply
5
35
02
68
10
141618
Figure 2.2 Required versus anticipated and recent expenditure
25 Refer Policy statement 8, Timor-Leste National Basic Sanitation Policy 2012, p10 26 Pers. comm. Andy Robinson - draft cost estimate for Sanitation Strategic Plan implementation 8/11/2013. Annual cost breakdown is US$4.9 million for demand generation; US$0.59 million for sanitation supply strengthening; US$2.5 million for incentive program; and US$0.8 million for enabling environment costs.
Part of the reason for little to no capital expenditure for sani-tation is that, according to Timor-Leste policy, households are expected to invest in their own sanitation facilities, ex-cept for a limited subsidy program proposed for disadvan-taged households, and community incentives that could offset some sanitation hardware costs. The SDA model cal-culates anticipated household investment as a figure lev-eraged by government capital expenditure, which is likely to be small, especially for onsite sanitation. Actual future household investment is likely to be higher if household self-investment can be successfully stimulated by govern-ment and external non-capital, “software” spending, e.g. sanitation promotion, community mobilization, etc. In the following charts, the anticipated household investment for sanitation is thus not “guaranteed” and the projected ‘defi-cit’ in sanitation spending presents the same high leverag-ing of self-investment by households.
Although anticipated government and development partner capital spending is substantial, it is probably not sufficient to achieve the 2020 goals. This is partly due to the need to consider replacement costs of existing and new infrastruc-ture until 2020, as well as ambitions for networked sewer-age in the capital. In addition, software costs to mobilize rural households to build toilets is a Ministry of Health bud-get line item, yet no budget had been forthcoming from the Ministry of Health up to 2013.
Future software costs for rural sanitation have been estimat-ed for the Rural Strategic Sanitation Plan at US$8.79 mil-lion between 2012 and 2020, or an average of US$976,000 per year.26 This includes costs for demand generation and sanitation promotion (including government programs), strengthening sanitation supply including sanitation mar-
keting; incentive financing (vouchers, rebates etc), and en-abling environment costs such as training.
The following charts summarize the information presented in tables 2.2 and 2.3.
Service Delivery Assessment 11
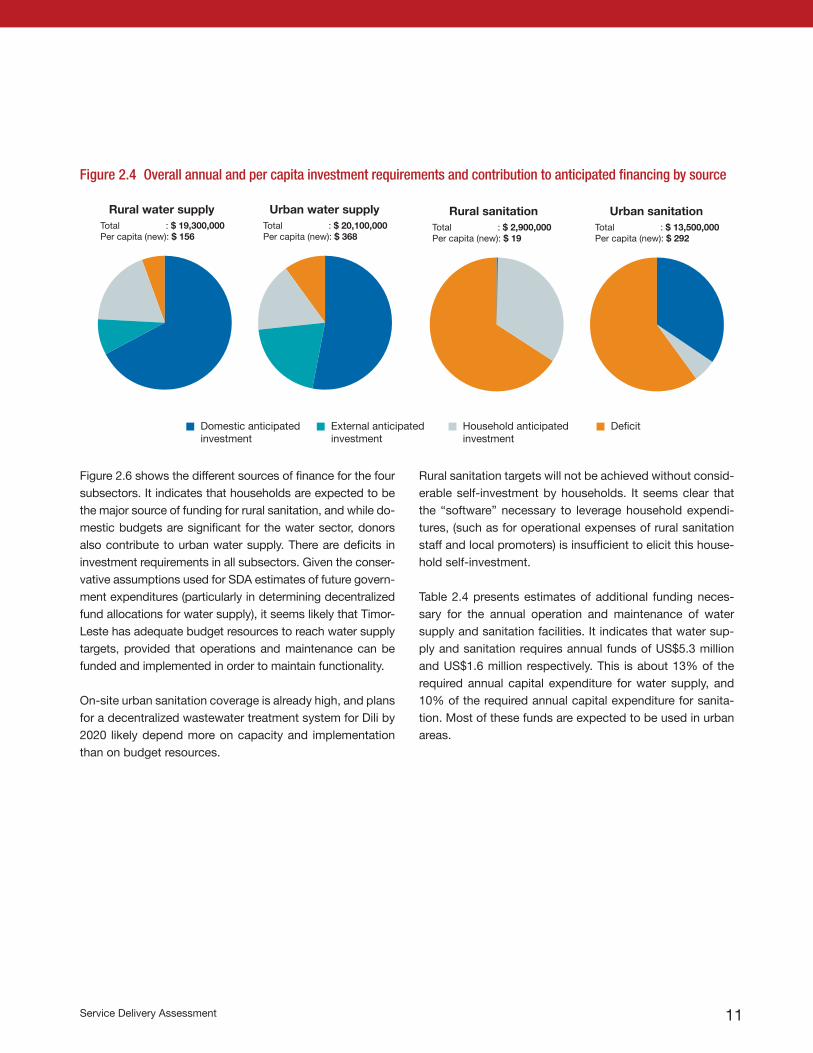
Figure 2.4 Overall annual and per capita investment requirements and contribution to anticipated financing by source
Figure 2.6 shows the different sources of finance for the four subsectors. It indicates that households are expected to be the major source of funding for rural sanitation, and while do-mestic budgets are significant for the water sector, donors also contribute to urban water supply. There are deficits in investment requirements in all subsectors. Given the conser-vative assumptions used for SDA estimates of future govern-ment expenditures (particularly in determining decentralized fund allocations for water supply), it seems likely that Timor-Leste has adequate budget resources to reach water supply targets, provided that operations and maintenance can be funded and implemented in order to maintain functionality.
On-site urban sanitation coverage is already high, and plans for a decentralized wastewater treatment system for Dili by 2020 likely depend more on capacity and implementation than on budget resources.
Domestic anticipated investment
External anticipated investment
Household anticipated investment
Deficit
Urban water supplyTotal : $ 20,100,000Per capita (new): $ 368
Rural water supplyTotal : $ 19,300,000Per capita (new): $ 156
Urban sanitationTotal : $ 13,500,000Per capita (new): $ 292
Rural sanitationTotal : $ 2,900,000Per capita (new): $ 19
Rural sanitation targets will not be achieved without consid-erable self-investment by households. It seems clear that the “software” necessary to leverage household expendi-tures, (such as for operational expenses of rural sanitation staff and local promoters) is insufficient to elicit this house-hold self-investment.
Table 2.4 presents estimates of additional funding neces-sary for the annual operation and maintenance of water supply and sanitation facilities. It indicates that water sup-ply and sanitation requires annual funds of US$5.3 million and US$1.6 million respectively. This is about 13% of the required annual capital expenditure for water supply, and 10% of the required annual capital expenditure for sanita-tion. Most of these funds are expected to be used in urban areas.

Water Supply and Sanitation in Timor Leste12
SubsectorO&M
US$ million/year
Rural water supply 1.9
Urban water supply 3.4
Water supply total 5.3
Rural sanitation 0.2
Urban sanitation 1.4
Sanitation total 1.6
Source: SDA ModelNote: O&M costs are presented as an indicative minimum requirement, assumed to be 3% of the capital cost for water supply piped onto premises or public taps, and 1.5% of the capital cost of other types of water supply technologies. For sanitation, the estimate is 3% of the capital cost for networked sewerage and for pour flush/flush into tanks or pits, and 1.5% for other technologies. This is a standard calculation for the region. For Timor-Leste maintenance costs may well be higher. Totals may not add-up due to rounding
Table 2.4 Annual operation and maintenance requirements

Service Delivery Assessment 13
3. Reform Context
The following section discusses some of the achievements and work in progress in reforming and developing the over-all WASH sector since Independence.
A Challenging Legacy at Independence
Since Independence in 2002, Timor-Leste’s water supply, sanitation and hygiene (WASH) sector has been developing with the assistance of international development partners and NGOs, but not without extreme challenges posed by years of violent foreign occupation, massive destruction of infrastructure, displacement, and political instability.27 Any gains in water and sanitation coverage during the period of Indonesian military control were wiped out by the departing Indonesian army and anti-independence militia following the referendum for self-governance in 1999.28 As recently as 2006, riots in Dili caused further infrastructure destruc-tion and disruption of services. The country’s instability made reform difficult, however important reform initiatives in recent years have positively shaped the rural and urban sectors.
National Plans Provide Goals but Lack Detail
The Government’s Strategic Development Plan to 2011-2030 signifies a shift from a period of building a sovereign state to detailing a development plan and vision for the next 20 years. The Strategic Development Plan elevates water
supply and sanitation to a national priority and sets a goal for universal access to water and sanitation by 2030, but it lacks detail on planning and how the goal will be achieved. The Ministry of Public Works’ recent Five-Year Action Plans 2013-2017 for water supply and sanitation are general plans for achieving goals by subsector, but similarly lack details such as a prioritized and costed investment plan, and implementation plan for the district level. The Minis-try of Health’s Five-Year Plan has limited information about sanitation and hygiene.
Water Supply Reform Needs Updating and a comprehensive Roadmap
Decree No. 4/2004, implemented quickly after Indepen-dence, currently guides the water sector, covering strategic planning and day-to-day activities.29 This decree defines urban and non-urban areas and how they will be served. For urban areas, piped water supply is to be provided in declared water supply zones, under the management of the Water Supply and Sanitation Authority (now the National Directorate of Water Supply - DNSA). In rural areas, com-munity water management groups have been given prime responsibility for supplying water to communities using lo-cal methods to raise revenues for operations, with technical input and oversight provided by DNSA.30 The rural respon-sibility for DNSA is not fully elaborated in the decree and introduces some ambiguity in their role.
27 Independence occurred May 19, 2002. The period of Portuguese rule (1515-1975) included local revolt and benign neglect of the population’s needs. Until the 1950s, the capital Dili had no water supply, electricity, telephone lines, or paved roads. Source: ‘Understanding the Tipping Point, Dili, Timor-Leste’. http://www.urbantippingpoint.org/cities/dili/ viewed 16/4/2013.28 Infrastructure including Mandi, Cuci, Kakus (MCK) – Indonesian public facility combining bathing, washing, and toilet facilities were built during Indonesian occupation. Source: Dutton, P and Siregar, R (2010). Timor-Leste Urban Sanitation Assessment, WSP.29 Government of Timor-Leste (2004) Approval for the Modalities of Distribution of Water for Public Consumption, 11 February 2004.30 Local methods of revenue raising include trading of livestock and collective fund raising. Individual household fee collection is not a cultural practice in rural areas.
Water Supply and Sanitation in Timor Leste14
Community participation in rural water supply planning has been formalized through the Rural Water Community Action Planning (CAP) Guidelines, developed by the government in 2005, with AusAID support. These guide both infrastructure development and community planning to support stake-holders to implement WASH programs in rural communi-ties. Following a review of the community engagement, the CAP guidelines are currently being revised to improve consultation with the community and extend community engagement over the entire project cycle, improve social inclusion (disability and gender), and harmonize the pro-cess with decentralized project approaches to water supply development. In particular, community representation in the monitoring is an added feature.
A National Water Supply Policy (currently being drafted) is needed to update Decree-Law 4/2004 and provide a policy framework to allow future legislation to be developed. The new policy will reflect the rapid development of the sector, provide a long-term vision and clarify institutional roles of the DNSA and broader stakeholders, and outline arrange-ments for water resource management, asset ownership, and financing.
A drag on the development of utilities and urban water ser-vices is the lack of tariffs for urban areas. Tariffs were intro-duced briefly between 2004-2006, but since the Dili riots in 2006 people in Dili have not paid for water. With ADB assistance, trials of metering and tariffs in three subzones in Dili are currently underway to reintroduce water tariffs.31
Sanitation Reform Delayed but now Founded on Progressive Policy
Until recently, sanitation has been a low priority for gov-ernment, reflected in limited institutional capacity within government, and ad hoc planning and development driven by low and unpredictable budget allocations. Evidence of the government’s increasing commitment to and priority for
sanitation improvement includes establishing the National Directorate of Basic Sanitation (DNSB) in the Ministry of Public Works, which—thanks to strong senior leadership of the Secretary of State—has effectively increased the profile of sanitation.32
Replacing the hastily introduced post-Independence 2002 Sanitation Management Decree, the National Basic Sanita-tion Policy was endorsed in 2012 after wide consultation, and has done much to unify the sector approach. The Policy comprehensively covers urban and rural areas, and household, institutional and community sanitation; guides all sector stakeholders on the policy principles, policy in-struments and financing rules that should be utilized; and clarifies the roles and responsibilities of the various stake-holders.33 The main focus is on safe excreta disposal and hygiene behaviors, but the policy also covers solid and haz-ardous waste disposal, and drainage. The policy sets out an integrated and staged approach to achieving a healthy environment, with open defecation free (ODF) sucos being the first target. The immediate challenge and focus is for dissemination, comprehension, and implementation of the policy at district level and below, while improving coordina-tion between Ministry of Health, Ministry of State Adminis-tration, DNSA and DNSB.34
Following approval of the National Basic Sanitation Policy, work began in 2012 on a draft Strategic Sanitation Plan to guide priorities and actions to achieve sanitation targets. Initially covering rural areas, the Strategic Plan clearly states sanitation targets, identifies priority groups and geographic areas, determines the best use of subsector resources and capacity, and proposes tracking of suco sanitation using five levels of achievement – the first being ODF sucos.
Timor-Leste has largely abandoned subsidies for house-hold toilets, instead adopting subsidy-free sanitation pro-motion and triggering behavior to end open defecation, through Community Led Total Sanitation (CLTS). Initially
31 Ministerial Diploma October 2009 – How to regulate/implement a system of tariffs.32 Decree Law No. 1/2011 on Organizational Structure of Ministry of Infrastructure, Article 25 Directorate of National Basic Sanitation Services.33 Timor-Leste National Basic Sanitation Policy, approved by the Council of Ministers in January 2012.34 Pers. comm. Vice Minister for Health, 21/11/2012.
Service Delivery Assessment 15
trialed in 2008, CLTS has now been adopted by the gov-ernment as a primary component within the Community Action Plan for Sanitation and Hygiene (PAKSI) program developed by the Ministry of Health and under trial in selected districts. Government and partners now mostly follow a consistent approach of subsidy-free sanitation.35 Currently being developed is a Program of Assistance for Basic Sanitation that targets vulnerable households iden-tified by the Ministry of Social Solidarity with support to improve sanitation.36
Sanitation and drainage is a priority for the capital Dili and the government has shown a willingness to adopt new technologies not used in Timor-Leste before. In 2012 the government commissioned and funded the preparation of a Sanitation and Drainage Masterplan for Dili.37 This master plan proposes a staged approach to sanitation in Dili, cul-minating in up to eight decentralized wastewater treatment systems by 2025. Stage 2 of the Masterplan, which sets up new organisational and regulatory frameworks and builds one decentralized wastewater treatment plant in central Dili, has been submitted to Ministry of Finance for tendering. This suggests the government is prepared to fund some as-pects of urban sanitation itself. The Master Plan proposes that by 2030 separate government agencies exist for man-aging policy, regulation and operations to improve account-ability, oversight and performance management.
Development Assistance Influenced Reform
Development partners, both donors and international NGOs, have been integral to the introduction of new ideas and practices in Timor-Leste – for example, community planning approaches, CLTS, gender, disability, monitoring tools, and more lately focus on asset management, opera-tions and maintenance and service provider reform. Sup-port has been long term, with the nature of development partner assistance transforming over the last 10 years from emergency response and standalone infrastructure projects
to greater partnership alignment with government develop-ment plans, and an emphasis on technical advice and ca-pacity building.
On a Path to Decentralization
Timor-Leste is committed to decentralization and has devel-oped strategies and a legal framework to delegate spend-ing and management to 13 local district governors, although transformation to full decentralization is not likely until at least 2014. Ministry of State Administration policy guidelines (2008) outline a “single-tier” of municipal government which will merge sub-district and district administrations into mu-nicipalities to deliver services, specifically civil registration, primary health, primary education, water and sanitation, and local roads. It is intended that most sub-district offices will be kept as service-providing extension units.
Funding for decentralized infrastructure development, through block grants, has been in place since trials of the Programa Dezenvolvimentu Lokal (PDL) in 2004. The PDL now operates in all 13 districts. Other programs include the Pakote Referendum in 2009, the Programa Dezenvolvimen-tu Desentralizadu (PDD) begun in 2010, which was split into PDD1 and PDD2. The Programa Nasional Dezenvolvimentu Suku (PNDS) for small scale community projects at suco (village) level including water supply and sanitation is pres-ently under trial in five districts, but set to begin full fund disbursement in 2014.
Community-selected projects under the decentralization programs include water supply schemes and public sani-tation.38 However participatory methods at aldeia (hamlet) level are weak, technical quality of some water and sanita-tion projects has been below standard, value for money has been questioned, and, without provision for maintenance, some schemes have failed.39 Due to poor coordination at district level, decentralized (and NGO) water and sanitation projects seem to be operating outside of the mainstream
35 Some cash incentive programs exist, for example Red Cross provides a cash incentive of $20 as a reward for a select few households who have developed an understanding of hygiene as part of its integrated water, sanitation, hygiene, disaster preparedness, and livelihoods program, however this is very small scale and does not cover the cost of sanitation hardware. 36 The type of sanitation support is yet to be decided but might include a voucher system, rebates, or cash transfers. Pers. comm. Alex Grumbley 13/9/2013.37 GoTL funded international technical expertise from a consortium led by Melbourne Water to prepare the Masterplan.38 Decentralized programs do not fund household toilets, only community toilets eg at villages, markets, schools, bus stations etc.

Water Supply and Sanitation in Timor Leste16
work and knowledge of sector stakeholders such as district DNSA staff.40
Each program had or has different rules as to size of infra-structure and different administration and different mecha-nisms for prioritization. The PDL as well as the PDD2, and PNDS programs are administered by Ministry of State Ad-ministration. In late 2011 the government decided on an integrated mechanism to harmonize deconcentrated devel-opment programs, called Planu Dezenvolvimentu Integradu Distrital (PDID), which includes PDD1, PDD2 and PNDS.
Table 3.1: Key dates in the reform of the sector in Timor-Leste
Year Event
2002 Independence (official date of international recognition of independence 20 May 2002)
2002 Sanitation Management Decree relating to sewage and wastewater disposal in urban areas, solid waste management, and drainage,
2004 Decree No. 4/2004 dated 11 February promulgated (approves the Modalities of Distribution of Water for Public Consumption)
2005 Community Water and Sanitation Guidelines developed by DNSA
2008 Rural Water, Sanitation, Hygiene Sector Strategy 2008-2011 developed
2008Ministry of Health National Integrated Community Health Services (SISCa) starts – includes promotion of sanitation and personal hygiene at monthly community outreach in all districts
2011 Timor-Leste Strategic Development Plan 2011-2030 developed – sets targets for water supply and sanitation to 2030
2010 National Census includes questions on household water and sanitation which match JMP format
2010 National Water Supply Policy developed (draft)
2010 Rural water and sanitation monitoring tool (SIBS) introduced
2011 National Health Sector Strategic Plan 2011-2030 launched
2011 National Development Agency established by decree law to assess and supervise capital works projects including in districts
2011 National Directorate of Basic Sanitation (DNSB) established
2012 National Basic Sanitation Policy approved by Council of Ministers
2012 Dili Sanitation and Drainage Masterplan prepared
2012 Ministry of Health trials Community Sanitation and Hygiene Planning program (PAKSI) (includes subsidy free CLTS approach to sanitation promotion)
2012 DNSA and DNSB Five Year Action Plan 2013-2017 prepared
2013 Strategic Sanitation Plan developed
2013 Trial of water tariffs in selected zones in Dili
2013 Planning for trials of operation & maintenance options for rural water supply systems commenced
This introduction puts the service delivery pathway in context, which can then be explored in detail using the SDA scorecard. The following Sections 4 to 6 highlight progress and challenges within the WASH sector across three thematic areas—the institutional framework, financing systems, and sector monitoring. The scorecards for each subsector are presented in their entirety in Sections 7 to 10.
39 Shortcomings of projects delivered through decentralized block grants are widely reported by many sector experts, and also reported generally eg. Community Experiences of decentralized development in Timor-Leste, The Asia Foundation/Irish Aid; Dale, P and Butterworth, D. (2010) Articulations of Local Governance in Timor-Leste: Lessons for Local Development under Decentralization. Justice for the Poor Policy Note. World Bank. Washington. Kuehn, S (2010).40 Reported by district representatives during SDA workshops in March and June 2013.41 Government of Timor-Leste, Decree Law 2011 National Development Agency. The ADN will eventually evolve to be an economic investment agency in the same vein as national planning agencies in Indonesia, Thailand and Philippines (pers. comm. Alex Sarmento, National Development Agency, 21/11/2013).
Efforts to improve the quality of infrastructure projects, in-cluding decentralized water supply schemes, are in part ad-dressed by the National Development Agency (ADN). Estab-lished by decree law in 2011, this agency evaluates the merits of water and sanitation projects planned by individual minis-tries; and then monitors, using field staff, the delivery of proj-ects and compliance with engineering design and contracts.41 Other factors that are critical for the sustainability of water supply and sanitation projects such as community participa-tion, maintenance, and coordination mechanisms at national and district level are not part of the Agency’s mandate.

Service Delivery Assessment 17
WASH sector responsibilities
The Ministry of Public Works has lead responsibility for ru-ral and urban water supply and sanitation through the Di-rectorates of Water Supply (DNSA) and Basic Sanitation (DNSB).42 A disadvantage of water and sanitation being within the Ministry for Public Works is the tendency for it to be overshadowed by the roads sector, which is a ma-jor priority for the government to achieve strong economic growth and improve human development.43 Sector stake-holders state that insufficient financial commitment is given to water and sanitation, and road development projects are favored. However the establishment of a Secretary of State for Water and Sanitation is going some way to improve the standing of water and sanitation within the Ministry. The Ministry of Health is the lead agency for health and hygiene, rural sanitation and promotion, through the Department for Environmental Health (sanitation) and the Department of Health Promotion (hygiene promotion).
4. Institutional Framework
Other ministries and agencies with responsibilities related to WASH are the ADN, Ministry of State Administration, Ministry of Education, and Ministry of Tourism. Challenges to effective coordination, particularly between the Ministry of Public Work, ADN, and Ministry of State Administration, are due to constantly changing roles and responsibilities of each organization. Efforts are being made by the new Min-ister of Public Works to improve internal coordination within the Ministry.44
Water Supply
In urban areas the operations and management of Timor-Leste’s 13 urban water supply schemes (servicing Dili and 12 district capitals) lies with the DNSA. In rural areas DNSA has a technical advisory role for community managed water supply schemes according to Decree-Law 4/2004.
Priority actions for institutional framework
• Increase autonomy, incentives and accountability of DNSA for improving urban water supply services• Clarify asset ownership and maintenance roles of rural water supply schemes• Strengthen service delivery at district and subdistrict levels including increasing human resources and technical capacity,
and improving coordination• Continue awareness building on options for private sector involvement, and reviewing options appropriate for the stage
of sector development to address capacity constraints• Increase Government commitment to meeting WASH human resource needs including taking responsibility for staff posi-
tions currently funded by donors (if needed) and recruiting adequate numbers of urban and rural staff for DNSB• Clarify the responsibilities and improve coordination between Ministries of Public Works, State Administration, Health,
Education, Tourism etc. in water supply, sanitation, hygiene, and water resources
42 Within the Ministry of Public Works the Directorate General for Water and Sanitation has three directorates: water supply (DNSA), basic sanitation (DNSB), and water quality and control/water resources (DNCQA). In 2011 DNSB was elevated to a separate directorate, equivalent to DNSA, previously being a unit under the former National Directorate for Water and Sanitation (DNSAS). 43 Timor-Leste Strategic Development Plan 2011-2030.44 Pers. comm. B da Sousa, ADB, 12/3/2013.

Water Supply and Sanitation in Timor Leste18
DNSA district offices are small with between 6 and 12 staff, and one or two people assigned to rural WASH. Re-cent placement of 88 sub-district facilitators has helped supplement rural WASH staff.45 District offices are con-strained in service delivery due to: lack of qualified techni-cal staff with skills in engineering design, maintenance etc; a recently (2013) increased but historically small discre-tionary operational budget; lack of vehicles for travelling to urban schemes for operational support; a centralized national procurement system that slows down acquisition of spare parts and repairing water supply systems; lack of clarity over O&M responsibility for rural schemes; ab-sence of performance measures for customer service; and poor communication between national level and district DNSA.46 With possibly the exception of the annual bud-get process, decisions and initiatives affecting the WASH sector are usually developed in Dili and are not always communicated effectively to districts for implementation. National DNSA staff rarely visit districts, and information does not reach district levels on a timely basis (e.g. guide-lines, decisions, outcomes).47 District staff reported feeling abandoned and ignored.48 District level skills and coordi-nation need to be improved including strengthening dis-trict WASH working groups.
Because DNSA operates as a government department it has limited autonomy in decision making, other than for basic op-erations and administration.49 All financing, fees and charges, staffing, infrastructure development, and procurement deci-sions (including hiring of consultants and other technical ex-pertise) require the prior approval of higher level government agencies. This slows down day-to-day operations, and pro-vides no incentive for improving service delivery. Develop-ment partner assistance has helped to build DNSA capacity
to plan, manage, and operate water supply systems and to develop and implement water sector policies, and although improving, overall capacity remains weak. Five-year action plans for rural and urban water and sanitation 2012-2017 lack cost estimates, suggesting a lack of skills in preparing detailed costings, as well as limited coordination with other ministries, NGOs, and donors.
In the urban sector, the ability of the DNSA to operate and maintain urban water supplies is also constrained by limit-ed annual budgets to fund O&M. According to Decree-Law 4/2004, any revenue generated from the reintroduction of tariffs would flow to the Ministry of Finance, not to DNSA, for operational purposes. Currently the only advantage tar-iff reintroduction offers DNSA is as a consumer demand management tool. Maintenance is reactive, planned asset maintenance programs are not implemented, and system functionality and service quality are declining. There is no independent regulator for urban water supply operations or consumer accountability, and in effect DNSA regulates itself. The autonomy of service providers to retain tariffs is essential in establishing a commercial utility approach as a key building block of the sector reform roadmap, as well as the separation of service provision (DNSA) and regulatory functions.
In the rural sector, a key issue is the unclear asset owner-ship of water supply facilities, especially schemes that are community managed. When maintenance beyond basic re-pairs is required, the community will typically turn to DNSA for assistance, but DNSA’s role in major repairs, and bud-get for this, is unclear. Rural water scheme functionality is being tracked through a monitoring system but even when non-functional schemes are identified, there is no capacity
45 88 no. Sub district facilitators directly facilitate community engagement, facilitate community action planning, help establish community management groups, collect water and sanitation monitoring data, and monitor contractor performance.46 District DNSA operational budget has increased to $3,000/month in 2013, up from $1,000/month in 2012. Each district has been provided a vehicle in early 2013 (under BESIK) for rural O&M, but not for urban O&M – pers. comm. K Clark, Program Manager, BESIK, 12/9/1347 Some district towns have not had visits from the national level for 5-7 years, and the lack of communication is worsening - pers. comm. B da Sousa, ADB. 48 District personnel who attended the SDA workshops directly expressed frustration at the failure of national level to communicate information to districts.49 ADB (2011) Democratic Republic of Timor-Leste: Strengthening Water Sector Management and Service Delivery, Technical Assistance Report, Project Number: 45227, Asian Development Bank, Manila; and SDA water supply workshops March and June 2013.

Service Delivery Assessment 19
or budget in DNSA to respond to rehabilitation and repair needs at district level. Rural water supply services are fur-ther complicated by the separate budget and delivery sys-tems of Ministry of State Administration-funded decentral-ization projects. Coordination at the district level is limited to district staff certifying the work of contractors to be paid by Ministry of State Administration. District staff know little about these schemes and have no sense of ownership to-wards their successful execution and operation.
Sanitation and Hygiene Promotion
In urban areas, households are responsible for on-site sani-tation, while wastewater treatment facilities and public toi-lets are the mandate of DNSB. Only Dili and Baucau have septage treatment facilities. The role of districts in urban sanitation has been defined but is not operationalized due to budget constraints.
Rural sanitation is also the responsibility of households with the Ministry of Health taking the lead agency role, and pro-motion of household sanitation and hygiene also the do-main of the Ministry of Health through the Department for Environmental Health. DNSB has no district staff or program budget for rural sanitation. According to rural stakeholders, householders need technical support to build a durable toilet, even dry pit latrines, but this technical support is missing at the district level. Existing sub-district facilitators, placed around the country to support rural water supply, do not have sanitation in their job descriptions although some have had basic training in latrine construction in 2009. Cur-rently no institution is tasked with providing technical sani-tation field support necessary for the implementation of the sanitation policy and rural sanitation programs.
However, currently DNSB is increasing capacity from na-tional level down to the district level with recruitment in 2013 of one sanitation officer in each district to address urban and rural sanitation. Each will be trained in technical and planning aspects of community-based sanitation and hygiene program (PAKSI), but will focus on quality assur-ance of infrastructure. The directorate will also contain a Policy and Strategic Planning section with responsibility to develop a strategy and formulate multi-year plans for the delivery of basic sanitation services in urban and rural areas of Timor-Leste.
Sanitation and hygiene promotion currently occurs through the Ministry of Health, and to a lesser extent, DNSA. En-vironmental health promotion, covering personal hygiene, sanitation, and healthy homes, is extended into rural areas through mobile primary health clinics operated by profes-sional health workers and volunteer Family Health Promot-ers under the Ministry of Health’s SISCa (Integrated Com-munity Health System) program.50 For sanitation promotion SISCa only targets those who attend the suco mobile clinic. However a handwashing with soap campaign currently un-der trial through the SISCa system, supports Family Health Promoters to undertake aldeia based activities for hygiene behavior change and may prove more effective than the suco level intervention. In rural communities where a new water supply system is being implemented DNSA sub-district facilitators provide limited sanitation promotion, although this may be strengthened by recruitment of ru-ral sanitarians and improved cooperation with Ministry of Health, local government and NGOs. Hygiene promotion in urban areas only occurs through the SISCa system or as part of standalone infrastructure projects funded by devel-opment partners.
50 Ministry of Health strengthen communities in the area of health through SISCa (Servisu Integradu da Saúde Communitária – Integrated Community Health Services).

Water Supply and Sanitation in Timor Leste20
The future of rural sanitation and hygiene promotion is ex-pected to be carried forward through the PAKSI program implemented by Ministry of Health sub-district sanitar-ians. Unlike SISCa, PAKSI is implemented at aldeia level thus having a greater reach to households, and directly in-volves local leaders. Based on the results of the trial and sanitarians’ ability to successfully implement PAKSI in three districts, a decision will be made by Ministry of Health on whether to expand this as a national program. This means that long term government funding is required to recruit and train sanitarians and fund operational costs and monitoring for all 65 sub-districts.
Development Partners
Development partners play a key role in supporting the government, particularly in infrastructure funding and more recently capacity building. Simple demarcation between development partners over urban and rural sectors has emerged over time.
In the rural sector, AusAID/DFAT has provided substantial support for water supply and sanitation since 2003, with the current BESIK (Rural Water Supply and Sanitation) program ongoing between 2007 and 2020.52
In 2012 USAID completed a three-year integrated rural wa-ter, sanitation and hygiene project (DWASH) in two districts (Oecussi and Manatuto), however the project has not been scaled up beyond the pilot districts, and USAID is not cur-rently active in the sector.53 The European Commission is supporting rural WASH as part of integrated rural develop-ment.
In the urban sector ADB has been the main funder of urban water supply projects in Dili and district towns (currently infrastructure in Manatuto and Pante Makassar, but in the future institutional support, and water and sanitation mas-ter planning for priority district towns of Baucau, Manatuto, Viqueque, and Los Palos). JICA has provided grant aid for the urban water sector for a number of years, particularly rehabilitation of Dili and district towns water, and recently water treatment facilities in Dili. KOICA has funded Timor-Leste’s first desalination facility.54
A gap in development partner engagement exists in urban sanitation.
NGOs
NGOs play a key role in rural WASH in the absence of strong local government and private sector actors, however they face challenges of limited human resources, technical expertise and financial capacity. Many local NGOs are sup-ported by UNICEF and international NGOs (e.g. WaterAid, Plan, World Vision, Care, Triangle, Red Cross, and Child Fund) to implement water and sanitation in rural areas. The capacity of local NGOs is developing slowly and should improve further as some international NGOs move from contracting local NGOs for project delivery to long-term engagement, capacity building, and organizational support.
BESIK is currently supporting trials of NGOs to provide con-tract maintenance for water supply systems in three loca-tions. While DNSA and the Ministry of Health are uncom-fortable with paying NGOs for this work, it is potentially a solution for improving sustainability of community schemes without tying up DNSA resources in this day to day work.55
51 PAKSI teams are created by the Sanitarian to include Ministry of Health community volunteers who provide support at the SISCas, suco chief, aldeia chief, and natural leaders. 52 BESIK (Be’e Saneamentu no Ijiene iha Komunidade ) Phase I: 2007-2012 (5 years); Phase II: 2012-2020 (in two 4-year blocks) 53 “USAID’s Water Project Leaves Behind Robust Systems, Stakeholder Commitment/ USAID Nia Projetu“http://www.flickr.com/photos/usaid_timor-leste/6718849617/ [viewed 9/8/2013]54 Located in Metinaro (on the outskirts of Dili) which produces 240 m3 per day which is then trucked to schools, clinics and public tanks around the plant.55 The opinion that government did not yet feel comfortable contracting O&M functions to NGOs was expressed by several people working in the sector.

Service Delivery Assessment 21
The Private Sector
Except for small-scale hardware suppliers, the private sec-tor is absent in Timor-Leste’s WASH sector.
The Government is currently contemplating private sector participation in water supply operations and maintenance in district capitals. While the decision is ultimately a political one, DNSA would consider a role for the private sector in service delivery, however the nature of that role was unde-termined.56 Starting with service and management contracts for specific functions would be a realistic way to embark on public private partnerships, as Timor-Leste is not yet ready for full-scale private-public partnership models such as
lease and concessions. Private financing of infrastructure development is likely to be unattractive to investors until contracting, financing and cost recovery, and human re-source capacity conditions are improved, however there are options for performance-based service contracts and other management contracts which could be implemented in the short term under the control of DNSA. The range of private sector engagement options, and the countries and cities where these options are in use, is shown in Figure 4.1.57
Trials of maintenance services for rural water supply un-der contract to NGOs and local companies are being sup-ported by BESIK but could, with guidance, be managed by DNSA.
56 Senior DNSA staff, June 2013; Pers. comm. B de Sousa, ADB Project Officer, 12/3/2013; G Costin, ADB consultant, 19/11/2012.57 More information on PPP in service provision is available at: http://ppp.worldbank.org/public-private-partnership/ and http://wbi.worldbank.org/wbi/about/topics/public-private-partnerships
NRW= Non Revenue Water; O&M= Operations and Maintenance; DBO/DBL= Design Build Operate/Design Build LeaseBOT/BOO = Build Operate Transfer/Build Operate Own
Design/Build O&MJohannesburg,
Kenya
OutsourcingSouth Australia
BOT/BOOBangkok, HCMC
PrivatizationUK, Chile
DBO/DBLVietnam,
Philippines
Service ContractsNRW: Bangkok, HCMC
Billing: Port Moresby
Lease/Affermage
Senegal,Colombia
Joint VentureBrazil,
Shanghai
ConcessionManila, Gabon
“PURE PUBLIC” “PURE PRIVATE”
Figure 4.1 Public-Private Partnership Options
Source: Adapted by authors from WSP Global Meeting on PPP powerpoint presentation by I. Menzies, Nairobi, 28 May 2013.

Water Supply and Sanitation in Timor Leste22
Coordination Mechanisms
Multilateral and bilateral donors are coordinating interna-tional development assistance for water supply and sani-tation with the Ministry of Finance. Technical levels of co-ordination between development partners and government exist on a project basis and through formal sector mecha-nisms such as the WASH Forum and Sanitation Working Group at national level. Coordination between stakehold-ers at district level is however not formalized. Previously, weekly infrastructure round table meetings of development partners provided an opportunity to share activities, issues and solutions. However these ceased when the ADB initia-tor departed Timor-Leste, indicating the need for govern-ment-owned processes. Development partners would wel-come its reinstatement. ADB has proposed establishing a National integrated working group for water and sanitation, however this is awaiting approval from government.
Capacity shortfall
Timor-Leste in general has a shortfall of skilled personnel across many sectors, including WASH. Increased resources and capacity are needed in all subsectors of WASH. For example, DNSB has gone very rapidly from a department to a national directorate. Human resources are especially needed in rural water supply and rural sanitation if targets are to be met.58 Simply to meet the MDG targets, there is demand for an estimated 25 to 70 engineers and 120 to just over 300 technicians across all sectors. The biggest short-fall in positions (where the demand will not be met from annual output of qualified graduates alone) is for techni-cians (drillers, plumbers, carpenters, welders, electricians,
pipe fitters, water supply design technicians, water supply construction technicians) and skilled workers (well builders, hygiene promoters, latrine builders, sanitation mobilizers, hand pump technicians). As mentioned above, outsourcing or developing management contracts with private sector will also be an important way to address capacity gaps in the short and mid-term.
58 FH Designs (2009) Human Resource Capacity in the Water, Sanitation and Hygiene Sector in East Timor, DFID.

Service Delivery Assessment 23
Investment planning
Sector investment plans as a formal tool for public invest-ment planning were abandoned in 2007 due to a change in government focus; currently none of the four sub-sec-tors has a sector investment plan, although there are sev-eral strategies and action plans as discussed in section 2. Timor-Leste uses a medium-term expenditure framework that extends planning out for five years with indications of planning for water supply and some sanitation investments within that framework.
The Government is committed to capital investment, spend-ing US$561 million in 2011 and projected to spend US$1.08 billion by 2015. By comparison, only US$55.8 million (or 5% of the 2015 total capital budget) is needed annually for water and sanitation capital expenditure and US$6.9 million for operations and maintenance expenditure.
Capital expenditure as a proportion of the total government budget was above 50% in 2011 and 2012, but dips to 46%
in the 2013 budget. For 2014 and 2015, budget projections show total capital expenditure at 51% and 52% of the bud-get respectively. According to the 2013 budget commen-tary, inability to spend large amounts from the infrastructure fund caused a dip in total capital spending in 2013. This is a major reason that the 2013 budget has been reduced sub-stantially.59 The projected budgets also evidence the phas-ing out of multilateral grant aid in 2017 from World Bank and ADB, due to Timor-Leste graduating from being eligible for such grants. The country will still be eligible for conces-sional loans and some selected grants in certain sectors or for technical assistance however none has been forecast in budgets.
There are two major sources of capital spending for water supply and sanitation infrastructure in the budget:
1. The Consolidated Fund of Timor-Leste2. The Infrastructure Fund.
5. Financing and Its Implementation
59 Government of Timor-Leste 2013a. p. 47.
Priority actions for institutional framework
• Increase capital works budget execution by improving capacities in public procurement, tendering, and contract man-agement processes and documentation
• Develop costing guidelines to ensure that future project plans for capital investment (hardware) are accompanied by budgets for the required level of technical assistance (software), especially for rural water supply and rural sanitation
• Improve sector financial coordination by annually reporting in one consolidated place, all sources of capital and non-capital funds expended on WASH
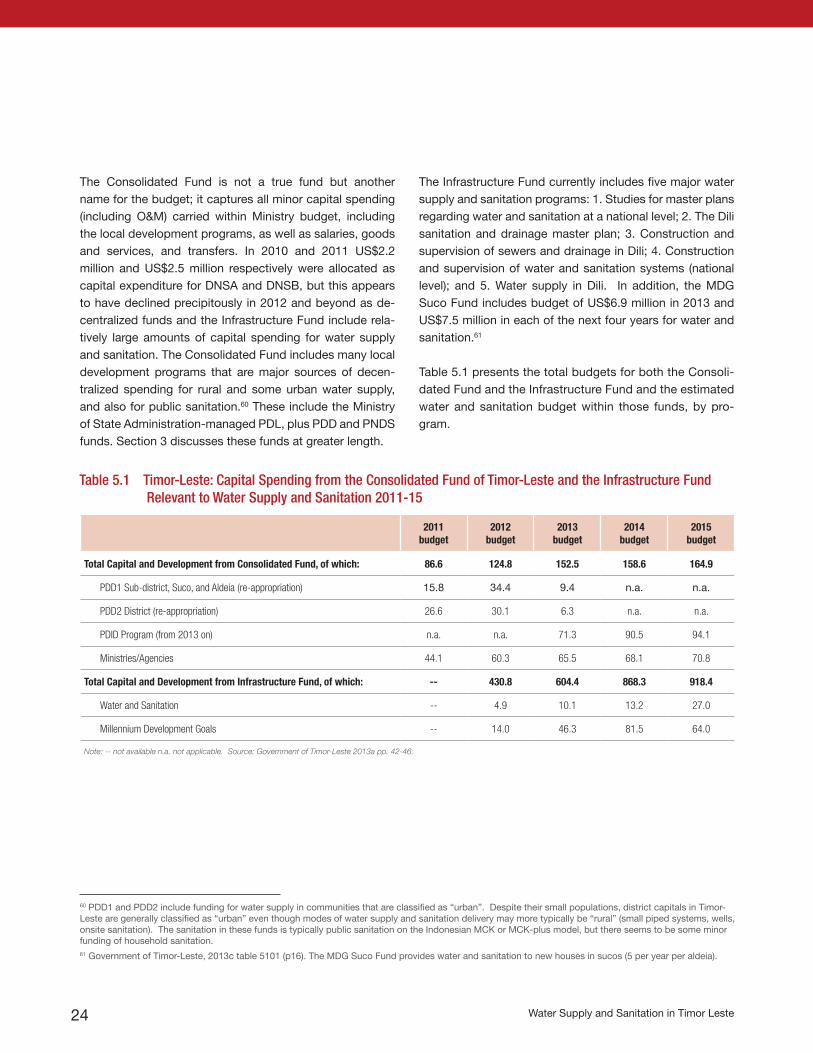
Water Supply and Sanitation in Timor Leste24
The Consolidated Fund is not a true fund but another name for the budget; it captures all minor capital spending (including O&M) carried within Ministry budget, including the local development programs, as well as salaries, goods and services, and transfers. In 2010 and 2011 US$2.2 million and US$2.5 million respectively were allocated as capital expenditure for DNSA and DNSB, but this appears to have declined precipitously in 2012 and beyond as de-centralized funds and the Infrastructure Fund include rela-tively large amounts of capital spending for water supply and sanitation. The Consolidated Fund includes many local development programs that are major sources of decen-tralized spending for rural and some urban water supply, and also for public sanitation.60 These include the Ministry of State Administration-managed PDL, plus PDD and PNDS funds. Section 3 discusses these funds at greater length.
The Infrastructure Fund currently includes five major water supply and sanitation programs: 1. Studies for master plans regarding water and sanitation at a national level; 2. The Dili sanitation and drainage master plan; 3. Construction and supervision of sewers and drainage in Dili; 4. Construction and supervision of water and sanitation systems (national level); and 5. Water supply in Dili. In addition, the MDG Suco Fund includes budget of US$6.9 million in 2013 and US$7.5 million in each of the next four years for water and sanitation.61
Table 5.1 presents the total budgets for both the Consoli-dated Fund and the Infrastructure Fund and the estimated water and sanitation budget within those funds, by pro-gram.
60 PDD1 and PDD2 include funding for water supply in communities that are classified as “urban”. Despite their small populations, district capitals in Timor-Leste are generally classified as “urban” even though modes of water supply and sanitation delivery may more typically be “rural” (small piped systems, wells, onsite sanitation). The sanitation in these funds is typically public sanitation on the Indonesian MCK or MCK-plus model, but there seems to be some minor funding of household sanitation. 61 Government of Timor-Leste, 2013c table 5101 (p16). The MDG Suco Fund provides water and sanitation to new houses in sucos (5 per year per aldeia).
2011 budget
2012 budget
2013 budget
2014 budget
2015 budget
Total Capital and Development from Consolidated Fund, of which: 86.6 124.8 152.5 158.6 164.9
PDD1 Sub-district, Suco, and Aldeia (re-appropriation) 15.8 34.4 9.4 n.a. n.a.
PDD2 District (re-appropriation) 26.6 30.1 6.3 n.a. n.a.
PDID Program (from 2013 on) n.a. n.a. 71.3 90.5 94.1
Ministries/Agencies 44.1 60.3 65.5 68.1 70.8
Total Capital and Development from Infrastructure Fund, of which: -- 430.8 604.4 868.3 918.4
Water and Sanitation -- 4.9 10.1 13.2 27.0
Millennium Development Goals -- 14.0 46.3 81.5 64.0
Note: -- not available n.a. not applicable. Source: Government of Timor-Leste 2013a pp. 42-46.
Table 5.1 Timor-Leste: Capital Spending from the Consolidated Fund of Timor-Leste and the Infrastructure Fund Relevant to Water Supply and Sanitation 2011-15

Service Delivery Assessment 25
Budget transparency
With a basic understanding of funding sources, it is relative-ly easy to identify capital investments in water supply and sanitation from Timor-Leste budget statements, although details on each sub-sector allocations are not available.62 Cooperating ministries and the Ministry of Finance are quite open with financial information, however details of some decentralized fund expenditures were not readily avail-able and are not published, but program data were willingly given where they were available. Operational subsidies for O&M in district budgets cannot be identified in the budget. The most recent available Public Expenditure and Finan-cial Assessment review was undertaken by the IMF in 2010 based on data from 2007-2009. It states fiscal transparency is “quite high” and “overall provision of fiscal information is quite good”.63 The report compliments advances made in public financial management.
Utilization of budgets
The IMF 2010 review of 2007-2009 data concluded that the Timor-Leste budget is not an accurate predictor of ex-penditure, partly due to under-execution of the budget and partly due to supplementary budgets. The IMF 2010 review shows that actual primary expenditure deviated from bud-get estimates by more than 15% in two of the three previ-ous years considered, but has been improving over time. The deviation was 45% in 2007 and 39% in 2008, however it was only 11% in 2009. Moreover, some ministries are bet-ter than the overall ranking; participants in the SDA consul-tation process—many of whom came from the Ministry of Public Works—consistently rated budget execution as high (over 75%). This could partly be explained by the fact that recurring expenditures (salaries) form a high proportion of
the operating budget; and salaries and small capital works budgets are known to execute well.
Most capital expenditures for urban water supply and sanitation are the responsibility of the decentralized funds (largely the responsibility of the Ministry of State Adminis-tration) or the Infrastructure Fund (run by the Ministry of Fi-nance). On the basis of two year’s data from the PDL, the decentralized funds appear to have little difficulty spend-ing budget allocations, but these are for small water sup-ply projects more often associated with rural settings. The consolidation of the local development programs into the Integrated District Development Program (PDID) may affect implementation speed, because the program is forecasted to be quite large and budget execution and implementation could become an issue.
One difficulty that arises is estimating capital works im-plementation and associated expenditure, as evidenced in Infrastructure Fund carry-forwards of unused water and sanitation project allocations.64 Only 40-50% of the Infra-structure Fund is executed, and a substantial proportion of low executed projects are from Public Works.
The process for executing approved projects is clear, with the Ministry of Public Works responsible for project super-vision; ADN responsible for checking and signing off the technical quality of works; and tendering carried out by the new National Procurement Commission. However there are bottlenecks due to poor procurement and contracting pro-cedures and lack of adequate documentation by the Minis-try of Public Works. While the Ministry of Finance payments are quick, it often rejects requests for payments due to poor documentation.65 Delays are also caused by the slow tender preparation through the National Procurement Commission.
62 Budget Book 6 details Infrastructure Fund Projects.63 IMF 2010 p.8.64 The Infrastructure Fund for 2012 was significantly underspent and then reduced in 2013. – pers. comm. K Clark, BESIK Program Manager, 12/9/2013.65 Pers. comm. Hans Beck, Senior Economist, World Bank Timor-Leste, 20/1/2014.

Water Supply and Sanitation in Timor Leste26
6. Sector Monitoring and Evaluation
Timor-Leste is well advanced in the development of moni-toring systems to track progress on water and sanitation. For the first time in 2010, the national Population and Hous-ing Census included questions on household water sup-ply and sanitation using the same definitions as the JMP, providing a comprehensive nationwide picture of access. According to sector professionals, enumerator unfamiliarity with different definitions of sanitation may have resulted in some misunderstanding and incorrect classification of sani-tation types. Further training is needed to improve accuracy in future.
The government is well underway with rolling out a cutting edge aldeia-level water, sanitation and hygiene information system or SIBS (Sistema Informasaun Bee no Saneamentu) which will help government and partners at all levels to plan and monitor progress and sustainability of services, as well as identify service gaps.66 Established with BESIK support, SIBS monitors national coverage and access to water supply and sanitation at the aldeia level. Work is currently ongoing to integrate and overlay information from individual water sup-
ply schemes, including functionality of schemes and areas served, which may be more than one aldeia. Systems are im-proving towards consolidating data from the SIBs and sector planning tool to provide information on the overall function-ality of water supply schemes. For water supply, indicators include the number of households with access to water, time taken to collect water, scheme types, year of modifications to schemes, community management group and scheme func-tioning; for sanitation, monitoring includes household sanita-tion access, and community level ODF status. Sub-district facilitators (DNSA staff) update aldeia data as part of their routine work, and since 2012, relay field information via mo-bile phone SMS messages to the database, which links to a mapping system. Project and scheme-level information is willingly and routinely provided by NGOs and government to update the sector planning database so that it will be pos-sible to identify schemes and unserved areas, and improve linkages between communities with water and schools with-out water. District managers are provided with monthly infor-mation for analysis, although not all district staff are yet fully informed about SIBS.67
Priority actions for sector monitoring and evaluation
• Provide implementation support and training to improve data quality and analytical use of the water, sanitation and hy-giene information system (SIBS).
• Improve performance monitoring, and public disclosure for urban water supply to increase accountability.• Develop asset registers and asset management systems for all urban water supplies in preparation for O&M contracting.• Synchronize data and definitions from different sources in support of robust national country monitoring systems.• Set up subsector multi-stakeholder annual reviews to monitor past progress and agree corrective actions.
66 The database currently covers 96% of aldeias. Presentation by K Clark, BESIK on SIBS during Water Workshop for SDA, March 201367 District staff attending SDA workshops did not have knowledge about SIBS although SIBS has been presented in several workshops. This could be due to other district staff attending the SDA workshops.

Service Delivery Assessment 27
SIBS is not without its challenges, including: resourcing and management of sub-national staff for timely collection of data; quality of sanitation data especially consistent un-derstanding of sanitation by data collectors; accessibility to SIBS information at sub-national offices due to poor in-ternet and computer equipment; government willingness to make SIBS information publically available; and how to link SIBS to an asset management system for each water sys-tem.68 An additional challenge is how to use the information as a tool for integrated planning. Data collection, manage-ment and analysis need strengthening through training and ongoing support.
In the urban water supply sector, ADB is supporting asset re-cording of schemes in Oecussi and Manatuto, as district staff do not have records of the infrastructure in their schemes, making repairs and replacement of spare parts and assets more difficult. Asset registers, with valuations of replacement cost, are useful preparation for transition to any private sec-tor involvement such as contracting out of services and/or establishing a utility.
As a government department, DNSA does not have the monitoring and reporting regime that most urban utilities would employ, including international benchmarking of
070502 Coliate-Leotelo
07 Enmera0705 Haulia
Aldeia
07050201 Leulara
07050202 Raogoa
07050203 Claehema
07050204 Manulete
07050205 Hauhei
07050206 Manucati
07050207 Alhaladiu
Funsionamentu
No piped/pumped system
Always functioning
No piped/pumped system
Partially functioning
Partially functioning
Not functioning
Not functioning
System Functioning Status
> 50% Functioning
> 50% Functioning or Partially Functioning
> 50% Partially Functioning
> 50% Not Functioning or No Piped/Pumped System
Urban
< 50% Aldeia data return
SIBS - Mapping Program
Figure 6.1 Water supply monitoring in SIBS database
68 Water and Sanitation Information System for Timor-Leste SIBS (Sistema Informasaun Bee no Saneamentu) by IRC International Water and Sanitation Centre on Apr 18, 2013. Prepared for the Monitoring Sustainable WASH Service Delivery Symposium, 9 - 11 April 2013, Addis Ababa, Ethiopia. (Available via Slideshare)

Water Supply and Sanitation in Timor Leste28
utility performance. Information on water supply operations and service levels is difficult to obtain. No data are available on septage management, or septic tank operators (except where contracted directly by DNSB). No records are kept of septage disposals at the Tibar wastewater treatment facil-ity or other district facilities. No information is available on the functioning of treatment facilities nor the quality of efflu-ent discharged. An assessment of the functioning of existing treatment works would be useful before expanding the num-ber of facilities in district towns. DNSA and DNSB are both operator and regulator and therefore have little incentive to monitor service performance and make information available to the public. Improved performance monitoring and public disclosure would strengthen accountability and regulatory oversight.
In terms of water quality monitoring, while DNSA has a func-tioning water testing laboratory in Dili developed with support of JICA and USAID, water testing is only regularly conducted for Dili water schemes. Operating and maintaining the testing facility has proved to be a challenge recently. Water quality, as far as identification of suitable sources, may be included in the next issue of the Community Action Planning Guide-lines for rural water supply, however there is no water quality monitoring done presently.
There is no formal joint annual review mechanism in Timor-Leste for water supply or sanitation although this would be desirable according to sector stakeholders. As mentioned in section 4, information sharing between sector stakehold-ers, including national and international NGOs, takes place through the government-chaired WASH Forum and the bi-monthly government-led Sanitation Working Group.69
Monitoring of infrastructure at the higher levels of govern-ment is meant to occur through an Infrastructure Develop-ment Strategic Sector working group led jointly by Ministry of Public Works and Ministry of Transport and Communica-tions, and supported by ADB. This high level working group is one of four strategic sector working groups that links with the Development Policy Coordination Mechanism, set up by the Prime Minister’s office to operationalize the Strategic Development Plan.70 Strategic working group meetings are intended to be held quarterly, bringing together donors, civil society, private sector, and the Ministry of Public Works, and relevant Director Generals for each area to report on annual and five year targets to achieve the Strategic Development Plan. Only one meeting of the infrastructure working group (covering roads and bridges, water and sanitation, urban development, electricity, ports and airports) has been held since the establishment of this mechanism in early 2013.
69 The WASH forum is chaired by DNSA and DNSB with coordination support from BESIK.(pers. comm. Keryn Clark 14/8/2013). The Sanitation Working Group is chaired and managed by Ministry of Health and supported by BESIK. Partners implementing rural sanitation share their annual plans and periodically report achievements. Pers. comm. Alex Grumbley 19/9/2012.70 Government of Timor-Leste (2013) Operationalizing the Strategic Development Plan, Transition from the National Priorities Process to the Strategic Development Plan 2011-2030. Development Policy Coordination Mechanism (DPCM). Concept paper approved by the Council of Ministers on 19 March 2013.

Service Delivery Assessment 29
7. Subsector: Rural Water Supply
0%
20%
40%
60%
80%
100%
1995 2000 2005 2010
Rur
al w
ater
sup
ply
cove
rage
Government estimates Government target
JMP, improved JMP, piped
2015 2020
Figure 7.1 Timor-Leste: Rural Water Supply Coverage and Targets
As of 2011, 60% of the rural population of Timor-Leste had access to improved water supply, an increase from 50% in 2000 (figure 7.1). Based on 2010 Census data, nearly a quarter (23%) of the rural population use a public tap, followed by protected well or spring (16%), with only 15% accessing piped water (to yard or house).71
The number of rural people that gained access between 1995 and 2011 (172,000) exceeded the rural population increase during this period (166,000), meaning that access has more than kept pace with population growth.
The 2020 target is for 80% of rural households to have ac-cess to improved water supply. This requires about 34,000 people per year in rural areas to gain access to improved water supply between 2011 and 2020. This is more than three times the average number of people (10,700 people) who gained access on an annual basis between 1995 and 2011.
Sources: SDA financial model; JMP (2013); GOL (2004); MOH (2012)
Priority actions for rural water supply
• Establish clear policies and define government and community responsibilities for O&M of rural water systems.• Ensure budget is available for technical support systems for O&M services of community-managed schemes.• Increase functionality of water supply schemes by a) improving the spare parts supply chain, b) increasing numbers and
skills of technical staff in districts, and c) professionalizing management of rural water supply through contracting of NGOs and the private sector.
• Make district budgets transparent to show water supply funding from DNSA, decentralized projects, development part-ners and NGOs.
• Finalize community engagement processes to improve community involvement in water supply scheme development and operation, and harmonize approaches with decentralized projects.
• Develop and enforce legislation that is sensitive to traditional customs in order to protect springs and other water re-sources from illegal use.
71 National Statistics Directorate and United Nations Population Fund (2011) Population and Housing Census 2010, Dili: Government of Timor-Leste.

Water Supply and Sanitation in Timor Leste30
Source: SDA Estimates
Figure 7.3 Timor-Leste: Estimates of Required and Anticipated Rural Water Supply Capital Expenditures to meet 2020 Target; Recent Capital Expenditure Investment Estimates
Figure 7.2 Timor-Leste: Estimates of Annual Rural Water Supply Capital Expenditures and Anticipated Sources Necessary to Meet 2020 Target
Totalinvestmentrequirement
Anticipatedinvestment2013-2015
Recentinvestment2010-2012
Ann
ual i
nves
tmen
tin
mill
ion
US
D
0
5
10
15
20
Other
Replacement
New
Household
External
Domestic
Household anticipated investmentDeficit
Domestic anticipated investmentExternal anticipated investment
Total : $ 19,300,000Per capita (new): $ 156
The SDA financial model estimates that in order for the target to be achieved, an annual expenditure of US$19.3 million will be necessary; some US$6.4 million for new in-vestments and US$12.9 million to replace new and existing stock. Assumptions are detailed in Annex 2.
Anticipated investment over the next three years (2013-2015) is almost to the level of required investment. Most of this money comes from government, including decentral-ized funds. With more attention to operations and mainte-nance of rural water supplies, the 2020 targets could easily be met. Greater attention to O&M will increase life span and functionality of assets; requiring less future investment in replacement of schemes and saving money in the long run.
Figure 7.4 shows the scorecard results for the rural water supply service delivery pathway. The scores for the rural water supply enabling environment are varied. The subsec-tor has national targets, policy direction from the Water De-cree 2004 (and a new Water Policy under development), as
well as clear but underfunded institutional roles. The scores for the planning-related building blocks of rural water ser-vice delivery highlight the need for coordination of funds from different sources, particularly integration of decentral-ized funds, government and development partner funds; a sector investment plan; and annual reviews with all stake-holders. Another bottleneck is the lack of human resources with technical and social skills to execute all facets of rural water service delivery. BESIK has supported placement of some new sub-district facilitators, however most districts are missing much needed engineering staff, and there is a need for people with technical skills such as drillers, weld-ers, plumbers, water supply technicians, etc.72
Source: SDA Estimates
72 Pers. comm. Anor Sihombing, BESIK National Engineering Adviser, 19/9/2012; FH Designs (2009) Human Resource Capacity in the Water, Sanitation and Hygiene Sector in East Timor, DFID

Service Delivery Assessment 31
Sufficient budget is probably available to meet the ru-ral water supply targets, but only if attention is given to operations and maintenance to ensure the water supply schemes continue to function. Without this attention to sustainability, progress towards targets will begin to fall behind. Funds for preventive maintenance, major repairs (beyond the capacity of local communities) and techni-cal support services to community-managed schemes need to be included in annual budgets. At the same time, a funding line would need to be established to allow for replacement of rural water assets at the end of their eco-nomic lifespan, as such replacement costs are normally not covered through rural water tariffs.
In terms of developing new services, budget allocations from both government and development partners for ru-ral water supply are executed effectively. Processes for local participation and engagement are well document-ed by government in the Rural Water Supply Guidelines and Community WASH Planning Manual. However, those working in the sector thought implementation of these pro-cesses could be stronger and more consistent, especially on decentralization projects where the guidelines may not be followed as rigorously. The Guidelines are currently un-der review to strengthen the process and harmonize with decentralized projects. The most difficult and most ex-pensive communities to serve are low density settlements in remote rural areas of the country. These communities
Enabling Developing SustainingPlanning
0.8
Policy
2.5
Budget
1.5
Output
2
Expenditure
2.5
Maintenance
0.8
Equity
1.5
Expansion
0.5 2
Use Outcomes
make up a high proportion of unserved communities. The government’s strategy, through the MDG Suco program, is to move remote households to newly built houses (with water and toilets) within new accessible settlements. To date there has been very little take up of this option by remote households.
Under the sustaining pillar, records are now being kept of the location and functionality of schemes through SIBS. While many water management committees are collecting fees for basic operations, there is no system or policy in place for financing and delivering effective maintenance beyond minor repairs. The unavailability of spare parts, even in Dili, and lack of standardized equipment, such as pumps, is a serious bottleneck in service sustainability. Requisitioning spare parts through the government sys-tem can take months.73 Some positive signals of the gov-ernment’s change in commitment to O&M are an increase in the 2013 district operating budget, plus a 2014 budget submission for 13 rural O&M technical staff (1 per district) to be recruited by DNSA and trained by BESIK.
The expansion building block scores red as there are barriers to the expansion of existing schemes despite this being a legitimate government function. A standard exists for water quality, as well as a professional water testing lab, but test-ing is rarely carried out after scheme design due to sampling logistics, unavailability of chemicals, and insufficient budget.
73 Pers. comm. Anor Sihombing, BESIK National Engineering Adviser, 19/9/2012; Rob Dewhirst, ADB consultant 8/6/2013
Figure 7.4 Timor-Leste: Rural Water Supply Scorecard

Water Supply and Sanitation in Timor Leste32
In terms of user outcomes, access to improved water is fair-ly equitable, with 43% of the rural population in the lowest wealth quintile having access, and 77% in the highest quin-tile. This is also due to government policy that focuses on public standpipes and considers this an appropriate level of service. Piped connections to individual households remain at a low level of 14%, with only 3% of the poorest rural quintile having access to individual house connections, and 28% among the richest quintile.74
Timor-Leste does not have abundant natural water resourc-es. A significant number of water systems rely on spring catchments and ground water sources that are recharged by
74 UNICEF/WHO Equity analysis for East Asia Pacific using DHS 2009 data.
rainfall. Shifting rainfall patterns and other potential effects of climate change could have serious impacts on water supply systems including availability of water resources in general. In addition, water sources are not properly controlled and need protection against illegal use and overuse eg. irrigation. This requires a coordinated approach between government agencies and integrated catchment management.
National level government officials attended training in late 2012 on adapting to climate change including water re-sources, sanitation, drainage and solid waste. As yet there are no plans or budgets for addressing climate change risk and implementing risk reduction strategies at local level.

Service Delivery Assessment 33
Approximately 93% of the urban population had access to improved water supply in 2011 (figure 8.1). However the lev-el of household connections is low with fewer people having direct access to a piped water service than use other forms of improved water supply. According to the 2010 Census, 41% of urban households have individual connections with piped water on to their premises. Significant sections of the population still rely on public taps (24%), tubewells or bore-holes (16%), and protected springs (8%). The number of urban people that had access to improved water supply in 2011 (304,000) has more than doubled compared with that in 1995 (129,000), suggesting access has more than kept pace with population growth and high rates of urbanization.
The 2020 target is for 100% of urban households to have access to improved water supply. This requires about 21,766 people per year in urban areas to gain access to im-
8. Subsector: Urban Water Supply
0%
20%
40%
60%
80%
100%
1995 2000 2005 2010
Urb
an w
ater
sup
ply
cove
rage
2015 2020 2025
Government estimates Government target
JMP, Improved JMP, Piped
Figure 8.1 Timor-Leste: Urban Water Supply Coverage and Targets
Sources: SDA financial model. JMP (2013); GOL (2004), GOL NSEDP7 (2015 target); MOH (2012)
Priority actions for urban water supply
• Develop a roadmap for urban water sector reform and regulatory framework that will increase the autonomy of DNSA/service providers, introduce incentives to drive performance improvements and establish separate regulatory functions
• Roll out wider tariff reform to fund operations and maintenance and increase sustainability of water systems• Reinforce coordination among agencies involved in local planning, urbanization, water supply, and drainage including
district coordination • Improve water quality of service provision, including testing regimes and disclosure• Introduce socialization programs and sanctions to control illegal connections and reduce water wastage

Water Supply and Sanitation in Timor Leste34
Figure 8.3 Timor-Leste: Estimates of Required and Anticipated Urban Water Supply Capital Expenditures to meet 2020 Target; Recent Capital Expenditure Investment Estimates
Figure 8.2 Timor-Leste: Estimates of Annual Urban Water Supply Capital Expenditures and Anticipated Sources Necessary to Meet 2020 Target
Household anticipated investmentDeficit
Domestic anticipated investmentExternal anticipated investment
Total : $ 20,100,000Per capita (new): $ 368
Source: SDA Estimates.
Source: SDA Estimates; see Annex 2 for further details.
Totalinvestmentrequirement
Anticipatedinvestment2013-2015
Recentinvestment2010-2012
Ann
ual i
nves
tmen
t in
mill
ion
US
D0
5
10
15
20
25
Other
Replacement
New
Household
External
Domestic
proved water supply between 2011 and 2020. This is twice the average number of people (10,967 people) who gained access on an annual basis between 1995 and 2011. While the increase in percentage terms from 93% to 100% ac-cess appears achievable based on past trends, a challenge to attaining this target is keeping pace with rapid urbaniza-tion.
In order to meet the government’s 2020 target of 100%, an annual expenditure of US$20.1 million will be necessary; some US$8.9 million for new investments and more than half the requirement - US$11.2 million – is to replace new and existing stock (see figure 8.2 and 8.3). The average amount of investment anticipated for the next three years comes close to meeting the required investment, and has increased compared to estimates of recent levels of invest-ments. However this relatively “modest” deficit might be misleading as a large proportion of anticipated investment has been earmarked for Dili water supply, and other urban centers may miss out. Assumptions are detailed in Annex 2.
The service delivery pathway for urban water has a strong enabling environment but has bottlenecks in achieving ser-vice sustainability. Clear targets articulated at the national and ministerial level provide direction, and are supported by policy statements and clear institutional responsibilities. Improvements in sector coordination (especially between central level and districts), annual reviews, costed invest-ment plans, human resource capacity, and increased and reliable budget, would strengthen the urban water sector foundation. The subsector is seriously underfunded if piped water coverage is to increase, and O&M is supported.

Service Delivery Assessment 35
Enabling Developing SustainingPlanning
1.1
Policy
3
Budget
2
Output
2
Expenditure
2
Maintenance
0
Equity
1
Expansion
0.5 2
Use Outcomes
In the developing pillar of urban water, budget utilization is high. Processes for local participation and reducing in-equality tend to be donor-driven and are not mainstreamed into national policies or guidelines as is the case for the ru-ral water subsector. Although national drinking water stan-dards exist, water quality monitoring is not systematically carried out outside of Dili, due to the cost, time, and logis-tics of collecting samples and transporting them between district towns and the DNSA laboratory in Dili.
The sustaining pillar of the urban water service delivery pathway has serious weaknesses. Non-revenue water is close to 100%.75 There are discrete trials of metering and tariff collections currently underway in piped water subzones in Dili that were upgraded with ADB financ-ing. Although earlier ADB technical assistance supported training and procurement of equipment to support the reintroduction of tariffs including billing and collection, a positive step is that DNSA is now continuing the pilot with-out support from ADB. The pilot subzones represent a small proportion of the total urban service area that could generate income from water sales. Wider introduction of user fees would first require capital investment to replace pipes and upgrade services, and a comprehensive social-ization process to inform people about laws and obliga-tions of both customer and service provider. 76 The valu-able experiences from the Dili trials can inform a broader tariff implementation program.
Lack of revenue from user fees restricts the execution of operations and maintenance necessary to maintain a qual-ity service which in turn users are willing to pay for. In other words, without tariffs the direct accountability between customer and service provider is absent. Tariffs used in the subzone trials are identical to those in the 2004 Water Decree, and while deemed adequate for present circum-stances, a tariff policy and review process will need to be developed in future that rationally sets prices for water. Tar-iff reform would also need to address greater autonomy for DNSA to retain and control revenues rather than the Ministry of Finance so that O&M can be effectively addressed. This reform would require a utility approach with autonomous service provision and regulation functions to be separated. A regulation study would be needed to assess the best in-stitutional and organizational arrangements for hosting eco-nomic and service regulation.
The imposition of tariffs was assumed to happen and did not emerge as a strong priority in the stakeholder consul-tations. However, the need for financing and implementing operations and maintenance of urban water systems was a priority.
Another major weakness is the lack of an independent and accountable water utility with autonomy in decision making for investment planning, human resources, and procure-ment. As a government entity, DNSA only has autonomy
75 Non-revenue water is measured as the difference between the volume of water produced in a system and the volume of water billed. 76 During SDA workshops, DNSA staff stated they had already experienced abuse and physical threats when delivering tanker water in some areas.
Figure 8.4 Timor-Leste: Urban Water Supply Scorecard

Water Supply and Sanitation in Timor Leste36
in minor administrative matters, with all other decisions re-ferred to government. This is a serious constraint to day-to-day operations, especially for district towns that already have logistic and communication difficulties between dis-trict towns and the national DNSA in Dili. Also as a gov-ernment entity, without operational control, DNSA has no incentive to improve performance of water supply services as there is no direct benefit in doing so.
The national assessment of climate change and disas-ter risk considers the impact of water shortages.77 While emergency procedures are in place and funding is avail-able in the event of a natural disaster, proactive climate adaption strategies and climate proofing have yet to be integrated into urban water supply services. This will be-
77 Government of Timor-Leste (2010) National Adaptation Programme of Action (NAPA) On Climate Change. Dili: Ministry for Economy And Development, Secretary of State for Environment78 Piped water access figures from National Statistics Directorate and United Nations Population Fund (2011) Population and Housing Census 2010, Social and Demographic Characteristics, Volume 3, Dili: Government of Timor-Leste
come critical for Dili as the major urban center and nation’s capital.
Given the high level of access to improved water supply, Timor-Leste is well on its way to meeting targets for access to improved water. However while access to piped water is around 65% (household connections and public taps), the reality is that for most people in district towns and Dili, piped water is only available a few hours per day.78 In Dili the poor service is largely the result of missing or aging pipe networks and inadequate demand management through tariffs and regulation. The overall risk of this service delivery pathway is that capital investment without the necessary reforms will translate into unsustainable services, leading to sub-optimal user outcomes.
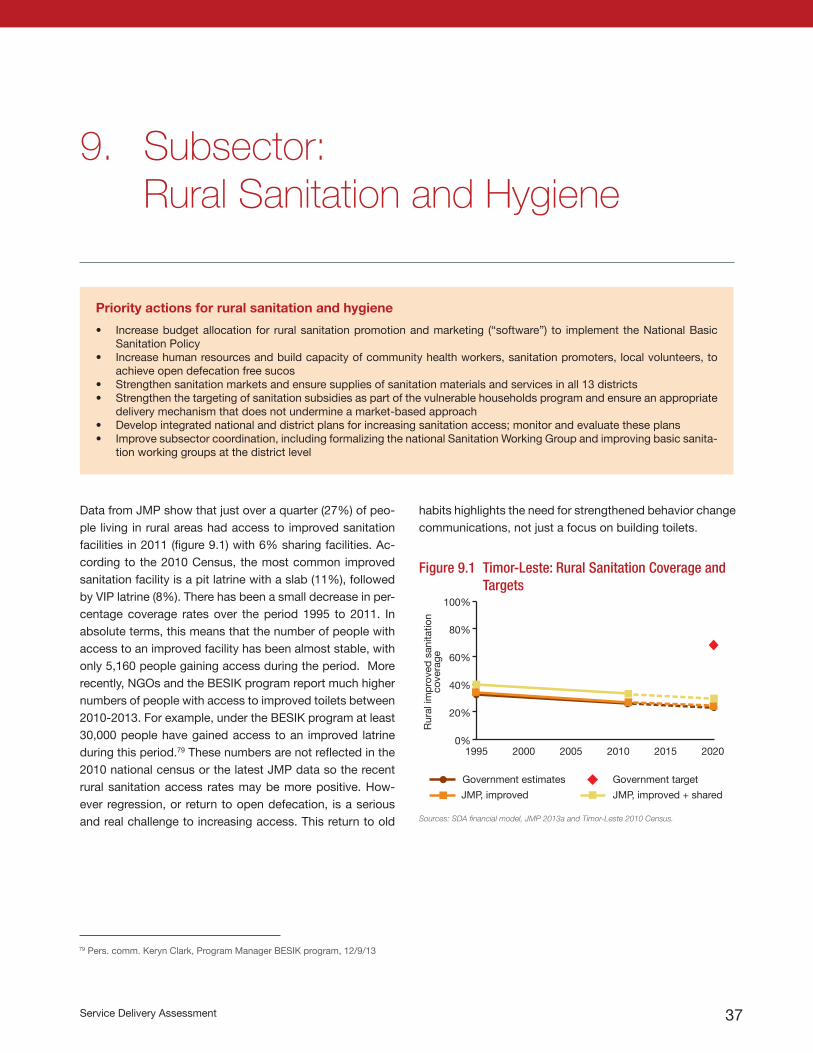
Service Delivery Assessment 37
Data from JMP show that just over a quarter (27%) of peo-ple living in rural areas had access to improved sanitation facilities in 2011 (figure 9.1) with 6% sharing facilities. Ac-cording to the 2010 Census, the most common improved sanitation facility is a pit latrine with a slab (11%), followed by VIP latrine (8%). There has been a small decrease in per-centage coverage rates over the period 1995 to 2011. In absolute terms, this means that the number of people with access to an improved facility has been almost stable, with only 5,160 people gaining access during the period. More recently, NGOs and the BESIK program report much higher numbers of people with access to improved toilets between 2010-2013. For example, under the BESIK program at least 30,000 people have gained access to an improved latrine during this period.79 These numbers are not reflected in the 2010 national census or the latest JMP data so the recent rural sanitation access rates may be more positive. How-ever regression, or return to open defecation, is a serious and real challenge to increasing access. This return to old
9. Subsector: Rural Sanitation and Hygiene
habits highlights the need for strengthened behavior change communications, not just a focus on building toilets.
Priority actions for rural sanitation and hygiene
• Increase budget allocation for rural sanitation promotion and marketing (“software”) to implement the National Basic Sanitation Policy
• Increase human resources and build capacity of community health workers, sanitation promoters, local volunteers, to achieve open defecation free sucos
• Strengthen sanitation markets and ensure supplies of sanitation materials and services in all 13 districts • Strengthen the targeting of sanitation subsidies as part of the vulnerable households program and ensure an appropriate
delivery mechanism that does not undermine a market-based approach• Develop integrated national and district plans for increasing sanitation access; monitor and evaluate these plans • Improve subsector coordination, including formalizing the national Sanitation Working Group and improving basic sanita-
tion working groups at the district level
Figure 9.1 Timor-Leste: Rural Sanitation Coverage and Targets
0%
20%
40%
60%
80%
100%
1995 2000 2005 2010
Rur
al im
prov
ed s
anita
tion
cove
rage
Government estimates Government target
JMP, improved JMP, improved + shared
2015 2020
Sources: SDA financial model, JMP 2013a and Timor-Leste 2010 Census.
79 Pers. comm. Keryn Clark, Program Manager BESIK program, 12/9/13

Water Supply and Sanitation in Timor Leste38
be successful. Sufficient funding is also required for mar-ket development — to make appropriate, affordable toilets easily available to rural households — as well as for gov-ernment operational budgets, and capacity building. These software costs are estimated at US$976,000 annually and are in addition to the annual capital expenditure required for rural sanitation in figure 9.2.
Much of the investment in domestic facilities has been ini-tiated and funded by householders themselves because, until recently, most promotional projects by government and development agencies were short term and on a fairly small scale. Such projects tended to promote relatively expensive toilet designs and to rely heavily on the use of hardware subsidies as an incentive for toilet construction. The National Action Plan indicates that in future, hard-ware subsidies should be provided only for the poorest and most remote communities, following the successful piloting of Community-Led Total Sanitation (CLTS) in re-cent years.
Figure 9.2 Timor-Leste: Estimates of Annual Rural Sanitation Capital Expenditures and Anticipated Sources Necessary to Meet 2020 Target
Source: SDA Estimates
Household anticipated investmentDeficit
Domestic anticipated investmentExternal anticipated investment
Total : $ 2,900,000Per capita (new): $ 19
The 2020 target (derived from the Sanitation Strategic Plan 2030 target of 100%) is for 68% of the rural population to have access to improved sanitation facilities. This requires 51,700 people per year in rural areas to gain access to im-proved sanitation between 2011 and 2020, or 161 times the average number of people (320 people) who gained access annually between 1995 and 2011.80
In order to meet the government’s 2020 target of 68%, it is estimated that an annual expenditure of US$2.9 million is necessary, for new investments and to replace new and existing stock (see figure 9.2 and 9.3). Sanitation is con-sidered a household investment decision so to achieve the 2020 target, households need to be motivated to invest in new toilets and in replacing them after their functional lifespan (see details in annex 2). Current efforts in sanitation promotion, including Community-led Total Sanitation, and marketing will have a positive impact on progress but data do not show this yet. This “software” for sanitation promo-tion, and behavior change needs funding commitment to
Figure 9.3 Timor-Leste: Estimates of Required and Anticipated Rural Sanitation Capital Expenditures to meet 2020 Target; Recent Capital Expenditure Investment Estimates
Totalinvestmentrequirement
Anticipatedinvestment2013-2015
Recentinvestment2010-2012
Ann
ual i
nves
tmen
t in
mill
ion
US
D
0.0
0.5
1.0
1.5
2.0
Other
Replacement
New
Household
External
Domestic
2.5
3.0
3.5
Source: SDA Estimates
80 Authors’ calculations using JMP access and population data

Service Delivery Assessment 39
Enabling Developing SustainingPlanning
1.1
Policy
3
Budget
2
Output
2
Expenditure
2
Maintenance
0.8
Equity
1.5
Uptake
2
Use Outcomes
0
Since households will continue to be the predominant source of capital financing, the deficit indicated in Figure 14 below is in fact a deficit in household financing. Even the anticipated household investments might not, in practice, materialize — especially if government and development partners devote insufficient resources to sanitation promo-tion and supply side development and so fail to elicit house-hold investments.
The sanitation component of the National Action Plan en-visages a substantial scaling up of sanitation and hygiene promotion, with the bulk of the funding needs arising from the costs of promotion and marketing. As with rural wa-ter supply, poor and remote communities are prioritized for support but implementation of the plan depends on Depart-ment of Hygiene together with the provincial departments developing a detailed sector investment plan, based on the outline provided in the Action Plan, and securing funding from government and development partners.
The rural sanitation service delivery has good enabling foundations in place to support the scaling up needed to reach 2020 targets, yet weaknesses emerge in the sustain-ing area of the pathway. With clear targets, a sanitation policy, and well defined institutional roles, Timor-Leste has a strong framework. While there are various subject reviews in place and forums for technical issues such as the Sani-tation Working Group, and generally good informal coop-
eration between stakeholders, an annual multi-stakeholder review is needed to closely monitor the annual progress to-wards targets and identify reasons for slow progress if the country is to successfully intensify efforts to meet targets. The recent draft Sanitation Strategy and monitoring tools such as SIBS provide valuable data that could be utilized in a regular review so that all stakeholders are working to-gether in a coordinated fashion. The budgeting process is clear and transparent, however more money needs to be allocated to the subsector for “software”: human resourc-es, operational budgets, training for sanitation and hygiene promotion, marketing, incentives, program supervision and monitoring. The adoption of the PAKSI sanitation promotion approach by government and development partners provides a uni-fied framework for achieving sanitation targets. However this approach must be actively supported and funded by the government in order to scale up and deliver on the full implementation potential. PAKSI operationalizes the ob-jectives of the National Basic Sanitation Policy, covering hygiene and solid waste, elimination of open defecation, building hygienic toilets, using handwashing facilities, dis-posing of solid waste safely and managing wastewater. With BESIK support, the PAKSI program is currently being trialed by Ministry of Health in 15 subdistricts and 164 sucos with training of community health workers/sanitation motivators underway since the first quarter of 2013. PAKSI is also be-
Figure 9.4 Timor-Leste: Rural sanitation scorecard

Water Supply and Sanitation in Timor Leste40
ing trialed concurrently in selected sucos in four districts by national NGOs.81 These efforts, including financing of sub district sanitarians and training of facilitators, will need to be replicated in the remaining subdistricts of Timor-Leste in or-der to meet targets. Developing strong links between PAKSI and sanitation market development will also be needed to enable households to either buy or build toilets once their motivation is “triggered”.
Timor-Leste has a history of conducting useful research (on topics such as handwashing with soap, WASH and dis-ability access, sanitation marketing) that has contributed to evidence-based rural sanitation and hygiene approaches.
A challenge to scaling up rural sanitation is the availability of sanitary products and services such as toilets pans and construction materials and skilled sanitation personnel in remote rural areas, where poor roads and transport make access difficult and increase the price of goods. These bot-tlenecks in the supply chain are being addressed through development of easily transportable sanitation products, and training of the private sector, but more needs to be done to ensure there is a cost effective market for sanitation in all districts. Increased government support and incen-tives for the private sector could help overcome these chal-lenges. Improvements in rural road networks will benefit the expansion of the sanitation market.
Rural sanitation is estimated to be off track to meet the MDG targets, which will set it back in achieving longer term 2020 targets unless intensive scaling up occurs soon. Ac-cording to WHO/UNICEF analysis, those missing out on improved sanitation are the poorest 20% of rural residents, who are 12 times less likely to have an improved toilet than the wealthiest 20% of rural households.
The focus on rural sanitation in the last three years has likely resulted in an increase in access (which will not be known until the next census or national survey), but more remains to be done. To help redress inequalities in sanita-tion access, a subsidy program for vulnerable households to increase access to sanitation was piloted by the gov-ernment in 2011-2012, however budget uncertainty and shortcomings in targeting the poor have hampered imple-mentation.82 The program is being evaluated and is likely to be relaunched in 2015. Without such a program it will be difficult for the bottom 20% of rural households to access sanitation, however, targeting and delivery mechanisms of subsidies for poor and vulnerable households need to be carefully designed, so as to i) incentivize usage of facilities, ii) align with community open defecation free outcomes and iii) minimize distortion of market-based approaches.
81 Ministry of Health sanitarians are trialing PAKSI in 15 subdistricts in Baucau, Bobonaro and Liquica; national NGOs are trialing the approach in sucos obtaining a water supply system in Lautem, Manatuto, Ainaro and Covalima.82 Program of Assistance for Basic Sanitation. This policy uses established criteria of the Ministry of Social Solidarity.

Service Delivery Assessment 41
By JMP estimates, 68% of the urban population had ac-cess to improved sanitation in 2011 (figure 10.1), and was as high as 84% when shared facilities are counted.83 Ac-cording to the 2010 Census the majority of toilets are pit latrines with a slab (37%), followed by pour flush to a pit or septic tank (24%), and VIP latrines (20%). Smaller sur-veys in Dili and Baucau indicate that the majority of toi-lets in these urban centers are water flush toilets, but few households ever empty their pit or septic tank suggesting widespread leaching of septage into the ground.84 Very little urban wastewater is treated with only Dili and three of the thirteen district capitals having treatment ponds to receive septage and those that do exist in Manatuto, Baucau and Suai are not well maintained.
Between 1995 and 2011 access to improved sanitation increased by 17%, and in absolute terms, the number of people with access to improved sanitation has more than doubled from an estimated 97,920 in 1995 to 222,360 in 2011. However the increase in number of people gaining access during the period (124,000) has not quite kept pace with urban population growth (135,000).85
10. Subsector: Urban Sanitation and Hygiene
The country is off-track in meeting the urban sanitation target of 93% by 2020. Meeting this target requires about 26,960 people gaining access to improved sanitation each year between 2011 and 2020. This is more than three times higher than the rate of annual increase (7,778 people per year) reported for 1995 to 2011.
83 In Timor-Leste sharing of toilets occurs between related family households.84 From survey results in 2010, 97% of Dili’s and 88% of Baucau’s toilets were pour flush, however only 16% and 20% of these households respectively had ever emptied their pit. Dutton, P and Siregar, R (2010). Timor-Leste Urban Sanitation Assessment, WSP.85 Authors’ calculations using JMP access and population data.
Priority actions for urban sanitation and hygiene
• Implement Dili Sanitation and Drainage Master Plan stage 2• Prepare Sanitation Master Plans for the remaining 12 district capital towns (excluding Dili)• Improve septage collection and maintenance of septage facilities in all towns• Increase the human resources capacity for sanitation in each district capital town according to the population size of
each town and sanitation needs • Increase community awareness of urban sanitation roles, responsibilities, and obligations of government and households
0%
20%
40%
60%
80%
100%
1995 2000 2005 2010
Urb
an im
prov
ed s
anita
tion
cove
rage
Government estimates Government target
JMP, improved JMP, improved + shared
2015 2020
Figure 10.1 Timor-Leste: Urban Sanitation Coverage and Targets
Sources: SDA financial model, JMP (2013). MOH and LSB (2012a) Targets agreed by national experts for the purposes of SDA.
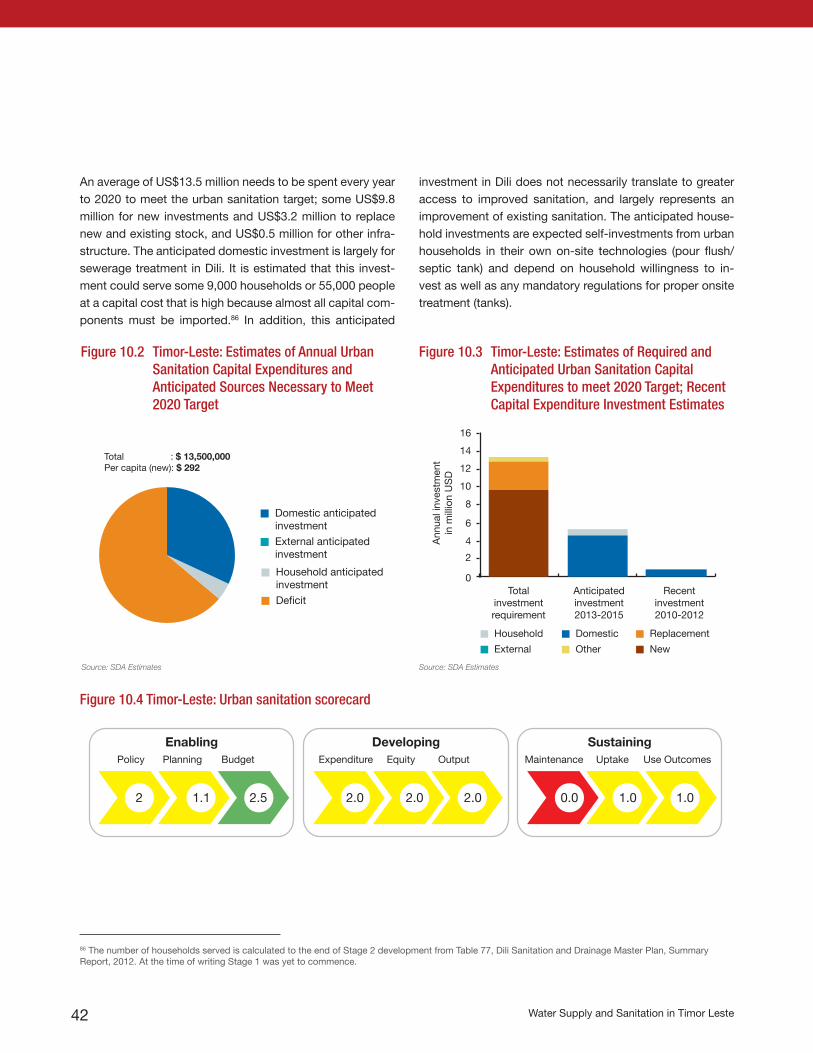
Water Supply and Sanitation in Timor Leste42
An average of US$13.5 million needs to be spent every year to 2020 to meet the urban sanitation target; some US$9.8 million for new investments and US$3.2 million to replace new and existing stock, and US$0.5 million for other infra-structure. The anticipated domestic investment is largely for sewerage treatment in Dili. It is estimated that this invest-ment could serve some 9,000 households or 55,000 people at a capital cost that is high because almost all capital com-ponents must be imported.86 In addition, this anticipated
investment in Dili does not necessarily translate to greater access to improved sanitation, and largely represents an improvement of existing sanitation. The anticipated house-hold investments are expected self-investments from urban households in their own on-site technologies (pour flush/septic tank) and depend on household willingness to in-vest as well as any mandatory regulations for proper onsite treatment (tanks).
Figure 10.2 Timor-Leste: Estimates of Annual Urban Sanitation Capital Expenditures and Anticipated Sources Necessary to Meet 2020 Target
Source: SDA Estimates
Household anticipated investmentDeficit
Domestic anticipated investmentExternal anticipated investment
Total : $ 13,500,000Per capita (new): $ 292
86 The number of households served is calculated to the end of Stage 2 development from Table 77, Dili Sanitation and Drainage Master Plan, Summary Report, 2012. At the time of writing Stage 1 was yet to commence.
Totalinvestmentrequirement
Anticipatedinvestment2013-2015
Recentinvestment2010-2012
Ann
ual i
nves
tmen
tin
mill
ion
US
D
Other
Replacement
New
Household
External
Domestic
0
2
4
6
8
10
12
14
16
Figure 10.3 Timor-Leste: Estimates of Required and Anticipated Urban Sanitation Capital Expenditures to meet 2020 Target; Recent Capital Expenditure Investment Estimates
Enabling Developing SustainingPlanning
1.1
Policy
2
Budget
2.5
Output
2.0
Expenditure
2.0
Maintenance
0.0
Equity
2.0
Uptake
1.0
Use Outcomes
1.0
Figure 10.4 Timor-Leste: Urban sanitation scorecard
Source: SDA Estimates

Service Delivery Assessment 43
The urban sanitation service delivery pathway has a rela-tively strong enabling environment. Access targets are stat-ed in national planning documents, although sewerage and septage management targets do not exist. Responsibili-ties in the subsector are defined through the 2012 National Basic Sanitation Policy, yet there is work to be done on operationalizing the roles at district level and clarifying the roles of SAS, Ministry of State Administration, and Ministry of Health. Planning of urban sanitation is one of the weaker building blocks with room for improvement in coordination of planning processes and budgeting (between both the district and central level, and between multiple stakehold-ers). There is no annual multi-stakeholder review that in-cludes participation of district and central government, and development partners, to agree on needs for urban sanita-tion and review progress. Although a review of the WASH human resources capacity was conducted in 2009, there are simply not enough staff and not enough staff skilled in urban sanitation to support the sector.87 To improve fecal waste collection and management, skills will be needed in the areas of planning and engineering design; construction; management, operations, and maintenance of sewage sys-tems and sewerage/septage treatment facilities. Some re-sources and services could be sourced and/or contracted out to the private sector.
Development and delivery building blocks of urban sanita-tion require some attention. Under the expenditure building block, budget execution is good but reporting of spending on urban sanitation against budget in a consolidated format is needed for all sources of expenditure, including donor contributions. This would help improve tracking of finances. The equity building block would score better if there were plans developed and implemented for serving the urban poor with sanitation, and there is good monitoring to track this, eg. the National Census of Population, however the quality of sanitation is not monitored and the quantity of fe-cal waste collected has no target and is difficult to monitor.
The sustaining pillar is the weakest for urban sanitation. The maintenance building block scores low as much of the fecal waste generated in urban areas is not collected. None of the urban areas of Timor-Leste have centralized sewage treat-ment facilities, and there are only four urban centers with simple septage treatment facilities, and these are not well maintained. Existing septic tanks and pit latrines in urban areas pollute shallow aquifers, particularly in Dili where the urban populations are most dense and many parts of the city have a very high water table. To improve fecal waste col-lection and septage treatment in all urban areas, additional budget will be required.
The Dili Sanitation and Drainage Master Plan provides for a staged approach to a sewerage system development with the addition of new infrastructure. However this is expen-sive and will require significant up skilling to operate and maintain effectively, and is unlikely to lead to any new ac-cess in the short term.88 The Dili Sanitation and Drainage Master Plan proposes by 2030: that water and sanitation and drainage operations are managed by the same entity preferably a utility (with water) under an operating licence; better planning controls exist; the sanitation system is self funding with revenues from customers paying for opera-tions, maintenance and depreciation; and an independent regulator exists for reviewing economic performance of util-ity and setting prices. O&M costs are not currently covered by user fees (except payments collected by the private sector for septic tank desludging) but charging tariffs will become important as more sophisticated networked infra-structure is adopted.
While wastewater standards exist for treatment plants, these are not monitored.89 Expansion of services is ham-pered by the lack of business plans for expanding fecal waste collection and treatment in towns, and low level of encouragement for households in urban areas to take up or improve their sanitation, and the absence of the pri-
87 FHDesigns, 2009. Human Resource Capacity in the Water, Sanitation and Hygiene Sector in East Timor, DFID. Lack of technical capacity was a key issue raised by stakeholders at the Sanitation Workshop June 2013.88 Dili Sanitation and Drainage Master Plan, Summary Report, 201289 Private contractors are not charged for disposing of septage in Tibar treatment facility. A proposal for charging users was developed by DNSB and signed off by Ministry of Health however the Ministry of Justice did not approve it. Pers. comm. Joao de Piedade, DNSB, 6/6/2013.

Water Supply and Sanitation in Timor Leste44
vate sector in district towns other than Dili. The subsector could meet the access target for households in 2020 with more attention to low income households. Currently 32% of urban households do not use improved toilets with the lowest income quintile being three times less likely to have improved sanitation.
ADB has a proposal for preparing water supply and sanita-tion masterplans for district capitals to produce demand-responsive investment plans for Baucau, Los Palos, Mana-
tuto and Viqueque over the period 2013-2030 in line with national development targets. The master planning process will include a social and technical assessment to produce investment plans based on the best options for sanitation. Once the master plans are completed, significant funding will be needed for implementation, and another eight dis-trict towns will still require similar planning and infrastruc-ture development. In the longer term, such investment plans might attract more external financing in addition to domestic financing.

Service Delivery Assessment 45
About 69% of Timor-Leste people have access to improved water, and only 39% have access to improved sanitation. Remarkable progress in water supply and sanitation cover-age has been achieved in the last 10 years. However, rural sanitation continues to lag behind. To achieve the govern-ment’s targets for 2030, by 2020 access to water should be at 87% and sanitation 76%. Spending to reach the 2020 access targets requires an average of US$39.4 million each year for water supply and US$16.4 million per year for sani-tation, as well as US$7 million per year to finance O&M of current and future water and sanitation infrastructure, and about US$1 million for rural sanitation software. For wa-ter supply, the estimated necessary capital expenditures amount to approximately 2.4% of the 2013 national com-bined sources budget of US$1.6 billion. Estimated opera-tions and maintenance costs are 0.4% of the 2013 budget.
Estimated annual capital expenditure for the next three years (2013-15) by government and development partners is US$29.4 million for water supply, and with assumed household investments of around US$7 million, the financ-ing gap for water supply is limited to less then 10% of that required to meet targets.
Estimated annual capital expenditure on sanitation for the next three years (2013-2015) is US$4.7 million by govern-ment, with assumed household investments of US$1.7 mil-
11. Conclusion
lion. The annual financing gap to meet targets is US$10.0 million. Capital spending on sanitation planned by either government or development partners is largely for major capital works in Dili only, yet there is a need for improved septage collection and treatment in other urban centers. No capital expenditure by government or donor is planned for rural areas as sanitation is considered to be a household investment.
In terms of the service delivery scorecard, Timor-Leste per-forms adequately in the ‘enabling’ area across all subsec-tors due to the presence of policy guidelines, national and subsector targets, and relatively clear institutional roles. Budget structures and processes are in place, however funding is unpredictable and fluctuates considerably from year to year, and non-existent for essential rural sanitation software. Timor-Leste’s scores in ‘developing’ services, which relate to expenditure of funds, systems for allocating them equitably, and securing value-for-money outputs, in-dicate that some improvements are required in the areas of contract documentation, budget execution for major capital works, prioritizing budget allocation and reporting on ex-penditure as well as reducing inequality and improving con-sistent local participation in all subsectors. At the end of the service delivery pathway, Timor-Leste’s scores show poor performance in ‘sustainability’ for all subsectors, especially for maintenance (refer to Figure 11.1).

Water Supply and Sanitation in Timor Leste46
The key bottlenecks that currently impede progress in Timor-Leste’s water and sanitation sector are:• lack of autonomy and incentives for urban water ser-
vice providers to improve service delivery• lack of funding for rural and urban water supply opera-
tions and maintenance• absence of a strategy for technical support and main-
tenance services to sustain functionality of rural water supply schemes
• lack of promotion (“software”) for households to take up sanitation in rural areas
• difficulty in obtaining sanitation goods and services, water supply spare parts and repair services in rural areas
• shortages of human resources, especially skilled tech-nical staff
• poor coordination, planning and communication be-tween central and district levels
• inadequate septage collection and treatment facilities in urban areas.
Charging of user fees in the urban water sector and devel-opment of a clear strategy to effectively support operations and maintenance in the rural water sector would unlock this sustainability bottleneck. Tariff reform would need to
address greater autonomy and incentives for urban water providers to retain and control revenues so that O&M can be effectively addressed. With improved operations and maintenance, water supply systems could last longer, save on replacement costs, and be a more cost effective invest-ment. The development of a roadmap for longer term re-form in urban areas as well as the possibility to engage the private sector as part of the solution to deal with weak ca-pacities and poor O&M practices needs to be considered.
Public funding is necessary for “software”, such as behavior change communication campaigns, monitoring and regula-tion, and private sector development to induce households to invest in their sanitation facilities. In the urban sector capital investment is needed to implement the Dili Sanita-tion and Drainage Master Plan, plan and improve sanita-tion in district capitals, and improve septage collection and maintenance of septage facilities in all towns.
Improvements in monitoring—improved data quality and analytical use of SIBS; performance monitoring and public disclosure for urban water supply; and synchronization of data from different sources into robust national monitoring system—would improve sector planning, accountability, and public support.

Service Delivery Assessment 47
Figure 11.1 Timor-Leste: Subsector Scorecards
RURAL WATER SUPPLY
URBAN WATER SUPPLY
RURAL SANITATION AND HYGIENE
URBAN SANITATION AND HYGIENE
Enabling Developing SustainingPlanning
0.8
Policy
2.5
Budget
1.5
Output
2
Expenditure
2.5
Maintenance
0.8
Equity
1.5
Expansion
0.5 2
Use Outcomes
Enabling Developing SustainingPlanning
1.1
Policy
3
Budget
2
Output
2
Expenditure
2
Maintenance
0
Equity
1
Expansion
0.5 2
Use Outcomes
Enabling Developing SustainingPlanning
1.1
Policy
3
Budget
2
Output
2
Expenditure
2
Maintenance
0.8
Equity
1.5
Uptake
2
Use Outcomes
0
Enabling Developing SustainingPlanning
1.1
Policy
2
Budget
2.5
Output
2.0
Expenditure
2.0
Maintenance
0.0
Equity
2.0
Uptake
1.0
Use Outcomes
1.0


Ser
vice
Del
iver
y A
sses
smen
t49
Ann
ex 1
: S
core
card
and
Evi
denc
e fo
r Sco
ring
The
follo
win
g ta
ble
pres
ents
the
scor
es a
nd e
vide
nce
for
each
ser
vice
del
iver
y in
dica
tor.
Eac
h in
dica
tor
can
scor
e 0,
0.5
or
a m
axim
um o
f 1. T
hese
sco
res
are
com
bine
d to
form
a to
tal s
core
for e
ach
of th
e ni
ne s
ervi
ce d
eliv
ery
build
ing
bloc
ks —
pol
icy,
pla
nnin
g, b
udge
t, ex
pend
iture
, equ
ity, o
utpu
t, m
aint
enan
ce, e
xpan
sion
, use
r out
com
e.
The
over
all b
uild
ing
bloc
k sc
ores
for
each
sub
sect
or a
re p
rese
nted
in t
he r
elev
ant
subs
ecto
r se
ctio
ns o
f the
rep
ort.
The
scor
es w
ere
deriv
ed fr
om a
ser
ies
of w
orks
hops
w
ith t
he p
artic
ipat
ion
of s
ever
al s
take
hold
ers:
DN
SA
, SA
S d
istr
ict
staf
f, D
NS
B, M
inis
try
of E
duca
tion,
AD
N, d
istr
ict
adm
inis
trat
ion
staf
f (M
anut
uto,
Liq
uica
, Bau
cau,
Dili
), M
inis
try
of H
ealth
, Chi
ef C
abin
et o
ffice
, BE
SIK
pro
gram
, AD
B, W
ater
Aid
, Red
Cro
ss, U
NIC
EF,
HTL
.
Build
ing
bloc
kNo
.Ar
eas
of
evid
ence
for
asse
ssm
ent
Ques
tion
High
(1)
Med
ium
(0,5
)Lo
w (0
)Sc
ore
Expl
anat
ion
for s
core
Sour
ce o
f evi
denc
e
RURA
L SA
NITA
TION
ENAB
LING
Polic
yRW
S 1
Sect
or ta
rget
sAr
e th
ere
RWS
acce
ss ta
rget
s in
the
natio
nal l
evel
de
velo
pmen
t pla
n?Ye
s, th
ere
are
targ
ets
for r
ural
w
ater
sup
ply
in
the
deve
lopm
ent
plan
Ther
e ar
e na
tiona
l ta
rget
s in
the
deve
lopm
ent
plan
but
non
e fo
r ru
ral w
ater
No ta
rget
s in
the
deve
lopm
ent
plan
1Na
tiona
l Stra
tegi
c De
velo
pmen
t Pla
n re
fers
to 7
5% o
f rur
al h
ouse
hold
s ha
ving
acce
ss to
saf
e, re
liabl
e an
d su
stai
nabl
e w
ater
by
2020
Natio
nal S
trate
gic
Deve
lopm
ent P
lan
(201
1-20
30) -
Offi
ce o
f the
Prim
e M
inis
ter
Polic
yRW
S 2
Sect
or p
olic
yIs
ther
e a
rura
l wat
er p
olic
y th
at is
agr
eed
by
stak
ehol
ders
, app
rove
d by
gov
ernm
ent,
and
is
publ
icly
avai
labl
e?
Polic
y of
ficia
lly
appr
oved
and
pu
blic
ly av
aila
ble
Polic
y dr
afte
d an
d ag
reed
but
no
t offi
cial
ly ap
prov
ed
No p
olic
y1
2004
Dec
ree
publ
icly
avai
labl
e. D
raft
polic
y fo
rmat
. App
lies
to b
oth
urba
n an
d ru
ral.
Wat
er S
uppl
y Po
licy
(Dra
ft 3
Dec
2010
); De
cree
Law
No
.4/2
004
Polic
yRW
S 3
Inst
itutio
nal r
oles
Ar
e th
e in
stitu
tiona
l rol
es o
f rur
al w
ater
sub
sect
or
play
ers
(nat
iona
l/sta
te &
loca
l gov
ernm
ent,
serv
ice
prov
ider
, reg
ulat
or e
tc) c
lear
ly de
fined
and
op
erat
iona
lized
?
Defin
ed a
nd
oper
atio
naliz
edDe
fined
but
not
op
erat
iona
lized
Not d
efine
d0.
5De
fined
in D
ecre
e an
d dr
aft p
olic
y (ru
ral a
nd u
rban
). In
stitu
tions
are
ca
rryin
g ou
t ass
igne
d ro
les
but
insu
ffici
ent b
udge
t and
reso
urce
s to
fu
lly o
pera
tiona
lize.
No
regu
lato
r
Wat
er S
uppl
y Po
licy
(Dra
ft 3
Dec
2010
); De
cree
Law
No
.4/2
004;
Wat
er w
orks
hop
Mar
ch 2
013
Plan
ning
RWS
4Fu
nd fl
ow
coor
dina
tion
Does
gov
ernm
ent h
ave
a pr
oces
s fo
r coo
rdin
atin
g m
ultip
le in
vest
men
ts in
the
subs
ecto
r (do
mes
tic
or d
onor
, eg.
Nat
iona
l gra
nts,
sta
te b
udge
ts, d
onor
lo
ans
and
gran
ts e
tc.)?
Coor
dina
tion
proc
ess
defin
ed a
nd
oper
atio
naliz
ed
Coor
dina
tion
proc
ess
defin
ed b
ut n
ot
oper
atio
naliz
ed
Not d
efine
d/no
pr
oces
s0.
5In
vest
men
ts c
oord
inat
ed a
t the
M
inis
try o
f Fin
ance
leve
l. Do
nor
fund
s no
t act
ively
coor
dina
ted
by
gove
rnm
ent.
SDA
finan
cial
ana
lysis
; W
ater
wor
ksho
p M
arch
20
13

Wat
er S
upp
ly a
nd S
anita
tion
in T
imor
Les
te50
Build
ing
bloc
kNo
.Ar
eas
of
evid
ence
for
asse
ssm
ent
Ques
tion
High
(1)
Med
ium
(0,5
)Lo
w (0
)Sc
ore
Expl
anat
ion
for s
core
Sour
ce o
f evi
denc
e
Plan
ning
RWS
5In
vest
men
t pla
nIs
ther
e a
med
ium
-ter
m in
vest
men
t pla
n fo
r rur
al
wat
er b
ased
on
natio
nal t
arge
ts th
at is
cos
ted,
pr
iorit
izes
inve
stm
ent n
eeds
, is
publ
ishe
d an
d us
ed?
Inve
stm
ent p
lan
base
d on
prio
rity
need
s ex
ists
, is
publ
ishe
d an
d us
ed
Exis
ts b
ut n
ot
used
, or u
nder
pr
epar
atio
n
Does
not
exis
t0
No S
ecto
r Inv
estm
ent P
lan
curre
ntly.
On
e w
as p
repa
red
with
the
first
Na
tiona
l gov
ernm
ent b
ut n
othi
ng
sinc
e.
Wat
er w
orks
hop
Mar
ch
2013
Plan
ning
RWS
6An
nual
revie
wIs
ther
e a
annu
al m
ulti-
stak
ehol
der r
evie
w in
pl
ace
to m
onito
r sub
sect
or p
erfo
rman
ce, t
o re
view
pr
ogre
ss a
nd s
et c
orre
ctive
act
ions
?
Revie
w o
f pe
rform
ance
an
d se
tting
of
corre
ctive
act
ions
Revie
w o
f pe
rform
ance
bu
t no
setti
ng o
f co
rrect
ive a
ctio
ns
No re
view
or
set
ting
of
corre
ctive
act
ions
0No
ann
ual r
evie
w p
roce
ssW
ater
wor
ksho
p M
arch
20
13
Plan
ning
RWS
7HR
cap
acity
Has
an a
sses
smen
t bee
n un
derta
ken
of th
e hu
man
reso
urce
nee
ds in
the
sub
sect
or to
mee
t th
e su
bsec
tor t
arge
t and
is th
e ac
tion
plan
bei
ng
impl
emen
ted?
Asse
ssm
ent
unde
rtake
n an
d ac
tions
bei
ng
impl
emen
ted
Asse
ssm
ent
unde
rtake
n bu
t no
act
ion
bein
g ta
ken
No a
sses
smen
t un
derta
ken
0.5
Asse
ssm
ent d
one
incl
udin
g by
su
bsec
tor,
with
som
e ac
tion
take
n to
ad
dres
s sk
ill sh
orta
ges
alth
ough
no
follo
w u
p si
nce.
DFID
Hum
an R
esou
rce
Capa
city
in th
e W
ASH
sect
or
in T
L 20
09; W
ater
wor
ksho
p M
arch
201
3
Budg
etRW
S 8
Adeq
uacy
(of
finan
cing
)Ar
e th
e pu
blic
fina
ncia
l com
mitm
ents
to th
e ru
ral
wat
er s
ubse
ctor
suf
ficie
nt to
mee
t the
nat
iona
l ta
rget
s fo
r the
sub
sect
or?
Mor
e th
an
75%
of w
hat i
s ne
eded
Betw
een
50-
75%
of n
eeds
Less
than
50%
of
nee
ds1
In re
cent
yea
rs e
noug
h m
oney
goi
ng
tow
ards
new
cap
ital t
o m
eet n
atio
nal
targ
ets
Pers
com
m K
Cla
rk; S
DA
Fina
ncia
l ana
lysis
; Bud
get
Book
s fo
r 201
1, 2
012,
20
13
Budg
etRW
S 9
Stru
ctur
eDo
es th
e bu
dget
stru
ctur
e pe
rmit
the
inve
stm
ents
an
d su
bsid
ies
(ope
ratio
nal c
osts
, adm
inis
tratio
n,
debt
ser
vice,
etc
) for
the
rura
l wat
er s
ecto
r to
be
clea
rly id
entifi
ed?
Yes
for
inve
stm
ent a
nd
for s
ubsi
dies
Yes
for
inve
stm
ent b
ut
not s
ubsi
dies
No0.
5M
ay b
e cl
ear a
t nat
iona
l lev
el b
ut
budg
et c
omes
in a
pac
kage
at D
istri
ct
leve
l so
it is
not
cle
ar if
mon
ey is
for
rura
l or u
rban
; als
o bu
dget
s pu
blis
hed
at d
istri
ct le
vel d
o no
t dis
aggr
egat
e be
twee
n ru
ral a
nd u
rban
Wat
er w
orks
hop
Mar
ch
2013
; SDA
fina
ncia
l ana
lysis
Budg
etRW
S 10
Com
preh
ensi
veDo
es th
e go
vern
men
t bud
get c
ompr
ehen
sive
ly co
ver d
omes
tic a
nd o
ffici
al d
onor
inve
stm
ent/
subs
idy
to ru
ral w
ater
?
Mor
e th
an 7
5%
of fu
nds
to s
ub-
sect
or o
n bu
dget
Betw
een
50-
75%
of f
unds
to
sub-
sect
or o
n bu
dget
Less
than
50%
of
fund
s to
sub
-se
ctor
on
budg
et
0Do
nor f
undi
ng e
g BE
SIK
and
NGOs
no
t in
budg
etW
ater
wor
ksho
p M
arch
20
13; S
DA fi
nanc
ial a
nalys
is

Ser
vice
Del
iver
y A
sses
smen
t51
Build
ing
bloc
kNo
.Ar
eas
of
evid
ence
for
asse
ssm
ent
Ques
tion
High
(1)
Med
ium
(0,5
)Lo
w (0
)Sc
ore
Expl
anat
ion
for s
core
Sour
ce o
f evi
denc
e
DEVE
LOPI
NG
Expe
nditu
reRW
S11
Utiliz
atio
n of
do
mes
tic fu
nds
Wha
t per
cent
age
of d
omes
tic fu
nds
budg
eted
for
rura
l wat
er a
re s
pent
(3 y
ear a
vera
ge)?
Over
75%
Betw
een
50%
an
d 75
%Le
ss th
an 5
0%1
No p
robl
em s
pend
ing
budg
etGo
vern
men
t bud
get r
ecor
ds
Expe
nditu
reRW
S12
Utiliz
atio
n of
ex
tern
al f
unds
Wha
t per
cent
age
of e
xter
nal f
unds
bud
gete
d fo
r ru
ral w
ater
are
spe
nt (3
yea
r ave
rage
)?
Over
75%
Betw
een
50%
an
d 75
%Le
ss th
an 5
0%1
No p
robl
em s
pend
ing
budg
etW
ater
wor
ksho
p M
arch
20
13 a
s re
porte
d by
BES
IK
and
UNIC
EF
Expe
nditu
reRW
S13
Repo
rting
Is ru
ral w
ater
exp
endi
ture
ver
sus
budg
et a
udite
d an
d re
porte
d on
in a
con
solid
ated
form
at fo
r all
sour
ces
of d
omes
tic a
nd o
ffici
al d
onor
exp
endi
ture
?
Yes
for d
omes
tic
and
dono
r ex
pend
iture
Yes
for d
omes
tic
expe
nditu
reNo
0.5
Not c
onso
lidat
ed. G
over
nmen
t doe
s pu
blic
aud
it. D
onor
s m
ay d
o au
dit b
ut
resu
lts a
re n
ot d
iscl
osed
.
Wat
er w
orks
hop
Mar
ch
2013
Equi
tyRW
S14
Loca
l pa
rtici
patio
nAr
e th
ere
clea
rly d
efine
d pr
oced
ures
for i
nfor
min
g,
cons
ultin
g w
ith a
nd s
uppo
rting
loca
l par
ticip
atio
n in
pla
nnin
g, b
udge
ting
and
impl
emen
ting
for r
ural
w
ater
dev
elop
men
ts?
Yes
and
syst
emat
ical
ly ap
plie
d
Yes,
but
not
sy
stem
atic
ally
appl
ied
No0.
5Co
mm
unity
role
cle
arly
defin
ed in
De
cree
and
Pol
icy,
and
also
CAP
pr
oces
s to
est
ablis
h Co
mm
unity
Gr
oup
Man
ager
s (G
MFs
). •
Proj
ect
Cycl
e an
d Co
mm
unity
Man
agem
ent
Proc
ess
in T
imor
Les
te R
ural
Wat
er
Supp
ly Gu
idel
ines
•
PDL/
PDD/
PDID
legi
slat
ions
Wat
er S
uppl
y Po
licy
(Dra
ft 3
Dec
2010
); De
cree
Law
No
.4/2
004;
CAP
gui
delin
es,
PDD/
PDL
prog
ram
le
gisl
atio
n
Equi
tyRW
S15
Budg
et a
lloca
tion
crite
riaHa
ve c
riter
ia (o
r a fo
rmul
a) b
een
dete
rmin
ed to
al
loca
te ru
ral w
ater
fund
ing
equi
tabl
y to
rura
l co
mm
uniti
es a
nd is
it b
eing
app
lied
cons
iste
ntly?
Yes,
app
lied
cons
iste
ntly
Yes,
but
no
t app
lied
cons
iste
ntly
No0.
5Po
ssib
ly a
crite
ria in
term
s of
pop
ulat
ion
but n
ot a
pplie
d co
nsis
tent
ly.
Wat
er w
orks
hop
Mar
ch
2013
Equi
tyRW
S16
Redu
cing
in
equa
lity
Is th
ere
perio
dic
anal
ysis
to a
sses
s w
heth
er
allo
catio
n cr
iteria
and
loca
l par
ticip
atio
n pr
oced
ures
se
t by
gove
rnm
ent h
ave
been
adh
ered
to a
nd a
re
redu
cing
dis
parit
ies
in a
cces
s?
Yes
perio
dic
anal
ysis
pu
blis
hed
and
acte
d up
on
Yes
perio
dic
anal
ysis
pu
blis
hed
but n
ot
acte
d up
on
No0.
5Ac
tion
plan
for c
omm
unity
exis
tsW
ater
wor
ksho
p M
arch
20
13
Outp
utRW
S17
Quan
tity
Is th
e an
nual
num
ber o
f new
sys
tem
s bu
ilt (a
nd
syst
ems
repl
aced
) suf
ficie
nt to
mee
t sec
tor t
arge
ts?
(incl
udin
g ou
tput
by
gove
rnm
ent d
irect
ly as
wel
l as
thro
ugh
cont
ract
ors
and
NGOs
)
Over
75%
of t
hat
need
ed to
reac
h se
ctor
targ
ets
Over
50%
of t
hat
need
ed to
reac
h se
ctor
targ
ets
Less
than
50%
of
that
nee
ded
to re
ach
sect
or
targ
ets
1En
ough
sch
emes
are
bei
ng b
uilt
to k
eep
up w
ith n
atio
nal t
arge
ts,
prov
ided
that
O&M
is a
pplie
d to
su
stai
n th
e sc
hem
es. I
f O&M
is
lack
ing
then
targ
ets
will
slip
Pers
. com
m. J
Yod
er B
ESIK
; W
ater
wor
ksho
p M
arch
20
13
Outp
utRW
S18
Capa
city
for
pr
omot
ion
Are
ther
e dr
inki
ng w
ater
qua
lity
stan
dard
s fo
r rur
al
wat
er a
nd a
re a
ll ne
w in
stal
latio
ns te
sted
? St
anda
rds
exis
t and
new
in
stal
latio
ns
test
ed
Stan
dard
s ex
ist b
ut n
ew
inst
alla
tions
not
te
sted
No0.
5St
anda
rds
exis
t, bu
t tes
ting
not
carri
ed o
utPe
rs. c
omm
. DNS
A W
ater
la
bora
tory
sta
ff; J
Yod
er
BESI
K
Outp
utRW
S19
Repo
rting
Is th
e nu
mbe
r of n
ew s
chem
es a
nd th
eir l
ocat
ions
re
porte
d in
a c
onso
lidat
ed fo
rmat
eac
h ye
ar?
Yes
with
full
listin
g of
lo
catio
ns
Yes
but w
ithou
t a
full
listin
g of
lo
catio
ns
No0.
5A
listin
g ex
ists
that
incl
udes
SAS
go
vern
men
t sch
emes
and
thos
e by
de
velo
pmen
t par
tner
s bu
t doe
s no
t in
clud
e sc
hem
es b
uilt
unde
r dis
trict
de
cent
raliz
atio
n pr
ogra
ms
eg. P
DL
Wat
er w
orks
hop
Mar
ch
2013

Wat
er S
upp
ly a
nd S
anita
tion
in T
imor
Les
te52
Build
ing
bloc
kNo
.Ar
eas
of
evid
ence
for
asse
ssm
ent
Ques
tion
High
(1)
Med
ium
(0,5
)Lo
w (0
)Sc
ore
Expl
anat
ion
for s
core
Sour
ce o
f evi
denc
e
SUST
AINI
NG
Mai
nten
ance
RWS
20Fu
nctio
nalit
yAr
e th
ere
regu
lar a
sset
regi
ster
upd
ates
of r
ural
w
ater
infra
stru
ctur
e in
clud
ing
thei
r fun
ctio
nal
stat
us?
Asse
t reg
iste
r an
d re
gula
r up
datin
g of
fu
nctio
nalit
y
Asse
t reg
iste
r bu
t no
upda
ting
of fu
nctio
nalit
y
Neith
er1
SIBS
wat
er a
nd s
anita
tion
info
rmat
ion
syst
ems
incl
udes
sch
eme
func
tiona
lity.
Upda
ted
quar
terly
.
SIBS
; Wat
er w
orks
hop
Mar
ch 2
013
Mai
nten
ance
RWS
21Co
st re
cove
ryIs
ther
e a
natio
nal p
olic
y on
O&M
cos
ts a
nd a
re
O&M
cos
ts k
now
n an
d co
vere
d fro
m s
ubsi
dies
and
/or
use
r fee
s?
O&M
pol
icy
exis
ts, c
osts
are
as
sess
ed a
nd
>75
% c
over
ed
O&M
pol
icy
exis
ts, c
osts
are
es
timat
ed a
nd
>50
% c
over
ed
No O
&M p
olic
y, co
sts
not k
now
n0
No s
peci
fic p
olic
y or
kno
wn
cost
sW
ater
wor
ksho
p M
arch
20
13
Mai
nten
ance
RWS
22Sp
are
parts
ch
ain
Is th
ere
a sy
stem
defi
ned
for s
pare
par
ts s
uppl
y ch
ain
that
is e
ffect
ive in
all
plac
es?
Syst
ems
defin
ed
and
spar
es
avai
labl
e in
>
50%
of v
illage
s
Syst
ems
defin
ed
but s
pare
s no
t av
aila
ble
up to
50
% o
f villa
ges
Syst
ems
not
defin
ed
0No
thin
g fo
r rur
alW
ater
wor
ksho
p M
arch
20
13
Mai
nten
ance
RWS
23M
anag
emen
t of
Dis
aste
r Ris
k an
d Cl
imat
e Ch
ange
Do ru
ral s
ervic
e pr
ovid
ers
have
pla
ns fo
r cop
ing
with
nat
ural
dis
aste
rs a
nd c
limat
e ch
ange
?Ye
s, th
e m
ajor
ity
of ru
ral s
ervic
e pr
ovid
ers
have
a
plan
for d
isas
ter
risk
man
agem
ent
and
clim
ate
chan
ge
No. O
nly
som
e se
rvic
e pr
ovid
ers
have
a p
lan
for
disa
ster
risk
m
anag
emen
t an
d cl
imat
e ch
ange
or m
ost
serv
ice
prov
ider
s ha
ve u
nder
take
n a
vuln
erab
ility
asse
ssm
ent.
No s
ervic
e pr
ovid
er h
as a
cl
imat
e ac
tion
plan
or h
as
unde
rtake
n a
vuln
erab
ility
asse
ssm
ent.
0Na
tiona
l ass
essm
ent o
f ris
ks fr
om
clim
ate
chan
ge a
nd n
atur
al d
isas
ter
incl
udes
wat
er s
horta
ges.
No
loca
l le
vel p
lann
ing.
Natio
nal A
dapt
atio
n Pr
ogra
mm
e of
Act
ion
to
Clim
ate
Chan
ge (2
010)
Expa
nsio
nRW
S 24
Inve
stm
ent
supp
ort
Are
pip
ed s
yste
ms
in ru
ral a
reas
reco
gnize
d as
m
anag
emen
t ent
ities
and
give
n te
chni
cal a
nd
finan
cial
sup
port
to e
xpan
d th
eir s
yste
ms
eith
er b
y go
vern
men
t or l
arge
r util
ities
?
Reco
gnize
d an
d su
ppor
ted
Reco
gnize
d bu
t no
t sup
porte
dNe
ither
0.5
Man
agem
ent g
roup
s "d
o no
t acq
uire
an
y ju
ridic
al p
erso
nalit
y" b
ut a
re
requ
ired
to s
ign
agre
emen
ts. D
NSA
is re
spon
sibl
e fo
r pro
vidin
g te
chni
cal
assi
stan
ce to
man
agem
ent g
roup
s.
2004
Wat
er D
ecre
e
Expa
nsio
nRW
S 2
5Pl
ans
Are
ther
e sc
hem
e-le
vel p
lans
for t
he e
xpan
sion
of
pipe
d sy
stem
s in
rura
l are
as?
Yes
in m
ost r
ural
ar
eas
Yes
in a
roun
d ha
lf of
rura
l ar
eas
In a
sm
all
prop
ortio
n, o
r no
rura
l are
as
0Co
mm
uniti
es h
ave
the
optio
n to
ex
pand
but
rare
ly do
so
Wat
er w
orks
hop
Mar
ch
2013
Expa
nsio
nRW
S 2
6In
vest
men
t fin
ance
Are
expa
nsio
n co
sts
for r
ural
wat
er b
eing
cov
ered
by
use
r fee
s an
d/or
pub
lic g
rant
s?Ye
s in
mos
t rur
al
area
sYe
s in
aro
und
half
of ru
ral
area
s
In a
sm
all
prop
ortio
n, o
r no
rura
l are
as
0PD
L in
clud
es s
ome
exte
nsio
n to
ex
istin
g sc
hem
es. C
over
ed b
y pu
blic
gr
ants
PDL
proj
ect r
ecor
ds
User
ou
tcom
esRW
S 2
7Su
b-se
ctor
pr
ogre
ssIs
the
sub-
sect
or o
n tra
ck to
mee
t the
sta
ted
targ
et?
On-t
rack
Off-
track
but
ke
epin
g up
w
ith p
opul
atio
n gr
owth
Off-
track
1On
trac
k if
inve
stm
ent m
ade
in
O&M
. Rec
ent p
rogr
ess
and
effo
rts to
im
prov
e su
stai
nabi
lity
indi
cate
a m
ore
posi
tive
outlo
ok th
an J
MP
data
.
Wat
er w
orks
hop
Mar
ch
2013

Ser
vice
Del
iver
y A
sses
smen
t53
Build
ing
bloc
kNo
.Ar
eas
of
evid
ence
for
asse
ssm
ent
Ques
tion
High
(1)
Med
ium
(0,5
)Lo
w (0
)Sc
ore
Expl
anat
ion
for s
core
Sour
ce o
f evi
denc
e
User
ou
tcom
esRW
S 28
Equi
ty o
f use
Wha
t is
the
ratio
of i
mpr
oved
drin
king
wat
er a
cces
s be
twee
n th
e lo
wes
t and
hig
hest
qui
ntile
in ru
ral
area
s?
Less
than
2
times
Betw
een
2 an
d 5
Mor
e th
an 5
tim
es1
JMP
show
s 1.
8 ra
tioUN
ICEF
/WHO
equ
ity a
nalys
is
for E
AP (2
012)
User
ou
tcom
esRW
S 2
9Qu
ality
of u
ser
expe
rienc
eOf
the
hous
ehol
ds u
sing
an
impr
oved
drin
king
w
ater
sou
rce,
wha
t pro
porti
on a
re u
sing
pip
ed
drin
king
wat
er in
the
dwel
ling
and
yard
/plo
t ?
Mor
e th
an 5
0%
of h
ouse
hold
sM
ore
than
25%
of
hou
seho
lds
Less
than
25%
of
hou
seho
lds
0Cu
rrent
gov
ernm
ent p
olic
y is
to
prov
ide
publ
ic s
tand
pipe
s as
this
is
appr
opria
te a
nd w
orka
ble.
Pers
. com
m. K
Cla
rk B
ESIK
URBA
N SA
NITA
TION
ENAB
LING
Polic
yUW
S 1
Sect
or ta
rget
sAr
e th
ere
UWS
acce
ss ta
rget
s in
the
natio
nal l
evel
de
velo
pmen
t pla
n?
Yes,
ther
e ar
e ur
ban
wat
er
supp
ly ta
rget
s in
th
e de
velo
pmen
t pl
an
Ther
e ar
e na
tiona
l ta
rget
s in
the
deve
lopm
ent
plan
but
non
e fo
r ur
ban
wat
er.
No ta
rget
s in
the
deve
lopm
ent
plan
1St
rate
gic
Deve
lopm
ent P
lan
refe
rs to
12
urb
an c
ente
rs h
avin
g ac
cess
to
safe
24
hour
pip
ed w
ater
by
2020
. Ap
prov
ed W
ater
Act
ion
Plan
refe
rs to
10
0% a
cces
s by
202
0 fo
r Dili
and
dist
rict c
entre
s
Natio
nal S
trate
gic
Deve
lopm
ent P
lan
(201
1-20
30);
Min
istry
of P
ublic
W
orks
Wat
er P
lan
of A
ctio
n 20
12-2
017
(201
2); W
ater
w
orks
hops
Mar
ch a
nd J
une
2013
Polic
yUW
S 2
Sect
or p
olic
yIs
ther
e an
urb
an w
ater
pol
icy
that
is a
gree
d by
st
akeh
olde
rs, a
ppro
ved
by g
over
nmen
t, an
d pu
blic
ly av
aila
ble?
Polic
y of
ficia
lly
appr
oved
, and
pu
blic
ly av
aila
ble
Polic
y dr
afte
d an
d ag
reed
but
no
t offi
cial
ly ap
prov
ed
No p
olic
y1
Decr
ee la
w a
pplie
s. D
raft
polic
y fo
rmat
. App
lies
to b
oth
urba
n an
d ru
ral.
Wat
er S
uppl
y Po
licy
(Dra
ft 3
Dec
2010
); De
cree
Law
No
.4/2
004
Polic
yUW
S 3
Inst
itutio
nal r
oles
Are
the
inst
itutio
nal r
oles
of u
rban
wat
er s
ubse
ctor
pl
ayer
s (n
atio
nal/s
tate
& lo
cal g
over
nmen
t, se
rvic
e pr
ovid
er, r
egul
ator
etc
) cle
arly
defin
ed a
nd
oper
atio
naliz
ed?
Defin
ed a
nd
oper
atio
naliz
edDe
fined
but
not
op
erat
iona
lized
Not d
efine
d1
Defin
ed in
Dec
ree
and
polic
y. Op
erat
iona
lized
. Min
istry
of H
ealth
re
spon
sibl
e fo
r wat
er q
ualit
y, SA
S fo
r w
ater
sup
ply.
No s
epar
ate
regu
lato
r ro
le.
Wat
er S
uppl
y Po
licy
(Dra
ft 3
Dec
2010
); De
cree
Law
No
.4/2
004
Plan
ning
UWS
4Fu
nd fl
ow
coor
dina
tion
Does
gov
ernm
ent h
ave
a pr
oces
s fo
r coo
rdin
atin
g m
ultip
le in
vest
men
ts in
the
subs
ecto
r (do
mes
tic
or d
onor
, eg.
Nat
iona
l gra
nts,
sta
te b
udge
ts, d
onor
lo
ans
and
gran
ts e
tc.)?
Coor
dina
tion
proc
ess
defin
ed a
nd
oper
atio
naliz
ed
Coor
dina
tion
proc
ess
defin
ed b
ut n
ot
oper
atio
naliz
ed
Not d
efine
d/ n
o pr
oces
s0.
5In
vest
men
ts c
oord
inat
ed a
t the
M
inis
try o
f Fin
ance
leve
l.SD
A fin
anci
al a
nalys
is
Plan
ning
UWS
5In
vest
men
t pla
nsIs
ther
e a
med
ium
term
inve
stm
ent p
lan
for u
rban
w
ater
bas
ed o
n na
tiona
l tar
gets
that
is c
oste
d,
prio
ritize
s in
vest
men
t nee
ds, i
s pu
blis
hed
and
used
?
Inve
stm
ent p
lan
base
d on
prio
rity
need
s ex
ists
, is
publ
ishe
d an
d us
ed
Exis
ts b
ut n
ot
used
, or u
nder
pr
epar
atio
n
Does
not
exis
t0.
5An
nual
act
ion
plan
pre
pare
d th
at is
re
activ
e to
nec
essi
ties.
Cur
rent
Five
-ye
ar p
lan
to 2
017,
but
bec
ause
ther
e is
no
budg
et th
e pl
an is
not
cos
ted
Min
istry
of P
ublic
Wor
ks
Wat
er A
ctio
n Pl
an 2
012-
2017
; Wat
er w
orks
hop
Mar
ch 2
013
Plan
ning
UWS
6An
nual
revie
wIs
ther
e an
ann
ual m
ulti-
stak
ehol
der r
evie
w in
pl
ace
to m
onito
r sub
sect
or p
erfo
rman
ce, t
o re
view
pr
ogre
ss a
nd s
et c
orre
ctive
act
ions
?
Annu
al re
view
of
per
form
ance
an
d se
tting
of
corre
ctive
act
ions
Annu
al re
view
of
per
form
ance
bu
t no
setti
ng o
f co
rrect
ive a
ctio
ns
No re
view
or
set
ting
of
corre
ctive
act
ions
0Po
ssib
ly a
revie
w a
t nat
iona
l lev
el, b
ut
not d
istri
ct le
vel.
Lack
of c
oord
inat
ion
and
info
rmat
ion
diss
emin
atio
n to
di
stric
ts.
Wat
er w
orks
hop
Mar
ch
2013

Wat
er S
upp
ly a
nd S
anita
tion
in T
imor
Les
te54
Build
ing
bloc
kNo
.Ar
eas
of
evid
ence
for
asse
ssm
ent
Ques
tion
High
(1)
Med
ium
(0,5
)Lo
w (0
)Sc
ore
Expl
anat
ion
for s
core
Sour
ce o
f evi
denc
e
Plan
ning
UWS
7HR
cap
acity
Has
an a
sses
smen
t bee
n un
derta
ken
of th
e hu
man
reso
urce
nee
ds in
the
sub
sect
or to
mee
t th
e su
bsec
tor t
arge
t and
is th
e ac
tion
plan
bei
ng
impl
emen
ted?
Asse
ssm
ent
unde
rtake
n an
d ac
tions
bei
ng
impl
emen
ted
Asse
ssm
ent
unde
rtake
n bu
t no
act
ion
bein
g ta
ken
No a
sses
smen
t un
derta
ken
0.5
Asse
ssm
ent d
one
incl
udin
g by
su
bsec
tor,
but l
imite
d fo
llow
up
actio
n ta
ken
to a
ddre
ss s
kill
shor
tage
s.
DFID
Hum
an R
esou
rce
Capa
city
in th
e W
ASH
sect
or
in T
L 20
09
Budg
etUW
S 8
Adeq
uacy
Are
the
publ
ic fi
nanc
ial c
omm
itmen
ts to
the
urba
n w
ater
sub
sect
or s
uffic
ient
to m
eet t
he n
atio
nal
targ
ets
for t
he s
ubse
ctor
?
Mor
e th
an
75%
of w
hat i
s ne
eded
Betw
een
50 a
nd
75%
of n
eeds
Less
than
50%
of
nee
ds0
Serio
usly
unde
rfund
ed fo
r ach
ievin
g pi
ped
wat
er ta
rget
s. M
illion
s of
$
requ
ired.
Wat
er w
orks
hop
Mar
ch
2013
. Bud
get B
ooks
for
2011
, 201
2, 2
013
Budg
etUW
S 9
Stru
ctur
eDo
es th
e bu
dget
stru
ctur
e pe
rmit
inve
stm
ents
and
su
bsid
ies
(ope
ratio
nal c
osts
, adm
inis
tratio
n, d
ebt
serv
ice,
etc
) for
the
urba
n w
ater
sec
tor t
o be
cle
arly
iden
tified
?
Yes
for
inve
stm
ent a
nd
for s
ubsi
dies
Yes
for
inve
stm
ent b
ut
not s
ubsi
dies
No1
Stru
ctur
e is
cle
ar b
ut n
ot b
roke
n ou
t to
sub
sect
orSD
A fin
anci
al a
nalys
is
Budg
etUW
S 1
0Co
mpr
ehen
sive
Does
the
gove
rnm
ent b
udge
t com
preh
ensi
vely
cove
r dom
estic
and
offi
cial
don
or in
vest
men
t/su
bsid
y to
urb
an w
ater
?
Mor
e th
an 7
5%
of fu
nds
to s
ub-
sect
or o
n bu
dget
Betw
een
50-
75%
of f
unds
to
sub-
sect
or o
n bu
dget
Less
than
50%
of
fund
s to
sub
-se
ctor
on
budg
et
1Fu
nds
are
on b
udge
t, bu
t bud
get i
s hi
ghly
cent
raliz
edSD
A fin
anci
al a
nalys
is
DEVE
LOPI
NG
Expe
nditu
reUW
S 11
Utiliz
atio
n of
do
mes
tic fu
nds
Wha
t per
cent
age
of d
omes
tic fu
nds
budg
eted
for
urba
n w
ater
are
spe
nt (3
yea
r ave
rage
)?
Over
75%
Betw
een
50%
an
d 75
%Le
ss th
an 5
0%1
High
bud
get e
xecu
tion
in T
imor
-Les
te
gene
rally
SDA
finan
cial
ana
lysis
Expe
nditu
reUW
S 12
Utiliz
atio
n of
ex
tern
al f
unds
Wha
t per
cent
age
of e
xter
nal f
unds
bud
gete
d fo
r ur
ban
wat
er a
re s
pent
(3 y
ear a
vera
ge)?
Ov
er 7
5%Be
twee
n 50
%
and
75%
Less
than
50%
1Hi
gh b
udge
t exe
cutio
n eg
. ADB
bu
dget
and
act
ual:
87%
in 2
010,
71
% in
201
1, a
nd 1
47%
in 2
012
ADB
Budg
ets
2010
-201
2
Expe
nditu
reUW
S 13
Repo
rting
Do u
rban
util
ities
(nat
iona
l or 3
larg
est u
tiliti
es) h
ave
audi
ted
acco
unts
and
bal
ance
she
et?
Audi
ted
acco
unts
an
d ba
lanc
e sh
eet
Bala
nce
shee
t bu
t not
aud
ited
No b
alan
ce s
heet
0No
util
ities
. No
bala
nce
shee
t. Di
li di
stric
t doe
s ha
ve a
list
of a
sset
s bu
t en
tity
is n
ot in
depe
nden
t so
has
no
liabi
litie
s an
d th
ere
is n
o in
depe
nden
t au
dit (
only
inte
rnal
gov
ernm
ent a
udit
only)
.
SDA
finan
cial
ana
lysis
; DN
SA re
ports
Equi
ityUW
S14
Loca
l pa
rtici
patio
nAr
e th
ere
clea
rly d
efine
d pr
oced
ures
for i
nfor
min
g,
cons
ultin
g w
ith a
nd s
uppo
rting
loca
l par
ticip
atio
n in
pla
nnin
g, b
udge
ting
and
impl
emen
ting
for u
rban
w
ater
dev
elop
men
ts?
Yes
and
syst
emat
ical
ly ap
plie
d
Yes,
but
not
sy
stem
atic
ally
appl
ied
No0.
5Pa
rtici
patio
n gu
idel
ines
not
cle
arly
defin
ed fo
r urb
an s
ecto
r, us
ually
as
a re
quire
men
t fro
m d
onor
s eg
. ADB
pr
ojec
ts.
SDA
asse
ssm
ent

Ser
vice
Del
iver
y A
sses
smen
t55
Build
ing
bloc
kNo
.Ar
eas
of
evid
ence
for
asse
ssm
ent
Ques
tion
High
(1)
Med
ium
(0,5
)Lo
w (0
)Sc
ore
Expl
anat
ion
for s
core
Sour
ce o
f evi
denc
e
Equi
ityUW
S15
Budg
et a
lloca
tion
crite
riaHa
ve c
riter
ia (o
r a fo
rmul
a) b
een
dete
rmin
ed
to a
lloca
te u
rban
wat
er fu
ndin
g eq
uita
bly
to
urba
n ut
ilitie
s or
ser
vice
prov
ider
s an
d am
ong
mun
icip
aliti
es a
nd is
it b
eing
con
sist
ently
app
lied?
Yes,
app
lied
cons
iste
ntly
Yes,
but
no
t app
lied
cons
iste
ntly
No0.
5Pr
iorit
y to
wns
exis
t and
ther
e ar
e be
lieve
d to
be
equi
ty c
riter
ia a
t the
Na
tiona
l lev
el, b
ut u
ncle
ar if
fund
ing
is c
onsi
sten
tly a
lloca
ted
to d
istri
ct
tow
ns e
quita
bly.
SDA
asse
ssm
ent;
Wat
er
wor
ksho
p M
arch
201
3
Equi
tyUW
S16
Redu
cing
in
equa
lity
Have
urb
an u
tiliti
es o
r ser
vice
prov
ider
s (n
atio
nal
or in
3 la
rges
t citi
es) d
evel
oped
and
impl
emen
ted
spec
ific
plan
s fo
r ser
ving
the
urba
n po
or?
Plan
s de
velo
ped
and
impl
emen
ted
Plan
s de
velo
ped
but n
ot
impl
emen
ted
No p
lans
do
cum
ente
d0
No e
viden
ce o
f thi
s.
SDA
asse
ssm
ent
Outp
utUW
S 17
Quan
tity
Is th
e an
nual
exp
ansi
on o
f HH
conn
ectio
ns a
nd
stan
d po
sts
in u
rban
are
as s
uffic
ient
to m
eet t
he
subs
ecto
r tar
gets
?
Over
75%
of t
hat
need
ed to
reac
h se
ctor
targ
ets
Over
50%
of t
hat
need
ed to
reac
h se
ctor
targ
ets
Less
than
50%
of
that
nee
ded
to re
ach
sect
or
targ
ets
0.5
Urba
n w
ater
app
ears
on
track
to m
eet
targ
ets
but n
ot fo
r pip
ed w
ater
acc
ess
JMP
2013
repo
rt
Outp
utUW
S 18
Qual
ity o
f wat
erAr
e th
ere
drin
king
wat
er q
ualit
y st
anda
rds
for u
rban
w
ater
that
are
regu
larly
mon
itore
d an
d th
e re
sults
pu
blis
hed?
Stan
dard
s ex
ist,
ther
e is
a
surv
eilla
nce
prog
ram
, and
re
sults
are
pu
blis
hed
Stan
dard
s ex
ist
and
ther
e is
a
surv
eilla
nce
prog
ram
but
th
ere
is n
o pu
blic
atio
n of
re
sults
No s
tand
ards
, or
sta
ndar
ds
exis
t but
are
not
m
onito
red
0.5
GoTL
Wat
er q
ualit
y st
anda
rds
exis
t (W
HO s
tand
ards
unt
il 20
120)
. M
onito
ring
for D
ili: b
acte
riolo
gica
l te
stin
g m
onth
ly, c
hem
istry
test
ing
6-m
onth
ly, p
hysi
cal a
nnua
lly –
but
re
sults
not
pub
lishe
d. D
istri
ct to
wns
on
ly w
hen
outb
reak
or p
robl
em. D
ili m
onito
red
at p
ublic
tap
- sa
mpl
e 10
out
of 5
00 m
onth
ly. In
Man
utut
o ea
ch o
f 4 z
ones
has
3 s
ampl
es d
one
ever
y tim
e.
DNSA
test
ing
labo
rato
ry.
Wat
er w
orks
hop
Mar
ch
2013
Outp
utUW
S 19
Repo
rting
Is th
e nu
mbe
r of a
dditi
onal
hou
seho
ld c
onne
ctio
ns
mad
e an
d st
and
post
s co
nstru
cted
repo
rted
on in
a
cons
olid
ated
form
at fo
r the
nat
ion
each
yea
r?
Yes
with
full
listin
g of
co
nnec
tions
Yes
but w
ithou
t a
full
listin
g of
co
nnec
tions
No1
Ever
y ye
ar th
e nu
mbe
r of n
ew
conn
ectio
ns is
repo
rted
Wat
er w
orks
hop
Mar
ch
2013
SUST
AINI
NG
Mai
nten
ance
UWS
20Fu
nctio
nalit
yW
hat i
s th
e w
eigh
ted
aver
age
perc
enta
ge o
f non
re
venu
e w
ater
acr
oss
urba
n ut
ilitie
s (n
atio
nal o
r 3
larg
est u
tiliti
es) (
last
3 y
ears
ave
rage
)?
Less
than
20%
20%
to 4
0%M
ore
than
40%
0Si
gnifi
cant
wat
er lo
sses
in d
istri
ct
tow
ns; n
on-r
even
ue w
ater
alm
ost
100%
Pers
. com
m. A
DB C
onsu
ltant
Gr
aham
Jac
kson
Mai
nten
ance
UWS
21Co
st re
cove
ryAr
e al
l O&M
cos
ts fo
r util
ities
(nat
iona
l or 3
larg
est
utilit
ies)
bei
ng c
over
ed b
y re
venu
es (u
ser f
ees
and/
subs
idie
s) (l
ast 3
yea
rs a
vera
ge)?
Oper
atin
g ra
tio
grea
ter t
han
1.2
Oper
atin
g ra
tio
betw
een
0.8
and
1.2
Oper
atin
g ra
tio
belo
w 0
.80
No u
ser f
ees
char
ged.
Insu
ffici
ent
budg
et fo
r O&
MDN
SA; W
ater
wor
ksho
p M
arch
201
3
Mai
nten
ance
UWS
22Ta
riff r
evie
ws
Are
tarif
f rev
iew
s re
gula
rly c
ondu
cted
usi
ng a
pr
oces
s an
d ta
riffs
adj
uste
d ac
cord
ingl
y an
d pu
blis
hed?
Cond
ucte
d,
adju
sted
and
pu
blis
hed
Cond
ucte
d bu
t no
t adj
uste
dNo
t con
duct
ed0
Tarif
fs p
ublis
hed
in 2
004
decr
ee b
ut
not u
pdat
ed a
s ch
argi
ng is
intro
duce
d in
lim
ited
subz
ones
in D
ili du
ring
2013
.
2004
Dec
ree;
Wat
er
wor
ksho
p M
arch
201
3

Wat
er S
upp
ly a
nd S
anita
tion
in T
imor
Les
te56
Build
ing
bloc
kNo
.Ar
eas
of
evid
ence
for
asse
ssm
ent
Ques
tion
High
(1)
Med
ium
(0,5
)Lo
w (0
)Sc
ore
Expl
anat
ion
for s
core
Sour
ce o
f evi
denc
e
Mai
nten
ance
UWS
23M
anag
emen
t of
Dis
aste
r Ris
k an
d Cl
imat
e Ch
ange
Do u
tiliti
es (n
atio
nal o
r 3 la
rges
t util
ities
) hav
e pl
ans
for c
opin
g w
ith n
atur
al d
isas
ters
and
clim
ate
chan
ge?
Yes,
the
maj
ority
of
urb
an s
ervic
e pr
ovid
ers
have
a
plan
for d
isas
ter
risk
man
agem
ent
and
clim
ate
chan
ge
No. O
nly
som
e se
rvic
e pr
ovid
ers
have
a p
lan
for
disa
ster
risk
m
anag
emen
t an
d cl
imat
e ch
ange
or m
ost
serv
ice
prov
ider
s ha
ve u
nder
take
n a
vuln
erab
ility
asse
ssm
ent.
No s
ervic
e pr
ovid
er h
as a
cl
imat
e ac
tion
plan
or h
as
unde
rtake
n a
vuln
erab
ility
asse
ssm
ent.
0Na
tiona
l Ass
essm
ent o
f ris
ks
from
clim
ate
chan
ge a
nd n
atur
al
disa
ster
incl
udes
wat
er s
horta
ges.
Pr
oced
ures
exis
t for
em
erge
ncy
resp
onse
at l
ocal
leve
l and
re
spon
sibi
lity
allo
cate
d to
dis
trict
m
anag
emen
t com
mitt
ee. E
mer
genc
y fu
ndin
g av
aila
ble
if a
natu
ral d
isas
ter
occu
rs e
g. la
ndsl
ide
dest
royin
g pi
pes,
ho
wev
er th
e re
spon
se is
reac
tive
and
ther
e is
no
forw
ard
plan
ning
.
Natio
nal A
dapt
atio
n Pr
ogra
mm
e of
Act
ion
to
Clim
ate
Chan
ge (2
010)
Expa
nsio
nUW
S 24
Auto
nom
yDo
util
ities
or s
ervic
e pr
ovid
ers
(nat
iona
l or
3 la
rges
t) ha
ve o
pera
tiona
l dec
isio
n-m
akin
g au
tono
my
in in
vest
men
t pla
nnin
g, H
R, fi
nanc
e (s
epar
ate
bala
nce
shee
t) an
d pr
ocur
emen
t m
anag
emen
t?
Yes
in a
ll as
pect
sIn
all
aspe
cts
exce
pt
inve
stm
ent
plan
ning
No0
Auto
nom
y on
ly in
min
or a
dmin
istra
tive
mat
ters
ADB
Sect
or A
sses
smen
t 20
11 (D
istri
ct T
owns
PPT
A)
Expa
nsio
nUW
S 25
Plan
sDo
ser
vice
prov
ider
s (n
atio
nal/s
tate
or 3
larg
est
utilit
ies)
hav
e bu
sine
ss p
lans
for e
xpan
ding
acc
ess
to u
rban
wat
er?
Busi
ness
pla
ns
for i
ncre
asin
g ac
cess
bei
ng
impl
emen
ted
Busi
ness
pla
ns
for i
ncre
asin
g ac
cess
bei
ng
prep
ared
No b
usin
ess
plan
s0.
5So
me
"bus
ines
s" p
lann
ing
in
conn
ectio
n w
ith p
roje
cts
eg. K
oica
de
salin
atio
n pl
ant.
Ther
e ar
e pl
ans
for e
xpan
sion
but
thes
e ar
e no
t rea
lly
busi
ness
pla
ns.
Wat
er w
orks
hop
Mar
ch
2013
Expa
nsio
nUW
S 26
Borro
win
gAr
e ut
ilitie
s al
low
ed b
y la
w to
acc
ess
and
are
they
ac
cess
ing
com
mer
cial
fina
nce
for e
xpan
sion
? Al
low
ed a
nd
acce
ssin
gAl
low
ed b
ut n
ot
acce
ssin
gNo
t allo
wed
0DN
SA is
not
an
inde
pend
ent u
tility
. No
t allo
wed
.Pe
rs. c
omm
. DNS
A st
aff
User
Ou
tcom
esUW
S 27
Sub-
sect
or
prog
ress
Is th
e su
b-se
ctor
on
track
to m
eet t
he s
tate
d ta
rget
?On
-tra
ckOf
f-tra
ck b
ut
keep
ing
up
with
pop
ulat
ion
grow
th
Off-
track
1On
trac
k fo
r acc
ess
to im
prov
ed w
ater
su
pply
(93%
) but
not
for p
iped
wat
er
whi
ch w
as 4
5% in
201
1.
JMP
2013
repo
rt
User
Ou
tcom
esUW
S 28
Equi
ty o
f use
Wha
t is
the
ratio
of i
mpr
oved
drin
king
wat
er a
cces
s be
twee
n th
e lo
wes
t and
hig
hest
qui
ntile
in u
rban
ar
eas?
Less
than
2
times
Betw
een
2 an
d 5
Mor
e th
an 5
tim
es1
Ratio
is a
roun
d 1.
4 tim
es, w
hich
is
sup
porte
d by
the
high
cov
erag
e fig
ures
UNIC
EF/J
MP
anal
ysis
of
2009
DHS
dat
a
User
Ou
tcom
esUW
S 29
Qual
ity o
f use
r ex
perie
nce
Wha
t is
the
aver
age
num
ber o
f hou
rs o
f ser
vice
per
day
acro
ss u
rban
util
ities
? (W
eigh
ted
by n
umbe
r of
HH c
onne
ctio
ns p
er u
tility
)?
Mor
e th
an 1
2 ho
urs
per d
ay6
to 1
2 ho
urs
per d
ayLe
ss th
an 6
ho
urs
per d
ay0
Less
than
30%
of D
ili's
popu
latio
n ha
s ac
cess
to c
ontin
ual w
ater
sup
ply;
ho
urs
of s
uppl
y 3-
16/d
ay. F
requ
ent
outa
ges
and
limite
d ho
urs
of s
uppl
y fo
r dis
trict
tow
ns.
ADB
Sect
or A
sses
smen
t; W
SP U
rban
San
itatio
n As
sess
men
t (20
10)

Ser
vice
Del
iver
y A
sses
smen
t57
Build
ing
bloc
kNo
.Ar
eas
of
evid
ence
for
asse
ssm
ent
Ques
tion
High
(1)
Med
ium
(0,5
)Lo
w (0
)Sc
ore
Expl
anat
ion
for s
core
Sour
ce o
f evi
denc
e
RURA
L W
ATER
SUP
PLY
ENAB
LING
Polic
y R
SH
1se
ctor
targ
ets
Are
ther
e RS
H ac
cess
targ
ets,
for h
ouse
hold
s an
d/or
com
mun
ities
, in
the
natio
nal l
evel
dev
elop
men
t pl
an?
Targ
ets
for
rura
l hou
seho
ld
acce
ss a
nd
com
mun
ities
be
com
ing
ODF
in
the
deve
lopm
ent
plan
Targ
ets
for
rura
l hou
seho
ld
acce
ss in
the
deve
lopm
ent
plan
No ru
ral
sani
tatio
n ta
rget
s in
the
deve
lopm
ent
plan
1Se
para
te ta
rget
s in
Nat
iona
l Stra
tegi
c De
velo
pmen
t Pla
n bu
t mor
e sp
ecifi
c ta
rget
s de
velo
ped
in d
raft
Sani
tatio
n St
rate
gy: r
ural
hou
seho
ld c
over
age
and
ODF
com
mun
ities
100
% b
y 20
30, 6
8% h
ouse
hold
s pl
us 3
%
shar
ed ta
rget
s fo
r 202
0 an
d 77
%
ODF
suco
s an
d Di
stric
ts
Natio
nal S
trate
gic
Deve
lopm
ent P
lan
2011
-20
30; d
raft
Natio
nal
Sani
tatio
n St
rate
gy 2
012
Polic
yRS
H 2Se
ctor
pol
icy
Is th
ere
a ru
ral s
anita
tion
polic
y, th
at is
agr
eed
by
stak
ehol
ders
, app
rove
d by
gov
ernm
ent,
and
publ
icly
avai
labl
e?
Polic
y of
ficia
lly
appr
oved
and
pu
blic
ly av
aila
ble
Polic
y dr
afte
d an
d ag
reed
but
no
t offi
cial
ly ap
prov
ed
No p
olic
y1
Natio
nal S
anita
tion
Polic
y ap
prov
ed
by C
ounc
il of
Min
iste
rs 2
012.
Wid
ely
cons
ulte
d.
Natio
nal S
anita
tion
Polic
y 20
12
Polic
yRS
H 3In
stitu
tiona
l Ro
les
Are
the
inst
itutio
nal r
oles
of r
ural
san
itatio
n su
bsec
tor p
laye
rs (n
atio
nal/s
tate
& lo
cal
gove
rnm
ent,
serv
ice
prov
ider
, reg
ulat
or e
tc) c
lear
ly de
fined
and
ope
ratio
naliz
ed?
Defin
ed a
nd
oper
atio
naliz
edDe
fined
but
not
op
erat
iona
lized
Not d
efine
d1
Role
s of
sub
sect
or a
ctor
s ar
e de
scrib
ed in
the
Natio
nal S
anita
tion
Polic
y an
d ar
e op
erat
iona
lized
.
Natio
nal S
anita
tion
Polic
y 20
12
Plan
ning
RSH 4
Fund
flow
co
ordi
natio
nDo
es g
over
nmen
t hav
e a
proc
ess
for c
oord
inat
ing
mul
tiple
inve
stm
ents
in th
e su
bsec
tor (
dom
estic
or
don
or, e
g. n
atio
nal g
rant
s, s
tate
bud
gets
, don
or
loan
s an
d gr
ants
etc
)?
Coor
dina
tion
proc
ess
defin
ed a
nd
oper
atio
naliz
ed
Coor
dina
tion
proc
ess
defin
ed b
ut n
ot
oper
atio
naliz
ed
Not d
efine
d/ n
o pr
oces
s0.
5Ba
sed
on ta
lk w
ith S
r. M
ario
Abe
l fro
m
DNSA
Pla
nnin
g De
partm
ent,
ther
e se
emed
to b
e no
spe
cific
pro
cess
for
coor
dina
ting
mul
tiple
inve
stm
ents
in
the
subs
ecto
r. S
take
hold
ers
feel
m
inis
teria
l coo
rdin
atio
n is
not
idea
l, be
tter c
ross
sec
tor c
oord
inat
ion
need
ed
Pers
. com
m. S
r Mar
io A
bel
(DNS
A); S
anita
tion
wor
ksho
p M
arch
201
3
Plan
ning
RSH 5
Inve
stm
ent p
lan
Is th
ere
a m
ediu
m-t
erm
inve
stm
ent p
lan
for r
ural
sa
nita
tion
base
d on
nat
iona
l tar
gets
that
is c
oste
d,
prio
ritize
s in
vest
men
t nee
ds, i
s pu
blis
hed
and
used
?
Inve
stm
ent p
lan
base
d on
prio
rity
need
s ex
ists
, is
publ
ishe
d an
d us
ed
Exis
ts b
ut n
ot
used
, or u
nder
pr
epar
atio
n
Does
not
exis
t0.
5Ar
bitra
ry p
lan
exis
ts b
ut n
ot b
ased
on
targ
ets
Sani
tatio
n w
orks
hop
Mar
ch
2013
Plan
ning
RSH 6
Annu
al re
view
Is th
ere
a an
nual
mul
ti-st
akeh
olde
r rev
iew
in
plac
e to
mon
itor s
ubse
ctor
per
form
ance
, to
revie
w
prog
ress
and
set
cor
rect
ive a
ctio
ns?
Revie
w o
f pe
rform
ance
an
d se
tting
of
corre
ctive
act
ions
Revie
w o
f pe
rform
ance
bu
t no
setti
ng o
f co
rrect
ive a
ctio
ns
No re
view
or
set
ting
of
corre
ctive
act
ions
0So
me
mul
ti st
akeh
olde
r rev
iew
s eg
. Jo
int S
anita
tion
Eval
uatio
n 20
09,
CLTS
revie
w. H
ealth
doe
s ha
ve a
m
ultis
take
hold
er a
nnua
l rev
iew
but
ac
ross
ent
ire h
ealth
sec
tor.
Annu
al
revie
ws
tend
to b
e pr
ojec
t rel
ated
.
Sani
tatio
n w
orks
hop
Mar
ch
2013

Wat
er S
upp
ly a
nd S
anita
tion
in T
imor
Les
te58
Build
ing
bloc
kNo
.Ar
eas
of
evid
ence
for
asse
ssm
ent
Ques
tion
High
(1)
Med
ium
(0,5
)Lo
w (0
)Sc
ore
Expl
anat
ion
for s
core
Sour
ce o
f evi
denc
e
Plan
ning
RSH 7
HR C
apac
ityHa
s an
ass
essm
ent b
een
unde
rtake
n of
the
hum
an re
sour
ce n
eeds
in th
e su
b se
ctor
to m
eet
the
subs
ecto
r tar
get a
nd is
the
actio
n pl
an b
eing
im
plem
ente
d?
Asse
ssm
ent
unde
rtake
n an
d ac
tions
bei
ng
impl
emen
ted
Asse
ssm
ent
unde
rtake
n bu
t no
act
ion
bein
g ta
ken
No a
sses
smen
t un
derta
ken
0.5
Asse
ssm
ent d
one
incl
udin
g by
su
bsec
tor,
but f
ollo
w u
p ac
tion
has
been
wea
k to
add
ress
ski
ll sh
orta
ges.
DFID
Hum
an R
esou
rce
Capa
city
in th
e W
ASH
sect
or
in T
L 20
09
Budg
etRS
H 8Ad
equa
cy (o
f fin
anci
ng)
Are
the
publ
ic fi
nanc
ial c
omm
itmen
ts to
the
rura
l sa
nita
tion
subs
ecto
r suf
ficie
nt to
mee
t the
nat
iona
l ta
rget
s fo
r the
sub
sect
or?
Mor
e th
an
75%
of w
hat i
s ne
eded
Betw
een
50-
75%
of n
eeds
Less
than
50%
of
nee
ds0
Not s
uffic
ient
acc
ordi
ng to
st
akeh
olde
rs. A
t lea
st $
1m n
eede
d in
su
bsid
ies
Sani
tatio
n w
orks
hop
2013
. Bu
dget
Boo
ks fo
r 201
1,
2012
, 201
3
Budg
etRS
H 9St
ruct
ure
Does
the
budg
et s
truct
ure
perm
it in
vest
men
ts a
nd
subs
idie
s (o
pera
tiona
l cos
ts, a
dmin
istra
tion,
deb
t se
rvic
e, e
tc) f
or th
e ru
ral s
anita
tion
sect
or to
be
clea
rly id
entifi
ed?
Yes
for
inve
stm
ent a
nd
for s
ubsi
dies
Yes
for
inve
stm
ent b
ut
not s
ubsi
dies
No1
Yes
can
be c
lear
ly id
entifi
ed b
ut n
ot
disa
ggre
gate
d by
rura
l and
urb
an
sani
tatio
n
SDA
finan
cial
ana
lysis
Budg
etRS
H 10
Com
preh
ensi
ve
Does
the
gove
rnm
ent b
udge
t com
preh
ensi
vely
cove
r dom
estic
and
offi
cial
don
or in
vest
men
t/su
bsid
y to
rura
l san
itatio
n?
Mor
e th
an 7
5%
of fu
nds
to s
ub-
sect
or o
n bu
dget
Betw
een
50-
75%
of f
unds
to
sub-
sect
or o
n bu
dget
Less
than
50%
of
fund
s to
sub
-se
ctor
on
budg
et
1Di
sagg
rega
tion
by ru
ral a
nd u
rban
not
cl
ear b
ut c
lear
in b
udge
t. SD
A fin
anci
al a
nalys
is
DEVE
LOPI
NG
Expe
nditu
reRS
H 11
Utiliz
atio
n of
do
mes
tic fu
nds
Wha
t per
cent
age
of d
omes
tic fu
nds
budg
eted
for
rura
l san
itatio
n ar
e sp
ent (
3 ye
ar a
vera
ge)?
Ov
er 7
5%Be
twee
n 50
%
and
75%
Less
than
50%
1Hi
gh b
udge
t exe
cutio
n in
Tim
or-L
este
ge
nera
lly, a
lthou
gh s
take
hold
ers
said
it w
as d
ifficu
lt to
dis
burs
e fu
nds
beca
use
of u
p to
thre
e so
urce
s in
clud
ing
PDL.
SDA
finan
cial
ana
lysis
Expe
nditu
reRS
H 12
Utiliz
atio
n of
ex
tern
al f
unds
Wha
t per
cent
age
of e
xter
nal f
unds
bud
gete
d fo
r ru
ral s
anita
tion
are
spen
t (3
year
ave
rage
)?
Over
75%
Betw
een
50%
an
d 75
%Le
ss th
an 5
0%0.
5Di
fficu
lt to
ans
wer
for d
onor
sou
rces
bu
t lik
ely
to b
e sa
tisfa
ctor
y.SD
A fin
anci
al a
nalys
is
Expe
nditu
reRS
H 13
Repo
rting
Is ru
ral s
anita
tion
expe
nditu
re v
ersu
s bu
dget
au
dite
d an
d re
porte
d on
in a
con
solid
ated
form
at
for a
ll so
urce
s of
dom
estic
and
offi
cial
don
or
expe
nditu
re?
Yes
for d
omes
tic
and
dono
r ex
pend
iture
Yes
for d
omes
tic
expe
nditu
reNo
0.5
Unab
le to
ans
wer
for d
onor
sou
rces
Sani
tatio
n w
orks
hop
Mar
ch
2013
Equi
tyRS
H 14
Loca
l pa
rtici
patio
nAr
e th
ere
clea
rly d
efine
d pr
oced
ures
for i
nfor
min
g,
cons
ultin
g w
ith a
nd s
uppo
rting
loca
l par
ticip
atio
n in
pla
nnin
g, b
udge
ting
and
impl
emen
ting
for r
ural
sa
nita
tion
deve
lopm
ents
?
Yes
and
syst
emat
ical
ly ap
plie
d
Yes,
but
not
sy
stem
atic
ally
appl
ied
No0.
5Co
mm
unity
resp
onsi
bilit
ies
and
parti
cipa
tion
docu
men
ted.
St
akeh
olde
rs fe
lt pa
rtici
patio
n pr
oces
ses
wer
e sy
stem
atic
ally
appl
ied
if in
trodu
ced
by a
don
or. T
here
is a
pr
oces
s bu
t not
sys
tem
atic
ally
appl
ied
the
way
it is
for w
ater
sup
ply.
PAKS
I Pro
cess
, RW
ASH
Sect
or S
trate
gy to
201
1,
Sani
tatio
n St
rate
gic
Plan
; Sa
nita
tion
wor
ksho
p M
arch
20
13
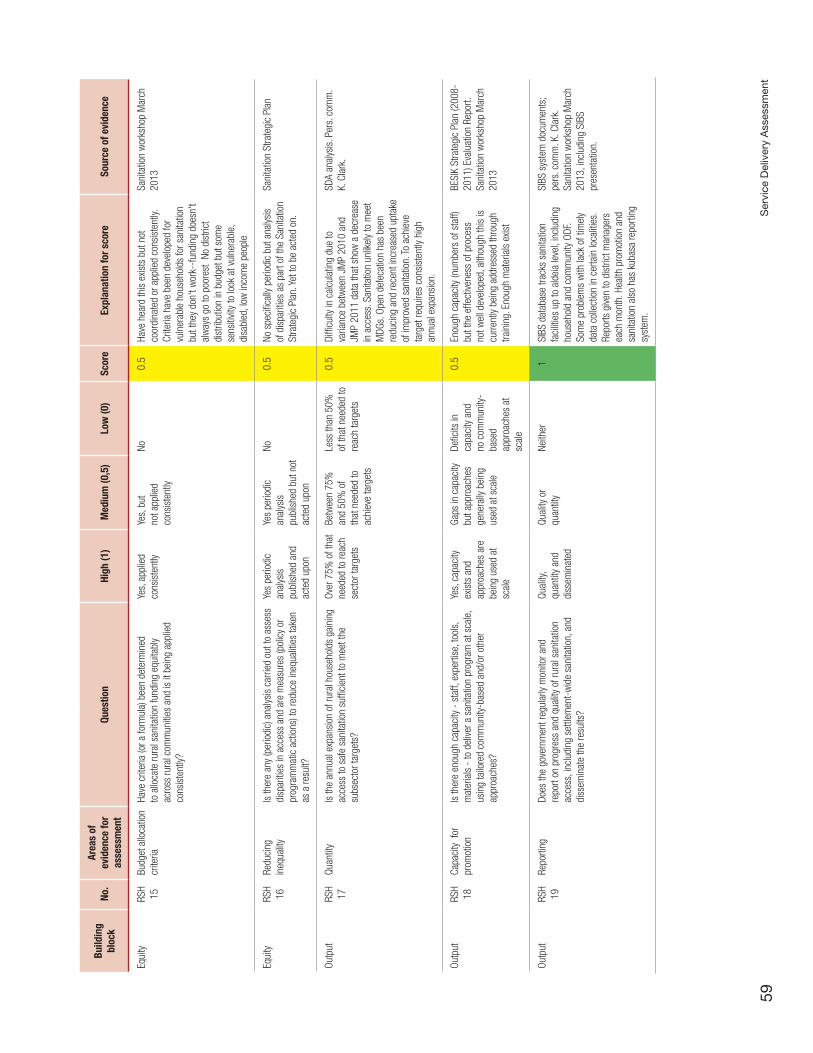
Ser
vice
Del
iver
y A
sses
smen
t59
Build
ing
bloc
kNo
.Ar
eas
of
evid
ence
for
asse
ssm
ent
Ques
tion
High
(1)
Med
ium
(0,5
)Lo
w (0
)Sc
ore
Expl
anat
ion
for s
core
Sour
ce o
f evi
denc
e
Equi
tyRS
H 15
Budg
et a
lloca
tion
crite
riaHa
ve c
riter
ia (o
r a fo
rmul
a) b
een
dete
rmin
ed
to a
lloca
te ru
ral s
anita
tion
fund
ing
equi
tabl
y ac
ross
rura
l com
mun
ities
and
is it
bei
ng a
pplie
d co
nsis
tent
ly?
Yes,
app
lied
cons
iste
ntly
Yes,
but
no
t app
lied
cons
iste
ntly
No0.
5Ha
ve h
eard
this
exis
ts b
ut n
ot
coor
dina
ted
or a
pplie
d co
nsis
tent
ly.
Crite
ria h
ave
been
dev
elop
ed fo
r vu
lner
able
hou
seho
lds
for s
anita
tion
but t
hey
don'
t wor
k--f
undi
ng d
oesn
't al
way
s go
to p
oore
st N
o di
stric
t di
strib
utio
n in
bud
get b
ut s
ome
sens
itivit
y to
look
at v
ulne
rabl
e,
disa
bled
, low
inco
me
peop
le
Sani
tatio
n w
orks
hop
Mar
ch
2013
Equi
tyRS
H 16
Redu
cing
in
equa
lity
Is th
ere
any
(per
iodi
c) a
nalys
is c
arrie
d ou
t to
asse
ss
disp
ariti
es in
acc
ess
and
are
mea
sure
s (p
olic
y or
pr
ogra
mm
atic
act
ions
) to
redu
ce in
equa
litie
s ta
ken
as a
resu
lt?
Yes
perio
dic
anal
ysis
pu
blis
hed
and
acte
d up
on
Yes
perio
dic
anal
ysis
pu
blis
hed
but n
ot
acte
d up
on
No0.
5No
spe
cific
ally
perio
dic
but a
nalys
is
of d
ispa
ritie
s as
par
t of t
he S
anita
tion
Stra
tegi
c Pl
an. Y
et to
be
acte
d on
.
Sani
tatio
n St
rate
gic
Plan
Outp
ut
RSH
17Qu
antit
yIs
the
annu
al e
xpan
sion
of r
ural
hou
seho
lds
gain
ing
acce
ss to
saf
e sa
nita
tion
suffi
cien
t to
mee
t the
su
bsec
tor t
arge
ts?
Over
75%
of t
hat
need
ed to
reac
h se
ctor
targ
ets
Betw
een
75%
an
d 50
% o
f th
at n
eede
d to
ac
hiev
e ta
rget
s
Less
than
50%
of
that
nee
ded
to
reac
h ta
rget
s
0.5
Diffi
culty
in c
alcu
latin
g du
e to
va
rianc
e be
twee
n JM
P 20
10 a
nd
JMP
2011
dat
a th
at s
how
a d
ecre
ase
in a
cces
s. S
anita
tion
unlik
ely
to m
eet
MDG
s. O
pen
defe
catio
n ha
s be
en
redu
cing
and
rece
nt in
crea
sed
upta
ke
of im
prov
ed s
anita
tion.
To
achi
eve
targ
et re
quire
s co
nsis
tent
ly hi
gh
annu
al e
xpan
sion
.
SDA
anal
ysis
. Per
s. c
omm
. K.
Cla
rk.
Outp
ut
RSH
18Ca
paci
ty f
or
prom
otio
nIs
ther
e en
ough
cap
acity
- s
taff,
exp
ertis
e, to
ols,
m
ater
ials
- to
del
iver a
san
itatio
n pr
ogra
m a
t sca
le,
usin
g ta
ilore
d co
mm
unity
-bas
ed a
nd/o
r oth
er
appr
oach
es?
Yes,
cap
acity
ex
ists
and
ap
proa
ches
are
be
ing
used
at
scal
e
Gaps
in c
apac
ity
but a
ppro
ache
s ge
nera
lly b
eing
us
ed a
t sca
le
Defic
its in
ca
paci
ty a
nd
no c
omm
unity
-ba
sed
appr
oach
es a
t sc
ale
0.5
Enou
gh c
apac
ity (n
umbe
rs o
f sta
ff)
but t
he e
ffect
ivene
ss o
f pro
cess
no
t wel
l dev
elop
ed, a
lthou
gh th
is is
cu
rrent
ly be
ing
addr
esse
d th
roug
h tra
inin
g. E
noug
h m
ater
ials
exis
t
BESI
K St
rate
gic
Plan
(200
8-20
11) E
valu
atio
n Re
port.
Sa
nita
tion
wor
ksho
p M
arch
20
13
Outp
ut
RSH
19Re
porti
ngDo
es th
e go
vern
men
t reg
ular
ly m
onito
r and
re
port
on p
rogr
ess
and
qual
ity o
f rur
al s
anita
tion
acce
ss, i
nclu
ding
set
tlem
ent-
wid
e sa
nita
tion,
and
di
ssem
inat
e th
e re
sults
?
Qual
ity,
quan
tity
and
diss
emin
ated
Qual
ity o
r qu
antit
yNe
ither
1SI
BS d
atab
ase
track
s sa
nita
tion
faci
litie
s up
to a
ldei
a le
vel,
incl
udin
g ho
useh
old
and
com
mun
ity O
DF.
Som
e pr
oble
ms
with
lack
of t
imel
y da
ta c
olle
ctio
n in
cer
tain
loca
litie
s.
Repo
rts g
iven
to d
istri
ct m
anag
ers
each
mon
th. H
ealth
pro
mot
ion
and
sani
tatio
n al
so h
as k
ubas
a re
porti
ng
syst
em.
SIBS
sys
tem
doc
umen
ts;
pers
. com
m. K
. Cla
rk.
Sani
tatio
n w
orks
hop
Mar
ch
2013
, inc
ludi
ng S
IBS
pres
enta
tion.

Wat
er S
upp
ly a
nd S
anita
tion
in T
imor
Les
te60
Build
ing
bloc
kNo
.Ar
eas
of
evid
ence
for
asse
ssm
ent
Ques
tion
High
(1)
Med
ium
(0,5
)Lo
w (0
)Sc
ore
Expl
anat
ion
for s
core
Sour
ce o
f evi
denc
e
SUST
AINI
NG
Mar
kets
RSH
20Su
pply-
chai
nDo
es th
e su
pply-
chai
n fo
r san
itatio
n pr
oduc
ts m
eet
hous
ehol
d ne
eds
(read
y av
aila
bilit
y, qu
antit
y an
d co
st),
satis
fy g
over
nmen
t sta
ndar
ds a
nd re
ach
to
unse
rved
are
as?
Yes
for q
uant
ity,
cost
, sta
ndar
ds
and
reac
h
Yes,
but
not
for
all o
f qua
ntity
, co
st, s
tand
ards
an
d re
ach
No0
Prod
ucts
una
vaila
ble
in re
mot
e ar
eas
due
to to
pogr
aphy
, tra
nspo
rt, c
ost,
prod
uct t
ype,
lack
of b
usin
esse
s st
ocki
ng p
rodu
cts.
Dev
elop
men
t of
pro
toty
pes
but n
ot s
cale
d up
. Im
plem
enta
tion
begu
n on
san
itatio
n m
arke
ting
to im
prov
e su
pply
chai
n.
Sani
tatio
n M
arke
ting
Stra
tegy
Dev
elop
men
t Re
port
(201
2), S
anita
tion
Supp
liers
in T
-L S
tudy
(2
010)
; Wat
erAi
d Le
sson
s Le
arne
d fro
m S
anita
tion
Mar
ketin
g in
Tim
or-L
este
(2
011)
Mar
kets
RSH
21Pr
ivate
sec
tor
capa
city
Is th
ere
suffi
cien
t mas
on/a
rtisa
n/sm
all b
usin
ess
capa
city
to m
eet h
ouse
hold
nee
ds (q
uant
ity, q
ualit
y an
d co
st)?
Yes
for q
uant
ity
and
cost
Yes,
for q
uant
ity
but n
ot fo
r cos
tNe
ither
0.5
Insu
ffici
ent n
umbe
r of t
rain
ed m
ason
s to
mee
t tar
gets
, how
ever
ther
e ar
e cu
rrent
ly pe
ople
with
con
stru
ctio
n sk
ills a
vaila
ble
in d
istri
cts.
Pro
blem
is
lack
of a
vaila
ble
prod
ucts
and
af
ford
abilit
y.
DFID
HR
Stud
y; S
anita
tion
wor
ksho
p M
arch
201
3
Mar
kets
RSH
22Pr
ivate
sec
tor
deve
lopm
ent
Does
the
gove
rnm
ent h
ave
prog
ram
s to
pro
mot
e an
d gu
ide
the
dom
estic
priv
ate
sect
or a
nd fa
cilit
ate
inno
vatio
n fo
r the
pro
visio
n of
san
itatio
n se
rvic
es in
ru
ral a
reas
?
Yes,
with
var
ious
co
mpo
nent
sYe
s, b
ut e
ither
be
ing
deve
lope
d or
has
gap
s
No p
rom
otio
n,
guid
ance
or
enco
urag
emen
t
0.5
Som
e di
scus
sion
and
initi
ative
s st
arte
d w
ith g
over
nmen
t on
priva
te
sect
or a
nd p
rodu
ct d
evel
opm
ent b
ut
not t
o sc
ale,
tria
ls o
nly.
Sani
tatio
n w
orks
hop
Mar
ch
2013
Mar
kets
RSH
23M
anag
emen
t of
Dis
aste
r Ris
k an
d Cl
imat
e Ch
ange
Do lo
cal g
over
nmen
t or r
ural
ser
vice
prov
ider
s ha
ve
plan
s fo
r cop
ing
with
nat
ural
dis
aste
rs a
nd c
limat
e ch
ange
?
Yes,
the
maj
ority
of
rura
l ser
vice
prov
ider
s ha
ve a
pl
an fo
r dis
aste
r ris
k m
anag
emen
t an
d cl
imat
e ch
ange
No. O
nly
som
e se
rvic
e pr
ovid
ers
have
a p
lan
for
disa
ster
risk
m
anag
emen
t an
d cl
imat
e ch
ange
or m
ost
serv
ice
prov
ider
s ha
ve u
nder
take
n a
vuln
erab
ility
asse
ssm
ent.
No s
ervic
e pr
ovid
er h
as a
cl
imat
e ac
tion
plan
or h
as
unde
rtake
n a
vuln
erab
ility
asse
ssm
ent.
0Na
tiona
l Ass
essm
ent o
f ris
ks fr
om
clim
ate
chan
ge a
nd n
atur
al d
isas
ter
incl
udes
san
itatio
n an
d he
alth
im
plic
atio
ns. I
nclu
des
adap
tatio
n m
easu
res
such
as
prot
ectio
n of
wat
er
sour
ces
(incl
udin
g fo
r san
itatio
n pu
rpos
es) a
nd d
evel
opin
g em
erge
ncy
prep
ared
ness
pla
n fo
r dis
ease
ou
tbre
ak s
uch
as d
iarrh
ea. A
n em
erge
ncy
inst
itutio
nal s
truct
ure
is
in p
lace
, but
no
budg
et fo
r edu
catio
n an
d aw
aren
ess/
teac
hing
peo
ple
how
to p
lan.
Info
rmat
ion
mis
sing
at
suco
leve
l. Po
licie
s ne
ed to
be
bette
r co
ordi
nate
d.
Natio
nal A
dapt
atio
n Pr
ogra
mm
e of
Act
ion
to
Clim
ate
Chan
ge (2
010)
; Sa
nita
tion
Wor
ksho
p M
arch
20
13
Upta
keRS
H 24
Supp
ort f
or
expa
nsio
nAr
e ex
pend
iture
s at
the
loca
l lev
el in
line
with
the
natio
nal s
anita
tion
polic
y an
d ar
e th
ey s
uffic
ient
to
achi
eve
natio
nal t
arge
ts?
In li
ne w
ith p
olic
y an
d su
ffici
ent t
o ac
hiev
e na
tiona
l ta
rget
s
In li
ne w
ith p
olic
y bu
t in
suffi
cien
t to
ach
ieve
na
tiona
l tar
gets
Not i
n lin
e w
ith
polic
y an
d in
suffi
cien
t to
achi
eve
natio
nal
obje
ctive
s
0Di
fficu
lt to
ass
ess
whe
ther
mon
ey is
su
ffici
ent.
Targ
et h
as n
ot fi
ltere
d do
wn
to d
istri
ct le
vel
Sani
tatio
n w
orks
hop
Mar
ch
2013

Ser
vice
Del
iver
y A
sses
smen
t61
Build
ing
bloc
kNo
.Ar
eas
of
evid
ence
for
asse
ssm
ent
Ques
tion
High
(1)
Med
ium
(0,5
)Lo
w (0
)Sc
ore
Expl
anat
ion
for s
core
Sour
ce o
f evi
denc
e
Upta
keRS
H 25
Ince
ntive
sHa
s go
vern
men
t (na
tiona
l or l
ocal
) dev
elop
ed a
ny
polic
ies,
pro
cedu
res
or p
rogr
ams
to s
timul
ate
upta
ke o
f rur
al s
anita
tion
serv
ices
and
beh
avio
rs b
y ho
useh
olds
?
Polic
ies
and
proc
edur
es
(inst
rum
ents
) de
velo
ped
and
bein
g im
plem
ente
d
Som
e po
licie
s an
d pr
oced
ures
(in
stru
men
ts)
deve
lope
d bu
t no
t im
plem
ente
d
No p
olic
ies
or
proc
edur
es
(inst
rum
ents
) ex
ist
1Ha
ndw
ashi
ng c
ampa
ign
and
sani
tatio
n th
roug
h th
e SI
SCa;
als
o PA
KSI p
rogr
am; s
uco
rew
ards
sy
stem
s. In
pla
ce a
nd b
eing
im
plem
ente
d bu
t nee
ds g
reat
er
scal
ing
up
PAKS
I pro
gram
doc
umen
ts;
SISC
a Gu
idel
ines
; San
itatio
n w
orks
hop
Mar
ch 2
013;
pe
rs. c
omm
. with
Min
istry
of
Heal
th a
nd B
ESIK
sta
ff
Upta
keRS
H 26
Beha
viors
Is th
e go
vern
men
t gen
erat
ing
and
usin
g ev
iden
ce to
m
onito
r and
ana
lyze
hous
ehol
d sa
nita
tion
beha
vior
chan
ge a
nd ta
ke a
ctio
n to
impr
ove
sust
aina
bilit
y?
Rese
arch
use
d to
und
erst
and
beha
vior a
nd
take
act
ion
acro
ss a
var
iety
of
beh
avio
rs
Rese
arch
use
d to
und
erst
and
beha
vior b
ut n
o ac
tion
Rese
arch
not
us
ed a
nd n
o ac
tion
1Se
vera
l stu
dies
com
mis
sion
ed
(not
alw
ays
by g
over
nmen
t, bu
t in
par
tner
ship
with
them
) on
hand
was
hing
, san
itatio
n. E
viden
ce
is u
sed
to p
lan
furth
er in
terv
entio
ns.
Dist
ricts
una
war
e of
mos
t res
earc
h an
d re
sults
.
Join
t San
itatio
n ev
alua
tion
2009
; san
itatio
n m
arke
ting
stud
ies;
PAK
SI tr
ials
; Ha
ndw
ashi
ng w
ith s
oap
rese
arch
. San
itatio
n w
orks
hop
2013
User
ou
tcom
esRS
H 27
Sub-
sect
or
Is th
e su
b-se
ctor
on
track
to m
eet t
he s
tate
d ta
rget
?On
-tra
ckOf
f-tra
ck b
ut
keep
ing
up
with
pop
ulat
ion
grow
th
Off-
track
0Sa
nita
tion
unlik
ely
to m
eet M
DG
targ
ets;
inte
nsive
sca
ling
up re
quire
d to
mee
t Stra
tegi
c De
velo
pmen
t Pla
n ta
rget
s an
d 20
20 in
term
edia
te ta
rget
Pers
. com
m. K
Cla
rk
User
ou
tcom
esRS
H 28
Equi
ty o
f use
Wha
t is
the
ratio
of i
mpr
oved
toile
t acc
ess
betw
een
the
low
est a
nd h
ighe
st q
uint
ile in
rura
l are
as?
Less
than
2
times
Betw
een
2 an
d 5
Mor
e th
an 5
tim
es0
Equi
ty ra
tio o
f 12
UNIC
EF/W
HO e
quity
ana
lysis
fo
r EAP
(201
2)
User
ou
tcom
esRS
H 29
Hygi
enic
use
of
qual
ity fa
cilit
ies
Wha
t per
cent
age
of p
eopl
e liv
ing
in ru
ral a
reas
us
e im
prov
ed to
ilet f
acilit
ies
(exc
ludi
ng s
hare
d fa
cilit
ies)
?
Mor
e th
an 7
5%
of p
eopl
e us
e to
ilets
Betw
een
50%
an
d 75
% o
f pe
ople
use
toile
ts
Less
than
50%
of
peo
ple
use
toile
ts
0Co
vera
ge in
late
st (2
013)
JM
P up
date
is
27%
JMP
figur
es (2
013)
URBA
N W
ATER
SUP
PLY
ENAB
LING
Polic
yUS
H 1Se
ctor
Tar
gets
Are
ther
e US
H ac
cess
targ
ets
(hou
seho
ld le
vel a
nd
sew
erag
e/se
ptag
e m
anag
emen
t) in
the
natio
nal
leve
l dev
elop
men
t pla
n?
Yes,
tar
gets
for
urba
n ho
useh
old
acce
ss a
nd
sew
erag
e/se
ptag
e m
anag
emen
t in
clud
ed in
the
deve
lopm
ent
plan
Targ
ets
for
urba
n ho
useh
old
acce
ss
incl
uded
in
the
deve
lopm
ent
plan
but
no
sew
erag
e or
sep
tage
m
anag
emen
t ta
rget
s in
clud
ed
No u
rban
sa
nita
tion
targ
ets
in th
e
deve
lopm
ent
plan
0.5
Urba
n ho
useh
old
cove
rage
and
ODF
co
mm
uniti
es 1
00%
by
2030
, 100
%
Dili
hous
ehol
ds a
nd 8
2% d
istri
ct
urba
n ta
rget
s fo
r 202
0
Natio
nal S
trate
gic
Deve
lopm
ent P
lan
2011
-20
30, a
nd d
raft
Natio
nal
Sani
tatio
n St
rate
gy 2
012
Polic
yUS
H 2Se
ctor
pol
icy
Is th
ere
an u
rban
san
itatio
n po
licy
that
is a
gree
d by
st
akeh
olde
rs, a
ppro
ved
by g
over
nmen
t, an
d pu
blic
ly av
aila
ble?
Polic
y of
ficia
lly
appr
oved
and
pu
blic
ly av
aila
ble
Polic
y dr
afte
d an
d ag
reed
but
no
t offi
cial
ly ap
prov
ed
No p
olic
y1
Natio
nal B
asic
San
itatio
n Po
licy
appr
oved
by
Coun
cil o
f Min
iste
rs
2012
. Wid
ely
cons
ulte
d.
Natio
nal B
asic
San
itatio
n Po
licy
2012
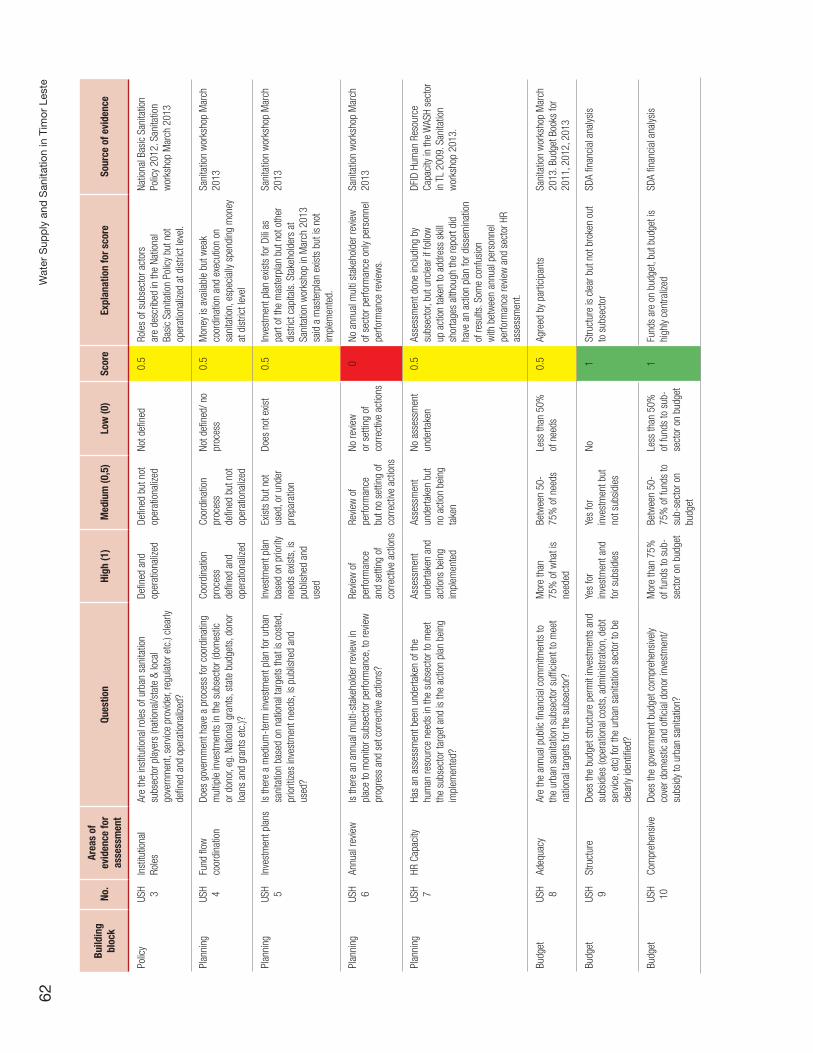
Wat
er S
upp
ly a
nd S
anita
tion
in T
imor
Les
te62
Build
ing
bloc
kNo
.Ar
eas
of
evid
ence
for
asse
ssm
ent
Ques
tion
High
(1)
Med
ium
(0,5
)Lo
w (0
)Sc
ore
Expl
anat
ion
for s
core
Sour
ce o
f evi
denc
e
Polic
yUS
H 3In
stitu
tiona
l Ro
les
Are
the
inst
itutio
nal r
oles
of u
rban
san
itatio
n su
bsec
tor p
laye
rs (n
atio
nal/s
tate
& lo
cal
gove
rnm
ent,
serv
ice
prov
ider
, reg
ulat
or e
tc.)
clea
rly
defin
ed a
nd o
pera
tiona
lized
?
Defin
ed a
nd
oper
atio
naliz
edDe
fined
but
not
op
erat
iona
lized
Not d
efine
d0.
5Ro
les
of s
ubse
ctor
act
ors
are
desc
ribed
in th
e Na
tiona
l Ba
sic
Sani
tatio
n Po
licy
but n
ot
oper
atio
naliz
ed a
t dis
trict
leve
l.
Natio
nal B
asic
San
itatio
n Po
licy
2012
. San
itatio
n w
orks
hop
Mar
ch 2
013
Plan
ning
USH 4
Fund
flow
co
ordi
natio
nDo
es g
over
nmen
t hav
e a
proc
ess
for c
oord
inat
ing
mul
tiple
inve
stm
ents
in th
e su
bsec
tor (
dom
estic
or
don
or, e
g. N
atio
nal g
rant
s, s
tate
bud
gets
, don
or
loan
s an
d gr
ants
etc
.)?
Coor
dina
tion
proc
ess
defin
ed a
nd
oper
atio
naliz
ed
Coor
dina
tion
proc
ess
defin
ed b
ut n
ot
oper
atio
naliz
ed
Not d
efine
d/ n
o pr
oces
s0.
5M
oney
is a
vaila
ble
but w
eak
coor
dina
tion
and
exec
utio
n on
sa
nita
tion,
esp
ecia
lly s
pend
ing
mon
ey
at d
istri
ct le
vel
Sani
tatio
n w
orks
hop
Mar
ch
2013
Plan
ning
USH 5
Inve
stm
ent p
lans
Is th
ere
a m
ediu
m-t
erm
inve
stm
ent p
lan
for u
rban
sa
nita
tion
base
d on
nat
iona
l tar
gets
that
is c
oste
d,
prio
ritize
s in
vest
men
t nee
ds, i
s pu
blis
hed
and
used
?
Inve
stm
ent p
lan
base
d on
prio
rity
need
s ex
ists
, is
publ
ishe
d an
d us
ed
Exis
ts b
ut n
ot
used
, or u
nder
pr
epar
atio
n
Does
not
exis
t0.
5In
vest
men
t pla
n ex
ists
for D
ili as
pa
rt of
the
mas
terp
lan
but n
ot o
ther
di
stric
t cap
itals
. Sta
keho
lder
s at
Sa
nita
tion
wor
ksho
p in
Mar
ch 2
013
said
a m
aste
rpla
n ex
ists
but
is n
ot
impl
emen
ted.
Sani
tatio
n w
orks
hop
Mar
ch
2013
Plan
ning
USH 6
Annu
al re
view
Is th
ere
an a
nnua
l mul
ti-st
akeh
olde
r rev
iew
in
plac
e to
mon
itor s
ubse
ctor
per
form
ance
, to
revie
w
prog
ress
and
set
cor
rect
ive a
ctio
ns?
Revie
w o
f pe
rform
ance
an
d se
tting
of
corre
ctive
act
ions
Revie
w o
f pe
rform
ance
bu
t no
setti
ng o
f co
rrect
ive a
ctio
ns
No re
view
or
set
ting
of
corre
ctive
act
ions
0No
ann
ual m
ulti
stak
ehol
der r
evie
w
of s
ecto
r per
form
ance
onl
y pe
rson
nel
perfo
rman
ce re
view
s.
Sani
tatio
n w
orks
hop
Mar
ch
2013
Plan
ning
USH 7
HR C
apac
ityHa
s an
ass
essm
ent b
een
unde
rtake
n of
the
hum
an re
sour
ce n
eeds
in th
e su
bsec
tor t
o m
eet
the
subs
ecto
r tar
get a
nd is
the
actio
n pl
an b
eing
im
plem
ente
d?
Asse
ssm
ent
unde
rtake
n an
d ac
tions
bei
ng
impl
emen
ted
Asse
ssm
ent
unde
rtake
n bu
t no
act
ion
bein
g ta
ken
No a
sses
smen
t un
derta
ken
0.5
Asse
ssm
ent d
one
incl
udin
g by
su
bsec
tor,
but u
ncle
ar if
follo
w
up a
ctio
n ta
ken
to a
ddre
ss s
kill
shor
tage
s al
thou
gh th
e re
port
did
have
an
actio
n pl
an fo
r dis
sem
inat
ion
of re
sults
. Som
e co
nfus
ion
with
bet
wee
n an
nual
per
sonn
el
perfo
rman
ce re
view
and
sec
tor H
R as
sess
men
t.
DFID
Hum
an R
esou
rce
Capa
city
in th
e W
ASH
sect
or
in T
L 20
09. S
anita
tion
wor
ksho
p 20
13.
Budg
etUS
H 8Ad
equa
cyAr
e th
e an
nual
pub
lic fi
nanc
ial c
omm
itmen
ts to
th
e ur
ban
sani
tatio
n su
bsec
tor s
uffic
ient
to m
eet
natio
nal t
arge
ts fo
r the
sub
sect
or?
Mor
e th
an
75%
of w
hat i
s ne
eded
Betw
een
50-
75%
of n
eeds
Less
than
50%
of
nee
ds0.
5Ag
reed
by
parti
cipa
nts
Sani
tatio
n w
orks
hop
Mar
ch
2013
. Bud
get B
ooks
for
2011
, 201
2, 2
013
Budg
etUS
H 9St
ruct
ure
Does
the
budg
et s
truct
ure
perm
it in
vest
men
ts a
nd
subs
idie
s (o
pera
tiona
l cos
ts, a
dmin
istra
tion,
deb
t se
rvic
e, e
tc) f
or th
e ur
ban
sani
tatio
n se
ctor
to b
e cl
early
iden
tified
?
Yes
for
inve
stm
ent a
nd
for s
ubsi
dies
Yes
for
inve
stm
ent b
ut
not s
ubsi
dies
No1
Stru
ctur
e is
cle
ar b
ut n
ot b
roke
n ou
t to
sub
sect
orSD
A fin
anci
al a
nalys
is
Budg
etUS
H 10
Com
preh
ensi
veDo
es th
e go
vern
men
t bud
get c
ompr
ehen
sive
ly co
ver d
omes
tic a
nd o
ffici
al d
onor
inve
stm
ent/
subs
idy
to u
rban
san
itatio
n?
Mor
e th
an 7
5%
of fu
nds
to s
ub-
sect
or o
n bu
dget
Betw
een
50-
75%
of f
unds
to
sub-
sect
or o
n bu
dget
Less
than
50%
of
fund
s to
sub
-se
ctor
on
budg
et
1Fu
nds
are
on b
udge
t, bu
t bud
get i
s hi
ghly
cent
raliz
edSD
A fin
anci
al a
nalys
is

Ser
vice
Del
iver
y A
sses
smen
t63
Build
ing
bloc
kNo
.Ar
eas
of
evid
ence
for
asse
ssm
ent
Ques
tion
High
(1)
Med
ium
(0,5
)Lo
w (0
)Sc
ore
Expl
anat
ion
for s
core
Sour
ce o
f evi
denc
e
DEVE
LOPI
NG
Expe
nditu
reUS
H 11
Utiliz
atio
n of
do
mes
tic fu
nds
Wha
t per
cent
age
of d
omes
tic fu
nds
budg
eted
for
urba
n sa
nita
tion
are
spen
t (3
year
ave
rage
)?Ov
er 7
5%Be
twee
n 50
%
and
75%
Less
than
50%
1No
sub
sect
or d
isag
greg
atio
n al
thou
gh
no p
robl
em w
ith b
udge
t exe
cutio
nSD
A fin
anci
al a
nalys
is a
nd
Sani
tatio
n w
orks
hop
Mar
ch
2013
Expe
nditu
reUS
H 12
Utiliz
atio
n of
ex
tern
al f
unds
Wha
t per
cent
age
of e
xter
nal f
unds
bud
gete
d fo
r ur
ban
sani
tatio
n ar
e sp
ent (
3 ye
ar a
vera
ge)?
Ov
er 7
5%Be
twee
n 50
%
and
75%
Less
than
50%
0.5
Diffi
cult
to a
sses
s pr
obab
ly be
twee
n 50
-75%
Sani
tatio
n w
orks
hop
Mar
ch
2013
Expe
nditu
reUS
H 13
Repo
rting
Is u
rban
san
itatio
n ex
pend
iture
ver
sus
budg
et
audi
ted
and
repo
rted
on in
a c
onso
lidat
ed fo
rmat
fo
r all
sour
ces
of d
omes
tic a
nd o
ffici
al d
onor
ex
pend
iture
?
Yes
for d
omes
tic
and
dono
r ex
pend
iture
Yes
for d
omes
tic
expe
nditu
reNo
0.5
Dono
r exp
endi
ture
s m
ay b
e au
dite
d bu
t not
dis
clos
edSa
nita
tion
wor
ksho
p M
arch
20
13
Equi
tyUS
H 14
Loca
l pa
rtici
patio
nAr
e th
ere
clea
rly d
efine
d pr
oced
ures
for i
nfor
min
g,
cons
ultin
g w
ith a
nd s
uppo
rting
loca
l par
ticip
atio
n in
pla
nnin
g, b
udge
ting
and
impl
emen
ting
for u
rban
sa
nita
tion
deve
lopm
ents
?
Yes
and
syst
emat
ical
ly ap
plie
d
Yes,
but
not
sy
stem
atic
ally
appl
ied
No1
Parti
cipa
tion
proc
esse
s ex
ist
Sani
tatio
n w
orks
hop
Mar
ch
2013
Equi
tyUS
H 15
Budg
et a
lloca
tion
crite
riaHa
ve c
riter
ia (o
r a fo
rmul
a) b
een
dete
rmin
ed to
al
loca
te u
rban
san
itatio
n fu
ndin
g eq
uita
bly
to
urba
n ut
ilitie
s or
ser
vice
prov
ider
s an
d am
ong
mun
icip
aliti
es a
nd is
it b
eing
con
sist
ently
app
lied?
Yes,
app
lied
cons
iste
ntly
Yes,
but
no
t app
lied
cons
iste
ntly
No1
Som
e pr
iorit
izatio
n of
urb
an
sani
tatio
n.
Sani
tatio
n w
orks
hop
Mar
ch
2013
Equi
tyUS
H 16
Redu
cing
in
equa
lity
Do lo
cal g
over
nmen
t or u
rban
ser
vice
prov
ider
s (n
atio
nal o
r in
3 la
rges
t citi
es) h
ave
spec
ific
plan
s or
m
easu
res
deve
lope
d an
d im
plem
ente
d fo
r ser
ving
the
urba
n po
or?
Plan
s de
velo
ped
and
impl
emen
ted
Plan
s de
velo
ped
but n
ot
impl
emen
ted
No p
lans
do
cum
ente
d0
No e
viden
ceSa
nita
tion
wor
ksho
p M
arch
20
13
Outp
utUS
H 17
Quan
tity
(acc
ess)
Is th
e an
nual
exp
ansi
on o
f ur
ban
hous
ehol
ds
gain
ing
acce
ss to
saf
e sa
nita
tion
suffi
cien
t to
mee
t th
e su
bsec
tor t
arge
ts?
Over
75%
of t
hat
need
ed to
reac
h se
ctor
targ
ets
Betw
een
75%
an
d 50
% o
f th
at n
eede
d to
ac
hiev
e ta
rget
s
Less
than
50%
of
that
nee
ded
to
reac
h ta
rget
s
1Ur
ban
sani
tatio
n is
incr
easi
ng
parti
cula
rly in
Dili,
whi
ch re
pres
ents
60
% o
f the
ent
ire u
rban
pop
ulat
ion
Natio
nal c
ensu
s da
ta
Outp
utUS
H 18
Quan
tity
(trea
tmen
t)Is
the
annu
al in
crea
se in
the
prop
ortio
n of
feca
l w
aste
that
is s
afel
y co
llect
ed a
nd tr
eate
d gr
owin
g at
the
pace
requ
ired
to m
eet t
he s
ubse
ctor
targ
ets
(for b
oth
onsi
te a
nd s
ewer
age)
?
For c
olle
ctio
n an
d fo
r tre
atm
ent
For c
olle
ctio
n bu
t no
t for
tre
atm
ent
Not f
or c
olle
ctio
n or
trea
tmen
t (or
if
no ta
rget
)
0.5
No s
ubse
ctor
targ
ets
for f
ecal
was
te
colle
ctio
nSa
nita
tion
wor
ksho
p M
arch
20
13
Outp
utUS
H 19
Repo
rting
Ar
e th
ere
proc
edur
es a
nd p
roce
sses
app
lied
on a
re
gula
r bas
is to
mon
itor u
rban
san
itatio
n ac
cess
an
d th
e qu
ality
of s
ervic
es a
nd is
the
info
rmat
ion
diss
emin
ated
?
Qual
ity,
quan
tity
and
diss
emin
ated
Qual
ity o
r qu
antit
yNe
ither
0.5
Cens
us, h
ealth
sur
veys
mea
sure
qu
antit
y in
term
s of
acc
ess
to
hous
ehol
d sa
nita
tion
Cens
us a
nd h
ealth
sur
veys

Wat
er S
upp
ly a
nd S
anita
tion
in T
imor
Les
te64
Build
ing
bloc
kNo
.Ar
eas
of
evid
ence
for
asse
ssm
ent
Ques
tion
High
(1)
Med
ium
(0,5
)Lo
w (0
)Sc
ore
Expl
anat
ion
for s
core
Sour
ce o
f evi
denc
e
SUST
AINI
NG
Mai
nten
ance
USH
20Co
llect
ion
and
treat
men
t W
hat i
s th
e pr
opor
tion
of to
tal f
ecal
was
te
gene
rate
d th
at g
ets
safe
ly co
llect
ed a
nd tr
eate
d?Ov
er 7
5% o
f th
at g
ener
ated
is
col
lect
ed a
nd
treat
ed
Over
50%
of
that
gen
erat
ed
is c
olle
cted
from
th
e HH
leve
l
Less
than
50%
of
that
gen
erat
ed0
Whi
le d
istri
ct c
apita
ls li
kely
to h
ave
latri
nes,
ther
e ar
e no
t col
lect
ion
or
treat
men
t fac
ilitie
s/di
spos
al s
ites.
Few
HH
s em
pty
thei
r lat
rines
.
WSP
Urb
an s
anita
tion
surv
ey. D
iscu
ssio
n w
ith J
oao
Pied
ade
Mai
nten
ance
USH
21Co
st re
cove
ryAr
e O&
M c
osts
of t
reat
men
t sys
tem
s (b
eyon
d ho
useh
old
leve
l fac
ilitie
s) a
sses
sed/
know
n an
d fu
lly
met
by
eith
er c
ost r
ecov
ery
thro
ugh
user
fees
and
/or
loca
l rev
enue
or t
rans
fers
?
O&M
cos
ts
know
n an
d >
75%
cov
ered
th
roug
h co
st
reco
very
O&M
cos
ts a
re
know
n an
d 50
%
cove
red
thro
ugh
cost
reco
very
O&M
cos
ts n
ot
know
n0
O&M
cos
ts n
ot k
now
n an
d po
licy
has
not b
een
impl
emen
ted
Sani
tatio
n w
orks
hop
Mar
ch
2013
Mai
nten
ance
USH
22Di
scha
rge
Are
ther
e no
rms
and
stan
dard
s fo
r was
tew
ater
di
scha
rge
for s
epta
ge a
nd s
ewer
age
treat
men
t pl
ants
that
are
sys
tem
atic
ally
mon
itore
d un
der a
re
gim
e of
san
ctio
ns (p
enal
ties)
?
Exis
t and
are
m
onito
red
unde
r a
regi
me
of
sanc
tions
Exis
t and
maj
ority
ar
e m
onito
red,
bu
t the
re a
re n
o sa
nctio
ns
Stan
dard
s ex
ist
but m
ajor
ity
of p
lant
s ar
e no
t reg
ular
ly m
onito
red
0Th
ere
are
Indo
nesi
an re
gula
tions
on
sept
age
for I
ndus
trial
, Hot
el, H
ospi
tal,
Oil &
Gas
and
min
ing
sect
ors:
Vario
us E
nviro
nmen
tal
Min
iste
rial D
iplo
mas
on
Was
tew
ater
Sta
ndar
ds fo
r In
dust
ries;
Mon
itorin
g fo
r se
wag
e tre
atm
ent p
lant
ef
fluen
t:
Mai
nten
ance
USH
23M
anag
emen
t of
Dis
aste
r Ris
k an
d Cl
imat
e Ch
ange
Do lo
cal g
over
nmen
t or s
ervic
e pr
ovid
ers
(nat
iona
l or
in 3
larg
est c
ities
) hav
e pl
ans
for c
opin
g w
ith
natu
ral d
isas
ters
and
clim
ate
chan
ge?
Yes,
the
maj
ority
of
urb
an s
ervic
e pr
ovid
ers
have
a
plan
for d
isas
ter
risk
man
agem
ent
and
clim
ate
chan
ge
No. O
nly
som
e se
rvic
e pr
ovid
ers
have
a p
lan
for
disa
ster
risk
m
anag
emen
t an
d cl
imat
e ch
ange
or m
ost
serv
ice
prov
ider
s ha
ve u
nder
take
n a
vuln
erab
ility
asse
ssm
ent.
No s
ervic
e pr
ovid
er h
as a
cl
imat
e ac
tion
plan
or h
as
unde
rtake
n a
vuln
erab
ility
asse
ssm
ent.
0Na
tiona
l Ass
essm
ent o
f ris
ks fr
om
clim
ate
chan
ge a
nd n
atur
al d
isas
ter
incl
udes
san
itatio
n an
d he
alth
im
plic
atio
ns. I
nclu
des
adap
tatio
n m
easu
res
such
as
prot
ectio
n of
wat
er
sour
ces
(incl
udin
g fo
r san
itatio
n pu
rpos
es) a
nd d
evel
opin
g em
erge
ncy
prep
ared
ness
pla
n fo
r dis
ease
ou
tbre
ak s
uch
as d
iarrh
oea.
An
emer
genc
y in
stitu
tiona
l stru
ctur
e is
in
pla
ce, b
ut n
o bu
dget
for e
duca
tion
and
awar
enes
s/te
achi
ng p
eopl
e ho
w to
pla
n. In
form
atio
n m
issi
ng a
t su
co le
vel.
Polic
ies
need
to b
e be
tter
coor
dina
ted.
Dis
trict
s re
ly on
cen
tral
leve
l for
info
rmat
ion.
Natio
nal A
dapt
atio
n Pr
ogra
mm
e of
Act
ion
to
Clim
ate
Chan
ge (2
010)
. Sa
nita
tion
wor
ksho
p M
arch
20
13
Expa
nsio
nUS
H 24
Upta
ke
Has
gove
rnm
ent (
natio
nal o
r loc
al) d
evel
oped
any
po
licie
s, p
roce
dure
s or
pro
gram
s to
stim
ulat
e up
take
of u
rban
san
itatio
n se
rvic
es a
nd b
ehav
iors
by
hou
seho
lds?
Polic
ies
and
proc
edur
es
(inst
rum
ents
) de
velo
ped
and
bein
g im
plem
ente
d
Som
e po
licie
s an
d pr
oced
ures
(in
stru
men
ts)
deve
lope
d bu
t no
t im
plem
ente
d
No p
olic
ies
or
proc
edur
es
(inst
rum
ents
) ex
ist
0.5
Noth
ing
spec
ifica
lly u
rban
but
nat
iona
l po
licie
s an
d pr
oced
ures
enc
oura
ge.
Impl
emen
tatio
n is
lack
ing.
Sani
tatio
n w
orks
hop
Mar
ch
2013

Ser
vice
Del
iver
y A
sses
smen
t65
Build
ing
bloc
kNo
.Ar
eas
of
evid
ence
for
asse
ssm
ent
Ques
tion
High
(1)
Med
ium
(0,5
)Lo
w (0
)Sc
ore
Expl
anat
ion
for s
core
Sour
ce o
f evi
denc
e
Expa
nsio
nUS
H 25
Plan
sDo
gov
ernm
ent/s
ervic
e pr
ovid
ers
have
bus
ines
s pl
ans
for e
xpan
ding
the
prop
ortio
n of
city
wid
e fe
cal
was
te th
at is
saf
ely
colle
cted
and
trea
ted?
Busi
ness
pla
ns
for e
xpan
sion
of
col
lect
ion
& tre
atm
ent b
eing
im
plem
ente
d
Busi
ness
pla
ns
for e
xpan
sion
of
col
lect
ion
& tre
atm
ent u
nder
pr
epar
atio
n
No B
usin
ess
Plan
s0
No b
usin
ess
plan
sSa
nita
tion
wor
ksho
p M
arch
20
13
Expa
nsio
nUS
H 26
Priva
te s
ecto
r de
velo
pmen
tDo
es th
e go
vern
men
t hav
e on
goin
g pr
ogra
ms
and
mea
sure
s to
stre
ngth
en th
e do
mes
tic p
rivat
e se
ctor
fo
r the
pro
visio
n of
san
itatio
n se
rvic
es in
urb
an o
r pe
ri-ur
ban
area
s?
Yes,
var
ious
co
mpo
nent
sIn
dev
elop
men
t, fe
w c
ompo
nent
sNo
0.5
Uncl
ear —
may
be s
ome
prog
ram
but
ev
iden
ce is
lack
ing
Sani
tatio
n w
orks
hop
Mar
ch
2013
User
ou
tcom
esUS
H 27
Sub-
sect
or
prog
ress
Is th
e su
b-se
ctor
on
track
to m
eet t
he s
tate
d ta
rget
?On
-tra
ckOf
f-tra
ck b
ut
keep
ing
up
with
pop
ulat
ion
grow
th
Off-
track
0.5
Anom
aly
that
the
sect
or is
not
ge
tting
eno
ugh
mon
ey b
ut a
cces
s is
incr
easi
ng. N
ot q
uite
on
track
for
targ
ets
Sani
tatio
n w
orks
hop
Mar
ch
2013
. SDA
ana
lysis
User
ou
tcom
esUS
H 28
Equi
ty o
f use
Wha
t is
the
ratio
of i
mpr
oved
toile
t acc
ess
betw
een
the
low
est a
nd h
ighe
st q
uint
ile in
urb
an a
reas
? Le
ss th
an 2
tim
esBe
twee
n 2
and
5M
ore
than
5
times
0.5
Equi
ty ra
tio o
f 3.2
UNIC
EF/W
HO E
quity
ana
lysis
fo
r EAP
cou
ntrie
s 20
12
(Usi
ng 2
009
DHS
data
)
User
ou
tcom
esUS
H 29
Use
of fa
cilit
ies
Wha
t per
cent
age
of p
eopl
e liv
ing
in u
rban
are
as
use
impr
oved
toile
t fac
ilitie
s (e
xclu
ding
sha
red
faci
litie
s)?
Mor
e th
an 9
0%
of p
eopl
eM
ore
than
75%
of
peo
ple
Less
than
75%
of
peo
ple
0Co
vera
ge in
late
st (2
013)
JM
P up
date
is
68%
JMP
figur
es (2
013)


Service Delivery Assessment 67
Annex 2: Assumptions and Inputs for Financial Model
This annex describes the key inputs that were used to gen-erate estimates of the required expenditures to meet gov-ernment targets and anticipated capital expenditures from 2013 to 2020. It discusses the sources, adjustments and assumptions of the following information: Exchange rates, demographic variables, sector-specific technologies and spending plans.
Exchange rates
The official currency in Timor-Leste is the US dollar. No exchange rate calculations were necessary.
Demographic and Access Estimates
The main demographic variables in the SDA financial model are rural and urban population estimates or projections for 1995, 2011, and the target year (2020). Combined with es-timates of actual and target coverage rates for water and sanitation, this information assists in the calculation of the number of people who will be needing access to improved facilities from 2011 to the target year. The second set of infor-mation refers to the average size of households. This is used to convert costs of facilities, which are generally expressed on a per household basis, into per capita terms.
Table A2.1 shows the key demographic variables used in the analysis. Population and coverage data for 1995 was based on JMP 2013a that used estimates from the United Nations Department of Economic and Social Affairs, Popu-
lation Division.90 Population estimates for 2011 were made by using official Timor-Leste census results for 2010 (Gov-ernment of Timor-Leste 2011 p. xxi) and applying the aver-age annual growth rate of 2.41% during intercensal period 2000-2010.91 2011 population projections used the same rural/urban percentages in the 2010 census. 2011 access figures for water supply and sanitation are from JMP 2013 (pp. 30 and 31). Population projections for 2020 are from the United Nations Department of Economic and Social Af-fairs Population Division.92 The percentage estimates for rural and urban population in 2020 are from Google Earth “Environments of the Poor”; these were applied to the UN total population estimates. Access targets for overall na-tional and sub-sectors of rural and urban water supply and rural and urban sanitation were also agreed in stakeholder meetings. For both rural and urban water supply, the target is drawn from the Ministry of Public Works Five Year Action Plan 2013 -2017 (pp. 2 and 7), and the national figure is cal-culated based on population estimates. For sanitation, the rural percentage is drawn from the draft national Sanitation Strategic Plan which calculates the 2020 target from the Strategic Development Plan target for 2030, while the ur-ban percentage is calculated from the draft national Strate-gic Sanitation Plan which targets district towns having 82% coverage and Dili having 100% coverage by 2020. National sanitation coverage in 2020 was calculated based on pro-jected population. It does not include shared facilities.
The average household size (5.8 persons) was drawn from the 2010 census.
90 Population data are available at http://esa.un.org/unpd/wpp/Excel-Data/population.htm.91 See http://timor-leste.gov.tl/?p=4144&lang=en). 92 World Population Prospects: The 2010 Revision, http://esa.un.org/unpd/wpp/index.htm Medium variant 2015-2025 viewed 21 Feb 2013.

Water Supply and Sanitation in Timor Leste68
Table A2.2 Timor-Leste: Distribution, Unit Costs, and Lifespans of Water Supply Technologies Among Households with Access to Improved Water Supply (Used for SDA Financial Model )
TechnologyEstimated Distribution 2011 Projected Distribution
2020 Unit capital cost(US$/capita)
Lifespan(years)
Assumed user share of unit cost
Rural Urban Rural Urban
Piped into dwelling or premises
26% 46% 28% 70%190 (rural)379 (urban)
9 (rural)20 (urban)
10%
Public tap 40% 26% 52% 13% 140 9 10%
Tube/piped well or borehole 27% 9% 5% 10% 190 8 99%
Protected dug well/spring 27% 9% 14% 7% 35 10 99%
Improved Rainwater Collection
1% 0% 1% 0% 34 10 99%
Total 100% 100% 100% 100%
Water Supply Technology Distribution, Unit Costs and Lifespan
Information on the distribution of technologies is used to calculate capital investment required to meet national tar-gets. Table A2.2 presents information on the estimated household distribution, per capita costs, and lifespans of key water supply technologies. The technology distribu-tion is for households that already have access to improved water supply.
The relative distribution of water supply technologies for 2011 were assumed to be identical to 2010, for which evidence is available. The distributions were based on the 2010 census.93 The projected technology distribution for 2020 was based on stakeholder discussions at a workshop on 5 June 2013 plus subsequent discussion with experts from the AusAID-funded BESIK project on 17 June 2013.
Table A2.1. Timor-Leste: Population (millions) and Access to Improved Water Supply and Sanitation 1995, 2011, and 2020 used for SDA Financial Model
Region
1995 Estimated 2011 Estimated 2020 Target
Pop.Access
Pop.Access
Pop.Access
Wat. San. WAt. San. Wat. San.
Rural 0.7 49% 33% 0.8 60% 27% 1.0 80% 68%
Urban 0.2 67% 51% 0.3 93% 68% 0.5 100% 93%
National 0.9 53% 37% 1.1 69% 39% 1.5 87% 76%
93 Population and Housing Census Data of Timor-Leste, Vol 3 social and Economic Data Summary p. xx.

Service Delivery Assessment 69
Evidence for unit capital costs for water piped into premis-es represent expenditures for materials and labor and were derived from data supplied by the AusAID-funded BESIK project for rural water supply and from estimates from Asian Development Bank projects in urban water supply. For all other technologies, estimates from the BESIK project were used, based on actual costs, with the major assumption be-ing that costs for rural and urban water supply technologies are similar except for water piped onto premises (for which urban systems are more complex and expensive). The same assumption was made for lifespans. The difference in lifes-pans for rural and urban water supply piped onto premises was estimated in part from functionality studies conducted by Oxfam and Triangle in 2008.94 It should be noted, how-ever, that functionality of water supply systems is not an ab-solute (either functioning or non-functioning). Especially in the case of rural water supply systems, the supply may be partially functional or a small repair such as a valve or pump would make systems functional. The SDA model however assumes that all capital investment must be fully replaced after its functional lifespan, which has been set fairly low for rural piped water supply schemes.
Sanitation Technology Distribution, Unit Costs, and Lifespan
Table A2.3 presents information on the estimated house-hold distribution, costs, and lifespans of key sanitation technologies. These were used to calculate capital invest-ment required to meet national targets.
The relative distribution of sanitation technologies for 2011 were assumed to be identical to 2010, for which evidence is available. The distributions were based on the 2010 cen-sus.95 The projections for 2020 were based on stakeholder discussions at a workshop on 5 June 2013 plus subsequent discussion with a major stakeholder on 17 June 2013.
There is no mention of sewerage connections in the 2010 census as there is no networked sewerage system in Timor-Leste, although a Dili Sanitation and Drainage Master Plan envisions a system for the capital. For the financial model it is assumed that stage 2 of the master plan – completion of one decentralized wastewater treatment systems – would be completed by 2020.
Table A2.3 Timor-Leste: Distribution, Unit Costs, and Lifespans of Sanitation Technologies Among Households with Access to Improved Sanitation (Used for SDA Financial Model)
TechnologyEstimated Distribution 2011 Projected Distribution
2020 Unit cost(US$/capita)
Lifespan(years)
Assumed user share of unit
costRural Urban Rural Urban
Pour flush/flush connected to sewerage
0% 0% 0% 10% 1,807 20 3%
Pour flush/flush connected to tank or pit
24% 30% 56% 70% 2110 (rural)15 (urban)
99%
Simple Improved Pit latrine 44% 46% 25% 10% 7 5 99%
VIP latrine 32% 24% 19% 3% 22 5 99%
Total 100% 100% 100% 100%
94 Oxfam Australia (2008) Covalima District Rural Water Supply Management Study and Triangle Génération Humanitaire (2008) Manatuto District Rural Water Supply Management Survey.95 Population and Housing Census Data of Timor-Leste, Vol 3 social and Economic Data Summary p. xx.

Water Supply and Sanitation in Timor Leste70
by the household. However, this does not mean that the households will certainly invest 100% of the requirements in the future; their expenditures need to be mobilized by corresponding “software” expenditures by government and donors. Thus the high deficits displayed for sanita-tion household expenditure can be conceptualized as the amounts that should be leveraged in the future with “soft-ware” expenditures.
Investments
Assumptions about the country’s budget commitment to all capital investment have been taken from the government budget figures (refer table A2.4).
Population projections plus technology distributions, costs, and lifespans are the key ingredients in estimating capital investment needed to reach national targets. To get a sense of how short- to medium-term actual expenditures measure against investment requirements, planned investments of the government, donor agencies, NGOs, and private insti-tutions from 2010 to 2012 were obtained from documents supplied by government agencies, published budgets, and interviews. An attempt was also made to estimate the con-tribution of households or users.
In 2011, about 20% of the total PDL budget of US$ 3.5 mil-lion was allocated for water supply projects (new and reha-bilitation), 2% in urban areas and 17% in rural areas, while in 2012, about US$ 2.4 million—41% of a total $5.3 million budget - was allocated to water supply. In 2011 about 7% was allocated for sanitation facilities, but all of these were public facilities that do not assist in reaching sanitation cov-erage goals and so were not included in SDA estimates or projections. SDA estimates adjusted these percentages and applied them to other funds to obtain an overall figure for rural water supply. Forecast budget for water and sanita-tion under the PNDS has not been included in the analysis because the total budget is not known.
Unit costs for networked sewerage plus treatment were cal-culated from data and cost estimates presented in the Dili Sanitation and Drainage Master Plan. Estimates for other sanitation technologies were based on figures offered by experts from the AusAID-funded BESIK project, the Timor-Leste Red Cross, and WaterAid. Lifespan figures were presented at a stakeholder workshop on 5 June 2013 and modified by subsequent discussion with BESIK experts on 17 June 2013.
User Share
The planned spending of users is computed by specifying the proportion of investments that the authorities believe households should contribute. This could be an expressed policy, supported by documentation. In the absence of such a policy, however, the approach was to consult ex-perts in the water and sanitation sector. It is through this consultation process that the user shares for urban and ru-ral water supply were obtained. Hence, the approach used in the analysis is to assume a share that the household is likely to contribute for different technologies. The percent-age of user investment in capital costs for rural sanitation, for example, was assumed to be 100% (the model calcula-tions do not allow entering more than 99%) as it is assumed that households will bear the major costs of investment in rural sanitation “hardware” in the future. The model uses the same user share for urban and rural infrastructure.
The assumed contributions of the households for invest-ments in water supply and sanitation are given in tables A.2.2 and A.2.3. In all cases, household investment is cal-culated based on a leverage ratio whose denominator is government investment. For example, for a leverage ratio of 1:2, for every dollar of government capital (hardware) in-vestment, the household would invest two units. For onsite sanitation, this is difficult to conceptualize because in many countries the government is in fact contributing very little capital. Virtually all the cost of onsite sanitation is borne

Service Delivery Assessment 71
Table A2.4. Timor-Leste: Budget and Capital Spending 2010-2015, US$ millions
2010 actual
2011 actual
2012 budget
2013 budget
2014 budget
2015 budget
Combined Sources Budget (Government + Development Partners)
-- 1,379.8 2,028.3 1,850.9 2,088.5 2.078.4
Total Government Expenditure 760.8 1,095.9 1,806.5 1,647.5 1,949.0 2,045.8
Recurrent 506.1 507.8 757.3 841.8 870.5 908.8
Minor Capital 38.3 27.2 49.2 49.6 51.6 53.6
Capital and Development (Including all Infrastructure Expenditures)
215.9 561.0 1,000.0 756.9 1,026.9 1,083.3
Capital as percent of Government Budget
-- 51% 55% 46% 53% 52.9%
Development Partner Commitments -- 283.9 221.8 203.4 139.5 32.6
Note: -- data not available. Source: RDTL 2013a p.43.
Given limitations on time and resources, the SDA invest-ment estimates should not be regarded as in-depth or highly detailed, but a wide view of spending. Apart from the difficulties associated with collecting information from various sources, several other challenges were confronted in the process. The financial model uses information on only hardware costs (for example, construction costs of facili-ties) and excludes software costs (for example training and awareness programs, project implementation, and salaries). Moreover, such information must be disaggregated among the four sectors (that is, rural water supply, urban water sup-ply, rural sanitation, and urban sanitation) and, in the case of multiyear projects, for each year. This disaggregation is usually not readily available, or even known, for projects. The SDA team consulted project funders, implementers, and other experts as well as examples of similar or previous projects to make informed estimates.
Table A2.5 shows the projected average annual spending of government and development partners, including NGOs from 2013 to 2015.
Table A2.5. Timor-Leste: Estimated Average Anticipated Annual Capital Investments in Water Supply and Sanitation 2013–2015 (Used for SDA Financial Model), US dollars, millions
Sub-Sector Government
Development Partners
including NGOs and private
sector
Total
Rural water supply 13.0 1.7 14.7
Urban water supply 10.6 4.1 14.7
Rural sanitation 0 0 0
Urban sanitation 4.7 0 4.7
Total Anticipated Capital Investment
28.3 5.8 34.1
Source: SDA estimates

Water Supply and Sanitation in Timor Leste72
Operations and Maintenance
The estimates of operations and maintenance costs are de-rived from averaging a set percentage of existing technolo-gies and expected future technologies to get an average cost. These are assumed to be 3% of the capital cost for water supply piped onto premises or public taps, and 1.5% of the capital cost of other types of water supply technolo-gies. For sanitation, the estimate is 3% of the capital cost for networked sewerage and for pour flush/flush into tanks or pits, and 1.5% for other technologies. When estimating O&M costs, there is no distinction between urban and rural sanitation and water supply, however total O&M costs (in Table A2.6) are pro-rated according to the predicted tech-nology distribution for 2020.
Table A.2.6 below presents annual estimates of O&M costs in 2011 and 2020, and the average.
Table A2.6. Timor-Leste: Estimated Operations and Maintenance Costs for Water Supply and Sanitation (Used for SDA Financial Model)
2011 O&M 2020 O&M Average O&M
Rural WS 1.2 2.6 1.9
Urban WS 2.2 4.5 3.4
WS total 3.4 7.1 5.3
Rural S&H 0.1 0.3 0.2
Urban S&H 0.1 2.7 1.4
S&H total 0.2 3.0 1.6

Service Delivery Assessment 73
ADB (2011) Democratic Republic of Timor-Leste: Strength-ening Water Sector Management and Service Delivery, Tech-nical Assistance Report, Project Number: 45227, Asian De-velopment Bank, Manila
Commonwealth of Australia, (2000). [December] East Timor – Final Report of the Senate Foreign Affairs, Defence and Trade References Committee, p.17 [pdf] Canberra: Commonwealth of Australia
Dale, P and Butterworth, D. (2010) Articulations of Local Gov-ernance in Timor-Leste: Lessons for Local Development un-der Decentralization. Justice for the Poor Policy Note. World Bank. Washington.
Dutton, P and Siregar, R (2010). Timor-Leste Urban Sanita-tion Assessment, WSP
FH Designs (2009) Human Resource Capacity in the Water, Sanitation and Hygiene Sector in East Timor, DFID
Government of Timor-Leste (2004) Approval for the Modali-ties of Distribution of Water for Public Consumption, 11 Feb-ruary 2004
Government of Timor-Leste (2010) National Adaptation Pro-gramme of Action (NAPA) On Climate Change. Dili: Ministry for Economy And Development, Secretary of State for Envi-ronment
Government of Timor-Leste (2011) Strategic Development Plan 2011-2030
References
Government of Timor-Leste (2013) Operationalizing the Stra-tegic Development Plan, Transition from the National Priori-ties Process to the Strategic Development Plan 2011-2030. Development Policy Coordination Mechanism (DPCM). Concept paper approved by the Council of Ministers on 19 March 2013
Government of Timor-Leste (2013a) Republica Democrati-ca de Timor-Leste State Budget 2013 Book 1. Available at http://www.mof.gov.tl/wp-content/uploads/2013/04/ENG-LISH_Budget_Book_UPDATE-17.04.2013-FINAL.pdf
Government of Timor-Leste (2013b) Republica Democratica de Timor-Leste Orçamento Geral do Estado 2013 Planos de Acçao Anual Livro 2. (Democratic Republic of Timor-Leste State Budget 2013 Book 2) Available at http://www.mof.gov.tl/wp-content/uploads/2013/04/PORTUGUESE-Livro-2-Pla-nos-Anuais-2013-Vers%C3%A3o-FINAL-25.3.2013-LOS.pdf
Government of Timor-Leste (2013c) Republica Democratica de Timor-Leste Orçamento Geral do Estado 2013 Fundos Es-peciais l Livro 6. (Democratic Republic of Timor-Leste State Budget 2013 Special Funds Book 6) Available at http://www.mof.gov.tl/wp-content/uploads/2013/04/PORTUGUESE_Budget_Book_6-2013_FINAL_2032013.pdf
Government of Timor-Leste and UNDP (2009) The Millen-nium Development Goals, Timor-Leste
Government of Timor-Leste, Decree Law 2011 National De-velopment Agency

Water Supply and Sanitation in Timor Leste74
Government of Timor-Leste, Decree Law No. 1/2011 on Or-ganizational Structure of Ministry of Infrastructure, Article 25 Directorate of National Basic Sanitation Services
Government of Timor-Leste, Ministerial Diploma October 2009 – How to regulate/implement a system of tariffs.
Government of Timor-Leste, Timor-Leste National Basic San-itation Policy, approved by the Council of Ministers in Janu-ary 2012
IMF (2010) Democratic Republic of Timor-Leste Public Fi-nancial Management Performance Report. November 2010. Country Report No 10/341.
IMF (2012) International Monetary Fund Democratic Repub-lic of Timor-Leste: Staff Report for the 2011 Article IV Consul-tation. IMF Country Report No 12/24 February 2012. Wash-ington: IMF
International Monetary Fund, World Economic Outlook Data-base, April 2013
IRC International Water and Sanitation Centre, Water and Sanitation Information System for Timor-Leste SIBS (Sistema Informasaun Bee no Saneamentu) Apr 18, 2013. Prepared for the Monitoring Sustainable WASH Service Delivery Sympo-sium, 9 - 11 April 2013, Addis Ababa, Ethiopia.
JMP (2013a). [April]. “Estimates on the Water Sources and Sanitation Facilities.” Available from wss.info.org.
JMP (2013b) Progress on Drinking Water and Sanitation: 2013 Update. UNICEF and WHO.
Kuehn, S (2010) Briefing Note On the Decentralization Pro-cess in Timor Leste. Dili, Timor-Leste, Joint UNDP-UNCDF Local Governance Support Program (LGSP), Dili, Timor-Leste. Available at http://www.estatal.gov.tl/English/Desen-tralization/pub_doc.html
Ministry of Health (nd) Strengthen Communities in the area of Health Through SISCa Servisu Integradu da Saúde Commu-nitária (Integrated Community Health Services). Government of Timor-Leste
Ministry of Infrastructure and Ministry of Health, 2009. Timor-Leste Joint Sanitation Evaluation Report A Study of Sanita-tion Program Outcomes, June – September, 2009
Ministry of Public Works (2012) Five Year Action Plans 2013-2017
National Statistics Directorate, Ministry of Finance, and ICF Macro. (2010). Timor-Leste Demographic and Health Survey 2009-10. Dili, Timor-Leste: NSD and ICF Macro,
National Statistics Directorate and United Nations Population Fund (2011) Population and Housing Census 2010, Dili: Gov-ernment of Timor-Leste
Oxfam Australia (2008) Covalima District Rural Water Supply Management Study
The Asia Foundation/Irish Aid (c2102) Community Experi-ences of decentralized development in Timor-Leste
Triangle Génération Humanitaire (2008) Manatuto District Ru-ral Water Supply Management Survey
UNICEF (2013) Improving Child Nutrition -The achievable im-perative for global progress. New York: UNICEF.
World Bank (2009) Community-Based Development and In-frastructure in Timor-Leste: Past Experiences & Future Op-portunities. AusAID – East Asia and Pacific Infrastructure for Growth Trust Fund

Service Delivery Assessment 75


Water Supply and Sanitation in Timor-LesteTurning Finance into Services for the Future
April 2015Service Delivery Assessment