Embed Size (px)
Citation preview
UNITED STATES DEPARTMENT OF THE INTERIORJ. A. Krug, Secretary
GEOLOGICAL SURVEYW. E. Wrather, Director
Water-Supply Paper 999
GROUND-WATER RESOURCES
OF THE CINCINNATI AREA
BUTLER AND HAMILTON COUNTIES
OHIO
BY
FRED H. KLAER, JR., AND DAVID G. THOMPSON
Prepared in cooperation with the
Boards of Commissioners of
Butler and Hamilton Counties, Ohio
UNITED STATES
GOVERNMENT PRINTING OFFICE
WASHINGTON : 1948
For sale by the Superintendent of Documents, U. S. Government Printing | Office, Washington 25, D. C.2-9-48 i
CONTENTS
Page
Abstract.. ..___________'____ 1Introduction __ .__ -- ' 2
Purpose and scope of the investigation_____ __________ .-- 2Location of the area__________ ._ _ 4Previous investigations.. __ _________ ___ . _ 5Well records.-________________________~___:__. _ 6Acknowledgments__________________________________ -- 6
Geography. ________________________._ _ . 7Surface features and drainage.._________________ ______ __ __ 7Climate.. ... _________________ ___ ___ ___.. 9Agricultural and industrial development_______________________._ 9
Geology ______... '__ 10Summary of stratigraphy and structure.---.--._____.___________.-__-- 10Glacial history......__________________________________________.-_-- 10Water-bearing formations___._______......___________________ 16
General characteristics______________________._______-._ 16Hydrologic properties_._.________-_.____________________________ 18
Test drilling......____________________________________........ .. 19Precipitation. _______________________________________________________.. 21Pumpage.. _________________________________.-__..__..__....__-.. 27Water table and artesian conditions...__.____-._.__________________._-_-_ 29Fluctuation of water levels.-_______.._._________._____.____-____.._.-_-_ 31Artificial recharge_.._______.____..._.____.....__..__._______.-_._ 35Quality of water.__________________________________________________________ 38Ground water in specific localities_____._._.___._____._._....-_...._ 40
Miami Valley.______________. ___________________. _ 40Middletown. ______.__._____...._.____.___.____.__-__________.-._ 41Miami Valley between Middletown and New Miami____ ______ 51New Miami_______________________________________________________ 52Hamilton.--_.__________________________________________________ 54Miami Valley south of Hamilton_____---_.__.__.._.._...__._...___--- 58
Divide area between Miami Valley and Mill Creek Valley________________ 61Mill Creek Valley..._____.___.__..__._..__...___.______.___________..._ 64
Upper Mill Creek Valley____________-..______________________. _._ 64Wyoming-Lockland-Reading_______________________________________ 73Hartwell-Carthage-Elmwood Place._---_--_--_--._-.-..--__---___--.- 79Ivorydale-St. Bernard___.___._._______.._________ 83Lower Mill Creek Valley___._.___.___.__._._____._'....__....... .- 87Cincinnati Basin______________________________________________._ 88
Norwood Trough and Little Miami Valley -_---_---_--_________-__-___- 90Possible additional sources of water supply in Mill Creek Valley and the Norwood
Trough____.__.__________ '... ________________________________ 97Records of wells in Butler and Hamilton Counties, Ohio. __.__._--__________..-- 108Index......__-___.-______.._______.__.__.._._.......___________........___ 167
ILLUSTRATIONS
PLATE 1. Map of Butler and Hamilton Counties, Ohio, showing approximate limitsof buried valleys, location of subareas, and locations of wells. _ _ _ In pocket
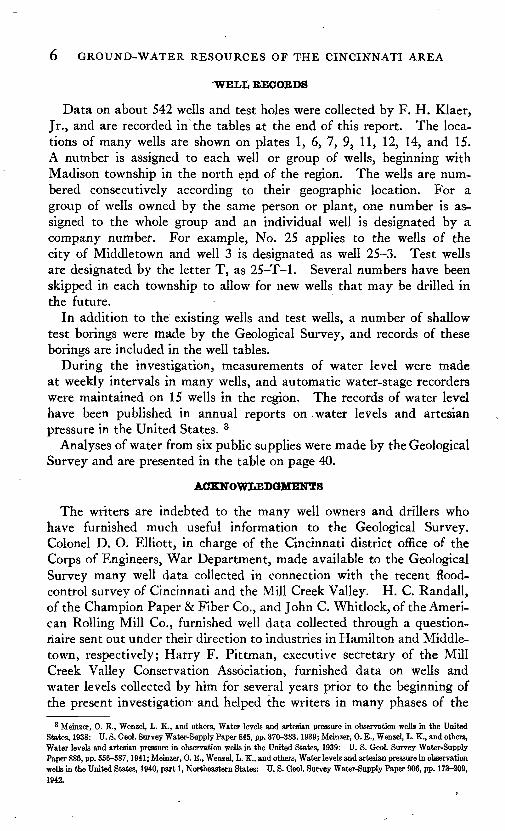
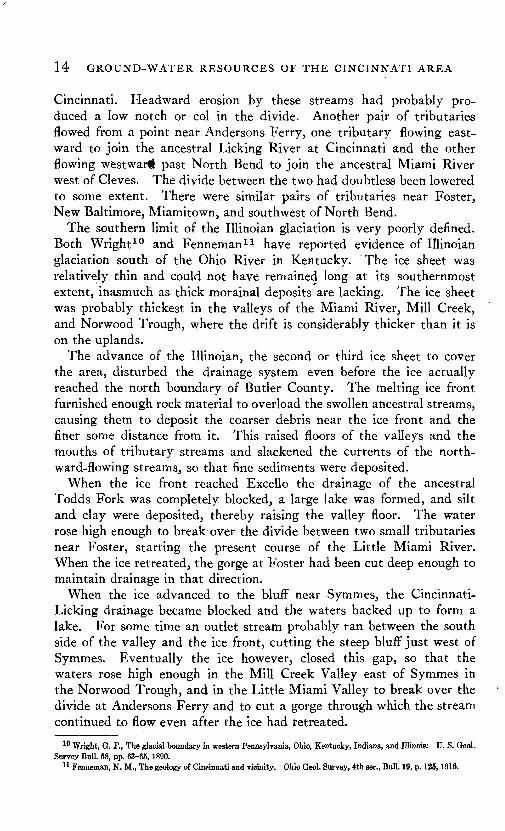
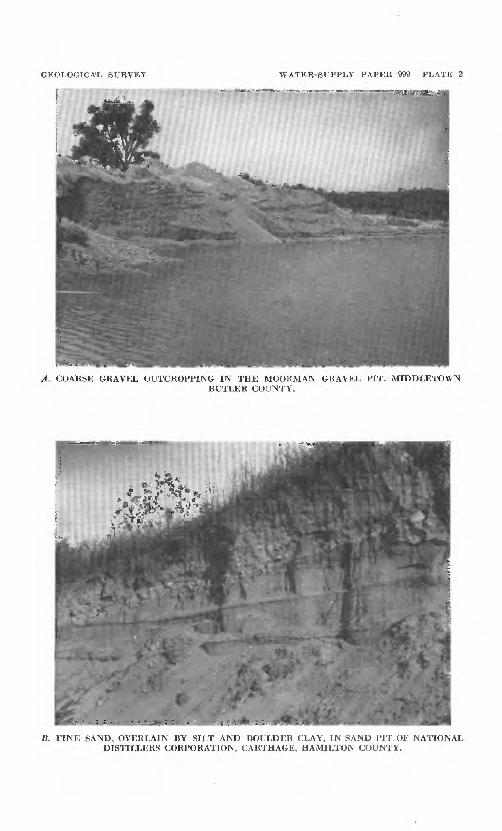
2. Ay Coarse gravel outcropping in the Moorman gravel pit, Middle- town, Butler County; B, Fine sand, overlain by silt and boulder- clay, in sand pit of National Distillers Corporation, Carthage, Hamilton County--------_--- -_---_______--_______________ 16
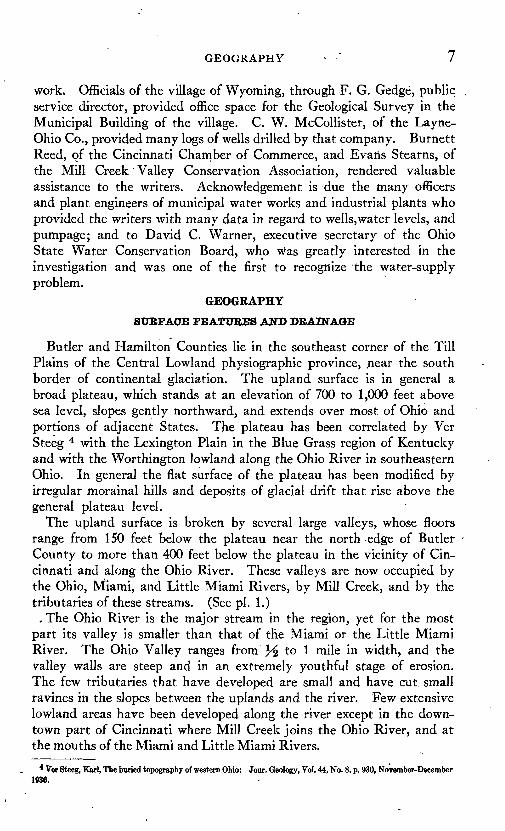
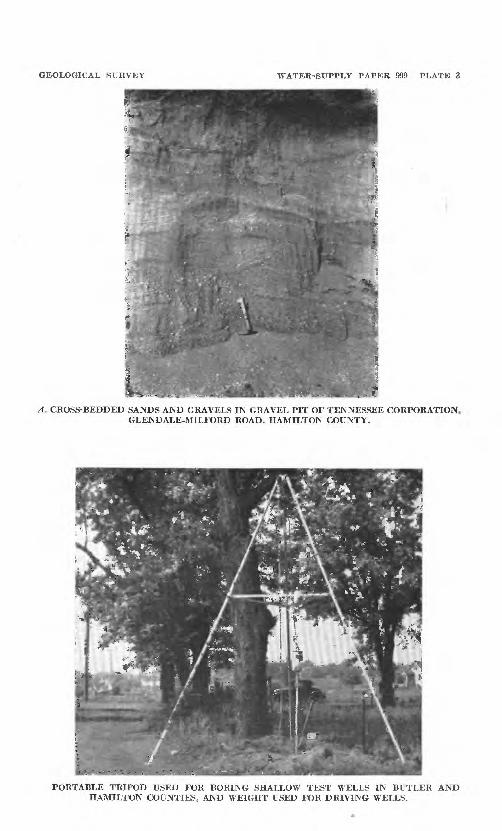
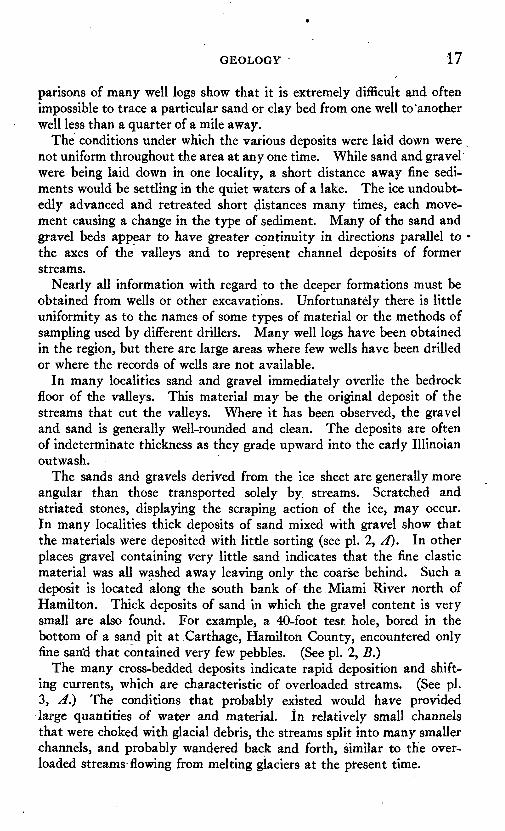
3. A, Cross^bedded sands and gravels in gravel pit of Tennessee Corpora tion, Glendale-Milford Road, Hamilton County; B, Portable tripod used for boring shallow test wells in Butler and Hamilton Counties, and weight used for driving wells-----------_--____-_ 17
4. At Automatic water-stage recorder used to record fluctuations of water level in wells; B, Wooden recorder shelter on well 212-1, Hamilton County._-----___________________________ 31
5. Graphs showing relation of water levels in observation wells, supplywells, and Miami River----_-_-_--__-__-__-_-_-_---_--___ In pocket
6. Map of Middletown, Butler County, showing location of wells and ap proximate limits of buried valleys. _-_-____-_--___________ In pocket
7. Map of Hamilton, Butler County, showing location of wells and ap proximate limits of buried valleys--..--_.___________---__ In pocket
8. Graphs of water level in wells 151-1, 151-2, and 160-2, Divide area,Butler County, January 17 to December 31, 1940._________ In pocket
9. Map of Mill Creek Valley from Flockton to Crescentville, Butler County, Ohio, showing location of wells and approximate limits of buried valley----..---------____-_-______-___---_---_ In pocket
10. Profile of land surface, water table, and piezometric surface in the Miamiand Mill Creek Valleys, from Miami River south of Hamilton to Ivorydale, November 7-9, 1940-._______________ In pocket
11. Map of Mill Creek Valley from Crescentville to Jackson Road, showinglocation of wells and approximate limits of buried valley.-.. In pocket
12. Map of Wyoming-Lockland-Reading area, Mill Creek Valley, Hamilton County, showing location of wells and approximate limits of buried valley__---__---_-__-___---_____----_--_--_-_--------- In pocket
13. Graphs showing lowest water level reached in four wells in Hamilton County, as determined from recorder charts, July 1, 1938, to De cember 31, 1940.________________________ _ In pocket
14. Map of Ivorydale-St. Bernard area and Norwood Trough, showinglocation of wells and approximate limits of buried valleys.--. In pocket
15. Map of Cincinnati Basin area, Hamilton County, showing location ofwells and approximate limits of buried valley --------------- In pocket
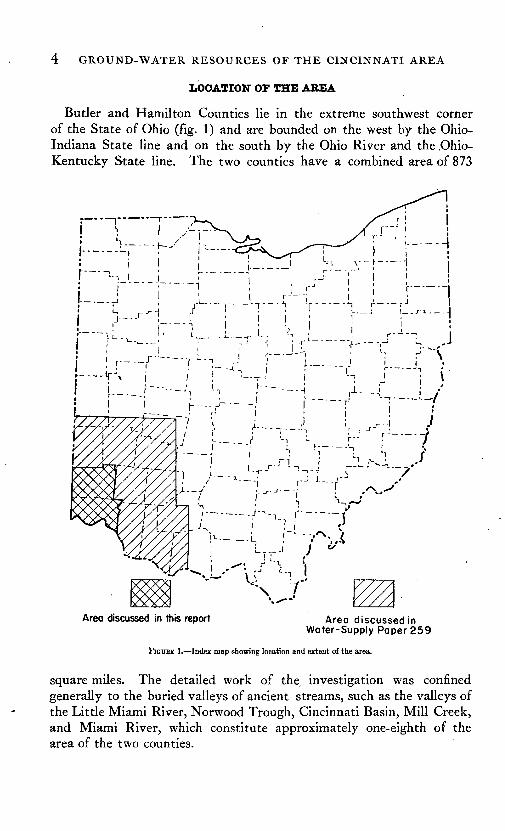
FIGURE 1. Index map showing location and extent of the area_____-__-_____- 42. Pre-Illinoian drainage in the Cincinnati area, Ohio (after Fenneman)__ 123. Cumulative departure from normal precipitation, by years, at the
Federal Building, 1871-1936, and at Abbe Observatory, 1916-40, inclusive, Cincinnati, Ohio____________________._-_--___--_ 22
4. Cumulative departure from normal precipitation, by months, at AbbeObservatory, January 1,1930, to December 31,1940----.____ 25
5. Precipitation, by months, at Abbe Observatory, near Mount Healthy, and at Hamilton and Middletown, January 1, 1938, to December 31, 1940 ._--_.__-_.____._________ __ ____.__-___-___ 27
IV
ILLUSTRATIONS v
Page6. Monthly pumpage from wells of the eight largest users of ground water
in the Wyoming-Lockland-Reading area, Hamilton County, Jan uary 1, 1939, to December 31, 1940...________________________ 28
7. Monthly pumpage from wells of the 14 largest users of ground water in the Ivorydale-St. Bernard area, Hamilton County, January 1, 1939, to December 31, 1940...._._......_..._.___.._........_ 29
8. Chart from automatic water-stage recorder on deep well at Glendale waterworks, Hamilton County, showing fluctuations of water level caused by pumping from a nearby well_..______._._ 33
9. Chart from automatic water-stage recorder in an observation well at Hamilton waterworks, Butler County, showing fluctuations of water level caused by pumping from a particular well or group of wells___-._._-_________-_-____..___________________--__ 33
10. Rise in water level in well 151-1, Flock ton, Butler County, Ohio, caused by heavy precipitation in April 1940. Well is 227 feet deep. Precipitation recorded at U. S. Weather Bureau Station, Hamil ton, Ohio ._-___-_._.___.___-_--__-____._-_____._-._.__-__ 34
11. Graphs of water level in the Moorman (J) and Smith (L) gravel pits, wells 29-1 and 33-1, and the Miami River at Central Avenue Bridge, Middletown, Butler County, October 1, 1938, to Decem ber 31, 1940...___..______..._._._____.-_-____-..._ 43
12. Graph of water level in well 85-7, Hamilton waterworks, New Miami,Butler County, March 7,1939, to December 31,1940_______ 53
13. Graph of water level in well 104-1, McGreevy Dairy Co., Hamilton,Butler County, November 30, 1938, to December 31, 1940. _ . . . _ 57
14. Graphs of water level in well 117 and gravel pit E, Miami Valley,Butler County, March 10, 1938, to December 31,1940___.... 60
15. Graphs of water level in wells 165-2, 173, 175, 180, and 204-3, Upper Mill Creek Valley, Butler and Hamilton Counties, July 14, 1938, to December 31, 1940.___....____.___________-.-. 66
16. Graphs of water level in wells 207-3, 207-5, and 212-1, Mill CreekValley, Hamilton County, August 1,1938, to December 31,1940_ . 68
17. Graph of water level in well 218-3, Mill Creek Valley, HamiltonCounty, March 3 to December 31, 1940____________-... 72
18. Graphs of water level in wells 226, T-55, and T-80, Mill Creek Valley,Hamilton County, June 6, 1939, to December 31, 1940______ 78
19. Graph of water level in well 252, Carthage, Hamilton County, Novem ber 7, 1938, to December 31, 1940......_____._____._ 83
20. Graphs of water level in wells 265, 270-25, 270-a5, and 270-a4, Mill Creek Valley, Hamilton County, July 7, 1938, to December 31, 1940___.__........._.._...___..__......__.____...._.__.... 86
21. Graphs of water level in wells 315-3 and 317-14, Norwood Trough,Hamilton County, July 1, 1938, to December 31, 1940.......--. 92
22. Profile of land surface and water table in the Norwood Trough, Hamil ton County, from Ivorydale to Little Miami River..._.._._...__ 94
GROUND-WATER RESOURCES OF THE CINCINNATI AREA BUTLER AND HAMILTON COUNTIES, OHIO
By FRED H. KLAER, JR., and DAVID G. THOMPSON
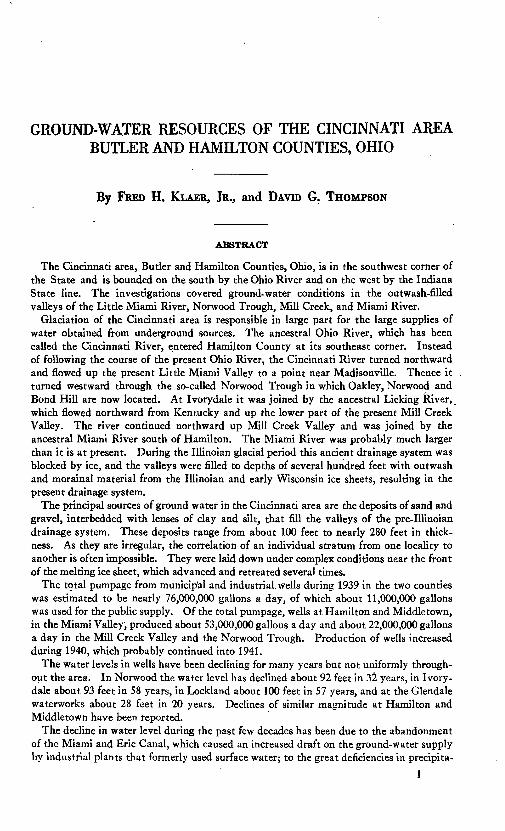
ABSTRACT
The Cincinnati area, Butler and Hamilton Counties, Ohio, is in the southwest corner of the State and is bounded on the south by the Ohio River and on the west by the Indiana State line. The investigations covered ground-water conditions in the outwash-filled valleys of the Little Miami River, Norwood Trough, Mill Creek, and Miami River.
Glaciation of the Cincinnati area Is responsible in large part for the large supplies of water obtained from underground sources. The ancestral Ohio River, which has been called the Cincinnati River, entered Hamilton County at its southeast corner. Instead of following the course of the present Ohio River, the Cincinnati River turned northward and flowed up the present Little Miami Valley to a point near Madisonville. Thence it turned westward through the so-called Norwood Trough in which Oakley, Norwood and Bond Hill are now located. At Ivorydale it was joined by the ancestral Licking River, which flowed northward from Kentucky and up the lower part of the present Mill Creek Valley. The river continued northward up Mill Creek Valley and was joined by the ancestral Miami River south of Hamilton. The Miami River was probably much larger than it is at present. During the Illinoian glacial period this ancient drainage system was blocked by ice, and the valleys were filled to depths of several hundred feet with outwash and morainal material from the Illinoian and early Wisconsin ice sheets, resulting in the present drainage system.
The principal sources of ground water in the Cincinnati area are the deposits of sand and gravel, interbedded with lenses of clay and silt, that fill the valleys of the pre-Illinoian drainage system. These deposits range from about 100 feet to nearly 280 feet in thick ness. As they are irregular, the correlation of an individual stratum from one locality to another is often impossible. They were laid down under complex conditions near the front of the melting ice sheet, which advanced and retreated several times.
The total pumpage from municipal and industrial, wells during 1939 in the two counties was estimated to be nearly 76,000,000 gallons a day, of which about 11,000,000 gallons was used for the public supply. Of the total pumpage, wells at Hamilton and Middletown, in the Miami Valley, produced about 53,000,000 gallons a day and about 22,000,000 gallons a day in the Mill Creek Valley and the Norwood Trough. Production of wells increased during 1940, which probably continued into 1941.
The water levels in wells have been declining for many years bat not uniformly through out the area. In Norwood the water level has declined about 92 feet in 32 years, in Ivory- dale about 93 feet in 58 years, in Lockland about 100 feet in 57 years, and at the Glendale waterworks about 28 feet in 20 years. Declines of similar magnitude at Hamilton and Middletown have been reported.
The decline in water level during the past few decades has been due to the abandonment of the Miami and Erie Canal, which caused an increased draft on the ground-water supply by industrial plants that formerly used surface water; to the great deficiencies in precipita-
1
2 GROUND-WATER RESOURCES OF THE CINCINNATI AREA
tion in 1930, 1934, and 1936; to drainage changes, which have increased and speeded up the run-off; to the close spacing of wells; and particularly to overpumping in certain areas.
During the period of investigation, from July 1938 to December 1940, the water level declined from 1 foot to 4 feet in spite of favorable conditions for recharge during the spring of 1939 and 1940. The decline was due largely to the seasonal distribution of precipita tion and to increased industrial pumpage from October to December 1940.
The recharge to the water-bearing formations in the Mill Creek Valley during 1939 was estimated to be approximately equal to the average daily pumpage from wells, or about 13,000,000 gallons a day. The lowest levels reached during the fall of 1939 in most wells were only slightly lower and in some wells even higher than those reached in the fall of 1938. During 1940 the pumpage was in general greater than 13,000,000 gallons a day and the water levels in most wells declined.
Increasing the ground-water supply by artificial recharge in the Mill Creek and Miami Valleys is hindered by the silt in the surface water, and by the difficulties of providing an adequate source of water without constructing storage facilities.
Additional water supplies could be developed by bringing in surface water or ground water by canal or pipeline from the Miami or the Little Miami Valley, by obtaining water from reservoirs in or near the Mill creek or the Miami Valley, or by purchasing water from the city of Cincinnati.
Detailed discussions of individual areas are included, together with tables of well data and water analyses.
INTRODUCTION
PURPOSE AND SCOPE OF THE INVESTIGATION
In Cincinnati and neighboring cities and villages in Butler and Hamil ton Counties, Ohio, large quantities of water are pumped for industrial and municipal use from wells in the sand and gravel deposits that fill buried glacial valleys. In certain areas the water level has declined as much as 90 feet during the last 50 years. Major droughts in Ohio in 1930 and 1934 brought attention to the declining water level, and it was feared that the ground-water supply, used principally by industrial plants that require large quantities of cheap cool water was in danger of exhaustion. Through the efforts of Mr. Harry F. Pittman, a resident of Lockland, the Mill Creek Valley Conservation Association was formed to study the problem of declining water level and to determine what remedial measures could be applied in order to obtain an adequate water supply. The organization, originally made up mainly of public-spirited citizens and small landowners in Mill Creek Valley, was supported by most of the industrial firms and municipalities and now includes most of the chief users of ground water in Mill Creek Valley. Advice and help were given to the association by Mr. David C. Warner, at that time executive secretary of the Ohio State Water Conservation Board, who was one of the first to realize the seriousness of the situation.
In 1936 the Federal Geological Survey was requested to make a pre liminary investigation with financial cooperation by the Boards of County Commissioners of Butler and Hamilton Counties. In Novem ber of that year a brief field study of the^region'was made by David G.
INTRODUCTION J
Thompson, of the Geological Survey. The problem obviously was not' limited to Hamilton County but extended into Butler County and into the Miami Valley.
In April 1938 an agreement was signed between the Geological Survey and the Boards of County Commissioners of Butler and Hamilton Counties to provide for a detailed investigation of ground-water condi tions in the two counties. Field work was begun on June 23, 1938; Mr. Thompson remained in the region for about 6 weeks, and Mr. Klaer continued the field work until December 15, 1938. On May 3, 1939, Mr. Klaer resumed the field work and continued until November 1939; in January 1940 he returned to the region for about 6 weeks to supervise the drilling of two deep test wells in Butler County. Several additional visits of a week or two have been made during the remainder of the time. Records of water levels and automatic water-stage recorders were main tained from September 1, 1938, to December 31, 1940, by Harry F. Pitt- man and Curtis L. Elliott, as local observers. Most of the detailed field work has been done by Mr. Klaer under the supervision of Mr. Thomp son, and the report has been prepared largely by Mr. Klaer. The in vestigation as described in this report covers the period from June 1938 to December 1940.
The investigation was made in accordance with the recommendations of Mr. Thompson as a result of his preliminary study in November 1936. The principal sources of ground-water supply in Butler and Hamilton Counties were studied thoroughly to determine, so far as possible, the perennial yield of these sources; to ascertain whether it has been exceeded by the consumption; and, if so, to consider possible methods of pre venting ultimate exhaustion of the ground-water supply.
To obtain information bearing on the perennial yield of water-bearing beds in the region, the present investigation included the study of the following: The distribution, both in lateral and in vertical extent, of the water-bearing formations; the distribution of the non-water-bearing beds, especially in relation to the areas of intake of the water-bearing beds; the approximate quantity of recharge from precipitation and from the Ohio, Miami, and Little Miami Rivers and from Mill Creek; the ability of the water-bearing beds to transmit water from areas of intake to areas of heavy withdrawal; the quantities of water pumped monthly and yearly, and the effects of pumping on ground-water level and ar tesian head; the effects on the water level or artesian head of recent deficiencies in precipitation and of possible heavier precipitation in the future; the effect of draining the Miami and Erie Canal; and the feasi bility of using artificial recharge methods to increase the ground-water supply.
4 GROUND-WATER RESOURCES OF THE CINCINNATI AREA
LOCATION OF THE AREA
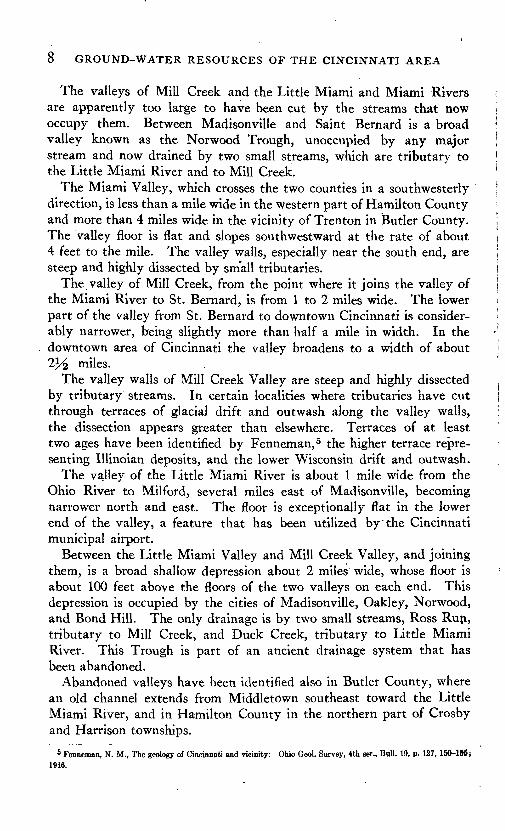
Butler and Hamilton Counties lie in the extreme southwest corner of the State of Ohio (fig. 1) and are bounded on the west by the Ohio- Indiana State line and on the south by the Ohio River and the .Ohio- Kentucky State line. The two counties have a combined area of 873
Area discussed in this report
FIGURE 1. Index map showing location and extent of the area.
Area discussed in Water-Supply Paper 259
square miles. The detailed work of the investigation was confined generally to the buried valleys of ancient streams, such as the valleys of the Little Miami River, Norwood Trough, Cincinnati Basin, Mill Creek, and Miami River, which constitute approximately one-eighth of the area of the two counties.
INTRODUCTION 5
PREVIOUS INVESTIGATIONS
The ground-water conditions in Butler and Hamilton Counties were described by Fuller and Clapp l in 1912. Their report contains general discussions of the occurrence of ground water in the various formations underlying an area that includes parts of 14 counties in southeastern Ohio, brief descriptions of ground-water conditions in specific localities, and tables of well data.
The geology of the Cincinnati region was described in detail by Fenne- man, 2 and much of the geological discussion included in this report is based on his report. He made only brief mention of the ground-water resources of the region.
In October 1936 a brief study was made by David G. Thompson, under a cooperative agreement between the Geological Survey and the Boards of County Commissioners of Butler and Hamilton Counties, to determine the type of detailed investigation needed in this region. The results were released only in manuscript form. Copies of the manu script may be consulted in the offices of the Geological Survey at Wash ington, D. C., and Columbus, Ohio; of the Board of County Commis sioners of Hamilton County at Cincinnati and of Butler County at Hamilton; of H. F. Pittman, executive secretary of the Mill Creek Valley Conservation Association, at Lockland, Ohio; and of the depart ment of geology of the University of Cincinnati at Cincinnati.
In February 1940 a brief progress report on the first 1J^ years of the present work was released in manuscript form. Copies of the complete manuscript may be consulted in the offices of the Geological Survey at Washington, D. C., and Columbus; of the Board of County Commis sioners of Hamilton County at Cincinnati and of Butler County at Hamilton; of the executive secretary, Mill Creek Valley Conservation Association, at Lockland; and of the Public Library at Middletown, Ohio. An abstract of the progress report was mimeographed for local distribution by the Mill Creek Valley Conservation Association.
Besides the reports mentioned, an investigation of the region was made in 1938 by the Cincinnati district office of the Corps of Engineers, U. S. War Department, in connection with plans for flood control in Mill Creek Valley.
The glacial history of the Cincinnati region has been discussed in papers by various geologists. The section on the glacial history of the region (pp. 10-16) is based on the work of these men.
1 Fuller, M. L., and Clapp, F. G., The underground waters of southwestern Ohio: U. S. Geol. Survey Water-Supply Paper 259, 228 pp., 1912.
2 Fenneman, N. M., The geology of Cincinnati and vicinity: Ohio Geol. Survey 4th sec.Bull. 19,207pp., 2 maps, 1916.
6 GROUND-WATER RESOURCES OF THE CINCINNATI AREA
WELL RECORDS
Data on about 542 wells and test holes were collected by F. H. Klaer, Jr., and are recorded in the tables at the end of this report. The loca tions of many wells are shown on plates 1, 6, 7, 9? 11, 12, 14, and 15. A number is assigned to each well or group of wells, beginning with Madison township in the north end of the region. The wells are num bered consecutively according to their geographic location. For a group of wells owned by the same person or plant, one number is as signed to the whole group and an individual well is designated by a company number. For example, No. 25 applies to the wells of the city of Middletown and well 3 is designated as well 25-3. Test wells are designated by the letter T, as 25-T-l. Several numbers have been skipped in each township to allow for new wells that may be drilled in the future.
In addition to the existing wells and test wells, a number of shallow test borings were made by the Geological Survey, and records of these borings are included in the well tables.
During the investigation, measurements of water level were made at weekly intervals in many wells, and automatic water-stage recorders were maintained on 15 wells in the region. The records of water level have been published in annual reports on .water levels and artesian pressure in the United States. 3
Analyses of water from six public supplies were made by the Geological Survey and are presented in the table on page 40.
ACKNOWLEDGMENTS
The writers are indebted to the many well owners and drillers who have furnished much useful information to the Geological Survey. Colonel D. O. Elliott, in charge of the Cincinnati district office of the Corps of Engineers, War Department, made available to the Geological Survey many well data collected in connection with the recent flood- control survey of Cincinnati and the Mill Creek Valley. H. C. Randall, of the Champion Paper & Fiber Co., and John C. Whitlock, of the Ameri can Rolling Mill Co., furnished well data collected through a question naire sent out under their direction to industries in Hamilton and Middle- town, respectively; Harry F. Pittman, executive secretary of the Mill Creek Valley Conservation Association, furnished data on wells and water levels collected by him for several years prior to the beginning of the present investigation and helped the writers in many phases of the
3 Meinzer, 0. E., Wenzel, L. K., and others, Water levels and artesian pressure in observation wells in the United States, 1938: U. S. Geol. Survey Water-Supply Paper 845, pp. 370-383,1939; Meinzer, 0. E., Wenzel, L. K., and others, Water levels and artesian pressure in observation wells in the United States, 1939: U. S. Geol. Survey Water-Supply Paper 886, pp. 556-587,1941; Meinzer, 0. E., Wenzel, L. K., and others, Water levels and artesian pressure in observation wells in the United States, 1940, part 1, Northeastern States: U. S. Geol. Survey Water-Supply Paper 906, pp. 173-209, 1942.
GEOGRAPHY - " 7
work. Officials of,the village of Wyoming, through F. G. Gedge, public service director, provided office space for the Geological Survey in the Municipal Building of the village. C. W. McCollister, of the Layne- Ohio Co., provided many logs of wells drilled by that company. Burnett Reed, of the Cincinnati Chamber of Commerce, and Evans Stearns, of the Mill Creek Valley Conservation Association, rendered valuable assistance to the writers. Acknowledgement is due the many officers and plant engineers of municipal water works and industrial plants who provided the writers with many data in regard to wells,water levels, and pumpage; and to David C. Warner, executive secretary of the Ohio State Water Conservation Board, who was greatly interested in the investigation and was one of the first to recognize the water-supply problem.
GEOGRAPHY
SURFACE FEATURES AND DRAINAGE
Butler and Hamilton Counties lie in the southeast corner of the Till Plains of the Central Lowland physiographic province, .near the south border of continental glaciation. The upland surface is in general a broad plateau, which stands at an elevation of 700 to 1,000 feet above sea level, slopes gently northward, and extends over most of Ohio and portions of adjacent States. The plateau has been correlated by Ver Steeg 4 with the Lexington Plain in the Blue Grass region of Kentucky and with the Worthington lowland along the Ohio River in southeastern Ohio. In general the flat surface of the plateau has been modified by irregular morainal hills and deposits of glacial drift that rise above the general plateau level.
The upland surface is broken by several large valleys, whose floors range from 150 feet below the plateau near the north edge of Butler County to more than 400 feet below the plateau in the vicinity of Cin cinnati and along the Ohio River. These valleys are now occupied by the Ohio, Mtiami, and Little Miami Rivers, by Mill Creek, and by the tributaries of these streams. (See pi. 1.)
. The Ohio River is the major stream in the region, yet for the most part its valley is smaller than that of the Miami or the Little Miami River. The Ohio Valley ranges from ' 3/£ to 1 mile in width, and the valley walls are steep and in an extremely youthful stage of erosion. The few tributaries that have developed are small and have cut small ravines in the slopes between the uplands and the river. Few extensive lowland areas have been developed along the river except in the down town part of Cincinnati where Mill Creek joins the Ohio River, and at the mouths of the Miami and Little Miami Rivers.
* Ver Steeg, Karl, The buried topography of western Ohio: Jour. Geology, Vol. 44, No. 8, p. 930, November-December 1936.
8 GROUND-WATER RESOURCES OF THE CINCINNATI AREA
The valleys of Mill Creek and the Little Miami and Miami Rivers are apparently too large to have been cut by the streams that now occupy them. Between Madisonville and Saint Bernard is a broad valley known as the Norwood Trough, unoccupied by any major stream and now drained by two small streams, which are tributary to the Little Miami River and to Mill Creek.
The Miami Valley, which crosses the two counties in a southwesterly direction, is less than a mile wide in the western part of Hamilton County and more than 4 miles wide in the vicinity of Trenton in Butler County. The valley floor is flat and slopes southwestward at the rate of about 4 feet to the mile. The valley walls, especially near the south end, are steep and highly dissected by small tributaries.
The valley of Mill Creek, from the point where it joins the valley of the Miami River to St. Bernard, is from 1 to 2 miles wide. The lower part of the valley from St. Bernard to downtown Cincinnati is consider ably narrower, being slightly more than half a mile in width. In the downtown area of Cincinnati the valley broadens to a width of about 2^ miles.
The valley walls of Mill Creek Valley are steep and highly dissected by tributary streams. In certain localities where tributaries have cut through terraces of glacial drift and outwash along the valley walls, the dissection appears greater than elsewhere. Terraces of at least two ages have been identified by Fenneman,5 the higher terrace repre senting Illinoian deposits, and the lower Wisconsin drift and outwash.
The valley of the Little Miami River is about 1 mile wide from the Ohio River to Milford, several miles east of Madisonville, becoming narrower north and east. The floor is exceptionally flat in the lower end of the valley, a feature that has been utilized by the Cincinnati municipal airport.
Between the Little Miami Valley and Mill Creek Valley, and joining them, is a broad shallow depression about 2 miles wide, whose floor is about 100 feet above the floors of the two valleys on each end. This depression is occupied by the cities of Madisonville, Oakley, Norwood, and Bond Hill. The only drainage is by two small streams, Ross Run, tributary to Mill Creek, and Duck Creek, tributary to Little Miami River. This Trough is part of an ancient drainage system that has been abandoned.
Abandoned valleys have been identified also in Butler County, where an old channel extends from Middletown southeast toward the Little Miami River, and in Hamilton County in the northern part of Crosby and Harrison townships.
5 Fenneman, N. M., The geology of Cincinnati and vicinity: Ohio Geol. Survey, 4th ser., Bull. 19, p. 127, 150-1*6;1916.
GEOGRAPHY , b>
In general the rivers and streams of this area are unsatisfactory as sources of water supply for many industrial processes because they are excessively contaminated by industrial wastes, contain a great amount of suspended mud and silt, and vary considerably in chemical quality and in temperature. The city of Cincinnati takes its public supply from the Ohio River, but the river water is given extensive and effective treatment.
CLIMATE
The mean annual temperature at the Abbe Observatory in Cincin nati is 55° F., and the average monthly temperatures range from 32° in January to 77° in July. December, January, and February are the coldest months, and June, July, and August are the warmest. The first killing frost generally occurs within the first 2 weeks in October and the last killing frost within the first 2 weeks in April. The ground is frozen during several months of winter.
The average monthly precipitation is nearly the same throughout the year but is generally above the average during March, April, and May and less during September, October, and November. As precipitation contributes a large part of the ground water, it is discussed in detail in a later section.
AGRICULTURAL AND INDUSTRIAL DEVELOPMENT
The broad, flat valleys and alluvial terraces and the gently rolling upland plateau in Butler and Hamilton Counties provide good locations for farms. According to the 1940 census, 271,330 acres, or about 90 per cent of the total area in Butler County, and 136,157 acres, or about 51.4 percent of the area in Hamilton County, are classed as farm lands. This acreage represents a total of 5,792 farms in the two counties, which in 1939 were valued at $56,312,255. Butler County, with the exception of the cities of Hamilton and Middletown, is largely agricultural, whereas Hamilton County, including the city of Cincinnati, is mainly industrial.
Livestock, corn, soybeans, hay, and garden truck are the principal sources of farm income. Most of the corn is allowed to mature and is fed to livestock, although some is sold for canning purposes. The city of Cincinnati offers a good market for vegetables and'garden produce, and many small truck farms are within easy reach of the city markets.
According to the 1940 census,6 Butler County had a total of 130 industries employing 14,623 persons and producing materials valued at $114,514,042. The principal manufactures were paper, iron and steel, foundry and machine products, and tin cans and other tinware. Most of the industrial establishments are located in Hamilton and Middle- town.
6 U. S. Bureau of the Census, Sixteenth Census of the United States, Manufactures, 1939, vol. 3, Reports by States and outlying areas, p. 766,1942.
10 GROUND-WATER RESOURCES OF THE CINCINNATI AREA
Hamilton County had a total of 1,525 industries7 employing 67,014 people and producing materials valued at $551,861,240. The principal industries included meat packing, printing and publishing, and the manufacture of foundry and machine-shop products, clothing, machine tools, bread and bakery products, paints and varnishes, boots and shoes, chemicals, and paper. Most of the industrial plants -are located in the valley of Mill Creek, in the Norwood Trough, and in the downtown area of Cincinnati.
GEOLOGY
SUMMARY OP STRATIGRAPHY AND STRUCTURE
The rocks underlying the glacial drift in the Cincinnati region con sist of limestones and interbedded shales of Ordovician age. The limestones and shales are not sufficiently porous to contain large quan tities of water. The water in these formations is generally brackish or highly mineralized and often contains hydrogen sulfide, which makes it unsatisfactory for municipal supply and for many industrial uses. Moderate supplies of sulfo-saline "Blue Lick" water have been obtained from the St. Peter sandstone at a depth of about 850 feet in the vicinity of Cincinnati. However, this water is not known to be used to any extent at present.
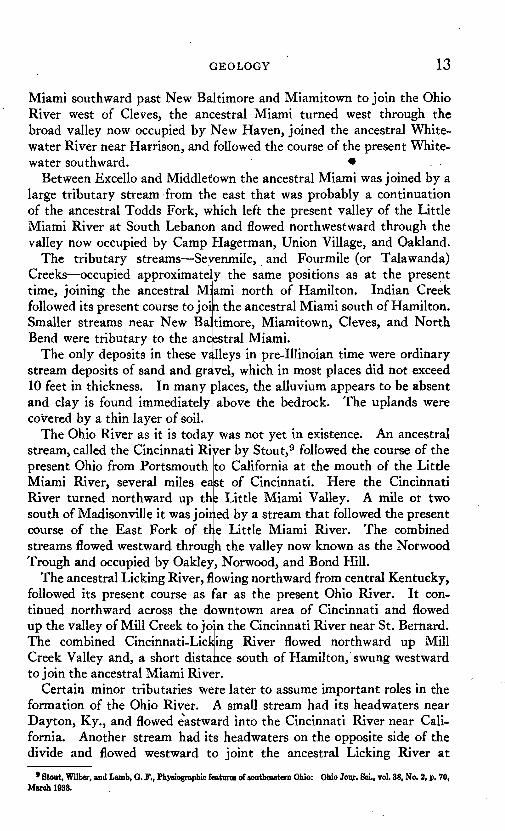
A summary of the stratigraphy of the region and brief notes as to the water supplies found in the formations are given in the table of geologic formations.
Butler and Hamilton Counties lie on the crest and the flanks of a gentle dome, known as the Cincinnati anticline, the center of which is near Cincinnati. The rocks dip away gently to the east, north, and west. The anticline rises to a slightly higher altitude in central Ken tucky, to the south. The dip of the limestones of Black River age, as determined by well borings, ranges from 10 feet to the mile near Miamis- burg in Montgomery County, to 3 feet to the mile in western Hamilton County. 8
GLACIAL HISTORY
To understand the occurrences and types of the varied glacial de posits in the region, the glacial history is discussed briefly. Although the many geologists who have studied the region do not agree completely in regard to all the details, most of them are satisfied as to the main sequence of events.
During the period preceding the Illinoian stage of glaciation, the Cin cinnati region was a broad upland plain cut 4>y valleys whose floors
7 U. S. Bureau of the Census, Sixteenth Census of the United States, Manufactures, 1939, vol. 3, Reports by Slates and outlying areas, p. 766, 1942.
8 Fuller, M. L., and Clapp, F. G., op. cit.; p. 31.
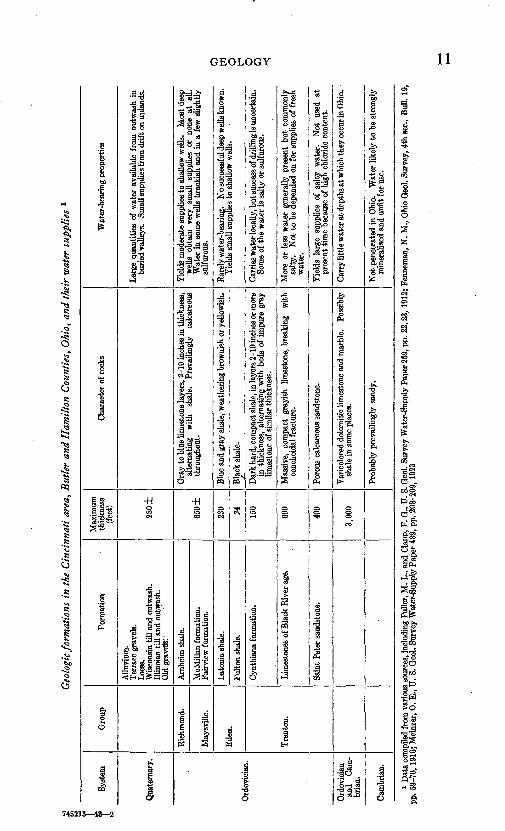
Geo
logi
c for
mat
ions
in
the
Cin
cinn
ati
area
, B
utle
r an
d H
amil
ton
Cou
ntie
s, O
hio,
and
thei
r w
ater
sup
plie
s
Syst
em
Qua
tern
ary.
Ord
ovic
ian.
Ord
ovic
ian
and
Cam
br
ian.
Cam
bria
n.
Gro
up
Ric
hmon
d.
May
svill
e.
Ede
n.
Tre
nton
.
Form
atio
n
Allu
vium
. T
erra
ce g
rave
ls.
Loes
s. W
isco
nsin
till
and
outw
ash.
Il
linoi
an ti
ll an
d ou
twas
h.
Old
gra
vels
:
"'
Arn
heim
sha
le.
McM
illan
for
mat
ion.
Fa
irvi
ew f
orm
atio
n.
Lat
onia
sha
le.
Fulto
n sh
ale.
Cyn
thia
na f
orm
atio
n.
Lim
esto
nes
of B
lack
Riv
er a
ge.
Sain
t Pe
ter
sand
ston
e.
Max
imum
th
ickn
ess
(fee
t)
280 ±
650 +
230 24 150
600
400
3,00
0
Cha
ract
er o
f roc
ks
Gra
y to
blu
e lim
esto
ne la
yers
, 2-1
0 in
ches
in th
ickn
ess,
al
tern
atin
g w
ith
shal
e.
Prev
ailin
gly
calc
areo
us
thro
ugho
ut.
Blu
e an
d gr
ay s
hale
, wea
ther
ing
brow
nish
or y
ello
wis
h.
Bla
ck s
hale
.
Dar
k ha
rd, c
ompa
ct sh
ale,
in la
yers
2-1
0 in
ches
or m
ore
in t
hick
ness
, al
tern
atin
g w
ith b
eds
of i
mpu
re g
ray
limes
tone
of s
imila
r th
ickn
ess.
Mas
sive
, co
mpa
ct g
rayi
sh l
imes
tone
, br
eaki
ng
with
co
ncho
idal
fra
ctur
e.
Poro
us c
alca
reou
s sa
ndst
one.
Var
icol
ored
dol
omiti
c lim
esto
ne a
nd m
arbl
e.
Poss
ibly
sh
ale
in s
ome
plac
es.
Prob
ably
pre
vaili
ngly
san
dy.
Wat
er-b
eari
ng p
rope
rtie
s
Lar
ge q
uant
ities
of
wat
er a
vaila
ble
from
out
was
h in
bu
ried
val
leys
. Sm
all s
uppl
ies
from
dri
ft o
n up
land
s.
Yie
lds
mod
erat
e su
pplie
s to
sha
llow
wel
ls.
Mos
t dee
p w
ells
obt
ain
very
sm
all
supp
lies
or n
one
at
all.
Wat
er i
n so
me
wel
ls b
rack
ish
and
in a
few
slig
htly
su
lfuro
us.
Rar
ely
wat
er-b
eari
ng.
No
succ
essf
ul d
eep
wel
ls k
now
n.
Yie
lds
smal
l sup
plie
s to
sha
llow
wel
ls.
Car
ries w
ater
loca
lly, b
ut su
cces
s of d
rilli
ng is
unc
erta
in.
Som
e of
the
wat
er is
sal
ty o
r su
lfur
ous.
Mor
e or
les
s w
ater
gen
eral
ly p
rese
nt b
ut c
omm
only
sa
lty.
Not
to
be d
epen
ded
on f
or s
uppl
ies
of f
resh
w
ater
.
Yie
lds
larg
e su
pplie
s of
sal
ty w
ater
. N
ot
used
at
pres
ent
time
beca
use
of h
igh
chlo
ride
cont
ent.
Car
ry li
ttle
wat
er a
t dep
ths a
t whi
ch th
ey o
ccur
in O
hio.
Not
pen
etra
ted
in O
hio.
W
ater
lik
ely
to b
e st
rong
ly
min
eral
ized
and
unf
it fo
r us
e.
o M
O
f
O o
i D
ata
com
pile
d fr
om v
ario
us s
ourc
es, i
nclu
ding
Ful
ler,
M. L
., an
d C
lapp
, F.
G.F
U. S
. Geo
l. Su
rvey
Wat
er-S
uppl
y Pa
per 2
59, p
p. 2
2,23
,191
2; F
enne
man
, N
. M
., O
hio
Geo
l. Su
rvey
, 4t
h se
r., B
ull.
19,
pp. 5
9-70
,191
6; M
einz
er, 0
. E
.( U
. S. G
eol.
Surv
ey W
ater
-Sup
ply
Pape
r 48
9, p
p. 2
08-2
09,
1923
12 GROUND-WATER RESOURCES OF THE CINCINNATI AREA
were 350-500 feet below the upland surface and 100-250 fee:t below the floors of the present valleys. The valley walls were steep and. rugged, and the floors were narrow gorges. Most of the rivers were still cutting downward, and no extensive flood plains had been developed. Small streams cut sharp tributary canyons in the valley walls, and the whole region was in a youthful stage of erosion.
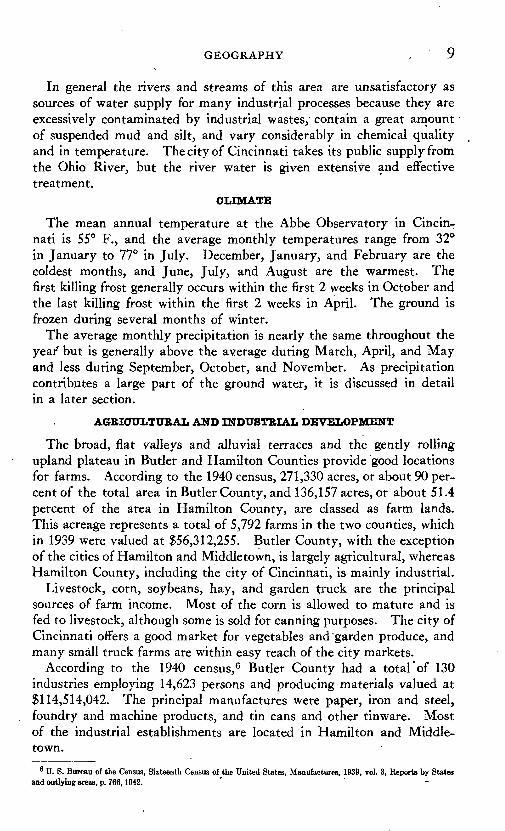
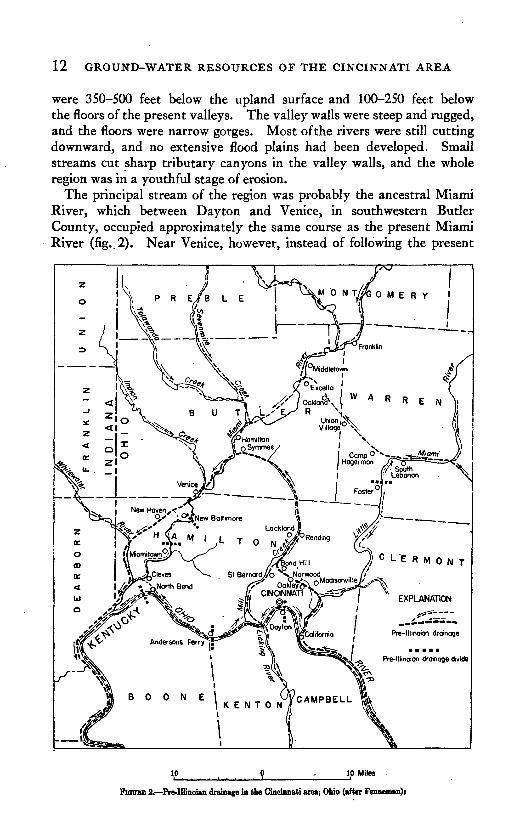
The principal stream of the region was probably the ancestral Miami River, which between Dayton and Venice, in southwestern Butler County, occupied approximately the same course as the present Miami River (fig..2). Near Venice, however, instead of following the present
Pre-lllinoian drainage
Pre-lllinoion drainage divide
B 0 0 N EKENTON
10 Miles
FiauM 2. Pre-Illinoian drainage in (he Cincinnati area; Ohio (after Fenneman)i
GEOLOGY 13
Miami southward past New Baltimore and Miamitown to join the Ohio River west of Cleves, the ancestral Miami turned west through the broad valley now occupied by New Haven, joined the ancestral White- water River near Hamson, and followed the course of the present White- water southward.
Between Excello and Middle!own the ancestral Miami was joined by alarge tributary stream from th 3 east that was probably a continuationof the ancestral Todds Fork, w lich left the present valley of the LittleMiami River at South Lebanoi valley now occupied by Camp
The tributary streams Sei Creeks occupied approximate time, joining the ancestral M:
and flowed northwestward through the Hagerman, Union Village, and Oakland, enmile, and Fourmile (or Talawanda) y the same positions as at the present ami north of Hamilton. Indian Creek
followed its present course to join the ancestral Miami south of Hamilton.Smaller streams near New Ba Bend were tributary to the anc
The only deposits in these v stream deposits of sand and gr; 10 feet in thickness. In many and clay is found immediately covered by a thin layer of soil.
The Ohio River as it is today
present Ohio from Portsmouth
River turned northward up th south of Madisonville it was joir
Trough and occupied by Oakley
followed its present course as
timore, Miamitown, Cleves, and North estral Miami.lleys in pre-Illinoian time were ordinary vel, which in most places did not exceed daces, the alluvium appears to be absent above the bedrock. The uplands were
was not yet in existence. An ancestralstream, called the Cincinnati River by Stout,9 followed the course of the
to California at the mouth of the LittleMiami River, several miles east of Cincinnati. Here the Cincinnati
s Little Miami Valley. A mile or two ed by a stream that followed the present
course of the East Fork of tie Little Miami River. The combined streams flowed westward throug hi the valley now known as the Norwood
, Norwood, and Bond Hill.The ancestral Licking River, f owing northward from central Kentucky,
ar as the present Ohio River. It continued northward across the downtown area of Cincinnati and flowed up the valley of Mill Creek to jo n the Cincinnati River near St. Bernard. The combined Cincinnati-Lie] ing River flowed northward up Mill Creek Valley and, a short distaice south of Hamilton, swung westward to join the ancestral Miami River.
Certain minor tributaries were later to assume important roles in the formation of the Ohio River. A small stream had its headwaters near Dayton, Ky., and flowed eastward into the Cincinnati River near Cali fornia. Another stream had its headwaters on the opposite side of the divide and flowed westward to joint the ancestral Licking River at
9 Stout, Wilber, and Lamb, G. .F., Physiographic features of southeastern Ohio: Ohio Jour. Sci., vol. 38, No. 2, p. 70, March 1938.
14 GROUND-WATER RESOURCES OF THE CINCINNATI AREA
Cincinnati. Headward erosion by these streams had probably pro duced a low notch or col in the divide. Another pair of tributaries flowed from a point near Andersons Ferry, one tributary flowing east ward to join the ancestral Licking River at Cincinnati and the other flowing westward past North Bend to join the ancestral Miami River west of Cleves. The divide between the two had doubtless been lowered to some extent. There were similar pairs of tributaries near Foster, New Baltimore, Miamitown, and southwest of North Bend.
The southern limit of the Illinoian glaciation is very poorly defined. Both Wright 10 and Fenneman 11 have reported evidence of Iflinoian glaciation south of the Ohio River in Kentucky. The ice sheet was relatively thin and could not have remained long at its southernmost extent, inasmuch as thick morainal deposits are lacking. The ice sheet was probably thickest in the valleys of the Miami River, Mill Creek, and Norwood Trough, where the drift is considerably thicker than it is on the uplands.
The advance of the Illinoian, the second or third ice sheet to cover the area, disturbed the drainage system even before the ice actually reached the north boundary of Butler County. The melting ice front furnished enough rock material to overload the swollen ancestral streams, causing them to deposit the coarser debris near the ice front and the finer some distance from it. This raised floors of the valleys and the mouths of tributary streams and slackened the currents of the north ward-flowing streams, so that fine sediments were deposited.
When the ice front reached Excello the drainage of the ancestral Todds Fork was completely blocked, a large lake was formed, and silt and clay were deposited, thereby raising the valley floor. The water rose high enough to break over the divide between two small tributaries near Foster, starting the present course of the Little Miami River. When the ice retreated, the gorge at Foster had been cut deep enough to maintain drainage in that direction.
When the ice advanced to the bluff near Symmes, the Cincinnati- Licking drainage became blocked and the waters backed up to form a lake. For some time an outlet stream probably ran between the south side of the valley and the ice front, cutting the steep bluff just west of Symmes. Eventually the ice however, closed this gap, so that the waters rose high enough in the Mill Creek Valley east of Symmes in the Norwood Trough, and in the Little Miami Valley to break over the divide at Andersons Ferry and to cut a gorge through which the stream continued to flow even after the ice had retreated.
I' Wright, G. F., The glacial boundary in western Pennsylvania, Ohio, Kentucky, Indiana, and Illinois: U. S. Geol. Surrey Bull. 58, pp. 63-65, 1890.
11 Fenneman, N. M., The geology of Cincinnati and vicinity. Ohio Geol. Survey, 4th ser., Bull. 19, p. 125, 1916.
GEOLOGY 15
As the ice continued to advance, the ancestral Cincinnati-Licking River was blocked at St. Bernard, and the water to the east and south was backed up in long narrow lakes. An outlet was finally cut through the divide near Dayton, Ky., and the present course of the Ohio River was established in this particular stretch of the river. v
When the ice in the ancestral Miami Valley cut off the channel north of New Baltimore, the stream found a new course past New Baltimore and Miamitown. This new channel remained in use after the ice re treated. Further advan:e of the ice blocked the drainage at Cleves and caused the water to spill into another small tributary valley. This course was also maintained after the ice retreated.
At the end of the Illinoian stage of glaciation, drift and outwash filled the large bedrock valleys to altitudes of 600-620 feet above sea level, many of the pre-Illinoian lines of drainage had been changed or aban doned, and the present drainage system was established.
During the interglacial stage that followed, streams cut into the newly deposited materials and partly reexcavated the ancient valleys. The Norwood Trough was abandoned and remained at levels that were 40-60 feet higher than the valleys of Mill Creek and the Little Miami River. Elsewhere, remnants of the Illinoian deposits are relatively flat-topped terraces along the valley walls. These terraces were origi nally continuous across the valleys and probably sloped gently toward the center. The ancestral valley of Todds Ford was abandoned, like wise, although glacial material may have been deposited there later by the Wisconsin ice sheet.
The interval between the Illinoian and Wisconsin glaciations is be lieved to have been considerably longer than the time that has elapsed since the Wisconsin glaciation. This belief is based on the relative amounts of soil formation and erosion.
The continental ice sheet advanced again during the early Wisconsin stage of glaciation, covering practically all of Butler County and extend ing in a lobe down Mill Creek Valley as far as Hartwell, just south of Lockland. The south border extended southeastward from the State line toward New Haven, swung northward around the steep bluff west of Symmes, and extended down the Mill Creek Valley. The west side of Mill Creek Valley was overridden by the ice sheet, which concealed the actual limits of the bedrock valley.
The deposits associated with the early Wisconsin glaciation are in general thicker than those of the Illinoian ice sheet. On the uplands the total thickness of both drifts averages 15-20 feet, most of which is of Wisconsin age. The younger drift also appears to be thicker near its south margin. The Wisconsin ice probably remained near its southern limit longer than did the Illinoian. Although no true terminal moraine was developed, the land surface along the south boarder of the Wis consin drift is hummocky and poorly drained.
16 GROUND-WATER RESOURCES OF THE CINCINNATI AREA
The deeper valleys were filled with deposits of sand and gravel washed out from the advancing ice front and later covered with a sheet of glacial drift as the ice passed over the region. In the valleys south of the south ern limit, the principal deposits are stream-deposited sands and gravels with little or no clay or drift deposits.
The Wisconsin sediments formed a terrace at 540 feet above sea level in downtown Cincinnati, about 560 feet at Reading, 600 to 620 feet at Hamilton, and about 660 feet at Middletown. The cities are situated in large part on the remnants of this terrace. In certain lo calities, such as the west side of the north end of Mill Creek Valley and the southeast end of the ancestral Todds Fork Valley near Camp Hager- man, kame deposits of sand and gravel are superposed on the terraces.
Following the early Wisconsin glaciation, a readvance of the ice sheet as far south as Dayton, Ohio, did not cover any of the^ region included in this report.' Although no morainal deposits of late Wisconsin age are found in this area, much of the sand and gravel outwash that cannot be distinguished from the early Wisconsin outwash in the valleys probably was contributed by the later ice sheet.
The glacial epoch ended with the melting of the Wisconsin ice sheet. Postglacial drainage has followed the pre-Illinoian system in some places and in others the courses that were developed during the Illinoian glaciation. Streams have removed much material of glacial origin and have partly reexcavated many of the buried valleys. The major streams have lowered their own levels from as much as 40 feet at Hamilton to nearly 190 feet in the downtown area of Cincinnati. Remnants of the glacial deposits remain as high-level terraces. In many places the valley walls are steep and much dissected by tributary streams cutting into the terrace deposits. In the valley floors, streams have cut channels 10 to 20 feet deep and have developed small flood plains.
The Ohio River is now the principal stream in the region and is joined by the Little Miami River near California, by Mill Creek and the Lick ing River in downtown Cincinnati, and by the Miami River several miles southwest of Cleves. Most of the tributary valleys to the Ohio are too large for their present streams. Sections of the ancient drainage system, such as the Norwood Trough, the New Haven Trough, the north end of Mill Creek Valley, and the valley extending southeastward from Middletown, have been abandoned by the original through-flowing streams and now are drained by small tributaries.
WATER-BEARING- FORMATIONS
GENERAL CHARACTERISTICS
The materials that now fill the ancient buried valleys consist of sand, gravel, and clay. They were deposited under complex conditions of sedi mentation and vary widely, both horizontally and vertically. Com-
GEOLOGICAL SURVEY WATER-SUPPLY PAPER 999 PLATE 2
A. COARSE GRAVEL OUTCROPPING I1N THE MOORMAN GRAVEL PIT, MIDDLETOWINBUTLER COUNTY.
B. FINE SAND, OVERLAIN BY SILT AND BOULDER CLAY, IN SAND PIT OF NATIONAL DISTILLERS CORPORATION, CARTHAGE, HAMILTON COUNTY.
GEOLOGICAL SURVEY WATER-SUPPLY PAPER 999 PLATE 3
A. CROSS-BEDDED SANDS AND GRAVELS IN GRAVEL PIT OF TENNESSEE CORPORATION. GLENDALE-MILFORD ROAD, HAMILTON COUNTY.
PORTABLE TRIPOD USED FOR BORING SHALLOW TEST WELLS IN BUTLER AND HAMILTON COUNTIES, AND WEIGHT USED FOR DRIVING WELLS.
GEOLOGY 17
parisons of many well logs show that it is extremely difficult and often impossible to trace a particular sand or clay bed from one well to'another well less than a quarter of a mile away.
The conditions under which the various deposits were laid down were not uniform throughout the area at any one time. While sand and gravel were being laid down in one locality, a short distance away fine sedi ments would be settling in the quiet waters of a lake. The ice undoubt edly advanced and retreated short clistances many times, each move ment causing a change in the type of sediment. Many of the sand and gravel beds appear to have greater continuity in directions parallel to the axes of the valleys and to represent channel deposits of former streams.
Nearly all information with regard to the deeper formations must be obtained from wells or other excavations. Unfortunately there is little uniformity as to the names of some types of material or the methods of sampling used by different drillers. Many well logs have been obtained in the region, but there are large areas where few wells have been drilled or where the records of wells are not available.
In many localities sand and gravel immediately overlie the bedrock floor of the valleys. This material may be the original deposit of the streams that cut the valleys. Where it has been observed, the gravel and sand is generally well-rounded and clean. The deposits are often of indeterminate thickness as they grade upward into the early Illinoian outwash.
The sands and gravels derived from the ice sheet are generally more angular than those transported solely by streams. Scratched and striated stones, displaying the scraping action of the ice, may occur. In many localities thick deposits of sand mixed with gravel show that the materials were deposited with little sorting (see pi. 2, A). In other places gravel containing very little sand indicates that the fine clastic material was all washed away leaving only the coarse behind. Such a deposit is located along the south bank of the Miami River north of Hamilton. Thick deposits of sand in which the gravel content is very small are also found. For example, a 40-foot test hole, bored in the bottom of a sand pit at Carthage, Hamilton County, encountered only fine san'd that contained very few pebbles. (See pi. 2, J9.)
The many cross-bedded deposits indicate rapid deposition and shift ing currents, which are characteristic of overloaded streams. (See pi. 3, A^} The conditions that probably existed would have provided large quantities of water and material. In relatively small channels that were choked with glacial debris, the streams split into many smaller channels, and probably wandered back and forth, similar to the over loaded streams flowing from melting glaciers at the present time.
18 GROUND-WATER RESOURCES OF THE CINCINNATI AREA
The sands and gravels are composed mainly of limestone fragments and contain only small percentages of igneous and metamorphic rocks brought southward by the ice sheets. Along the Ohio River the gravels are reported to contain pebbles of sandstone, presumably brought from the region of its headwaters in Pennsylvania and West Virginia. The limestone sands and gravels were derived for the most part from the underlying bedrock and probably were carried a relatively short distance from their original position.
The outwash derived from the Illinoian ice sheet is very similar to that from the Wisconsin ice sheet, and usually the two cannot be distinguished. The Wisconsin glacier is reported to have carried more foreign rocks, such as granite, basalt, and gneiss, from the area north of Lake Superior than did the Illinoian. Most samples of the outwash that is believed to be of Illinoian age were taken from drill cuttings. Consequently no distinction could be made as to the age of these samples.
HYDROLOGIC PROPERTIES
The general properties of water-bearing materials have been described in detail by Meinzer 12 and Stearns. 13 Although a detailed discussion of all the properties of water-bearing materials is beyond the scope of this report, brief mention of several may be helpful to the reader in understanding the problems encountered in the Cincinnati area.
Ground water occurs in the small pores and voids between the in dividual particles and fragments that make up a formation. Such voids are usually irregular in shape and connect with one another. In sand and gravel the pores are relatively large because of the large size of the grains; in most clays the pores are extremely small. As these spaces in water-bearing material are usually interconnected, water passes slowly from one pore to another in response to differences of head.
The permeability of a rock is its ability to transmit water. It is generally expressed as a coefficient of permeability, which has been defined as the rate of flow of water at 60°F., in gallons per day, through a cross section of 1 square foot under a hydraulic gradient of 100 per cent. Generally sand and gravel have high coefficients of permeability, whereas clay has a low coefficient.
The quantity of ground water annually available in a region depends not only on the quantity of water that falls on the surface and is there fore available for recharge, but also on the permeabilities of the under lying formations. If the surficial material in a region is clay, relatively little water can percolate vertically downward. If a water-bearing
12 Meinzer, 0. E., The occurrence of ground water in the United States, with a discussion of principles: U. S. Geol. Survey Water-Supply Paper 489, 321 pp., 1923; Outline of ground-water hydrology, with definitions: U. S. Geol. Survey Water-Supply Paper 494, 71 pp., 1923.
** Stearns, N. D., Laboratory tests on physical properties of water-bearing materials: U. S. Geol. Survey Water- Supply Paper 596-F, pp. 121-176, 1927.
GEOLOGY 19
formation is overlain by clay, the water in the formation may have to travel in a somewhat horizontal direction from some distant recharge area to the point of withdrawal.
The different methods of determining the permeability of water bearing materials have been described in detail by Stearns, 14 Wenzel, 15 Tolman, 16 and others and need not be discussed here.
The materials filling the buried valleys in Butler and Hamilton Counties are'so irregular both in horizontal and in vertical extent that determina tions of permeability of individual samples may be of little value. For instance, in a shallow test well bored by the Geological Survey on the north side of the Glendale-Milford Road in Hamilton County, the co efficients of permeability as determined by laboratory tests for sand and gravel sampled between a depth of 5 feet and 20 feet ranged from about 530 to about 1,850.
TEST DRILLING
To locate intake areas that might be suitable for increasing the ground- water supply by artificial recharge, a number of shallow test wells were bored by hand in the Mill Creek Valley. The boring was done by a crew of three men, who used soil augers of two types. The first was an auger of the Iwan type, consisting of two vertical steel plates that were bent at the bottom to form cutting edges. As the sides of the auger were open, difficulty was encountered in coarse material in keeping the ma terial in the auger until it could be removed from the hole. A sliding jacket made by H. F. Pittman to slip over the auger when it was raised, so as to close the sides, helped to some extent. The second type, known as a "Standard" earth auger and made by the Specialty Device Co. in Cincinnati, proved far more satisfactory in both coarse and fine material. It consists of two curved plates, which almost enclose the circum ference of the auger and which are bent at the bottom to form two sharp cutting edges. It is emptied by raising a collar and opening the 'blade. An auxiliary blade is used when a larger hole is desired; it is also helpful in maintaining a straight hole. In addition, several chisel bits were used to loosen rocks and hard-packed sand and gravel.
When the hole was less than 10 feet deep the tools were attached to 4 foot lengths of ^-inch pipe. In deeper holes, 10-foot sections of pipe were used and were supplemented by the shorter lengths. A removable wooden handle was used at the top to turn the auger.
H Stearns, N. D., Laboratory tests on physical properties of water-bearing materials: U. S. Geol. Survey Water- Supply Paper 596-F, pp. 121-176, 1927.
15 Wenzel, L. K., The Thiem method for determining permeability of water-bearing materials and its application to the determination of specific yield, results of investigations in the Platte River Valley, Nebr.: U. S. Geol. Survey Water* Supply Paper 679-A, pp. 1-57,1935.
16 Tolman, C. F., Ground water, pp. 190-222, New York, McGraw-Hill Book Co., 1937.
20 GROUND-WATER RESOURCES OF THE CINCINNATI AREA
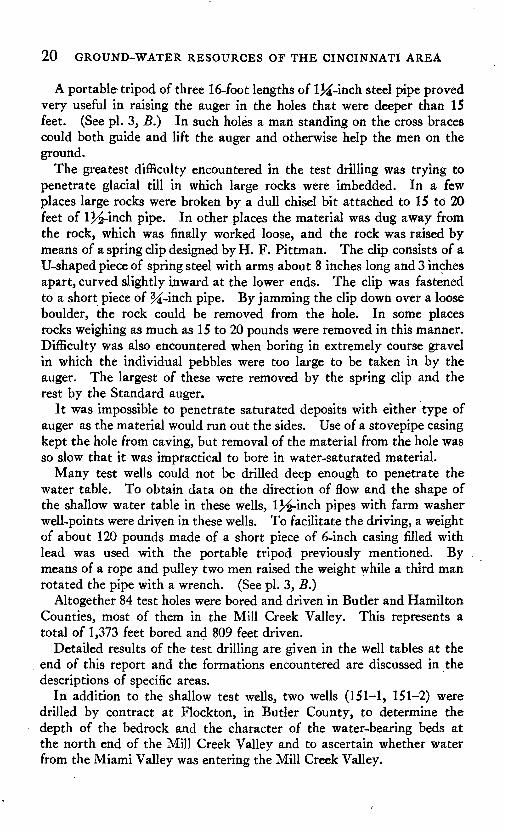
A portable tripod of three 16-foot lengths of 1^-inch steel pipe proved very useful in raising the auger in the holes that were deeper than 15 feet. (See pi. 3, 5.) In such holes a man standing on the cross braces could both guide and lift the auger and otherwise help the men on the ground.
The greatest difficulty encountered in the test drilling was trying to penetrate glacial till in which large rocks were imbedded. In a few places large rocks were broken by a dull chisel bit attached to 15 to 20 feet of IJ^-inch pipe. In other places the material was dug away from the rock, which was finally worked loose, and the rock was raised by means of a spring clip designed by H. F. Pittman. The clip consists of a U-shaped piece of spring steel with arms about 8 inches long and 3 inches apart, curved slightly inward at the lower ends. The clip was fastened to a short piece of ^-inch pipe. By jamming the clip down over a loose boulder, the rock could be removed from the hole. In some places rocks weighing as much as 15 to 20 pounds were removed in this manner. Difficulty was also encountered when boring in extremely course gravel in which the individual pebbles were too large to be taken in by the auger. The largest of these were removed by the spring clip and the rest by the Standard auger.
It was impossible to penetrate saturated deposits with either type of auger as the material would run out the sides. Use of a stovepipe casing kept the hole from caving, but removal of the material from the hole was so slow that it was impractical to bore in water-saturated material.
Many test wells could not be drilled deep enough to penetrate the water table. To obtain data on the direction of flow and the shape of the shallow water table in these wells, IJ^-inch pipes with farm washer well-points were driven in these wells. To facilitate the driving, a weight of about 120 pounds made of a short piece of 6-inch casing filled with lead was used with the portable tripod previously mentioned. By means of a rope and pulley two men raised the weight while a third man rotated the pipe with a wrench. (See pi. 3, B.)
Altogether 84 test holes were bored and driven in Butler and Hamilton Counties, most of them in the Mill Creek Valley. This represents a total of 1,373 feet bored and 809 feet driven.
Detailed results of the test drilling are given in the well tables at the end of this report and the formations encountered are discussed in the descriptions of specific areas.
In addition to the shallow test wells, two wells (151-1, 151-2) were drilled by contract at Flockton, in Butler County, to determine the depth of the bedrock and the character of the water-bearing beds at the north end of the Mill Creek Valley and to ascertain whether water from the Miami Valley was entering the Mill Creek Valley.
PRECIPITATION 21
PRECIPITATION
The principal source of the ground water in Butler and Hamilton Counties is the rain and snow that fall within the limits of the drainage basins of the Miami and Little Miami Rivers and Mill Creek. Some water is doubtless obtained from the Ohio River, particularly in the downtown area of the Cincinnati Basin, but the amount of such water is probably small. The precipitation in the drainage basins of the Miami and Little Miami Rivers beyond the boundaries of the two counties contributes to the flow of the streams and therefore is available for recharge of the water-bearing beds. Most of the ground water probably comes from precipitation within the boundaries of the counties; some of the precipitation gradually percolates downward to the water-bearing beds and is recovered from wells.
The United States Weather Bureau has maintained a first-order weather station at the Federal Building in Cincinnati from 1870 to 1937 and at the Abbe Observatory in the same city from 1916 to the presjent time. Second-order stations have been maintained in Hamilton County near Mount Healthy since 1904 and in Butler County at Hamilton since 1911 and at Middletown since 1923. The records of precipitation and other climatological data for these stations can be found in current Climatological Data reports, Ohio section, which are published by the United State Weather Bureau. The data on precipitation and tem perature used in this report have been taken from published records,
In addition to the stations named above, a rain gage has been main tained by the Cincinnati district office of the Corps of Engineers, War Department, in cooperation with the Weather Bureau, on the property of Emmett Ferris, located on Mostellar Road just south of Kemper Road near Sharonville, in Hamilton County. Records of precipitation of this gage since January 1, 1940, can be found in Daily and Hourly Precipitation, Hydrologic Network, Region 3, Ohio River, published currently by the United States Weather Bureau.
The longest record of precipitation in the area has been kept at Cin cinnati. The average, or normal, precipitation at the Federal Building for the period 1871-1930 was 38.34 inches and at the Abbe Observatory for the period 1916-39 was 38.55 inches.
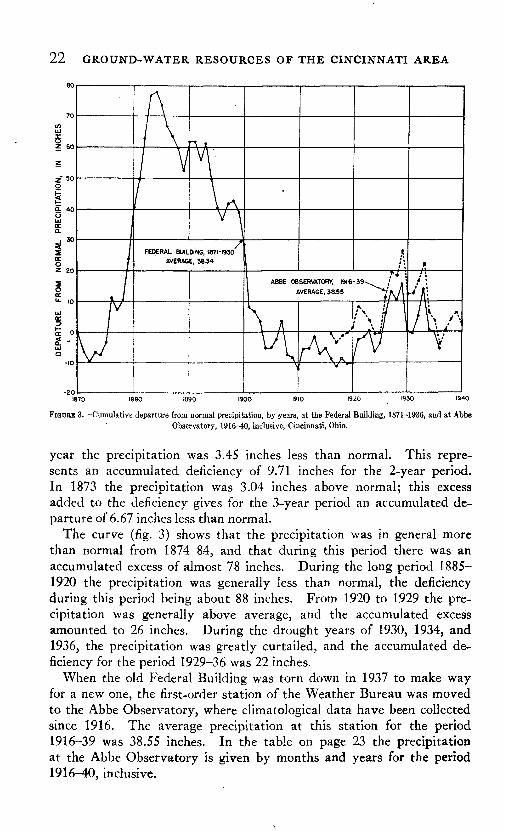
A curve showing the cumulative departure from the normal precipi tation (fig. 3) has been prepared from published data of the Weather Bureau. This type of curve represents the accumulated excesses and deficiencies in precipitation above or below a mean or average amount during the period of record. When precipitation is in excess of the average during a particular year, the curve rises; when less than the average, the curve falls. For example (fig. 3), in 1871 the precipitation was 6.26 inches less than the average for the period 1871-1930. The curve therefore is drawn below the zero "line. During the following
22 GROUND-WATER RESOURCES OF THE CINCINNATI AREA
FIGURE 3. Cumulative departure from normal precipitation, by years, at the Federal Building, 1871-1938, and at Abbe Observatory, 1916-40, inclusive, Cincinnati, Ohio.
year the precipitation was 3.45 inches less than normal. This repre sents an accumulated deficiency of 9.71 inches for the 2-year period. In 1873 the precipitation was 3.04 inches above normal; this excess added to the deficiency gives for the 3-year period an accumulated de parture of 6.67 inches less than normal.
The curve (fig. 3) shows that the precipitation was in general more than normal from 1874-84, and that during this period there was an accumulated excess of almost 78 inches. During the long period 1885- 1920 the precipitation was generally less than normal, the deficiency during this period being about 88 inches. From 1920 to 1929 the pre cipitation was generally above average, and the accumulated excess amounted to 26 inches. During the drought years of 1930, 1934, and 1936, the precipitation was greatly curtailed, and the accumulated de ficiency for the period 1929-36 was 22 inches.
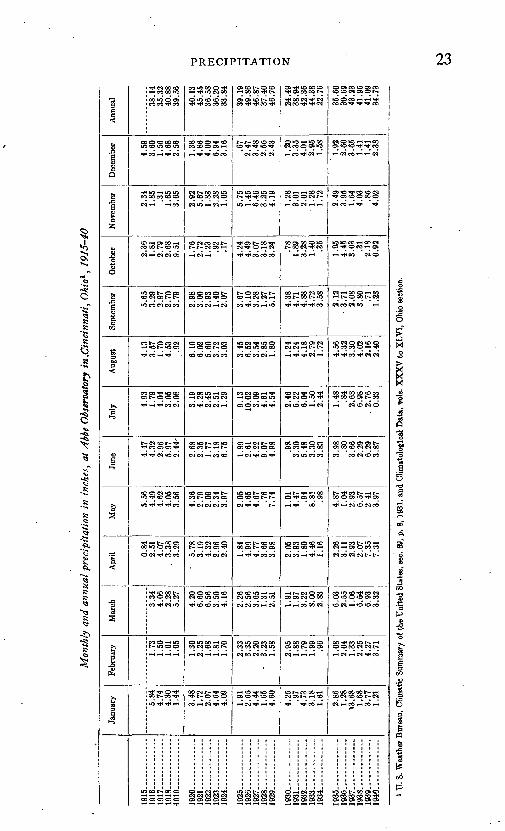
When the old Federal Building was torn down in 1937 to make way for a new one, the first-order station of the Weather Bureau was moved to the Abbe Observatory, where climatological data have been collected since 1916. The average precipitation at this station for the period 1916-39 was 38.55 inches. In the table on page 23 the precipitation at the Abbe Observatory is given by months and years for the period 1916-40, inclusive.
Mon
thly
and
ann
ual p
reci
pita
tion
in
inch
es,
at A
bbe
Obs
erva
tory
in
.Cin
cinn
ati,
Ohi
o1,1
915-
40
1915
191
6
19
17
19
18
1919
1920
.
1921
1922
192
3
192
4
19
25
1926
1927
1928
19
29
1930
193
1
1932
1933
1934
1935 -
1936
1937
1938
193
9.
1940
Janu
ary
5.84
4.74
4.30
1.44
3.48
1.72
2.07
4.64
4.09
1.91
2.65
4.44
1.65
4.60
4.25 .9
74.
733.
181.
61
2.86
1.28
13.6
81.
683.
771.
21
Febr
uary 1.73
1.50
1.61
1.05
1.30
2.25
1.68
1.81
1.70
2.33
3.35
2.20
- 3.
231.
58
2.95
1.88
1.79
1.99 .9
6
1.08
2.04
1.33
2.25
4.27
3.71
Mar
ch 3.34
4.06
2.28
5.27
4.20
6.60
6.56
3.50
4.16
2.26
2.56
3.65
1.31
2.51
1.91
1.97
3.22
8.00
2.83
6.03
2.55
1.06
6.54
6.93
3.32
Apr
il 0.84
2.51
4.07
. 3.
383.
29
5.
783.
194.
329
Qfi
2.40
1 84
4 QQ
4.77
3.66
3.98
2 A
C
3.93
1.80
4.46
1.16
3.11
2.93
9 ff
l
7.35
7.31
May 5.
564.
494.
624
053.
56
4.36
2.79
2.09
2.34
3.97
2.05
4.65
4.67 .7
67.
74
1.01
4.47 .9
48.
81 .98
4.87
1.04
2.93
6.57
2.41
3.97
June 4.
474.
322.
965
972.
44-
2.68
2.35
1.77
3.18
6.75
1 89
2.61
4.22
9 07
4.98 O
S3.
305.
483.
303.
83
3 O
S.8
03.
662
90
69
0
3.87
July 4.
931.
794.
043.
052.
08
3.19
4.28
2.45
2.51
1.29
9 13
10.0
23.
094.
614.
54
2.46
5.22
6.04
1.50
2.44
1.48 .8
42.
686.
98.
2.76
0.33
Aug
ust
4.13
3.57
1.70
4 53 .92
6.10
6.02
5.60
3.72
3.03
3 di
6.52
3.54
2.85
1.80
1.24
4.24
4.18
2.79
1.72
4.56
4.32
3.30
4.02
2.16
2.40
Sept
embe
r
5.65
3.29
2.97
2.70
3.79
2.98
3.00
2.93
1.40
2.07
3.67
4.10
3.28
1.27
5.17
4.38
4.71
4.88
4.72
3.58
2.12
3.
712.
083.
80 .71
1.23
Oct
ober 2.36
1.81
2.79
2.68
9.51
1.76
2.72
1.23 .9
2.1
7
4.24
4.49
3.07
3.18
3.24 .7
81.
893.
281.
40 .35
1.95
4.45
3.03 .3
12.
180.
92
Nov
embe
r
2.34
1.85 .3
11.
653.
65
2.92
5.67
1.88
2.28
1.05
5.75
1.45
6.46
3.25
4.19
1.28
3.01
2.01
1.28
1.72
2.49
3.95
1.64
4.03 .8
54.
02
Dec
embe
r
4.59
3.60
1.56
4.68
2.56
4.86
4.00
6.94
3.16 .6
72.
473.
482.
562.
43
1.20
3.35
4.01
2.95
1.58
1.92
2.60
3.65
1.41
1.41
2.38
Ann
ual
38.1
435
.32
40.8
839
.56
40.1
345
.46
36.5
836
.20
33.8
4
39.1
949
.86
46.8
737
.40
46.7
6
24.4
938
.94
42.3
644
.38
22.7
6
35.6
030
.69
43.2
341
.95
41.0
934
.73
i U
. S. W
eath
er B
urea
u, C
limat
ic S
umm
ary
of th
e U
nite
d St
ates
, se
c. 6
9, p
. 8,
193
1, a
nd C
limat
olog
ieal
Dat
a, w
ls.
XX
XV
to X
LV
I, O
hio
sect
ion.
to
24 GROUND-WATER RESOURCES OF THE CINCINNATI AREA
During the period of record the annual precipitation at both the Federal Building and the Abbe Observatory was nearly the same, al though differences for shorter periods were considerable. A curve showing the cumulative departure from normal precipitation by months has been plotted from the data of the Abbe Observatory for the period January 1930 to December 1940. (See fig. 4.) The curve shows that during 1930, 1934, 1935, 1936, and 1940 the precipitation was generally deficient and that during the rest of the period it was usually more than normal. The deficiency in precipitation during 1930 and the early part of 1931 was not made up until May 1933, and that of 1934 had not been made up by December 1940.
The part of the curve from July 1938 to December 1940, inclusive, is of particular interest because it covers the period of this investigation. With the exception of 3 months the precipitation during the year 1938 and the first 6 months of 1939 was generally more than normal. Water in many shallow and deep observation wells reached its low level for the winter of 1938-39 in December and January and then bega,n to rise slowly. In April 1939 a severe storm occurred. In a 5-day period 4.92 inches of rain fell at the Abbe Observatory, 3.52 inches at Hamilton, and 3.30 inches at Middletown. The Miami River reached its highest stage during the year, and Mill Creek rose above its banks and flooded large areas in the adjacent valley. At this time conditions for recharge were exceptionally favorable and water levels in many wells rose abruptly, in some wells as much as 15 feet. The deficiency in soil moisture from the preceding summer had been made up by excess precipitation during the first 3 months of 1939. As the ground was not frozen, water could percolate rapidly through the soil. Losses by evaporation and trans piration were at a minimum.
From July 1939 to January 1940, inclusive, precipitation was less than normal each month, and water levels declined throughout the period. In many wells the decline continued until April. The more nearly normal precipitation during February and March 1940 was not sufficient to make up the deficiency from the preceding summer. In April 1940 a storm similar to that of April 1939 occurred; 3.74 inches of rain fell at the Abbe Observatory, 4.43 inches near Sharonville, 5.78 inches at Hamilton, and 4.25 inches at Middletown. Water levels agairr rose abruptly, a maximum rise of 18 feet being measured. In most of the observation wells the rise in water level was greater in April 1940 than in April 1939. This was probably due to the greater amount of precipitation in the Miami Valley and to the greater area that was flooded by Mill Creek.
A study of the data shows that the relation between preciprtation and fluctuations of ground-water levels in Butler and Hamilton Counties is closer than was originally believed. This is especially true in shallow
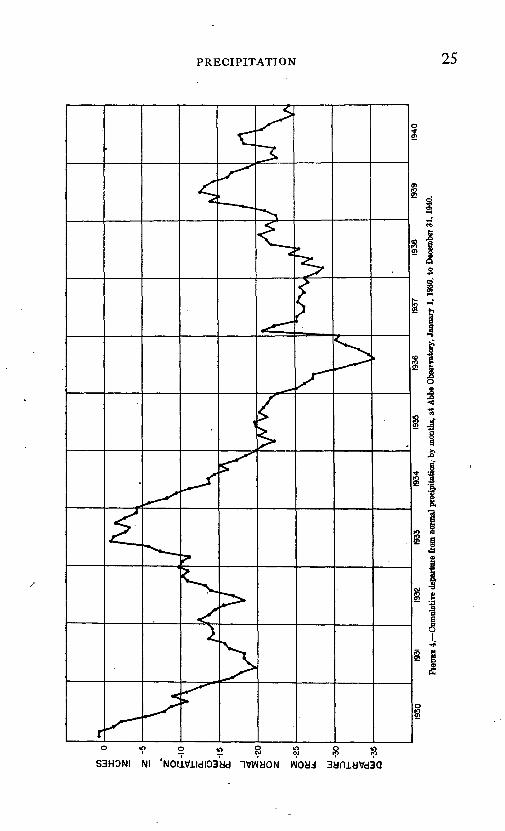
PRECIPITATION 25
ffi .1
S3HONI NI 'NOiiviidios'ad ivwyoN woyj
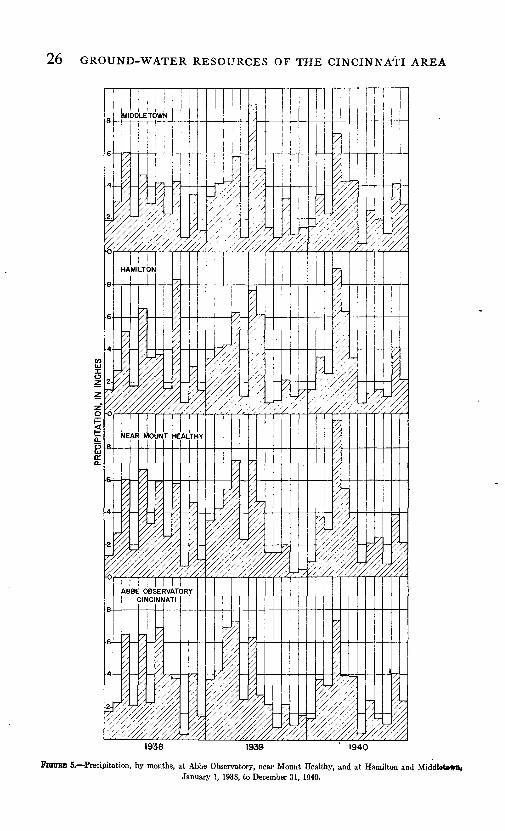
26 GROUND-WATER RESOURCES OF THE CINCINNATI AREA
1938 1939 1940
FKTOBB 5. Precipitation, by months, at Abbe Observatory, near Mount Healthy, and at Hamilton and January 1, 1938, to December 31. 1940.
PUMPAGE 27
wells in which the water level is near the surface and rises rapidly follow ing heavy precipitation. It is also true in a more general way with respect to water levels in deep wells. Individual storms generally have little effect on the water level in the deeper beds, particularly where the beds are overlain by an impermeable confining layer. After periods of heavy precipitation lasting several weeks or months, however, water levels in some deep wells rise notably. In many wells the water levels were higher in July 1938 than in the fall of 1936. It is interesting to note in figure 4 that the accumulated deficiency in'precipitation was almost 10 inches greater in 1936 than in July 1938.
Data on monthly precipitation at the Abbe Observatory, at stations near Mount Healthy, and at Hamilton and Middletown are given in figure 5.
PUMPAGE
During the present investigation an attempt was made to obtain from individual owners of industrial and municipal wells in Butler and Hamil ton Counties data on daily and monthly pumpage. A circular letter, sent to each of 62 well owners in the two counties, requested that records of daily pumpage and water levels be kept and submitted at the end of each month to the Geological Survey and that similar data be furnished for past years. Replies were obtained' from 49 well owners, some of whom could not furnish the desired information. In December 1940, records of current daily pumpage were being received monthly from 24 industrial users and public-supply systems.
A summary of data, based on either actual daily records or estimates, shows an average pumpage for the year 1939 of about 76 million gallons of water a day from wells in the two counties. The distribution of the pumpage is shown below.
Average daily pumpagefrom municipal and industrial wells in Butler and Hamilton Counties,Ohio, in 1939
Gallons Butler County:
Middletown____________:_________________,___________ 32,900,000Hamilton............I...................____________ 21,130,000
Hamilton County:Upper Mill Creek Valley____.__......._...._......._... 661,000Lockland, Reading, and Wyoming._____________ 6,189,000Elmwood Place to Carthage..-_-_-.-_._____._____-.__ 1,194,000Ivorydale-St. Bernard._...-_-________._._..._.._._____ 4,784,000Cincinnati Basin...._......___........._.._.._.._ 5,905,000Norwood Trough and Little Miami Valley.._ _______ 3,333,000
Total. .. -_-.._--__--._-._-_.,____-_.__.-._. 76,096,000
The record of pumpage for different industrial and municipal supplies shows considerable variation from day to day and from month to month.
745213 48 3
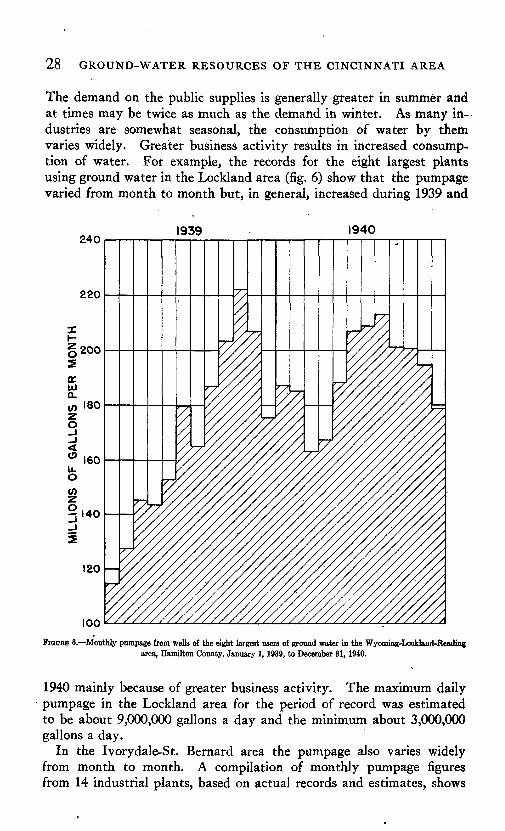
28 GROUND-WATER RESOURCES OF THE CINCINNATI AREA
The demand on the public supplies is generally greater in summer and at times may be twice as much as the demand in winter. As many in dustries are somewhat seasonal, the consumption of water by them varies widely. Greater business activity results in increased consump tion of water. For example, the records for the eight largest plants using ground water in the Lockland area (fig. 6) show that the pumpage varied from month to month but, in general, increased during 1939 and
2401939 1940
100
FIGURE 6. Monthly pumpage from wells of the eight largest users of ground water in the Wyoming-Lockland-Reading area, Hamilton County, January 1, 1939, to December 31, 1940.
1940 mainly because of greater business activity. The maximum daily pumpage in the Lockland area for the period of record was estimated to be about 9,000,000 gallons a day and the minimum about 3,000,000 gallons a day.
In the Ivorydale-St. Bernard area the pumpage also varies widely from month to month. A compilation of monthly pumpage figures from 14 industrial plants, based on actual records and estimates, shows
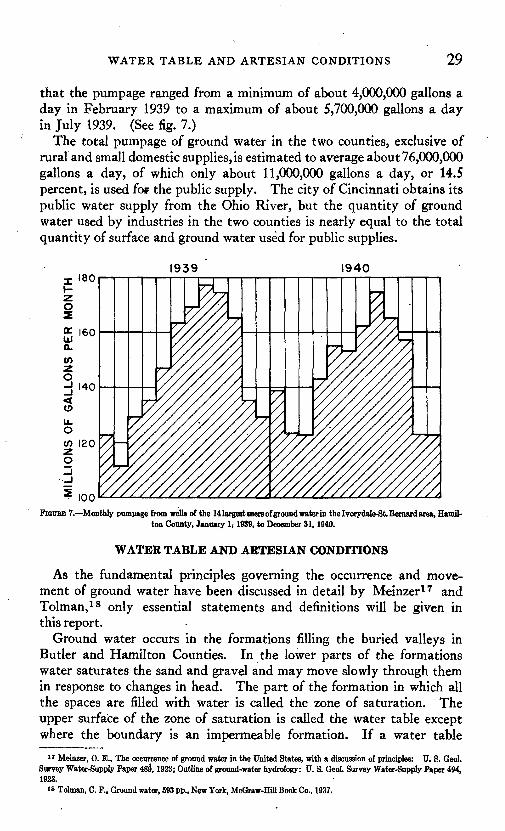
WATER TABLE AND ARTESIAN CONDITIONS 29
that the pumpage ranged from a minimum of about 4,000,000 gallons a day in February 1939 to a maximum of about 5,700,000 gallons a day in July 1939. (See fig. 7.)
The total pumpage of ground water in the two counties, exclusive of rural and small domestic supplies, is estimated to average about 76,000,000 gallons a day, of which only about 11,000,000 gallons a day, or 14.5 percent, is used fo* the public supply. The city of Cincinnati obtains its public water supply from the Ohio River, but the quantity of ground water used by industries in the two counties is nearly equal to the total quantity of surface and ground water used for public supplies.
1939 1940
FIOUBE 7. Monthly pumpage from wells of the 14 largest users of ground water in the I vorydale-St. Bernard area, Hamil ton County, January 1; 1939, to December 31,1940.
WATER TABLE AND ARTESIAN CONDITIONS
As the fundamental principles governing the occurrence and move ment of ground water have been discussed in detail by Meinzer17 and Tolman, 18 only essential statements and definitions will be given in this report.
Ground water occurs in the formations filling the buried valleys in Butler and Hamilton Counties. In the lower parts of the formations water saturates the sand and gravel and may move slowly through them in response to changes in head. The part of the formation in which all the spaces are filled with water is called the zone of saturation. The upper surface of the zone of saturation is called the water table except where the boundary is an impermeable formation. If a water table
17 Meinzer, 0. E., The occurrence of ground water in the United States, with a discussion of principles: U. S. Geol. Survey Water-Supply Paper 48§, 1923; Outline of ground-water hydrology: U. S. Geol. Survey Water-Supply Paper 494, 1923.
is Tolman, C. F., Ground water, 593 pp., New York, McGraw-HiU Book Co., 1937.
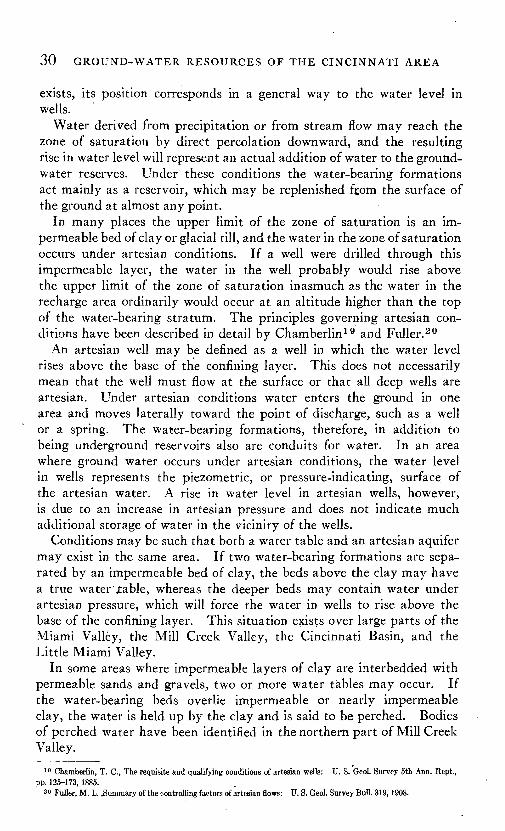
30 GROUND-WATER RESOURCES OF THE CINCINNATI AREA
exists, its position corresponds in a general way to the water level in wells.
Water derived from precipitation or from stream flow may reach the zone of saturation by direct percolation downward, and the resulting rise in water level will represent an actual addition of water to the ground- water reserves. Under these conditions the water-bearing formations act mainly as a reservoir, which may be replenished from the surface of the ground at almost any point.
In many places the upper limit of the zone of saturation is an im permeable bed of clay or glacial till, and the water in the zone of saturation occurs under artesian conditions. If a well were drilled through this impermeable layer, the water in the well probably would rise above the upper limit of the zone of saturation inasmuch as the water in the recharge area ordinarily would occur at an altitude higher than the top of the water-bearing stratum. The principles governing artesian con ditions have been described in detail by Chamberlin 19 and Fuller. 20
An artesian well may be defined as a well in which the water level rises above the base of the confining layer. This does not necessarily mean that the well must flow at the surface or that all deep wells are artesian. Under artesian conditions water enters the ground in one area and moves laterally toward the point of discharge, such as a well or a spring. The water-bearing formations, therefore, in addition to being underground reservoirs also are conduits for water. In an area where ground water occurs under artesian conditions, the water level in wells represents the piezometric, or pressure-indicating, surface of the artesian water. A rise in water level in artesian wells, however, is due to an increase in artesian pressure and does not indicate much additional storage of water in the vicinity of the wells.
Conditions may be such that both a water table and an artesian aquifer may exist in the same area. If two water-bearing formations are sepa rated by an impermeable bed of clay, the beds above the clay may have a true water table, whereas the deeper beds may contain water under artesian pressure, which will force the water in wells to rise above the base of the confining layer. This situation exists over lai^ge parts of the Miami Valley, the Mill Creek Valley, the Cincinnati Basin, and the Little Miami Valley.
In some areas where impermeable layers of clay are interbedded with permeable sands and gravels, two or more water tables may occur. If the water-bearing beds overlie impermeable or nearly impermeable clay, the water is held up by the clay and is said to be perched. Bodies of perched water have been identified in the northern part of Mill Creek Valley.
19 Chamberlin, T. C., The requisite and qualifying conditions of artesian wells: U. S. Geol. Survey 5th Ann. Kept., pp. 125-173,1885.
20 Fuller, M. L. .Summary of the controlling factors of artesian flows: U. S. Geol, Survey Bull. 319,1908.
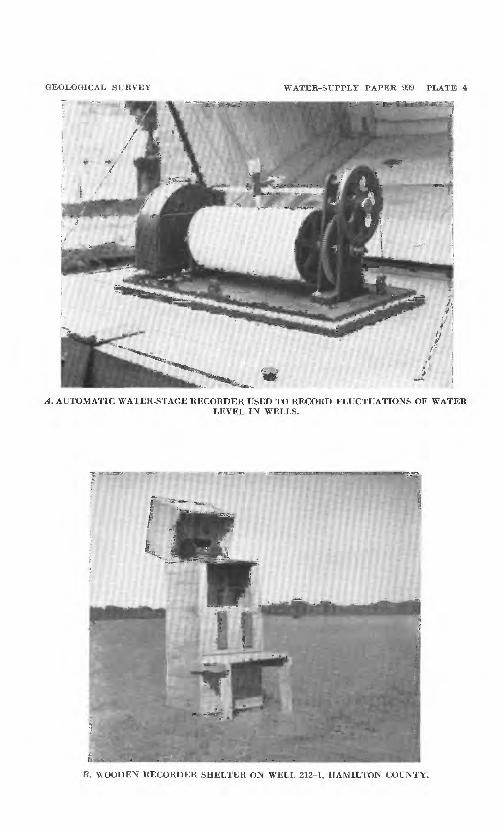
GEOLOGICAL SURVEY WATER-SUPPLY PAPER 999 PLATE 4
A. AUTOMATIC WATER-STAGE RECORDER USED TO RECORD FLUCTUATIONS OF WATERLEVEL IN WELLS.
B. WOODEN RECORDER SHELTER ON WELL 212-1, HAMILTON COUNTY.
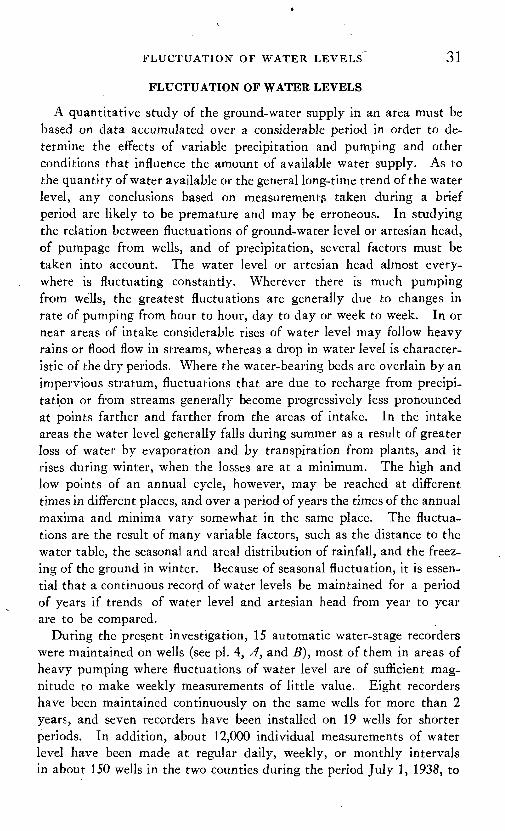
FLUCTUATION OF WATER LEVELS 31
FLUCTUATION OF WATER LEVELS
A quantitative study of the ground-water supply in an area must be based on data accumulated over a considerable period in order to de termine the effects of variable precipitation and pumping and other conditions that influence the amount of available water supply. As to the quantity of water available or the general long-time trend of the water level, any conclusions based on measurements taken during a brief period are likely to be premature and may be erroneous. In studying the relation between fluctuations of ground-water level or artesian head, of pumpage from wells, and of precipitation, several factors must be taken into account. The water level or artesian head almost every where is fluctuating constantly. Wherever there is much pumping from wells, the greatest fluctuations are generally due to changes in rate of pumping from hour to hour, day to day or week to week. In or near areas of intake considerable rises of water level may follow heavy rains or flood flow in streams, whereas a drop in water level is character istic of the dry periods. Where the water-bearing beds are overlain by an impervious stratum, fluctuations that are due to recharge from precipi tation or from streams generally become progressively less pronounced at points farther and farther from the areas of intake. In the intake areas the water level generally falls during summer as a result of greater loss of water by evaporation and by transpiration from plants, and it rises during winter, when the losses are at a minimum. The high and low points of an annual cycle, however, may be reached at different times in different places, and over a period of years the times of the annual maxima and minima vary somewhat in the same place. The fluctua tions are the result of many variable factors, such as the distance to the water table, the seasonal and areal distribution of rainfall, and the freez ing of the ground in winter. Because of seasonal fluctuation, it is essen tial that a continuous record of water levels be maintained for a period of years if trends of water level and artesian head from year to year are to be compared.
During the present investigation, 15 automatic water-stage recorders were maintained on wells (see pi. 4, A, and .8), most of them in areas of heavy pumping where fluctuations of water level are of sufficient mag nitude to make weekly measurements of little value. Eight recorders have been maintained continuously on the same wells for more than 2 years, and seven recorders have been installed on 19 wells for shorter periods. In addition, about 12,000 individual measurements of water level have been made at regular daily, weekly, or monthly intervals in about 150 wells in the two counties during the period July I, 1938, to
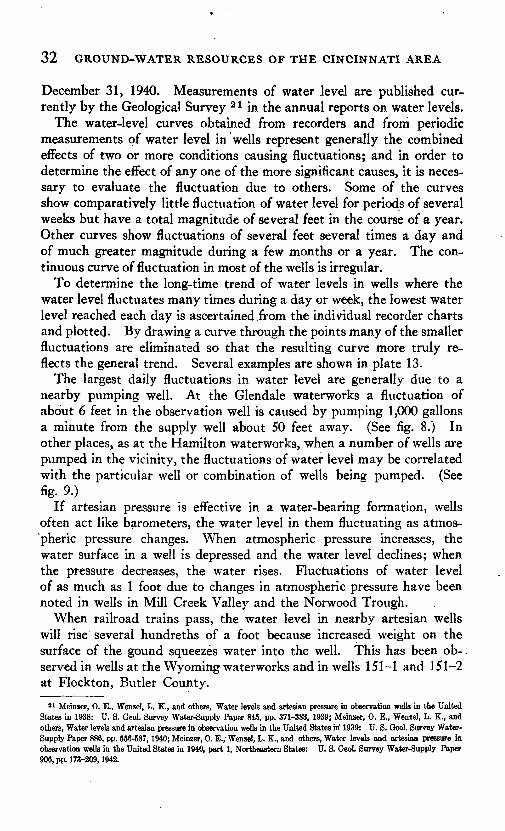
32 GROUND-WATER RESOURCES OF THE CINCINNATI AREA
December 31, 1940. Measurements of water level are published cur rently by the Geological Survey 21 in the annual reports on water levels.
The water-level curves obtained from recorders and from periodic measurements of water level in wells represent generally the combined effects of two or more conditions causing fluctuations; and in order to determine the effect of any one of the more significant causes, it is neces sary to evaluate the fluctuation due to others. Some of the curves show comparatively little fluctuation of water level for periods of several weeks but have a total magnitude of several feet in the course of a year. Other curves show fluctuations of several feet several times a day and of much greater magnitude during a few months or a year. The con tinuous curve of fluctuation in most of the wells is irregular.
To determine the long-time trend of water levels in wells where the water level fluctuates many times during a day or week, the lowest water level reached each day is ascertained,from the individual recorder charts and plotted. By drawing a curve through the points many of the smaller fluctuations are eliminated so that the resulting curve more truly re flects the general trend. Several examples are shown in plate 13.
The largest daily fluctuations in water level are generally due to a nearby pumping well. At the Glendale waterworks a fluctuation of about 6 feet in the observation well is caused by pumping 1,000 gallons a minute from the supply well about 50 feet away. (See fig. 8.) In other places, as at the Hamilton waterworks, when a number of wells are pumped in the vicinity, the fluctuations of water level may be correlated with the particular well or combination of wells being pumped. (See fig. 9.)
If artesian pressure is effective in a water-bearing formation, wells often act like barometers, the water level in them fluctuating as atmos- 'pheric pressure changes. When atmospheric pressure increases, the water surface in a well is depressed and the water level declines; when the pressure decreases, the water rises. Fluctuations of water level of as much as 1 foot due to changes in atmospheric pressure have been noted in wells in Mill Creek Valley and the Norwood Trough.
When railroad trains pass, the water level in nearby artesian wells will rise several hundreths of a foot because increased weight on the surface of the gound squeezes water into the well. This has been ob served in wells at the Wyoming waterworks and in wells 151-1 and 151-2 at Flockton, Butler County.
21 Meinzer, 0. E., Wenzel, L. K., and others, Water levels and artesian pressure in observation wells in the United States in 1938: U. S. Geol. Survey Water-Supply Paper 845, pp. 371-383, 1939; Meinzer, 0. E., Wenzel, L. K., and others, Water levels and artesian pressure in observation wells in the United States in 1939: U. S. Geol. Survey Water- Supply Paper 886, pp. 556-587,1940; Meinzer, 0. E., Wenzel, L. K., and others, Water levels and artesian pressure in observation wells in the United States in 1940, part 1, Northeastern States: U. S. Geol. Survey Water-Supply Paper 906, pp. 173-209,1942.
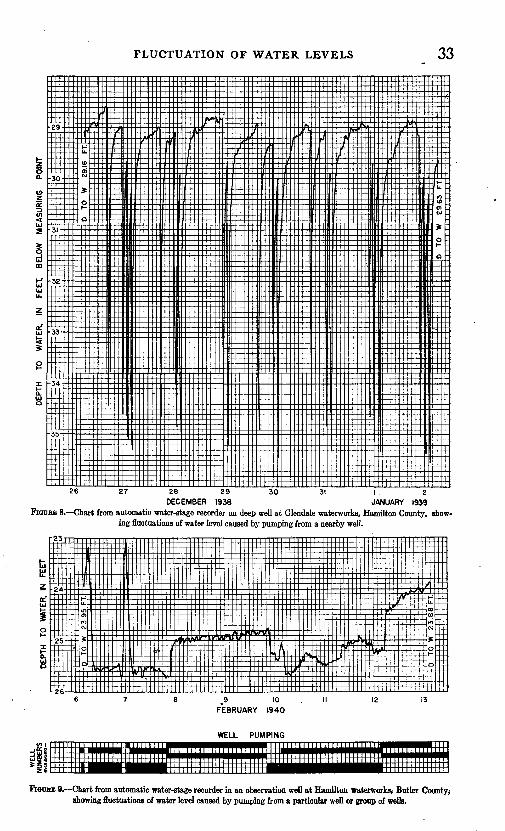
FLUCTUATION OF WATER LEVELS 33
27 30 3126 29DECEMBER 1938 JANUARY 1939
FIODBE 8. Chart from automatic water-stage recorder on deep well at Glendale waterworks, Hamilton County, show ing fluctuations of water level caused by pumping from a nearby well.
23
I
m^9 10
FEBRUARY I94O
WELL PUMPING
FtouBE 9. Chart from automatic water-stage recorder in an observation well at Hamilton waterworks, Butler County; showing fluctuations of water level caused by pumping from a particular well or group of wells.
34 GROUND-WATER RESOURCES OF THE CINCINNATI AREA
In intake areas local precipitation causes a sharp rise in water level. In April 1940 the water in a deep well at Flockton rose about 15 feet during a 4-day storm in which 6.16 inches of rain were measured at Hamilton. (See fig. 10.) During the same storm the water level in a
22
FIGURE 10 Rise in water level in well 151-1, Flockton, Butler County, Ohio, caused by heavy precipitation in April 1940. Well is 227 feet deep. Preciptitation recorded at U. 8. Weather Bureau Station, Hamilton,~Ohio.
ARTIFICIAL RECHARGE 35
shallow well (214-3) on the Glendale-Milford Road rose about 19 feet. The water levels in both deep and shallow wells generally rise during winter and early spring, reach their highest levels in April or May, and decline during summer and fall, when there is relatively little re charge and the loss of water at the intake areas by evaporation and transpiration is at a maximum. Such a seasonal fluctuation is shown by the curve of the water level in well 207-3 at the Glendale water works. (See pi. 13.)
Many wells located near streams show fluctuations of water level that correspond closely to changes in stage of the stream. The curve of water level in well 89-3 located on the east bank of the Miami River, at the Niles Tool Works in Hamilton, is similar to the hydrograph of the Miami River at the Black Street Bridge. (See pi. 5.)
In areas from which large quantities of water are drawn from many wells at varying rates, the daily fluctuations of water level are generally too great to correlate closely with the variations in pumpage. If, how ever, the lowest water level reached each week is plotted against the total weekly pumpage from the well field (pi. 5), the correlation is much closer., In plate 5 the total weekly pumpage has been inverted to show more clearly its relation to the water-level curve.
ARTIFICIAL RECHARGE
Artificial recharge, or the process of putting water into the ground by artificial methods, has been suggested as a means of increasing the ground-water supply in the alluvium-filled valleys of Butler and Hamilton Counties. Artificial recharge has been used with considerable success in some parts of the country, especially in California. The methods used in California have been described in detail by Mitchelson and Muckel,22 arid much of the following discussion has been taken from their report.
Four methods of spreading water are in general use: The basin method, the furrow or ditch method, the flooding method, and diver sion of water into pits, shafts, and wells. Each method has its advan tages and disadvantages, depending on many factors such as the to pography of the soil surface, general slope of the land, amount of land available for spreading grounds, type of soil and water-bearing ma terial, condition of water (silty or clear), and characteristics of-stream flow. It is not uncommon to find all four methods used in a single artificial recharge system.
In the basin method, water is impounded in a series of small basins enclosed by dikes or banks. These basins are arranged so that the entire area may be submerged during the spreading. This method is
23 Mitchelson, A. T., and Muckel, D. C., Spreading water for storage underground: U. S. Dept. Agr. Tech. BulL 578, 80 pp., 1937.
36 GROUND-WATER RESOURCES OF THE CINCINNATI AREA
used where the surface is irregular and spotted with" numerous shallow gullies and ridges. In many places after a period of continuous use percolation rates have decreased because of puddling of the soil and depo sition of silt. The basin method has been used in connection with flood- control systems that temporarily store surface water.
In the furrow or ditch method the water is passed through a series of ditches laid out in one of several patterns. The shallow and flat-bot tomed ditches are closely spaced in order to expose the greatest possible area. The slopes of the ditches are usually such that the water has sufficient velocity to carry in suspension or as rolling-bed load the silt and fine material. This method is used extensively in the vicinity of stream beds where, because of flood hazard, no permanent works can be installed.
In the flooding method, the water is spread in a thin sheet and at low velocity over the land surface. Few areas are naturally suitable for this method, and the spreading grounds must be prepared to prevent water from collecting in small streams and running off without spreading. The highest percolation rates, as found by experiment and field observa tion, are obtained in areas on which the native vegetation and soil cover have, been least disturbed. One disadvantage of this method is that the water cannot be controlled as easily as in the other methods of water spreading.
The use of pits, shafts, and wells is not strictly a means of water spreading, but it serves the same purpose and is often considered a method of artificial recharge even though it is not used extensively because of its high cost and other limitations. Generally water is di verted into abandoned gravel pits, old wells, or other excavations. New shafts or wells seldom are sunk primarily for recharge. High rates of percolation are usually obtained in this manner, but the area involved is so limited that only a relatively small amount of water is put into the ground. The water supplied to pits and wells must be chosen carefully because a small amount of s'lt will soon seal the bottom and sides to such an extent that percolation practically ceases. The cost of cleaning wells or shafts is usually high or altogether prohibitive; so unless the silt deposit can be prevented or removed cheaply the shafts become useless.23
On Long Island a considerable quantity of water used for air condi tioning and other purposes has been returned to the ground. In prac tically every instance, however, under conditions imposed by the New York Water Power and Control Commission, acting under authority of a State law, the water passes from the supply well to the recharge well in a closed-pipe system and is not exposed to the air. The water that enters the recharge well is as clear as it came from the supply well,
23 Mitchelson, A. T., and Muckd, D. C., op. oit., pp. 6-10.
ARTIFICIAL RECHARGE " 37
unless dissolved material precipitates as a result of changes in temperature and pressure during passage from one well to the other. A recent study24 has shown that even under favorable conditions many of the recharge wells on Long Island have not maintained their efficiency because of clogging, which results probably from chemical incrustation or deposition of silt pumped from the supply well, or from a combination of both processes. The clogging is due in part to a difficulty in well construction, which doubtless may be overcome to some extent as more experience is gained.
The successful operation of any method of artificial recharge depends in large part on the quality and quantity of the water that is available for recharge. One problem is whether the water carries enough silt or clay in suspension to clog the pores of the permeable material through which recharge tales place. Another condition that should be con sidered is the presence of algae, plant spores, and other organic matter in the water. After introduction into the ground these organisms may grow and clog the pores in the permeable material. If water is returned to ground that is close to pumping wells, the danger of bac terial pollution might necessitate some method of sterilization. Even when no silt or organic matter is carried in the water, trouble may be encountered, especially in surface spreading methods, because of resort ing of the soil particles and puddling of the soil surface.
To be economically feasible, the quantity of water available for re charging purposes should be sufficient to permit operations for at least several weeks each year. In many places it is necessary to provide for temporary storage of flood waters, which may be released later for the spreading operations. Such storage has the advantage also of allowing silt to settle before the water is used for recharging.
Artificial recharge is practiced most successfully in areas where the depth to water is fairly great and there is a large thickness of permeable material in which water may be stored. If such a deposit is cut by a river channel, much of the water that percolates into the underground reservoir will drain back into the stream as effluent seepage. As water moves through the ground-at a relatively slow rate, recharge areas should be located as near as possible to areas of heavy withdrawal. In many areas from which large quantities of water are being pumped, large cones of depression have been developed. In these cones the hydraulic gradients are steep, and the water percolates through the water-bearing material more rapidly than in areas where gradients are low. Such areas appear to be best suited for artificial recharge.
It has been said frequently that it should be possible to put water into a recharge well as fast as it can be taken out. Within certain limits
34 Leggette, R. M., and Braahears, M. L., Ground water for air conditioning on Long Island, K. Y. j Am. Geophys. Union Trass. 1938, pt. 1, pp. 412-418,1939.
38 GROUND-WATER RESOURCES OF THE CINCINNATI AREA
this statement is theoretically true. One limiting factor is the hydro static head that can be built up above the so-called static water level at the recharge well. For example, in a locality where the water-bearing alluvium is 100 feet thick and the water table is only 10 feet below the surface, in pumping from a well the water level could be lowered to within, say, 10 feet of the bottom; that is, a draw-down of 80 feet could be created. In attempting -to recharge however, the head could not be built up more than 10 feet without pumping into the well under pressure. Therefore, other conditions being equal, water could be drained into the well only about one-eighth as fast as it could be pumped out. On the other hand, if only a small part of the alluvium were saturated, the maximum draw-down that could be created by pumping would be much less than the head that could be created by draining water into the well, and hence recharge could take place at a higher rate than pump ing.
The application and feasibility of the methods of artificial recharge in the parts of the Cincinnati region are discussed under the section on ground-water conditions in specific areas.
QUALITY OF WATER
The amount and character of dissolved mineral matter in the ground water from the buried valleys of Butler and Hamilton Counties, Ohio, are shown in a general way by the table of analyses, which presents data on samples from six public water-supply systems in the area that were analyzed by W. M. Noble, of the Geological Survey. Two analyses of water from the Middletown public supply made in 1932 and published in Geological Survey Water-Supply Paper 658, pages 104-105, are also included to show the difference in iron content between the water of the shallow and deep water-bearing formations in the Middletown area.
The samples are chemically similar. All are calcium-bicarbonate waters in which the total solid content ranges from 303 to 561 parts per million and the hardness from 274 to 464 parts per million. The iron content may be as much as 2.3 parts per million. According to other analyses, the amount of iron is variable and may be as high as 10 parts per million in some wells. The sulfate content is variable, one example (5A) having 142 parts per million, and another (3A) having only 9.4 parts per million. The chloride content is generally very low. The mineral content of these waters is typical of most waters from the glacial outwash in southwestern Ohio.
Although the analyses give no indication of the sanitary condition of the water, they indicate that the water would be generally satisfactory for domestic and most industrial uses, so far as such uses are affected by dissolved mineral matter.
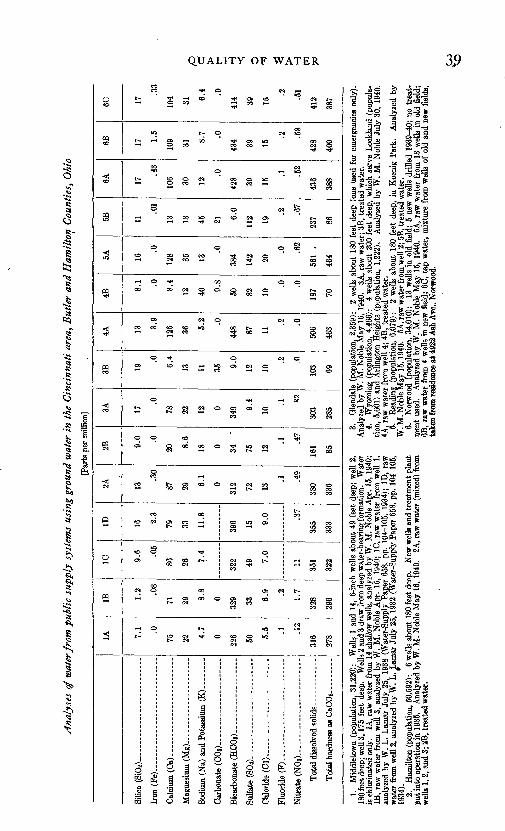
Ana
lyse
s of
wat
er fr
om p
ubli
c su
pply
sys
tem
s us
ing
grou
nd w
ater
in
the
Cin
cinn
ati
area
, B
utle
r an
d H
amil
ton
Cou
ntie
s, O
hio
[Par
ts p
er m
illio
n]
Silica
(SiOz) ...
Iran
(Fe) . . .
Cwbonate (C0
8)~~ --
----
----
----
--
Chloride(Cl). . ...
Nitrat
e (N03) -- -
1A 7.1 .0
75 22 4.7
0
226 50 5.
5 .1
316
278
IB 1.2 .08
71 29 8.8
0
329 33 6.9 .2
1 *T
328
296
1C 9.6 .05
86 26 7.4
322 49 7.
0
,, 351
322
ID 16 2.3
79 33 11.8
396 15 9.0 11
355
333
2A 13
.30
87 29 6.1
0
312 72 13
.1 40
380
336
2B 9.0 .0
20 8.6
18 0 34
-
75 12
.1 47
161 85
3A 17
.0
78 22 12 0
349 9.
4
10
.1 85!
303
285
3B 19
.0
6.4
13 11 35 9.0
12 10
.2
103 69
4A 13 3.9
126 36 5.2 .0
448 87 11
.2
506
463
4B
8.1 .0 8.4
12 40 9.8
50 82 10
.0 .0
187 70
5A 16
.0
128 35 13
.0
384
142 20
.0 CO
561
.
464
5B 11
.01
13 13 45 21 6.0
112 19
.2 .67
237 86
6A 17
.43
106 30 12
.0
428 39 15
.1 en
436
388
6B 17 1.5
109 31 8.
7 .0
434 39 15
.2
428
400
6C 17
.33
104 31 6.4 .0
414 39 15
.2 .51
412
387
1.
Mid
dlet
own
(pop
ulat
ion,
31,
220)
: W
ells
1 a
nd 1
4, 6
-inch
wel
ls a
bout
49
feet
dee
p; w
ell
2,
180
feet
dee
p; w
ell 3
,175
fee
t de
ep.
Wel
ls 2
and
3 d
raw
from
dee
p w
ater
-bea
ring
form
atio
n.
Wat
er
is c
hlor
inat
ed o
nly.
1A
, raw
wat
er f
rom
14
shal
low
wel
ls,
anal
yzed
by
W.
M.
Nob
le A
pr.
15,
1940
; IB
, ra
w w
ater
fro
m w
ell
3, a
naly
zed
by W
. M
. N
oble
Apr
. 15
, 19
40;
1C,
raw
wat
er f
rom
wel
l 1,
an
alyz
ed b
y W
. L.
Lam
ar J
uly
25,
1938
(W
ater
-Sup
ply
Pape
r 65
8, p
p. 1
04-1
05,
1934
); ID
, ra
w
wat
er f
rom
wel
l 2,
anal
yzed
by
W.
L. L
amar
Jul
y 25
, 19
32 (
Wat
er-S
uppl
y Pa
per
658,
pp.
104
-105
, 19
34).
*2.
H
amilt
on (
popu
latio
n, 5
0,59
2):
6 w
ells
abo
ut 1
80 f
eet
deep
. N
ew w
ells
and
trea
tmen
t pla
nt
put i
nto
oper
atio
n in
193
5.
Ana
lyze
d by
W. M
. N
oble
May
16,
1940
. 2A
, raw
wat
er (
mix
ed)
from
w
ells
1, 2
, and
3; 2
B, t
reat
ed w
ater
.
3.
Gle
ndal
e (p
opul
atio
n, 2
,359
): 2
wel
ls a
bout
180
fee
t de
ep (
one
used
for
em
erge
ncie
s on
ly).
Ana
lyze
d by
W. M
. N
oble
May
16,
194
0.
3A, r
aw w
ater
; 3B
, tre
ated
wat
er.
4.
Wyo
min
g (p
opul
atio
n, 4
,466
): 4
wel
ls a
bout
200
fee
t de
ep,
whi
ch s
erve
Loc
klan
d (p
opul
a
tion,
5,6
01)
and
Arli
ngto
n H
eigh
ts (
popu
latio
n, 1
,222
). A
naly
zed
by W
. M
. N
oble
Jul
y 30
, 19
40.
4A, r
aw w
ater
fro
m w
ell
4; 4
B,
trea
ted
Wat
er.
5.
Rea
ding
(po
pula
tion,
6,0
79):
2 w
ells
abo
ut 1
80 f
eet
deep
, in
Eoe
nig
Park
. A
naly
zed
by
W. M
. Nob
le M
ay 1
5,19
40.
5A, r
aw w
ater
from
wel
l 2; 5
B, t
reat
ed w
ater
.6.
N
orw
ood
(pop
ulat
ion,
34,
010)
: 13
wel
ls i
n ol
d fie
ld;
5 ne
w w
ells
dril
led
1939
-40;
no
trea
t
men
t us
ed.
Ana
lyze
d by
W.
M.
Nob
le M
ay 1
5, 1
940.
6A
, ra
w w
ater
fro
m 1
3 w
ells
in
old
field
; 6B
, ra
w w
ater
fro
m 4
wel
ls i
n ne
w f
ield
; 6C
, ta
p w
ater
, m
ixtu
re f
rom
wel
ls o
f ol
d an
d ne
w f
ield
s, ta
ken
from
resi
denc
e at
492
2 A
sh A
ve..
Nor
woo
d.
40 GROUND-WATER RESOURCES OF THE CINCINNATI AREA
Four of tHe six public water-supply systems in the area that use ground water as a source of supply have treatment plants for softening the water by the lime or lime-soda process. In most plants the hardness of the water is reduced to about 85 parts per million. At two plants the water is aerated to remove iron, and at three plants the water is treated to remove carbon dioxide. In five of the systems the water is chlori nated, and in one system no treatment is used.
A comparison of changes in hardness of the water pumped over a period of years at the Glendale waterworks and at the Wyoming water works reveals a relation between hardness and water level. According to data supplied by Clarence Bahlman, water purification supervisor of the Cincinnati waterworks filtration plant, there has been little varia tion in the composition of the water pumped at the Glendale waterworks during the past 14 years, the hardness remaining fairly constant during that period.25 In contrast, the hardness of the water pumped at the Wyoming waterworks has been increasing during the past 10 years. Between 1932 and 1935 the increase was rather gradual, but since 1935 it has been more marked. The hardness has «iore than doubled since 1932. -
The wells at the two plants probably obtain water from the same water bearing formation. The water level at the Glendale waterworks during the past 10 years has been from 20 to 40 feet below the surface. The water level at the Wyoming waterworks during the same period has been from 100 to 130 feet below the surface. The increase in hardness at the Wyoming plant possibly may be attributed to the fact that a large cone of depression has been created around the Wyoming wells so that the drainage of water from the bedrock formations into the glacial fill of the buried valley has been increased, or to the fact that the Wyoming wells are drawing water in large part from storage. Recharge of softer water at the Glendale plant maintains a sufficient dilution to prevent an increase in hardness.
GROUND WATER IN SPECIFIC LOCALITIES MIAMI VALLEY
The Miami River drains the southwestern part of the State of Ohio, and its drainage basin of 5,385 square miles includes parts of Auglaize, Hardin, Mercer, Shelby, Logan, Darke, Miami, Champaign, Preble, Montgomery, Clark, Greene, Butler, Warren, and Hamilton Counties in Ohio, and parts of Randolph, Wayne, Fayette, Union, Franklin, Ripley, and Dearborn Counties in Indiana. The slope of the Miami River from Dayton, Ohio, to the mouth of the Whitewater River averages about 3 feet to the mile. Important tributaries that join the Miami
a* Letter from Clarence Bahlman to George Ervin( superintendent of the Qlendale waterworks; March 20,1939.
GROUND WATER IN SPECIFIC LOCALITIES 41
River in Butler County are Fourmile and Sevenmile Creeks just north of Hamilton and Indian Creek several miles south of Hamilton.
As a result of a disastrous flood in March 1913, a flood-control system of five retarding dams, with accompanying levees and channel improve ment works, has been built by the Miami Conservancy District. Com plete descriptions of the construction methods and design and the hy draulics connected with this project have been described in a series of reports issued by the Miami Conservancy District, Dayton, Ohio.26
MJDDLETOWN
The city of Middletown is situated on the east bank of the Miami River near the north end of Butler County about 32 miles north from Cincinnati. It is mainly an industrial city, the principal industries being two plants of the American Rolling Mill Co. and several large paper mills. The population according to the 1940 census was 31,220.
The Middletown Hydraulic Co. maintains a canal, which runs along the east edge of the valley from a dam across Miami River about 3 miles northeast of Middletown through the northwest corner of the city. The canal is used entirely for power and water supply and not for trans portation. The old Miami and Erie Canal, which has been abandoned, ran parallel to the hydraulic canal.
The municipal water supply of Middletown is taken from 15 wells in the shallow water-bearing beds and from two wells in the deeper water-bearing beds. The shallow wells are pumped by suction, and the deep wells are equipped with electric deep-well turbines. The water is chlorinated and pumped directly into the mains with no further treat ment. Water from the shallow wells is used as much as possible, as the iron content of the water is lower than that from the deeper water bearing beds. The well field [Wells 25 (1-4)] is located in the northwest corner of the city. (See pi. 6.) The pumpage for public supply averages about 1% million gallons a day.
The main part of the city stands on a broad terrace of glacial outwash, of Wisconsin Age, at an elevation of 650 to 680 feet above sea level. The terrace slopes gently toward the sides of the valley at a rate of about 20 feet to the mile. The Miami River has cut into the terrace to a depth of about 10 feet, forming a new terrace about three-tenths of a
a« Miami Conservancy Technical Reports: Part I, The Miami Valley and the 1913 flood, by A. E. Morgan, 125 pp., 1917. Part H, History of the Miami flood-control project, by C. A. Bock, 196 pp., 1918. Part HI, Theory of hydraulic jump and backwater curves, by 8. M. Woodward; Experimental investigation of the hydraulic jump as a means of dissi pating energy, by R. M. Riegaland J. C. Beebe, 111 pp., 1917. Part IV, Calculation of flow in open channels, by I. E. Houk, 283 pp., 1918. Part V, Storm rainfall of eastern United States, by the engineering staff of the District, 310 pp.; 1917. Part VI, Contract forms and specifications, by the engineering staff of the District, 3 folding plates and index; atlas of the selected contract and information drawings to accompany part VI, 192 pp., 1918. Part VII, Hydraulics of the Miami flood-control project, by S. M. Woodward, 344 pp., 1920. Part VIII, Rainfall and run-off in the Miami Valley, by I. E. Houk, 236 pp., 1921. Part IX, Accounting and cost keeping of the department of engineering and construction; by F. L. Cavis, 112 pp., 31 ills. Part X, Construction plant, methods and cost, by Chas. H. Pauls, 432 pp.
Miami Conservancy Bulletin, August 1918 to December 1923 vol. 1, No. 1, to voL 4, No. St
42 GROUND-WATER RESOURCES OF THE CINCINNATI AREA
mile wide, which acts as a flood plain. The terrace is made of relatively coarse sand and gravel.
The shallow water-bearing beds of sand and gravel vary in thickness, depending on the surface elevation, from 30 to 50 feet and are fairly continuous and regular. These beds have been developed for water supply mainly in a small area along the east bank of the Miami River north of Central Avenue for the municipal supply and the industrial water supplies of the Sorg Paper Co., the Gardner-Richardson Paper Co., and the Wrenn Blotting Paper Co. About 11,000,000 gallons of water per day are taken from the shallow beds in this area.
The shallow water-bearing beds are generally a mixture of medium to coarse gravel and sand. In some localities fine and coarse sand with little mixed gravel is reported. The material is exposed to a depth of about 2Q feet in the pit of the Moorman Sand & Gravel Co. (J), near the municipal well field. Here the sand and gravel is moderately coarse and cross bedded showing deposition by cross currents. Near the river bank the shallow aquifers are about 25 feet thick and become thicker to the east. The maximum thickness reported was 53 feet in a well at the Gardner-Richardson plant No. 2 at Charles Street and Flemming Road.
Measurements of water level have been made in the pit of the Moorman Sand & Gravel Co. (J) since September 30, 1938, and in the abandoned Smith gravel pit (L), one-half mile northeast, since July 10, 1939. Staff gages were installed in each pit, and the elevation of the zero of each gage was determined by instrumental leveling. The fluctuations of water level during the period of record to December 31, 1940, are shown in figure 11.
The water level in the Moorman pit has ranged from a high stage of 632.52 feet above sea level on April 18, 1939, to a low level of 616.60 feet above sea level on October 22, 1940. The low level for 1938 occurred on November 14, when the level was 619.06 feet above sea level. The low level of the fall and winter of 1939-40 was reached on January 16, 1940, and was 2.21 feet lower than the low level of 1938. This decline in water level during the year was due, in large part, to the deficient precipitation from July 1939 to January 1940, during which period there was an accumulated deficiency of more than 10 inches of rainfall, and to the increase in industrial pumping from nearby wells in October 1939. The water level rose rapidly to a level of 632,28 feet above sea level on April 26, 1940. The high level of 1940 was 0.24 feet lower than that of 1939. The water level on July 2, 1940, was 3.93 feet lower than on July 10, 1939.
The water level in the Miami River has been measured at weekly intervals from a measuring point on the Central Avenue Bridge. In spite of large fluctuations in water levels, in the river and the pit, with
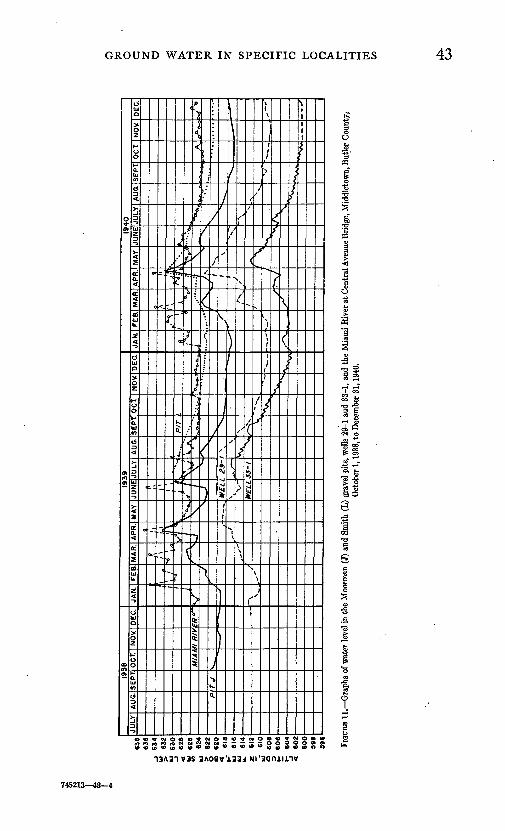
GROUND WATER IN SPECIFIC LOCALITIES 43
13A31V3S 3Aoav'i33j Ni'aaniiiiv
745213 48 4
44 GROUND-WATER RESOURCES OF THE CINCINNATI AREA
the exception of 3 weeks the water level in the Moorman pit has re mained from 1 foot to 14 feet below river level. The exceptions have followed extremely high stages in the river when the ground-water level declined to normal more slowly than the river stage.
During normal stages of the river, when it is confined to its normal channel, recharge to the water-bearing beds directly from the river is at a minimum. The river carries much silt, which, when deposited, may effectively seal the pores of the gravel and curtail seepage of water out of the stream into the ground. As the river flows in the same channel a large part of the time, enough silt may have been deposited to seal the channel partly during periods of low stream flow. During periods of low river stage, the water in the Moorman gravel pit apparently moves from the hills and farther up the Miami Valley in a southerly and west erly direction. A depression in the water table has been caused in this area by heavy pumping from the wells of the municipal supply and of the Sorg Paper Co., which has lowered the water level in the gravel pit below river level.
During periods of high-river stage the broad flood plains of the river are often covered. The gravels, which have not been covered continu ously by the river for long periods of time and thus have not been covered by silt, are sufficiently permeable to allow large quantities of water to pass into the ground. Considerable recharge to the ground-water reservoir may occur during such periods. The water level in the Moor man pit rises rapidly in response to changes in river stage and to preci pitation.
The water level in the Smith pit (L) has been measured at weekly intervals since July 10, 1939. During the period of record the water level has ranged from a low level of 621.43 feet above sea level on Novem ber 19, 1940, to a high level of 632.00 feet above sea level on April 23, 1940. On July 2, 1940, the water level in this pit was 3.94 feet lower than on July 10, 1939. This net loss is roughly the same for the cor responding period in the Moorman pit.
The fluctuations of water level in the Smith pit appear to be due mainly to precipitation and in a lesser degree to changes in the stage of the Miami River. For much of the year except for several weeks after an extremely high river stage, the pit level has been from a few feet above to about 8 feet below river level. The changes in water level are not as rapid or as large as those in the Moorman pit. During the period of record the water level in the Smith pit has been with one ex ception on April 26, 1940, from less than 1 foot to 5^ feet above the water level in the Moorman pit. The evidence indicates that the normal flow of ground water is west and south from the Smith pit toward the Miami River and toward the Moorman pit and the area of heavy with drawal.
GROUND WATER IN» SPECIFIC LOCALITIES 45
A staff gage was installed on February 6, 1940, in the pit of the South Middletown Sand & Gravel Co. (P) just beyond the southeast cofner of the city limits, on the east bank of the Miami River. The period of record to date is not sufficiently long to determine the high and low water levels in this pit. The record does show, however, that the water level in the pit fluctuates in a similar manner as the river stage.
The water level has been measured in a well (29-1) in the basement of the Y. M. C. A., at Manchester Avenue and Broad Street, since August 8, 1939. The depth of the well was measured as 50 feet below the side walk level and therefore probably ends in the shallow water-bearing beds. The water from the well was reported to contain very little or no iron. The water level in this well is not affected by pumping from the present supply well (29-2) 15 feet away, which draws its water from the deeper water-bearing formation. The water level in the shallow well has ranged from a low level on November 12,1940, of 608.03 feet above sea level, to a high level on April 23, 1940, of 623.05 feet above sea level, and it fluctuates in a similar manner to that in the Moorman gravel pit. The water level in this well is generally from 7 to 16 feet below the level of the Miami River at the Central Avenue Bridge, owing in large part to the cone of depression developed by heavy pumping from muni cipal and industrial wells between this well and the river.
The pumping level in the well at the Sorg Paper Co. in December 1939 was about 16 feet below the water level in pit J and about 8 feet below the level in the Y. M. C. A. well. This would indicate that the cone of depression' extends more across the valley than parallel to the valley. Unfortunately it has not been possible to obtain shallow wells suitable for measurement in the area farther from the river than the Y. M. C. A. well, and the shape of the cone of depression has not been determined.
The water in the shallow water-bearing beds is derived in part from local precipitation and in part from recharge from the Miami River. The United States Weather Bureau reports an average precipitation for Middletown of 42.97 inches. The intake area for the shallow water bearing beds is large, as most of the area within the limits of the glacial- outwash deposits is underlain by gravelly and sandy soils that permit water to pass easily through them.
The ground water in the shallow water-bearing beds probably moves generally southwestward along the valley of the Miami River, similar to the surface drainage. In areas where no extensive quantities of water are pumped the ground water also generally moves from the valley walls toward the river and probably drains into the river in such areas, parti cularly during low river stages. In the vicinity of the area of heavy withdrawal, the general direction of flow into the river is reversed and water flows toward the heavily developed area from all directions.
46 GROUND-WATER RESOURCES OF THE CINCINNATI AREA
The area affected by the pumping of approximately 11,000,000 gallons of water a day from the shallow water-bearing beds probably extends under a large part of the city. The sands and gravels of the shallow formation are highly permeable, as shown by the rapid rise of water level in the Moorman pit in response to high stages of the Miami River and to precipitation, and by the relatively large yields of more than 1,000 gallons a minute from wells of the Sorg Paper Co.
The shallow water-bearing beds range in thickness from about 20 to 50 feet, with an average of about 35 feet. During several months of summer and fall, when the water level is generally low, only about 10 to 12 feet of saturated material remains in the Moorman pit and con siderably less in the pumped wells nearby. Some wells must be pumped at only part capacity to avoid pumping air and losing suction. Because of these conditions, the available supply from the shallow water-bearing beds in this area is limited. In the northwest corner of the city, where .the supply has been developed to capacity, any increase in withdrawal will result in overdevelopment and abandonment or some wells.
Moderately large supplies of water, however, may be developed from the shallow water-bearing beds in other areas, where the supply has not been developed to capacity. Such areas would include the undeveloped areas on the east and west sides of Ohio Route 4 to Poasttowh north of Middletown in sees. 23 and 24, and the N^> sees. 29 and 30, Lemon township. South of Middletown suitable areas may be found in sees. 27, 32 and 33, Lemon township. The broad, flat area south of Trenton in Madison township appears quite favorable for further development. Care should be taken to develop a supply as near to the center or eastern side of the valley as possible, where the shallow gravels are generally thickest. Careful test drilling should be done before any extensive ground-water supply is planned.
The water in the shallow water-bearing beds probably contains less iron than that from the deeper formations, as shown by the figures in the table of analyses. The shallow water is therefore preferred for municipal supply and for many industrial purposes, such as paper- making in which a high iron content is objectionable.
The shallow water-bearing beds in Middletown are underlain by a fairly continuous bed of boulder clay, occurring at a depth of 30 feet near the Miami River and 53 feet below the land surface in the center of the city. The upper surface of the clay appears to be fairly flat and slopes uniformly upward toward the valley walls. The clay is con siderably thicker along the Miami River, having a maximum thickness of 42 feet in a test well in the city well field. The clay becomes thinner toward the east, having a thickness of only 6 feet in the well at the P. .Oborillard Co. The equivalent of the clay in a well at the Gardner- Richardsori Co., plant No. 2, probably has a thickness of 9 feet. The
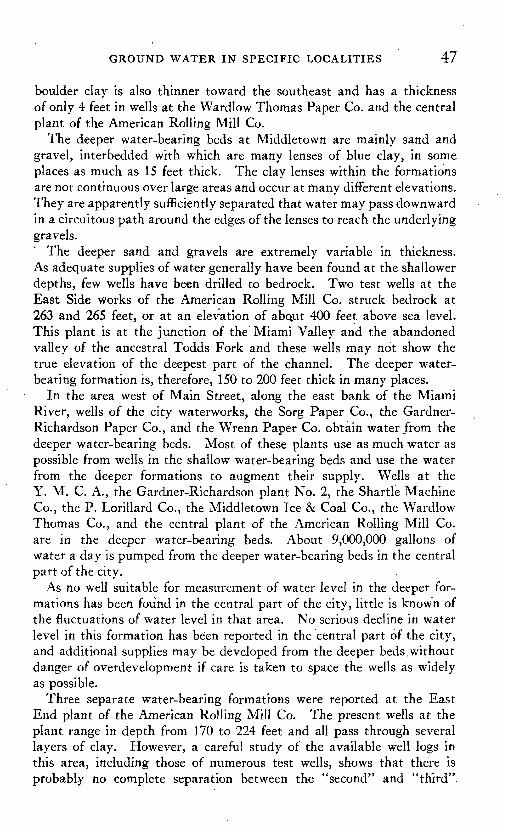
GROUND WATER IN SPECIFIC LOCALITIES 47
boulder clay is also thinner toward the southeast and has a thickness of only 4 feet in wells at the Wardlow Thomas Paper Co. and the central plant of the American Rolling Mill Co.
The deeper water-bearing beds at Middletown are mainly sand and gravel, interbedded with which are many lenses of blue clay, in some places as much as 15 feet thick. The clay lenses within the formations are not continuous over large areas and occur at many different elevations. They are apparently sufficiently separated that water may pass downward in a circuitous path around the edges of the lenses to reach the underlying gravels.
The deeper sand and gravels are extremely variable in thickness. As adequate supplies of water generally have been found at the shallower depths, few wells have been drilled to bedrock. Two test wells at the East Side works of the American Rolling Mill Co. struck bedrock at 263 and 265 feet, or at an elevation of abaut 400 feet above sea level. This plant is at the junction of the Miami Valley and the abandoned valley of the ancestral Todds Fork and these wells may not show the true elevation of the deepest part of the channel. The deeper water bearing formation is, therefore, 150 to 200 feet thick in many places.
In the area west of Main Street, along the east bank of the Miami River, wells of the city waterworks, the Sorg Paper Co., the Gardner- Richardson Paper Co., and the Wrenn Paper Co. obtain water from the deeper water-bearing beds. Most of these plants use as much water as possible from wells in the shallow water-bearing beds and use the water from the deeper formations to augment their supply. Wells at the Y. M. C. A., the Gardner-Richardson plant No. 2, the Shartle Machine Co., the P. Lorillard Co., the Middletown Ice & Coal Co., the Wardlow Thomas Co., and the central plant of the American Rolling Mill Co. are in the deeper water-bearing beds. About 9,000,000 gallons of water a day is pumped from the deeper water-bearing beds in the central part of the city.
As no well suitable for measurement of water level in the deeper for mations has been found in the central part of the city, little is known of the fluctuations of water level in that area. No serious decline in water level in this formation has been reported in the central part of the city, and additional supplies may be developed from the deeper beds without danger of overdevelopment if care is taken to space the wells as widely as possible.
Three separate water-bearing formations were reported at the East End plant of the American Rolling Mill Co. The present wells at the plant range in depth from 170 to 224 feet and all pass through several layers of clay. However, a careful study of the available well logs in this area, including those of numerous test wells, shows that there is probably no complete separation between the "second" and "third"
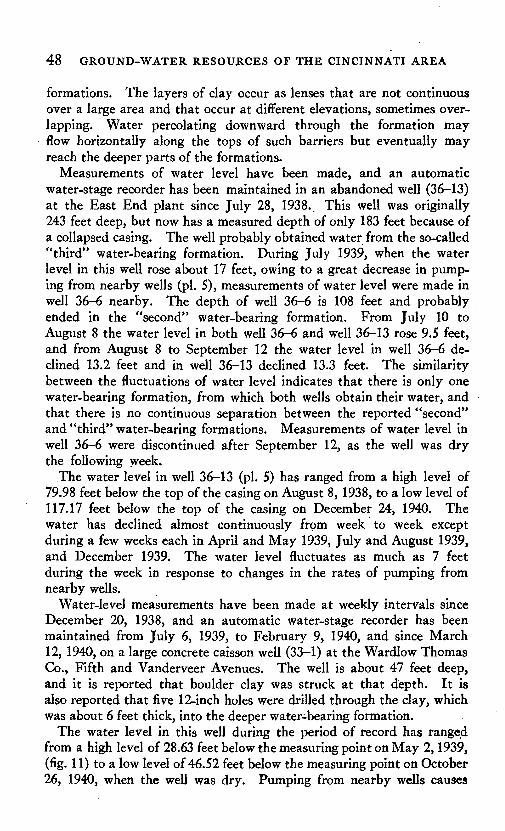
48 GROUND-WATER RESOURCES OF THE CINCINNATI AREA
formations. The layers of clay occur as lenses that are not continuous over a large area and that occur at different elevations, sometimes over lapping. Water percolating downward through the formation may flow horizontally along the tops of such barriers but eventually may reach the deeper parts of the formations.
Measurements of water level have been made, and an automatic water-stage recorder has been maintained in an abandoned well (36-13) at the East End plant since July 28, 1938., This well was originally 243 feet deep, but now has a measured depth of only 183 feet because of a collapsed casing. The well probably obtained water from the so-called "third" water-bearing formation. During July 1939, when the water level in this well rose about 17 feet, owing to a great decrease in pump ing from nearby wells (pi. 5), measurements of water level were made in well 36-6 nearby. The depth of well 36-6 is 108 feet and probably ended in the "second" water-bearing formation. From July 10 to August 8 the water level in both well 36-6 and well 36-13 rose 9.5 feet, and from August 8 to September 12 the water level in well 36-6 de clined 13.2 feet and in well 36-13 declined 13.3 feet. The similarity between the fluctuations of water level indicates that there is only one water-bearing formation, from which both wells obtain their water, and that there is no continuous separation between the reported "second" and "third" water-bearing formations. Measurements of water level in well 36-6 were discontinued after September 12, as the well was dry the following week.
The water level in well 36-13 (pi. 5) has ranged from a high level of 79.98 feet below the top of the casing on August 8, 1938, to a low level of 117.17 feet below the top of the casing on December 24, 1940. The water has declined almost continuously from week to week except during a few weeks each in April and May 1939, July and August 1939, and December 1939. The water level fluctuates as much as 7 feet during the week in response to changes in the rates of pumping from nearby wells.
Water-level measurements have been made at weekly intervals since December 20, 1938, and an automatic water-stage recorder has been maintained from July 6, 1939, to February 9, 1940, and since March 12, 1940, on a large concrete caisson well (33-1) at the Wardlow Thomas Co., Fifth and Vanderveer Avenues. The well is about 47 feet deep, and it is reported that boulder clay was struck at that depth. It is also reported that five 12-inch holes were drilled through the clay, which was about 6 feet thick, into the deeper water-bearing formation.
The water level in this well during the period of record has ranged from a high level of 28.63 feet below the measuring point on May 2,1939, (fig. 11) to a low level of 46.52 feet below the measuring point on October 26, 1940, when the well was dry. Pumping from nearby wells causes
GROUND WATER IN SPECIFIC LOCALITIES 49
a fluctuation of about 1 % to 2 feet in this well. The fluctuation, however, is gradual, occurs only once a week, and shows a gradual draw-down during the week and a recovery over the week end.
The fluctuations of water level in this well indicate that the water level is affected by pumping from the supply well of the Wardlow Thomas plant, from which about 2,000,000 gallons a day are pumped when the plant is in operation. During periods when the plant is shut down the usual weekly fluctuation of water level in this well is absent and the water level rises or declines continuously throughout the week. The supply well of the Wardlow Thomas Co. takes water from the deeper water-bearing formation. The evidence suggests a connection between the shallow water-bearing formations and the deep ones at or near the Wardlow Thomas plant. The layer of clay that separates the deep and the shallow formation also apparently becomes thinner in the south ern part of the city and may pinch out or be cut out near the southern limits. If such an opening in the clay bed exists, the water from local precipitation and from the shallow water-bearing formation may re charge the deep water-bearing beds.
The water level in well 33-1 has remained 8 to 15 feet below the level of the Miami River at Central Avenue and 1 foot to 16 feet below the water level in the Y. M. C. A. well 29-1. One of the holes that were reported to be drilled through that clay at the bottom of the well was actually found by walking over the bottom when the well was dry. The presence of the holes and the fact that the clay stratum separating the two water-bearing formations becomes thinner in a southerly direction suggests that this well is near a hydraulic connection between the two formations. The water level in this well probably represents the com bined effect of the water table in the shallow beds and the artesian pres sure in the deeper formation.
The fluctuations of water level in the deep water-bearing beds at Middletown show that this formation has been overdeveloped in the vicinity of the East Side works of the American Rolling Mill Co., as the water level has declined almost continuously during the period of ob servation (pi. 5). However, in the central and northern parts of the city, there has been no overdevelopment, and additional water supplies may be taken from the deep water-bearing formation. The wells should be spaced as far apart as possible, and extensive test drilling and pumping should be done before any large development is made.
It may be possible to increase the ground-water supply from the shallow water-bearing beds by some method of artificial recharge. Some of the difficulties that may be encountered in artificial-recharge operations have been discussed in a previous section, and many of these may have to be overcome before any recharge operation may be successful. If
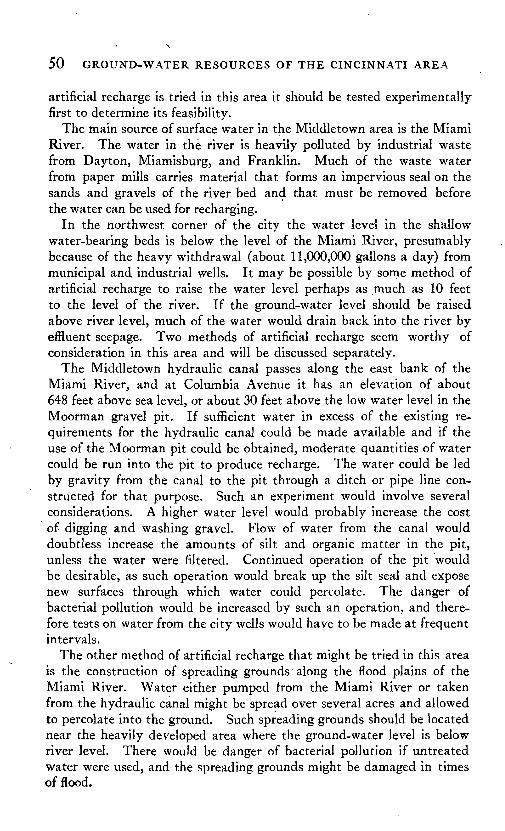
50 GROUND-WATER RESOURCES OF THE CINCINNATI AREA
artificial recharge is tried in this area it should be tested experimentally first to determine its feasibility.
The main source of surface water in the Middletown area is the Miami River. The water in the river is heavily polluted by industrial waste from Dayton, Miamisburg, and Franklin. Much of the waste water from paper mills carries material that forms an impervious seal on the sands and gravels of the river bed and that must be removed before the water can be used for recharging.
In the northwest corner of the city the water level in the shallow water-bearing beds is below the level of the Miami River, presumably because of the heavy withdrawal (about 11,000,000 gallons a day) from municipal and industrial wells. It may be possible by some method of artificial recharge to raise the water level perhaps as much as 10 feet to the level of the river. If the ground-water level should be raised above river level, much of the water would drain back into the river by effluent seepage. Two methods of artificial recharge seem worthy of consideration in this area and will be discussed separately.
The Middletown hydraulic canal passes along the east bank of the Miami River, and at Columbia Avenue it has an elevation of about 648 feet above sea level, or about 30 feet above the low water level in the Moorman gravel pit. If sufficient water in excess of the existing re quirements for the hydraulic canal could be made available and if the use of the Moorman pit could be obtained, moderate quantities of water could be run into the pit to produce recharge. The water could be led by gravity from the canal to the pit through a ditch or pipe line con structed for that purpose. Such an experiment would involve several considerations. A higher water level would probably increase the cost of digging and washing gravel. Flow of water from the canal would doubtless increase the amounts of silt and organic matter in the pit, unless the water were filtered. Continued operation of the pit would be desirable, as such operation would break up the silt seal and expose new surfaces through which water could percolate. The danger of bacterial pollution would be increased by such an operation, and there fore tests on water from the city wells would have to be made at frequent intervals.
The other method of artificial recharge that might be tried in this area is the construction of spreading grounds along the flood plains of the Miami River. Water either pumped from the Miami River or taken from the hydraulic canal might be spread over several acres and allowed to percolate into the ground. Such spreading grounds should be located near the heavily developed area where the ground-water level is below river level. There would be danger of bacterial pollution if untreated water were used, and the spreading grounds might be damaged in times of flood.
GROUND WATER IN SPECIFIC LOCALITIES 51
Artificial recharge to the deep water-bearing beds through shafts or wells might be attempted in the vicinity of the East Side works of the American Rolling Mill Co., where the water level is about 110 feet below the land surface. However, an adequate supply of water for recharging would have to be provided. As the water supply would have to be brought to the recharge wells through a pipe line or the hydraulic canal, the question may be raised as to the economic feasibility of such a pro ject, especially in view of the difficulties encountered in recharge wells in other areas.
MIAMI VALLEY BETWEEN MIDDLETOWN AND NEW MIAMI
The Miami Valley between Middletown and New Miami has a flat valley floor that attains a maximum width of about 5 miles between Trenton and Busenbark. (See pi. 1.) The major part of the valley floor is the top of a broad terrace of Wisconsin outwash. The Miami River has cut a new channel and flood plain about 20 feet below the general terrace level. The area is used entirely for agriculture and is supposed to be one of the finest farming areas in the two counties.
Just south of Middletown the Miami Valley is joined by the buried valley of the ancestral Todds Fork, which flowed northwestward from Camp Hagerman and the drainage basin of the present Little Miami River. It is reported that this valley is underlain by beds of clay and silt, deposited during Illinoian time, when the valley remained a lake because drainage was blocked by advancing ice.. The plant of the Crystal Tissue Co. is located at Excello, at the mouth
of this valley near the south wall. A number of wells have been drilled and in December 1940 about 2,500,000 gallons a day were being pumped from six wells, that ranged in depth from 56 to 110 feet. A study of logs of several wells in this locality shows that apparently several discon tinuous lenses of clay and silt are interbedded in the deposits of sand and gravel. The lenses of clay and silt occur at different elevations and are not present in all wells.
As the main part of the Miami Valley is used for agriculture, most of the wells have been drilled or driven for domestic and stock supply. As far as is known, moderate supplies of water can be obtained with little difficulty at shallow depths of not more than 30 feet. Although the ground water has not been developed extensively in this area, a moderate supply probably can be developed without much difficulty, particularly near the center of the valley.
The Miami Valley is joined several miles north of New Miami by the valleys of Sevenmile and Fourmile Creeks. Adequate supplies of water for domestic use and for farm supplies have been easily obtained in this area.
52 GROUND-WATER RESOURCES OF THE~ CINCINNATI AREA
NEW MIAMI
New Miami, a village several miles north of Hamilton on the north side of the Miami River, has grown up around the large coke plant and the two blast furnaces of the Hamilton Coke & Iron Co. The water supply for the plant has been developed from three wells ranging in depth from 169 to 177 feet and located in a 4,000 foot line parallel to the Miami River. About 4,500,000 gallons of water a day were pumped from these wells during 1939. Measurements of water level in a 6-inch test well are made at irregular intervals by the company, but the fluctuations of water level due to pumping the nearby supply wells are so great that no significant trend of water level can be determined. No serious de cline in water level has been reported during the past 3 years.
The municipal waterworks of the city of Hamilton is located just south of the Miami River and about 1 mile north of Hamilton. The plant was built in 1935 and consists of six individual wells and well houses, a pumping station and filtration plant, and a chemical building. Not more than three wells' are usually operated at one time. The average daily pumpage for this plant in December 194fr was about. 3,500,000 gallons a day. The wells are reported to be 133 to 186 feet deep.
An automatic water-stage recorder was installed on a 2-inch test well (85-7) near the west end of the well field on July 7, 1939, and has been maintained since that date. The fluctuations of water level are due largely to the particular wells or combination of wells that are being pumped. There is usually a fluctuation of water level of about 3 feet each day. (See fig. 9.)
The water level in the test well at the Hamilton waterworks has ranged from a low stage of 562.60 feet above sea level on December 14, 1940, to a high stage of 575.04 feet above sea level on April 18, 1939. (See fig. 12.) The water level in this well during the last week in July 1940 was about 2^ feet lower than during the same period in 1939; the pump- age from the well field during this week in 1939 was more than 1% times that during the same week in 1940. The apparent decline in water level from July 1939 to July 1940, is therefore, not as serious as it first appears. This comparison, however, tends to show that the pumpage from the well field of the Hamilton waterworks may be increased with out serious decline in water level.
Measurements of stage of the Miami River have been made at weekly intervals from the bridge on U. S. Highway 127, just south of New Miami and about 0.2 miles north from the Hamilton waterworks. The graphs of water level in the Miami River and in the test well at the waterworks show that the ground-water level is influenced in part by the river level, particularly during high stages of the river. The fluc tuations of ground-water level caused by pumping from the well fielda
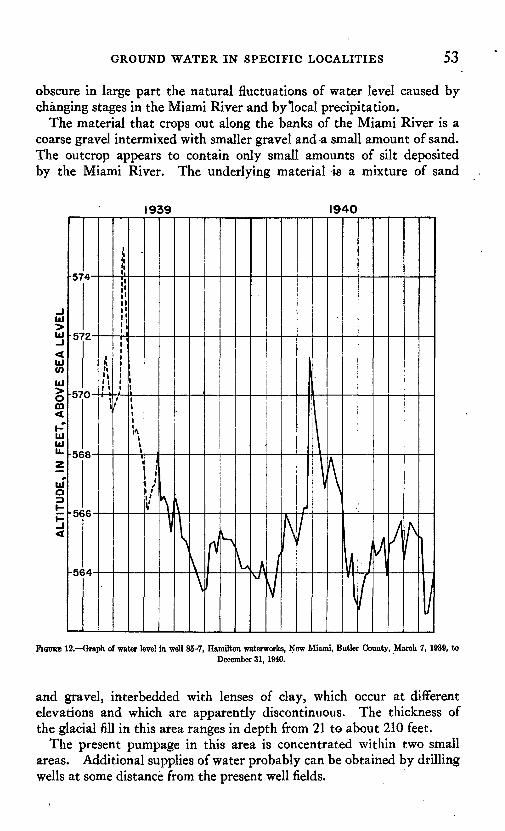
GROUND WATER IN SPECIFIC LOCALITIES 53
obscure in large part the natural fluctuations of water level caused by changing stages in the Miami River and by local precipitation.
The material that crops out along the banks of the Miami River is a coarse gravel intermixed with smaller gravel and a small amount of sand. The outcrop appears to contain only small amounts of silt deposited by the Miami River. The underlying material is a mixture of sand
1939 1940
FIGURE 12. Graph of water level in well 85-7, Hamilton waterworks, New Miami, Butler County, March 7; 1939, toDecember 31,1940.
and gravel, interbedded with lenses of clay, which occur at different elevations and which are apparently discontinuous. The thickness of the glacial fill in this area ranges in depth from 21 to about 210 feet.
The present pumpage in this area is concentrated within two small areas. Additional supplies of water probably can be obtained by drilling wells at some distance from the present well fields.
54 GROUND-WATER RESOURCES OF THE CINCINNATI AREA
HAMILTON *
The city of Hamilton stands on the banks of the Miami River about 22 miles north from Cincinnati. It is the county seat of Butler County. The population according to the 1940 census is 50,592. The principal industries are paper mills, foundries, and plants for making heavy ma chines, tools, and safes.
Some of the industrial plants obtain water from the municipal supply system, but most of the large plants pump water from private wells. The largest user of ground water is the Champion Paper & Fibre Co. plant, on the west side of the Miami River near Black Street (pi. 7), from whose wells [80(1-8)] are pumped almost twice as much water as is used for public supply. It has been estimated that during 1939 approximately 12,000,000 gallons a day were pumped in the city of Hamilton, not including the municipal supply outside the city limits of the water pumped by the Hamilton Coke & Iron Co. at New Miami.
The city of Hamilton stands on a broad terrace of Wisconsin outwash at an elevation of about 600-610 feet above sea level. The central part of the city is extremely flat. The Miami River flows through the western part of the city in a channel that is about 50 feet below the general terrace level. The river has been deepened through the heavily developed area by the Miami Conservancy District, as part of the larger flood-control plan in the Miami Valley. The river is relatively narrow through the build-up section of the city and flows through a channel the walls of which are protected by a concrete revetment.
The part of the city on the west bank of the Miami River lies mainly in a bowl-shaped embayment now drained by Twomite Creek. The floor of the valley appears to be a remnant of a partly dissected terrace about 640 feet above sea level. This embayment, the origin of which is not fully understood, is probably an extension of the buried bedrock valley. Two wells of the Champion Paper & Fibre Co. drilled in the valley of Twomile Creek failed to encounter rock at depths of 181 and 164 feet, or at elevations 405 and 435, respectively.
The depth to the floor of the bedrock valley apparently varies con siderably throughout the city. Leverett27 reported the maximum thickness of the drift at Hamilton as 210 feet. Fenneman 28 reported that one of the wells of the old city waterworks struck rock at a depth of 208 feet, or 360 feet above sea level.
The deepest part of the channel is probably under the western part of the city. Bedrock was encountered in one of the present wells of the Champion Paper & Fibre Co. at a depth of 212 feet, or 381 feet above sea level. It is reported that bedrock was encountered at a depth of
27 Leverett, Frank, Glacial formations and drainage features in the Erie and Ohio Basins: U. S. Geol. Survey Mon. 41, p. 361,1902.
28 Fenneman; N. M., The geology of Cincinnati and vicinity: Ohio Geol; Survey, 4th series, Bull. 19, p. 118,1916.
GROUND WATER IN SPECIFIC LOCALITIES 55
118 feet, or about 472 feet above sea level, in a well of the Beckett Paper Co. at Fifth and Buckeye Streets. The other wells in Hamilton on which data are aval'able do not reach bedrock.
The deposits filling the buried valley at Hamilton according to well logs are mainly sands and gravels with a few discontinuous lenses of blue clay and "conglomerate." The conglomerate is probably an extremely hard and gravelly boulder clay. A careful study of the available well logs fails to show any continuous bed of clay or impermeable material underlying most of the city. There are probably not two separate water-bearing formations, but water from tlie surface may reach the deeper gravels, from which it is later pumped.
An automatic water-stage recorder has been in operation on an aban doned well (89-3) at the Niles Tool Works of the General Machinery Corporation since July 25, 1938. The well is on the east bank of the Miami River, about 50 feet east of the river and about 100 feet south of the Black Street Bridge. The water level in this well has ranged from a high level of 567.20 feet above sea level on April 22, 1940, to a low level of 553.56 feet above sea level, on January 2, 1940. (See pi. 5.) Measurements of water level have been made at weekly intervals from a measuring point on the Black Street Bridge and show that the water level in the well of the Niles Tool Works fluctuates in the same manner as the stage of the Miami River. The ground-rwater level remains from 2 to 10 feet below the river level, owing to pumping from wells in the vicinity.
Measurements of water level have been made in one of the abandoned wells (86-7) of the old Hamilton public-supply well field just north of the city limits. The water level in this well, which is 113 feet deep, has ranged from a high level of 568.41 feet above sea level on April 25, 1939, to a low level of 560.34 feet above sea level on February 5, 1940. A continuous water-level record, obtained by an automatic water-stage recorder on this well, shows that the water level is affected only slightly by pumping from wells in the vicinity. The ground-water level is affected partly by a rising stage of the Miami River, although the rise in ground-water level is much slower and smaller than the corresponding rise in river stage.
The water level in well 86-6 at the old well field of the Hamilton public supply is generally from less than 1 foot to 10 feet*above the water level in well 89-3 at the Niles Tool Works. The water level in well 86-6 is apparently unaffected by pumping from the wells of the present public supply, about 1 mile north.
In the Miami River approximately due west of the old Hamilton well field, the Miami Conservancy District has constructed a concrete over flow dam about 7 feet high 29 to prevent gravel from drifting down into
29 Anonymous, The concrete overflow dam at Hamilton: Miami Conservancy Bulletin, vol. 4, No. 4, pp. 62-64, December 1922.
56 GROUND-WATER RESOURCES OF THE CINCINNATI AREA
the narrow part of the channel, which has been deepened for flood flow of the river. The Hamilton Gravel Co. operates a drag line to remove gravel from the river. It is believed that this breaks up any silt seal and allows more water to seep into the deeper gravels than would naturally seep into them. However, as the water level in well 86-6 has remained about 10 feet below the water level in the river above the dam and as the ground-water level responds rather slowly to rises in the river, apparently only a small recharge enters the ground from the river north of the dam.
The channel of the Miami River through Hamilton from Black Street Bridge to beyond High Street Bridge has been deepened by the Miami Conservancy District. Even now the principal action of the river is a scouring of its present bed, especially during high stages. During high stages of the river silt that may have been deposited during low stages is probably removed and the bottom of the river cleaned suffi ciently to allow rapid recharge, as shown by the rapid rises in water level in well 89-3.
The Champion Paper Co. has five wells along the west bank of the Miami River, starting slightly south of Black Street Bridge and ex tending north almost to the overflow dam. Two additional wells extend in a line that runs west from the Miami River up the valley of Twomile Creek. In December 1940 the company obtained its supply from five wells that range from 158 to 181 feet in depth. The static level and pumping level in four of the wells are measured with a pressure gage by the company at frequent intervals. The fluctuations of static water level as determined by the measurements in well 80-5, which is aban doned, appear to be fairly closely related to changes in stage of the river, although the water level in well 80-5 is as much as 60 feet below river level.
All the wells penetrate one or more layers of clay between the surface and the formation from which water is pumped. However, the layers are probably not entirely continuous and probably allow at least some water from the surface to reach the deeper gravels.
In the wells of the Champion Co. that run in a line parallel to the main axis of the valley the water table is reversed and slopes toward the north. This may be due to a cone of depression that has been de veloped around well 80-4, the yield of which is greater than that of wells on either side of it. In the line of wells that extends west, away from the river, the water table apparently slopes away from the river toward wells 80-7 and 80-8. The slope may also be due to heavy pumping from wells 80-7 and 80-8 and to recharge by water that seeps out of the river channel south of Black Street Bridge.
The water obtained from the Champion wells is probably from a water-bearing formation that is separated, in part, from the formation
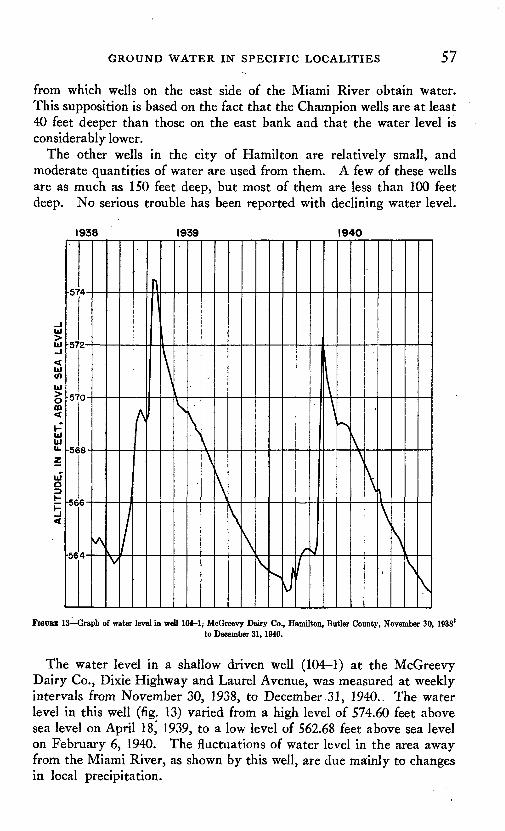
GROUND WATER IN SPECIFIC LOCALITIES 57
from which wells on the east side of the Miami River obtain water. This supposition is based on the fact that the Champion wells are at least 40 feet deeper than those on the east bank and that the water level is considerably lower.
The other wells in the city of Hamilton are relatively small, and moderate quantities of water are used from them. A few of these wells are as much as 150 feet deep, but most of them are less than 100 feet deep. No serious trouble has been reported with declining water level.
1938 1939 1940
574
572
570
-568
566
564
\\ \
\FIQUBE 13 Graph of water level in well 104-1; McGreevy Dairy Co., Hamilton, Butler County, November 30, 1938'
to December 31,1940.
The water level in a shallow driven well (104-1) at the McGreevy Dairy Co., Dixie Highway and Laurel Avenue, was measured at weekly intervals from November 30, 1938, to December 31, 1940.. The water level in this well (fig. 13) varied from a high level of 574.60 feet above sea level on April 18, 1939, to a low level of 562.68 feet above sea level on February 6, 1940. The fluctuations of water level in the area away from the Miami River, as shown by this well, are due mainly to changes in local precipitation.
58 GROUND-WATER RESOURCES OF THE CINCINNATI AREA
The ground water pumped from wells in Hamilton and vicinity prob ably is derived mostly from local precipitation and from the Miami River, which, during high stages, enters the ground within a compara tively short distance of the pumped wells'. Undoubtedly, the general underflow of the Miami River, flowing in a southwesterly direction down the natural slope of the water table, contributes some water that is recovered by the wells. The soils that cover the valley are generally sandy and gravelly, loams, through which water may readily percolate. The materials underlying the soils in most of the valley are sands and gravels, which allow ample storage for local precipitation.
A steep cone of depression has been developed in the vicinity of the well field of the Champion Paper Co. because of heavy pumping of ground water for many years. The water level in the well field of the Champion Paper Co. was reported in 1937 30 to have declined about 90 feet since 1916. The few available measurements of water level show that most of the decline occurred during the period 1923 to 1926. A comparison of static water levels measured in 1931 and 1939 in four wells shows that during this period the water level declined in two wells, 4 and 6 feet, respectively, and rose in two wells, 10 and 11 feet, respect ively. The pumpage from these wells was probably much greater during 1931 than during 1939. In December 1940, as a result of certain methods of reusing and conserving water, the Champion Paper & Fibre Co. is having little or no trouble in obtaining sufficient water from its wells.
The water level in the old well field of the city of Hamilton is reported to have declined 27 feet, or about 2 feet per year, from 1916 to 1929. Measurements of water level in five wells installed in 1927 show a de cline in water level of from 4^ feet to 17^ feet during the period 1927 to 1935, when the well field was abandoned. Measurements of water level that are being made in well 86-6 show that the water level is at present as high as in 1927, or even higher.
The problem of declining water level in the city of Hamilton appears to have been somewhat overemphasized. During the 2 years of in tensive investigation the water level did not decline seriously, and ad ditional supplies of water may be obtained in the area. The most favorable locations appear to be in the level tract just north of the city, but small to moderate supplies can be obtained almost anywhere in the city if care is taken to drill new wells as far as possible from existing wells.
MIAMI VALLEY SOUTH OF HAMILTON
The Miami Valley south from Hamilton to the Butler-Hamilton County line (pi. 1) is about 1}^, miles wide near Hamilton but becomes
30 Questionnaire sent out by the Hamilton Chamber of Commerce.
GROUND WATER IN SPECIFIC LOCALITIES 59
slightly narrower near Venice. The main part of the valley floor is a terrace at an elevation of about 570 feet above sea level. As the area is well suited for agriculture many farms have been developed in it. Several pits have been opened for sand and gravel, but only one pit, operated by the South Hamilton Sand & Gravel Co. (E) was being worked at the time of this investigation.
The abandoned valley of the ancestral Ohio River flowing north and west from Cincinnati, up the present valley of Mill Creek, joins the Miami Valley near Symmes, several miles south of Hamilton. Although there is no definite separation between the two valleys, the Mill Creek Valley may be considered to end approximately at the 600-foot contour line, which extends southward from the east wall of the valley at Hamil ton.
The valley is underlain by deposits of fairly coarse sand and gravel. Local drillers have found clay in many wells, but the clay lenses are apparently not continuous over a large area and appear to be less wide spread than in the Mill Creek Valley. The total thickness of glacial fill in this area is not definitely known as no well has been drilled to bed rock. However, as bedrock in Hamilton was struck at an altitude of 370 to 380 feet above sea level and as it probably would be found about the same altitude in this area, the glacial deposits are probably 170 to 220 feet thick.
Many small wells have been drilled for farm and domestic use but no large development of ground water has been made in the area. The quantity of water pumped is therefore small and the water supplies are not overdeveloped.
Water levels have been measured in several wells and in two gravel pits at regular intervals during the period of investigation. The fluctua tions of water levels in this area are shown in figure 14. In general the fluctuations of water level in this area are due mainly to fluctuations in local precipitation, although a rise in stage in the Miami River may cause a rise in water level in wells near the river.
The water level in well 117 has ranged from a low of 29.76 feet below the measuring point, or an altitude of 554.04 feet above sea level, on December 31, 1940, to a high of 21.24 feet below the measuring point, or an altitude of 562.56 feet above sea level, on May 2, 1939. The high stage in May 1939 was 0.13 foot higher than the high stage on April 23, 1940. The low stage of December 1940 was about the same as the low stage of February 6, 1940, and 1.2 feet lower than the low stage of January 3, 1939.
The graph of water level in pit E shows fluctuations of water level typical of this area. Before the present staff gage was installed oc casional measurements of water level in the pit were made by J. T. Alexander, drag-line operator of the South Hamilton Sand & Gravel Co.
745213 48 5
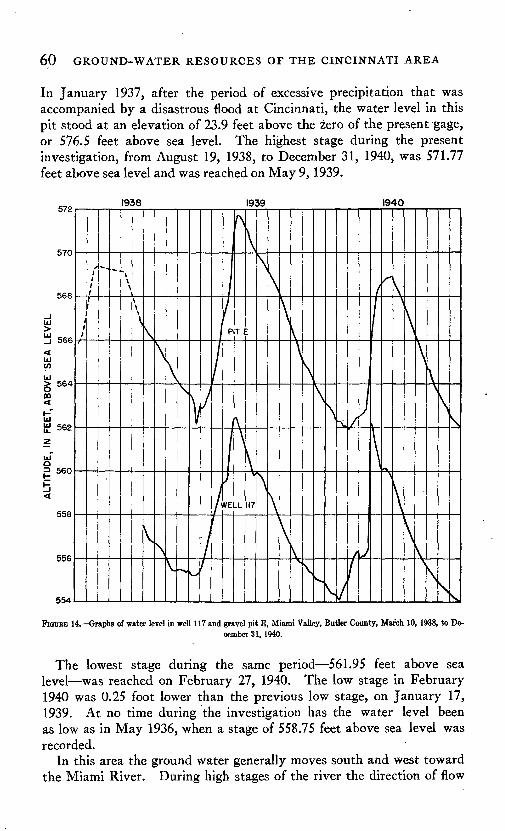
60 GROUND-WATER RESOURCES OF THE CINCINNATI AREA
In January 1937, after the period of excessive precipitation that was accompanied by a disastrous flood at Cincinnati, the water level in this pit stood at an elevation of 23.9 feet above the zero of the present gage, or 576.5 feet above sea level. The highest stage during the present investigation, from August 19, 1938, to December 31, 1940, was 571.77 feet above sea level and was reached on May 9,1939.
5721938 1939 1940
554
FIOUBB 14. Graphs of water level in well 117 and gravel pit E, Miami Valley, Butler County, March 10, 1938, to De cember 31, 1940.
The lowest stage during the same period 561.95 feet above sea level was reached on February 27, 1940. The low stage in February 1940 was 0.25 foot lower than the previous low stage, on January 17, 1939. At no time during the investigation has the water level been as low as in May 1936, when a stage of 558.75 feet above sea level was recorded.
In this area the ground water generally moves south and west toward the Miami River. During high stages of the river the direction of flow
GROUND WATER IN SPECIFIC LOCALITIES 61
may be reversed, and water probably percolates from the river to the water-bearing beds. -
The great thickness and character of the material filling the buried valley, the relatively small amounts of clay reported, and.the present small pumpage indicate that probably a moderate to large quantity of water could be pumped from wells without serious depletion of the available supply. Care should be taken3, however, to spread wells sufficiently far apart and not to create a cone of depression that would extend as far north as Hamilton and possibly interfere with the existing wells in the city.
DIVIDE ABEA BETWEEN MIAMI VALLEY AND MILL CEEEK VALLEY
The area between the Miami Valley and the north end of Mill Creek Valley has been referred to as the "divide area." (See pis. 1 and 9.) This term denotes merely a drainage divide or an imaginary line from which the land surface slopes down in opposite directions. The profile of the land surface is shown in plate 10. A study of measurements of water level made in a number of wells in this area shows also a ground- water divide, on one side of which ground water drains toward the Miami River and on the other toward Mill Creek.
The land surface in Mill Creek Valley is not as flat and level as in the Miami Valley. The south and west wall of the valley is concealed by morainic deposits of Wisconsin age. The moraine parallels the valley wall as far south as Hartwell and is characterized by small hummocks and gentle knobs of boulder clay rising 40 to 60 feet above the general land surface. A few kames have been identified, and the evidence indicates that the ice front remained stagnant for some time in this valley. Similar deposits probably were left in the Miami River, but have been removed by erosion.
The Mill Creek Valley may be said to end on the. east side of the Miami Valley along a line extending south from the prominent bluff east of Hamilton to the prominence near Symmes. The Miami Valley to the west is 20 to 30 feet lower than the Mill Creek Valley to the east, which now remains as a terrace. The section of Mill Creek Valley between the Miami Valley and Flockton is not drained by any natural stream. As the only drainage at present is through the abandoned Miami and Erie Canal considerable difficulty is encountered in disposing of excess flood water in spring. In some years water floods the fields and re mains for several months, thereby causing great damage to crops.
The glacial outwash underlying the divide area is at least 227 feet thick and may be thicker in certain localities because of higher surface elevations. Most of the material is sand and gravel, although con siderable clay has been encountered in several wells. Clay is apparently thicker in the divide area than in the Miami Valley.
62 GROUND-WATER RESOURCES OF THE CINCINNATI AREA
Many wells have been drilled for domestic and farm supplies and in most places sufficient water has been obtained. In a small area about 0.7 mile east from Symmes several wells have encountered natural gas from buried swamps in the glacial deposits. Small amounts of natural gas still escape from the water in the well at the Fairfield School in this area.
Numerous measurements of water level and the few available well logs show that a fairly continuous bed of clay extends from the end of Mill Creek Valley about as far as U. S. Highway 127. This clay, which is exposed in the gravel pit of the South Hamilton Sand & Gravel Co. (pit E), is a boulder clay and contains angular pieces of rock. The water levels show also that the water table slopes more steeply here than at any other place in the valley, suggesting that the water in the shallow water-bearing beds drops , suddenly over the end of the clay bed to the deeper water table. The clay apparently was eroded by the Miami River during the late Wisconsin epoch.
The area east of the Dixie Highway, Ohio Route 4, is underlain in many places by two water-bearing formations. The clay bed that crops out in the South Hamilton pit appears to be continuous enough to cause at least one perched water table. In the area of moraine deposits several other small bodies of ground water are perched. As much of the land is underlain by clay and is poorly drained, water often stands in the fields for considerable periods of time.
The actual surface drainage divide is rather poorly defined but probably is along the section line between sees. 23 and 17, Fairfield township. Along this line a long gravel-capped hill extends southward partly across the valley. A low broad ridge also extends northward partly across this valley. The T ow saddle in the topographic divide is 600-610 feet above sea level. East of this saddle, Mill Creek enters the valley from the north side and flows eastward and southward.
The ground-water divide may not be so easily located as its position is subject to change during different seasons of the year, depending on the source and amount of recharge. The ground-water divide in the shallow water-bearing formation occurs normally along the road through Flockton, through the centers of sees. 16 and 17, Fairfield township. Water in the shallow beds east of this divide flows east and south into Mill Creek Valley, while the water west of the divide flows into the Miami Valley.
The ground water in the deeper water-bearing beds is separated from the water in the shallow beds by a layer of clay that is at least 50 feet thick in some places, as determined by two test wells drilled by the Geological Survey at Flockton. The layer of clay is apparently fairly continuous over a broad area, as two separate water levels exist throughout Mill Creek Valley. From a theoretical consideration of the geologic history
GROUND WATER IN SPECIFIC LOCALITIES 63
of the area, the clay may represent a deposit of glacial till that was laid down by the ice as it passed over the area. In addition, during the periods when the northward-flowing drainage was blocked by advancing ice, water was ponded in the deep valleys and a fine silt was able to settle. During the Wisconsin stage of glaciation the great amount of water from the melting ice front probably cut holes and channels in the clay, at least in some places, and these were later filled with Wisconsin outwash of sand and gravel. Therefore, under a large part of the valley direct vertical percolation from the surface to the deeper gravels is possible only through small areas where the clay is absent. Water seeping downward from the surface moves vertically downward until if en counters the impermeable clay layer, then drains horizontally toward the lowest point in the clay layer and through a channel or hole into the deeper water-bearing formation.
The ground-water divide in the deeper water-bearing beds occurs in about the same position as that in the shallow formation. However, during periods of heavy precipitation and recharge, the divide migrates westward and during prolonged dry periods it moves eastward. The difference in position of the divide during wet and dry periods is about 1 mile. The highest water level in the deeper formation in this area in a Geological Survey test well at Flockton on April 25, 1940, was 5.05 feet below the top of the casing, 598 feet above sea level.
The graphs of water levels in wells in both the shallow and deeper water-bearing beds (pi. 8) shows that the water level in this area may fluctuate as much as 18 feet during the year. The similarity in fluctua tions of water level in the shallow water-bearing beds, as shown by the curve for well 160-2, and in the deeper formation, as shown by the curves for wells 151-1 and 151-2, indicates that somewhere in the vi cinity of these wells water from the shallow beds may percolate to the deeper beds. It is interesting to note that during the storm of April 1940 the water level in wells 151-1 and 151-2 began to rise within several hours after precipitation had started. Although the water levels in both deep and shallow wells fluctuate in a similar manner, the water level in the deeper beds has remained considerably below the level in the shallow beds. This suggests that water is moving more rapidly in a horizontal direction through the deeper beds than by vertical percola tion from the shallow beds.
The rapid rise in water level in April 1940 suggests that water from the surface is able to reach the deeper water-bearing formation within a short distance of the well. The hole in the layer of clay is probably between Flockton and the north wall of Mill Creek Valley. Near this hole Mill Creek enters the valley from the uplands and during the April storm a large flow of water came down the creek and probably entered the ground near the north wall of the valley
64 GROUND-WATER RESOURCES OF THE CINCINNATI AREA
The fact that a ground-water divide exists between Miami Valley and Mill Creek Valley is important in that, the divide prohibits the percolation of water to the underground reservoir in the Mill Creek Valley from the Miami River or from the Miami drainage basin and therefore limits the available supply of water in the valley to local pre cipitation within the limits if the Mill Creek drainage basin.
In December 1940 no large quantities of ground water were being pumped from this area, but moderate quantities probably could be de veloped. However, as the ground-water supply is limited, the with drawal of large quantities in the north end of Mill Creek Valley would decrease the quantity that slowly passes southward and becomes avail able to the industrial areas of Lockland and Reading. Pumping large quantities east of the ground-water divide will move the divide west ward and lower the hydraulic gradient in Mill Creek Valley. Similarly, pumping large quantities west of the divide will shift the divide east ward and reduce the area that contributes water to the Mill Creek valley. It appears more practical to develop the water supply in the Miami Valley several miles west of the divide, where the water-bearing formations might be recharged more easily with water from the Miami River.
MILL CREEK VALLEY
UPPER MILL CREEK VALLEY
The Upper Mill Creek Valley includes the part of the valley north of the industrial centers of Wyoming, Lockland, and Reading. (See pis. 9 and 11.) The area is agricultural except in the southern part, and at present no large supplies of ground water are used north of Sharon Avenue. In the past, paper mills at Rialto and Crescentville pumped moderate quantities of ground water, but these mills are now abandoned. The present consumption of ground water is from the deeper water bearing formation between Sharon Avenue and Lockland and includes the public supply of the village of Glendale and water pumped by the Drackett Chemical Co., the Big Four Railroad at Sharonville and Even- dale, and the Tennessee Corporation.
As the west side of the valley is covered by a glacial moraine of Wis consin age, the actual boundaries of the bedrock valley are not easily determined. The western slope of the valley wall is hummocky, with small knobs of boulder clay and kame deposits rising 20 to 30 feet above the general slope. The east wall of the valley which rises rather steeply from the flat floor of the valley, is more prominent.
Two water-bearing formations extend throughout the area, and several small bodies of perched water are also present in the moraine deposits. The two fairly consistent water levels suggest that the bed of clay separating them is present under most of the area. On the other
GROUND WATER IN SPECIFIC LOCALITIES 65
hand, the rapid recharge after periods of heavy precipitation shows that the layer of clay is absent in places or is sufficiently permeable to allow water to pass through it to the lower water-bearing formation. The ground water generally moves southward toward the heavily pumped area in the central and lower parts of the valley.
The glacial fill in the bedrock valley varies in thickness because of differences in surface elevation. The elevation of the deepest part of the bedrock valley is believed to be about 360 feet above sea level. In a test well of the Geological Survey at Flockton, bedrock was encountered at a depth of 227 feet, or 373 feet above sea level, but it is not certain that the test well is in the deepest part of the bedrock valley. It is reported 31 that a gas boring in Lockland struck rock at a depth of 190 feet, or 356 feet above sea level. As the ancestral Ohio River flowed northward up the Mill Creek Valley, the elevation of the deepest part of the bedrock valley must be as deep at the north end as at Lockland.
Water levels have been measured in a number of wells in this area and the graphs of water level in some of them are shown in figure 15. The principal fluctuations of water level in both the shallow and the deeper water-bearing beds appear to be closely related to local precipi tation. Wells 173 and 180 are deep, and the water levels in them re flect the artesian head in the deeper water-bearing formation. Wells 165-2 and 175 are shallow and reflect the water table in the shallow beds. The annual range in water level in both shallow and deeper formations has been about 12 feet, the maximum stage usually being reached in March or April and the minimum in December or January. The water level declines generally throughout the growing season and during the fall until the deficiency in soil moisture is replenished. Re charge usually occurs rapidly during the period from January to May. During the period of record since 1938, the lowest water level reached each year in certain shallow wells has been 1 to 3 feet lower than that of the previous year. This apparent decline is due in large part to deficient precipitation during the summer and fall of 1939 and 1940. The water levels in the deeper formation have declined about the same amount.
In the area between Crescentville Road at the Butler-Hamilton County line and Kemper Road, 1 mile south, the water table in the shallow water-bearing beds and the piezometric surface of water from the deeper formation are about the same elevation during most of the year. (See pi. 10.) The water-level profiles in this area are based on two shallow bored wells on Crescentville Road (T-74, T-75), two shallow, bored wells on Kemper Road (T-67, T-68), and wells at Crescentville (180) and about a quarter of a mile north of Kemper Road (204-3).
11 Leverett, Frank, Glacial formations and drainage features of the Erie and Ohio Basins: U. 8. GeoL Surrey Mon. 41, p. 320,1902.
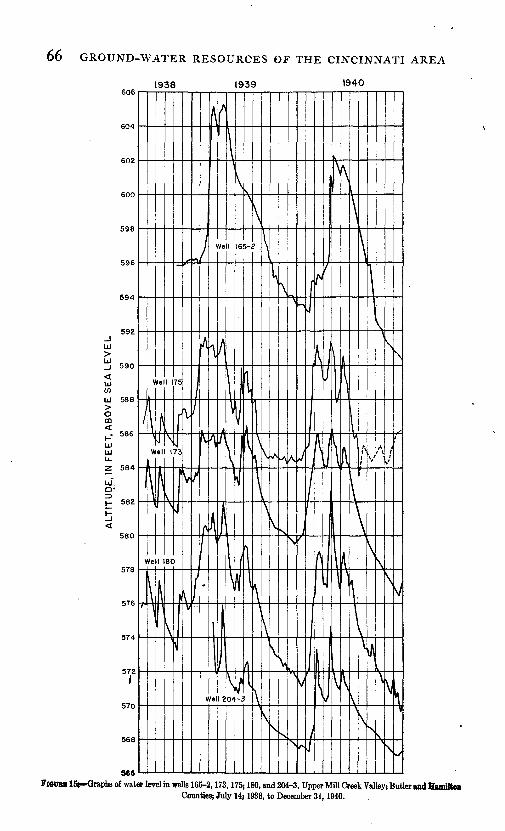
66 GROUND-WATER RESOURCES OF THE CINCINNATI AREA
1938 1939 IS40606
568
566FMTOBB 16^-Graphs of water level in wells 165-2,173,1755 180, and 204-3, Upper Mill Creek Valley; Butler and Hsnultoo
Counties; July 14; 1938, to December 31,1940.
GROUND WATER IN SPECIFIC LOCALITIES 67
The deep well at Crescentville has a measured depth of 90 feet, and the log of the well shows that it ends at bedrock. The well is gravel-packed and has been abandoned for several years. The deep well (204-3) north of Kemper Road was drilled in 1936 for the Farm Security Administra tion in connection with the proposed development of a water supply for a resettlement project at Greenhills. The supply was never developed from this source, and the well has been capped and abandoned.
, This well was reported to be 108 feet deep, but the depth was measured as 132 feet. The log of the well shows that bedrock had not been en countered at 108 feet, but as nearby wells encountered rock at depths of 110-135 feet this well probably extends to bedrock.
The fluctuations of water level in well 175, which is shallow, are very similar to those in wells 173, 180, and 204-3. (See fig. 15.) The water level in all the wells rises rapidly after a period of heavy precipitation or during high stages of Mill Creek. The general curve of water level throughout the year is extremely irregular and differs greatly from curves of water level in wells south of Sharon Avenue.
On the other hand, the log of well 180 shows beds of clay and hardpan from the surface to a depth of 53 feet. The log of well 204-3 shows 10 feet of brown clay at the surface and several impermeable layers at different depths. Somewhere near these two deep wells a glacial stream probably cut through the Illinoian beds of clay and till. The channel was later filled with sand and gravel and now acts as a conduit to allow water to pass through the clay beds to the deeper gravels.
The next deep well south (207-3) at the Glendale waterworks has a measured depth of 167 feet. (See pi. 11.) The water level in the deep water-bearing formation is about 10 feet lower than that in the shallow beds, as shown in well 207-5, a shallow test well bored by the Geo logical Survey. (See fig. 16.) This well is not more than 10 feet away from well 207-1, which is deep and from which most of the public supply is pumped. The water level in well 207-5 shows no fluctuations that are due to pumping, whereas the water level in well 207-3 fluctuates about 7 feet when well 207-1 is pumped. These data indicate that in this area the two water-bearing formations are separated.
About 1 mile farther south a deep well (212-1) has been drilled on the property of the Johns Manville Corporation, about one-tenth of a mile north of Glendale-Milford Road. This well has a measure depth of 177 feet and is not used at the present time. An automatic water-stage recorder has been in operation on this well since October 14, 1938. A shallow test well (212-2) was bored by the Geological Survey about 6 feet south of the deep well in November 1939. Measurements of water level in the two wells show that the water level in the deep well is usually about 12 feet below the water level in the shallow well. The water level in the deep well shows fluctuations that are due to the pumping
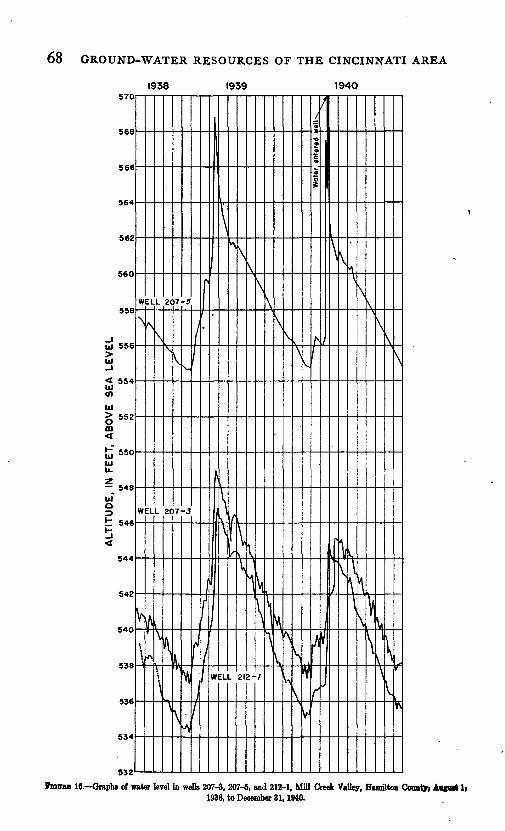
68 GROUND-WATER RESOURCES OF THE CINCINNATI AREA
1938 1939 . 1940570
568
566
564
562
560
558
UJ 556
< 554 UJ<nUl> 552
CD<X
550
- 548
>= 546
544
542
540
538
536
534
532
WELL 207-5\
V
\ V
\
FMUM 10. Graphs of water level in wells 207-3, 207-5, and 212-1, Mill Creek Valley, Hamilton County, Amort 1(1938, to December 31,1940.
GROUND WATER IN SPECIFIC LOCALITIES 69
of the Sharonville and Evendale wells of the Big Four Railroad and of wells of the Tennessee Corporation and at the Glendale waterworks. The fluctuation that is due to pumping generally amounts to less than a foot. The water level in the shallow well shows no fluctuations that are due to pumping.
The difference between the water levels in the deep and shallow for mations in the wells (215-1, 215-2) of Harry F. Pittman, about three- quarters of a mile south of well 212, is somewhat greater, averaging about 15 feet through most of the year. The difference between the water table in the shallow beds and the piezometric surface in the deeper beds becomes greater toward Lockland, because of the cone of depres sion developed by heavy withdrawal of ground water from the deeper water-bearing beds in Lockland. The effect of the heavy pumping in the Lockland area probably extends as far north as Sharon Avenue.
The slope of the water table in the shallow beds also increases toward Lockland about the same rate as that of the piezometric surface of water in the deeper beds. The similarity in slope suggests that water frotn the shallow beds is draining into the deeper formation somewhere imder Lockland and Reading. From the Glendale-Milford Road south' to Carthage the water level in Mill Creek is considerably above the water table in the shallow water-bearing beds during much of the year. , This condition suggests that comparatively little water seeps from the } creek into the ground during normal stages of the stream.
The general slope of the piezometric surface in the deep water-bearing formation has been disturbed in the vicinity of Sharon Avenue by plump ing wells at the Glendale waterworks and the Sharonville roundhouse of the Big Four Railroad. Pumping at the pknts of the Joslin-Schmidt Corporation .and from the wells of the city of Reading have also caused minor irregularities.
In April 1939 and April 1940 two severe storms in Mill Creek Valley caused Mill Creek to overflow its banks and to flood many of tike ad jacent fields between Crescentville Road and Jackson. Road. The Jwater levels in both deep and shallow wells rose rapidly, a maximum cise of about 16 feet being measured in a test well .along the Glendale-Milford Road in 1939 and a maximum rise of about 20 feet in the same well in 1940. A detailed analysis of the storm of April 1940 shows that during the period April 17-20, inclusive, precipitation was measured a$ 4.74 inches at the Abbe Observatory, 4.25 inches near Mount Healthy!, 4.43 inches at Kemper and Mostellar Roads, and 6.16 inches at Hamilton. The greatest amount of precipitation fell on April 19, and the maximum hourly rate occurred between 9 a. m. and 2 p. m. on April 19.
At the time of the April storm the ground was at least partly thjawed. Freezing weather occurred on April 14, but the following daysLwerc warm. The precipitation during February and March had been about
70 GROUND-WATER RESOURCES OF THE CINCINNATI AREA
normal and the deficiency in soil moisture had been satisfied. As the growing season had not yet begun, losses of water by evaporation and transpiration by plants were at a minimum. The water levels in a number of wells, especially those north of Sharon Avenue, had already risen several feet above the low level of the winter that was reached early in February. Conditions for recharge were unusually favorable.
In the upper end of Mill Creek Valley the water levels in both deep and shallow wells rose abruptly. In a deep test well (150-1) at Flock- ton, the water rose about 7 feet in 1 day and a total of about 15 feet in 4 days. (See fig. 7.) This rise is rather surprising, as the log of the well shows 50 feet of clay at the surface. However, the clay layer separating the two water-bearing formations probably is not present in an area just north of the well. The place where the clay is a.bsent acts as a conduit to allow water from the surface and from the shallow for mation to pass into the deeper beds.
In the area between Princeton Pike and Sharon Avenue the rise in water level during this period was surprisingly small, the maximum rise being 4 feet in a well (165-2) on Princeton Pike. This small rise in water level is probably due at least in part to the fact that the level in both deep and shallow wells was fairly close to the surface and that the underground reservoir had already been filled by precipitation in early March. As there was no more available storage space the water flowed to Mill Creek and southward down the valley and added to the flooding south of Kemper Road.
In the area between Kemper Road and Lockland the water levels in both deep and shallow wells rose rapidly, the maximum rise in a shallow test well along the Glendale-Milford Road being 20.1 feet in 2 days. The level in a deep well (212-1) rose 7 feet and in seven other shallow wells in the vicinity rose more than 10 feet during the same period.
The recharge to the shallow water-bearing beds apparently occurred mainly along the creek in the area north of Sharon Avenue. At Kemper Road the maximum rise in water level occurred in well T-68, which is on the east bank of Mill Creek. At Sharon Avenue the maximum rise occurred between the Glendale waterworks and Mill Creek. The water level in a well (T-46) about one-quarter of a mile east of Mill Creek did not reach its maximum stage until June 10, whereas the water levet in well 207-5 at the Glendale waterworks reached its maximum stage on April 20. This indicates that most of the recharge entered the ground in the west side of the valley between the Glendale waterworks and the Pennsylvania R. R. embankment.
Along the Glendale-Milford Road the maximum rise in water level occurred in well T-8A, which is approximately 1,500 feet west from Mill Creek. A profile of the water level in the shallow beds along the Glen dale-Milford Road shows that before the storm the water table sloped
GROUND WATER IN SPECIFIC LOCALITIES 71
in most places from Mill Creek toward the center of the valley and reached its lowest level in well T-8A. On April 20, the day on which most of the water levels in these wells reached their highest stages, the general slope was reversed and the water table sloped away from well T-8A in both directions. This indicates that most recharge occurred in the center of the valley and that the underlying material is probably more permeable in the center than along the sides of the valley.
Little recharge occurred in the area between the Glendale-Milford Road and Jackson Road, probably because this area was not as com pletely flooded as the adjacent areas. The water level in well 215-1 did not begin to rise until April 21 and did not reach its high stage until May 6. This suggests that the rise in water level was due to recharge that entered north of the Glendale-Milford Road and flowed under ground south to this well.
The water level in the wells in the deeper water-bearing beds rose abruptly shortly after the rain of this storm began. Unfortunately the record at the Glendale waterworks was lost, as the flood water rose high enough to cover the well. In well 212-1 a rise in water level of almost 7 feet was recorded in 36 hours, beginning about 4 p. m. on April 19. This time corresponds to the time when the surrounding fields became flooded. That this rise is due mostly to recharge and not to a loading effect is shown by the fact that the water level in this well remained about at its maximum stage for almost a month before begin ning to decline at the usual rate during the summer.
The water level rose about 3J^ feet in well 215-2, a deep well on the farm of Harry F. Pittman, between April 15 and April 20. The water level at this locality at first rose much more rapidly in the deep well than in the shallow well.
A recorder has been maintained on well 218-3 at the Joslin-Schmidt Co. since March 3, 1940. The water level in this well, which has a measured depth of 143 fee.t, fluctuates about 1 J/£ feet as a result of pump ing from a nearby well (218-5), and therefore it is difficult to determine how much of the fluctuation may be due to recharge. The water level in this well rose abruptly about 2 feet on April 19. (See fig. 17.) It rose abruptly again on April 27 and continued in general to rise until the last week in May. The recharge shown in this well probably oc curred somewhere north of Glendale-Milford Road.
During the 2J^ years of record the water levels in both deep and shallow wells in the Upper Mill Creek Valley area have been raised con siderably by one storm a year that has occurred when conditions for recharge were exceptionally favorable. In both storms Mill Creek has overflowed its banks and has caused considerable flooding of the valley. In spite of these periods of exceptional recharge the water levels in general have declined, in some wells as much as 3 or 4 feet during the period.
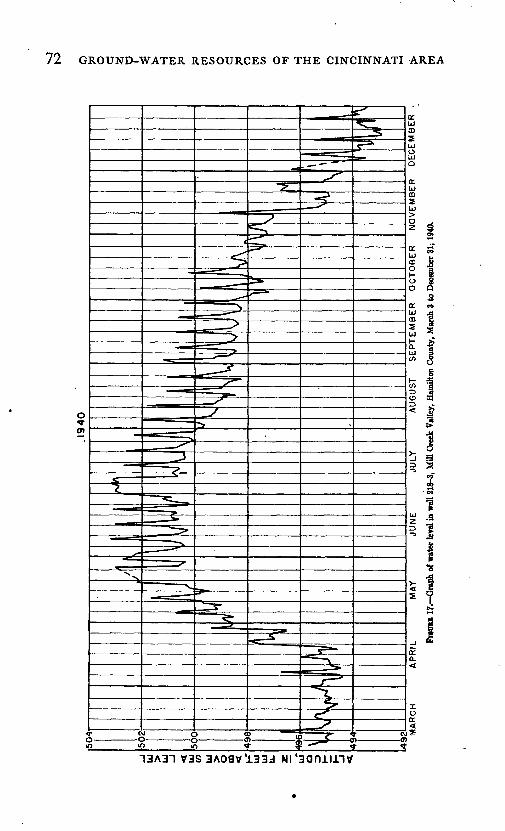
72 GROUND-WATER RESOURCES OF THE CINCINNATI AREA
13A31 vss 3Aoav'i33d Ni'sonnnv
GROUND WATER IN SPECIFIC LOCALITIES 73
Most of the decline may be attributed^ to the heavy pumping from wells and overdevelopment in the Lockland area and to deficient precipitation during the summers of 1939 and 1940. It is important to consider what the situation during the past 2 years might have been if the two storms that caused an unusually large amount of recharge to the water-bearing beds had not occurred when conditions for recharge were favorable or if they had not occurred at all. Much has been said in recent years about flood control in Mill Creek Valley, and plans have provided for holding back flood waters north of Sharon Avenue. If this were done, the area just north of> the Glendale-Milford Road would not be flooded in the future and much less recharge would probably reach the water bearing formations. That the water levels have declined in spite of large recharge during the past 2 years suggests that the area has been developed beyond its capacity to supply water to wells. Even under the same conditions that have prevailed during the past 2 years the water levels in Mill Creek Valley probably will continue to decline. With increased industrial development in Mill Creek Valley and with deficien cies in precipitation, water levels in both deep and shallow formations may decline rapidly and the supply may become seriously depleted. The results of this investigation indicate that consideration should be given to the development of an additional source of supply to furnish water for increased industrial and municipal use in Mill Creek Valley.
WYOMING-LOCKLAND-READING
The village of Wyoming and the cities of Lockland and Reading, just north of the city limits of Cincinnati, extend across Mill Creek Valley (pi. 12) and comprise an area from which large quantities of water are pumped from wells for municipal and industrial use. According to the 1940 census the population of Wyoming was 4,466, of Lockland 5,601, and of Reading 6,079. Wyoming is mainly a residential town and has no large industrial plants within its limits. The public supply is taken from four deep wells at the Wyoming waterworks on Vine Street, which, also supplies water for the city of Lockland and the village of Arlington Heights. The average daily pumpage in 1939 was about 740,000 gallons. Lockland is mainly an industrial center, in which are located several large paper mills, a roofing plant, a mattress factory, and other smaller industrial plants. Reading is also mainly industrial, although it con tains fewer industrial plants than Lockland. The municipal water supply is taken from two wells in Koenig Park, near the north corporation line. The average daily pumpage in 1939 was about 350,000 gallons.
The east or main branch of Mill Creek that separates Reading and Lockland, flows through the area about one-third of the distance across the valley from the east wall of the valley. The West Fork of Mill Creek, having its drainage basin mainly in the uplands west of the main
74 GROUND-WATER RESOURCES OF THE CINCINNATI AREA
Mill Creek Valley, enters the valley just north of Wyoming, flows through the western part of Lockland, and joins the East Fork just south of Amity Road, the southern corporation limit of Reading and Arlington Heights.
On the west side of the valley the outlines of the ancient bedrock valley are obscured by the continuation of the Wisconsin moraine. The two cities and the village stand on a relatively flat terrace about 560 feet above sea level. Mill Creek and the West Fork have cut channels from 20 to 30 feet below the general terrace level. The east wall of the valley rises rather abruptly, although there are small remnants of a higher Illinoian terrace, about 640 feet above sea level.
The glacial deposits underlying the area are about 180-200 feet thick. The lowest elevation of the bedrock floor of the valley was reported by Leverett 32 to be 356 feet above sea level in a gas boring in the valley of the West Fork. The logs of many other wells show that the deepest part of the bedrock valley is on the- west side of the present valley under lying Lockland and Wyoming. The wells at the Reading waterworks encountered rock at 390 feet above sea level. Wells of the Fox Paper Co. struck rock at 382 feet above sea level and of the Philip Carey Co., just east of Wayne Avenue, at an elevation of about 370 feet. Several other wells in the western part of Lockland struck rock at less than 380 feet above sea level.
For the most part the underlying formations are mainly sand, with some mixed sand and gravel, interbedded with layers of clay. In many of the wells considerable thicknesses of clay of as much as 110 feet are encountered above the deeper water-bearing formation. In such wells the shallow water-bearing beds are usually absent.
The outcrop area of the shallow water-bearing beds becomes narrower near Lockland and passes through the central part of Reading. Most of Lockland is underlain by clay except along the valley of the West Fork, where about 30 feet of alluvial gravels are reported close to the stream channel. These alluvial deposits along the West Fork are prob ably not connected with the main shallow water-bearing beds.
It is estimated that during 1939 an average of about 6,189,000 gallons of water a day were pumped from wells in the Wyoming-Lockland- Reading area. Of this amount only about 1,100,000 gallons a day were for the municipal supplies of Wyoming and Reading. About 65 per cent of this amount was taken from a small area about half a mile square near Wayne Avenue and south of Cooper Avenue.
In this area the fluctuations of water level in the deep formation bear a close relation to fluctuations in the rate of pumping from wells. (See pi. 5.) The fluctuations of water level that are due to pumping
32' Leverett, Frank, Glacial formations and drainage features of the Erie and Ohio Basins: U. S. Geol. Survey MOD. 41, p. 320,1902.
GROUND WATER IN SPECIFIC LOCALITIES 75
are large enough to obscure those that are due to recharge to the water bearing beds. In November and December 1938 the pumpage at the Gardiner-Richardson Co. plant in Lockland was decreased from about 10,000,000 gallons a week to about 2,000,000 gallons a week, which resulted in a rise in water level of about 10 feet. A study of the graphs of weekly pumpage and the lowest water level reached each week shows that the pumpage at this plant closely balances the recharge entering the water-bearing beds.
Superimposed on the fluctuations of water level that are due to pump ing is the seasonal fluctuation that is due to natural causes, such as seasonal distribution of precipitation, favorable recharge conditions, and losses of water in the intake area by evaporation and transpiration. The seasonal fluctuation in the deeper formations in this area shows that in general if the water level were unaffected by pumping from the formation, it would decline throughout the summer and fall and rise during the period from December to May.
The logs of most wells show that the deeper water-bearing formation is separated from the surface by a fairly continuous bed of clay. Re charge to this formation cannot occur by direct vertical precolation but must occur at considerable distance. The water that is taken from wells in the heavily industrialized center of Lockland probably enters the ground in the Mill Creek Valley north of the Glendale-Milford .Road or in the valley of the West Fork north of Wyoming. Because of the large cone of depression that has been developed just south of Cooper Avenue, some water probably enters the ground farther south in Mill Creek Valley and flows northward to the centers of heavy pumping. Therefore the water that supplies the wells must travel underground for some distance, and increased pumpage or new developments of the underground supply within the limits of the cone of depression will curtail the amount of water available from existing wells.
The lowest water-level elevation measured in this area during the 2^- year record was 432.2 feet above sea level in well 240-10 at the plant of the Gardner-Richardson Co. on September 26, 1940. This water level was measured in an unused well and therefore was perhaps as much as 20 feet higher than the pumping level in nearby pumped wells. If we assume the pumping level in supply wells to be about 410 feet above sea level and the bedrock floor of the valley to be about 380 feet above sea level, only about 30 feet of saturated water-bearing material remains.
The water in the deep water-bearing beds in most of Mill Creek Valley is under artesian pressure. However, in the heavily developed area south of Cooper Avenue the water has been drawn down below the bottom of the confining bed and the upper part of the water-bearing beds has been de-watered. The de-watering of the formation shows that water is being pumped from wells in the formation faster than it can move
74521S-4*-«
76 GROUND-WATER RESOURCES OF THE CINCINNATI AREA
through the formation to the wells. This difficulty might be alleviated to some extent if the supply wells could be spaced at greater distances from each other so that the cones of depression for each well would not affect other wells.
In the Wyoming-Lockland-Reading area automatic water-stage recorders have been in operation on well 237-5 at the Wyoming water works on Vine Street, in Wyoming, on well 240-10 at the plant of the Gardner-Richardson Co. near the center of the heavily pumped area on South Cooper Avenue, and on well 243-2 at the plant of the City Ice & Fuel Co. on Wayne Avenue. Graphs of the lowest water level reached each day for these wells are shown in plate 13.
The municipal supply for the village of Wyoming and the city of Lockland is taken from four wells about 200 feet deep at the Wyoming waterworks. Generally only two or three wells are pumped at a time, although during periods of heavy consumption all four wells may be pumped at once. The wells are pumped for periods of several hours, usually twice a day. As the wells are often idle on Sunday the water level rises without interruption during that day. The sharp fluctua tions of water level (pi. 13) during July-October 1938, March-August and October 1939, and March-June 1940 represent the lowest water levels reached each Sunday when the wells are shut off and are therefore higher than those during the remainder of the week. During periods when these fluctuations are absent, pumping has been continued until early Sunday morning, and therefore the lowest water level reached during Sunday is measured when the supply wells are being pumped rather than when they are idle.
It is reported that the water level in wells at the Wyoming water works was about 45 feet; below the land surface in 1906.33 In December 1940 the water level in an unused well (237-5) stood about 124 feet below the land surface. The water level in nearby pumped wells prob ably is several feet lower. This represents a decline in water level of about 79 feet in 34 years. The record of water-level measurements since July 1, 1938, shows that the water level has not declined seriously in the past 2% years. The water in this well reached a low level in October 1938 and then rose about 4 feet more or less continuously until August 1939. It declined until April 1940, then remained about the same for about 1 month, and since then has declined more or less steadily to December 1940. The steady decline in water level since August 1939 has been due in large part to the deficient precipitation during the summer and fall of 1939 and 1940. It is probably also due in part to increased industrial pumpage in the Lockland area during 1939 and 1940. The low level reached in December. 1940 was about 2 feet lower than the
88 Fuller, M. L., and Clapp, F. G., The underground waters of southwestern Ohio: U. S. Geol. Surrey Water-Supply Paper 259, p. 129,1912.
GROUND WATER IN SPECIFIC LOCALITIES 77
lowest .level measured in 1938 and about 4 feet lower than the lowest level in 1939. At the end of December 1940 the water level was still slowly declining.
The water level in the Gardner-Richardson well (240-10) during the past 2^ years has fluctuated as much as 18 feet because of pumping from the supply wells of the plant. During high stages of Mill Creek, when large quantities of water are pumped directly from the creek, pumpage from wells is decreased. Thus in periods of heavy precipita tion the water level in the Gardner-Richardson well often rises, not because of recharge entering the water-bearing beds but because of decreased pumpage from the supply wells. During the period of record the lowest water level measured occurred in September 1940, which was about 2.5 feet lower than the lowest levels reached in 1938 and 1939. This apparent decline in water level is due in part to an increase in in dustrial pumpage from the Gardner-Richardson supply wells of about 30 percent and to deficient p'recipitation from July to December 1940.
The water level in the observation well at the City Ice & Fuel Co. on Wayne Avenue (243-2) fluctuates several feet a day because of pumping from a supply well during the summer, when the ice plant is in operation. During the rest of the year the principal fluctuations appear to be due to changes in barometric pressure and to changes in rates of pumping from the Lockland area as a whole rather than to pumping from any particular plant. The lowest water level during the period of record since August 11, 1938, was reached in September 1940, when the plant was in operation. This level was about 1 foot lower than the lowest level in 1938, reached in September of that year, and almost 3 feet lower than the lowest level reached during 1939.
Water-level measurements in well 226 (fig. 18) on the east side of Mill Creek near Clark Road in Reading, show that the water level is gen erally more than 25 feet lower than that in a nearby gravel pit of the Reading Sand & Gravel Co. The well was originally drilled to test gravel and has a measured depth of 70 feet. No written record of the well has been found, but it is reported that 6 feet of clay was struck about 40 feet below the surface. This well probably is in the deeper water-bearing beds and probably represents the water level in those beds in an area that is only slightly affected by pumping. The well is located nearly three-quarters of a mile from the heavily pumped area in Lockland.
The water level in well 226 fluctuates within a range of about 12 feet in a year. A graph of water level during the period of record is shown in figure 18.
The apparent decline in water level during 1940 in the deep water bearing formation in Lockland and Wyoming has been due in part to deficient precipitation during the period July to November 1940 and in
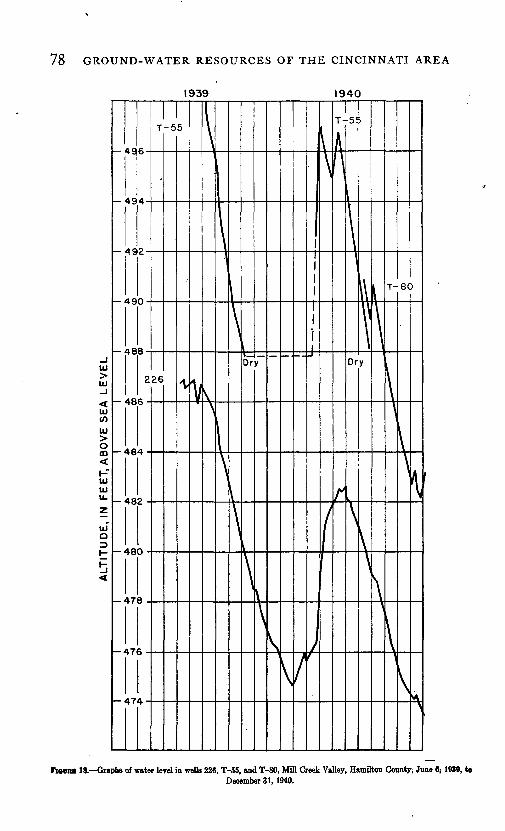
78 GROUND-WATER RESOURCES OF THE CINCINNATI AHEA
1939 1940
FIQUBB 18. Graphs of water level in wells 226, T-55, and T-80, MUI Creek Valley, Hamilton County, June 6; 1939, toDecember 31,1940.
GROUND WATER IN SPECIFIC LOCALITIES 79
part to the fact that pumpage from wells in the Lockland area during the first 9 months of 1940 was about 25 percent greater than during the same period in 1939.
Computations of pumpage from wells in the Wyoming-Lockland- Reading area during 1939, based on estimates and records of pumpage from 14 industrial plants and municipal waterworks, show that the total daily pumpage has ranged from a minimum during January of less than 3,000,000 gallons to a maximum during October of about 7,000,000 gallons a day, with an average daily pumpage for the year of about 6,000,000 gallons (fig. 6). On January 1, 1940, the water levels in well 237-5 stood about the same level as on January 1, 1939. The water level in well 243-2 was about 2 feet lower and in well 240-10 about 7 feet lower than on January 1, 1939. During the first 6 months of 1939, the precipitation was above normal, but during the last 6 months it was below normal, and for the year 1939 at the Abbe Observatory at Cin cinnati it was 2.54 inches above normal. The amount of water pumped from wells was probably about equal to the amount of recharge to the water-bearing beds, namely about 6,000,000 gallons a day.
If, however, the average recharge in future years is less, or if the average pumpage from wells in the area is increased by greater in dustrial activity or by new development to greater than about 6 mil lion gallons of water a day, a decline in water level will occur and the available supply will be depleted.
The average daily pumpage from wells in this area for the period January 1 to December 31, 1940, was about 6,980,000 gallons. This is an increase in pumpage of almost 14 percent over the daily average for 1939. On December 31, 1940, the water level was about 4 feet lower in well 237-5, about 1 foot lower in well 240-10, and about 2 feet lower in well 243-2 than on August 31, 1939. This decline has been due mainly to the increase in average daily pumpage from wells in the area.
If the rate of pumping from wells in the Wyoming-Lockland-Reading area continues at the rate of about 6,900,000 gallons a day or increases because of increased industrial and municipal requirements, the water level probably will decline at a faster rate than during the past 2 years. As the area is favorable in other ways for new industrial development and as the Mill Creek Valley offers good locations for the expansion of the Cincinnati industrial area, the various possibilities for an additional water supply should be considered and a new source of water should be developed.
HARTWELL-CARTHAGE-ELMWOOD PLACE
Mill Creek Valley from the southern limits of Wyoming, Arlington Heights, and Reading to the northern corporation of Saint Bernard is
80 GROUND-WATER RESOURCES OF THE CINCINNATI AREA
occupied by the subdivisions of the city of Cincinnati of Hartwell, Carthage, and the independent village of Elmwood Place. (See pis. 12 and 14.) The western wall of the valley is steep and highly dissected by post-glacial erosion. Small remnants of a terrace of Illinoian age are found about 600-620 feet above sea level.
The valley floor is relatively flat and represents the top of a terrace 520-540 feet above sea level. This outwash terrace is probably late Wisconsin in age. Mill Creek has entrenched its channel 10 to 20 feet below the general level of the terrace. Mill Creek, following the east side of the main valley through Reading, turns westward in Carthage and flows down the west side of the valley as far as Ivorydale.
The east wall of the bedrock valley is obscured by a large Illinoian terrace 580-600 feet above sea level that starts just south of Reading and reaches a maximum width of more than 2 miles in the vicinity of Bond Hill. This terrace is continuous with the Illinoian terrace in the Norwood Trough. The course of the abandoned Miami and Erie Canal follows approximately the western limits of this terrace.
The glacial deposits in this area are mainly sands and gravels with thick beds of boulder clay, which occur as lenticular-shaped bodies at different elevations. The distinction between the two water-bearing formations in the northern part of Mill Creek Valley becomes difficult, as several other bodies of perched water are present, some of which per sist over broad areas. The deposits range in thickness from 250 feet to about 120 feet, largely because of differences in surface elevations.
The early Wisconsin ice advanced as far south as the south end of Hartwell, and deposits of Wisconsin till have been mapped by Fenne- man 34 as underlying the village of Wyoming and the west side of the Mill Creek Valley almost to Carthage. A small remnant of a Wisconsin outwash terrace has been found just south of the till. A test well (T-64) on the property of Mrs. Ann Frank was drilled through 19^ feet of sand and gravel before encountering blue clay.
About 6 feet of the clay crops out nearby in the banks of Mill Creek, and many small springs occur along the top of the clay bed. The total thickness of'the clay bed is not known at this locality as the base of the exposure is covered by Mill Creek. The clay is probably continuous along the west side of the valley at least as far south as Ivorydale, as several test holes show a body of perched water.
The outcrop of the sand and gravel of the shallow water-bearing formation in the upper Mill Creek Valley becomes narrow and passes through Reading east of Mill Creek. South of Benson Street it becomes somewhat broader, and just north of Clark Road the Reading Sand & Gravel Co. has operated a gravel pit in this formation for a period of
a* Fenneman, N. M., The geology of Cincinnati and vicinity: Ohio Geol. Survey* 4th ser.; Bull. 19, physiographic map, 1918.
GROUND WATER IN SPECIFIC LOCALITIES 81
years. The eastern part of this area is mapped by Fenneman 35 as a Wisconsin outwash terrace.
Along Amity Road four test holes were bored by the Geological Survey near the two branches of Mill Creek to determine whether water from the creeks was seeping into the ground. A driven well (245) just east of the Big Four Railroad embankment showed the water level about 516 feet above sea level. In another unused driven well (244) on Elliott Avenue, just west of Mill Creek, the water level stood about 515 feet above sea level. A test well (T-57) was bored on the north side of Amity Road, just east of the intersection with Elliott Avenue, to a depth of 28 feet or 510^ feet above sea level, without striking water or clay. A 1^-inch wrought-iron pipe and well point was then driven to a depth of 52 feet, or 486 feet above sea level. Water then stood at 500 feet above sea level. A second well (T-55) was drilled and driven on the west bank of the West Fork of Mill Creek to a depth of 463^ feet, or 500 feet above sea level. A third well (T-56) was drilled and driven on the west bank of the East Fork of Mill Creek to a depth of 30 feet when large boulders or boulder clay was encountered, but no water was obtained. As several attempts to penetrate the material were unsuccessful the'hole was filled and abandoned.
A fourth well (T-54) was drilled to a depth of 12 feet about 300 feet east of the East Fork of Mill Creek. Water was struck at a depth of 10 feet, or 529 feet above sea level, and the well was stopped at 12 feet when blue clay was struck.
During the summers of 1939 and 1940 wells T-55 and T-57 both went dry, and in September 1940 well T-80 was bored and driven on the east bank of the East Fork of Mill Creek, about 200 feet north of Amity Road, to a depth of about 60 feet, or 477 feet above sea level. On August 19, 1940, the water level in well T-80 was about 1^ feet higher than in wells T-55 and T-57. (See fig. 18.)
A study of the logs and water-level records from these wells shows that in the area between well 245 and well T-54 the clay layer that underlies the surface sand and gravel in the rest of the area was cut out by Mill Creek probably during the interglacial period between the early and late Wisconsin stages of glaciation and was filled during late Wisconsin times with sand and gravel washed out from the melting ice.
This channel apparently continues southward along the east side of the lowest terrace, following closely the present course of Mill Creek until the creek turns sharply westward at Carthage. A test well (T-61-) was bored in the southeast corner of a sand pit of the National Distillers Corporation just south of Section Road. The Illinoian terrace rises abruptly to the east of the sand pit. (See pi. 2, B.) The test hole was bored to a depth of 45 feet without striking water through fine
18 Fenneman, N. M., op. cit.
82 GROUND-WATER RESOURCES OF THE CINCINNATI AREA
sand, light brown in color and uniform in size, that contained only an occasional pebble. A well point and pipe was driven to a depth of 75 feet, or to an elevation of 460 feet, without obtaining water. At that depth the well was stopped as it was impossible to move the pipe farther.
It has been reported that the Chatfield Manufacturing Co., which formerly occupied the present plant of the Flintkote Co., originally poured asphalt waste into a sand.pit just south of the pit described above. It was also reported that the asphalt waste contaminated the wells of the Longview Asylum, which at that time were deep wells in the low Wisconsin terrace. Asphalt was found in the deep well pumps on the wells, suggesting that the surface water carried small bits of asphalt into the deep water-bearing formations and into the wells at the asylum. Unfortunately, no records have been found to substantiate the report. If it is true it would indicate the existence of a channel through the clay beds separating the shallow and deep water-bearing beds in this area and that recharge to the deep formation is possible.
The log of a deep well at the National Distillers Corporation, about 100 yards northwest of well T-61, shows about 65 feet of "dense blue mud" from about 505 to about 440 feet above sea level. That this clay is absent in the sand pit to the east suggests that the clay has been cut out.
Water is pumped from the deep formations in somewhat scattered localities. The largest supply, of about 1,200,000 gallons a day, is pumped from wells in Carthage, with smaller amounts pumped from wells in Elmwood Place. The total daily pumpage from the area prob ably does not exceed 3,000,000 gallons. It is reported that in many places the formation in which the wells end is mainly sand with smaller amounts of admixed gravel.
The water level has been measured in well 252 at the plant of the Flintkote Co. in Carthage. This well is Jess than one-quarter of a mile away from the supply wells of the National Distillers Corporation. The water level is affected by pumping from the National Distillers wells over a long period, but the well is not sufficiently close to record minor changes in the rate of pumping. According to the record of the past 2 years the water level in this well hgs ranged from a high stage of 91.69 feet below the top of the casing, or 455.81 feet above sea level, on August 7, 1939, to a low stage of 97.55 feet below the top of the casing, or 449.95 above sea level, on December 9, 1940. (See fig: 19.) The low stage in December 1940 was about one-half foot lower than the previous low stage on April 8, 1940, and about 1 foot lower than the low stage in January 1939. The elevation of the water level on December 9, 1940. was about 450 feet above sea level, or about 13 feet above the water level in well 240-3 at the Gardner-Richardson plant in Lockland. This
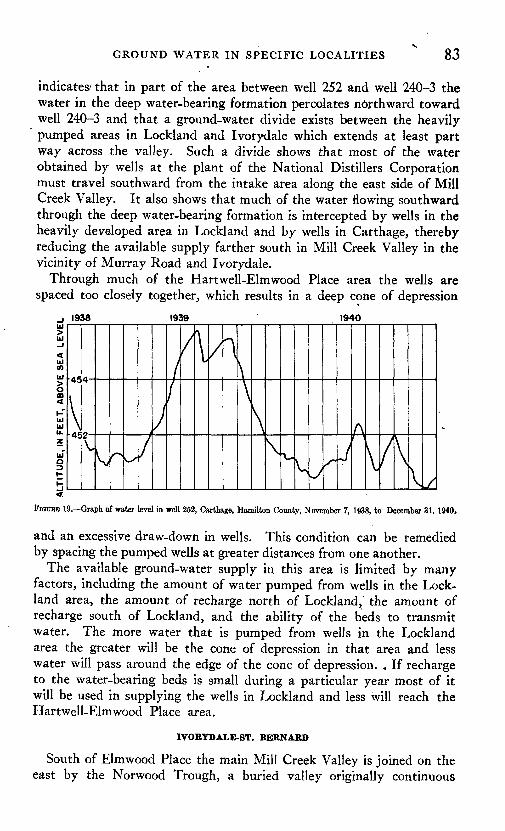
GROUND WATER IN SPECIFIC LOCALITIES 83
indicates,' that in part of the area between well 252 and well 240-3 the water in the deep water-bearing formation percolates northward toward well 240-3 and that a ground-water divide exists between the heavily pumped areas in Lockland and Ivorydale which extends at least part way across the valley. Such a divide shows that most of the water obtained by wells at the plant of the National Distillers Corporation must travel southward from the intake area along the east side of Mill Creek Valley, It also shows that much of the water flowing southward through the deep water-bearing formation is intercepted by wells in the heavily developed area in Lockland and by wells in Carthage, thereby reducing the available supply farther south in Mill Creek Valley in the vicinity of Murray Road and Ivorydale.
Through much of the Hartwell-Elmwood Place area the wells are spaced too closely together, which results in a deep cone of depression
1938 1939 1940
454-
-452
A/T
J\l\
\FIGURE 19. Graph of water level in well 252, Carthage, Hamilton County, November 7, 1938, to December 31, 1940.
and an excessive draw-down in wells. This condition can be remedied by spacing the pumped wells at greater distances from one another.
The available ground-water supply in this area is limited by many factors, including the amount of water pumped from wells in the Lock- land area, the amount of recharge north of Lockland, the amount of recharge south of Lockland, and the ability of the beds to transmit water. The more water that is pumped from wells in the Lockland area the greater will be the cone of depression in that area and less water will pass around the edge of the cone of depression. . If recharge to the water-bearing beds is small during a particular year most of it will be used in supplying the wells in Lockland and less will reach the Hartwell-Elmwood Place area.
IVORYDALE-ST. BERNARD
South of Elmwood Place the main Mill Creek Valley is joined on the east by the Norwood Trough, a buried valley originally continuous
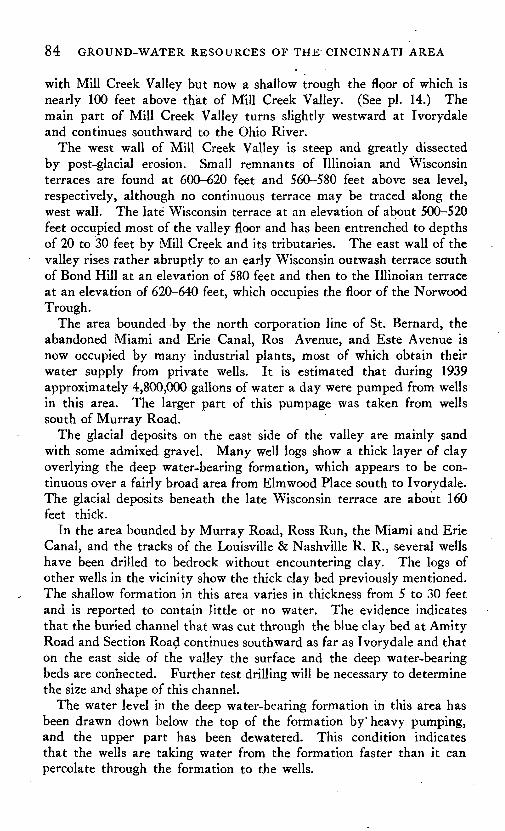
84 GROUND-WATER RESOURCES OF THE CINCINNATI AREA
with Mill Creek Valley but now a shallow trough the floor of which is nearly 100 feet above that of Mill Creek Valley. (See pi. 14.) The main part of Mill Creek Valley turns slightly westward at Ivorydale and continues southward to the Ohio River.
The west wall of Mill Creek Valley is steep and greatly dissected by post-glacial erosion. Small remnants of Illinoian and Wisconsin terraces are found at 600-620 feet and 560-580 feet above sea level, respectively, although no continuous terrace may be traced along the west wall. The late Wisconsin terrace at an elevation of about 500-520 feet occupied most of the valley floor and has been entrenched to depths of 20 to 30 feet by Mill Creek and its tributaries. The east wall of the valley rises rather abruptly to an early Wisconsin outwash terrace south of Bond Hill at an elevation of 580 feet and then to the Illinoian terrace at an elevation of 620-640 feet, which occupies the floor of the Norwood Trough.
The area bounded by the north corporation line of St. Bernard, the abandoned Miami and Erie Canal, Ros Avenue, and Este Avenue is now occupied by many industrial plants, most of which obtain their water supply from private wells. It is estimated that during 1939 approximately 4,800,000 gallons of water a day were pumped from wells in this area. The larger part of this pumpage was taken from wells south of Murray Road.
The glacial deposits on the east side of the valley are mainly sand with some admixed gravel. Many well logs show a thick layer of clay overlying the deep water-bearing formation, which appears to be con tinuous over a fairly broad area from Elmwood Place south to Ivorydale. The glacial deposits beneath the late Wisconsin terrace are about 160 feet thick.
In the area bounded by Murray Road, Ross Run, the Miami and Erie Canal, and the tracks of the Louisville & Nashville R. R., several wells have been drilled to bedrock without encountering clay. The logs of other wells in the vicinity show the thick clay bed previously mentioned. The shallow formation in this area varies in thickness from 5 to 30 feet and is reported to contain little or no water. The evidence indicates that the buried channel that was cut through the blue clay bed at Amity Road and Section Road continues southward as far as Ivorydale and that on the east side of the valley the surface and the deep water-bearing beds are connected. Further test drilling will be necessary to determine the size and shape of this channel.
The water level in the deep water-bearing formation in this area has been drawn down below the top of the formation by" heavy pumping, and the upper part has been dewatered. This condition indicates that the wells are taking water from the formation faster than it can percolate through the formation to the wells.
GROUND WATER IN SPECIFIC LOCALITIES 85
It has been reported that a well at the Proctor & Gamble well field overflowed at the surface in 1882.36 Company records show that the water level was 37 feet below the surface in 1913 and 65 feet below the surface in 1920. In December 1940 it was about 93 feet below the surface. The water level has therefore declined at least 93 feet in 53 years. The rate of decline during 1939 and 1940 was about 1J^ feet per year.
An automatic water-stage recorder was installed on well 270-a5 on July 11, 1938, and was maintained until December 3, 1939. At that time the well was cleaned out and put back into service by the owners, and the recorder was moved to well 270-a4, about 100 feet east of well 270-a5, where it has remained.
The water levels in these two wells, 270-a4 and 270-a5,. are not ex actly comparable as the two wells are not located in the same position with respect to two nearby pumped wells, 270-4 and 270-6. Well 270-a5 is between the two pumped wells and somewhat nearer to well 270-4. Well 270-a4 is about 100 feet south of well 270-a5 and about 120 feet from well 270-4. The measuring point on well 270-a4 is1 3.0 feet higher than that on well 270-a5. When wells 270-4 and 270-6 are being pumped, the static water level is probably lower in well 270-a5 than in 270-a4.
In well 270-a5 the low level of 1938. was reached on November 5 and was about 1^5 feet higher than the low level during 1939, which was reached on November 11. (See fig. 20.) A large part of the decline occurred during September, October, and November, 1939, when the pumpage from nearby wells was greater than during the rest of the year. Part of the decline may also have been due to the deficient precipitation during the summer of 1939. The low level in well 270-a4 during 1940 occurred in December and was about 1^ feet lower than the low level in well 270-a5 in November 1939. The continued decline has been caused by heavy pumping and deficient precipitation. During the summer and fall of 1940 the water level in well 270-a4 remained fairly constant, fluctuating during each week between 91 and 92 feet below the measuring point until December 1940, when a sudden decline of about one-half foot occurred.
A test well, 270-25, was drilled in the bed of the abandoned Miami and Erie Canal, 500'feet south of Murray Road, in July 1939, on the property of the Proctor & Gamble Co. Measurements in this well show that the water level has declined about 14 feet from July 1939 to December 31, 1940. The decline in water level in well 270-25 has been greater than in well 270-a4 probably because of greater pumpage from wells in the vicinity of wefl 270-25.
86 Personal communication from well driller.]
86 GROUND-WATER RESOURCES OF THE CINCINNATI AREA
At the south end of the Proctor & Gamble Co. well field the water level in well 270-a4 in December' 1940 was about 92 feet below the land surface. This level was measured when nearby wells were being pumped and therefore is not a true static or a true pumping level. The pumping level in nearby wells is probably about 15 to 20 feet lower, or about
4361938
I I I Well 265
434'
432
-430
428
-426
-424
\h422
42(
418
416-
X
Well 270 (a-.
V1939 1940
A/N
Well 270-25
A
*t
^V W\
r^/L
Well 270 (a-
'^A
FIQUBS 20. Graphs of water level in wells 265, 270-25, 270-a5, and 270-a4, Mill Creek Valley, Hamilton'County, July 7,1938, to December 31, 1940.
107 to 112 feet below the land surface. In well 270-4 bedrock was encountered at a depth of 120 feet. There remains, therefore, only about 8 feet of water in the well when it is pumped. If the decline in water level continues, the available supply from these wells will soon be serious ly curtailed.
GROUND WATER IN SPECIFIC LOCALITIES 87
Unsuccessful attempts have been made to locate additional areas favorable for the development of large supplies of ground water in the area farther west in Mill Creek Valley. In the main valley of Mill Creek, just north of Este Avenue, several test wells were drilled but the deposits encountered were mainly clay and clayey sand mixtures with very little or no productive sand or gravel. Under the existing condi tions an increase in the number of wells or an increase in the rate of pumping from the existing wells will not provide additional water over a period of years but will merely aggravate the present overdevelop ment. A supplemental supply is needed, either of surface water or of ground water obtained in an area that is not already overdeveloped.
LOWER HILL CREEK VALLEY
Between Ivorydale and Western Hills viaduct the Mill Creek Valley is considerably narrower than north of Ivorydale. (See pi. 1£.) The ancestral Licking River, flowing northward from Kentucky, was a small stream compared to the ancestral Ohio River, which flowed westward through the Norwood Trough and thence northward through the Mill Creek Valley. The valley walls are steep and dissected by post-glacial erosion. The valley floor is flat and slopes southward from an eleva tion of 500 feet at Winton Place to about 480 feet in the western part of downtown Cincinnati. Broad remnants of the Illinoian terrace are found near Spring Grove Cemetery on the west side of the valley and south of St. Bernard on the east side. A small remnant of the late Wisconsin terrace occurs on the east side of the valley near the Hopple Street viaduct.
The area constitutes an important part of the industrial area of Cin cinnati, for many industrial plants are located in it. However, at only a few of the plants has it been possible to develop from wells water supplies sufficient to satisfy the requirements.
A moderate supply of ground water has been obtained from wells at Spring Grove Cemetery near Crawford Avenue and the Baltimore & Ohio R. R. Bedrock was struck at a depth of about 100 feet, or about 395 feet above sea level. The logs of the wells show that the glacial deposits in this area are mainly clay and glacial till with three relatively thin beds of water-bearing sand and gravel. Nearby, at the corner of Winton Road and Spring Grove Avenue, a test well was drilled, but as sufficient water could not be obtained a permanent well was not installed. About 10 feet of water-bearing material was encountered.
Farther south near Arlington Street and Spring Grove Avenue a test well was drilled to a depth of 104 feet through clay and two beds of muddy gravel, each 5 feet thick. The hole was abandoned, because of lack of sufficient water. A test well drilled to a depth of 74 feet at the Union Stock Yards penetrated only 6 feet of water-bearing material
00 GROUND-WATER RESOURCES OF THE CINCINNATI AREA
and was abandoned. Another well at Alfred Street arid Spring Grove Avenue encountered rock at a depth of 90 feet after passing through clay with no water-bearing beds. As far as is known to the writers no large supply of water has been developed in this part of Mill Creek Valley.
Conditions are apparently unfavorable for the occurrence of ground water in the area because of many factors. The ancestral Licking River flowing northward was not as large a stream as the ancestral Ohio and therefore its valley was not as wide. The original stream alluvium of the ancestral Licking was probably not as thick. When the ancestral Ohio drainage was reversed the water probably flowed eastward through the larger valley and through the Norwood Trough. At that time the Licking probably backed up and ponded, which allowed the fine sediments carried in suspension to settle and form the thick clay beds now present. After the narrows at Andersons Ferry had been cut through, the main drainage was southward through the present lower Mill Creek Valley, which was so much narrower than the upper valley that only a little outwash was deposited. As the ancestral Lick ing River was a comparatively small stream, its channel was also small. Possibly the wells drilled have not been in the deepest part of the old channel where the material would be coarser and more permeable than elsewhere.
No detailed information as to changes in water level in this area were obtained by the writers during the present investigation.
CINCINNATI BASIN
The business section of Cincinnati lies in a bowl-shaped lowland several hundred feet below the general surface of the surrounding up lands. (See pi. 15.) The lowland area is almost 3 miles long in an easfc- west direction and about 2 miles wide in a north-south direction. Across the Ohio River, the cities of Covington and Newport, Ky., lie in a con tinuation of the lowland area. The eastern part of Cincinnati stands on a flat terrace of the Ohio River at 520-540 feet above sea level. Rem nants of the same terrace have been found in the Covington-Newport area, at the mouth of the Little Miami Valley, and near Dayton, Ky..
The terrace in the eastern part of the city slopes southward from about 520 feet at Fifth Street to about 440 feet at the Ohio River. Westward the terrace slopes down to the present valley of Mill Creek at an elevation of about 460 feet. The channel of Mill Creek has been cut about 20 feet below the general valley floor. The lowland of the valley is occupied mainly by railroads at present, as the Mill Creek and Ohio Valleys offer arteries for transportation routes with gentle grades.
The valley floor of the lower Mill Creek Valley is only from 10 to 20 feet higher than the Ohio River and therefore is subject to flood waters
GROUND WATER IN SPECIFIC LOCALITIES 89
that back into Mill Creek Valley from the Ohio. Recent plans of engineers of the U. S. War Department for flood protection of the Mill Creek Valley have included the construction of a barrier dam across Mill Creek Valley to prevent flooding by backwater from tfye river.
Logs of wells that reach bedrock show that the glacial deposits of the Cincinnati Basin have a maximum thickness of about 190 feet. How ever, the depth to bedrock differs considerably throughout the city be cause of the irregular topography of the bedrock Surface and of the present land surface. The average depth to rock is about 90 to 100 feet. The deposits are mainly sand and gravel, interbedded with many fairly thin beds of clay and silt. In many wells the upper 50 to 60 feet appear to be mainly sand, but considerable tKicknesses of clay are found at intermediate depths.
The Cincinnati Basin is near the southern limit of Illinoian glaciation, where the ice was probably thin. This assumption is further shown by the lack of a well-defined terminal moraine. The ice probably ad vanced and retreated short distances at least several times during Illino ian time. Small lense-like deposits of boulder clay and outwash sand and gravel, together with small channels of ordinary stream alluvium and deposits of small temporary lakes, make correlation of strata from one well to another extremely difficult.
Many wells have been drilled in the Cincinnati Basin to provide water for industrial use and air conditioning. During the past several years the use o ground water for air conditioning has increased manyfold for theaters, hotels, restaurants, and department stores. The use of water for air conditioning has probably doubled the rate of pumping of ground water in the Cincinnati Basin. It is estimated that during 1939 an average of about 6,000,000 gallons of water £ day were pumped from wells in the basin, with a maximum pumpage of about 9,000,000 gallons a day during the summer. These figures are based on individual esti mates of pumpage from 23 plants.
During the 1% years of investigation little detailed information has been obtained on the fluctuations of water level in the Cincinnati Basin. However, no serious decline in water level has been reported during that period. Unfortunately there are few wells in the downtown area which are suitable for periodic measurements of water level. Recently, how ever, through the cooperation of the Cincinnati district office, Corps of Engineers, U. S. War Department, a test well drilled by the engineers was made available for observation, and an automatic water-stage recorder was installed. The period of record to date is too short to show any significant trend. The short record does show, however, that the stage of the Ohio River has an effect on water levels in this part of Mill Creek Valley. Whether the effect is due to actual recharge from the river or to pressure caused by a greater weight of water on the surface during high stages of the river has not been determined.
90 GROUND-WATER RESOURCES OF THE CINCINNATI AREA
Although definite data are lacking with regard to the rise and fall of water levels in the downtown area of Cincinnati, it is probably 4esirable to investigatate the problem more carefully before the pumpage of ground water is greatly increased. Many air-conditioning systems re move from the water-bearing beds large quantities of water that are* discharged through sewers to the surface drainage. In certain areas of the United States ground water used for air conditioning is returned through wells. This method of conservation has been tried on a large scale on Long Island.37 Two main difficulties have arisen: The clogging of the screen of the return well and of the surrounding sand has decreased the capacity of the well to return water to the formation at its original capacity, and the continued return of warm water to the formation has raised the temperature of the ground water and thereby has reduced the efficiency of the system.
Much of the water pumped from wells in the basin probably comes from recharge from the Ohio River, although further work will be needed to determine the rate of recharge. Although moderate quantities .of ground water can probably be pumped in this area in addition to the present supplies, care should be taken to locate the new wells as far as possible from existing wells.
NORWOOD TROUGH AND LITTLE MIAMI VALLEY
The Norwood Trough is a broad, shallow valley extending from the Little Miami Valley about 3 miles north of the Ohio River to the Mill Creek "Valley near Ivorydale and St. Bernard. (See pis. 1 and 14.) It represents part of the course of the ancestral Ohio River during pre- Illinoian time when the river flowed northward up the Mill Creek Valley. The trough is about 2 miles wide in most places. The valley has been abandoned by large streams and is now drained by Duck Creek, a tri butary to the Little Miami River, and by Ross Run, a tributary to Mill Creek. The valley is occupied by the cities and towns of Madison- ville, Oakley, Norwood, and Bond Hill. Much of the area in the vicini ties of Norwood and Oakley has been occupied by industrial plants that obtain water from private wells. The city of Madisonville originally obtained water for the public supply from wells but now uses water from the Cincinnati public supply system. The municipal supply for Norwood is now taken from wells in Norwood. The wells originally used by St. Bernard for public supply have been abandoned, and the Cincinnati public supply is used.
The Norwood Trough runs roughly east and west. The walls of the valley are gradual and gently sloping, particularly on the south. The
37 Leggette, R. M., and Brasheare, M. L.; Jr.; Ground Water for air-conditioning on Long Island, New York: Am, Geophys. Union Trans, 1938, pt. 1, pp. 412-418,1939. Brasheare, M. L., Jr.; Ground-water temperature on Long Island^ New York, as affected by recharge of warm water: Econ. Geology, vol. 36, No. 8, pp. 811-828; December 1941.
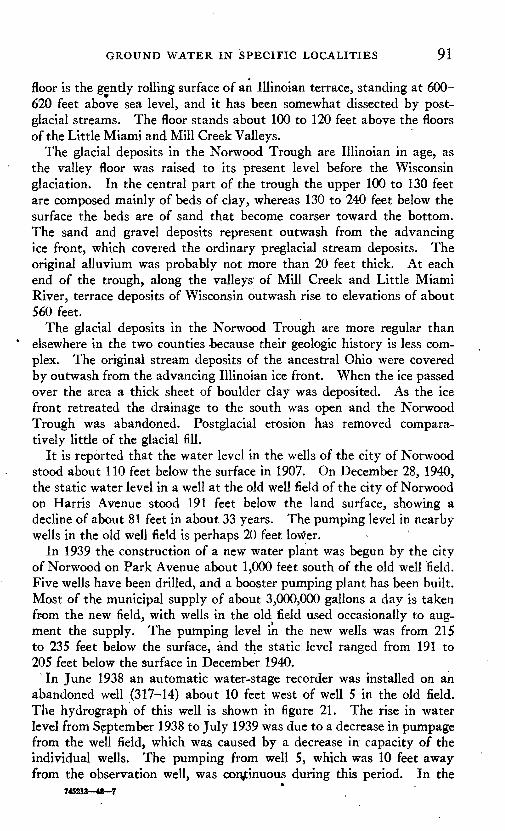
GROUND WATER IN SPECIFIC LOCALITIES 91
floor is the gently rolling surface of an Illinoian terrace, standing at 600- 620 feet above sea level, and it has been somewhat dissected by post glacial streams. The floor stands about 100 to 120 feet above the floors of the Little Miami and Mill Creek Valleys.
The glacial deposits in the Norwood Trough are Illinoian in age, as the valley floor was raised to its present level before the Wisconsin glaciation. In the central part of the trough the upper 100 to 130 feet are composed mainly of beds of clay, whereas 130 to 240 feet below the surface the beds are of sand that become coarser toward the bottom. The sand and gravel deposits represent outwash from the advancing ice front, which covered the ordinary preglacial stream deposits. The original alluvium was probably not more than 20 feet thick. At each end of the trough, along the valleys of Mill Creek and Little Miami River, terrace deposits of Wisconsin outwash rise to elevations of about 560 feet.
The glacial deposits in the Norwood Trough are more regular than elsewhere in the two counties -because their geologic history is less com plex. The original stream deposits of the ancestral Ohio were covered by outwash from the advancing Illinoian ice front. When the ice passed over the area a thick sheet of boulder clay was deposited. As the ice front retreated the drainage to the south was open and the Norwood Trough was abandoned. Postglacial erosion has removed compara tively little of the glacial fill.
It is reported that the water level in the wells of the city of Norwood stood about 110 feet below the surface in 1907. On December 28, 1940, the static water level in a well at the old well field of the city of Norwood on Harris Avenue stood 191 feet below the land surface, showing a decline of about 81 feet in about 33 years. The pumping level in nearby wells in the old well field is perhaps 20 feet lower.
In 1939 the construction of a new water plant was begun by the city of Norwood on Park Avenue about 1,000 feet south of the old well field. Five wells have been drilled, and a booster pumping plant has been built. Most of the municipal supply of about 3,000,000 gallons a day is taken from the new field, with wells in the old field used occasionally to aug ment the supply. The pumping level in the new wells was from 215 to 235 feet below the surface, and the static level ranged from 191 to 205 feet below the surface in December 1940.
In June 1938 an automatic water-stage recorder was installed on an abandoned well (317-14) about 10 feet west of well 5 in the old field. The hydrograph of this well is shown in figure 21. The rise in water level from September 1938 to July 1939 was due to a decrease in pumpage from the well field, which was caused by a decrease in capacity of the individual wells. The pumping from well 5, which was 10 feet away from the observation well, was continuous during this period. In the
745213-48-7
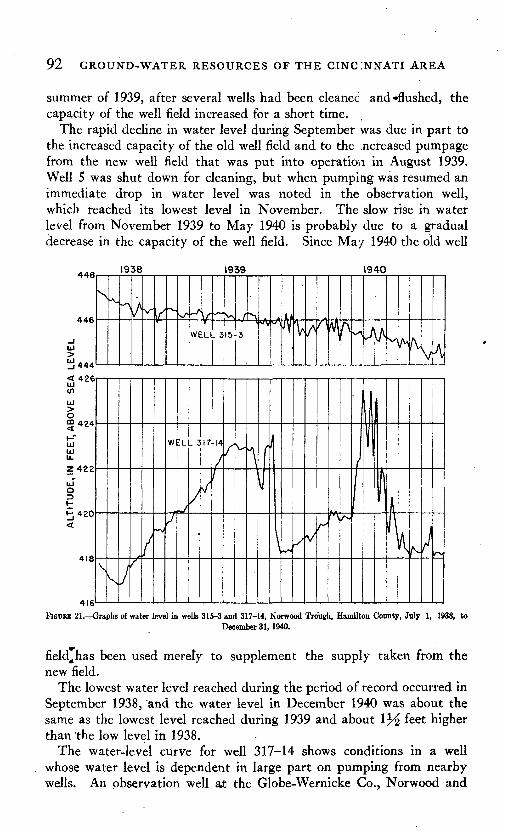
92 GROUND-WATER RESOURCES OF THE CINCINNATI AREA
summer of 1939, after several wells had been cleaned and*flushed, the capacity of the well field increased for a short time.
The rapid decline in water level during September was due in part to the increased capacity of the old well field and to the .ncreased pumpage from the new well field that was put into operation in August 1939. Well 5 was shut down for cleaning, but when pumping was resumed an immediate drop in water level was noted in the observation well, which reached its lowest level in November. The slow rise in water level from November 1939 to May 1940 is probably due to a gradual decrease in the capacity of the well field. Since May 1940 the old well
448
446
LJ
§444
1938 1939 1940
315-3 K-AA MVA
416
FIGURE 21. Graphs of water level in wells 315-3 and 317-14, Norwood Trough, Hamilton County, July 1, 1938, toDecember 31,1940.
fieldjhas been used merely to supplement the supply taken from the new field.
The lowest water level reached during the period of record occurred in September 1938, ^.nd the water level in December 1940 was about the same as the lowest level reached during 1939 and about 1^ feet higher than the low level in 1938.
The water-level curve for well 317-14 shows conditions in a well whose water level is dependent in large part on pumping from nearby wells. An observation well at the Globe-Wernicke Co., Norwood and
GROUND WATER IN SPECIFIC LOCALITIES 93
Carthage Avenues, is about 200 feet from the supply well of the company. The water level in the observation well (315-3) apparently is not affected by the comparatively small pumpage from the supply well. An auto matic water-stage recorder was in operation on this well from July 1, 1938, to July 31, 1939. The weekly recorder charts show.that the pi incipal daily fluctuations of water level in this well are due to changes in atmospheric pressure. During the period of record from July 1, 1938, to December 31, 1940, the water level in this well generally de clined. (See fig. 21.) The low level in December 1939 was about one-half foot lower than the low level in December 1938. The level in December 1940, which was about 1 foot lower than at the same time in 1939, showed a total decline'of about 3 feet for the period of record from July 1938 to December 1940.
In well 326, at the plant of the Cincinnati Milling Machine Co. at Oakley, the water level was measured from August to December 1940. The period of record is not long enough to show any significant change in water level.
A study of well logs and water levels in several wells at the east end of the Norwood Trough at Oakley and Norwood show that the upper part of the water-bearing beds have been unwatered; in other words, the water level has declined below the top of the water-bearing beds. (See fig. 22.) This fact, together with the slow decline in water level that is apparently continuing, suggests that the ground-water supply has been overdeveloped under the present conditions of pumpage and recharge. Rough calculations show that the water pumped from the Norwood Trough has been taken largely from storage and that recharge to the water-bearing beds has been relatively small.
As the surficial and shallow deposits of the Norwood Trough are relatively impermeable, little water can percolate downward to the water-bearing beds directly from the surface; so most of the recharge must come from either the Mill Creek Valley or the Little Miami Valley, where the sands and gravels are exposed or are connected with other permeable deposits. One of the local drillers believes that the water pumped from wells in the Norwood Trough was originally derived in large part from several ice ponds in the vicinity of Murray Road and the Miami and Erie Canal. Before the canal was abandoned at least three large ice ponds and turning basins were supplied with water from the canal. When the canal was abandoned and drained in 1919 and 1920, this source of recharge was eliminated. The direct recharge from the canal itself was probably negligible, but water may have percolated from the ice ponds through the underlying sands and gravels to the water-bearing formation. The ponds and the canal were on a low terrace about 520 feet above sea level. The elevations of the land surface in the Mill Creek Valley would allow water entering the surface from the
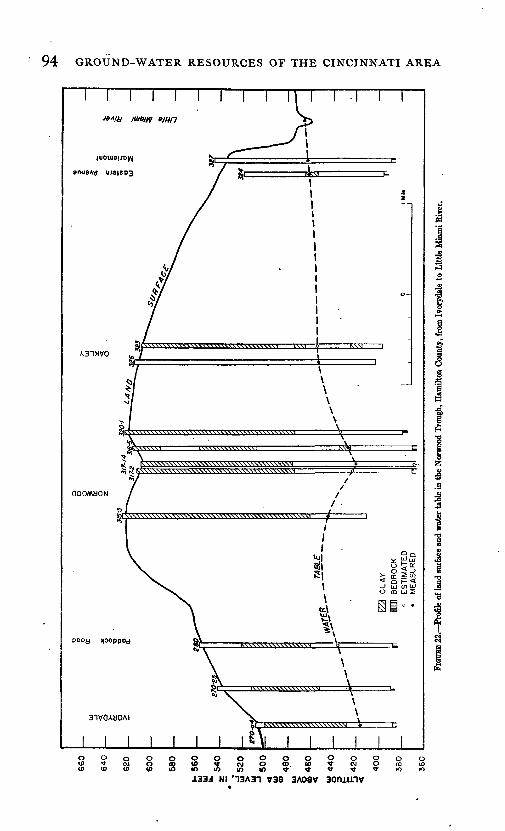
94 GROUND-WATER RESOURCES OF THE CINCINNATI AREA
IUIOM
JUOUU9UD1N
V UJ9JSD3
A31XVO
J.33J Nl '13A3T V3S 3A08V
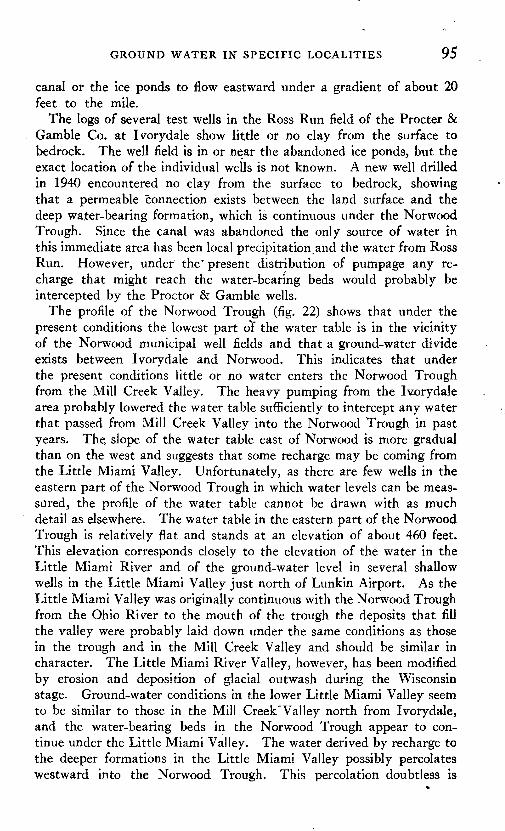
GROUND WATER IN SPECIFIC LOCALITIES 95
canal or the ice ponds to flow eastward under a gradient of about 20 feet to the mile.
The logs of several test wells in the Ross Run field of the Procter & Gamble Co. at Ivorydale show little or no clay from the surface to bedrock. The well field is in or near the abandoned ice ponds, but the exact location of the individual wells is not known. A new well drilled in 1940 encountered no clay from the surface to bedrock, showing that a permeable connection exists between the land surface and the deep water-bearing formation, which is continuous under the Norwood Trough. Since the canal was abandoned the only source of water in this immediate area has been local precipitation^and the water from Ross Run. However, under the" present distribution of pumpage any re charge that might reach the water-bearing beds would probably be intercepted by the Proctor & Gamble wells.
The profile of the Norwood Trough (fig. 22) shows that under the present conditions the lowest part olf the water table is in the vicinity of the Norwood municipal well fields and that a ground-water divide exists between Ivorydale and Norwood. This indicates that under the present conditions little or no water enters the Norwood Trough from the Mill Creek Valley. The heavy pumping from the Ivorydale area probably lowered the water table sufficiently to intercept any water that passed from Mill Creek Valley into the Norwood Trough in past years. The, slope of the water table east of Norwood is more gradual than on the west and suggests that some recharge may be coming from the Little Miami Valley. Unfortunately, as there are few wells in the eastern part of the Norwood Trough in which water levels can be meas- sured, the profile of the water table cannot be drawn with as much detail as elsewhere. The water table in the eastern part of the Norwood Trough is relatively flat and stands at an elevation of about 460 feet. This elevation corresponds closely to the elevation of the water in the Little Miami River and of the ground-water level in several shallow wells in the Little Miami Valley just north of Lunkin Airport. As the Little Miami Valley was originally continuous with the Norwood Trough from the Ohio River to the mouth of the trough the deposits that fill the valley were probably laid down under the same conditions as those in the trough and in the Mill Creek Valley and should be similar in character. The Little Miami River Valley, however, has been modified by erosion and deposition of glacial outwash during the Wisconsin stage. Ground-water conditions in the lower Little Miami Valley seem to be similar to those in the Mill Creek'Valley north from Ivorydale, and the water-bearing beds in the Norwood Trough appear to con tinue under the Little Miami Valley. The water derived by recharge to the deeper formations in the Little Miami Valley possibly percolates westward into the Norwood Trough. This percolation doubtless is
96 GROUND-WATER RESOURCES OF THE CINCINNATI AREA
slow, as the hydraulic gradient is smaller than that on the west end of the trough.
The wells of the Norwood public supply are in two small areas, and the wells of several industrial plants are not far from them. Doubt less the close spacing of these wells tends to accentuate the depression of the water table. Consideration should be given to the construction of new wells at points as widely separated as practicable in that part of the city located in the trough, especially in areas where no large quantity of water is pumped at present. As much of the recharge to the water-bearing beds may come from the Little Miami Valley, there will be an advantage in locating wells in the eastern part of the city. Considerable water probably can be pumped in the undeveloped local ities in the western parts of the city, but as the water would be pumped almost entirely from storage no large development should be made in that section.
So far as known, the water-bearing beds in the Norwood Trough are overlain by a considerable thickness of clay, and therefore artificial recharge could probably be accomplished only by pouring water into wells constructed for that purpose. To make the artificial recharge effective it would be necessary to drill the recharge wells in places near the heavy pumping. As the land surface near the heavy pumping is 100 to 160 feet above the levels of Mill Creek and the Little Miami River, it would be necessary to lift any water taken from these streams for recharging. In addition much pipe line would be required to trans port the water to the areas suitable for recharge. Therefore, these streams probably cannot be considered as sources of water for artificial recharge in the Norwood Trough. Several square miles of territory are tributary to small streams in the trough. However, these streams largely drain built-up sections of Norwood, Cincinnati, and several of its suburbs. Probably much water is disposed of through sewers, and all of it is subject to pollution. In addition, other difficulties would be involved in recharging through wells.
The remaining alternatives for obtaining additional water for municipal or industrial use in the Norwood Trough include the purchase of water from the Cincinnati municipal water-supply system; the connection with a system to supply additional water to municipalities and indus tries in the Mill Creek Valley if such should be constructed; the develop ment of a ground-water supply in the valley of the Little Miami River; and the development of a surface-water supply from that river or its East Fork, or from the Ohio River.
Few wells have been drilled in the valley of the Little Miami River between the Norwood Trough and the Ohio River. However, the bedrock valley is filled at least partly with deposits of sand and gravel, which should yield water as readily as similar deposits in the Mill Creek
POSSIBLE ADDITIONAL SOURCES OF WATER SUPPLY 97
Valley. Although the water in this part of the valley is not greatly developed at the present it may be possible to obtain several million gallons a day from wells in the lowlands of the valley. If the ground water in the Norwood Trough comes largely by underflow from the Little Miami Valley, pumping from wells in that area probably would reduce^ the flow into the trough. On the other hand, conditions in the Little Miami Valley appear favorable for recharge from the Little Miami or the Ohio River. If any large development of ground water is to be undertaken in this area, the most favorable location for such a develop ment should be determined by test drilling and pumping and the safe yield of the water-bearing beds should be determined.
POSSIBLE ADDITIONAL SOURCES OF WATER SUPPLY IN MILL CREEK VALLEY AND THE NORWOOD TROUGH
The sand and gravel deposits underlying the Mill Creek Valley .from the Miami Valley to Ivorydale and perhaps to the Ohio River may be considered as one large underground reservoir in which vast quantities of ground water are stored. A large part of the water pumped from wells throughout the valley probably enters the underground reservoir north of Lockland and percolates southward toward Ivory dale, and the Ohio River. It may be considered that the valley is a unit and that any project for increasing the water supply in one part of the valley will ultimately affect the water supply in the more distant parts.
If there is a considerable increase in the rate of pumping from existing wells in Mill Creek Valley or if additional supplies of ground water are developed from new wells, further depletion and lowering of the water levels may be expected. Unless reliance is to be placed in the Cincin nati public supply, plans should be made to obtain additional supplies of water from some now unused source. A project for the whole valley that would furnish an additional supply comparable in quantity to the present pumpage wpuld be desirable to provide for new industries and to allow a reasonable factor of safety.
The Miami and Erie Canal formerly provided a means of water trans-. portation from Toledo on Lake Erie to the Ohio River at Cincinnati. The canal has fallen into disuse, and the lower stretch has been aban doned the part from the Ohio River to Cumminsville in 1919 and that from Cumminsville to Middletown in 1929. Much of the canal has been filled in and is now covered with highways and streets. The canal followed the east side of the Miami Valley from Middletown to Hamilton, crossed the Mill Creek Valley south of Hamilton, and followed the west side of the valley to Lockland. South of Lockland, it again crossed Mill Creek Valley and followed the east side of the valley to Cincinnati. Through much of its length, it was many feet higher than the Miami River and Mill Creek. From Middletown southward, it was
98 GROUND-WATER RESOURCES OF THE CINCINNATI AREA
originally fed by the Middletown feeder, several miles northeast of Middle town.
The Miami and Erie Canal is reported to have had a great effect in maintaining ground-water levels. The rate of decline in water levels
-has been accelerated by its abandonment, as the canal provided surface water to many industrial plants, which, when this source of water was eliminated, used private wells and thereby greatly increased the de mand on the ground-water supply. By maintaining a constant flow of water in Mill Creek, seepage to the shallow water-bearing beds and subsequently to the deeper beds was doubtless somewhat greater than at present.
Waste water from the canal is reported to have maintained a flow in Mill Creek equal to about twice the average flow since the canal was abandoned. Mill Creek was probably never completely dry during the summer until 1934, whereas during the past 2 years it has been completely dry in certain stretches for periods of a few months. As several large ice ponds and turning basins were kept full of water by the canal in the Ivorydale area several well drillers believe that these basins supplied water to the water-bearing beds in the Norwood area. However, the canal probably contributed little water to the ground-water supply by direct seepage from the canal bed.
Many persons have advocated the reopening of the canal as a water way for water supply and recreation. However, much of the canal has been filled in, much of it has been broken down, and highways have been built on the old canal bed. The Middletown feeder can no longer be used without building new stretches of the canal through the cities of Middletown and Hamilton. If a new feeder were constructed south of Hamilton, a pumping lift of about 50 feet would be required. The reopening of the canal would involve many difficulties.
The available logs of wells in the area between Ivorydale and the Glen- dale waterworks show that in most of this area the principal water bearing beds are overlain by clay or silt. In addition, many wells are reported to contain "muddy gravel." Judging from samples of this gravel examined at wells in course of construction, much of it is probably boulder clay that consists largely of clay or silt with included pebbles. Some of the muddy gravel and beds reported as clay are relatively impermeable and tend to retard the recharge by direct downward per colation into the deep water-bearing beds. This condition is also sug gested by the behavior of water level in observation wells in certain parts of Mill Creek Valley, notably in Ivorydale and Lockland, which have not shown any significant rise after heavy rains. On the other hand, the rapid and large rise of water levels in many wells after rains suggests that a large part of the valley north of the Glendale-Milford Road constitutes an intake area where conditions are relatively favorable for recharge.
POSSIBLE ADDITIONAL SOURCES OF WATER SUPPLY 99
Rough estimates show that the total quantity of water withdrawn from the wells in the area between Ivorydale and the Glendale water works over a long period of years is several times greater than the maxi mum quantity of water that could be stored in the underlying beds in the area described. Therefore it is evident that most of the ground water consumed between Ivorydale and the Glendale waterworks has not been taken from storage but from recharge either from direct downward percolation in areas not far from the pumped wells, where the impervious beds may be absent, or from the more distant area of intake in the upper part of Mill Creek Valley, or in the lower part of the valley by northward percolation from the Ohio River or another intake area.
If the deeper water-bearing beds are nearly everywhere overlain by impermeable beds between Ivorydale and Lockland, so that water moves under impervious beds for a considerable distance, then the ability of the water-bearing beds to transmit water is an important factor in determining the quantity of water that can be pumped from them. Although it might be possible to increase recharge by artificial methods in the intake area .above Lockland, the perennial yield of the beds farther down the valley would depend largely on the maximum rate at which the water could travel through them. On the other hand, if there are permeable connections between the surficial beds and the deeper beds 'near the places of heavy draft, better results may be ob tained from artificial recharge near these places.
From 1938 to 1940 the Cincinnati district office, Corps of Engineers, U. S. War Department, was making a survey of Mill Creek Valley and the Cincinnati area for purposes of flood control. During this survey, several alternate plans for flood protection in Mill-Creek Valley were considered. These include (1) the construction of a barrier dam across the mouth of Mill Creek to protect the lower part of the valley from backwater from the Ohio River, and the placing of pumps to dispose of flows in Mill Creek during flood periods in the Ohio River; (2) the con struction of a dam on the West Fork of Mill Creek in the uplands north of Mount Healthy to be known as West Fork Reservoir, and the con struction of a dam across Mill Creek Valley at Sharon Avenue north of Lockland to be known as Sharonville Reservoir, which will provide for control of headwater floods in the Mill Creek Valley and thus will reduce the number of pumps required at the barrier dam; and (3) the possible construction of a diversion channel from the north end of the Sharonville Reservoir to the Miami River to aid in the disposition of headwater floods in Mill Creek. The considerations of these engineers involve different combinations of these individual plans. The possibility of coordinating a flood-control project with possible future projects to develop a water supply for municipal and industrial use in Mill Creek
100 GROUND-WATER RESOURCES OF THE CINCINNATI AREA
Valley was also considered. Dual-purpose reservoirs have been sug gested by local interests to supplement the ground-water supplies. It has been suggested, for example, the water from either of the storage reservoirs might be used directly for a water supply by transporting it to the point of use in the stream channels or in pipe lines; or, especially, that water from the Sharonville Reservoir might percolate into the ground at the reservoir or as it moved down Mill Creek to increase the ground- water recharge.
At the Glendale waterworks, a few hundred feet south of the line of the proposed Sharonville Dam, the surficial materials consist of nearly impermeable silt or clay to a depth of several feet. If these materials are present in the area to be covered by the proposed reservoir the strata could be removed if not too thick. Sand and gravel is found below the silt or clay at the Glendale waterworks and elsewhere along Sharon Avenue but the logs of deep wells in other parts of the area show that, at least in some places, there is a considerable thickness of clay. It is not certain whether the upper beds of gravel connect with the lower water-bearing beds to provide any large quantity of recharge through the bottom of the proposed reservoir.
In much of the Mill Creek Valley above the Glendale waterworks the water table is not far from the surface, and during wet seasons some of the land is so poorly drained that farm operations are hampered. If a reservoir is made above Sharon Avenue, not only the actual reservoir lands will be flooded but also the water table will be raised in a con siderable area near the reservoir, which tends to make the problem of drainage even more serious. Water possibly may pass under the dam and waterlog the lands below it unless an imprevious curtain is carried to a considerable depth, perhaps 50-feet or more. This condition might be mitigated to some extent by the drainage channel leading to the Miami River.
Preliminary data show that in some places the bottom of the diversion channel, as tentatively considered, would be below or about the level of the water table. In some places the effectiveness of the drainage channel possibly would be greatly reduced by a comparatively small rise of the water table above the present levels so that the drainage channel might be flooded by ground water, a condition that might easily happen during periods of heavy rainfall. In contrast, in other places the diversion channel might lower the water table so much during extended periods of low precipitation that it would be necessary to deepen wells. Con sidering that the water table in some wells has fluctuated as much as 10 to 15 feet in the relatively short period of the current investigation, it is necessary to consider carefully the relation between the water table in and about the Sharonville reservoir site and the tentatively proposed reservoir region, and also the relation of the water table to the profile
POSSIBLE ADDITIONAL SOURCES OF WATER SUPPLY 101
of the proposed diversion channel before the construction of either pro ject is undertaken. Before the reservoir is constructed with the ex pectation that it will serve to recharge the water-bearing beds, there should be extensive test drilling over a larger area and tft greater depths than has been possible in this investigation so as to determine whether conditions are favorable for recharge and whether the reservoir would likely waterlog the land. Whether a great amount of silt might be deposited in the reservoir and seal its bottom and reduce its efficiency for recharge must be considered carefully. The Cincinnati district office, Corps of Engineers, United States War Department, has made a survey of the silt in Sharon Woods Lake, which is in the Mill Creek drainage basin above Sharonville.
Sharonville and West Fork Reservoirs would control the floodwaters of Mill Creek in the upper parts of Mill Creek Valley and probably would increase the recharge to some extent by retarding the run-off. If arrangements could be made so that additional storage for water supply in addition to the storage for flood control could be provided, the reservoirs would furnish water for direct use or for additional re charge to increase the ground-water supply.
There has been considerable discussion of a plan, proposed by Mr. David C. Warner, to construct a series of dams at intervals along Mill Creek with the object of impounding some of the storm run-off and permitting it to percolate into the ground. It will be realized that, although at times there would be some velocity through the pools or reservoirs, at other times, especially in dry periods, there would be essentially no velocity. Under most circumstances, probably even in periods of heavy run-off, the pools would be sufficiently stagnant to allow the silt and clay, carried in suspension by the stream, to be de posited and to clog the pores of the water-bearing material If the pools were perennially filled it would not be possible to break up the silt cover merely by raking or harrowing but it would be necessary to resort to some kind of dredging, perhaps continuously. Actually the deposit of silt in the pools might become so thick as to offset any possible benefit of increased bottom and side area exposed to the water.
In considering artificial recharge in Mill Creek Valley, the principal factor is an adequate supply of surface water available for recharge. The difficulties with silt and organic matter that are carried in suspen sion in surface water have been discussed in a previous section. Mill Creek is extremely variable in flow and during several months of the year may be a most or completely dry in certain stretches. Records of the flow of Mill Creek at Koehler Street Bridge in Reading which were made by the Cincinnati district office, Corps of Engineers, United States War Department, show a minimum flow of only about 62,000 gallons a day during dry periods. If some sort of surface storage could
102 GROUND-WATER RESOURCES OF THE CINCINNATI AREA
be provided an artificial recharge system possibly might be operated throughout the year; if no surface storage could be provided the ground- water reservoir could be recharged only during parts of the year.
Suggestions "have been made that the ground-water supply in Mill Creek Valley may be materially increased by the flooding method of artificial recharge, in which floodwater is spread in a thin sheet over a broad area underlain by permeable material and allowed to percolate slowly into the ground. Some idea of the value of the flooding method may be obtained by the following computations. As a result of the heavy rains in mid-April 1939 the average rise in water level in eight wells within a mile on each side of the Glendale-Milford Road was about 10 feet. Information is not available as to the exact boundaries of the area that was flooded at this time. However if it was half a mile wide and 1 mile long, and if the specific yield was 20 percent, then the volume of water that went into storage in such an area during the 10-foot rise in water level was approximately 210,000,000 gallons. This would be equivalent to a supply of about 575,000 gallons a day for a year.
A detailed record of the rise and fall of the creek during the storm of April 1939 at Glendale-Milford Road is not available , but the record at. the Koehler Street Bridge in Reading shows that the creek reached its highest stage about 6:30 p. m. on April 16 and remained at an un usually high stage for about 38 hours. The land was flooded for 2 days or more. The water levels in most of the observation wells in this territory a few days after the land.was flooded were about 1 foot to 12 feet below the surface. If the area had been flooded for a longer period percolation into the surficial beds could have continued at the rate in dicated for only a few more days before the ground would have been saturated to the surface.
The rate at which the water table declined during extended periods without precipitation is perhaps more significant in indicating the rate at which artificial recharge could be maintained at a uniform rate. For example, there was no precipitation in the region from April 28 to" May 6, 1939, and for more than a week previously there had been very little rain. For the 8-day period from the afternoon of April 28 to the after noon of May 6, 1939, the average decline in water level in the eight wells referred to above ranged from about 0.3 foot to 1.1 feet and averaged 0.75 foot. Assuming a specific yield of 20 percent, the average change in level corresponds to a depth of water of 0.15 foot. This is equivalent to about 48,000 gallons per acre for the 8 day period, or about 7,000 gallons per acre per day. This would be about 1,900,000 gallons per day over the half square mile for which the estimate was made.
During the aforementioned period, the altitude of the water level in all the eight wells under consideration was above the level of Mill Creek.
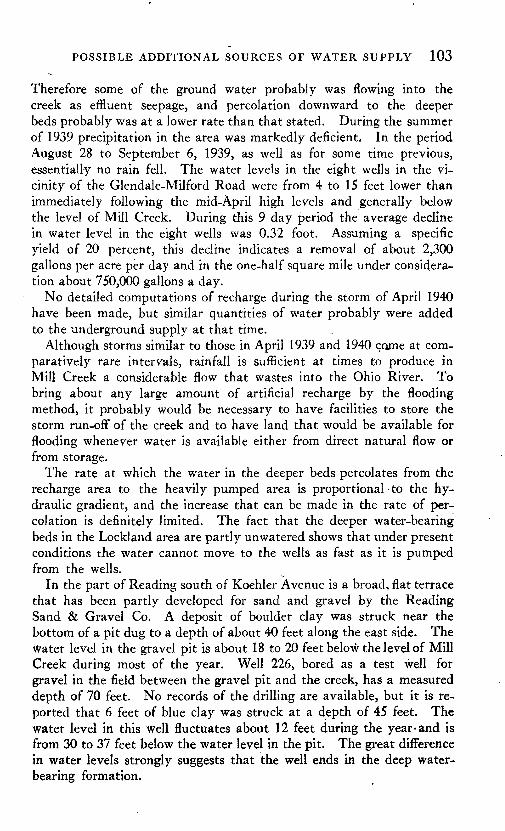
POSSIBLE ADDITIONAL SOURCES OF WATER SUPPLY 103
Therefore some of the ground water probably was flowing into the creek as effluent seepage, and percolation downward to the deeper beds probably was at a lower rate than that stated. During the summer of 1939 precipitation in the area was markedly deficient, In the period August 28 to September 6, 1939, as well as for some time previous, essentially no rain fell. The water levels in the eight wells in the vi cinity of the Glendale-Milford Road were from 4 to 15 feet lower than immediately following the mid-April high levels and generally below the level of Mill Creek. During this 9 day period the average decline in water level in the eight wells was 0.32 foot. Assuming a specific yield of 20 percent, this decline indicates a removal of about 2,300 gallons per acre per day and in the one-half square mile under considera tion about 750,000 gallons a day.
No detailed computations of recharge during the storm of April 1940 have been made, but similar quantities of water probably were added to the underground supply at that time.
Although storms similar to those in April 1939 and 1940 cojne at com paratively rare intervals, rainfall is sufficient at times to produce in Mill Creek a considerable flow that wastes into the Ohio River. To bring about any large amount of artificial recharge by the flooding method, it probably would be necessary to have facilities to store the storm run-off of the creek and to have land that would be available for flooding whenever water is available either from direct natural flow or from storage.
The rate at which the water in the deeper beds percolates from the recharge area to the heavily pumped area is proportional to the hy draulic gradient, and the increase that can be made in the rate of per colation is definitely limited. The fact that the deeper water-bearing beds in the Lockland area are partly unwatered shows that under present conditions the water cannot move to the wells as fast as it is pumped from the wells.
In the part of Reading south of Koehler Avenue is a broad, flat terrace that has been partly developed for sand and gravel by the Reading Sand & Gravel Co. A deposit of boulder clay was struck near the bottom of a pit dug to a depth of about 40 feet along the east side. The Water level in the gravel pit is about 18 to 20 feet below the level of Mill Creek during most of the year. Well 226, bored as a test well for gravel in the field between the gravel pit and the creek, has a measured depth of 70 feet. No records of the drilling are available, but it is re ported that 6 feet of blue clay was struck at a d,epth of 45 feet. The water level in this well fluctuates about 12 feet during the year-and is from 30 to 37 feet below the water level in the pit. The great difference in water levels strongly suggests that the well ends in the deep water bearing formation.
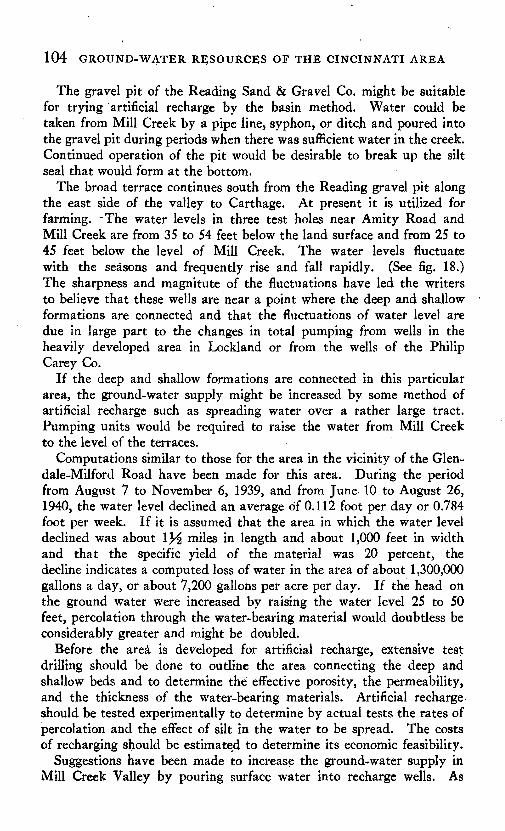
104 GROUND-WATER RESOURCES OF THE CINCINNATI AREA
The gravel pit of the Reading Sand & Gravel Co. might be suitable for trying artificial recharge by the basin method. Water could be taken from Mill Creek by a pipe line, syphon, or ditch and poured into the gravel pit during periods when there was sufficient water in the creek. Continued operation of the pit would be desirable to break up the silt seal that would form at the bottom.
The broad terrace continues south from the Reading gravel pit along the east side of the valley to Carthage. At present it is utilized for farming. -The water levels in three test holes near Amity Road and Mill Creek are from 35 to 54 feet below the land surface and from 25 to 45 feet below the level of Mill Creek. The water levels fluctuate with the seasons and frequently rise and fall rapidly. (See fig. 18.) The sharpness and magnitute of the fluctuations have led the writers to believe that these wells are near a point where the deep and shallow formations are connected and that the fluctuations of water level are due in large part to the changes in total pumping from wells in the heavily developed area in Lockland or from the wells of the Philip Carey Co.
If the deep and shallow formations are connected in this particular area, the ground-water supply might be increased by some method of artificial recharge such as spreading water over a rather large tract. Pumping units would be required to raise the water from Mill Creek to the level of the terraces.
Computations similar to those for the area in the vicinity of the Glen- dale-Milford Road have been made for this area. During the period from August 7 to November 6, 1939, and from June 10 to August 26, 1940, the water level declined an average o'f 0.112 foot per day or 0.784 foot per week. If it is assumed that the area in which the water level declined was about 1^ miles in length and about 1,000 feet in width and that the specific yield of the material was 20 percent, the decline indicates a computed loss of water in the area of about 1.300,000 gallons a day, or about 7,200 gallons per acre per day. If the head on the ground water were increased by raising the water level 25 to 50 feet, percolation through the water-bearing material would doubtless be considerably greater and might be doubled.
Before the area is developed for artificial recharge, extensive test drilling should be done to outline the area connecting the deep and shallow beds and to determine the effective porosity, the permeability, and the thickness of the water-bearing materials. Artificial recharge should be tested experimentally to determine by actual tests the rates of percolation and the effect of silt in the water to be spread. The costs of recharging should be estimated to determine its economic feasibility.
Suggestions have been made to increase the ground-water supply in Mill Creek Valley by pouring surface water into recharge wells. As
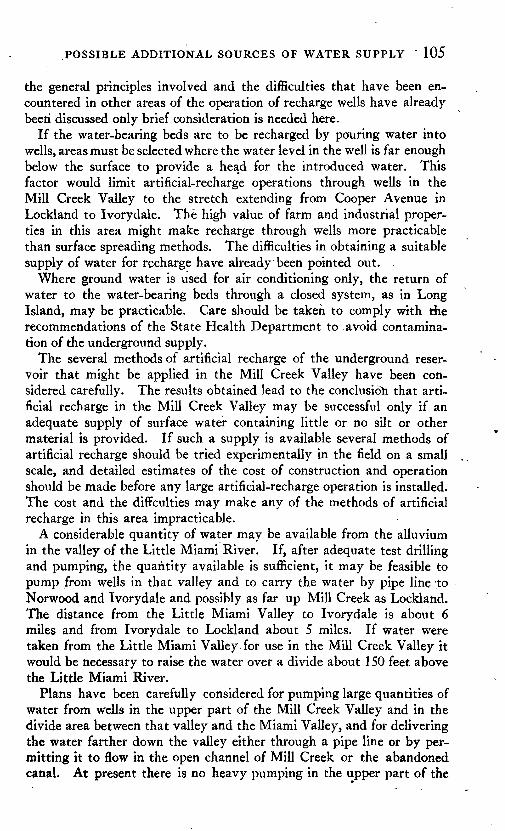
POSSIBLE ADDITIONAL SOURCES OF WATER SUPPLY 105
the general principles involved and the difficulties that have been en countered in other areas of the operation of recharge wells have already been discussed only brief consideration is needed here.
If the water-bearing beds are to be recharged by pouring water into wells, areas must be selected where the water level in the well is far enough below the surface to provide a head for the introduced water. This factor would limit artificial-recharge operations through wells in the Mill Creek Valley to the stretch extending from Cooper Avenue in Lockland to Ivorydale. The high value of farm and industrial proper ties in this area might make recharge through wells more practicable than surface spreading methods. The difficulties in obtaining a suitable supply of water for recharge have already been pointed out.
Where ground water is used for air conditioning only, the return of water to the water-bearing beds through a closed system, as in Long Island, may be practicable. Care should be taken to comply with the recommendations of the State Health Department to avoid contamina tion of the underground supply.
The several methods of artificial recharge of the underground reser voir that might be applied in the Mill Creek Valley have been con sidered carefully. The results obtained lead to the conclusidh that arti ficial recharge in the Mill Creek Valley may be successful only if an adequate supply of surface water containing little or no silt or other material is provided. If such a supply is available several methods of artificial recharge should be tried experimentally in the field on a small scale, and detailed estimates of the cost of construction and operation should be made before any large artificial-recharge operation is installed. The cost and the diffculties may make any of the methods of artificial recharge in this area impracticable.
A considerable quantity of water may be available from the alluvium in the valley of the Little Miami River. If, after adequate test drilling and pumping, the quantity available is sufficient, it may be feasible to pump from wells in that valley and to carry the water by pipe line to Norwood and Ivorydale and possibly as far up Mill Creek as Lockland. The distance from the Little Miami Valley to Ivorydale is about 6 miles and from Ivorydale to Lockland about 5 miles. If water were taken from the Little Miami Valley for use in the Mill Creek Valley it would be necessary to raise the water over a divide about 150 feet above the Little Miami River.
Plans have been carefully considered for pumping large quantities of water from wells in the upper part of the Mill Creek Valley and in the divide area between that valley and the Miami Valley, and for delivering the water farther down the valley either through a pipe line or by per mitting it to flow in the open channel of Mill Creek or the abandoned canal. At present there is no heavy pumping in the upper part of the
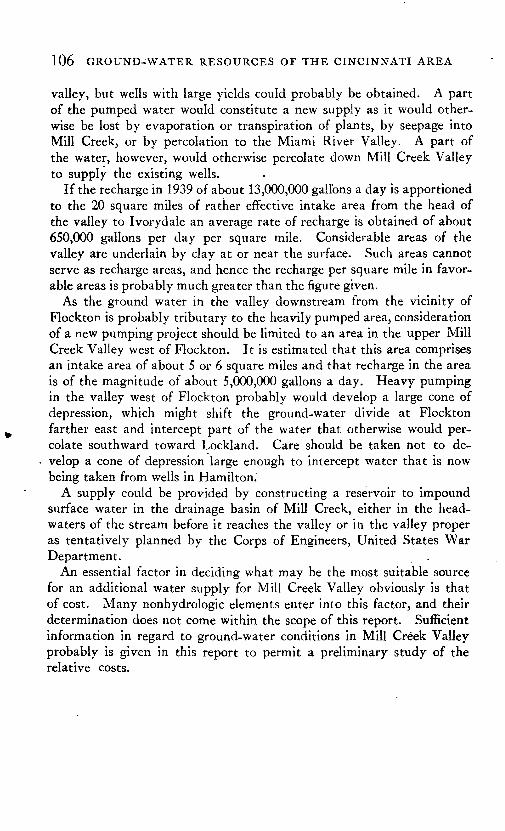
106 GROUND-WATER RESOURCES OF THE CINCINNATI AREA
valley, but wells with large yields could probably be obtained. A part of the pumped water would constitute a new supply as it would other wise be lost by evaporation or transpiration of plants, by seepage into Mill Creek, or by percolation to the Miami River Valley. A part of the water, however, would otherwise percolate down Mill Creek Valley to supply the existing wells.
If the recharge in 1939 of about 13,000,000 gallons a day is apportioned to the 20 square miles of rather effective intake area from the head of the valley to Ivorydale an average rate of recharge is obtained of about 650,000 gallons per day per square mile. Considerable areas of the valley are underlain by clay at or near the surface. Such areas cannot serve as recharge areas, and hence the recharge per square mile in favor able areas is probably much greater than the figure given.
As the ground water in the valley downstream from the vicinity of Flockton is probably tributary to the heavily pumped area, consideration of a new pumping project should be limited to an area in the upper Mill Creek Valley west of Flockton. It is estimated that this area comprises an intake area of about 5 or 6 square miles and that recharge in the area is of the magnitude of about 5,000,000 gallons a day. Heavy pumping in the valley west of Flockton probably would develop a large cone of depression, which might shift the ground-water divide at Flockton farther east and intercept part of the water that otherwise would per colate southward toward Lockland. Care should be taken not to de velop a cone of depression large enough to intercept water that is now being taken from wells in Hamilton.
A supply could be provided by constructing a reservoir to impound surface water in the drainage basin of Mill Creek, either in the head waters of the stream before it reaches the valley or in the valley proper as tentatively planned by the Corps of Engineers, United States War Department.
An essential factor in deciding what may be the most suitable source for an additional water supply for Mill Creek Valley obviously is that of cost. Many nonhydrologic elements enter into this factor, and their determination does not come within the scope of this report. Sufficient information in regard to ground-water conditions in Mill Creek Valley probably is given in this report to permit a preliminary study of the relative costs.

745213-^18 8
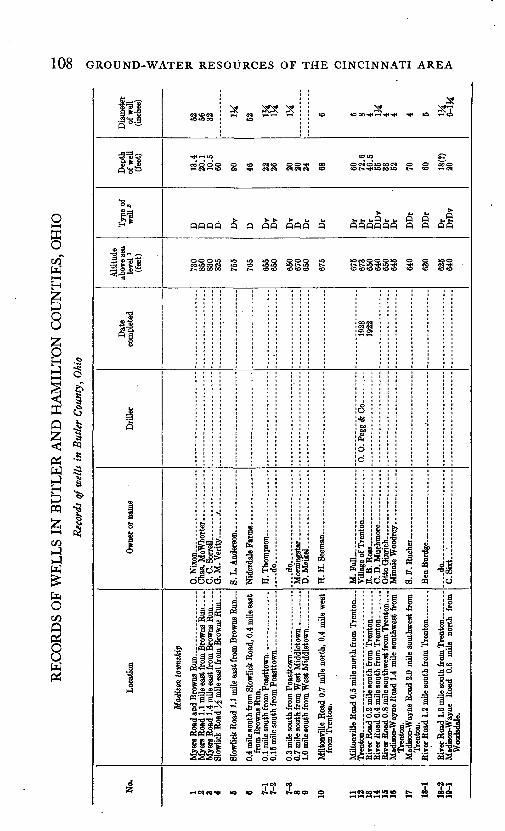
108 GROUND-WATER RESOURCES OF THE CINCINNATI AREA
t^s. «H^-4\ _4\tO 00 «< rH 52
COOOO O CO C4CO OO^< 00 C4CDU30OC4 O O OOt^ * >o co "5 t- eo ^
»t» b b bbbQi.bQQb Q QQ QftQ Q QQQQQQ Q Q QQ
T3 E~ ,3 "» »" S&ts
?OO»O UD U3 1OO OOO »O kQCQOOOta O O tOO _____ .^ ^ »o»O »OJ>»»O * - J>-t--»O^t»O^ ^* CC C^^fl*
s
Qa
Stf* JoS ooo
3QQ 55 W
* 1 d
S^wdoS ta PQ
d
g 0 g
8(S wPQ a 9
|*A 8 Is
f5&=i£l 1 lii ia1^:' * ^ « *<
8 S « :' g 'IfiJ * QQ
H 2 g S
£88?I -3 12
5°
ilrSS
111 -oo oOt-i
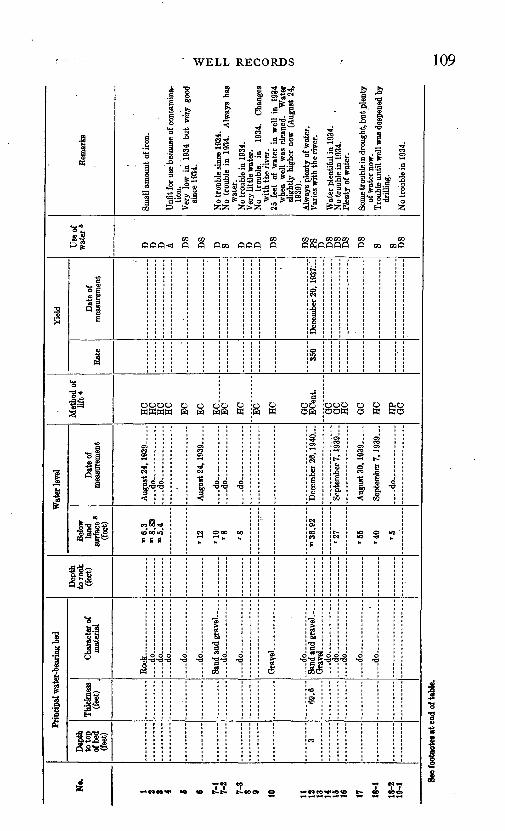
WELL RECORDS 109
2
Itj
J
Jlt*>
iie1
Aid .
13 Is
i!a
o B
Is
§
i s
1s
s |
II"CO
g13 §**"
2*g£
III
1ills6
!_|I
Ifll
i
§"8
' ' i
100
oocWWS
iOSCO CD
cq *»S "^ "
**
COcoa itea «a a
^ c
e
»«tNe
i '
1 -,8 *
"S j
3 -
.-°. :"
<ta.S j& >
=)«1 C
JO C SW f£
sc
*0
3
^ £
IX
>> 5k
i 33
1H
since 193
2 a5 C
C£
o& Cf^
S sgE
<:
c<
cT
T pC
1-;"("2
J ct
\ c.
CEE
'
CI T=
c
]&T3
§
J
J
.
l<
i;-1C!'
!l9 C&
>a
CfL
C
oc
J
^
«
1a
?3
S Ts i3 -*
lz : 3 1^5 P
; s
3 C
&
c
oc
c X
T
hllm +
3!
NS-
?JH K
^C
TpC
sJ s"«'2
1C
cf£
1 1
? >3
363,B-£i
i|:5 f a
a> C
k
1
3
1-1
1-SeS
!^1)T»^.1 rt fr.
3-1 2 1g«te *!^ .
i|l§* teHS ^
1 <
2 a5 C
C c
5
-^
i jj
s|
siHnt>
?gc
C<5a>
§ &
1iQ
i
^Qpq
J
SC4
1as(S
*CBto"CO
a
i
j8^
T3 P
It*
toc«CO
CO
^.^
^ pc
J
>iH
§"(n 1
&
V
%
4
-*
h
1 _3g >L's"
fo trouble
=KP
2 5525QC
;
§c te
jCOCD
1
6,da
cq
I
;
1
§4
jI
j
j
." -.r
: "
$ ^ -
H C
3 t/5 e
c
aST-l
9 sE
5
S
4
»-
I -1. "
§^ rar ,3|«sS-1of water :
i, ,Ul- .,
3 t-
3 o
Cft
a
1
I' "S
eg
! O ^
4
1
&1S'
i£
S£
il!-SH
3 V
P-te
H
CT
kC
i
e<c
_!^ Z
s C
a3C
§
,
S
h
5 »
333s
3 <
35
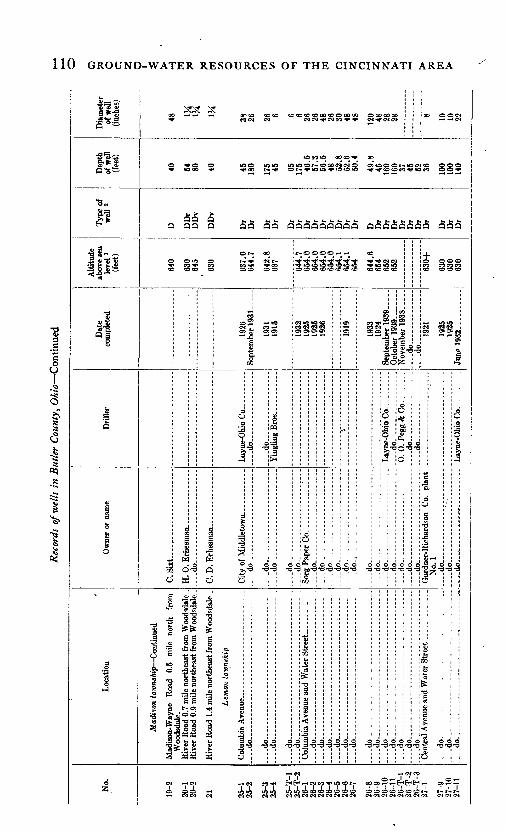
110 GROUND-WATER RESOURCES OF THE CINCINNATI AREA
1=3?!> § oo -« ^H ^* ao so eo «o CD ao co © ao ao ©oooooo
«5to«5 ocas'*o >oo UJU3 - 1
QQ O Q QQ Q QQ QQ QQQQQQQQQ QQQQQQQQ QQQ
iS^iIJJE^
Ot- 00t * ff4 e-*
S -4< -*mCO O CD
O O OO
I c <U3
. M-H> 5 OCT.,_ ,»'s
94 94IM
OQ O sr«
D gi 1HH 1-H -"
Pll .& ^S PnPn OS I
IM -HCS> ^.(M
O3 OO ^^ ftAUSi-« C<l C<l Cfl (M Cq
IQ IQ
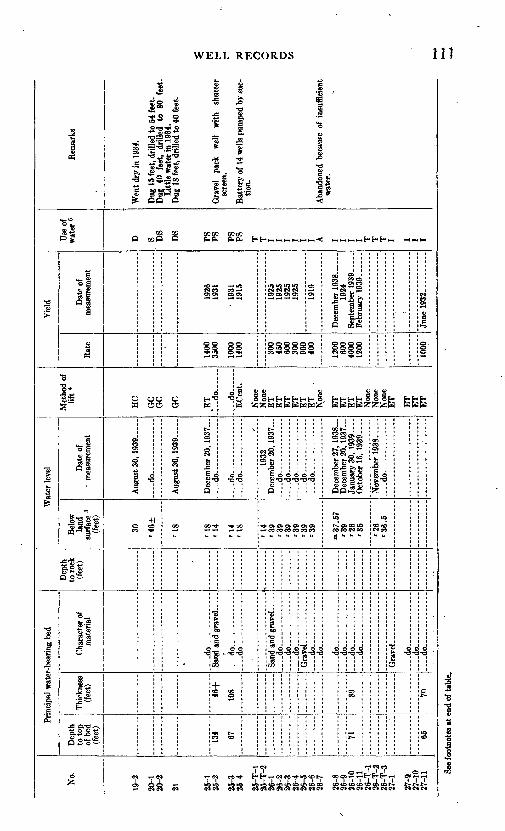
No.
19-2
20-1
20
-2
21 25-1
25
-2
25-3
25
-4
25-T
-l
25-T
-2
26-1
26
-2
26-3
26
-4
26-5
26
-6
26-7
26-8
26
-9
26-1
0 26
-11
26-T
-l
26-T
-2
26-T
-3
27-1
27-9
. 27
-10
27-1
1
Prin
cipa
l wat
er-b
earin
g be
d
Dep
th
to to
p of
bed
(fee
t)
134 67 71 65
Thic
knes
s(f
eet)
46+
108 89 70
Cha
ract
er o
f m
ater
ial
....do- - -
~~
4a~
--~
-do
....d
o-.
.. ...
. ..
. -
..._
dO
------ - .
.....d
o .
...... ...
.
....d
o- . ..
... .
do.. ... .... .
.
....
do ... ..
...
.... d
o -,. .
,.-d
o ... ..
do
..-do
..... .....
....do ..
.. .
....d
o.. ..
... ....
Dep
th
to r
ock
(fee
t)
...
Wat
er le
vel
Bel
ow
land
su
rfac
e 3
(fee
t)
30 '46±
'18
'18
'14
'14
'18
'14
'39
'39
'39
'39
'3
9
'39
"37
.57
'3
9
'26
'3
5
'26
'36
.5
Dat
e of
mea
sure
men
t
Aug
ust 3
0, 1
93
9 .
d
o
Aug
ust 3
0, 1
939-
Dec
embe
r 20
, 1937
....
do -
....
do
do
. -
1932
D
ecem
ber
20, 1
93
7
.d
o -
do do
-dO
...
... -
-.-
dO
-.-
- .
Dec
embe
r 27
, 1938
Dec
embe
r 20
, 1937
Janu
ary
30, 1
93
9
Oct
ober
16,
193
9. ...
Nov
embe
r 19
38. .
...
....
do ....
Met
hod
of
lift
*
HC
GC
G
C
GC
.ET
. do- ..
.... d
o ...
EC
ent.
Non
e N
one
BT
B
T
BT
B
T
BT
B
T
, N
one
BT
B
T
BT
B
TN
one
Non
e N
one
ET
ET
B
T
BT
Yie
ld
Rat
e
1400
35
00
1000
14
00 300
450
600
300
900
400
1200
60
0 40
00
1200
1000
Dat
e of
m
easu
rem
ent
1926
19
31
19
31
1915
1925
19
25
1925
19
25
1919
Dec
embe
r 1
93
8
1924
Se
ptem
ber 1
93
9-.
Fe
brua
ry 1
939 .
.....
June
193
2, .........
Use
of
wat
er 5
D S DS
DS
PS PS PS PS T
T
I I I I 1 A I I I I T
T
T
I I I I
Rem
arks
Wen
t dry
in 1
934.
Dug
15
feet
, dri
lled
to 5
4 fe
et.
Dug
40
fe
et,
drill
ed
to
80
feet
. L
ittle
wat
er in
193
4.
Dug
18
feet
, dri
lled
to 4
0 fe
et.
Gra
vel
pack
w
ell
with
sh
utte
r sc
reen
.
Bat
tery
of
14 w
ells
pum
ped
by s
uc
tion.
Aba
ndon
ed b
ecau
se o
f in
suff
icie
nt
wat
er.
See
foot
note
s at
end
of t
able
.
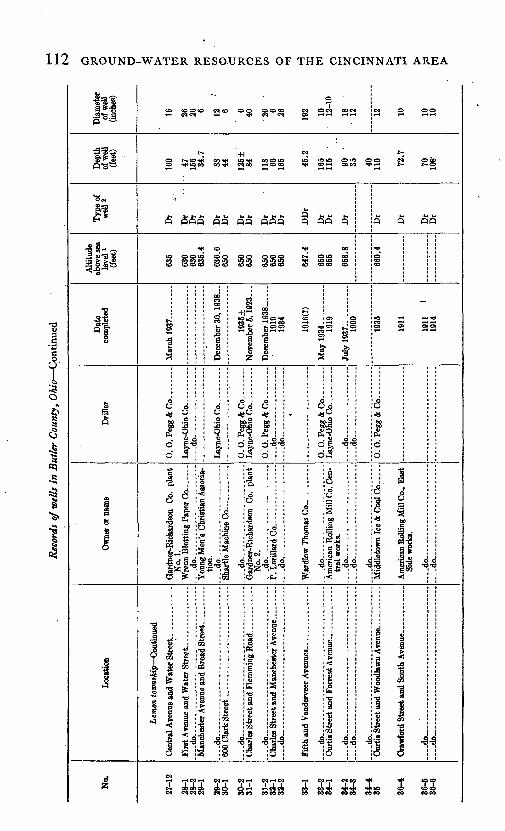
112 GROUND-WATER RESOURCES OF THE CINCINNATI AREA
cq o oo cococo-H »(<««
cq ocq oo« cat o oo
cc-v afv bo coo *a to to o «oWV P>00 rtCOCO «!< ^^ OPS
Q QQQ QQ QQ QfiQ Q QQ Q Q Q QQ
is^ii fe fe.s. eo coeoeo eo
°.| °. oJ o
« §
* §
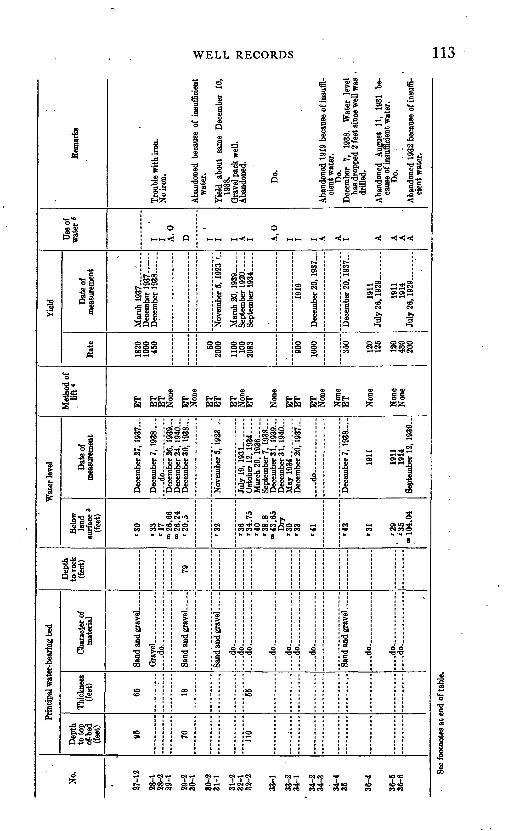
WELL RECORDS 113
1 3SS1: feJ
3| ':§,: i'i. "si3-eD-S^J J$0 J-si
2 fe ^1^3 M«
1 It-1 M<!l-< <! HHI 1 1 1<! <il-<
322
c-e-03 P.
12; SGQ
S !
ni^ S o ooco O OO CO
O OU9 OOOus c<ic<i «eoo
HZ§H § &,& &
S S c S
oU
.,
>>-|S'S.
CO (MCOO
".:" 8 .
T3 >S L
so O
1 21 2^ ^12 1 ^T "i1 ? I 1 55JCT. efcA 6^< ^cSieii iA eo4i -w-* .-Aw to «6<oc<i CM eo coco eocoeo co coco coco coco eo coco
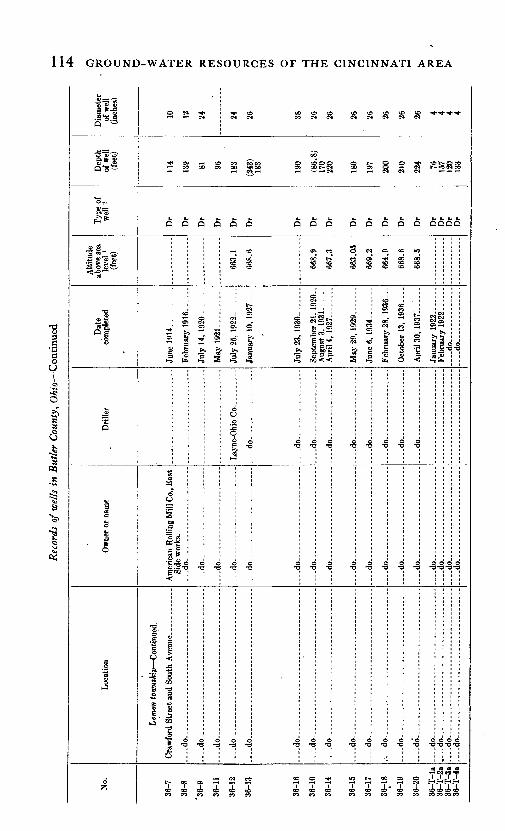
114 GROUND-WATER RESOURCES OF THE CINCINNATI AREA
-§15 8S **"§
b ^
o-s-
1=H*
sS-~Ijll
l|°l
1
1j-|«
C
O
.0"3
J
0
C
"*
O
5a
*r
J
C
e_c
1
.j
-
S =o 45i, *is -
1 1l-i* i
1o
S
<N
o c*-
C
ce c
1:
1
1
1Ofe*C3 ^ 3"^CO
c
«
"«(N
T oc
C
S
*»-
i
c c
c -e
I
cca
C
1i
1
c"C
cT
i
«IN
o- a
C
_i
scr
^IN'i
ae
!c
j
-i
4
IN)
5
cee>
cc
S
a
ce
1
^
c
!* 1*-
c , "^
c^
c ^
CO
2CO
exe*"
CO C
.*-' *"
C
1*~IN
^
C T
e r
c
ce
cl
) CC> (N
QC
CCac
C
<y.
sCC
1sic. > "S
0*
-i
c c
c -e
0
S
<c
SI
a
ccIr^-cecc
i
«-- " *
II
c -c
c
*
CO
CCIN
i *
a
sccCC
a:
2o
i
4
c
4
«5
CC
cc(N
! J> O r-
C
IN
; C£ CC
Scy
«
1 £
S
e c
c
^
CO
> cc
c
C
a
Scc
c<a
XIN
> . J
I '
4
cT
c
QO
«
ccIN
C
S
a
CC
; oc ceCC
cea' cri "^
\£c
c ^
c =
4
Ol i
cco.
sIN
C
If
aCC
S1
cf 'S <
4
eT
c
oIN)
CO
> -o
g
c
1>0
*
cT
c -c
»
«
II
c
so-,-.
E
1
-i
c
f^t
&
«^l
s
C
>
c"^
c r
c
a
2 iCO
«^«
S o- 0
C
c-e
cT
^
I
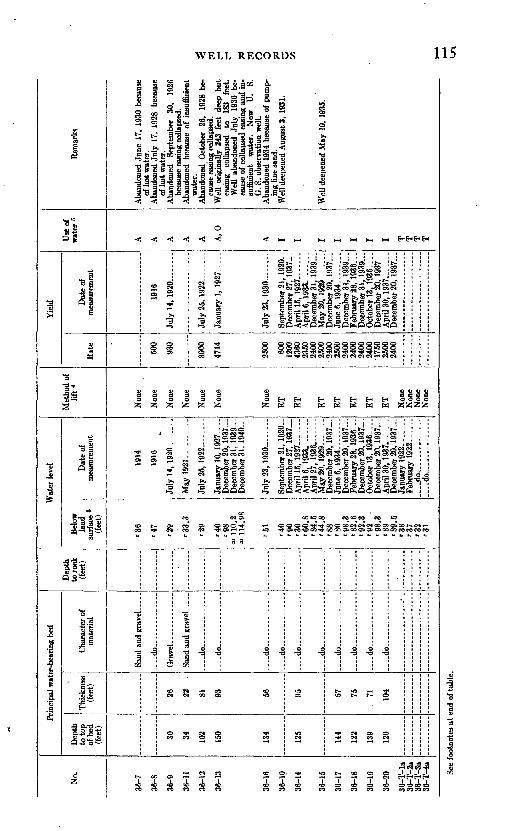
No.
36-7
36-8
36-9
36-1
1
36-1
2
36-1
3
36-1
6
36-1
0
36-1
4
36-1
5
36-1
7
36-1
8
36-1
9
36-2
0
36-T
-la
36-T
-2a
36-T
-3a
36-T
-4a
Prin
cipa
l wat
er-b
eari
ng b
ed
Dep
th
to to
p of
bed
(fee
t)
30
34
102
150
134
125
144
122
139
120
Thic
knes
s(f
eet)
26
22
.
81
93 56 95 57
75
, 71
104
Cha
ract
er o
f m
ater
ial
d
o
... .
do
..-d
o - .
. ...
do
... .
....... ...
d
o .
. ...
do..
. ......... ..
do . ..
.... -
do
....
do
...
. .......
--do
....do- .........
Dep
th
to ro
ck(f
eet)
Wat
er le
vel
Bel
ow
land
su
rfac
e 3
(fee
t)
'36
'47
'29
'33.3
'29
'40
'9
8
"11
0.2
m 114.9
8
'51
'40
'90
'3
0
'60
.8
'84
.5
'44
.8
'88
'80
*98.
3 '8
2.6
'9
2.3
'9
2
'9
8.3
'8
9 '8
9.5
'3
8
'37
'32
'31
Dat
e of
m
easu
rem
ent
1914
1916
July
14,
192
0..-
-..-
.
May
19
21
---
July
25,
1922 .
...
Janu
ary
10, 1
927 .
...
Dec
embe
r 20
, 1937
Dec
embe
r 31
, 1939
Dec
embe
r 31
, 1940
July
23,
1930 .
....
Sept
embe
r 21
, 19
20-
Dec
embe
r 27,
1937
Apr
il 15
, 1
92
7 .
...
Apr
il 6,
1933.
Apr
il 27
, 1
93
6
..M
ay 2
0, 1
929
Dec
embe
r 20
, 1
93
7
June
6, 1
934.
--.
...-
Dec
embe
r 20
, 1937
Febr
uary
28,
193
6- .
Dec
embe
r 20
, 1937
Oct
ober
13,
1936
Dec
embe
r 20
, 1937
Apr
il 30
, 1
93
7
D
ecem
ber
20, 1937
....do....... .
....
..
Met
hod
of
lift
*
Non
e
Non
e
Non
e
Non
e
Non
e
Non
e
Non
e
ET
ET
ET
ET
ET
ET
ET
Non
e N
one
Non
e N
one
Yie
ld
Rat
e
500
930
3000
4714
2500 60
0 12
00
4360
23
50
2400
25
00
2400
25
00
2400
24
00
2400
24
00
'175
0 25
00
2400
Dat
e of
m
easu
rem
ent
1916
July
14,
1920 .
.. .
July
25,
1922 .
....
July
23,
1930 .
....
Sept
embe
r 21
, 19
20-
Dec
embe
r 27
, 1937
Apr
il 15
, 1927
Apr
il 6,
19
33
..
.D
ecem
ber
31,
1939
_
May
20,
1929 .
Dec
embe
r 20
, 19
37 ..
. Ju
ne 6
, 19
34. .
....
..D
ecem
ber
31,
1939
Febr
uary
28,
19
36
D
ecem
ber
31,
1939
Oct
ober
13,
193
6 ....
Dec
embe
r 20
, 19
37
Apr
il 30
, 1937 ..
.D
ecem
ber
20,
1937
Use
of
wat
er s
A
A
A
A
A
A, 0
A
I I I I I I I T
T
T
T
Rem
arks
Aba
ndon
ed J
une
17,
1930
bec
ause
of
hot
wat
er.
Aba
ndon
ed J
uly
17,
1928
be
caus
e of
hot
wat
er.
Aba
ndon
ed
Sept
embe
r 30
, 19
26
beca
use
casi
ng c
olla
psed
. A
band
oned
bec
ause
of
insu
ffic
ient
w
ater
. ^
Aba
ndon
ed O
ctob
er
26,
1928
be-
5j
ca
use
casi
ng c
olla
psed
. fr
j W
ell
orig
inal
ly 2
43 f
eet
deep
but
(->
ca
sing
co
llaps
ed
to
183
feet
. f«
W
ell
aban
done
d Ju
ly
1936
be
ca
use
of c
olla
psed
cas
ing
and
in-
7^
suff
icie
nt
wat
er.
Now
U
. S.
W
G
. S. o
bser
vatio
n w
ell.
O
Aba
ndon
ed 1
934
beca
use
of p
ump-
Q
in
g fin
e sa
nd.
73
Wel
l dee
pene
d A
ugus
t 3,
1931
. Q V
3
Wel
l dee
pene
d M
ay 1
0, 1
935.
»
See
foot
note
s at
end
of t
able
.
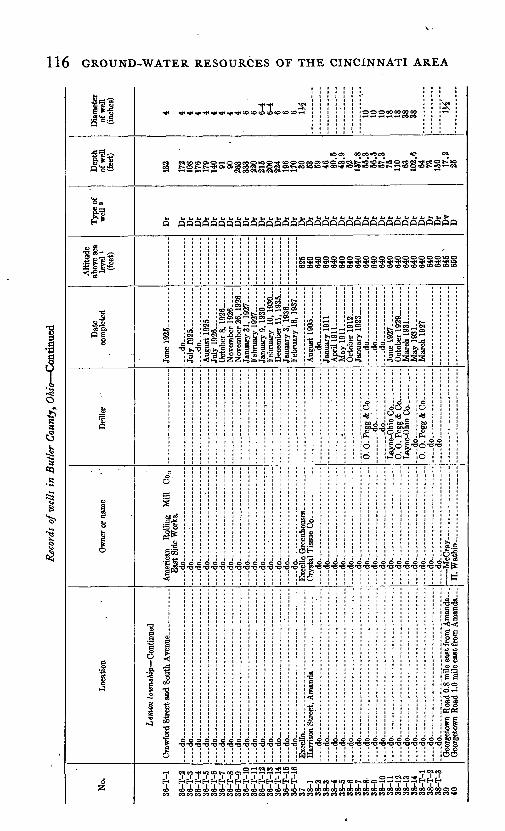
Rec
ords
of w
ells
in
But
ler
Cou
nty,
Oh
io C
ontin
ued
No.
36-T
-l
36-T
-236
-T-3
36-T
-436
-T-5
36-T
-636
-T-7
36-T
-836
-T-9
36-T
-10
36-T
-ll
36-T
-12
36-T
-13
36-T
-14
36-T
-15
36-T
-16
37 38-1
38-2
38-3
38-4
38-5
38-6
38-7
38-8
38-9
38-1
038
-11
38-1
238
-13
38-1
438
-T-l
38-T
-238
-T-3
39 40
Loc
atio
n
Lem
on t
owns
hip C
ontin
ued
d
O
do
. d
o .
....
....
....
....
....
....
....
....
......do. ..
. .............
..................
.,..
dO
--.-
........... ...................
....do ..
... .
............
....
....
....
....
.....do -. . .
....do .
....
....
....
......
....
....
....
....
....do.... ..
. ...
....
...
....
....
....
....
....
.....do . .
...
do....
....do .......... ...
....
....
....
....
....
..-.
..do... .
..................................
do-.
..do .
..................................
.d
o '.
d
o .
....dO
.... ...........
.d
o .... ...
....
... ........ ..
....
....
do
...
... .
............ . ........ ..
....
do... .
..... ...... ............... ....
dO
.do
-..
.d
o. -dO
....
do.
........ ............ ...... ..
....
....
do
...
....do.... ........
.. ..
.... . ..
. d
o. . .... ...... .....
d
o
.do . ..... .
Ow
ner
or n
ame
Eas
t Si
de W
orks
. d
o
d
o : ~
.do
do
-
... -
do......... ..
. .....
....-d
o-.
. ...
.. ...........
..-do ..
....
......... ......
....do... ..
. ...... .
.... ..
.. .d
o -
....d
o ........... ........
....do..... .
....
....
....
....
....
.. d
o... ..
. ... ..
.
do
....d
o -
... ......... .
......
d
o
d
o -
.-.d
o ..
.. ..
....
......
d
O
do d
o .
... .
do... .
... ... .
... ....... ...
-dO
.... ...... .....
....d
o
do
ao ..
... ..
. .
.d
o ..
....
.
.dO
.. ........ ...
d
o
....do. ..
... ..
....
. . d
o... ..
... .
.. ..
...
.... d
o... . ..
... .
... .
.. M
cCra
y ..
........
......
H. W
ath
in . __
Dril
ler
^
*
^
6. O
.PeB
g&C
o. .
........do
do..... -.
Dat
e co
mpl
eted
June
192
5. ..
.... d
o
July
1925 -
July
19
26
. .
Oct
ober
8, 1928
Nov
embe
r 26
, 192
8 Ja
nuar
y 31
, 19
27 ..
..
Febr
uary
16,
193
7 ...
Apr
il 19
11...
..
.M
ay 1
911.
Oct
ober
1912.. .
Janu
ary
1923
___
.... d
o
.... d
o ...
.. .
do
June
192
7.
Oct
ober
19
29
Mar
ch 1
93
1 .
May
193
1. .........
Mar
ch 1
927
Alti
tude
ab
ove
sea
leve
l i
(fee
t)
625
640
640
640
640
640
640
640
640
640
640
640
640
640
640
640
640
640
645
'65
0
Typ
e of
w
ell2
Dr
Dr
Dr
Dr
Dr
Dr
Dr
Dr
Dr
Dr
Dr
Dr
Dr
Dr
Dr
Dr
Dr
Dr
Dr
Dr
Dr
Dr
Dr
Dr
Dr
Dr
Dr
Dr
Dr
Dr
Dr
Dr
Dr
Dr
Dv
D
Dep
th
of w
ell
(fee
t)
132
172
108
176
179
140 91 90 263
333
220
215
200
224
196
170 30 53 59 46 80
.543
.952 15
7.8
55.3
56.5
57.3
75 110 63 102.
664 73 15
0 17.2
25
Dia
met
er
of w
ell
(inch
es)
4 6 .
6 6-4
6-4
6 6 6 IK 10 10 10 18 18 38 38 W
ON
O § d 3 d k w
.
O d * o
w W
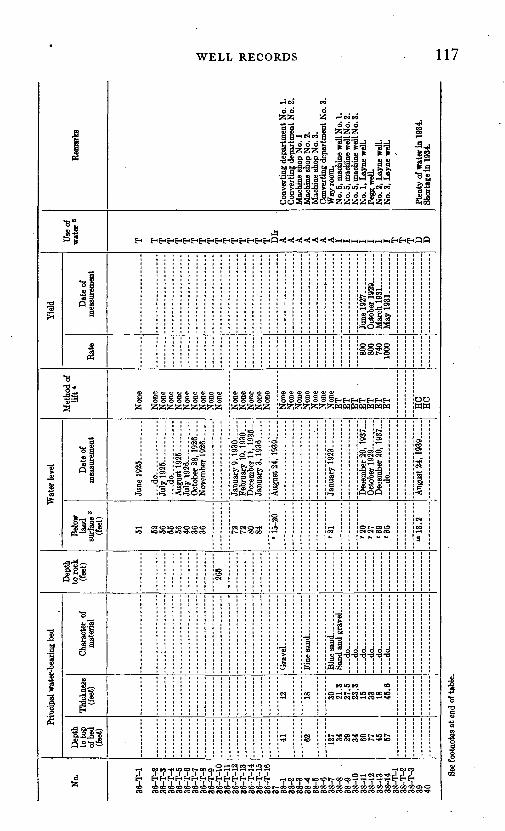
No.
36-T
-l
36-T
-2
36-T
-3
36-T
-4
36-T
-5
36-T
-6
36-T
-7
36-T
-8
36-T
-9
36-T
-10
36-T
-ll
36-T
-12
36-T
-13
36-T
-14
36-T
-15
36-T
-16
37
38-1
38
-2
38-3
38
-4
38-5
38
-6
38-7
38
-8
- 38
-9
38-1
0 38
-11
38-1
2 38
-13
38-1
4 38
-T-l
38
-T-2
38
-T-3
39
40
Prin
cipa
l wat
er-b
eari
ng b
ed
Dep
th
to to
p of
bed
(f
eet)
41 62 127 34
29
34
60
77
45
57
Thic
knes
s (f
eet)
12 18 30
21.3
27
.5
23.3
15
33
18
45
.6
Cha
ract
er o
f m
ater
ial
....
do
. ..
.. ..
.. ..
... .
do ..
.....
do
. d
o
....do ..
... .
....
do
.....
Dep
th
to r
ock
(fee
t)
265
Wat
er le
vel
Bel
ow
land
su
rfac
e 3
(fee
t)
51 52
56
55
56
40
36
36 72
72
80
84 ' 15
-20
'21 ,
'20
'27
'39
'35
"13.2
Dat
e of
m
easu
rem
ent
d
o
July
19
25
July
1926.
......
.O
ctob
er 2
8, 1
926....
Nov
embe
r 19
26 ..
...
Janu
ary
9, 1
930 .
....
Fe
brua
ry 1
0, 1
930.
.. D
ecem
ber
11,
1936
Janu
ary
3, 1
936 _
..
Aug
ust 2
4, 1
939-
...
Dec
embe
r 20
, 19
37...
Oct
ober
192
9 __
Dec
embe
r 20
, 1937
.... d
o..
....
... .
....
Aug
ust 2
4, 1
939
Met
hod
of
lift
*
Non
e
Non
e N
one
Non
e N
one
Non
e N
one
Non
e N
one
Non
e N
one
Non
e
Non
e
Non
e
Non
e N
one
Non
e E
T
ET
E
T
, E
T
ET
E
T
ET
HC
H
C
Yie
ld
Rat
e
800
800
740
1000
Dat
e of
m
easu
rem
ent
Oct
ober
10
20
.
Mar
ch 1
931
M
ay 1
931.... ..
....
Use
of
wat
er6
T T
T
T
T
T
T
T
T
T
T
T
T
T
T
T DIr
A
A
A
A
A
A
A
I I I I I I I T
T
T
D
D
Rem
arks
Con
vert
ing
depa
rtm
ent N
o. 1
. C
onve
rtin
g de
part
men
t No.
2.
Mac
hine
sho
p N
o. 1
M
achi
ne s
hop
No.
2.
Mac
hine
sho
p N
o. 3
. C
onve
rtin
g de
part
men
t N
o. 3
. W
ay r
oom
. N
o. 5
, mac
hine
wel
l No.
1.
No.
5, m
achi
ne w
ell N
o. 2
. N
o. 5
, mac
hine
wel
l No.
3.
No.
1, L
ayne
wel
l. Pe
gg w
ell.
No.
2, L
ayne
wel
l. N
o. 3
, Lay
ne w
ell.
Plen
ty o
f wat
er in
193
4.
Shor
tage
in 1
934.
w f
r1 *
M o o * o CO
See
foot
note
s at
end
of t
able
.
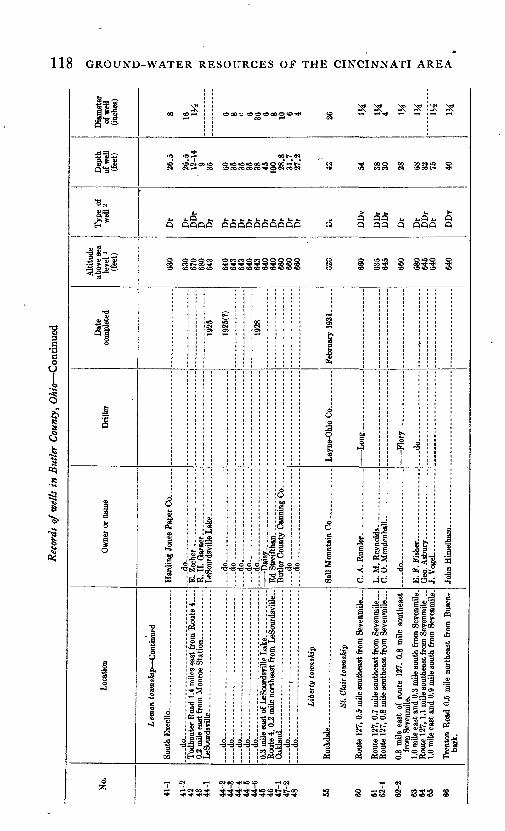
118 GROUND-WATER RESOURCES OF THE CINCINNATI AREA
OOO- CO CO CO 00 O CO *l<
co^oeqco ooo oo ooc^u: o coco N cocot- ^c
. . .h «-Q t, hbt.bht.bbh>. - Q OO h >-O h QQ QQQQ OQQOQOQOQO « Q QQ Q QQO Q
oooco o eo cooeoooCOt^OO-** ^f -^ *!* -^ -^ -^ -^ t«D CO CO CO CO CO CO CO CD CO CO C
o io»o o ouso oO CO^* CD OO^'V ^*C& COCO CO CD CO CO CO
.8
W«.3
I «S
SoJO
J5
Jis .s
= 1
8888
88t^oo00
IIo o
JJ^JJ
s""^ oo 2-
U5 Ous co
-<N«oeo
COCCUS COco«oeo tS
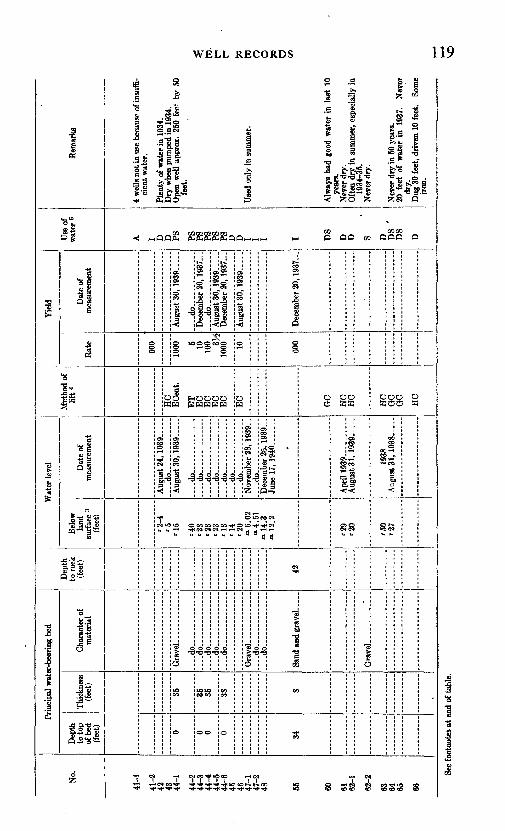
No.
41-1
41-2
42
43
44
-1
44-2
44
-3
44-4
44
-5
44-6
45
46
47
-1
47-2
48 55 60 61
62
-1
62-2
63
64
65 66
Prin
cipa
l wat
er-b
earin
g be
d
Dep
th
to to
p of
bed
(fee
t) 0 0 0 0 34
Thic
knes
s (f
eet)
35 35 35 38 8
Cha
ract
er o
f m
ater
ial
....
do
....
....
....
....
..d
o..
....
....
....
..-d
o..............
... .
do.
....do. .
.do.... ...,..
...-
do..............
Sand
and
gra
vel
Dep
th
to r
ock
(fee
t)
42
Wat
er le
vel
Bel
ow
land
su
rfac
e 3
(fee
t)
'2-4
'5
'1
5
'40
'23
'23
'23
'13
'14
'20
i»6.
02
M.5
1»14.3
" 1
2.2
'29
'20
'50
'27
Dat
e of
m
easu
rem
ent
Aug
ust 2
4, 1
939
Aug
ust
30, 1939
d
o .
....
do
do
....
do
.d
o:.
.
....do
....
do
....do ..
..
Dec
embe
r 26
, 19
39...
June
17,
19
40
...... .
Apr
il 1939 .
......
Aug
ust 3
1, 1
939 .
1938
A
ugus
t 31,
1938
Met
hod
of
lift
*
HC
EC
ent.
ET
E
C
EC
E
C
EC
EC GC
HC
H
C
HC
G
C
GC
HC
Yie
ld
Rat
e
600
1000 5 10
10
0 3^
1000 10 60
0
Dat
e of
m
easu
rem
ent
Aug
ust
30,
1939
. ...
.
d
o
Dec
embe
r 20
, 1
93
7
d
o.... ...
..A
ugus
t 30,
1939
Dec
embe
r 20
, 1937
Aug
ust.
30, 1939-.
-
Dec
embe
r 20
, 1937
Use
of
wat
er 5
A I D
D PS PS
PS
PS
PS
PS
D
D
I I I I DS
D
D S D
, D
S D
S
D
Rem
arks
4 w
ells
not
in u
se b
ecau
se o
f ins
uffi
ci
ent w
ater
.
Plen
ty o
f wat
er in
193
4.
Dry
whe
n pu
mpe
d in
193
4.
Ope
n w
ell
appr
ox.
250
fee'
by
50
feet
.
Use
d on
ly in
sum
mer
.
Alw
ays
had
good
wat
er i
n la
st 1
0 ye
ars.
N
ever
dry
. O
ften
dry
in
sum
mer
, es
peci
ally
in
1934
-35.
N
ever
dry
.
Nev
er d
ry in
50
year
s.
20 f
eet
of w
ater
in
1937
. N
ever
dr
y.
Dug
30
feet
, dri
ven
10 f
eet.
Som
e ir
on.
See
foot
note
s at
end
of t
able
..
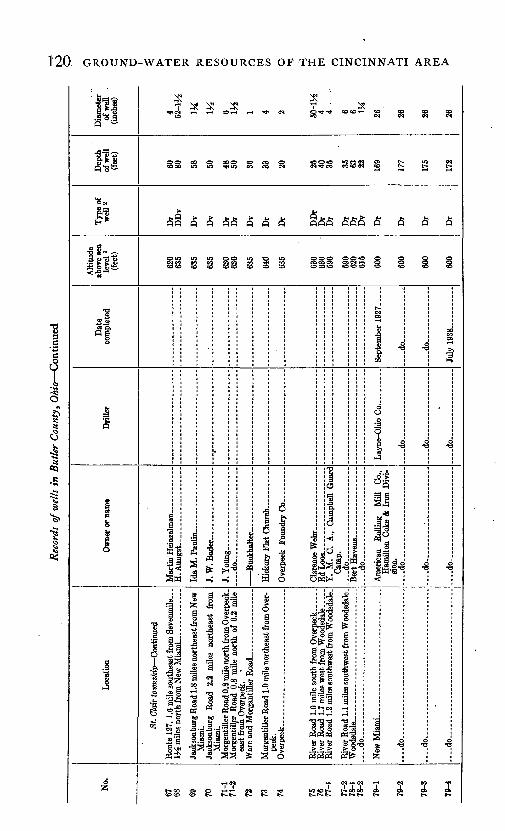
120 GROUND-WATER RESOURCES OF THE CINCINNATI AREA
fl oo o coo to co o 10010 tame* roIO IO TtHQ CO CO CM OI^CO COEOOI CO
QQ Q Q QQ Q Q
i 8 M oooSSg
-
a -
|31° ^5
** S *=3 «>:O _
H M fe fe i.'S3 b ^J^a^llllpl
OS O r-«t-t (M CO
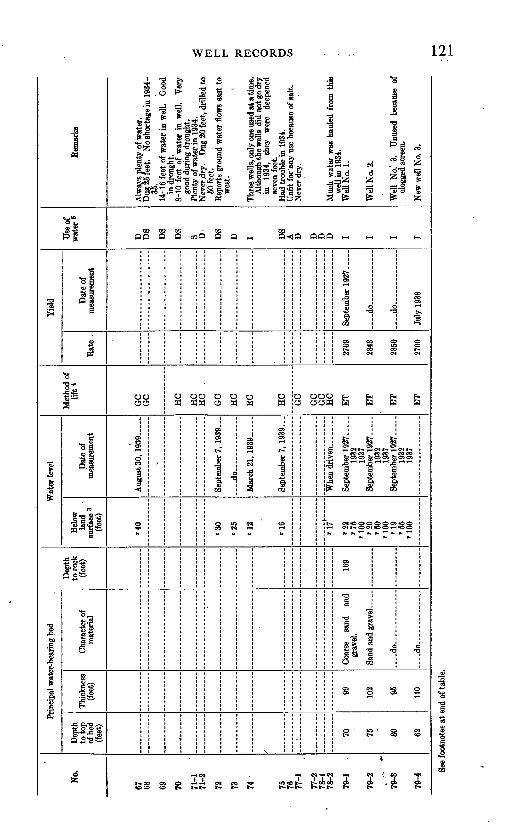
No.
«7
68 69
70 71-1
71
-2
72
73
74
75
76
77-1
77-2
78
-1
78-2
79-1
79-2
79-3
79-4
Prin
cipa
l wat
er-b
eari
ng b
ed
Dep
th
to to
p of
bed
(f
eet)
-
70
75
80
62
Thic
knes
s (f
eet)
99
102 95
110
Cha
ract
er o
f m
ater
ial
Coa
rse
sand
an
d gr
avel
.
d
o. J .
....d
o..
....
.. ... ..
.
Dep
th
to r
ock
(fee
t)
1 169
Wat
er le
vel
Bel
ow
land
surf
ace
3 (f
eet)
'40
'30
'25
'12
'16
--,
'22
'75
'1
00
'20
'5
0
'100
'1
9
'55
'100
Dat
e of
m
easu
rem
ent
Aug
ust 3
0, 1
939-
_
Sept
embe
r 7,
193
9 ...
do
Mar
ch 2
1, 1
939
Sept
embe
r 7,
193
9- __
Sept
embe
r 1927
1932
19
37
1932
19
37
Sept
embe
r 19
27. .
...
1932
19
37
Met
hod
of
lift
*
GC
G
C
HC
HC
H
C
,
GC
HC
EC
HC
GC
GC
G
C
HC
ET
ET
ET
ET
Yie
ld
Bat
e .
2769
2843
2850
2700
Dat
e of
m
easu
rem
ent
.... d
o ....... ..
.
.d
o..
... .
........
July
193
8
Use
of
wat
er 5
D DS
DS
DS
S D DS
D
I DS
A
D D
D
D I I I I
Rem
arks
Alw
ays
plen
ty o
f wat
er.
Dug
25
feet
. N
o sh
orta
ge in
193
4-
35.
14-1
6 fe
et o
f wat
er in
wel
l. G
ood
in d
roug
ht.
8-10
fee
t of
wat
er i
n w
ell.
Ver
y go
od d
urin
g dr
ough
t. Pl
enty
of w
ater
in 1
934.
N
ever
.dry
. D
ug 2
0 fe
et, d
rille
d to
50
fee
t. R
epor
ts g
roun
d w
ater
flo
ws
east
to
wes
t.
Thr
ee w
ells
, onl
y on
e us
ed a
t a ti
me.
A
lthou
gh th
e w
ells
did
not
go
dry
in
1934
, th
ey
wer
e de
epen
ed
seve
n fe
et.
Had
trou
ble
in 1
934.
U
nfit
for '
any
use
beca
use
of s
alt.
Nev
er d
ry.
Muc
h w
ater
was
hau
led
from
thi
s w
ell i
n 19
34.
Wel
l No.
1.
Wel
l No.
2.
Wel
l N
o.'
3.
Unu
sed
beca
use
of
clog
ged
scre
en.
New
wel
l No.
3.
See
foot
note
s at
end
of t
able
.
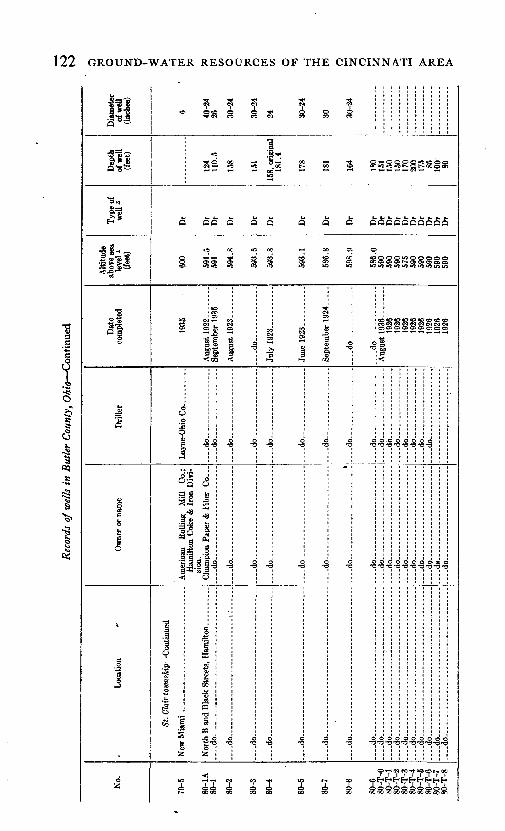
122 GROUND-WATER RESOURCES OF THE CINCINNATI AREA
11}
013-
S
4t-~
IjH
1
sQ
s>
8
1
»
1
J
055
to o<r> o o -* o o o * N co co w co co co
,1 s a Jj B , gsSSSSS88|8
Q GG G Q G G G C QI^GGGGQGGQ
USOOtOOC 00050
1 S! 1 1 I .1 1 1
IP 1
d
s 1 s s5| ^
S ® s «
Id 4
>o
1 ^
§A ^bc
1i&
|
"S
1
1O
-2
'.3 "^
-i
1 1 a a § -tglj-s
1
51cc"2 5
1 155 55
c
-i
-i
4
5
-i
c
so: - _>
-i
-i
"C
1
J
^
4
< ^c
1 4CQ
C ^c
4
af
4
c"C
c-t
c
i
cf
c-z
«g»»ogo»o
:§
c c
o c
c
4
4
cT
g
-g
-?
4
4
4
4
4
4
4
4
4
4
c V
c-c
-i
4
4
4
I III 111 S i
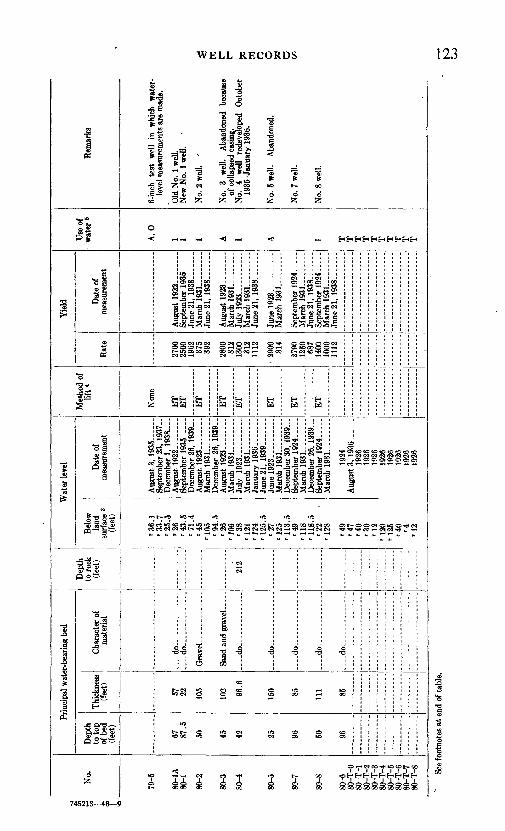
No.
79-5
80-1
A
80-1
80-2
80-3
80-4
80-5
80-7
80-8
80-6
80
-T-O
80
-T-l
80
-T-2
80
-T-3
80
-T-4
80
-T-5
80
-T-6
80
-T-7
80
-T-8
Prin
cipa
l wat
er-b
eari
ng b
ed
Dep
th
to to
p of
bed
(f
eet)
67
87.5
50 45
42 25
96
50
96
Thic
knes
s(f
eet)
57
22 105
102 96
.6
150 85
111 85
Cha
ract
er o
f m
ater
ial
do .
. do
-....-. ..
.
. do
do
..-d
o- .... ---
do
. do
-
Dep
th
to r
ock
(fee
t)
212
Wat
er le
vel
Bel
ow
land
su
rfac
e 3
(fee
t)
'36
.1
'33
.7
'25.5
'2
6
'43
.5
'71
.4
'45
'105
'9
4.5
'2
6
'109
'3
8
'121
'1
24
' 12
5.5
'27
'125
'1
13.5
'4
9
'118
'1
18.5
'2
2
'128 '49
'4
7
'40
'3
0
'12
'120
'1
25
'40
'4
'1
2
Dat
e of
m
easu
rem
ent
Sept
embe
r 23
, 19
37- .
D
ecem
ber
1, 1
938
Sept
embe
r 19
35 .
.. .
Dec
embe
r 26
, 1
93
9
Mar
ch 1
93
1 .
... ..
Mar
ch 1
93
1 -
July
19
23-.
.. ......
Mar
ch 1
931.
.. ......
June
21,
1939 .
Mar
ch 1
93
1
Dec
embe
r 30
, 19
39 _
Mar
ch 1
931
Sept
embe
r 19
24 ..
...
Mar
ch 1
931
1924
1926
19
26
1926
19
26
1926
10
26
1926
19
26
Met
hod
of
lift
*
Non
e
ET
E
T
ET
ET
ET
ET
ET
ET
Yie
ld
Rat
e
2700
25
00
1962
37
5 39
2
2800
31
2 13
00
312
1112
2900
81
4
2790
12
50
687
1400
10
00
1112 i
Dat
e of
m
easu
rem
ent
Sept
embe
r 19
35
June
21,
1938
M
arch
1931
June
21,
1938-
-
Mar
ch 1
93
1.
July
1923
Mar
ch 1
93
1 ..
. ..
June
21,
19
38
June
192
3. _
____
Mar
ch 1
93
1
Sept
embe
r 19
24.
Mar
ch 1
931.
-. _
_ ..
June
21,
193
8.
Sept
embe
r 1924.....
Mar
ch 1
93
1
June
21,
193
8-. .
Use
of
wat
er 6
A, 0
I I I A I A I T
T
T
T
T
T
T
T
T
T
Rem
arks
6-rn
ch
test
w
ell
in
whi
ch
wat
er-
leve
l mea
sure
men
ts a
re m
ade.
Old
No.
1 w
ell.
New
No.
1 w
ell.
No.
2 w
ell.
x
No.
3
wel
l. A
band
oned
be
caus
e of
col
laps
ed c
asin
g.
No.
4
wel
l re
deve
lope
d O
ctob
er
1935
-Jan
uary
193
6.
No.
5 w
ell.
Aba
ndon
ed.
No.
7 w
elt.
No.
8 w
ell.
See
foot
note
s at
end
of t
able
.
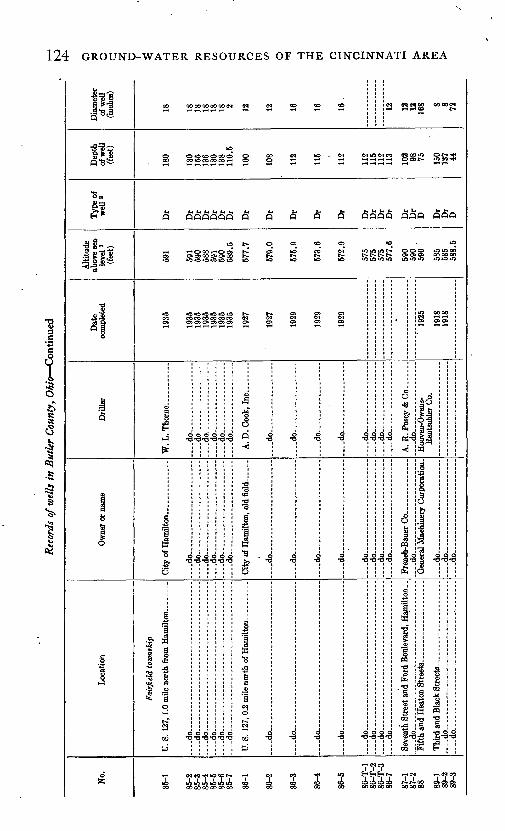
Reco
rds
of w
ells
in
But
ler
Cou
nty,
Ohi
o C
onti
nued
No.
86-1
85-2
85-3
85-4
85-5
85-6
85-7
86-1
86-2
86-3
86-4
86-5
86-T
-l86
-T-2
86-T
-388
-7
87-1
87-2
88 89-1
89-2
89-3
Loca
tion
Fair
field
tow
nshi
p
... .
do..
... .
....... ........... .......... ...
. do
.do--.-
... ..
. ....................... .
. d
o
.d
o..
....
....
. ...
........................
....do ................
....
....
....
....
...
U. S
. 12
7, 0
.2 m
ile n
orth
of H
am
ilto
n..
....
do
... .
........ ..
........................
do . ..
do
.-..do.-
............. ...
....
....
....
....
... .
do........ ........
....
....
....
....
...
....do. ......... -....
....
....
....
...
... do ..
....
....
....
....
....
....
....
....
.....do.... ..
................................
do
Thi
rd a
nd B
lack
Str
eets
... .._
..--d
O-........--.-. ...................
d
o
Ow
ner
or n
ame
do do
. do
....do ............
....
. . d
o .
........ ............
....do ..............
....
..
City
of H
amilt
on,
old fi
eld
.
do
....do ... ... .
....
...... ..
... .
do .
....
....
....
........
.. -do........ ................
....
do
-...
. ...
... ............
do do ...
....
. d
o .
.do .. .
..... .
............
do..
.. d
o .
....
....
....
. .......
... .
do. ........... .......
Dri
ller
... .
do.. . ......... ..
. do
.d
o..
....
....
....
.
....do ... .
..... ...
do do.
do
do
....do... ..
.....
.
....do... .
..... .
........
....
do
..
....
.... d
o ..
.... .
do .
....
....
....
......do ...
....
....
...
Ren
tsch
ler
Co.
Dat
e co
mpl
eted
1935
1935
1935
1935
1935
1935
1935
1927
1927
1929
1929
1929
T 19
25
1918
1918
Alti
tude
ab
ove
sea
leve
l i
(fee
t)
591
591
590
588
591
590
589.
5
577.
7
579.
0
575.
9
573.
6
572.
9
575
575
575
577.
6
590
590
,59
0
585
585
588.
5
Typ
e of
w
ell a
Dr
Dr
Dr
Dr
Dr
Dr
Dr
Dr
Dr
Dr
Dr
Dr
Dr
Dr
Dr
Dr
Dr
Dr
D Dr
Dr
D
Dep
th
of w
ell
(fee
t)
1 oft
180
155
136
180
138
110.
5
100
108
112
115
112
112
115
112
113
102 98 75 150
137 44
Dia
met
er
of w
ell
(inch
es)
1 s 18 18 18 18 18 2 12 12 16 16 16 .
12 12 12 168 8 8 72
to 4*.
O
*
O W
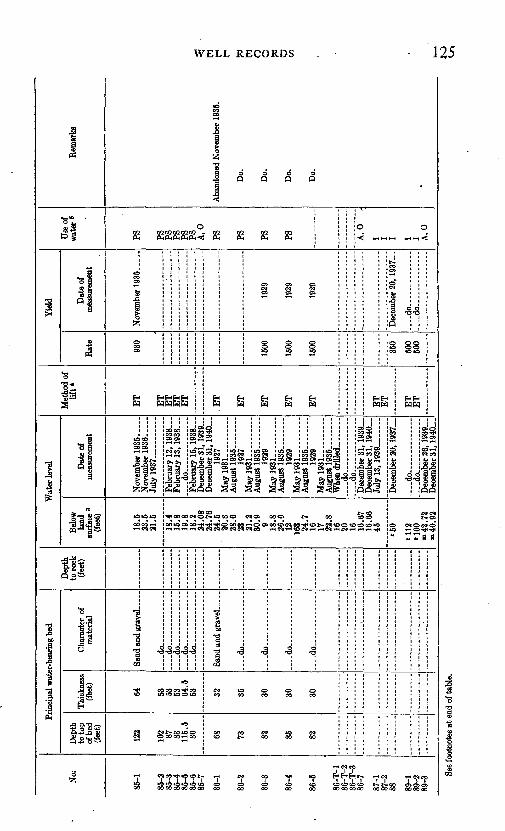
NOJ
85-1
85-2
85
-3
85-4
85
-5
85-6
85
-7
86-1
86-2
86-3
86-4
86-5
86-T
-l
86-T
-2
86-T
-3
86-7
87-1
87-2
88 89
-1
89-2
89
-3
Prin
cipa
l wat
er-b
eari
ng b
ed
Dep
th
to to
p of
bed
(f
eet)
122
102 87
83
115.
5 80 68
73
82
85
82
Thic
knes
s (f
eet)
64 53
53
53
64.5
53 32
35
30
30
30
Cha
ract
er o
f m
ater
ial
....do....... ..
. . do .
.-.d
o..
....
....
...
..
.do.
..
.-....do.. .
....
.
. ...do... .
...... ..
..
....do. ...
....
...
-...
do..
....
....
...
do-..-..... .
Dep
th
to r
ock
(fee
t)
Wat
er le
vel
Bel
ow
land
su
rfac
e3
(fee
t) .
18.6
23
.5
21.6
18.4
15
.8
19.8
18.2
24
.08
24.7
6 24
.6
20.3
28
.6
23
21.2
30
.9
9 18.8
26
.6
12
163 24
.7
16
17
22.8
16
20
16
16
.67
16.6
6 45 '60
'112
'1
00
= 4
2.72
"4
0.9
2
Dat
e of
m
easu
rem
ent
July
193
7 _
Febr
uary
12,
193
8 ...
Febr
uary
13,
193
8 _
Febr
uary
15,
19
38
D
ecem
ber 3
1, 1
939
Dec
embe
r 31
, 19
40...
19
27
May
193
1. ...... .
..A
ugus
t 19
35 ..
......
1927
M
ay 1
931.
.. _
....
1929
M
ay 1
931.
.........
Aug
ust 1
935 .
....
...
1929
M
ay 1
931.
...
....
..
1929
M
ay 1
931.
.........
Aug
ust
1935
....
....
....
do..
....
....
....
do. ......
Dec
embe
r 31,
193
9_
Dec
embe
r 31
, 1
94
0
July
13,
1939
Dec
embe
r 20
, 19
37
do . .
.d
o... .
......... .
Dec
embe
r 26
, 1939
Dec
embe
r 31
, 19
40 _
Met
hod
of
lift
*
ET
ET
E
T
ET
E
T
.ET
ET
ET
ET
ET
ET
E
T
ET
E
T
Yie
ld
Rat
e
930
1500
1500
1500 360
500
600
Dat
e of
m
easu
rem
ent
1929
1929
1929
Dec
embe
r 20
, 1
93
7
....
do
.... . .
.... d
o ....... .
Use
of
wat
er 5
PS PS
PS
PS
PS
PS
A,0
PS
PS
PS
PS A, 0
4
I I I I I A,0
Rem
arks
Aba
ndon
ed N
ovem
ber
1935
.
Do.
Do.
Do.
Do.
See
foot
note
s at
end
of t
able
.
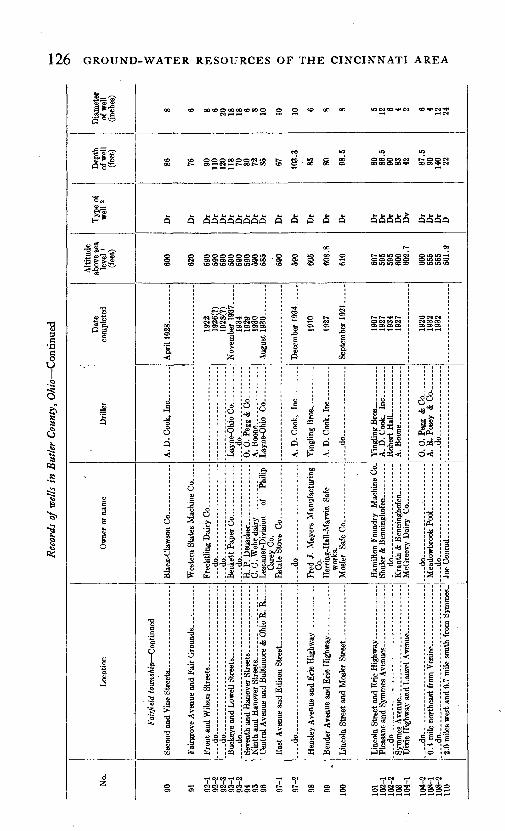
126 GROUND-WATER RESOURCES OF THE CINCINNATI AREA
*-.-»Ill
^=3^S* ^ O0<S^
SssSIH *
s*-~ a £"®^^|Jfe
Q aW|
iQ
Owner or name
Location
d
OO SO 00 CO O 00 00 CO OO O O O CO OO OO U3 C-
CO kA O O O OC00 * ""SS;:CO U3 kC
OOC^JUS t>» CO U5 O OO O CCt-» 00 1"» OO tO O " OO OO Oi OO O(
«« M » *
U9
o co e^i t^ o
ss
o«-*
Q Q QQQQQQQQ Q Q Q (S Q QQQQQ QQQQ
00 OS
§ O OOOOOOO 1O O O W5 OO O t-^UBUBOC'* OW3U5«^ C4 OiOiOiOsSoiOSOO'S Oi O O * ' O Oi OS O O O *O »P COCO U5U5U5U"
«««*"
oo oiro=» £
1 1 < 2
c
J,
Io^
0o
c* i > 1 si1 1 «3 1 1 1 J 1» j£ fe
8a ^ 5 ""^ a§ §
I *
c
< a pc^ -S
1 § 'fl ^
If 11ftj C C OB
1 "S "2 £ 53 § S
1 I r
-i
-i
c_c
9c
J
£
1t -ga
j:
kOtOU3U3 W5 *O <O « eo OkOkOCOeD 50 U5 US «3
S gMH Oi O O ^ O t-- »-H t-» t-» ' tf' t-» «O Ctroc^coeo *^ T-» « . o«eo« «t?cO5 OS OS OS fc* C5 OS Jj5 OS OS OS OS O5 CT
s a §s§ jiM g p.
< O CB
C '
1
-i
ye and Lowell Stree
§ £M
£
|acc
J.
p.
w
f
I
jc3 £! f*a "ci! JP9 £ C3<5h4 <;
isi J3j&Hi
.G.Wehr dairy ... ;schner-Division of
Carey Co.
state Stove Co...... ..do _ ___.
0*3 W
i i'c4> e
, ^' 8
' fe **N a 33
th and Hanover Stn and Hanover Stree il Avenue and Balti Avenue and Edison !
B-fl c ^ c £"B~B ~£ ^
J £SD -^ ffl^
9 0 I?C
1 P £ lc£ «> £«
.s $3 fl
"* * OJ *S«3 *«J O
^=«'S M j
*i £l^a dtfc§<j d<
"3 CO * C
i .§ ^^* 1 . fl5^O § fl
S M *" ^
^ . s-3 s It c gagg'g ij-fc, a s WGC
>i
g ^ ^ >>
S M ^ .£P C
iS 'C 1? *^^ ^ s i|i g -g -g a
||| |1"5 ^ 02 S^
w « 3 as*
rt
rauth & Benninghofel [cGreevy Dairy Co... ..do -------
it3
ies Avenue... .-.-------. Highway and Laurel Avei
l-s ^£5
CM
g
3
4
[eadowbrook Pool-.-. ..do.. .. ....
S
>
B
Sa -i *0
1 c
I02
s -fl
les west and 0.7 mile sout
aes ci
g s iSSgisss 55 & s § s ssssi i^is
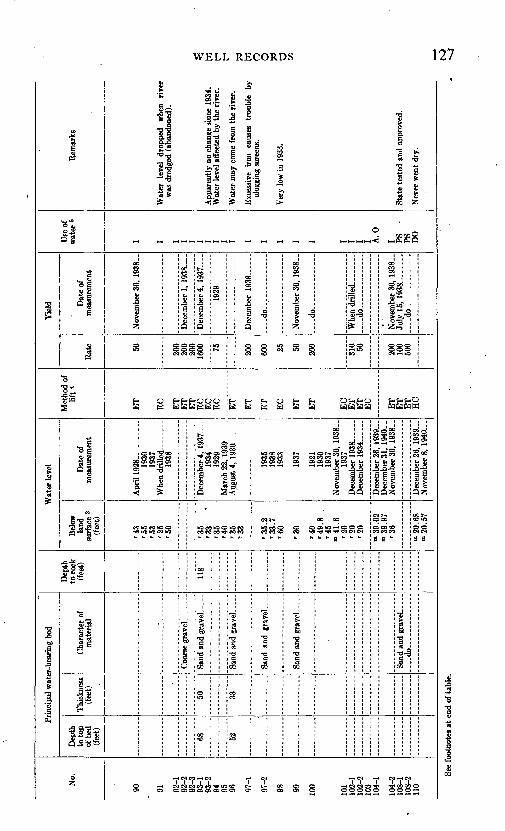
No.
90 91 92-1
92
-2
92-3
93
-1
93-2
94
95
96 97
-1
97-2
98
99
100
101
102-
1 10
2-2
103
104-
1
104-
2 10
8-1
108-
2 11
0
Prin
cipa
l wat
er-b
eari
ng b
ed
Dep
th
to to
p of
bed
(fee
t)
68 52
Thic
knes
s (f
eet)
50 33
Cha
ract
er o
f m
ater
ial
Sand
and
gra
vel _
-.
Sand
and
gra
vel
Dep
th
to ro
ck(f
eet)
118
Wat
er le
vel
Bel
ow
land
su
rfac
e 3
(fee
t)
'43
'55
'53
'25
'50
'35
'33
'35
'40
'35
'33
'35.2
'3
3.7
'6
0
'30
'40
'4
9.8
'4
5
Ml.
6 '2
0
'20
'20
*»39
.02
"39
.97
'36
'"20
.68
-"20
.57
Dat
e of
m
easu
rem
ent
Apr
il 19
28-.
....
...
1930
19
37
Whe
n dri
lled--
-.-
1938
Dec
embe
r 4,
1937
1934
19
29
Mar
ch 2
2, 1
939--
--A
ugus
t 4,
193
0 -
1935
19
38
1933
1937
1921
19
30
1937
N
ovem
ber
30,
1938
- 19
37
Dec
embe
r 1
93
4 .
Dec
embe
r 26
, 19
39...
D
ecem
ber 3
1, 1
940.
- N
ovem
ber
30,
1938
.-
Dec
embe
r 26
, 19
39
Nov
embe
rs,
1940
...
Met
hod
of
lift
*
ET
EC ET
E
T
ET
E
C
EC
E
C ET
ET
ET
EC
ET
ET
EC
E
T
ET
E
C ET
E
T
ET
H
C
Yie
ld
Rat
e 50 200
200
200
1600 75 200
600 25
50
200
310 50 200
100
500
Dat
e of
m
easu
rem
ent
Nov
embe
r 30
, 19
38-
Dec
einb
er 1
, 1938
Dec
embe
r4, 1937
1929
.do..
....
....
..
Nov
embe
r 30
, 19
38-.
. d
o-
Whe
n d
rill
ed .
....
....do.... ..
.... ..
..
Nov
embe
r 30
, 19
38-
July
15,
1938..
.do
. .
.
Use
of
wat
er 5
I I I I I I I I I I I I I I I I I I I A, 0
I PS
PS
D
O
Rem
arks
Wat
er
leve
l dr
oppe
d w
hen
riv
was
dre
dged
(ab
ando
ned)
.
App
aren
tly n
o ch
ange
siu
ce 1
934
Wat
er le
vel a
ffec
ted
by t
he r
iver
.
Wat
er m
ay c
ome
from
the
riv
er.
Exce
ssiv
e iro
n ca
uses
tr
oubl
e cl
oggi
ng s
cree
ns.
Ver
y lo
w in
193
3.
Stat
e te
sted
and
app
rove
d.
Nev
er w
ent
dry.
See
foot
note
s at
end
of t
able
.ro
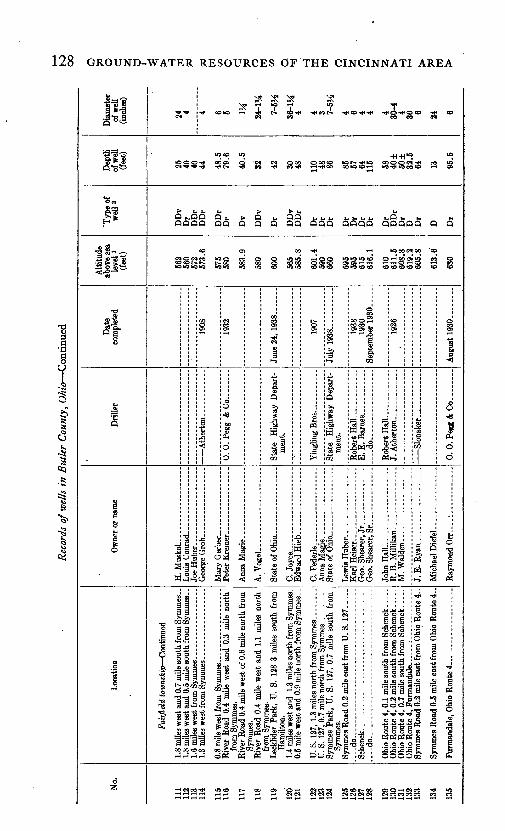
128 GROUND-WATER RESOURCES OF THE CINCINNATI AREA
is?1O to * co
IQCO U9
«?» 3 ?3-H-H 10.
OOOQW* f>
Q b > Q4
QQb b > t. h fc, fc, fc, b h b, h t, h - QQQQ QQ Q Q fi QQ QQQ QQQQ QQQQQ Q Q
« <-H laceeQoo to
S S 43
S
o H ft £
QC; ^ |.a
«J|J§ £
313 »-fe c-g '^"3 o
fi-3 S a, «>0-3co JMO
I 393
SJS^S^ ra
iOOOOoQ OQ
31 t C^COTJ4 U3COt-CO OiOi t<M< 9C4 C4C4C4 C^ C^ (M (M OICCCOCCC
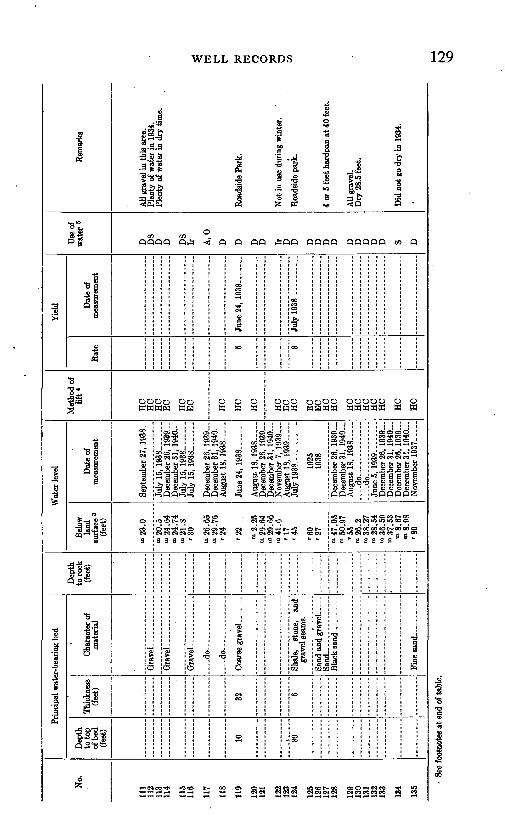
No.
Ill
112
113
114
115
116
117
118
119
120
121
122
123
124
125
126
127
128
129
130
131
132
133
134
135
Prin
cipa
l wat
er-b
eari
ng b
ed
Dep
th
to to
p of
bed
(f
eet)
10 80
Thic
knes
s (f
eet)
32 6
Cha
ract
er o
f m
ater
ial
Gra
veL
... _
_ ..
...
. do
-. ...... ...
..
..-d
o.
..........
Shal
e,
ston
e,
and
grav
el s
eam
s.
San
d..
.
.. ..
..
Dep
th
to r
ock
(fee
t)
Wat
er le
vel
Bel
ow
land
su
rfac
e3
(fee
t)
"23
.0
"120
.5
"124
.64
-"24
.74
"21
.8
'30
"26
.65
-"29
.76
'24
'22
-"2.
25
-"29
.64
"29.6
6
"41
.6
'17
'4
5
'60
'27
-"47
.05
-" 5
0.97
'5
5
-"26
.2-"
38.2
7-"
28.
54
-" 3
6.59
-"
37.5
3 -"
8.67
»8.9
8
'80
Dat
e of
m
easu
rem
ent
Sept
embe
r 27
, 19
38-
July
15,
1938
Dec
embe
r 26
, 1939
Dec
embe
r 31
, 1940
July
15,
1938
July
15,
193
8
Dec
embe
r 26
, 1939
Dec
embe
r 31
, 1940
Aug
ust
18, 1938
June
24,
193
8..
Aug
ust
18,
1938
_
Dec
embe
r 26
, 1939
Dec
embe
r 31
, 1940
Nov
embe
r 7,
193
9 ...
Aug
ust
18, 1939
July
l93
8 .
....
1925
19
38
Dec
embe
r 26
, 1939
Dec
embe
r 31
, 1940
Aug
ust
18, 1938
d
o
Dec
embe
r 26
, 1939
Dec
embe
r 31
, 1
94
0
Dec
embe
r 26
, 1
93
9
Dec
embe
r 31
, 1940
Nov
embe
r 19
37. .
...
Met
hod
of
lift
*
HC
H
C
HC
E
C
HC
E
C
HC
HC
HC
HC
E
C
HC
EC
E
C
HC
H
C
HC
H
C
HC
H
C
HC
HC
HC
Yie
ld
Rat
e 5 8
Dat
e of
m
easu
rem
ent
June
24,
19
38
July
1938 ..
....
Use
of
wat
er s
D
DS
D
D DS
Ir A, 0
D
D D
D Ir
D
D D
D
D
D D
D
D
D
D S D
Rem
arks
All
grav
el in
this
are
a.
Plen
ty o
f wat
er in
193
4.
Plen
ty o
f wat
er in
dry
tim
e.
Roa
dsid
e Pa
rk.
Not
in u
se d
urin
g w
inte
r.
Roa
dsid
e pa
rk.
4 or
5 f
eet h
ardp
an a
t 40
feet
.
All
grav
el.
Dry
28.
5 fe
et.
Did
not
go
dry
in 1
934.
See
foot
note
s at
end
of t
able
.K
)
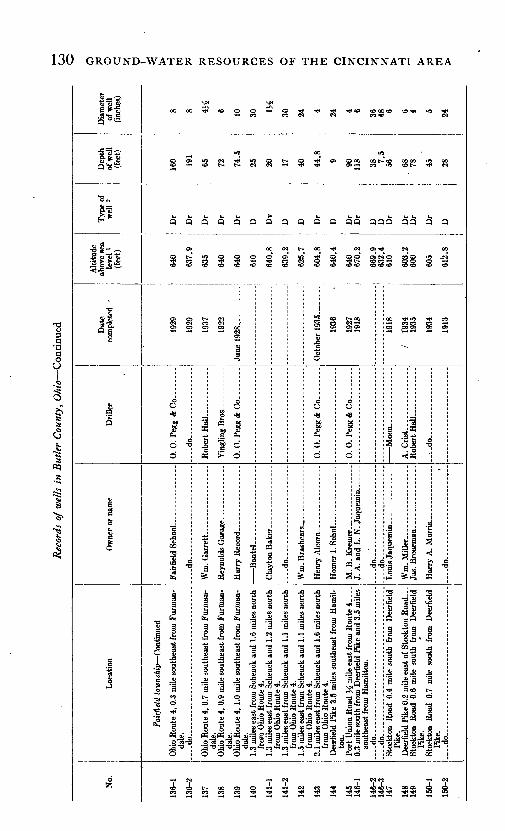
130 GROUND-WATER RESOURCES OF THE CINCINNATI AREA
s.S
o
I§
~R
^
b
S
5
13
i
l_,?j'l
^is""® 'tJa
IW
s. H
» I-
111!
e
jiQ S
fc
S
a
s?
1
g"S0
O*
OO OO ^* CO O O i <O^*^«'^* * «D 5OOOCO CO ^* «5 "* *~t CO CO « C« CO"* «
us oo to
8 3 3 R S 8 8 S S 3 - S3 8-8 S£ 3 8
QQQQQQQQQQQQQ QQQ QQ Q Q
0,
^4 CO CO ^* ^* T » ^t CO W O ^* ^*t-* !OCO^-< ^O O ** *
O= OS t- <Ncq eq co <MO3 en en en oc
a
S1t-i
oO abfl
^
d =o
Fairfield Schoo
i"i aS3 aa £."1 "2
1 «'-S °
% 1
~ 21 «" ** fl
.s|- o
u
"3 in atd
^ 1 =(§ P O
a
^& O gtj OQ » "SS "O OS * 0 i * 1S & S3& (2 w
Clayton Baker
do
1 § is» §1
0 0O O a -aa ' ^
O 0
o 6
AP3
i _ ^3 a ja S ^
^ a w SK
1 1 i 1 1 1 1 1 1 -1| | | '§ 'e 's "§ 's ^ (§ §
"Slf'S^B-B-B-B-B § i^
liilillliiidSS»g§§§§M rS^^SIII i-ji-ji-ji-ji-ji |«l5 S S lIlllllllIS -sJiI S 1 llllljl-lljS a||fl fl 3 ooO o? O osO OQ O oaO*o *^ * S
*^!s|!s|^ J^ 1^13 J'^ If J?^l^ OOO-H-<-H-H«Qfrid
OC T|«O ^i CO
^^
^0 52o *
S! ij ? < f§
-
S '£'a § s I j I sa
*1 * - M
2 22
_O
*** ^"" **"
1 i! 1J£ i .3 4(S -2 g g -* So »- O CIO O
1 II 1st "O cl cl
=lllllll^S QS S
^S^OOffioI^NCO^Ujii 2H^ 2 I
_
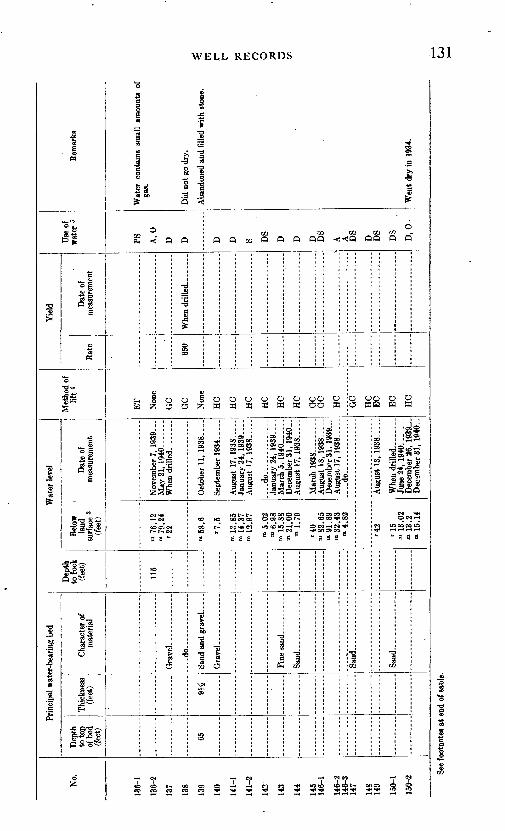
No.
136-
1
136-
2
137
138
139
140
141-
1
141-
2 14
2-
143
144
145
146-
1
146-
2 14
6-3
147
148
149
150-
1
150-
2
Prin
cipa
l wat
er-b
eari
ng b
ed
Dep
th
to to
p of
bed
(fee
t)
65
Thic
knes
s (f
eet) VA
Cha
ract
er o
f m
ater
ial
Gra
vel-
..-.
..-.
--.
-..d
o -------
Gra
vel
- -
San
d..
----
.---
---.
San
d... - _
__
San
d--
.
Dep
th
tofo
ck(f
eet)
115
Wat
er le
vel
Bel
ow
land
surf
ace
3(f
eet)
n»76
.12
"79.
24
'22
58
.6
'7.5
m 13
.85
"> 14
.37
"> 12
.97
"5.0
2"6
.98
">
15.8
8 ">
21,0
0 "1
.79
'40
m 82
.65
'"91
.89
-> 3
2.43
"4
.82
'42
'15
">
13.0
2 m
!3.2
"1
5.14
Dat
e of
m
easu
rem
ent
May
21,
194
0_._
_
Whe
n dri
lled
--
Oct
ober
11,
193
8- ...
Sept
embe
r 1934-
Aug
ust
17, 1
93
8
Janu
ary
24,
1939
__
-.
.do..
.. ---
----
--Ja
nuar
y 24
, 1939.
Mar
chS,
1940 .
..
Dec
embe
r 31
, 1940
Aug
ust
17,
1938
_ .-
Dec
embe
r 31
, 1939
Aug
ust
17, 1938 -
Aug
ust
13, 1
93
8 -
.
Whe
n dri
lled
..-
..Ju
ne 2
4, 1
940-
..
.D
ecem
ber
26,
19
39
D
ecsm
ber
31,
1940
-
Met
hod
of
lift
*
ET
GC
GC
Non
e
HC
HC
HC
HC
HC
HC
GC
G
C
HC
GC
HC
E
C EC
HC
Yie
ld
Rat
e
650
Dat
e of
m
easu
rem
ent
Whe
n dr
illed
-. ..
. ._
-
Use
of
wat
er 5
PS
A,0
D
D D
D S DS
D
D D
DS
A A
DS
D
DS
DS
D,
0~
Rem
arks
Wat
er c
onta
ins
smal
l am
ount
s of
' ga
s.
Did
not
go
dry.
Aba
ndon
ed a
nd f
illed
with
sto
ne.
w
o o 5«
O C/3
Wen
t dry
in 1
934.
See
foot
note
s at
end
of t
able
.
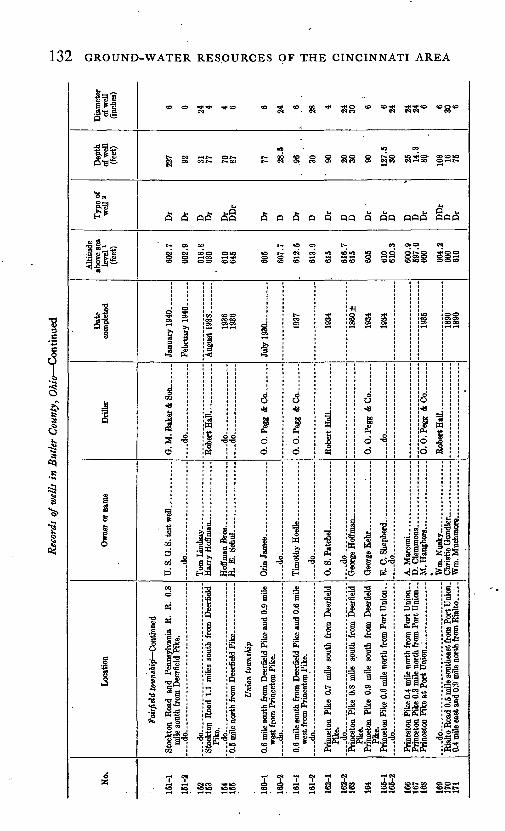
Rec
ords
of w
ells
in
But
ler
Cou
nty,
Oh
io C
onti
nued
No.
151-
1
151-
2
152
153
154
155
160-
1
160-
2
161-
1
161-
2
162-
1
162-
216
3
164
165-
116
5-2
166
167
168
169
170
17!
Loc
atio
n
Fai
rfid
d to
wni
hift-
^Con
tJao
ed
mile
sou
th f
rom
Dee
rfie
ld P
ike.
..-.d
o
....d
o..
....
....
....
................... ... .
Pike
. do
0.5
mile
nor
th f
rom
Dee
rfie
ld P
ike.
...
Uni
on t
owns
hip
wes
t fro
m P
rinc
eton
Pik
e.
....d
o..
.
wes
t fro
m P
rinc
eton
Pik
e.
Pike
. d
o...... .
Prin
ceto
n Pi
ke 0
.8 m
ile
sout
h fr
om D
eerf
ield
Pike
.
Pike
.
do
.do
Ow
ner
or n
ame
U. S
. G. S
. tes
t well
. ........
- d
o... .
H.
E.
Sch
ul
...
....
....
...
....do........................
Tim
othy
Hoe
lle _
. _
... .
....
d
o ,
0. S
. Pat
chel
....... .
..........
....
do
....
.. ..
....
....
....
....
Geo
rge
Hof
fman
______ ...
.
Geo
rge
I£eh
r
A. M
arco
ni _
_ ..
. _ _
. _ ..
Wm
. N
usky
_________
Dri
ller
G. M
. Bak
er &
So
n..
.. ..
d
o.... ..
.... ........
do... .
........... ...
.d
o .
0. 0
. Pe
gg &
Co
....
0. O
.Peg
g &
Co
0.0
. Pe
gg &
Co.
_ _
...
do..................
0.0
. Pe
gg &
Co
_
.
Rob
ert H
all
...
....
...
Dat
e co
mpl
eted
TT
pli
rila
rv 1
Q4H
1936
1936
July
1930...........
1937
1934
1860
±
1934
1934
1935
1890
1890
Alti
tude
ab
ove
sea
leve
l i
(fee
t)
602.
7
602.
9
616.
863
0
610
645
605
607.
7
. 61
2.5
613.
9
615
616.
761
5
605
610
610.
3
600.
959
7.6
600
604.
260
061
0
Typ
e of
w
ell2
Dr
Dr
D Dr
Dr
DD
r
Dr
D Dr
D Dr
D D Dr
Dr
D D D Dr
DD
rD D
r
Dep
th
of w
ell
(fee
t)
227
09
<J1 77 70 87
77 28.5
Qfl 30
' 90 20 30 90 12
7.5
30 25 14.8
86 108 16 75
Dia
met
er
of w
ell
(inch
es)
6 6
94 4 4 6 6 24 6 28 4 24 30 6
:
6 24 24 24 6 6 30 6
Co
to O pa
O H
HI
W O O
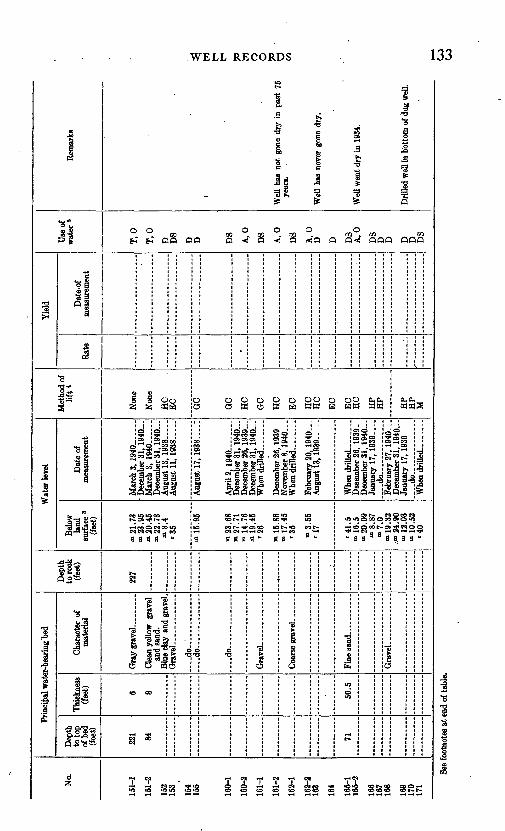
WELL RECORDS 133
=3l =3 =3
sio o o o o
CO C»Xc»\.CQ.H H OQ OO O < IQ <! Q «!
oCO X CQ CO
Q Q<! QQQ QQQ
§ § Oo55 55 WHo o o o oo o oo me*WOWHWWH H» WW Ss
2Sen
i-ieoONoouseqC4C4Ol to
a a 0 a a *
U5U5OOOO
a a, a a
o »"
7 ?B S SS § S S
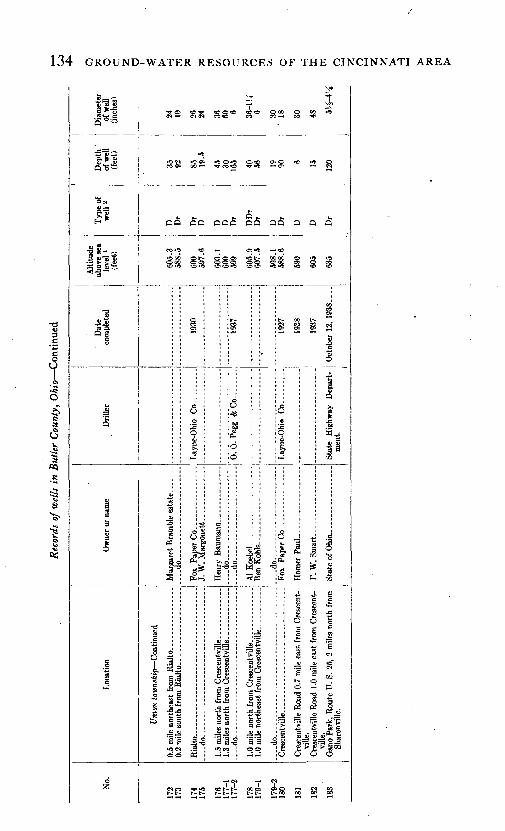
134 GROUND-WATER RESOURCES OF THE CINCINNATI AREA
1 \,»'S'aj ca * §
"S, (t "S
nH*
it?IJ11
Isa'o.
°|
iQ
1efe
c:
g
1
6^
? IS2 83S g8<° S 50 82 g SS *
«COO OO ^« **<eO<O **< *O »-* Oi (M
U u U Ofc, U U
QQ QQ QQQ QQ QQ Q Q Q
2£ " c^ o. 52 2282? »8 SfS S§ §S -» § S
.j"i
3
2
1
1
T3
iI e
¥ -^
OS
6.2
9£3
J
*
?i
fc>-;
1j!i fi
O toV OJ
a a ^-5^O N .£Soo PS
s£3
ffl
a
l-H
^
M
£d6
c e
II"i"§
66
II1!J8 S'3'3 c S ST;
~*~
Al KoebeL Kcn Kohls_e
3
II"S |
1°
6|
i|j=j= 11e eu u
sa ^OO
00«
§ 1 1 -Jo
O
1Q
6 a
g £,£)
o S jv C
i-3 V3
fc £ cfl
On
1
^
e ^3 fe ^
«2 I °|5|J. J. Ec c o
6 ' 6 "is e ei 1 -S^ « '1
JS A «
J I S
S3 S3 ,rrs "? ? b 5
"§ 1 »1 ai 1 ^ 'g g?5 83 2^2f y ^ &J ^ e8 ^O6OO
rf^l C-)
<M CO ^ tO COt-b- QO O5 OO *-* <M Cg
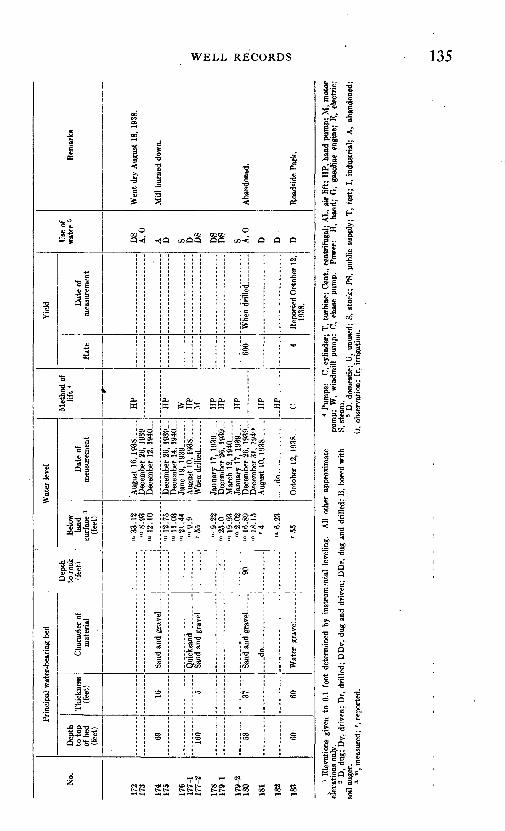
No.
172
173
174
175
176
177-
1 17
7-2
178
179-
1
179-
2 18
0
181
182
183
Prin
cipa
l w
ater
-bea
ring
bed
Dep
th
to to
p of
bed
(fee
t)
69 160 53 60
Thic
knes
s(f
eet)
16 5 37
'
60
Cha
ract
er o
f m
ater
ial
Dep
th
to ro
ck(f
eet)
....do
.-_ _
*
90
Wat
er le
vel
Bel
ow
land
su
rfac
e 3
(fee
t)
'"33
.12
8.
93
"> 12
.10
» 12
.75
11
.03
-»21
.44
'"9.9
'5
5
'» 9.
22
"25.0
19.9
3 "»
2.02
'"
16.8
9 1
8.15
'4 ">
6.23
'55
Dat
e of
m
easu
rem
ent
Aug
ust
16,
1938.....
Dec
embe
r 26
, 19
39-
- D
ecem
ber
12,
19
40
Dec
embe
r 26
, 1939
Dec
embe
r 14
, 19
40_.
_ Ju
ne 1
9, 1
93
9 .
Aug
ust
10,
1938
-....
W
hen
drill
ed-
----
--
Janu
ary
17,
1939
Dec
embe
r 26
, 1
93
9
Mar
ch 1
2, 1
940.
.. ...
Janu
ary
17,
1939
. _
Dec
embe
r 26
, 19
39...
Dec
embe
r 31
. 19
40>
A
ugus
t 10
, 19
38- .
..
..-d
o..............
Oct
ober
12,
19
38
..-
Met
hod
oflif
t4
HP
HP
W
HP
M HP
HP
HP
HP
..H
P
C
Yie
ld
Rat
e
600 4
Dat
e of
m
easu
rem
ent
Whe
n dri
lled
Rep
orte
d O
ctob
er 1
2,
1938
.
Use
of
wat
er 5
DS
A, 0
A D 8 D
DS
DS
DS
S A,
0
D
D
D
R
emar
ks
Wen
t dr
y A
ugus
t 18
, 19
38.
Mill
bur
ned
dow
n.
Aba
ndon
ed.
Roa
dsid
e Pa
rk.
x !
Ele
vatio
ns g
iven
to
0.1
foot
det
erm
ined
by
inst
rum
enta
l le
velin
g.
All
othe
r ap
prox
imat
e 4
Pum
ps:
C,
cylin
der;
T,
turb
ine;
Cen
t., c
entr
ifug
al;
AL,
air
lif
t; H
P, h
and
pum
p; M
, m
otor
elev
atio
ns o
nly.
pu
mp;
W,
win
dmill
pum
p; C
, ch
ase
pum
p.
Pow
er:
H,
hand
; G
, ga
solin
e en
gine
; E
, el
ectri
c;2
D,
dug;
Dv,
dri
ven;
Dr,
drill
ed;
DD
v, d
ug a
nd d
rive
n; D
Dr,
dug
and
drill
ed;
B,
bore
d w
ith
S, s
team
,so
il au
ger.
3 D
, do
mes
tic;
U,
unus
ed;
S, s
tock
; PS
, pu
blic
sup
ply;
T,
test
; I,
indu
stri
al;
A,
aban
done
d;3
m, m
easu
red;
r, r
epor
ted.
0,
obs
erva
tion;
Ir,
irri
gatio
n.
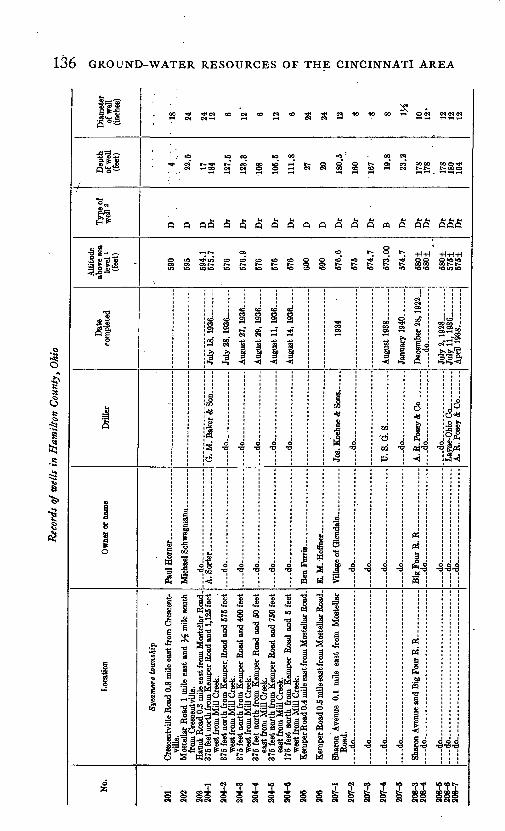
136 GROUND-WATER RESOURCES OF THE CINCINNATI AREA
en «>-<
1O COt~^t !> " COrHDO « «
us oo1O r-T t- Or-l«
"5 ' oo e»O O t- O> CO OOOO OO
Q Q QQ QQQQQQQQQQMQ QQ QQQ
a>t~- t- t- t- t- t-
*-. °. *-. -H-H -H-H-H«3 "3* CO "3* OO O1Q10t~ t~ t~ t~ oooo oot~t~
J
13 13 t 13
0 | -
fl
I | I
I S J:
2 ^ *
i » i**.
1
5 Wco co co co co i-" W
co ^ 10
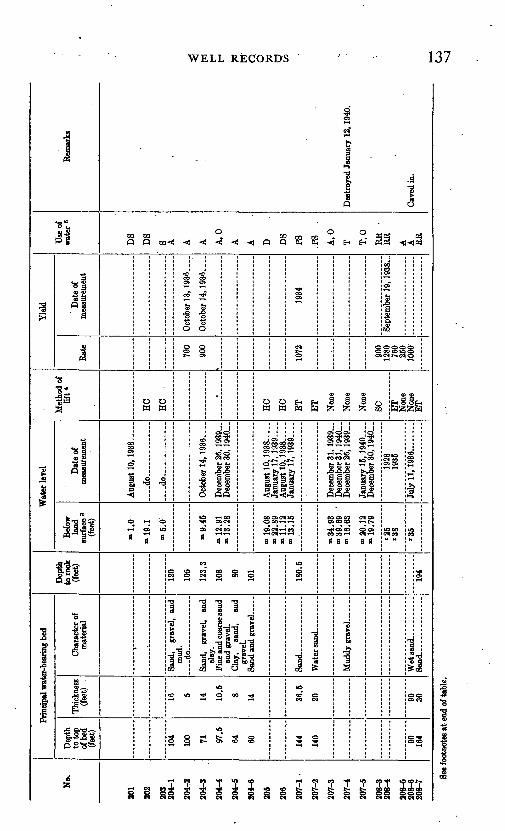
No.
201
202
203
204-
1
204-
2
204-
3
204-
4
204-
5
204-
6
205
206
207-
1
207-
2
207-
3
207-
4
207-
6
208-
3 20
8-4
208-
5 20
8-6
208-
7
Prin
cipa
l wat
er-b
earin
g be
d
Dep
th
to to
p of
bed
(fe
et)
104
100 71
97.5
64
69 144
140 90
164
Thic
knes
s (fe
et)
16 5 14
10.5 8
' 14 36
.5
20 90
30
Cha
ract
er o
f m
ater
ial
Sand
, gr
avel
, an
d m
ud.
...-
do..
....
....
.
Sand
, gr
avel
, an
d cl
ay.
Fine
and
coa
rse s
and
and
grav
el.
Cla
y,
sand
, an
d gr
avel
. Sa
nd a
nd g
rave
l
Wet
sand. . .
.. ..
.S
and...... ..
... .
...
Dep
th
to ro
ck
(fee
t)
120
105
123.
3
108 80
101
180.
5
194
Wat
er le
vel
Belo
w
land
su
rfac
e 3
(feet
)
"1.0
">19
.1
"5.0
"
"9
.45
m 12
.91
" 13
.28
" 1
9.0
8"2
2.89
m
11.1
2 ">
13.1
5
" 34
.93
"39.
69
"16.
63
"20.
12
m 19
.79
'25
'38
'35
Dat
e of
m
easu
rem
ent
Aug
ust 1
0, 1938
... .
do ..... .
.
....do ..
....
...
Oct
ober
14,
193
6-
Dec
embe
r 26,
193
9
Dec
embe
r 30,
194
0...
Aug
ust 1
0, 1
938
Janu
ary
17, 1
939.
...
Aug
ust 1
0, 1
938.
.. ..
Janu
ary
17, 1
939 .
...
Dec
embe
r 31
, 193
9...
Dec
embe
r 31,
194
0...
Dec
embe
r 26,
193
9...
Janu
ary
15, 1
940 .
...
Dec
embe
r 30,
194
0 _
1928
19
35
July
11,
193
6 ..
....
Met
hod
of
lift*
HC
HC
,
,
HC
HC
ET
ET
Non
e
Non
e
SC ET
N
one
Non
e E
T
Yie
ld
Rat
e
700
900
1072 900
1280
76
0 25
0 10
00
Dat
e of
m
easu
rem
ent
Oct
ober
13,
193
6. __
_
Oct
ober
14,
193
6. ..
.
1934
Sept
embe
r 19
, 193
8..
Use
of
. w
ater
6
DS
DS
' S A A
A
A, 0
A
A D
DS
PS
.PS
.
A,0
T
T.O
RR
RR
A
A RR
Rem
arks
Des
troye
d Ja
nuar
y 12
, 194
0.
Cav
ed in
.
See
foot
note
s at
end
of t
able
.
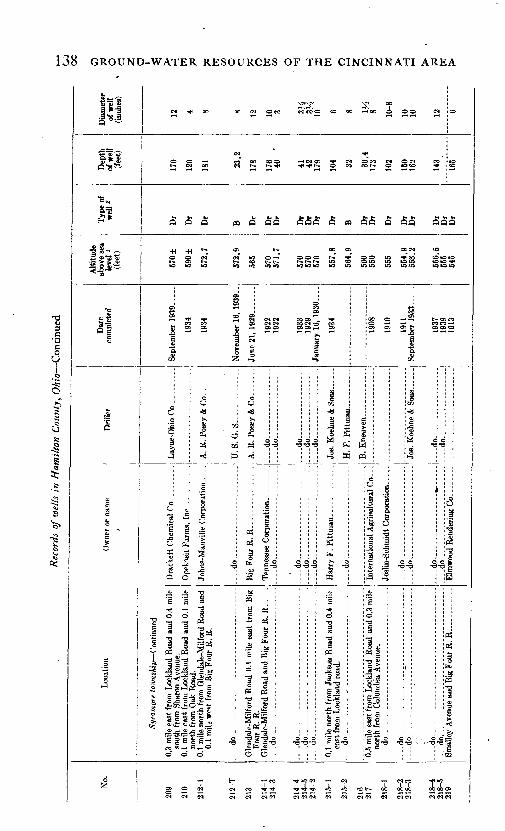
138 GROUND-WATER RESOURCES OF THE CINCINNATI AREA
'»'$ pi "*
S'S^s ft^jg
11 §!~~ijll
g £ "®*"c.
8
A~o
ic oS *
,
c ^o
1
6
W -^ OO 00 C* O (TO eVcVo CO OO I-H OO O O O W «O
O O CO005OO i-HINOS *> W O°« IM ON CO "5
a Q a « a QQ QQQ Q « QQ a QQ aao
^ g, ^ 00 OS OSC-* «
1 1 s § 3 §§ §§§ 5 3 33 3 33 333
j 1S a 2* 2. *""^ ec cc
1"S.<£ 2
| : ,
1 O
J «
0 *0 >.
2 S! wi ^ C
| « »
J < t=
-J
i .2
5 , I s -s &1 1 =
J3 fe '>0 fa C
£ *"* "^0) "« x-J
111 § Q 0 1
i A =>'§ '§ § *. -. J
"O _ _ OS §-O ^ hM - S S -o j
.S fec^| 1 1 |«
i Ijiijf1 ililll
Ills'!-. 4o o o
i di OS
OS 1-H
2 osc? o»S>2 S_. -H -H - ^ -H
0 S
»? *?
c!O
t?§
PHO
OS = i-<;
jP5 o
PH
O ^
!» 1"03 H
M
Sg 03
*~ 03
c§ 3
* fa
."3 Ms a-H -O
« i 1 1PS (§
1 1S«l_i«jjlil-co o
c 5 -5
C C c -c
e c 5 "S
j
o
"* §
siOO O I-H * t^- OS (TO
S os S h cnSS
§"E
t»
|
Sag-c S t>O PH g
c M . aBa
^ W pa
iiI
s
Jffifa
C >i C c j; -c
W
A'§
^ s
S8
103
11
|1£3
5Js aS 0«)=£:
o'
0« §
1 J1 i.2 -S"S H3
1 .s -§11_o.'a
o
1
1, Ǥi Lockland umbia Ave
ia 1111-^o"
4n
15T2 «
j
5* -§
"»
O Ct -c-
: c _
4
co 9 'i
sPH"1
? l
^
S
13 S
1
= |
OQ
g O C* Cq (TO ^ -«f <* * * M5 M5 CD t-- OO 00 OO OO OO OS
WIMIM <M <H <Mttl «<M<M<M<M<N«Mffl<M<M C-1IMIM
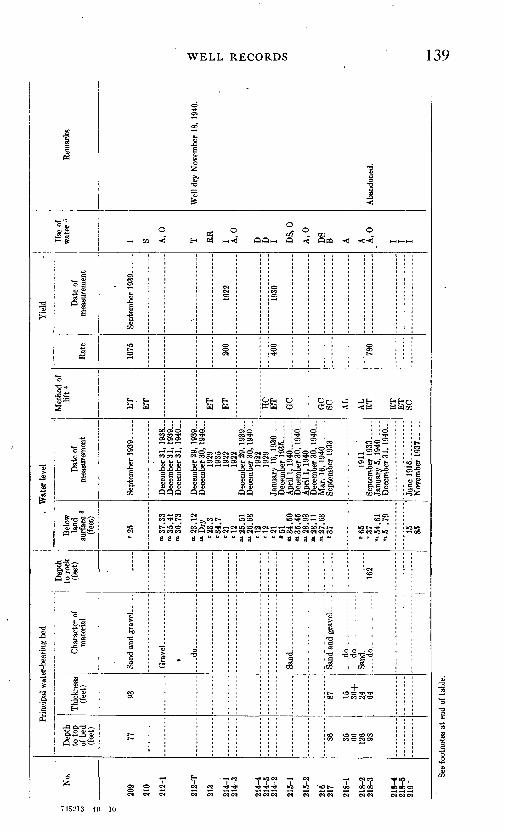
No.
209
210
212-
1
212-
T
213
214-
1 21
4-3
214-
4 21
4-5
214-
2
215-
1
215-
2
216
217
218-
1
218-
2 21
8-3
218-
4 21
8-5
219
4
Prin
cipa
l w
ater
-bea
ring
bed
Dep
th
to to
p of
bed
(fee
t)
77 86 35 fifi
126 98
Thic
knes
s(f
eet)
93 87 15
36+
24
6'4
Cha
ract
er o
f m
ater
ial
do
Sand
... .
do.. - --
d
o ....
Sand -
----
----
- .do -
.- -
Dep
th
to r
ock
(fee
t)
162
. W
ater
leve
l
Bel
ow
land
su
rfac
e 3
(fee
t)
'25
"»37
.33
"35.
41
"36
.73
»23
.12
"Dry
'2
3.3
'34
.7
'21
'12
"25
.51
m 2
6.68
'1
2
'12
'21
51
» 34
.50
"35
.45
=> 2
8.93
»2
8.11
"2
7.63
'3
7
'65
'37
» 5
4.61
»
5
.79
15
85
Dat
e of
m
easu
rem
ent
Sept
embe
r 1
93
9. .
Dec
embe
r 31
, 1938
Dec
embe
r 31,
1-9
39
Dec
embe
r 31
, 19
40...
Dec
embe
r 29
, 19
39...
Dec
embe
r 30
, 19
40...
19
29
1935
19
22
1922
D
ecem
ber
29,
1939
...
Dec
embe
r 30
, 1940
1922
19
29
Janu
ary
16,
1930
_--
Apr
ill,
19
40
-
Dec
embe
r 30
, 1940
Apr
il 1,
19
40
-_
_-
Dec
embe
r 30
, 19
40.._
M
ar.
16,
19
40
----
--
1911
Se
ptem
ber
19
33
. -
Janu
ary
5, 1
940-
..-.
Dec
embe
rSl,
1940
...
June
191
6.-.
.-..
Nov
embe
rl93
7.-.
-.
Met
hod
of
lift
*
BT
BT
BT
ET
HC
E
T
GC
GC
SC A
L
AL
BT
BT
E
T
SC
Yie
ld
Rat
e
1075 200
400
780
Dat
e of
m
easu
rem
ent
Sept
embe
r 1939--
-
1922
1930
Use
of
wat
er "
I S A, 0
T
RR
I A, 0
D
D
I DS,
0
A,
0
DS
B A A
A,0
I I I
Rem
arks
Wel
l dry
Nov
embe
r 18
, 19
40.
Aba
ndon
ed.
See
foot
note
s at
end
of t
able
.
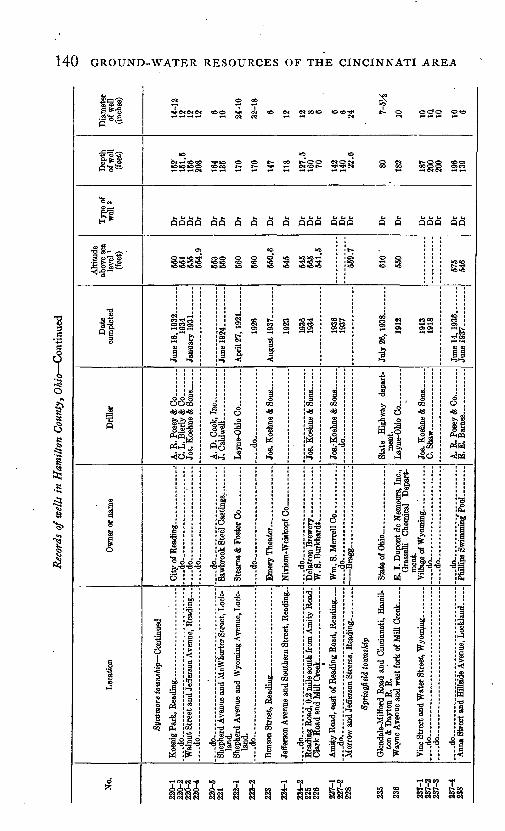
140 GROUND-WATER RESOURCES OF THE CINCINNATI AREA
3°£
O 00
tOO 4" CT CO IM C400CO o oc>o o<o
iMi-HCOOO 'SI US O O t~ OO t-OO C4 c-oo oo
fiQfifi Qfi fi fi fi fi fififi fifiQ Q fi QQfi (Sfi
^ O O 1C U3>C^-<US CO^ w1C 1C
1
-CO N COCO
-
» S 222 OS OOS
S3£
III £Jo
£0
Pnpe PI ft <&
«g 5
a 3
.-
^iiL3 O^2 ^
s a
T °? 7 ?e^j cq co -4< -4«»cco« <M c« <M 040*0*404 04 04 04 040*04
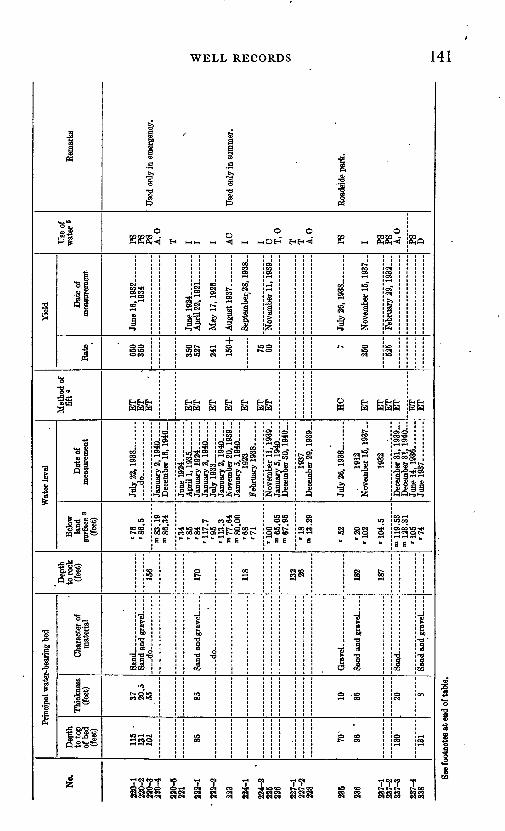
No.
220-
1 22
0-2
220-
3 22
0-4
220-
5 22
1
222-
1
222-
2
223
224-
1
224-
2 22
5 22
6
227-
1 22
7-2
228
235
236
237-
1 23
7-2
237-
3
237-
4 23
8
Prin
cipa
l wat
er-b
earin
g be
d
Dep
th
to to
p of
bed
(fe
et)
115
13
1 10
1 85 70'
96
'
180
131
Thic
knes
s (fe
et)
37
20.5
55 85 10 86 20 8
Cha
ract
er o
f m
ater
ial
Sand
and
gra
vel
d
o
Sand
and
gra
vel
Dep
th
to ro
ck
(feet
)
156
170
118
132 26 182
187
Wat
er le
vel
Belo
w
land
su
rfac
e3
(feet
)
'76
'86.
5
">83
.19
» 8
6.34
'34
'85
'84
'117
.7
'95
'113
.3
"77.
64
80
.00
'68
'71
'166
°>
65.0
5 ">
67.
95
'18
=» 13
.29
' 52 '20
'1
02
' 10
4.5
"> 11
9.53
">
123
.31
'105
'7
4
Dat
e of
m
easu
rem
ent
July
22,
193
8 ..
...
Dec
embe
r 16,
194
0
June
192
4.. ,_
....
A
pril
1,1
935
July
19
33
Janu
ary
2, 1
940 .
... .
N
ovem
ber 2
0, 1
939.
.
1923
Nov
embe
r 11
, 193
9-
Dec
embe
rSO
, 194
0
1937
D
ecem
ber 2
9, 1
939
July
26
1938
1912
N
ovem
ber
15, 1
937-
1932
Dec
embe
r 31,
193
9
Dec
embe
r 31,
194
0
June
14,
19
36
....
...
Met
hod
of
lift*
ET
E
T
ET
ET
E
T
ET
ET
ET
ET
E
T
EC
ET ET
E
T
ET
ET
E
T
Yie
ld
Rat
e
650
350
350
527
241
150+ 75
60 7
250
525
Dat
e of
m
easu
rem
ent
June
16,
193
2... ..
..19
34
June
1924..
Apr
il 22
, 19
21
May
17,
1926
Aug
ust 1
93
7
Sept
embe
r;28,
193
8
Nov
embe
r 11
, 193
9..
July
26,
1938
..
....
Nov
embe
r 15
, 193
7-
Febr
uary
29,
193
2 ...
Use
of
wat
er5
PS
PS
PS
A, 0
T I I I AC
I I C T, 0
T
T A,0
PS I PS
PS
A,0
PS
D
Rem
arks
Use
d on
ly in
em
erge
ncy.
Use
d on
ly in
sum
mer
.
Roa
dsid
e pa
rk.
See
foot
note
s at
end
of t
able
.
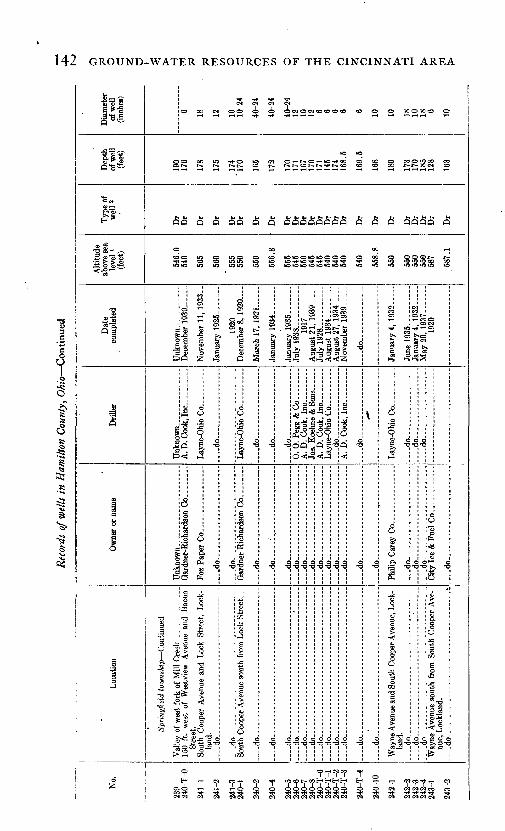
142 GROUND-WATER RESOURCES OF THE CINCINNATI AREA
IN?!* §' S°-
' J3=3^v+» 03 +»
S^J!
0*.
D«T3
-S I-*Jgfl3l~~
"O5-1at
o
iQ
o>
ae5IM
. i
§ '-§,3
S S ^ 5
1C to
O CD OO tO * O tO « O i ' O- O i i *O * OO O5 OO O CO O W3 OO
O
COfS>
aa Q o aa o o aaaSaafia a a fi fifiaa
O 00 OC
CD o to o too o CD to>oototoooo o oo o oooo-Tft Tft CD CD to tO to to to -^ to -rf* -^ ^P -^ M* M* to to tO tO tO OO to to to to to to *O to to to to to »O to tO tO to to to to tO tO tf|
ic-*£
1i
Jl «3
c
! §cs -1
i s ste fe -° -S > S | fes g 1
Q ^ £
j 0
f I0 1 '<J J
«s1"1 i o «? i
Is 31! § -^ S fe x5(5 pg
1 ii-aq i-3
"S "2 -Sc S ^vn » co
J jJ c: J4O) O) CJ
. O) > Oi *: ^ s §1 §I 2s «I og g* i; i1 ll 1
S -s^J> £ Ijs-o cis* i-*'>-« 02
I io »-i^H <M
__ _ CS "H*Soo *-i co" CS
t ~& 1~H >
§ § iw C8 C-3? "^t c D i< i-s
e"C
e T:
6o 3o& 0c -^
J
oo
JJ3
S
^0
ESoJ>d
§J
3
JS"3
3
>per Aven
a1 -03
^
-
4
c"C
««
>
4
1 C "C
1 C "C
^
ag
-
>
£
c5
J
O5
l^- T"H
2S«
> S>33 <>-:
j
60 JJ
Si fiC
dcd<!
c t
cT.
CT
C "C
S t-8^
||f £
M<
e"C
4
c"C
-i
[ j *> oj
HH § «'g'gS
e'I IJ
eT
c T:
c
e"C
4
cc
1C
C<
c"C
e T:
c "c
e"C
c"C
e"C
c"C
IN
^ "*3 a)i s
1-3 i-:
d j I 4
1
j1
6
oI O, c
a "c
P-i
JA
J
2c:
<!
1O-g
1
1 a
^G~§ C
1
1
C "C
e"C
c"C
g>cc
S
C
C "C
e"C
art00
o
§
1
cC
1£
s^ c
» T:
6i>
I
1e £J3
irenue sou ckland.
*3S«e &§-
153R
? o,S I i zi s<N W W « -"-" "
T7T7 Tooo
«««e<)C<i
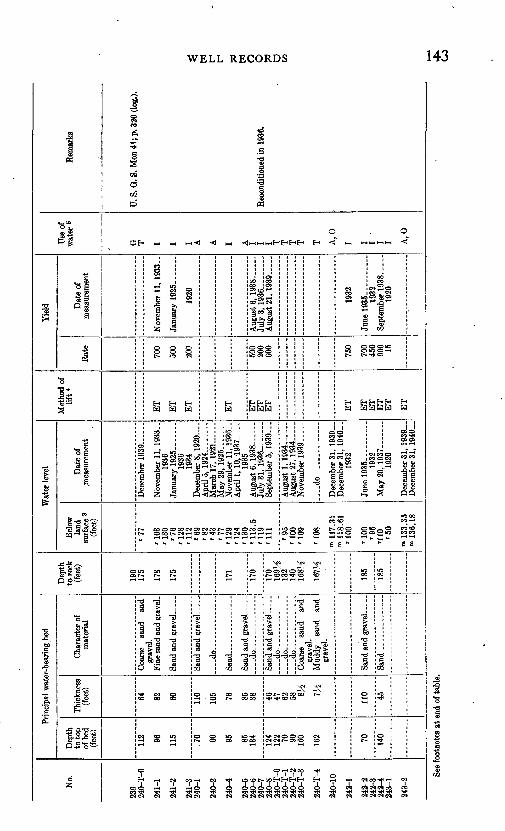
No.
239
240-
T-O
241-
1
241-
2
241-
3 24
0-1
240-
2
240-
4
240-
5 24
0-6
240-
7 24
0-8
240-
T-6
24
0-T
-l
240-
T-2
24
0-T
-3
240-
T-4
240-
10
242-
1
242-
2 24
2-3
242-
4 24
3-1
243-
2
Prin
cipa
l w
ater
-bea
ring
bed
Dep
th
to to
p of
bed
(fee
t)
112 96
115
.70 60
95 85
134
124
122 70
90
16
0
162 70 140
Thic
knes
s (f
eet)
64
82
60 110
105 76 85
38 46 47
62
58 8
^
7M
110 45
Cha
ract
er o
f m
ater
ial
Coa
rse
sand
an
d gr
avel
. Fi
ne s
and
and
grav
el-
Sand
and
gra
vel .....
d
o
San
d...
Sand
and
gra
vel ..
... .
do
....
do
....
do
Coa
rse
sand
an
d gr
avel
. M
uddy
sa
nd
and
grav
el.
Sand
and
gra
vel --
Sand
Dep
th
to r
ock
(fee
t)
190
175
178
175
171
170
170
169^
13
2 14
0 U
81A
M1A
185
185
Wat
er le
vel
Bel
ow
laud
su
rfac
e 3
(fee
t)
'77
'103
'1
30
'76
'1
28
'112
'6
9
'82
'43
'77
129
124
130
113.
5 11
9 11
1
'95
100
109
'108
m 11
7. 31
"1
18.6
1 '1
00
'100
'9
5
'110
'5
0
» 1
33.3
5 =>
136
.18
Dat
e of
.m
easu
rem
ent
Dec
embe
r 19
39. _
..
Nov
embe
r 11
, 19
33..
1936
1936
19
34
Dec
embe
r 8,
192
0 ..
Apr
il 5,
19
24
. -
Mar
ch 1
7, 1
921
....
May
29,
19
25
Nov
embe
r 11
, 193
6-
Apr
ill,
10
,19
37
.
1935
A
ugus
t 6,
1938
July
31,
1936
Se
ptem
ber
5, 1
939
Aug
ust
1, 1934
Aug
ust
27, 1934
Nov
embe
r 19
39.. ...
....d
o... ... ..
Dec
embe
r 31
, 19
39...
D
ecem
ber
31,
1940
-.
1932
1932
M
ay 2
0, 1
937.
.. ..
..19
20
Dec
embe
r 31,
193
9 _
Dec
embe
r 31
, 1940
Met
hod
of
lift
*
ET
ET
E
T
-
ET
ET
E
T
ET ET ET
E
T
ET
E
T
ET
Yie
ld
Rat
e
700
500
200
500
200
600
750
700
450
900 15
Dat
e of
m
easu
rem
ent
Nov
embe
r 11
, 19
33..
1920
July
3,
1936
.......
Aug
ust 2
1, 1
939
1932
1932
1920
Use
of
wat
er 8
G T I I I A A
I A
I I I T
T
T
T T A,0
I I I I I A,0
Rem
arks
U. S
. G. S
. Mon
41;
p. 3
20 (
log.
).
Rec
ondi
tione
d in
193
6.
See
foot
note
s at
end
of t
able
.C
o
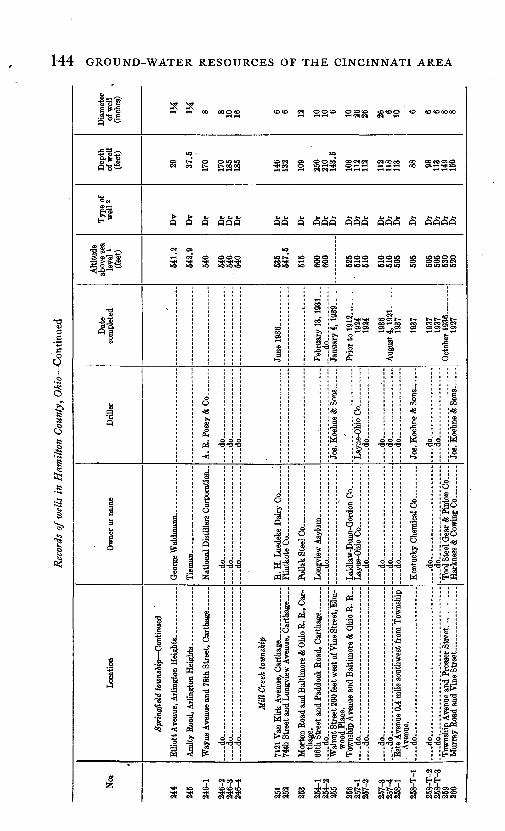
144 GROUND-WATER RESOURCES OF THE CINCINNATI AREA
I-H I-H oo OOOCD COCO CM OOCO OC cocoooo°
t- O O>OU9 to !>. fr-0000
COCM OS OOCO OOCMCM C4 00 CO 00 OOWOSO *« o tort.* =»m~< ^3^!^ °° °*^5!J2
Q Q Q QQQ QQ Q QQQ QPQ QQQ Q QQQQ
Sfr* W3 O OJ-* rt OO9IO U3 CO CO
soo 33591OU9 U9U9U
£ °
a .2
*i<*i coastCNC* osi-iero ro cs . c» e»e»S
« ^^
ffi boS
a ito5in WE
00
'
-5 -I a §PQ « a *
oo
al§ < fo
COt^l~. t~-t--CkOkAio ua uauNcSK <MC4<
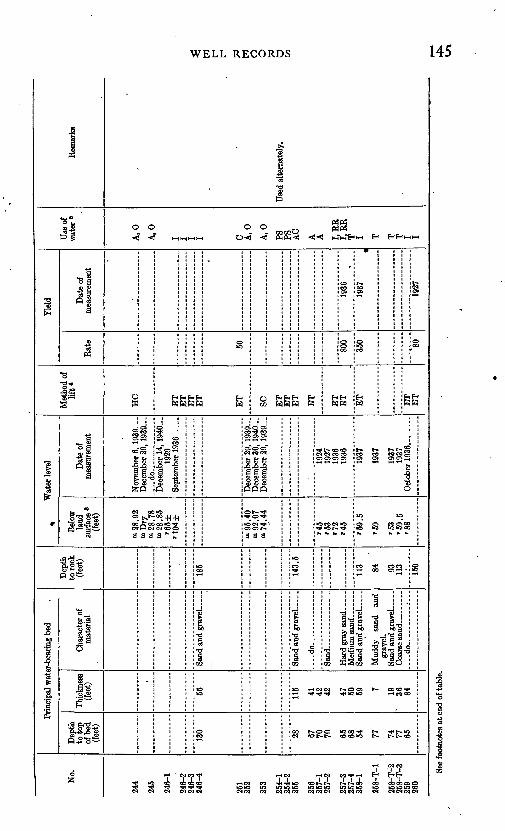
No.
244
245
246-
1
246-
2 24
6-3
246-
4
251
252
253
254-
1 25
4-2
255
256
257-
1 25
7-2
257-
3 25
7-4
258-
1
258-
T-l
258-
1^2
258-
T-3
259
260
, Pr
inci
pal w
ater
-bea
ring
bed
,
Dep
th
to to
p of
bed
(f
eet)
130 28 67
70
70 65
68
54 77 74
77
65
Thic
knes
s (f
eet)
.
55 115 41
42
42 47
50
59 7 19
' 36
84
Cha
ract
er o
f m
ater
ial
Sand
and
gra
vel .....
....
do
.. .........
Sand
__
-.-
-. _
_ -.
Sand
and
gra
vel
..
Mud
dy
sand
an
d gr
avel
. Sa
nd a
nd g
rave
l .....
. d
o .-
Dep
th
to r
ock
(fee
t)
185
143.
5
113 84 93
11
3
150
^ W
ater
leve
l
Bel
ow
land
su
rfac
e 3
(fee
t)
» 2
8.92
m
Dry
» 2
8.78
"28
.85
'6
5±
'1
04
±
°> 9
5.40
*»
92.
07
m 7
4. 4
4
'45
'53
1 72
'45
'59.5
'59
'53
'59.5
'8
8
Dat
e of
m
easu
rem
ent
Nov
embe
r 6,
193
9 ...
Dec
embe
r 29
. 19
39 _
....do.... ...
....
...
Dec
embe
r 14
, 1
94
0
1929
Dec
embe
r 29
, 19
39 ..
.D
ecem
ber
30,
1940
__
1924
19
27
1936
19
36
1937
1937
1937
19
37
Met
hod
of
lift
*
EC
ET
E
T
ET
E
T
ET
SO ET
E
T
ET
ET
ET
E
T
ET
ET
E
T
Yie
ld
Rat
e 50 800
350 80
Dat
e of
m
easu
rem
ent
1936
1937
1927
Use
of
wat
er 5
A,0
A,0
I I I I C
A, 0
A, 0
PS
PS
AC
A
A I.R
R
I, R
R
T
I T T
T
I I
Rem
arks
Use
d al
tern
atel
y.
See
foot
note
s at
end
of t
able
.
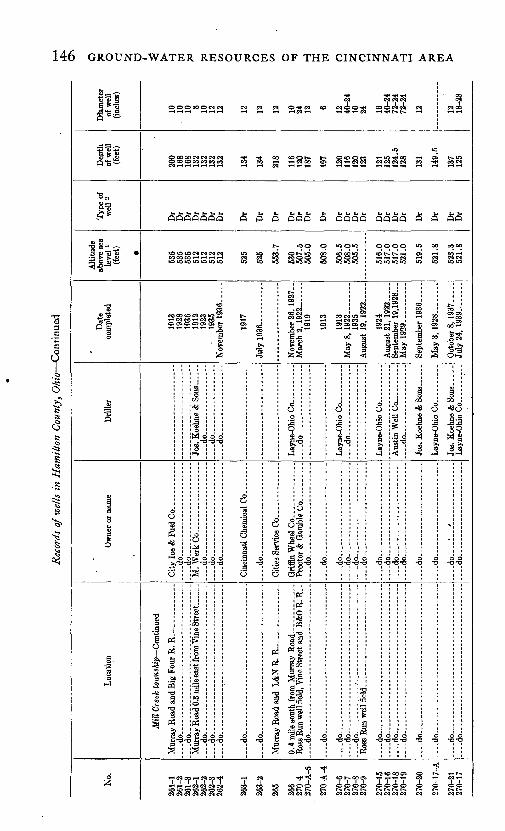
Rec
ords
of
wel
ls i
n H
amilt
on C
ount
y, O
hio
Con
tinu
ed
No.
261-
126
1-2
261-
326
2-1
262-
226
2-3
262-
4
263-
1
263-
2
265
266
270-
427
0-A
-5
270-
A-4
270-
627
0-7
270-
827
0-9
270-
1527
0-16
270-
1897
ft_
10
270-
20
97ft
-_1
7 A
270-
2127
0-17
Loc
atio
n
Mill
Cre
ek t
owns
hip C
ontin
ued
do
. .
do
. ...
- _
_
----
-
do do do
. .
- . ....
....do..... .. -_. . ..
....
. ..
.
-.-
do.................. ..
....
....
....
...
Ros
s R
un w
ell f
ield
, Vin
e St
reet
and
B&
O R
. R..
.do.... ........ ........ .........
....
do
....
....
....
....
. ..
... .... .........
-...do--
............. ...
....
....
....
.. ..
...
.. d
o..
. ..
....
do .
.
do
... .
do
..
.... . . .
... .
do....... ........ ................
do. .
...
do.
. u
- , -
do
--
- -
- - _
_
--
-.-
- .....
do
. -------
do
- _
_
- -
. ... _
__ ...
Ow
ner o
r na
me
do-..do--- ...............
M. W
erk
Co
...
. .......
-._-d
O .....................
do
do
-
-d
o..
... ..
..... ... ..
.
Grif
fin W
heel
Co...-
-. .
. d
o .... ..
.. ....- .
....do
-d
O-.
. ...
...
... ..... ...
d
o
..-do.. ..
. .... ..
......
-do-- ... ..... -
....do ... .
....
.. ..
. ...
.....
-dO
.......
d
o
d
o-- ... .
.. ..
. ..... ..
.
d
o........-
... .
...
_ do
..
.
. ..
d
o -
I-./
....
.... d
o ..
. ...
Dri
ller
-d
O
...
... .
do-
. ..
. ...... ... .
.do
.d
o
Aus
tin W
ell C
o -
-d
o--
...
.
Dat
e co
mpl
eted
1913
1928
1936
1912
1923
- 19
35
1917
July
19
36
... ..
. ..
Nov
embe
r 26
, 19
27..
Mar
ch 2
, 1922 ..
1919
1913
1913
May
8, 1922 .,
1935
1924
Aug
ust
21,
1922
-....
Sept
embe
r 19
,192
8 M
ay 1
929.
-
Sept
embe
r 19
36 ..
...
May
3, 1
92
8 .
.-..
Oct
ober
s, 1
937 .
.Ju
ly 2
4, 1
939
Alti
tude
ab
ove
sea
leve
l »
(fee
t)
535
535
535
512
512
512
512
525
525
553.
7
530
507.
550
5.0
508.
0
506.
550
8.0
505.
5
516.
051
7.0
517.
052
1.0
519.
5
521.
8
523.
352
1.8
Typ
e of
w
ell 3
Dr
Dr
Dr
Dr
Dr
Dr
Dr
Dr
Dr
Dr
Dr
Dr
Dr
Dr
Dr
Dr
Dr
Dr
Dr
Dr
Dr
Dr
Dr
Dr
Dr
Dr
Dep
th
of w
ell
(fee
t)
200
168
168
132
132
132
134
134
218
116
120
187
197
120
116
120
123
121
125
124.
512
8
131
149.
5
137
125
Dfa
met
er
of w
ell
(inch
es)
10 10 10 8 10 12 12 12 12 12 10 24 12 6 12 40-2
410 24 16 40
-24
72-2
472
-24
12 12 18-2
8
ON O
* o CJ * p k > H
W o W
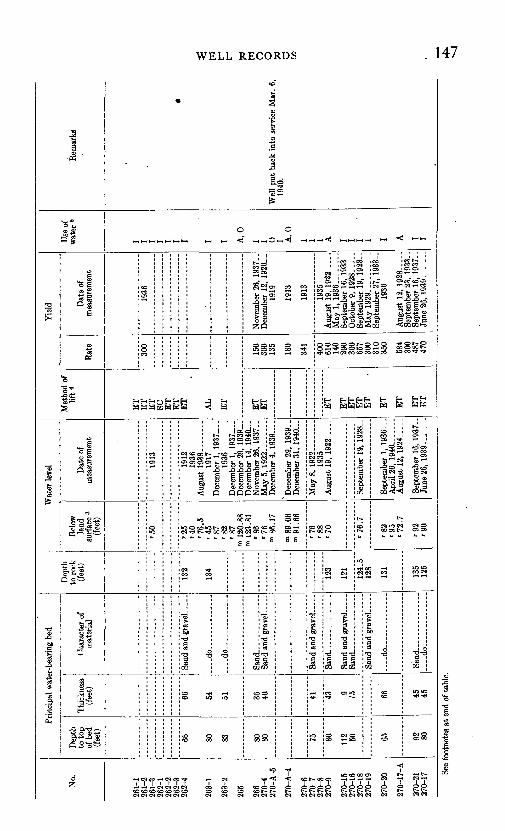
No.
261-
1 26
1-2
261-
3 26
2-1
262-
2 26
2-3
262-
4
263-
1
263-
2
265
266
270-
4 27
0-A
-5
270-
A-4
270-
6 27
0-7
270-
8 27
0-9
270-
15
270-
16
270-
18
270-
19
270-
20
270-
17-A
270-
21
270-
17
Prin
cipa
l w
ater
-bea
ring
bed
Dep
th
to to
p of
bed
(f
eet)
66 80
83 80
80 75 80 112 50 65 92
80
Thic
knes
s (f
eet)
66 54 51 36
40 41 43 9 /5 66
'
45
45
Cha
ract
er o
f m
ater
ial
Sand
and
gra
vel
. .
....d
o. ..........
....do... .
..........
Sand
and
gra
vel ..
....d
o ..
.. ..
. ...
.
....d
o- .........
Dep
th
to r
ock
(fee
t)
132
134
123
121
124.
5 12
8
131
135
125
Wat
er le
vel
Bel
ow
land
su
rfac
e 3
(fee
t)
'50
'25
'40
'76.5
'4
5'8
7
'82
'8
7
"» 1
20.8
8 =
123.
81
'86
'76
"
86.1
7
*> 8
9.06
"
91.6
6
'76
'88
'7
0
'76.7
'82
'95
'7
2.7
'92
'90
Dat
e of
m
easu
rem
ent
1913
1912
19
36
1917
D
ecem
ber
1, 1
937
1936
D
ecem
ber
1, 1937
Dec
embe
r 29
, 1939
Dec
embe
r 14
, 1
94
0
Nov
embe
r 26
, 19
37..
May
5, 1
92
2.....
'Dec
embe
r 29
, 19
39
Dec
embe
r 31
, 1940
May
8, 1
922
1935
A
ugus
t 19
, 19
22-.
...
Sept
embe
r 19
, 19
28-
Sept
embe
r 1,
1936
Apr
il 26
, 1940 .
...
Aug
ust
12, 1924
Sept
embe
r 16
, 19
37-
Met
hod
of
lift
*
ET
E
T
ET
SC
E
T
ET
E
T
AL
ET
ET
E
T ET
ET
E
T
ET
E
T ET
ET
ET
ET
Yie
ld
Rat
e
300
150
300
135
180
341
400
610
140
290
300
657
300
310
350
584
300
487
470
Dat
e of
m
easu
rem
ent
1936
Nov
embe
r 26
, 19
37..
Dec
embe
r 12
, 19
26 ..
.19
19
1913
1913
1935
A
ugus
t 19
, 1
92
2 ..
May
1, 1936
Sept
embe
r 16
, 19
33
Sept
embe
r 19
, 19
28-
May
1929 .
Sept
embe
r 27
, 19
33..
1936
Aug
ust
12, 1928
Sept
embe
r 23
, 19
33-
Sept
embe
r 16
, 19
37.
June
26,
193
9 ......
Use
of
wat
er fl
I I I I I I I I I A, 0
I I O
I A, 0
I I I A I I I I I A I I
Rem
arks
*
Wel
l pu
t ba
ck i
nto
serv
ice
Mar
. 6,
19
40.
w f r *
w
o O
See
foot
note
s at
end
of t
able
.
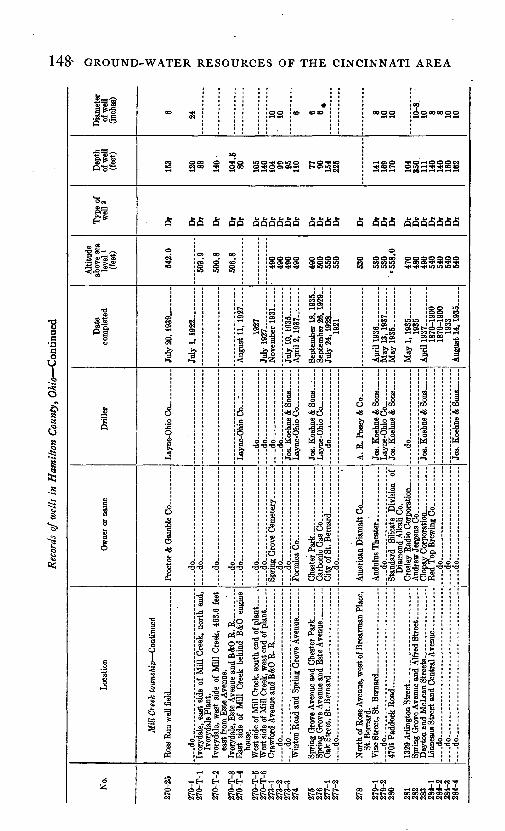
GROUND-WATER RESOURCES OF THE CINCINNATI AREA
«com 5OOOOOOO
S"35? &* g 8 S 28
Q QO (5 (5(3 (5QQQQQ QQQQ Q QQQQQQQ
a> oo oo
«"Si tl
o ^
dt SSMS O
, «CO * 'S w °*r"a <s <« <«<-g§ § 1
^O;d
ll
"8
^ds
5S 0 g5
!5?|.-^11
O
j. ^ «« °5-i
S Jrf JI 2|^ S-5 I 8 " I S^ M o'o
i I
3§s 1-52
<U VQQ> fe *
J1SB cS^g qs £1*^i11
_
G O. D. l> OQOQ
»-eioeon
C* CO^I 1O05
H HH E-i H 1-1 e« mi oo ^ico»»jj<M dcq cq eo eo eo cq IM
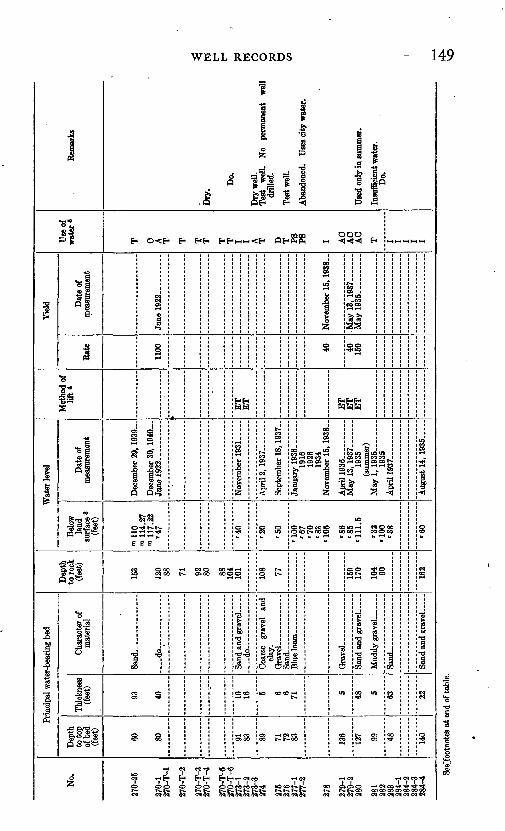
No.
270-
25
270-
1 27
0-T
-l
270-
T-2
270-
T-3
27
0-T
-4
270-
T-6
27
0-T
-627
3-1
273-
2 27
3-3
274
275
276
277-
1 27
7-2
278
279-
1 27
9-2
280
281
282
283
284-
1 28
4-2
284-
3 28
4-4
Prin
cipa
l wat
er-b
eari
ng b
ed
Dep
th
to to
p of
bed
(f
eet)
60
80 91 83 89 71
72
83 136
127 99 48 140
Thic
knes
s (f
eet)
93
40 16
16 5 6 6 71 5 48 5 63 22
Cha
ract
er o
f m
ater
ial
....do.... ..
....
....
Sand
and
gra
vel .....
....do-... ..
....
Coa
rse
grav
el
and
clay
.
Sand
and
gra
vel .....
Sand
. .....
Sand
and
gra
vel
Dep
th
to ro
ck
(fee
t)
153
120 88 71 92 80 88
104
101
108 77 159
170
104 90 162
Wat
er le
vel
Bel
ow
land
su
rfac
e 3
(fee
t)
-M10
n> 1
14.2
7«»
117
.22
'47
'40
'20
'50
'100
'6
7
70
'83
'105 '86
'8
5
'111
.5
'32
'100
'3
8
'60
Dat
e of
m
easu
rem
ent
Dec
embe
r 29
, 1939
Dec
embe
r 30
, 1940
Apr
il 2,
193
7... .....
1916
19
26
1934
N
ovem
ber
15, 1
938
Apr
il 1936..........
May
13,
1937. ..
.19
35
(sum
mer
) M
ay 1
,1935........
1935
A
pril
1937 .
......
Met
hod
of
lift
*
ET
E
T
ET
E
T
ET
Yie
ld
Rat
e
1100 40 40
15
0
Dat
e of
mea
sure
men
t
June
192
2 ..........
Nov
embe
r 15
, 193
8..
May
13,
19
37
.......
May
193
5.. ........
Use
of
wat
er «
T 0 A
T T T
T T
T.
I I A
T D T
PS
PS I AC
A
C
AC
T I I I I I
Rem
arks
Dry
.
Do.
Dry
wel
l. T
est
wel
l. N
o pe
rman
ent
wel
l dr
illed
.
Tes
t wel
l.
Aba
ndon
ed.
Use
s ci
ty w
ater
.
Use
d on
ly in
sum
mer
.
Insu
ffic
ient
wat
er.
Do.
See'
foot
note
s at
end
of t
able
.
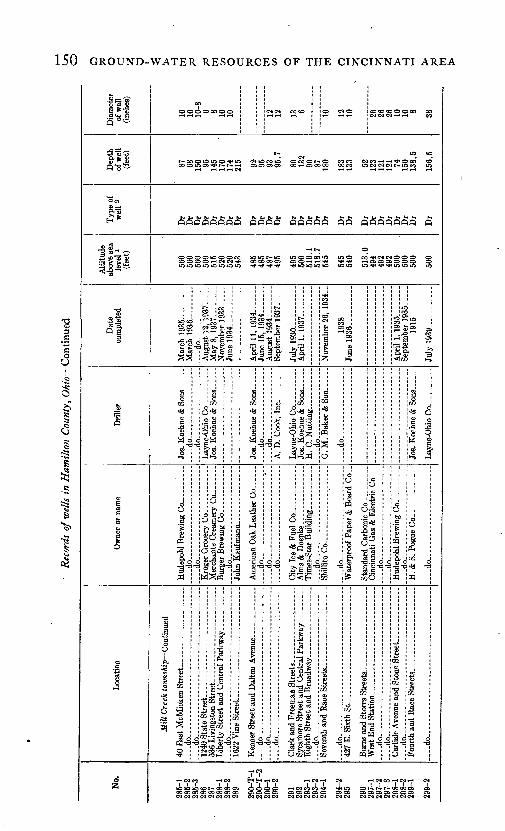
150 GROUND-WATER RESOURCES OF THE CINCINNATI AREA
1|J
3 ° !S'
|l|
Ii sl-^IjH
a-SJ§
1
^
Q
S
O
a
d
Tooococsooo <Mcq coco o cqo cococooocso cso
r-ooo^^o^.^ «^«5 oS?o^o «« g«^S^g«' «
QQOOQQQO QQQO OQQOQ QQ QQQQQQQ Q
i I !>. O
llll 11 1
|
^ *"**
g-s t- 1. 1 ss
jo
CO 3a
0M 4i
4
;' '
Dhl Brewing Co _ ..
&o9
1 i.9 i1 i
1 j1 4s -2 ^^ g^ ^
Mill Cr40 East McMi
do- ..
t~ 'J
1c5"
22J>jCO OO Q r-
1? S3 5<JS55>-
;
jJ
u«a.2 o
0>M & ^ 1
|
[
Grocery Co_ .--.... ints Creamery Co _ . Brewing Co. _ .
|||Ts2s«
&11!1§
o>O^S^3
"S^ §
1240 State Stn 536 Livingston Liberty Street
C CefiI J"11
$32 C«"
<*£
i
j
J=a
so
I1
;an Oak Leather Co_.
g co^:
§a?
gQ afli «S
1622 Vine Stre Kenner Street do .....
t^-c«I
.Si^ <
c ^
,
cT
-i
c.C
H~
1
P<
c
^
s2
, .2
i
«2«"
1
j1
Q=a si
l^°"J^M
c
«fea
>+
!1
!.f£13
ISOQ
&
C3
"3 >
if -1-SO §
CQi §13p +? HClark and Free Sycamore Strei Eighth Street t
iS 00
CO
J OJ50 5Sa 2
& <E
55 hi
d02
_fe
03
*-l CS T:
d
;[
1 < 3 T3
^
&
Jo
a>
^
a §
"a c
dO
>roof Paper & Board
te 4-e ceS c
& £
X
r<?
lati Gas & Electric (
.S ca0
ofti
02 e
J .o
*» S .£3 "3T3«a ajS i«-s51 1^=
0
w ^2 j
i
ohl Brewing Co. _ .
_c &_c
W
oaS
iTO aaOJ
do.. -. Carlisle Avenu -do
a>1-1 c.
2 1
»
& 6c .20 (^
i 5 S2?^
1-5 >-l
. Pogue Co.-. _...
2 cW
j2-3
CO
o
Fourth and Ra . do....
T^JS. Hr ^ssj 3, .5:22132 2CM <M CM <M CM CM <NI CM <M«!M!M §ffq<M«cq IN<M CM CM <N m <M CM m §
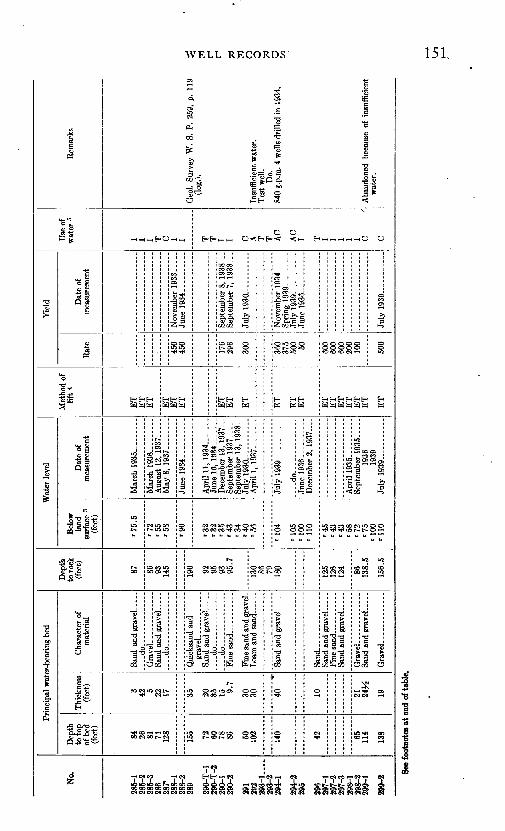
No.
285-
1 28
5-2
285-
3 28
6 28
7*
288-
1 28
8-2
289
290-
T-l
29
0-T
-2
290-
1 29
0-2
291
292
293-
1 __
293-
2 29
4-1
294-
2 29
5
296
297-
1 29
7-2
297-
3 29
8-1
298-
2 29
9-1
299-
2
Prin
cipa
l wat
er-b
eari
ng b
ed
Dep
th
to to
p of
bed
(f
eet)
84
26
81
71
128
155 72
60 78
86 50
102
140 42
..........
65
114
138
Thic
knes
s (f
eet) 3 42 5 22 17 35 20
35 15 9.7
30
30
""40"*
10
....
....
..
21
24
^
19
Cha
ract
er o
f m
ater
ial
Sand
and
gra
vel
..
Qui
cksa
nd a
nd
....do. .
Fine
san
d an
d gr
aveL
Lo
am a
nd s
and ..
San
d..
....
.. ...
.Sa
nd a
nd g
rav
el.
.
Sand
aud
gra
vel _
--
Dep
th
to ro
ck
(fee
t)
87 86
93
145
190 92
95
93
95.7
130 86
79
18Q
125
126
124 86
138.
5
156.
5
Wat
er le
vel
Bel
ow
land
su
rfac
e 3
(fee
t)
'75.5
'72
'55
'58
'90
'32
'32
'35
'43
'34
'4
0
'56
'104
'105
'1
00
'110 '45
'4
3
'43
'58
'72
'7
5
'100
'1
10
Dat
e of
m
easu
rem
ent
Mar
ch 1
93
5 ...
..
Mar
ch 1
936
Aug
ust
12, 1937
May
8,1
937
Apr
il It
, 1934.......
June
15,
19
34
Dec
embe
r 13
, 1937
Sept
embe
r 13
, 19
38-
July
1930--
----
--..
Apr
il 1,
1937
July
19
39
d
o-
Dec
embe
r 2,
1937
Apr
il 1935 .
......
Sept
embe
r 19
35 ..
. 19
36
1939
Ju
ly 1
93
9
Met
hod
of
lift
*
ET
E
T
ET
ET
E
T
ET
ET
E
T
ET
ET
ET
E
T
ET
E
T
ET
E
T
ET
E
T
ET
Yie
ld
Rat
e
450
450
176
296
300
360
375
500 50 600
600
600
200
100
500
Dat
e of
m
easu
rem
ent
Sept
embe
r 8,
1938
Sept
embe
r 7,
193
8- .
July
1930 .
.......
Nov
embe
r 19
34
...
July
19
39
........
July
1939
Use
of
wat
er &
I I I T C I I T
T
I I C A
T
T
AC
AC
I T
I I I I I C '
C
Rem
arks
Geo
l. Su
rvey
W.
S. P
. 25
9, p
. 11
9do
g.).
Insu
ffic
ient
wat
er.
Tes
t w
ell.
Do.
84
0 g.
p.in
. 4
wel
ls d
rille
d in
193
4.
Aba
ndon
ed b
ecau
se o
f in
suff
icie
nt
wat
er.
See
foot
note
s at e
nd o
f tab
le,
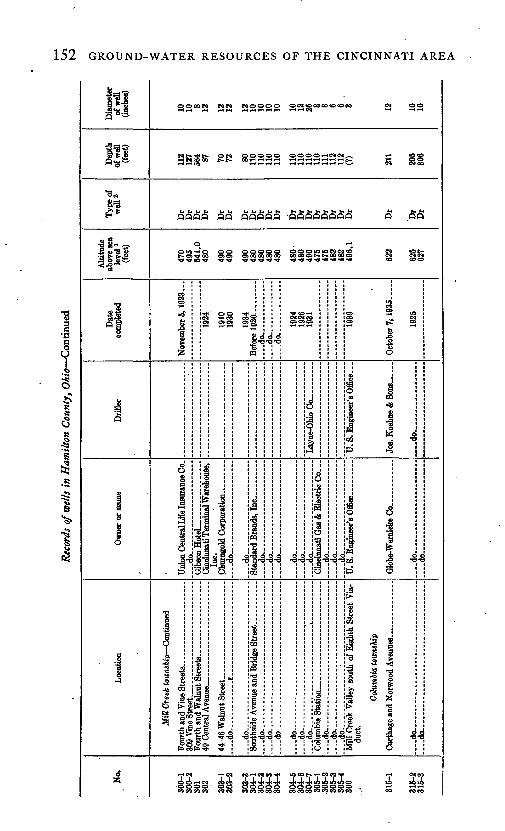
Rec
ords
of w
ells
in
Ham
ilto
n C
ount
y, O
hio
Con
tinue
d
No.
300-
130
0-2
301
302
303-
130
3-2
303-
330
4-1
304-
230
4-3
304-
4
304-
530
4-6
304-
730
5-1
-305
-230
5-3
305-
430
6
315-
1
315-
231
5-3
Loca
tion
Mill
Cre
ek to
wns
hip C
ontin
ued
309
Vin
e St
reet
______________ . .
..
44-4
8 W
alnu
t Stre
et _
__
__
__
__
__
__
_...
.do.
.. ......... .e . ..
....
....do.. ....................................
....d
o ... _
__
__
__
_____ . _
__
__
....
do
....
....
....
....
....
....
....
....
....
......do-.
................. ..
..............
.d
o... .
..... .
............. .
....
....
....
.. .d
O .,
....
do
...... .
....
....
....
....
....
....
....
do... _ -
do
....
. ..
......:.
....................
MiD
Cre
ek V
aUey
sou
th o
f Ei
ghth
Stre
et V
ia
duct
.
Col
umbi
a to
wns
hip
do . .... .
....
do
...
....
....
....
....................
Ow
ner
or n
ame
do.. ..
........
.......
... -
do
.. .
..................
....do-...., ..
........
....do... .
....
... .
....
....
....
.do ......... .
...........
.... d
o
_
. .
d
o..
....
....
....
....
....
.. do .
....
do
..
...
....
.........
. d
o..
....
. ...
....
..........
do
Dril
ler
_ d
o.
Dat
eco
mpl
eted
Nov
embe
r 5, 1
923.
..
1924
1910
1930
1934
Befo
re 1
920.
.
.... d
o...... ..
....
....
.. d
o...... ..
....
...... d
o
1924
1926
1931
1939
1
Oct
ober
7*1935.
1925
Alti
tude
abov
e se
ale
vel*
(feet
)
470
495
541.
048
0
490
490
490
480
480
480
480
480
480
490
475
475
482
482
496.
1
622
625
627
Type
of
wel
l 2
Dr
Dr
Dr
Dr
Dr
Dr
Dr
Dr
Dr
Dr
Dr
Dr
Dr
Dr
Dr
Dr
Dr
Dr
Dr
Dr
Dr
Dr
Dep
thof
wel
l(f
eet)
112
127
564 87 70 72 80 110
110
110
110
110
110
110
110
111
112
112
(?)
211
205
306
Dia
met
erof
wel
l(in
ches
)
10 10 8 12 12 12 12 10 10 10 10 10 12 26 8 8 6 6 3 12 10 10
O w O5 O
**J H W
W O W
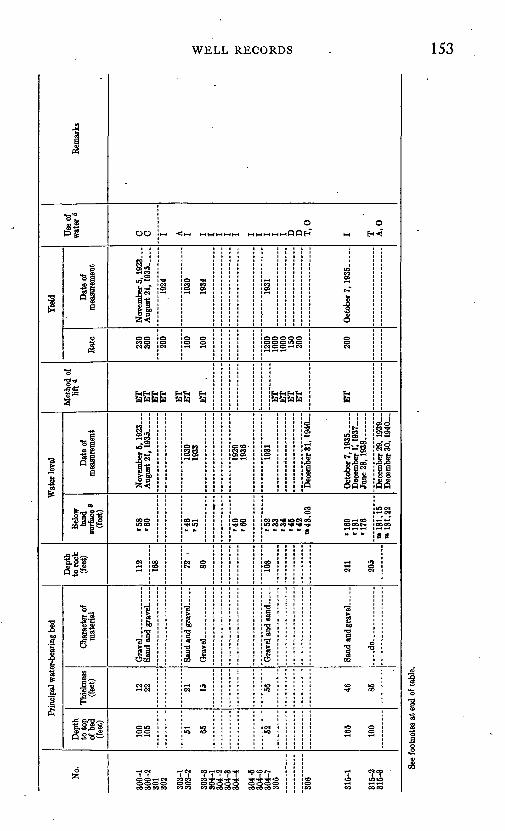
No.
300-
1 30
0-2
301
302
QA
O
1
303-
2
303-
3 30
4-1
304-
2 30
4-3
304-
4
304-
5 30
4-6
304-
7 30
5
306
315-
1
315-
2 31
5-3
Prin
cipa
l wat
er-b
earin
g be
d
Dep
th
to to
p of
bed
(feet
)
100
105 51 65 52 165
100
Thic
knes
s (fe
et)
12
22 21
15 56 46 85
Cha
ract
er o
f m
ater
ial
Sand
and
gra
vel
Gra
vel a
nd s
and.
__
Sand
and
gra
vel ..
....
do
....
....
....
..
Dep
th
to ro
ck
(feet
)
112
168 72
80 108
211
205
Wat
er le
vel
Belo
w
land
su
rfac
e3
(feet
)
'58
'60
'46
'5
1
'40
'6
0
'52
'33
'34
'4
5 '4
2 » 4
8.03
'169
'1
81
'176
"181
.15
» 18
1.22
Dat
e of
m
easu
rem
ent
Nov
embe
rs, 1
923 _
A
ugus
t 21,
1935..
1930
19
33
1920
19
36
1931
Dec
embe
r 31;
194
0_.
Oct
ober
?, 1
93
5-
.D
ecem
ber
1', 1
937
June
28,
1938
Dec
embe
r 29,
193
9...
Dec
embe
r 30,
194
0_.
Met
hod
of
lift*
ET
E
T
ET
E
T ET
E
T
ET
,
ET
E
T
ET
E
T
ET
Yie
ld
Rat
e
230
300
200
100
100
1200
10
00
1000
15
0 20
0
200
Dat
e of
m
easu
rem
ent
Nov
embe
r 5, 1
923 _
A
ugus
t 21,
193
5. ..
..
1924
1930
1934
1931
Oct
ober
?, 1
935.
Use
of
wat
er s
C C I A
I I I I I I I I I I I D
D
T,0
I T A,0
Rem
arks '
See
foot
note
s at
end
of t
able
.
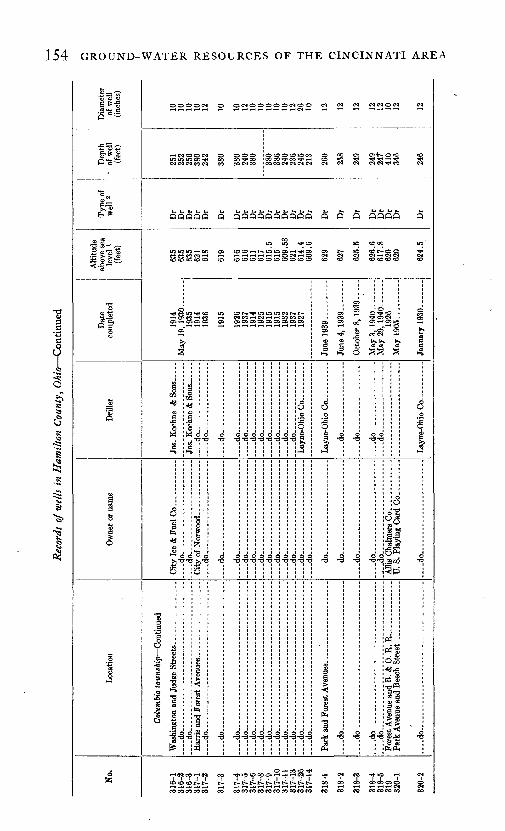
Rec
ords
of w
ells
in
Ham
ilton
Cou
nty,
Oh
io C
onti
nued
No.
316-
131
6-2
316-
331
7-1
317-
2
317-
3
317-
431
7-5
317-
631
7-8
317-
931
7-10
317-
1131
7-13
317-
2631
7-14
318-
1
318-
2
318-
3
318-
431
8-5
319
320-
1
320-
2
Loca
tion
Col
umbi
a to
wns
hip C
ontin
ued
-...d
o.
. .
..-.
do
....
....
.. .
....d
o..
....
. ...
....
....
....................
....do................ ..
....................
-...d
o.....................................
....
do......................................
... .
do..
....
....
.. .
.................. ..
......
do....................
... .
....
....
....
......
do..
... .
....
....
....
....................
....
do
....
....
....
....
....
....
....
....
....
....
..d
o..............- ..
............. .
...
....d
o............ ..
.-..
....
..-.
-...
._._
...
....
do
....
....
....
....
....
....
....
....
....
.. do. . . .
....d
o....................................
....d
o... .
....
....
....
-. ... .. .._
d
o-..
....
....
....
..................
....
do..
....
....
... .
....
......... ..
....
....
.
....d
o..
..
_ -.
Ow
ner
or n
ame
.... d
o... . ....... .-
.d
o.... ...
....
....
....
....
.
... .
do...
. ..... ..
;.. .
... .
....
.
.... d
o... ..............
.......
....
do
....
....
....
..... .
....
...... d
o..
....
....
....
....
.. d
o.......... ..
...
....do... .
....
... .
....
....
.. ..
....d
o. .
..........
.......
....
do..... .
.. ..
.........
d
O .... .... ,. -.-
-
do- ...
. ..
.... ..
....
....
do .......-. ..... ..
......d
o ...
....
....
....
....
.
do..... .
....
....
....
....
..
do..... ..
...... .....
.... d
o..
.. ..
....
....
....
....
..
....do........ ..
....
..... .
....
d
o.... ............ ........
U. S
. Pla
ying
Car
d C
o.
.
....
do
..
.. -. .... ..
Dril
ler
. d
o ........
-..
do
.
...... ..
...
-..-dO
. ..
....
...
... -
.... d
o-. ...
..
....
do..
..
.........
d
o ..
...
....d
o........ .......
do. .............
....do .... .
.... ...
..
do
...... ...
.. ..
.. d
o.... ...... .
..
.... d
o.... ..
.. ...
....
...
....do- ........ ...
..
d
O -
Dat
e co
mpl
eted
1914
May
19,
19
30
1935
1914
1936
1915
1926
1937
1914
1925
1915
1915
1932
1937
1927
June
4, 1939
Oct
ober
s, 1
939-
May
3, 1940
May
29,
1940 ..
.19
26M
ay 1
905..... . .
Alti
tude
ab
ove
sea
leve
l *
(fee
t)
635
635
635
621
618
619
616
616
611
617
615.
561
560
9.53
621
614.
460
9.6
629
627
625.
5
626.
661
7.8
620
620
624.
5
Typ
e of
w
ell 2
Dr
Dr
Dr
Dr
Dr
Dr
Dr
Dr
Dr
Dr
Dr
Dr
Dr
Dr
Dr
Dr
Dr
Dr
Dr
Dr
Dr
Dr
Dr
Dr
Dep
th
11 of
wel
l (f
eet)
251
252
256
380
242
380
380
240
380
380
386
240
236
245
213
260
258
249
249
247"
410
346
246
Dia
met
er
of w
ell
(inch
es)
10 10 10 10 12 10 10 12 10 10 10 10 10 12 26 10 12 12 12 12 12 10 12 12
W
O> O d 50
O
W !/> o "J H a W o O W
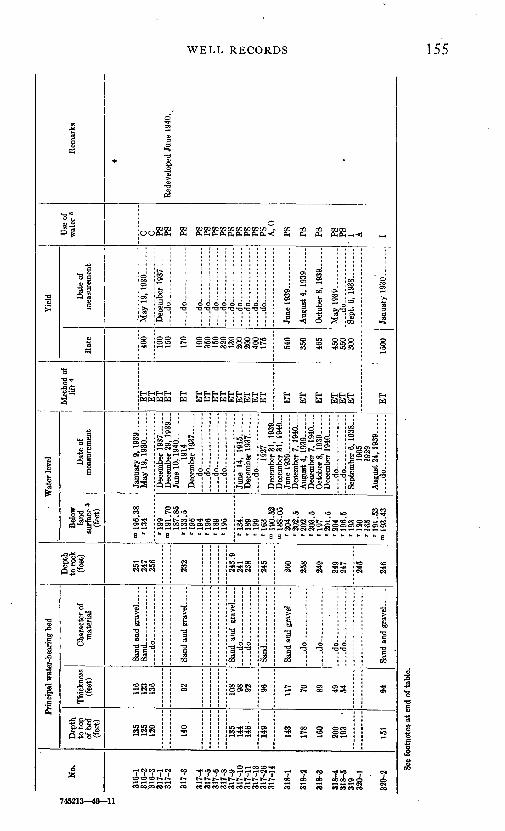
No.
316-
1 31
6-2
S16-
3 31
7-1
317-
2
317-
3
317-
4 31
7-5
317-
6 31
7-8
317-
9 31
7-10
31
7-11
31
7-13
31
7-26
31
7-14
318-
1
318-
2
318-
3
318-
4 31
8-5
319
320-
1
320-
2
Prin
cipa
l wat
er-b
eari
ng b
ed
Dep
th
to to
p of
bed
(f
eet)
135
125
120
140
135
144
146
149
143
178
160
200
193
'
151
Thic
knes
s (f
eet)
116
123
136 92 108 98
92 96 117 70
89 49
54 94
Cha
ract
er o
f m
ater
ial
Sand
and
gra
veL
....
Sand...............
. ...do...... ...
...
__
Sand
and
gra
vel
.....
....do........ ..
.
Sand .
... .
....
...
Sand
and
gra
vel .
.
....
do.... ........ ..
....do..............
d
o....
....
do- .........
Dep
th
to r
ock
(fee
t)
251
247
256
232
243.
924
1 23
8
245
260
258
249
249
247
245
246
W
ater
leve
l
Bel
ow
land
su
rfac
e 3
(fee
t)
» 1
96.3
8 '1
34
'199
"1
91.7
0 18
7.85
'1
33.5
'1
96
'194
'1
96
'189
'1
95
'134
. '1
89
'199
'1
63
m 1
90.5
2 *
188
.05
'204
'
202.
5 '2
02
'203
.5
'197
'2
01.5
'2
04
'196
.5
'193
'1
20
'165
'1
91.5
3 "
193
.43
Dat
e of
m
easu
rem
ent
Janu
ary
9, 1
939-
...
.M
ay 1
9, 1
930 _
Dec
embe
r 19
37 ...
Dec
embe
r 29
, 19
39...
Ju
ne 1
0, 1
94
0 .
1914
....
do
....
.. ..
.. ....
... .
do..,. ..
......do ..
. ... ..
..... d
o..
... ..-
June
14,
1915-
D
ecem
ber
1937
___
....do ...........
1927
D
ecem
ber
31,
1939
...D
ecem
ber
31,
1940
Dec
embe
r?,
1940 .
Aug
ust
4, 1
939.
_ -.
Dec
embe
r 7,
194
0. ..
. O
ctob
ers,
1939.....
....
do
-.-.
....
..,-
...
.. d
o-..
... .
...
Sept
embe
r 6,
193
8...
1905
19
29
Aug
ust
24, 1
93
9 .
Met
hod
of
lift
*
ET
E
T
ET
E
T
ET
ET
E
T
ET
E
T
ET
E
T
ET
E
T
ET
ET
ET
ET
ET
E
T
ET
ET
Yie
ld
Rat
e
400
100
150
170
100
350
150
320
130
200
200
400
175
540
350
465
450
550
300
1500
Dat
e of
m
easu
rem
ent
May
19,
1930 .
Dec
embe
r 1937 -
. do
....
dO
----------
do- __
....
do ..
. .... .
......do ...
....
...
do
. do
-
.....do
.-..do- .........
d
o
....
do ...
....
. ..
Aug
ust
4, 1
939
Oct
ober
s, 1
939.
May
1939..
--..
....
..
do _
-_ _
__ ..
.Se
pt.
6, 1
93
8 .
Janu
ary
1930
- ... ...
Use
of
wat
er s
C
C
PS
PS PS PS
PS
PS
PS
PS
PS
PS
PS
PS
A,
0
PS
PS
PS PS
PS I A I
Rem
arks
«
Red
evel
oped
Jun
e 19
40.
See
foot
note
s at
end
of t
able
.
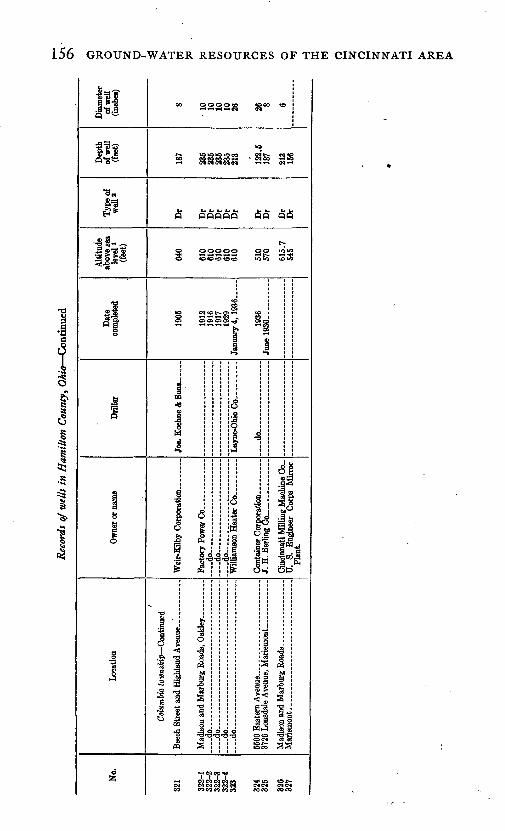
156 GROUND-WATER RESOURCES OF THE CINCINNATI AREA
§ a
i
oo ooooco toco co
QfS
00000 ooU9U9 x9
a |
1 l*8-s
-S-r
r*r<a
L* §
Js 8 g a I
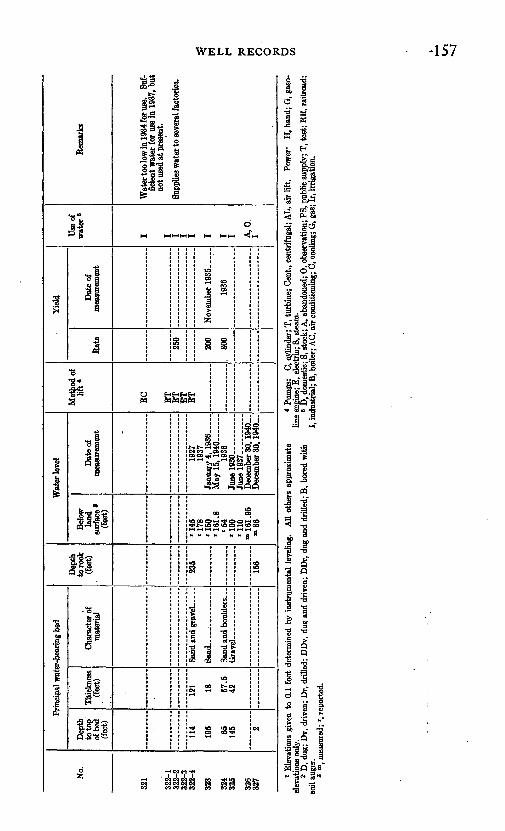
No.
321
322-
1 32
2-2
322-
3 32
2-4
323
324
325
326
327
Prin
cipa
l wat
er-b
eari
ng b
ed
Dep
th
to to
p of
bed
(f
eet)
114
195 65
145 2
Thic
knes
s (f
eet)
121 IS 57
.5
42
Cha
ract
er o
f m
ater
ial
Sarid
and
gra
vel ..
Sand
.
Dep
th
to ro
ok
(fee
t)
235
156
Wat
er le
vel
Bel
ow
land
su
rfac
e 8
(fee
t)
'145
'1
78
'150
' 16
1.8
'54
'1
00
'110
"161
.95
«»86
Dat
e of
m
easu
rem
ent
1927
19
37
Janu
ary
4, 1
936
May
15,
1940
19
36
June
193
0Ju
ne 1
937 _
__
__
Dec
embe
r 30
, 1940
Dec
embe
r 30
, 1940
Met
hod
of
lift
*
EC
ET
E
T
ET
E
T
Yie
ld
Rat
e
250
200
800
Dat
e of
m
easu
rem
ent
Nov
embe
r 19
35 _
_
1936
Use
of
wat
er5
I I I I I I I I A,0
Rem
arks
Wat
er to
o lo
w in
193
4 fo
r use
. Su
f
fici
ent w
ater
for
use
in 1
937,
but
no
t use
d at
pre
sent
.
Supp
lies w
ater
to s
ever
al f
acto
ries.
1 E
leva
tions
giv
en t
o 0.
1 fo
ot d
eter
min
ed b
y in
stru
men
tal
leve
ling.
A
ll ot
hers
app
roxi
mat
e el
evat
ions
onl
y.2
D,
dug;
Dv,
dri
ven;
Dr,
drill
ed;
DD
v, d
ug a
nd d
rive
n; D
Dr,
dug
and
drill
ed; B
, bo
red
with
so
il au
ger.
3 m
, mea
sure
d; *
, rep
orte
d.
* Pu
mps
: C
, cyl
inde
r; T
, tur
bine
; C
ent.,
cen
trif
ugal
; A
L, a
ir li
ft.
Pow
er:
H, h
and;
G, g
aso
lin
e en
gine
; E, e
lect
ric;
S, s
team
.6
D, d
omes
tic; S
, sto
ck; A
, aba
ndon
ed;
0, o
bser
vatio
n; P
S, p
ublic
sup
ply;
T, t
est;
RR
, rai
lroa
d;
I, in
dust
rial
; B, b
oile
r; A
C, a
ir c
ondi
tioni
ng;
C, c
oolin
g; G
, gas
; Ir,
irri
gatio
n.
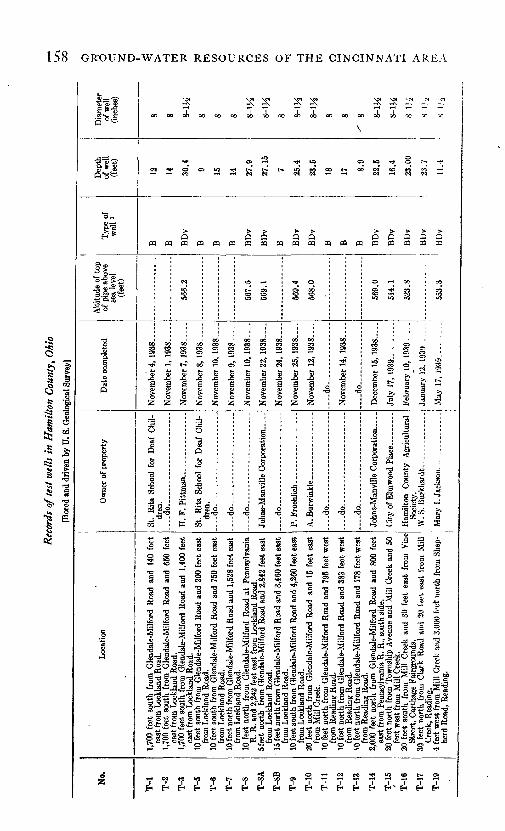
158 GROUND-WATER RESOURCES OF THE CINCINNATI AREA
NN*4\
OOCOQOOOOOOO OOQOOOOO OOQOaO
^(tit>t> oeocc <-!««»-
Q Q
|-SJ^"s
CO CO CO CO
OS OS OS °H
111s s e g I I^ ^ ^^i ^ XH
Cft OS OS OS
J I I J J& & & & ai i i i &
I 1
OS -*
2 g
>» : -2 -
m §%3 -;
3 ax» a
a -a
I Jf ! 1 Iff 1 1 i 1
I 1 I
!§13||1|1|13 g|gi _ - ^ _ . g ^
«i*_rt«*3 gg**- ^**-' £3**- CJ «*- O *"flUt4~' ®_a^2 *3 O
sgsH OW S£ °
7 2 2 i f ^^-i f-i E-i E-i E-i H
< paop op «
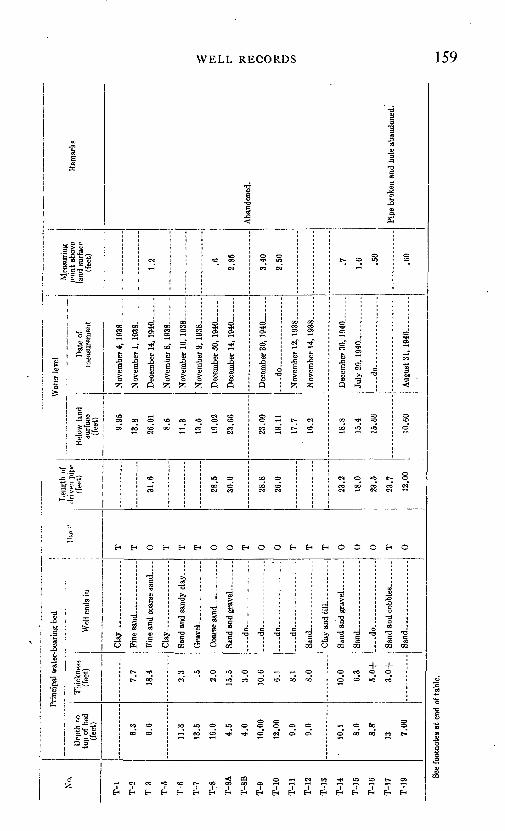
WELL RECORDS 159
il?
si oo oo -5, oo
cs^lcscscsSS ZgQgggQQ
§C | o> oo o i<9 m
£sJ i » 2 s °°' :£OO -* CO
iffl O
00 O
oo oOO SO
E-" E-> O H E-i O O E-> O O 0 0 O E-i 0
JJ
1
fe
a_e
-o0
^ss
:IJf-
cT3U'SJ
*»
c
I
^
§a
S $
"e "g
^ 05 03 t»
1 £ c
*" 2
CO CO
CO CO
J^ 3
>. "53 "e §
«3 T3 «-
a a §
cc O 6 cc
CO iO O »O O
W W »« CO
CO »« O UD O
<ri pci j i - i i
-I
CO
o
o o0
s
i c T
CO
§e«
o
&
c c
00
01
Ol
^
^_ c^
"3 *Cfl S:
o
0
01
<N CO
Ei Ei
1 a'If"5
CO CO
o co oo co m
- o 60O OO 00
* »O CO
E^ E!. E!.
03
1'S § 1« «
CO GC
oCO
sOT l>
t- OS
^ E^
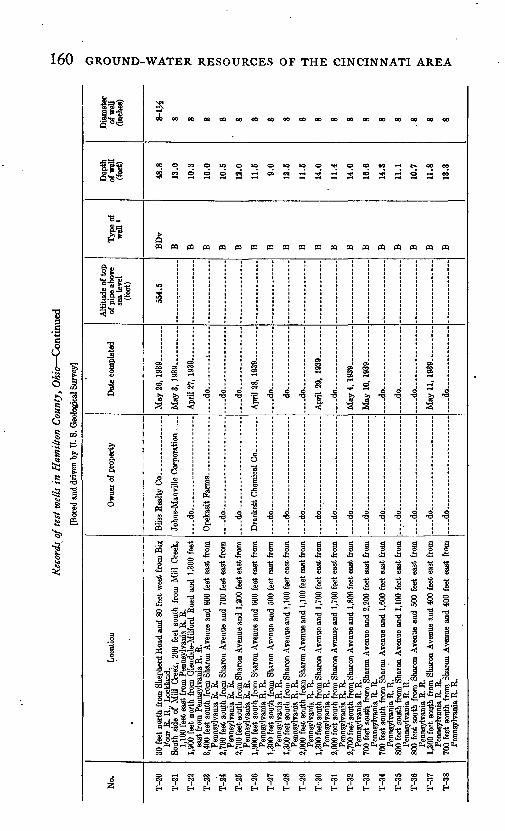
Rec
ords
of t
est
wel
ls i
n H
amil
ton
Cou
nty,
Oh
io C
onti
nued
[Bor
ed a
nd d
riven
by
U. S
. Geo
logi
cal S
urve
y]
No.
T-20
T-21
T-22
T-23
T-24
T-25
T-2
6
T-2
7
TO
fl
T-2
9
T-30
T-31
T-32
T-33
T-34
T-3
5
T-36
T-3
7
T-3
8
Loca
tion
Four
R.
R.,
Lock
land
. So
uth
side
of M
ill C
reek
, 20
0 fe
et s
outh
fro
m M
ill C
reek
,1,
100
feet
eas
t fro
m P
enns
ylva
nia
R. R
.
east
from
Pen
nsyl
vani
a R
. R.
Penn
sylv
ania
R. R
.
Penn
sylv
ania
R. R
. -
Penn
sylv
ania
R. R
.
Penn
sylv
ania
R. R
.
Penn
sylv
ania
R. R
.
Penn
sylv
ania
R. R
.
Penn
sylv
ania
R. R
.
Penn
sylv
ania
R. R
.
Penn
sylv
ania
R. R
.
Penn
sylv
ania
R. R
. '
Penn
sylv
ania
R. R
.
Penn
sylv
ania
R. R
.
Penn
sylv
ania
R. R
.
Penn
sylv
ania
R. R
.
Penn
sylv
ania
R. R
.
Penn
sylv
ania
R. R
.
Ow
ner
of p
rope
rty
... .
do....
.... .
.. ..
.. ..
....
d
o
....
do
-...
......... ..
....
..
do.
... -
do .
..
....
do
,...
...
..............
....
do
...-
. ..
....
....
....
.
do
....
....
do
-..
...
....
....
....
.
.d
o..
....
........ .
....
..
... -
do....
..... ..
. ...
. .
....
do
.
....
do
...
.. ..
.........
....
do
....
....
....
....
...
....
do
. ..
Dat
e co
mpl
eted
May
26,
1939
... ..
....
May
3, 1
939 ..
....
Apr
il 27
, 1939
. d
o...-
........
....do.... ..
....
.
Apr
il 28
, 19
39
. .
..
....
do.
..
... .
..
do
... ..
....
.
....
do
...
...
Apr
il 29
, 19
39...
.....
do .
May
4, 1
939 ..
....
May
10,
1939
... ..
. ...
....
do
.
..... .
d
o .
do _
..
May
11,
193
9 .........
. _ d
o... ..
....
....
...
Alti
tude
of t
op
of p
ipe
abov
e se
a le
vel
(feet
)
554.
5
Type
of
wel
l'
BD
v
B B B B B B B B B B B B B B B B B B
Dep
th
of w
ell
(feet
)
AS.
fi
13.0
10.3
10.0
10.5
12.0
11.5 9n
12.5
11.5
14.0
11.4
14.0
16.6
14.3
11.1
10.7
11.8
13.3
Dia
met
er
of w
ell
(inch
es)
fi_I
U£
8 8 8 8 8 8 8 8 8 8 8 8 ,8 8 8
Os
O o 9t
O cj o w oo O
^ H W w o I I * o W
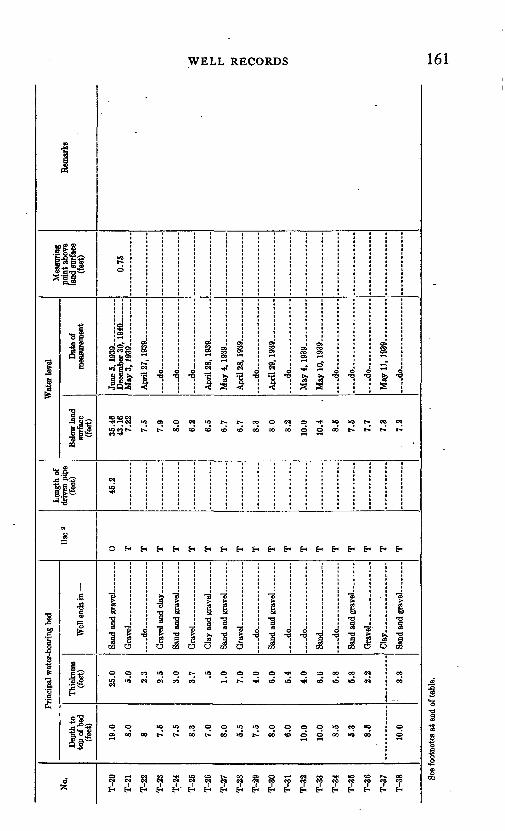
WELL RECORDS 161
1
"ft
1
"8
1
1
I
1
1.1
1
1
'siv S.
as8
3*S'«S
"3 ai""»
8.ft©
1
1.a 3§
£
i11^
«
o
t o
j(.
e»Seseo co e»1
illI-»Q!S
COtOCN *t-l«
iSSS*"
O E-
O
!? B 1
02 C
. 0 C
to 1C CM
0 C
en oc t i
% I
o
S £5'1
<5
1C
l>
EH
s
csi
00
C! C!
tr<
, ^
ai-
EH
>
1 C
5
1
WCM
«t-
sEH
4
C
CC
E-
1
?0!
1 OC
cM
1C
t-
o EH
4
c<4S
EH
!
1 « ^ ^
ea
cc00
"S c;' EH
o
2S
I
1C
to
EH
1 «b t* >
10
cl>
1
as» i-H
-*
U "5^
l>
CC
E-
1o 5 T:' i
, -c
c*
eoc
SH
01
S. «
CM
' 1<<
CC
H
D
1
1
C
*-
1C
00
2EH
.*
CC
oc
EH
4
c »
1C
I O3
2EH
O
O
CR C4
'S 1
coc
E-
1 c§IoC
ece
eoc
c
EH
I ""
CM
CC
EH
D
£
<<10
oCO
2H
CRCO
iH
1S
cc
£-<
a
c^
cc
gh c*- 1
.S
c
H
14:cc
C
C^
fn
c, -e
u:cc
E-
oc1C
1C
oc
Tl
eT
1C
l>
EH
1G
I
oc10
«u;
10
2EH
C t
I>
E-
"
1
CM
CM
«
oc
; «e
2EH
S ^
m!>.
EH
'i
IN.
2EH
' ^
CM
t
EH
"og- &i' 1 £
CO
CO
_
oo
00
2
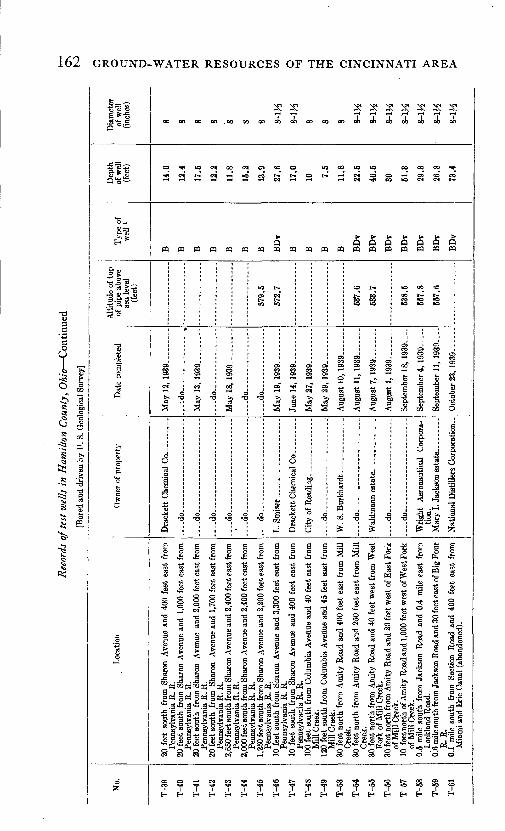
162 GROUND-WATER RESOURCES OF THE CINCINNATI AREA
"C<u3
_C
Co
Y _" 5J %*
CO
£ 1| 1
R 02 S ^1 > 'i >>1 x>
to gfc*
55 'E
-5 "°
1 ^
2 CQ
X ~
14
\1=3?B ^"o
dtrG-gfe
||
f|"s -§1*5? § s J s'il^ c
"c.
c°
c
300000000. GO 00000
O * U5 <M 00 <M 0> «
* ^\ r^4
3; x sCO CO QO CO CO CO CO
0 IO 00 IO IO
(5 Q Q Qpqeqpqpqpqpqpqpqpqpqpqpqpqpqpq
oa* *
S
s
_£>o
I"c
fe
O
c
1
0
I
cO
1'j=
_JO
1§Q
1
!i oc
s c
ag
JsCO
C T
C c
*
o-C*"a
1
o
c c
-c
o;a
a1 1>
5
c
c -t
c
-
IO l>
OS C<t^ t IO >O
o: cc0
a
e >
S
od
<j
a
! ' 1-3
C0
i_ia
o-
a
;
5
1
1S i £5 a 1 °
^ CQ «
t-
a s a a s s ao o o o o o o M L* *^ tfc ^ vt< *h
| 1 -s 1 | | |
§ 1 1 1 1 1 1N i i M <N N ;
^ S ^ -a -a -a " a g 3 a a o ^C eg ^5 S3 c« ce 5
So i 3 3 § i a § I g g g a
J C3 ^
S " J3 CQ 03 CO JpjCQpjCQpj^Opj epj gpj flpj 0^
G
S *
^
o o <*<
1
c
1£J
pj 3-
oMO
»
s
>> "C
C
E
Sc«
O <*< a
CO t-
CO
s s
a o> § S S> §§
I T-* i ( Oi Cft«
C i- »
£ ) OT bD fafl ^ i? ST -^- -
"2J§3
CQ ^^'
<J <J
JJsa
1 4
^
S ' ! ' } -» * ^ ^H .7-1 OQ h
S 'S! 'S! k? O ^. *$< $&: fr
"3 -*s -M
rt
§ ^
1 *A ^§ 2 O O & s o 10 o ««
§ c
<J*
1c _c
pj
|ej |pj gpj grtlrtlrf J«.gpj I* o "-1 i9>t3 si! «<i; «js <sjs csja «Jj g«" «*"
llsl^lllllllNllll 3t.g>-gt.-gt.tot.int«in>-3t>3fc5"'S'S'^l'gi'R-S'^-S'R-sl.i'feSli^
S c3 q? c3 "a? g"oc3!ir M^ fl^QQJ pSfl^g
1 § § § 5 ^ ^ | ^ sc3
3 ^ S
SC ^3 O «J
C? °>»
§ '§ '§ 'fl .-a« <j <j <j^ q
^ * s ^00 09 09 00
co eo oo THi 1 OS «O CO IO <M <M t~-
Q Q Q Qpq pq ffl pq
IO 00 CO
00 t- !>.
S 1O >O 1C >O
i ;O 1 OS
i-< OS rt OT
00 ^. rt 2
*" S S ?3S rt c3 S>
® J 5 § t , "g. "g. -ga CQ CQ O
^ ' So ' .2§* ! So ! R
-S s< ' ;« o§ "S °
s I §L* o -2^ 83 Q
Sa^ § i .SP.2 £? -S
^ S iS
a s s ao o g o fa A fa J3 g -w .M -g
.»_, O 03 ^*
^ -a o -ai * I if 9 *§ "i « §rt d '^ a s a o5 a^
J o w "S^T« -M .fi «>, "-> 2*5^ e8 58
"a S "> BOS a a a®-) B o.a o,, o n n a »- a J3 ^i-i 5 *-*.£,2 0 0 OQ g .< "|,8 A
-g'^HtS rS ^S^^J^a05^ ="§jyi .1 .|?!SlSfli ! - IlllllliiJSIIillJiJ
S88SSS---SSSS'gSgg"
OS
HO -H <M CO <*< «O «
E- H H H H H H 200 S S S 10 o
H H H H H H
rt O 'o C>
!>. 00 OS rt IO IO IO CO
EH H EH H
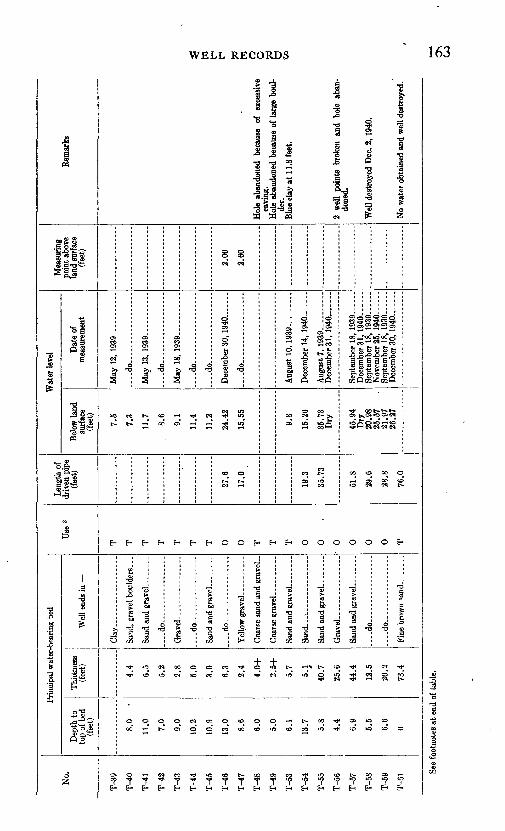
No.
T-3
9
T-4
0
T-4
1
T-4
2
T-4
3
T-4
4
T-4
5
T-4
6
T-4
7
T-4
8
T-4
9
T-5
3
T-5
4
T-5
5
T-5
6
T-5
7
T-5
8
T-5
9
T-6
1
Prin
cipa
l w
ater
-bea
ring
bed
Dep
th t
o to
p of
bed
(f
eet)
8.0
-
11.0
7.0
9.0
10.2
10.9
13.0
8.6
6.0
5.0
6.1
13.7
5.8
4.4
6.9
5.5
6.6
0
Thic
knes
s (f
eet)
4.4
6.5
5.2
2.8
5.0
3.0
6.3
2.4
4.0
+
2.5
+
5.7
5.1
40.7
25.6
44.4
12.5
20.2
73.4
Wel
l en
ds in
Cla
y
Sand
, gra
vel b
ould
ers.
..
do .............
... .
do
....
do
....
Coa
rse
sand
and
gra
vel
Sand -
. .
.... d
o..
..
....
do ..
Use
2
T
T
T
T
T
T
T
0
0
T T
T
0
0 o 0
0 0
T
Len
gth
of
driv
en p
ipe
(fee
t)
27.6
17.0
19.3
35.7
3
51.8
29.6
28.8
76.0
Wat
er le
vel
Bel
ow l
and
surf
ace
(fee
t)
7.5
7.3
11.7
8.6
9.1
11.4
11.2
24.4
2
15.5
5
9.8
15.2
6
35.7
3 D
ry
45.9
4 D
ry
20.9
8 25
.57
21.9
7 26
.27
Dat
e of
m
easu
rem
ent
May
12,
1939
....d
o. .............
May
13.
1939
do..
....
....
. .......
May
18,
1939
.... d
o
do. .............
Dec
embe
r 30
, 19
40. ...
...
d
o.... ..
..
. ...
Aug
ust
10,
1939
Dec
embe
r 31
, 1940
Sept
embe
r 18
, 19
39- -
Sept
embe
r 18
, 19
39 _
...
Sept
embe
r 18
, 19
39 _
_
Mea
suri
ng
poin
t ab
ove
land
sur
face
(f
eet)
2.00
2.60
Rem
arks
Hol
e ab
ando
ned
beca
use
of
exce
ssiv
e ca
ving
. H
ole
aban
done
d be
caus
e of
lar
ge b
oul
de
r. B
lue
clay
at
11.8
fee
t.
2 w
ell
poin
ts b
roke
n an
d ho
le a
ban
do
ned.
Wel
l des
troy
ed D
ec.
2, 1
940.
No
wat
er o
btai
ned
and
wel
l des
troy
ed.
See
foot
note
s at
end
of t
able
.O
N
CO
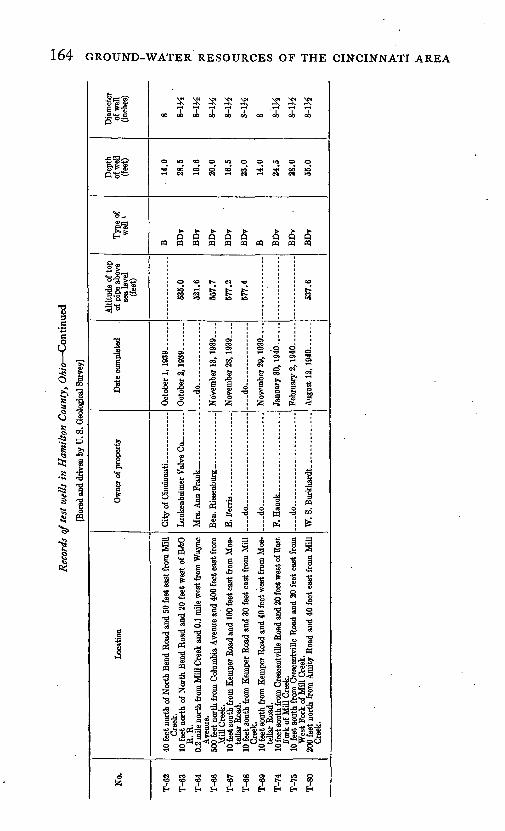
164 GROUND-WATER RESOURCES OF THE CINCINNATI AREA
^ oJ *
1
3 * § 2*3=9. 0000000000 oo oo oo oo
ouaoouaoouaoo ^fiooo»o<oeo^f<^oou3^HCS|i-HCN,-Hc4^l<MCSlMa
£ ,5 & & & <§ apqpqpqpqpqpqpppqpq
O CO t~ c*l ^fl
ua i i t^ t^ i>Tco <M us t» t»w us us ia ia
a oS 1
-fe 6S5 iz;
CO O Orl ~*H tf
^ OS Oi
1 1 I II I |1 1l-s^lalaof
! 111111! I
S o
I a aM M M
.111
*-H O US t-l *-H *-H
cqco^fcot>.QOoa^ua y ==, co y co j « ^ ^
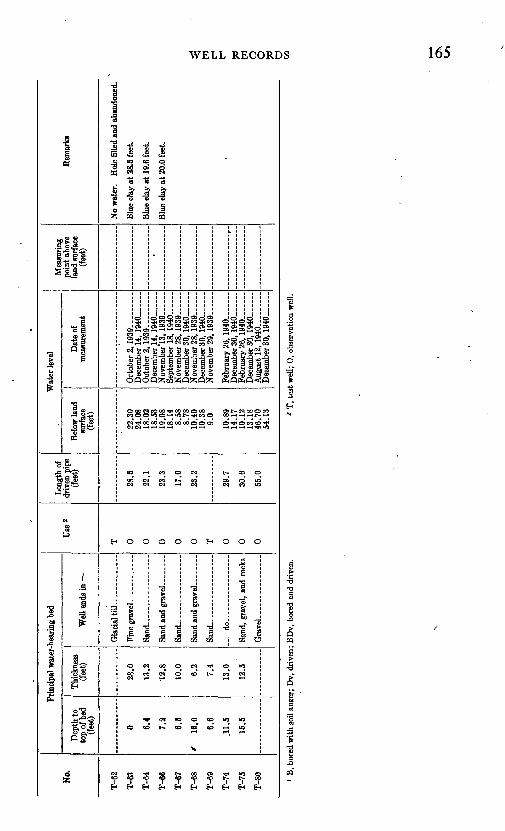
No.
T-6
2
T-6
3
T-6
4
T-6
6
T-6
7
T-6
8
T-6
9
T-7
4
T-7
5
T-8
0
Prin
cipa
l wat
er-b
eari
ng b
ed
Dep
th to
to
p of
bed
(f
eet)
0 6.4
7.2
6.5
' 18
.0
6.6
.11.
5
15.5
Thic
knes
s (f
eet)
28.0
13.2
12.8
10.0
6.2
7.4
13.0
12.5
'
Wel
l end
s in
Gla
cial
til
l... ..
.
San
d... - -
Sand.. .
....
....
....
..-d
o.
Sand
, gr
avel
, an
d ro
cks _
Use
«
T
0
0
0
0
0
T
0
0
0
Len
gth
of
driv
en p
ipe
(fee
t)
28.5
22.1
23.3
17.0
23.2
29.7
30.6
55.0
Wat
er le
vel
Bel
ow la
nd
surf
ace
(fee
t)
22.3
0 24
.08
18.0
2 18
.53
19.0
8 18
.14
8.58
8.
78
10.4
0 10
.38
9.0
10.8
9 14
.17
10.1
2 13
.18
46.7
0 54
.13
Dat
e of
m
easu
rem
ent
Oct
ober
2, 1939.........
Oct
ober
2,
1939
. . .......
Dec
embe
r 14
, 194
0 __
_ .
Nov
embe
r'13,
193
9 ......
Nov
embe
r 28
, 19
39 ..
....
Nov
embe
r 28
, 19
39 ..
....
Dec
embe
r 30,
194
0.. _
-N
ovem
ber
29,
1939
......
Febr
uary
26,
194
0.. _
..
Dec
embe
r 30
, 194
0 _.....
Aug
ust
12, 1940.........
Dec
embe
r 30
, 194
0 __ ..
Mea
suri
ng
poin
t abo
ve
land
sur
face
(f
eet)
T
Rem
arks
No
wat
er.
Hol
e fil
led
and
aban
done
d.
Blu
e cl
ay a
t 28.
5 fe
et.
Blu
e cl
ay a
t 19
.6 f
eet.
Blu
e cl
ay a
t 20
.0 f
eet.
1 B
, bor
ed w
ith s
oil a
uger
; D
v, d
rive
n; B
Dv,
bor
ed a
nd d
rive
n.1
T,
test
wel
l; 0,
obs
erva
tion
wel
l.
ON
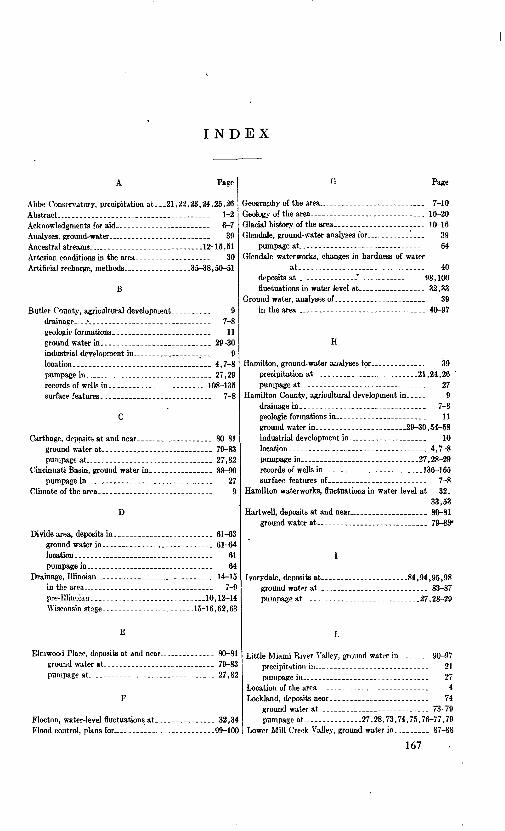
INDEX
Abbe Conservatory, precipitation at.. .21,22,23,24,25,26 Abstract. --.-.....-.--------__...---.--.- 1-2Acknowledgments for aid---.------.--.---------- 6-7Analyses, ground-water --.. -.. 39 Ancestral streams._------- . .12-15,51Artesian conditions in the area-------.--...-....- 30Artificial recharge, methods_----.---------35-38,50-51
B
B utler County, agricultural development ---------- 9drainage_.1. . . . 7-8geologic formations.. ---------- .-..-- 11ground water in...-._______.-.___ 29-30industrial development in_.....-...--..._.. 9location-____________________ 4,7-8 pumpage in__. ..___ ......._. 27,29records of wells in..___-.________108-135 surface features.-.-. 7-8
Carthage, deposits at and near____..._____ 80-81 ground water at___________.___._ 79-83 pumpage at..-.__-___---_._____ 27,82
Cincinnati Basin, ground water in.___ _ _____. 88-90 pumpage in....,--...--_--.....---.-..... 27
Climate of the area...------
D
Divide area, deposits in..----.--.----.--------.. 61-63ground water in-...--...-------..---------. 61-64location.__------- -...__ ..-. 61pumpage in _. __ 64
Drainage, Illinoian_---.-----_---..----------. 14-15in the area ----- - -.._ 7-9pre-Illinoian.____.....................10,12-14Wisconsin stage-___._.__..------15-16,62,63
E
Elmwood Place, deposits at and near......---.-..- 80-81ground water at-------.---.--..._____ _ ____ 79-8;pumpage at ------------------------------ 27,82
Flocton, water-level fluctuations at --------------- 32,34Flood control, plans for.....__._.______99-100
G Page
Geography of the area . -----------_. 7-10Geology of the area .. .. .. _. 10-20 Glacial history of the area .. 10-16
lendale, ground-water analyses for ......1_ 39pumpage at -- . - 64
ilendale waterworks, changes in hardness of waterat--------.--------.-.---------. 40
deposits at.._______.*__________98,100 fluctuations in water level at..._ _ 32,33
Ground water, analyses of . ... 39 in the area_------------------------------ 40-97
H
Hamilton, ground-water analyses for ...____ 39 precipitation at- . _21,24,26pumpage at . - ... 27
Hamilton County, agricultural development in..... 9drainage in.----.----.--.------------------ 7-8geologic formations in.. 11ground water in. ____________29-30,54-58 industrial development in ..... 10location.---. - -.-.. __ 4,7-8 pumpage in_______._________27,28-29 records of wells in. ____________ _136-165 surface features of _......_ . 7-8
Hamilton waterworks, fluctuations in water level at 32,33,53
Hartwell, deposits at and near.. _ _ __ 80-81 ground water at-. .............__ 79-89"
I
Ivorydale, deposits at__._________84,94,95,98 ground water at_- -- __. - . .___. 83-87 pumpage at..--.. .__...... ...._.27,28-29
Little Miami River Valley, ground water in .... 90-97precipitation in_-------------------------- 21pumpage in ----------------- .. 27
Location of the area.... ... .... ... 4Loekland, deposits near.._... -------- ... 74
ground water at....___.__ ...... 73-79pumpage at--.-..--------.27,28,73,74,75,76-77,79
Lower Mill Creek Valley, ground water in. ..... 87-88
167
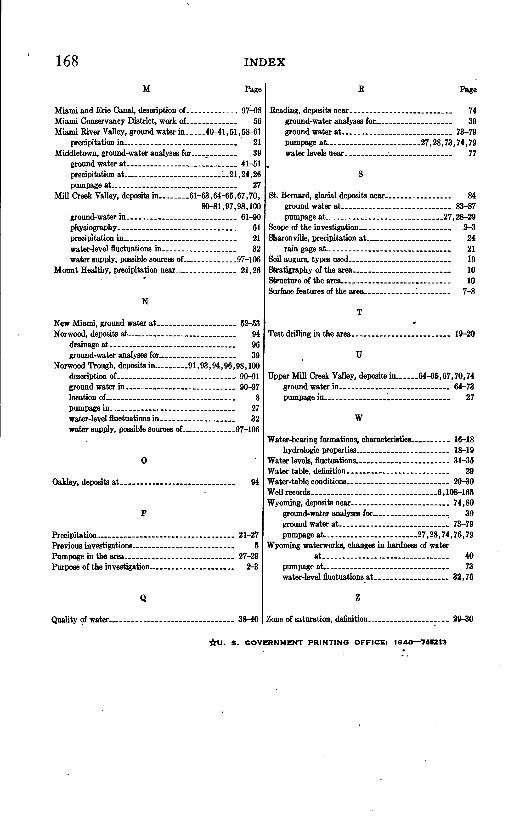
168 INDEX
M
Miami and Brie Canal, description of- __ 97-98Miami Conservancy District, work of. ______ 56Miami River Valley, ground water in 40-41,51,58-61
precipitation in.., 21Middletown, ground-water analyses for . ... 39
ground water at _______ 41-51precipitation at______________1.21,24,26pumpage at. , 27
Mill Creek Valley, deposits in... ..61-63,64-65,67,70,80-81,97,98,100
ground-water in ______ 61-90 physiography- 61 precipitation in 21 water-level fluctuations in . 32 water supply, possible sources of ...__97-106
Mount Healthy, precipitation near.________ 21,26
N
New Miami, ground water at _.____ 52-53 Norwood, deposits at 94
drainage at . 96 ground-water analyses for ... 39
Norwood Trough, deposits in.. 91,93,94,96,98,100 description of _, 90-91 ground water in .. _ 90-97 location of ..__ 8 pumpage in .__.____ 27 water-level fluctuations in__.________ 32 water supply, possible sources of .97-106
Oakley, deposits at. 94
Precipitation 21-27 Previous investigations. 5 Pumpage in the area 27-29 Purpose of the investigation 2-3
Quality of water . 38-40
R
Reading, deposits near ____ 74 ground-water analyses for___________ 39 ground water at._______________ 73-79 pumpage at 27,28,73,74,79 water levels near. _ ..__._ 77
St. Bernard, glacial deposits near.___ _____ 84 ground water at 83-87 pumpage at__________________27,28-29
Scope of the investigation ......__..._ 2-3Sharonville, precipitation at._
rain gage at.. Soil augurs, types used Stratigraphy of the area. Structure of the area.._.....
__._.... 24..._____ 21. ... 19.__..__ 10-.-..-...... 10
Surface features of the area. . 7-8
Test drilling in the area______________ 19-20
U
Upper Mill Creek Valley, deposits in___64-65,67,70,74 ground water in 64-73 pumpage in 1 27
W
Water-bearing formations, characteristics.- 16-18 hydrotogic properties.. ... . _ .. 18-19
Water levels, fluctuations.. . .. 31-35 Water table, definition . 29 Water-table conditions- 29-30 WeU records....____ _-____6,108-165Wyoming, deposits near. . 74,80
ground-water analyses for ........__. 39ground water at 73-79 pumpage at. 27,28,74,76,79
Wyoming waterworks, changes in hardness of waterat..___._..._____.___ 40
pumpage at . . 73 water-level fluctuations at. . ..... 32,76
Zone of saturation, definition 29-30
&U. S. GOVERNMENT PRINTING OFFICE: 1948 745213