Embed Size (px)
Citation preview

December 12, 2014
Logan Anderson
Kellie Heiden
Madelaina Martin (PM)
Tia Scarpelli
Adam Tuff
Water Supply Systems for Nidori, Panama

Water Supply Systems for Nidori, Panama Submitted to: Dr. David Watkins Mr. Mike Drewyor Peace Corps, Panama: Colleen Hickey Nidori Community
Submitted by: Bolen Consulting Logan Anderson
Kellie Heiden Madelaina Martin (PM) Tia Scarpelli Adam Tuff
Mission Statement Bolen Consulting is focused on engineering sustainable solutions that provide quality drinking water to those in need throughout the world. Project Remarks Bolen Consulting consists of a student team in the International Senior Design Program at Michigan Technological University. The following report discusses Bolen Consulting’s field work in La Ensenada and Nidori, Panama, in the summer of 2014, and the water supply projects that were designed based on collected field data during the following fall semester. The report includes design plans for two water supply systems, project materials and costs, and system construction and maintenance instructions. Acknowledgements Bolen Consulting would like to thank Colleen Hickey for hosting the team while in Panama. The project design could not have been completed without the information and assistance provided by Colleen. The team would also like to acknowledge the Nidori community for providing assistance to the team while collecting field data in Panama. Michigan Technological University faculty Dr. Dave Watkins, PE, and Mike Drewyor, PE, also provided valuable professional and technical guidance throughout the project. Disclaimer This report, titled “Water Distribution Systems for Nidori, Panama,” represents the efforts of undergraduate students in the Civil and Environmental Engineering Department of Michigan Technological University. While the students worked under the supervision and guidance of associated faculty members, the contents of this report should not be considered professional engineering. BY: _________________________________________ _____________________________________ Madelaina Martin (Project Manager) Logan Anderson _________________________________________ _____________________________________ Kellie Heiden Tia Scarpelli _________________________________________ Adam Tuff
Bolen Consulting i Final Report

Table of Contents
Executive Summary .................................................................................................................... v
1.0 Introduction ..................................................................................................................... 1
2.0 Project Background ......................................................................................................... 3 2.1 La Ensenada and Nidori .............................................................................................. 3
2.2 System Maintenance and Feasibility ............................................................................ 4
3.0 Analysis Methodology & Criteria ...................................................................................... 5 3.1 Methodology ................................................................................................................ 5
3.2 Constraints & Criteria ................................................................................................... 7
4.0 Technical Design ............................................................................................................. 8 4.1 Quebrada System ........................................................................................................ 9
4.1.1 Distribution Line .................................................................................................... 9
4.1.2 EPANET Analysis ................................................................................................11
4.1.3 Air Release & Cleanout Valves ............................................................................12
4.1.4 Concrete Dam ......................................................................................................13
4.1.5 Water Treatment ..................................................................................................14
4.2 Pozo System ...............................................................................................................15
4.2.1 Aqueduct .............................................................................................................15
4.2.2 EPANET Analysis ................................................................................................15
4.2.3 Spring Box and Tank Design ...............................................................................17
4.2.4 Water Treatment ..................................................................................................20
4.3 Materials .....................................................................................................................20
5.0 Cost Estimate .................................................................................................................20
6.0 Construction Schedule ...................................................................................................21
7.0 Conclusions & Recommendations ..................................................................................23
8.0 References .....................................................................................................................24
Appendices ............................................................................................................................. A-1 Appendix A: Field Data ........................................................................................................ A-2
Appendix B: Water Capacity and Usage Calculations .......................................................... A-3
Appendix C: Materials List ................................................................................................... A-4
Appendix D: Online Resources ............................................................................................... 5
Appendix E: EPANET Inputs and Results ............................................................................ A-6
Appendix F: Water Quality Data .......................................................................................... A-7
Appendix G: Air Block Analysis............................................................................................ A-8
Bolen Consulting ii Final Report
Appendix H: Cost Estimate .................................................................................................. A-9
Appendix I: Construction Schedule .................................................................................... A-10
Appendix J: Engineering Drawings & System Design Maps .............................................. A-11
Appendix K: Construction Manual ...................................................................................... A-12
Appendix L: Maintenance Manual ...................................................................................... A-13
Bolen Consulting iii Final Report

List of Figures Figure 1 Google Earth aerial view of La Ensenada (Casa de nosotros) and Nidori (Pozo/Quebrada) communities. ................................................................................................................................................. 2 Figure 2 Map of Panama with the Kusapín Peninsula indicated by the box ................................................. 4 Figure 3. Google Maps view of proposed systems with paved path shown. The beach (Caribbean Sea) is shown to the upper right corner. The five houses fed by the Quebrada system (H1-H5) and the proposed distribution lines also pictured. ..................................................................................................................... 9 Figure 4. Proposed Quebrada distribution line ........................................................................................... 10 Figure 5. Elevation profile for the Quebrada site with source shown at horizontal distance of 0 ft. .......... 11 Figure 6. Total flow demand from the Quebrada System ........................................................................... 12 Figure 7. Cleanout design with shut-off valve and capped wye joint ......................................................... 13 Figure 8. Concrete dam design for Quebrada stream .................................................................................. 13 Figure 9. The Quebrada system dam will be constructed in place of the current temporary dam put together by the community members (indicated by red arrow) .................................................................. 14 Figure 10. Proposed Pozo aqueduct (original survey shown as dashed line) ............................................. 15 Figure 11. Elevation profile for the Pozo system with the source at a horizontal distance of 0 ft. The elevations of two houses with a current distribution line from the Pozo spring source are also shown. .... 16 Figure 12. Water level in Pozo tank ............................................................................................................ 17 Figure 13. Spring box design side view with gravel entrance and main chamber shown........................... 18 Figure 14. Concrete tank design for Pozo system with piping components shown (far left component is the overflow and far right component is the inlet) ...................................................................................... 19 Figure 15. GPS route of survey for Quebrada source ................................................................. Appendix A Figure 16. GPS route of survey for Pozo source ......................................................................... Appendix A Figure 17. Shape outline of Quebrada pool ................................................................................. Appendix B Figure 18. Cross-section of stream exiting Pozo source .............................................................. Appendix B Figure 19. EPANET Quebrada demand pattern ........................................................................... Appendix E Figure 20. EPANET Pozo demand pattern .................................................................................. Appendix E Figure 21. EPANET Quebrada system model ............................................................................. Appendix E Figure 22. EPANET Pozo system model ..................................................................................... Appendix E Figure 23. EPANET Quebrada pressure overnight ...................................................................... Appendix E Figure 24. EPANET Quebrada pressure during peak demand .................................................... Appendix E Figure 25. Quebrada source water quality test ............................................................................. Appendix F Figure 26. Pozo source water quality test .................................................................................... Appendix F List of Tables Table 1. Average count of E. coli colonies per Petri-Film plate at each source ........................................... 6 Table 2. Cost estimate for each water system. ............................................................................................ 21 Table 3. Quebrada System Roll-up Schedule ............................................................................................. 21 Table 4. Pozo System Roll-up Schedule ..................................................................................................... 22 Table 5. Quebrada source inlet flow rates .................................................................................... Appendix B Table 6. Quebrada source outlet flow rates .................................................................................. Appendix B Table 7. Pozo source leaf travel time ........................................................................................... Appendix B Table 8. Nidori community water usage ...................................................................................... Appendix B Table 9. Water quality test results summary ................................................................................ Appendix F
Bolen Consulting iv Final Report

Executive Summary
The Bolen Consulting team has designed two small water systems for the Nidori community based on surveying and community field data collected while visiting Panama in August 2014. The Quebrada system project consists of a dam that collects water from a stream and funnels it into a piping system. The pipe network then distributes water to five houses, currently without water access in the home. The water source for this system is a stream flowing from a spring source that is currently undeveloped. The Quebrada system design also includes a water treatment plan for in-home chlorination. The project design includes the construction of an air release valve at a high point along the distribution line and two washout pipes at low points in the distribution line to allow sediment removal. The second project designed by the team, referred to as the Pozo system, consists of a spring box and concrete tank, connected by an aqueduct. This system is designed to improve access to potable water for twelve houses that currently only have access to water in the home on a seasonal basis. The concrete tank is sized to hold the daily water consumed by these twelve houses, and modeling of the system has shown that the tank will remain full throughout the day. The water source for the Pozo system is a spring that currently has a rock dam pooling water at its base. The water pooled at the base of the Pozo spring is also used for laundry, so the spring box was designed to allow overflow that will fill and maintain the laundry site. The elevation changes for the Quebrada and Pozo systems are minimal and prevent any pressure concerns in the piping systems. Cost estimates and construction plans have been developed and included with these design plans to minimize the difficulties of project implementation. A list of materials needed for construction and an estimated schedule for implementation are also included. The cost, construction and maintenance required have been considered in the context of rural Panama. These systems have been designed to increase access to improved water for the Nidori community by improving source protection at the Pozo system and water supply accessibility for the Quebrada system.
Bolen Consulting v Final Report

1.0 Introduction
The technological advancement of modern society is far-reaching, but there are still many people in the world today unserved by these innovations. These communities often go unnoticed, and to the people living in these rural communities, it is clear that technological advancement is not universal. According to the World Bank, as of 2012, only 81.6% of the world’s rural population had access to an improved water source, which includes all public taps, wells, and piped water to privately owned premises (The World Bank, 2014). Panama is one country where much of the population is without access to clean water. Organizations including Panama’s Ministry of Health, the U.S. Peace Corps, and recently Michigan Technological University through its International Senior Design Program have increased technical support in rural communities. The goal of these support projects is to increase access to clean water. Through the International Senior Design Program, student teams travel to various rural communities throughout Panama to work with a current Peace Corps Volunteer (PCV) to develop an engineering solution based on current community needs. This year, one student team traveled to the La Ensenada and Nidori communities in the Bocas del Toro province to improve the Nidori community’s water systems and general access to potable water. Members of the Nidori community currently rely on two water sources to supply 19 households with water. Families living in 12 of the homes rely on a spring, or toma in Spanish, and have a gravity-fed distribution line to supply water to their homes. The second source is a low-lying spring source, or pozo. The pozo is currently utilized year round by the remaining 7 homes in Nidori. A privately constructed distribution line runs from the pozo to 2 of the 7 houses. The remaining 5 homes have no in-home water access and must fill 5-gallon buckets, or kubos, and carry them back to their houses several times per day. These various water sources can be seen in Figure 1 on the following page. The pozo is also dammed to create a pool where women can do laundry. This area is an important social center for the women of the community, and its preservation was a key concern for community members.
Bolen Consulting 1 Final Report
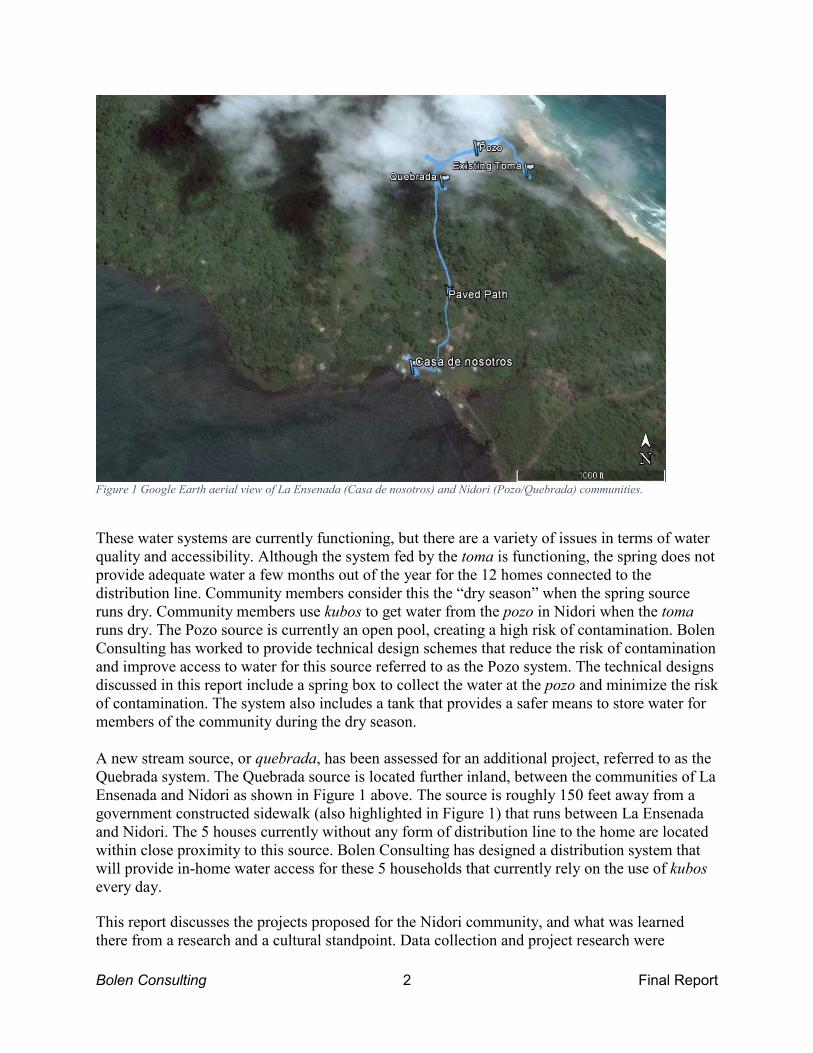
Figure 1 Google Earth aerial view of La Ensenada (Casa de nosotros) and Nidori (Pozo/Quebrada) communities.
These water systems are currently functioning, but there are a variety of issues in terms of water quality and accessibility. Although the system fed by the toma is functioning, the spring does not provide adequate water a few months out of the year for the 12 homes connected to the distribution line. Community members consider this the “dry season” when the spring source runs dry. Community members use kubos to get water from the pozo in Nidori when the toma runs dry. The Pozo source is currently an open pool, creating a high risk of contamination. Bolen Consulting has worked to provide technical design schemes that reduce the risk of contamination and improve access to water for this source referred to as the Pozo system. The technical designs discussed in this report include a spring box to collect the water at the pozo and minimize the risk of contamination. The system also includes a tank that provides a safer means to store water for members of the community during the dry season. A new stream source, or quebrada, has been assessed for an additional project, referred to as the Quebrada system. The Quebrada source is located further inland, between the communities of La Ensenada and Nidori as shown in Figure 1 above. The source is roughly 150 feet away from a government constructed sidewalk (also highlighted in Figure 1) that runs between La Ensenada and Nidori. The 5 houses currently without any form of distribution line to the home are located within close proximity to this source. Bolen Consulting has designed a distribution system that will provide in-home water access for these 5 households that currently rely on the use of kubos every day. This report discusses the projects proposed for the Nidori community, and what was learned there from a research and a cultural standpoint. Data collection and project research were
Bolen Consulting 2 Final Report

conducted both in Panama and back in the United States to design the Pozo and Quebrada systems. These systems will improve the water quality and accessibility in Nidori. The systems are designed based on resource availability and limitations observed in the community to ensure that the projects will allow the community to have sustainable access to clean, safe drinking water. This report discusses in detail the design process, technical design components, construction, maintenance, feasibility, recommendations, and the impact these projects will have on the community.
2.0 Project Background
2.1 La Ensenada and Nidori The La Ensenada and Nidori communities are located on the Kusapín Peninsula in Bocas del Toro, shown by the box in Figure 2 on the following page. This rural area is currently part of the Ngöbe-Buglé Comarca, which is one of several land reservations set aside by the government for the various indigenous groups of Panama. The peninsula is home to about 400 people, most of whom are part of the Ngöbe indigenous group. The area is divided into multiple small clusters of homes or communities built along the coast of the bay and the Caribbean Sea. These communities are mainly centered around two schools, an elementary school located in La Ensenada and a high school located across the bay in a different part of the community. The Ngöbe people rely on water transportation throughout the community due to the location of the homes and schools, as well as the rough surrounding terrain. Various water systems are utilized in these two communities to provide inhabitants with water because of the dispersed locations of homes. Colleen Hickey, a PCV, has been working with the La Ensenada and Nidori communities to help develop and improve water systems throughout the area. The Bolen Consulting team visited this community in August 2014 and collected necessary data to provide Colleen and the community with technical support for water system design improvements in Nidori.
Bolen Consulting 3 Final Report
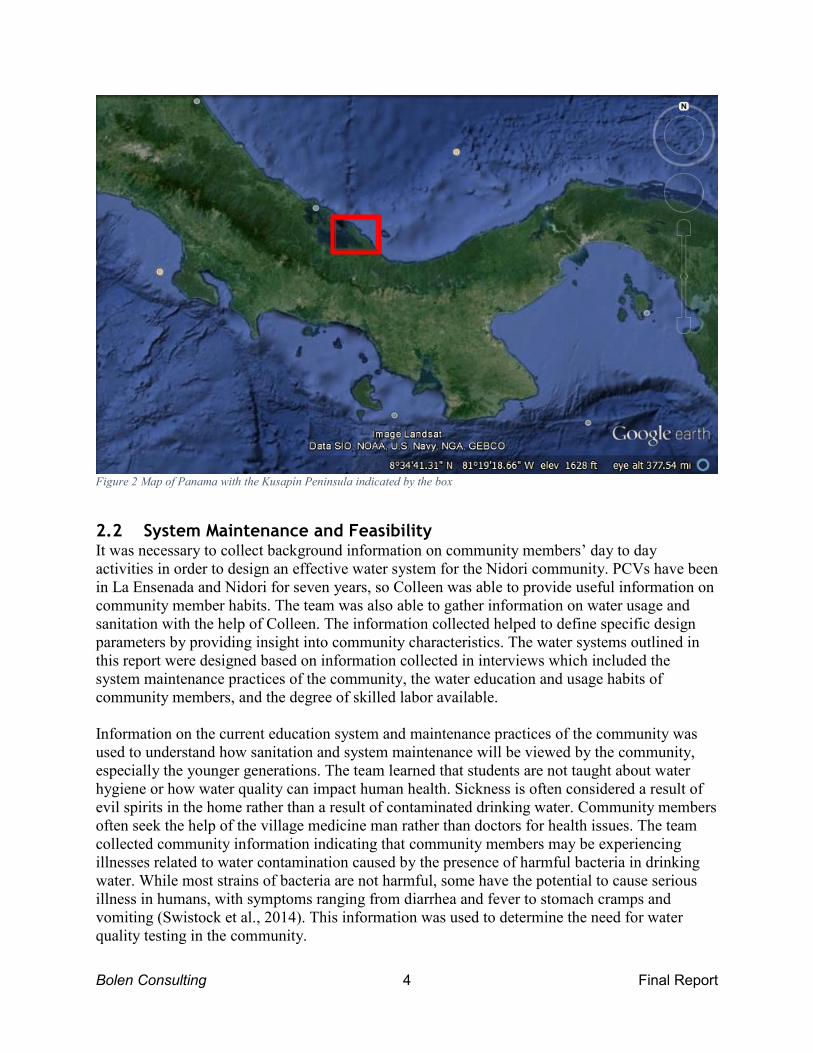
Figure 2 Map of Panama with the Kusapín Peninsula indicated by the box
2.2 System Maintenance and Feasibility It was necessary to collect background information on community members’ day to day activities in order to design an effective water system for the Nidori community. PCVs have been in La Ensenada and Nidori for seven years, so Colleen was able to provide useful information on community member habits. The team was also able to gather information on water usage and sanitation with the help of Colleen. The information collected helped to define specific design parameters by providing insight into community characteristics. The water systems outlined in this report were designed based on information collected in interviews which included the system maintenance practices of the community, the water education and usage habits of community members, and the degree of skilled labor available. Information on the current education system and maintenance practices of the community was used to understand how sanitation and system maintenance will be viewed by the community, especially the younger generations. The team learned that students are not taught about water hygiene or how water quality can impact human health. Sickness is often considered a result of evil spirits in the home rather than a result of contaminated drinking water. Community members often seek the help of the village medicine man rather than doctors for health issues. The team collected community information indicating that community members may be experiencing illnesses related to water contamination caused by the presence of harmful bacteria in drinking water. While most strains of bacteria are not harmful, some have the potential to cause serious illness in humans, with symptoms ranging from diarrhea and fever to stomach cramps and vomiting (Swistock et al., 2014). This information was used to determine the need for water quality testing in the community.
Bolen Consulting 4 Final Report

The team also witnessed neglect of current water distribution systems, including broken pipes and incomplete projects. Colleen is currently making efforts to educate the community on proper sanitation, so it is possible that awareness of waterborne illnesses will increase in the future. The current lack of recognition of the connection between sanitation and health and the failure to upkeep existing systems were both key constraints recognized by the team in determining design options for the community. The team was able to determine that some technical skill is available in the community in regard to project implementation feasibility. Many men in the community seek out construction jobs in the city and send money home. There is a chief engineer in the village and a water committee, although Colleen identified some problems in the organization of the committee. Interactions with community members showed that there was interest for Peace Corps water usage and sanitation programs. Based on these observations, the team determined that there is skill in the community to build and maintain a distribution system, so with further water, sanitation and hygiene education the project can be implemented successfully.
3.0 Analysis Methodology & Criteria
3.1 Methodology The goal of the assessment trip in August of 2014 was to collect the necessary field data to design a successful gravity-fed water distribution system. Survey data, GPS waypoints, source water flow rates, and water quality data were collected. The team investigated the current water usage in the community to help with designing project capacity. Water in the home is used for cooking, drinking, and hand washing while bathing and laundry are typically done at separate locations from drinking water. Most households in the community rely on wells or spring sources for water. Women in families that are not currently connected to a distribution line or do not have water seasonally must walk to a spring and carry kubos full of water back to the home. Families in the community that carry water use between 2 and 6 gallons of water per person per day. Most houses have between 5 and 15 people living in them. The water usage data collected was used in combination with outside sources, as discussed in the next section, to determine daily water use for the community. Technical data was collected by the team while in Panama to be used during the design process. This data included a survey of a possible distribution route for the Quebrada system and a survey of a route leading to a tank for the Pozo system. The survey data are shown in Appendix A. Data was also collected on flow rates from the two water sources and on water quality, as shown in Appendix B and F, respectively. Data collection is further discussed in the following section. Survey measurements were completed using a Nikon® Forestry Pro, a compass, a GPS, and a 100 foot measuring tape. Starting with the source for both projects, a GPS waypoint was created at every major change in elevation and direction until the end of a proposed pipeline route. At each GPS waypoint, a forward sight was taken to the next waypoint, and a back sight was taken to the previous waypoint. Forward and back sight measurements were taken to increase the
Bolen Consulting 5 Final Report

accuracy of the surveying. The GPS and Nikon® Forestry Pro data were used for horizontal distance mapping of the route. The Nikon® Forestry Pro also provided elevation measurements, while the compass provided bearings. The flow rate at each source was measured to ensure proper system modeling. The volume-time method was used to estimate the flow rate of the Quebrada source. Unlike the Quebrada source, the Pozo source is a spring, so flow from the spring was estimated by measuring flow exiting a pool of water created by an existing dam around the base of the spring. The float method was employed to estimate flow rate for the Pozo source. A more detailed explanation of the methods employed and the full calculations can be found in Appendix B. Testing for coliform is a basic indicator for potentially harmful bacteria. The team tested for indicator organisms to ensure that the proposed water system would not be a source of disease or illness. 3M™ Petrifilm E. coli/Coliform count plates were used as indicators for the quality of the water sources. The procedures created by the manufacturer were followed by the team to obtain accurate results with the minor adjustment of incubating the plates against the body for the specified time period (3MFoodSafety, 2012). Water quality tests were performed at the Quebrada source, the Pozo source, and at a house water tap that is connected to the Pozo source. These test results were then compared to water quality standards recommended by the World Health Organization (WHO). The rating of the drinking water source is dependent upon the concentration of indicator organisms, specifically E. coli colonies. A low risk source can have up to 10 E. coli colonies per 100 mL sample, while a high risk source has at least 100 colonies per 100 mL sample (WHO, 1997). A summary of water quality data collected in Nidori is shown below in Table 1. Table 1. Average count of E. coli colonies per Petri-Film plate at each source
The Quebrada source would be considered high risk drinking water based on standards recommended by WHO. Another test was administered for the Quebrada source on the following day to check the results. This test yielded a lower risk, but it is important to note that a large rain event occurred between collections of the 2 tests which may have resulted in the changes observed. The water quality testing plates for the Pozo source returned coliform bacteria counts that categorized it as low risk drinking water by WHO standards. A second sample was taken from a tap in a home to see if the current distribution system was working properly. The water flowing out of the tap is high risk, indicating contamination in the line. The team surveyed the current distribution system and found a break in the pipe. This allowed run-off from the surrounding area
LocationAverage E. coli
Colony Count per 1 mL Sample
Quebrada Attempt 1 8Quebrada Attempt 2 2Pozo at Source 0Pozo House Tap 10
Bolen Consulting 6 Final Report

to get into the system. The surrounding area had a large number of cows, pigs, and chickens that could contribute to fecal contamination. This break was fixed and it is assumed that without this source of contamination, the piping system will flush out most of the bacteria shown in the test. A complete table of results for each test taken by the team can be found in Appendix F. Due to the presence of indicator bacteria species, the team was forced to consider treatment options for the Quebrada and Pozo source which are discussed in the Technical section of this report. Many different resources were utilized as the team began to complete the final design. Previous Peace Corps or UNICEF volunteer projects were used most prominently for system designs (Reents, 2003; Jordan, 1980). These spring box and distribution system designs were the most applicable for the more technical aspects of the design. The team also obtained information from professors in the Civil and Environmental Engineering Department at Michigan Technological University. The team referred to Peace Corps Volunteer Colleen Hickey to answer any questions regarding details on community behavior, including water use, work day production rates and involvement. A list of questions was given to Colleen for her to answer when the team first arrived in the community. Question topics included meteorology, topography, population, water use, and possible design constraints. Colleen was also there to facilitate interviews with community members to gain a further understanding of how the community members live on a daily basis. The computer aided drawing program AutoCAD® 2014 was used to create the engineering drawings for each aspect of the final design and to model the pipeline routes for each system. The hydraulic analysis program EPANET 2.0 was used to model the gravity-fed water systems with the use of the EPANET 2 User’s Manual (Rossman, 2000). Further details on the calculations and data input process can be seen in the Final Design section of this report. Various design alternatives were created and examined based from the data collected during the assessment trip. The Quebrada system had two different distribution pipeline paths that were analyzed based on constructability and cost. The final option chosen locates the pipeline where it is easier to bury, and the cost difference between the two options is minimal. Two different tank locations were proposed for the Pozo system and were analyzed based on differences in costs and relative closeness to the community. The tank location option that is closest to the community was chosen due to the added pipe cost being negligible relative to the cost of the tank. Rainwater catchment was considered as an alternative to both distribution systems in the unfortunate case that neither system could perform adequately or if sufficient funding could not be found. This alternative was eliminated as an option because over 50% of the homes in the community have thatched roofs, and the cost of replacing the current roofs with ones made of steel would far exceed that of the distribution system.
3.2 Constraints & Criteria The team investigated the current water usage in the community to help with designing project capacity. Water in the home is used for cooking, drinking, and hand washing while bathing and laundry are typically done at separate locations from drinking water. Most households in the community rely on wells or spring sources for water. Women in families that are not currently connected to a distribution line, or do not have water seasonally, must walk to a spring and carry kubos full of water back to the home. Families in the community that carry water use between 2
Bolen Consulting 7 Final Report

and 6 gallons of water per person per day. Most houses have between 5 and 15 people living in them. The water usage data collected was used in combination with outside sources to determine daily water use for the community because it was assumed water usage would increase if piped directly to the home. Outside sources, such as the Panamanian Ministry of Health and WHO, provided adequate information for the team to assume an average water usage rate. These were 50 liters per person per day for the Quebrada system and 30 liters per person per day for the Pozo system. The team believed that the community members using the Pozo system would use less water as they still have to travel and fill kubos when they use the Pozo source. The observations regarding system maintenance made while in the community indicated that a large degree of mechanization or complexity would not be ideal for the Nidori community, as discussed previously. Water treatment options were limited based on the degree of maintenance required and the commitment and organization of community members. Design materials were limited based on equipment available and the prior work experience of the community. The availability of funding was also a major constraint in the design process. Most funding programs grant money to gravity-fed water distribution systems that utilize a spring source. The Quebrada system design collects water through the diversion of a stream, making it a project that would have to be completely funded by the community members.
4.0 Technical Design
The major design components of the Quebrada system are a concrete dam and a pipe distribution system that carries water to 5 houses. The minor components include an air release valve and two washout pipes to remove sediment. The major design components of the Pozo system include a concrete tank for water storage and a spring box. These two components are connected by a distribution line. Figure 3 on the following page provides a basic map of the two systems and their locations relative to each other. (A link to the Google Map of this system is included in Appendix D.)
Bolen Consulting 8 Final Report
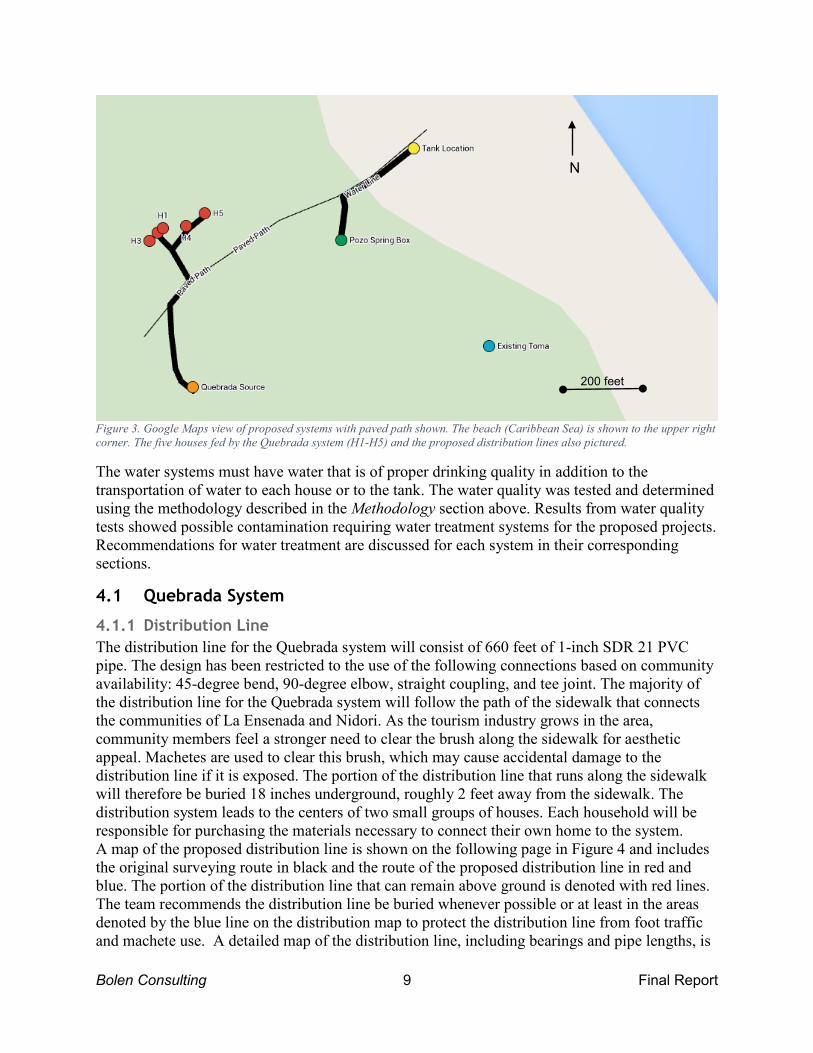
Figure 3. Google Maps view of proposed systems with paved path shown. The beach (Caribbean Sea) is shown to the upper right corner. The five houses fed by the Quebrada system (H1-H5) and the proposed distribution lines also pictured.
The water systems must have water that is of proper drinking quality in addition to the transportation of water to each house or to the tank. The water quality was tested and determined using the methodology described in the Methodology section above. Results from water quality tests showed possible contamination requiring water treatment systems for the proposed projects. Recommendations for water treatment are discussed for each system in their corresponding sections.
4.1 Quebrada System
4.1.1 Distribution Line The distribution line for the Quebrada system will consist of 660 feet of 1-inch SDR 21 PVC pipe. The design has been restricted to the use of the following connections based on community availability: 45-degree bend, 90-degree elbow, straight coupling, and tee joint. The majority of the distribution line for the Quebrada system will follow the path of the sidewalk that connects the communities of La Ensenada and Nidori. As the tourism industry grows in the area, community members feel a stronger need to clear the brush along the sidewalk for aesthetic appeal. Machetes are used to clear this brush, which may cause accidental damage to the distribution line if it is exposed. The portion of the distribution line that runs along the sidewalk will therefore be buried 18 inches underground, roughly 2 feet away from the sidewalk. The distribution system leads to the centers of two small groups of houses. Each household will be responsible for purchasing the materials necessary to connect their own home to the system. A map of the proposed distribution line is shown on the following page in Figure 4 and includes the original surveying route in black and the route of the proposed distribution line in red and blue. The portion of the distribution line that can remain above ground is denoted with red lines. The team recommends the distribution line be buried whenever possible or at least in the areas denoted by the blue line on the distribution map to protect the distribution line from foot traffic and machete use. A detailed map of the distribution line, including bearings and pipe lengths, is
N
200 feet
Bolen Consulting 9 Final Report

included in Appendix J. An alternative route was chosen at the location marked “TREE” on the map and is denoted with a dashed line. This alternative route was chosen because the extensive root system of the tree blocks the path along the sidewalk. In addition, the pathway immediately after the tree becomes muddy and uneven, leading to potential issues with erosion around the pipe.
Figure 4. Proposed Quebrada distribution line
Bolen Consulting 10 Final Report
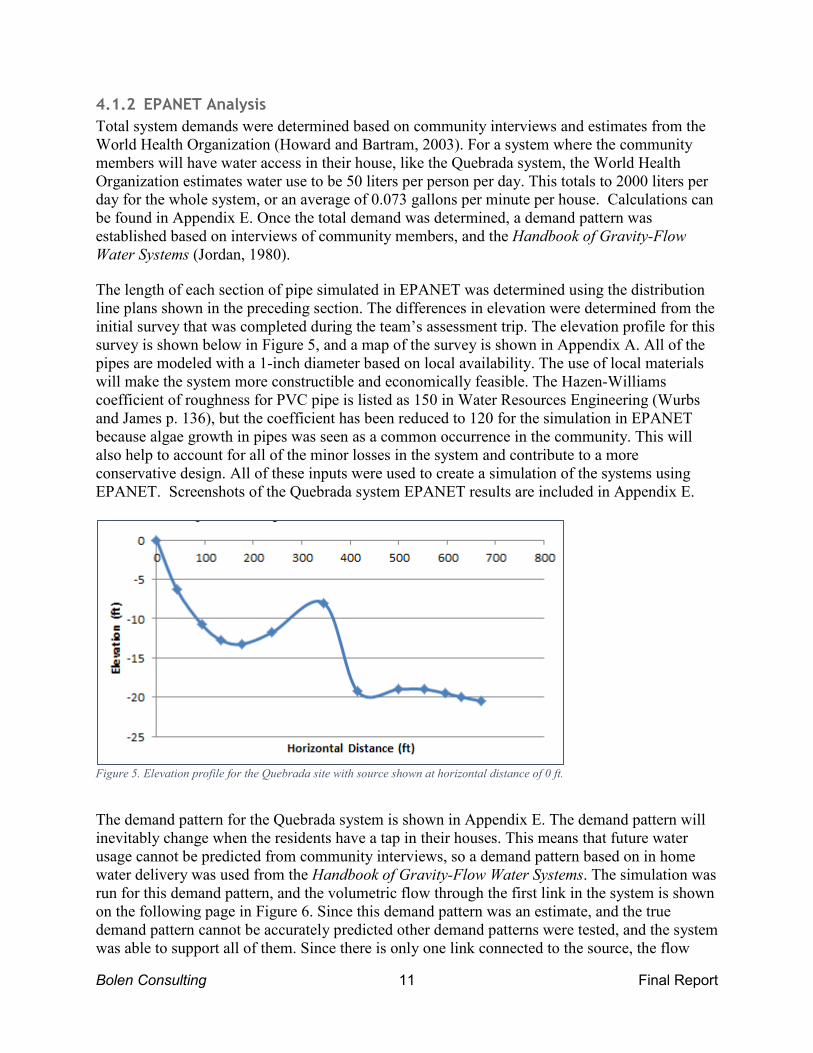
4.1.2 EPANET Analysis Total system demands were determined based on community interviews and estimates from the World Health Organization (Howard and Bartram, 2003). For a system where the community members will have water access in their house, like the Quebrada system, the World Health Organization estimates water use to be 50 liters per person per day. This totals to 2000 liters per day for the whole system, or an average of 0.073 gallons per minute per house. Calculations can be found in Appendix E. Once the total demand was determined, a demand pattern was established based on interviews of community members, and the Handbook of Gravity-Flow Water Systems (Jordan, 1980). The length of each section of pipe simulated in EPANET was determined using the distribution line plans shown in the preceding section. The differences in elevation were determined from the initial survey that was completed during the team’s assessment trip. The elevation profile for this survey is shown below in Figure 5, and a map of the survey is shown in Appendix A. All of the pipes are modeled with a 1-inch diameter based on local availability. The use of local materials will make the system more constructible and economically feasible. The Hazen-Williams coefficient of roughness for PVC pipe is listed as 150 in Water Resources Engineering (Wurbs and James p. 136), but the coefficient has been reduced to 120 for the simulation in EPANET because algae growth in pipes was seen as a common occurrence in the community. This will also help to account for all of the minor losses in the system and contribute to a more conservative design. All of these inputs were used to create a simulation of the systems using EPANET. Screenshots of the Quebrada system EPANET results are included in Appendix E.
Figure 5. Elevation profile for the Quebrada site with source shown at horizontal distance of 0 ft.
The demand pattern for the Quebrada system is shown in Appendix E. The demand pattern will inevitably change when the residents have a tap in their houses. This means that future water usage cannot be predicted from community interviews, so a demand pattern based on in home water delivery was used from the Handbook of Gravity-Flow Water Systems. The simulation was run for this demand pattern, and the volumetric flow through the first link in the system is shown on the following page in Figure 6. Since this demand pattern was an estimate, and the true demand pattern cannot be accurately predicted other demand patterns were tested, and the system was able to support all of them. Since there is only one link connected to the source, the flow
Bolen Consulting 11 Final Report
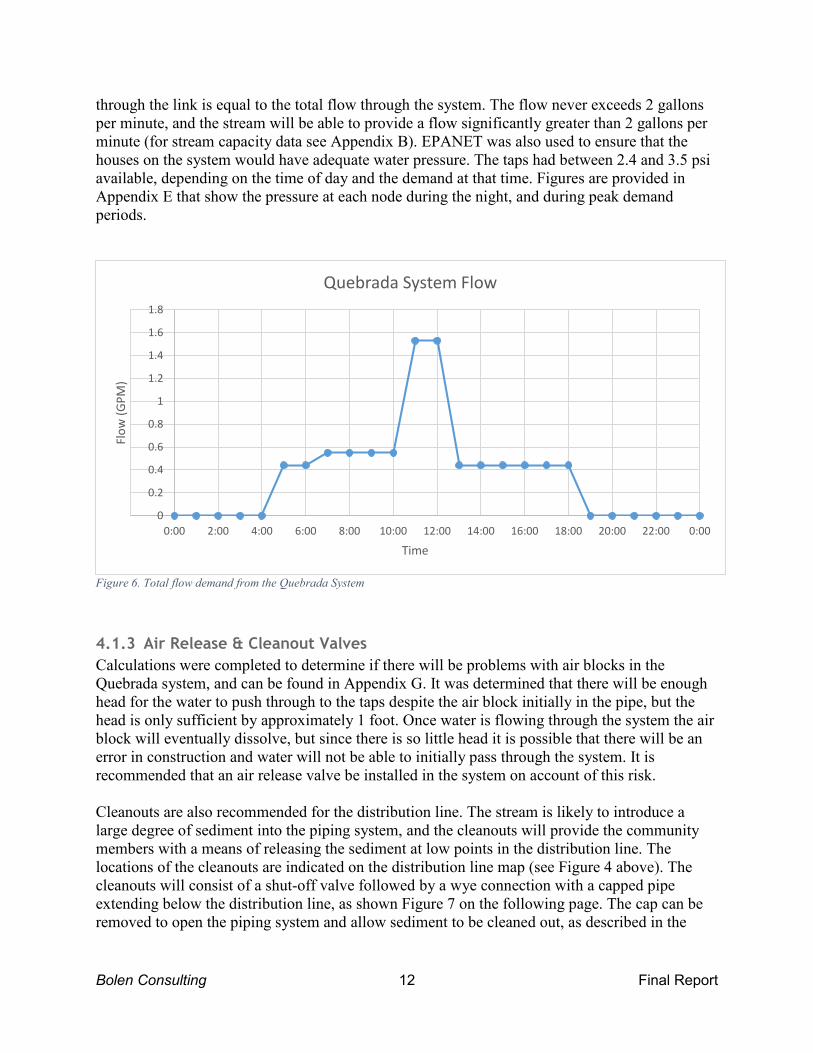
through the link is equal to the total flow through the system. The flow never exceeds 2 gallons per minute, and the stream will be able to provide a flow significantly greater than 2 gallons per minute (for stream capacity data see Appendix B). EPANET was also used to ensure that the houses on the system would have adequate water pressure. The taps had between 2.4 and 3.5 psi available, depending on the time of day and the demand at that time. Figures are provided in Appendix E that show the pressure at each node during the night, and during peak demand periods.
Figure 6. Total flow demand from the Quebrada System
4.1.3 Air Release & Cleanout Valves Calculations were completed to determine if there will be problems with air blocks in the Quebrada system, and can be found in Appendix G. It was determined that there will be enough head for the water to push through to the taps despite the air block initially in the pipe, but the head is only sufficient by approximately 1 foot. Once water is flowing through the system the air block will eventually dissolve, but since there is so little head it is possible that there will be an error in construction and water will not be able to initially pass through the system. It is recommended that an air release valve be installed in the system on account of this risk. Cleanouts are also recommended for the distribution line. The stream is likely to introduce a large degree of sediment into the piping system, and the cleanouts will provide the community members with a means of releasing the sediment at low points in the distribution line. The locations of the cleanouts are indicated on the distribution line map (see Figure 4 above). The cleanouts will consist of a shut-off valve followed by a wye connection with a capped pipe extending below the distribution line, as shown Figure 7 on the following page. The cap can be removed to open the piping system and allow sediment to be cleaned out, as described in the
0
0.2
0.4
0.6
0.8
1
1.2
1.4
1.6
1.8
0:00 2:00 4:00 6:00 8:00 10:00 12:00 14:00 16:00 18:00 20:00 22:00 0:00
Flow
(GPM
)
Time
Quebrada System Flow
Bolen Consulting 12 Final Report

maintenance manual in Appendix L. Each cleanout location corresponds to a low point in the system where the pipe extends across a small ditch, providing easy access for the community.
Figure 7. Cleanout design with shut-off valve and capped wye connection
4.1.4 Concrete Dam A dam was designed for the Quebrada system in order to divert the water from the stream source. A basic spring box design was deemed unnecessary and ineffective due to the nature of the source because it is open to any type of contamination brought in by runoff from the surrounding area. The cast-in-place concrete dam has a T-shape that extends vertically above and below the ground. The two-piece vertical wall shown below depicts this separation. The extended base is level with the ground surface to provide anchorage as shown in Figure 8 below.
Figure 8. Concrete dam design for Quebrada stream
The main wall of the dam will have a thickness of 6 inches and a length of 2.6 feet before branching off at a 60-degree angle for another 1.7 feet. It will extend 2.3 feet above ground level
Bolen Consulting 13 Final Report

and 2 feet into the ground. Type-4 rebar will also be placed in the walls of the dam at 1-foot intervals. At ground level, a base with a thickness of 3.9 inches will extend 1.7 feet towards the source. The complete engineering drawing can be seen in Appendix J. Dimensions for the dam were based on the current area of the source (see Appendix B), allowing for both the pooling and possible overflow of water. The overflow will be used for large rain events as the source provides more water than the system requires on a daily basis. Coarse gravel will be laid around the collection pipe to impede larger solids from entering the system, and a stainless steel mesh will be placed over the pipe opening to help catch finer sediments. The dam will be located where the community has already constructed a makeshift dam of large rocks, which can be seen below in Figure 9, indicated by the red arrow. The construction of the dam will be completed using the materials listed in Appendix C and the steps detailed in Appendix K.
Figure 9. The Quebrada system dam will be constructed in place of the current temporary dam put together by the community members (indicated by red arrow)
4.1.5 Water Treatment The total counts and averages for all water quality tests are shown in Appendix F, along with pictures of an example Petri-film result. Overall, only the Quebrada site showed indication of possible fecal contamination (indicated by the presence of E. coli). The team recognized this site is a mountain stream rather than a spring source and the surrounding area has many animals roaming freely, both factors increasing the likelihood of contamination. The team has proposed treatment options for this site based on the risk indicated by Petri-film results.
Bolen Consulting 14 Final Report

The community members should follow these three steps to adequately clean the water from the Quebrada system:
1. Add 80 drops of regular bleach to 1 full kubo of water (or 16 drops/1 gallon). 2. Mix the water well using a clean instrument. Cap or cover the kubo. 3. Wait 30 minutes before using.
The preceding steps were adapted from those used by the United States Centers for Disease Control (The Centers for Disease Control, 2013).
4.2 Pozo System
4.2.1 Aqueduct The aqueduct for the Pozo system will consist of roughly 340 feet of 1-inch SDR 21 PVC pipe. The aqueduct for this system begins at a spring source and leads to a tank at the center of the Nidori community. The tank location was chosen because of its proximity to the sidewalk, making it easily accessible for all members of the community. Near the beginning of the aqueduct a trench must be dug through a small hill to accommodate the pipe and maintain a downhill grade. This section of pipe has been colored blue on the map of the aqueduct, which is shown below in Figure 10. The entire aqueduct for the Pozo system will be buried to protect from accidental damage by animals grazing in the area. A more detailed map of the aqueduct with bearings and distances can be found in Appendix J.
Figure 10. Proposed Pozo aqueduct (original survey shown as dashed line)
4.2.2 EPANET Analysis A water usage of 30 liters per person per day was estimated for the Pozo system given that community members will still have to walk some distance to get their water. This means a use of
Bolen Consulting 15 Final Report

3600 liters per day, or 0.66 gallons per minute, on average for the whole system. The same pipe sizing and input characteristics outlined in the EPANET Analysis section for the Quebrada system were used for the Pozo system. Calculations and EPANET results are included in Appendix E. The length of each section of pipe simulated in EPANET was determined using the aqueduct plans shown in the preceding section. The elevation profile created based on the initial field survey performed in Panama is shown below in Figure 11. The elevations of the two service lines that are already in place are included for reference. These two service lines were privately funded and constructed by a community member for himself and his neighbor. The PCV originally wanted to replace the old lines with new lines leading to the houses from the tank, but there is not enough elevation change to bring water from the tank to the homes reliably. The map of the initial survey is also shown in Appendix A. The horizontal pipe lengths and elevation data were used to model the system design in EPANET.
Figure 11. Elevation profile for the Pozo system with the source at a horizontal distance of 0 ft. The elevations of two houses with a current distribution line from the Pozo spring source are also shown.
The demand pattern for the Pozo system is shown in Appendix E. The demand pattern is bimodal. Most community members said they go to get water twice a day, and community members will still have to walk a short distance when the Pozo system is implemented. The simulation was run using this demand pattern, outputting the elevation of water in the tank, which is shown on the following page in Figure 12. The tank is full when the elevation is at 47 feet, the elevation of the base of the tank 42 feet and the height of the tank is 5 feet. The water demand is drastically surpassed by the inflow from the spring, so the tank will stay nearly full at all times. The tank design, discussed in detail in the following section, accounts for possible tank overflow caused by excess water flow from the spring. A valve could be installed on the tank to reduce the overflow rate.
Bolen Consulting 16 Final Report

Figure 12. Water level in Pozo tank
4.2.3 Spring Box and Tank Design A concrete tank and a spring box were designed for the Pozo system. The spring box will be constructed at the Pozo source to protect the water in the spring from surface contamination. The tank will be constructed towards the middle of the Nidori community. The construction of a tank and spring box will serve to provide the community with accessible, potable water when the current distribution system runs dry seasonally. Figure 3, shown previously, provides a rough estimate of the tank location in comparison to the spring box which is located at the Pozo source. There is a spring located at the Pozo site seeping from a vertical rock surface. A gravel filled compartment will be placed at the entrance to the spring box, positioned so that the entrance is flush with the spring source rock face. The spring box will have a flanged concrete entrance that will trap water from the spring and channel it into the spring box. There will be a gravel channel surrounded by concrete at the entrance to the spring box to be used as a filter, preventing large debris from entering the water system. A small PVC pipe will connect the gravel channel to a concrete box reservoir. The side of the PVC pipe penetrating the gravel channel will have open slits and an end cap, allowing water seepage into the pipe. The pipe will be covered by a screen on the side of the reservoir allowing water to enter the open concrete chamber. A detailed design drawing can be seen in Appendix J and a list of materials and construction steps are included in Appendix C and K, respectively. Figure 13, on the following page, provides an idea of the spring box design. Some aspects of the spring box design are based on plans discussed by Nathan Reents in Design of Potable Water Supply Systems in Rural Honduras (Reents, 2003).
42
43
44
45
46
47
48
0:00 2:00 4:00 6:00 8:00 10:00 12:00 14:00 16:00 18:00 20:00 22:00 0:00
Wat
er E
leva
tion
(ft)
Time
Pozo Tank Water Level
Bolen Consulting 17 Final Report
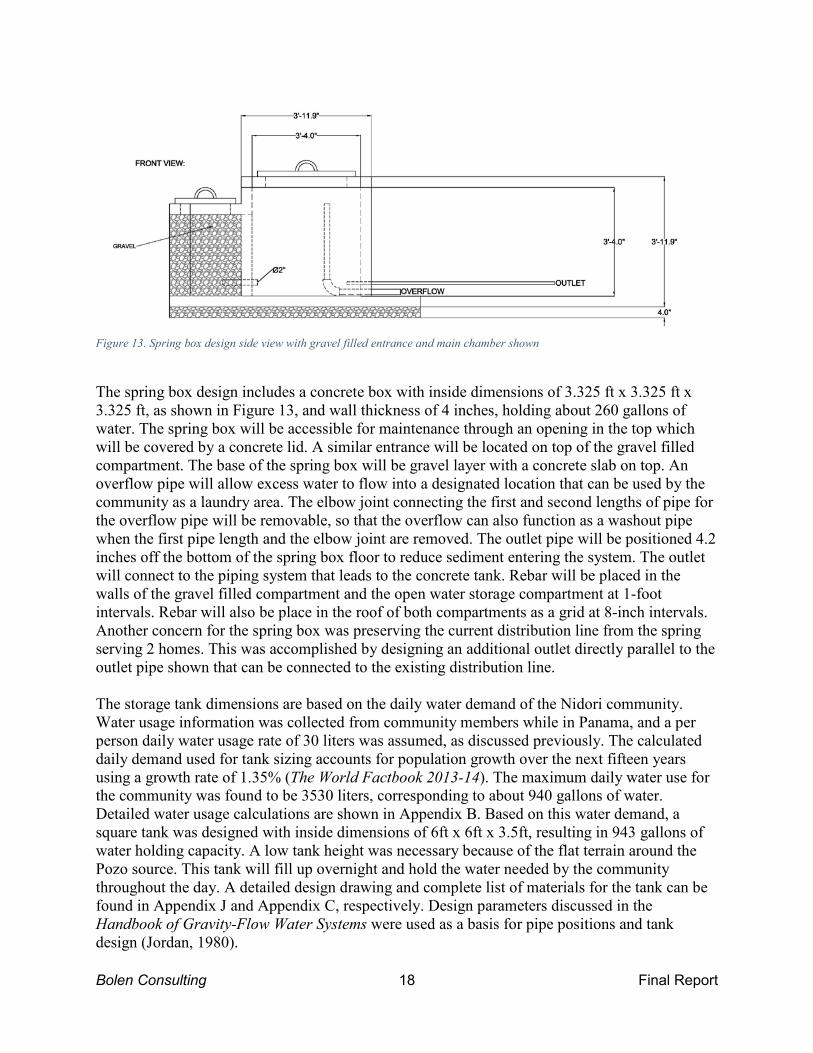
Figure 13. Spring box design side view with gravel filled entrance and main chamber shown
The spring box design includes a concrete box with inside dimensions of 3.325 ft x 3.325 ft x 3.325 ft, as shown in Figure 13, and wall thickness of 4 inches, holding about 260 gallons of water. The spring box will be accessible for maintenance through an opening in the top which will be covered by a concrete lid. A similar entrance will be located on top of the gravel filled compartment. The base of the spring box will be gravel layer with a concrete slab on top. An overflow pipe will allow excess water to flow into a designated location that can be used by the community as a laundry area. The elbow joint connecting the first and second lengths of pipe for the overflow pipe will be removable, so that the overflow can also function as a washout pipe when the first pipe length and the elbow joint are removed. The outlet pipe will be positioned 4.2 inches off the bottom of the spring box floor to reduce sediment entering the system. The outlet will connect to the piping system that leads to the concrete tank. Rebar will be placed in the walls of the gravel filled compartment and the open water storage compartment at 1-foot intervals. Rebar will also be place in the roof of both compartments as a grid at 8-inch intervals. Another concern for the spring box was preserving the current distribution line from the spring serving 2 homes. This was accomplished by designing an additional outlet directly parallel to the outlet pipe shown that can be connected to the existing distribution line. The storage tank dimensions are based on the daily water demand of the Nidori community. Water usage information was collected from community members while in Panama, and a per person daily water usage rate of 30 liters was assumed, as discussed previously. The calculated daily demand used for tank sizing accounts for population growth over the next fifteen years using a growth rate of 1.35% (The World Factbook 2013-14). The maximum daily water use for the community was found to be 3530 liters, corresponding to about 940 gallons of water. Detailed water usage calculations are shown in Appendix B. Based on this water demand, a square tank was designed with inside dimensions of 6ft x 6ft x 3.5ft, resulting in 943 gallons of water holding capacity. A low tank height was necessary because of the flat terrain around the Pozo source. This tank will fill up overnight and hold the water needed by the community throughout the day. A detailed design drawing and complete list of materials for the tank can be found in Appendix J and Appendix C, respectively. Design parameters discussed in the Handbook of Gravity-Flow Water Systems were used as a basis for pipe positions and tank design (Jordan, 1980).
Bolen Consulting 18 Final Report

Water will enter the tank from an aqueduct system. Piping for the tank includes an inlet, outlet, washout pipe, overflow pipe and air vent. The inlet and outlet are 1-inch pipe placed on opposite sides to allow some degree of sedimentation as water enters the tank. The washout pipe is located on the bottom of the tank which is slightly sloped to allow the tank to be emptied for maintenance. The overflow pipe is a 2-inch diameter pipe that exits the tank 3 inches from the top and carries water away from the tank to prevent erosion around the tank base. The outlet from the tank is positioned about 15 inches above the concrete base to allow easy placement of a kubo underneath. Figure 14 shows the placement of the various pipes in and out of the tank.
Figure 14. Concrete tank design for Pozo system with piping components shown (far left component is the overflow and far right component is the inlet)
The tank walls and top will be made out of cast-in-place concrete with steel reinforcement. The base of the tank will have a gravel layer covered by a concrete layer extending past the length of the tank to provide a flat surface for placing buckets on under the outlet. The concrete walls will be 4 inches thick and have rebar at 1-foot intervals. The top of the tank is sloped to provide drainage with a thickness of 7.9 inches at the inlet and 3.6 inches at the outlet. The top will also have a rebar grid with 8 inch intervals. There is also a 2.5 ft x 2.5 ft square opening in the top of the tank to allow access for maintenance which is otherwise covered by a 3 ft x 3 ft square concrete lid. The spring source for the Pozo system provides adequate flow to meet the hourly demand of the community. This means that under the current conditions in the community a tapstand rather than a tank would be an acceptable alternative design. The tank ensures ready flow at all hours of the day as it stores water overnight, and ensures that water will be available if the pipeline requires maintenance. The tapstand does not allow storage, but it is a cost effective alternative if only a portion of the needed funds are available. This alternative would still provide a protected water supply and allow convenient access for filling kubos.
Bolen Consulting 19 Final Report

4.2.4 Water Treatment The Pozo source water tests indicated that it is a low risk source by WHO standard, which normally would not require water treatment (WHO, 1997). However, Bolen Consulting recommends that a water treatment system be used for the Pozo system. Our recommendation is based on the possibility of contamination away from the source. Contamination can come from a variety of origins, including broken pipes, biofilms on buckets and mixing instruments, and bacteria on the hands of the community members (Mellor et al, 2014). Evidence of this can be seen in the results of the water quality tests done on water from a Pozo system home tap (see Appendix F). The water treatment steps prescribed for the Quebrada system should be followed for the Pozo system to ensure the health of the community.
4.3 Materials A final bill of materials was created for both the Quebrada and the Pozo system using the design components described above. The team had to select the correct materials needed to construct the projects. Materials were chosen based on the feasibility to meet the design requirements and be readily available within the region. Additionally, a mix design for the concrete components was developed. The mix consists of a 1:2:3 ratio of cement, sand (fine aggregate), and gravel (coarse aggregate). A water to cement ratio of 0.57 was used to determine the approximate mixing water, assuming a design strength of 4000 pounds per square inch. Overall this mix can be easily proportioned using a 5-gallon bucket, or kubo. Two-thirds of a cubic yard of concrete will require: 4 kubos (2.5 cubic feet) of water, 6 kubos (4.1 cubic feet) of cement, 12 kubos (8.2 cubic feet) of sand, and 18 kubos (12.3 cubic feet) of gravel, assuming that the mix has 0% air and typical compaction of loose materials. Using the material properties and the completed designs, a quantity take off was completed to estimate the amount of each material required to complete the construction of both systems. The final list can be found in Appendix C.
5.0 Cost Estimate
A cost analysis was completed to determine the financial support needed to construct the Quebrada and the Pozo systems. This analysis was completed using the designs described above as well as the final bill of materials for each system. Additionally, the team also identified various small tools such as shovels, machetes, pipe cutters, etc. that would be required in order for the community members to build the system. The cost for each material and tool was found using various sources including regional suppliers, RS Means, and previous Peace Corps reports (Rosenfield; "Geo. F. Novey"; RSMeans). The cost was then applied to the required quantity in order to create an individual total for the line item. An additional mobilization charge was also assigned to cover the cost required to ship items to the community using the various means of transportation. Labor costs were omitted from the cost analysis because all construction labor will be supplied by the members of the community on a volunteer basis. The final summation of all the line items and estimated cost for each system is included in Table 2 on the following page. The complete estimate and line item summary has been included in Appendix H.
Bolen Consulting 20 Final Report

Table 2. Cost estimate for each water system.
Project Component Associated Cost for the Quebrada System
Associated Cost for the Pozo System
Mobilization $356 $267
Clearing $20 $13
Concrete Structures $293 $1,315
Pipeline $309 $167
Total $978 $1,762
6.0 Construction Schedule
A construction schedule was created to outline the required steps and expected time to construct the Quebrada and Pozo systems. Based on the climate of the Nidori community, the team recommends that the project be constructed during the dry season between the months of May and August. The team determined all the necessary steps to receive materials, clear and prepare the sites, construct the concrete structures, set the piping, and open the systems for use. As the steps were outlined, the team also developed a Construction Manual, which has been included in Appendix K. The manual outlines all the intermediate steps and procedures to complete the tasks, which were included in the schedule. A roll-up schedule with the critical tasks has been included in Table 3 below and Table 4 on the following page. After the team identified the required tasks, an assumed production output was used to estimate the required time to complete each task. The schedule was then put into Microsoft Project. Tasks were organized in sequential order, predecessors were selected and the critical path was identified. Based on the critical path, the Quebrada system should take 28 days to complete. This is approximately 940 man-hours, assuming a 5 man crew working 8 hours a day. The Pozo system should take 32 days to finish or approximately 1340 man-hours with a 5 man crew working 8 hours a day. The complete construction schedules can be seen in Appendix I. Table 3. Quebrada System Roll-up Schedule
Major Tasks Duration (days) Mobilization 12 Clearing 1 Dam Construction 13.5 Pipeline Construction 10
Bolen Consulting 21 Final Report

Table 4. Pozo System Roll-up Schedule
Major Tasks Duration (days) Mobilization 12
Clearing 1
Spring Box Construction 15
Pipeline Construction 5
Tank Construction 12.5
Bolen Consulting 22 Final Report

7.0 Conclusions & Recommendations
The projects outlined in this report serve to decrease the amount of people without access to water which can improve the quality of life in Nidori. The report summarized Bolen Consulting’s International Senior Design Project, from the assessment trip in La Ensenada and Nidori to the final design. The design plans and construction and maintenance manuals will be delivered to the Nidori community. The community will be able to begin construction and follow the described schedule to construct the proposed systems, allowing improved access to drinking water. Bolen Consulting recommends that the Quebrada system be constructed to serve the five homes not currently serviced by a water distribution system. This system consists of a dam to direct water from a spring into a distribution line. The distribution line will bring water to 5 household service lines. The system should be constructed as detailed in the plans. Bolen Consulting also recommends that the Pozo system be constructed as detailed in the plans. This system will consist of a concrete spring box and an aqueduct connecting the spring box to a concrete tank which will be fitted with a tap. This system will serve twelve households in the Nidori community which are without water when the spring that feeds their existing distribution system runs dry. The tank will be centrally located in the community, so it is easily accessible by foot. If inadequate funds are available, it would be possible for the community to construct a tap stand rather than a tank at the end of the proposed system, as it would be more economical. Water treatment is recommended for all households receiving water from the Pozo and Quebrada systems. Bolen Consulting recommends the addition of a small quantity of chlorine bleach to disinfect water in the home. The projects discussed in this report were designed to provide long term water supply to the community. Project sustainability can be achieved through system upkeep based on recommendations made in the system maintenance manual (Appendix L). Community involvement is an essential requirement for maintaining system functionality. Further organization of the community’s water committee will increase the likelihood of achieving the stated project goals. The work of Bolen Consulting is completed, and the Nidori community is equipped to improve its standard of living starting with the community’s drinking water. The designs outlined in this report serve to increase access to water and reduce the likelihood of sickness in the community due to unsanitary water. Members of the community will be better able to focus their time and energy on community development rather than personal health issues through implementation of these projects.
Bolen Consulting 23 Final Report
8.0 References
3MFoodSafety. “3M™ Petrifilm™ Plates - Coliform.” Online video clip. YouTube. YouTube, 8 Jun. 2012. Web. 30 Oct. 2014. http://www.youtube.com/watch?v=VVbyoHPcLEM "Geo. F. Novey." Geo. F. Novey. N.p., n.d. Web. 21 Oct. 2014. http://www.novey.com.pa/. (David Supplier) Howard, Guy, and Jamie Bartram. Domestic Water Quantity, Service Level and Health. Who.int. WHO, 2003. Web. 21 Oct. 2014. http://www.who.int/water_sanitation_health/diseases/WSH03.02.pdf?ua=1 Jordan, Thomas D., Jr. Handbook of Gravity-Flow Water Systems. Kathmandu, Nepal: UNICEF, 1980. Print. Mellor, Jonathan E., James A. Smith, Amidou Samie, and Rebecca A. Dillingham. “Coliform Sources and Mechanisms for Regrowth in Household Drinking Water in Limpopo, South Africa.” J Environ Eng (New York) 139.9 (2013): 1152-1161. Print. Reents, Nathan W. “Design of Potable Water Supply Systems in Rural Honduras.” Michigan Technological University. 2003. B5-B9. PDF File. http://www.mtu.edu. Rosenfield, Eric. In Search of Running Water: Carrisal Aqueduct Project Proposal, A Water Systems Technical Assistance Report (WaterSTAR). Rep. N.p.: n.p., n.d. Print. Rossman, Lewis A. EPANET 2 User’s Manual. US Environmental Protection Agency. 2000. PDF File. http://nepis.epa.gov/Adobe/PDF/P1007WWU.pdf RSMeans Building Construction Cost Data 2014. Norwell, MA: RSMeans, 2014. Print. The World Factbook 2013-14. Washington, DC: Central Intelligence Agency. 2013. https://www.cia.gov/library/publications/the-world-factbook/index.html. World Health Organization. Guidelines for Drinking-Water Quality. Who.int.WHO, 1997. Web. 21 Oct. 2014. http://www.who.int/water_sanitation_health/dwq/gdwqvol32ed.pdf. Wurbs, Ralph Allen., and Wesley P. James. Water Resources Engineering. Upper Saddle River, NJ: Prentice Hall, 2002. Print.
Bolen Consulting 24 Final Report

Appendices
Appendix A: Field Data Appendix B: Water Capacity & Usage Appendix C: Materials List Appendix D: Online Resource (Map) Appendix E: EPANET Inputs and Results Appendix F: Water Quality Data Appendix G: Air Block Analysis Appendix H: Cost Estimate Appendix I: Construction Schedule Appendix J: Engineering Drawings & System Design Maps Engineering Drawings
Quebrada System: Quebrada Dam Design I Pozo System: Spring Box Design II Pozo System: Concrete Tank Design III Water System Maps Quebrada System: Distribution Line Map IV Quebrada System: Distribution Line Bearings V Pozo System: Pipeline Map VI Pozo System: Pipeline Bearings VII
Appendix K: Construction Manual Appendix L: Maintenance Manual
Bolen Consulting A-1 Final Report

Appendix A: Field Data See following pages
Bolen Consulting A-2 Final Report
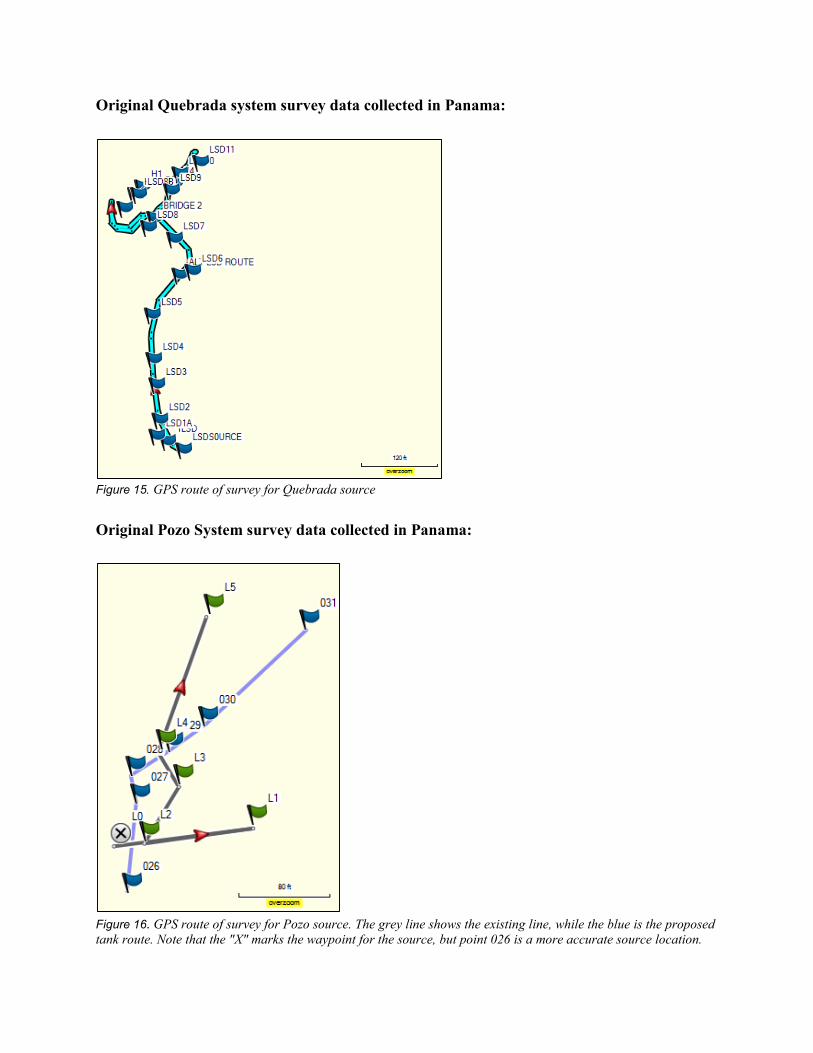
Original Quebrada system survey data collected in Panama:
Figure 15. GPS route of survey for Quebrada source Original Pozo System survey data collected in Panama:
Figure 16. GPS route of survey for Pozo source. The grey line shows the existing line, while the blue is the proposed tank route. Note that the "X" marks the waypoint for the source, but point 026 is a more accurate source location.
Appendix B: Water Capacity and Usage Calculations See following pages
Bolen Consulting A-3 Final Report
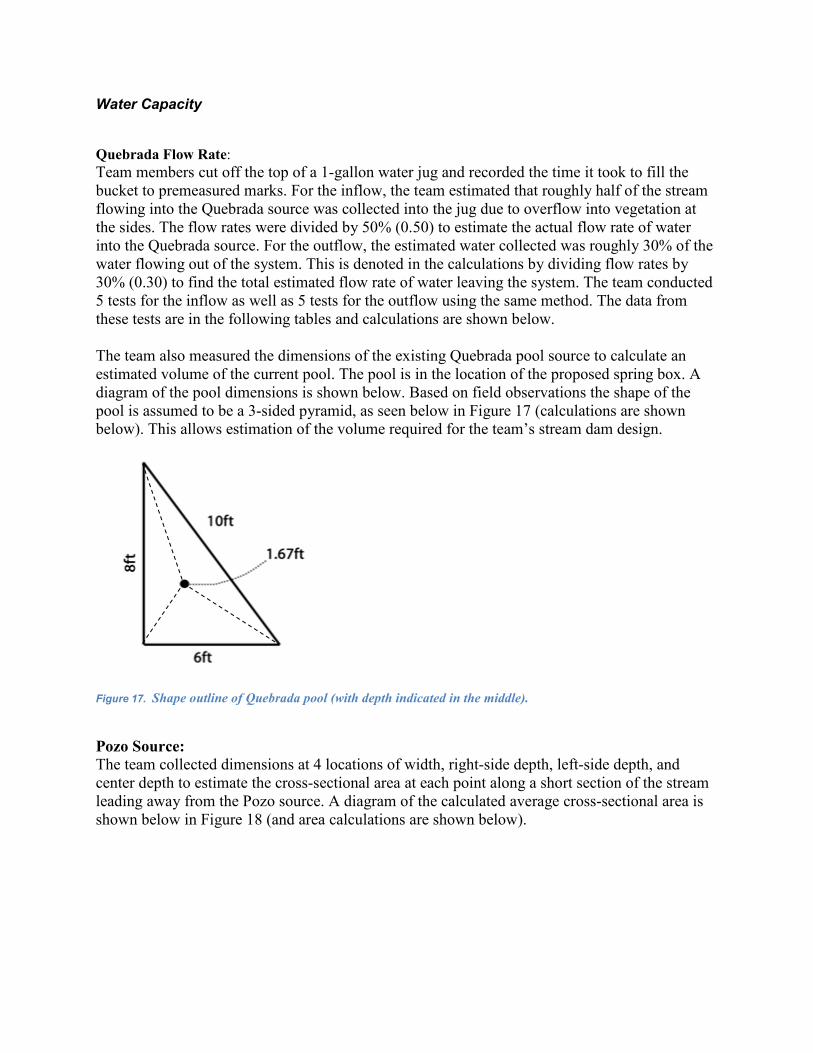
Water Capacity Quebrada Flow Rate: Team members cut off the top of a 1-gallon water jug and recorded the time it took to fill the bucket to premeasured marks. For the inflow, the team estimated that roughly half of the stream flowing into the Quebrada source was collected into the jug due to overflow into vegetation at the sides. The flow rates were divided by 50% (0.50) to estimate the actual flow rate of water into the Quebrada source. For the outflow, the estimated water collected was roughly 30% of the water flowing out of the system. This is denoted in the calculations by dividing flow rates by 30% (0.30) to find the total estimated flow rate of water leaving the system. The team conducted 5 tests for the inflow as well as 5 tests for the outflow using the same method. The data from these tests are in the following tables and calculations are shown below. The team also measured the dimensions of the existing Quebrada pool source to calculate an estimated volume of the current pool. The pool is in the location of the proposed spring box. A diagram of the pool dimensions is shown below. Based on field observations the shape of the pool is assumed to be a 3-sided pyramid, as seen below in Figure 17 (calculations are shown below). This allows estimation of the volume required for the team’s stream dam design.
Figure 17. Shape outline of Quebrada pool (with depth indicated in the middle).
Pozo Source: The team collected dimensions at 4 locations of width, right-side depth, left-side depth, and center depth to estimate the cross-sectional area at each point along a short section of the stream leading away from the Pozo source. A diagram of the calculated average cross-sectional area is shown below in Figure 18 (and area calculations are shown below).
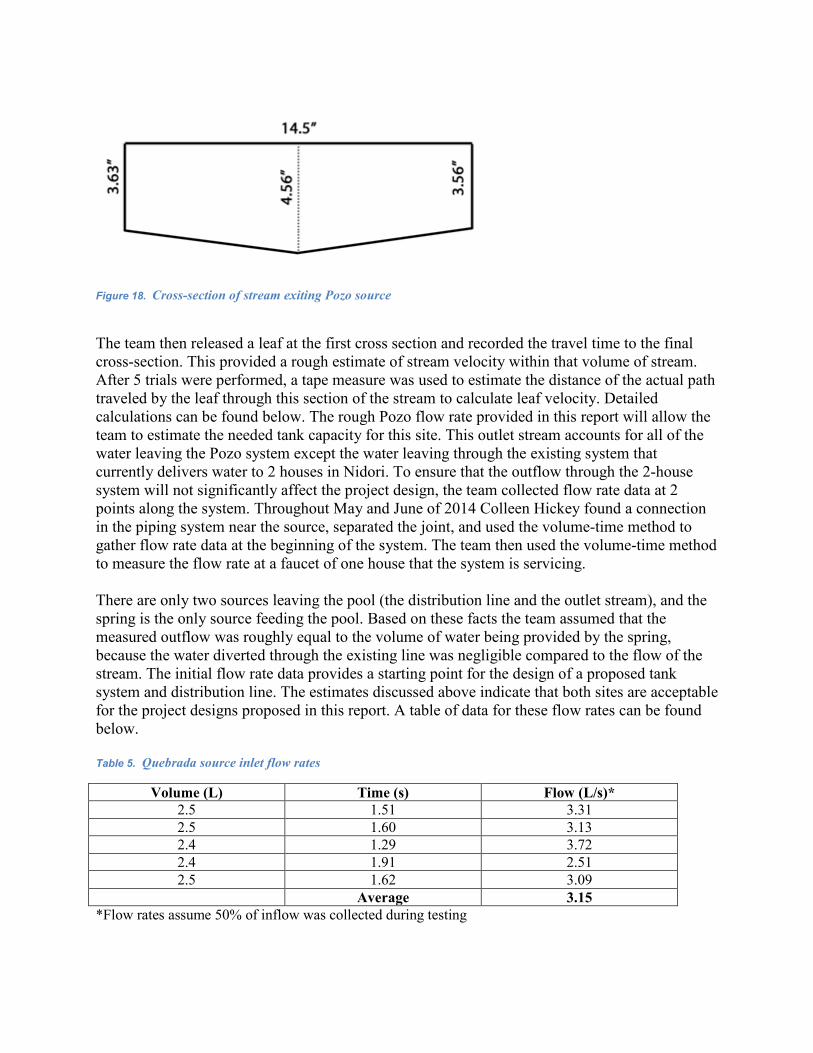
Figure 18. Cross-section of stream exiting Pozo source
The team then released a leaf at the first cross section and recorded the travel time to the final cross-section. This provided a rough estimate of stream velocity within that volume of stream. After 5 trials were performed, a tape measure was used to estimate the distance of the actual path traveled by the leaf through this section of the stream to calculate leaf velocity. Detailed calculations can be found below. The rough Pozo flow rate provided in this report will allow the team to estimate the needed tank capacity for this site. This outlet stream accounts for all of the water leaving the Pozo system except the water leaving through the existing system that currently delivers water to 2 houses in Nidori. To ensure that the outflow through the 2-house system will not significantly affect the project design, the team collected flow rate data at 2 points along the system. Throughout May and June of 2014 Colleen Hickey found a connection in the piping system near the source, separated the joint, and used the volume-time method to gather flow rate data at the beginning of the system. The team then used the volume-time method to measure the flow rate at a faucet of one house that the system is servicing. There are only two sources leaving the pool (the distribution line and the outlet stream), and the spring is the only source feeding the pool. Based on these facts the team assumed that the measured outflow was roughly equal to the volume of water being provided by the spring, because the water diverted through the existing line was negligible compared to the flow of the stream. The initial flow rate data provides a starting point for the design of a proposed tank system and distribution line. The estimates discussed above indicate that both sites are acceptable for the project designs proposed in this report. A table of data for these flow rates can be found below. Table 5. Quebrada source inlet flow rates
Volume (L) Time (s) Flow (L/s)* 2.5 1.51 3.31 2.5 1.60 3.13 2.4 1.29 3.72 2.4 1.91 2.51 2.5 1.62 3.09
Average 3.15 *Flow rates assume 50% of inflow was collected during testing
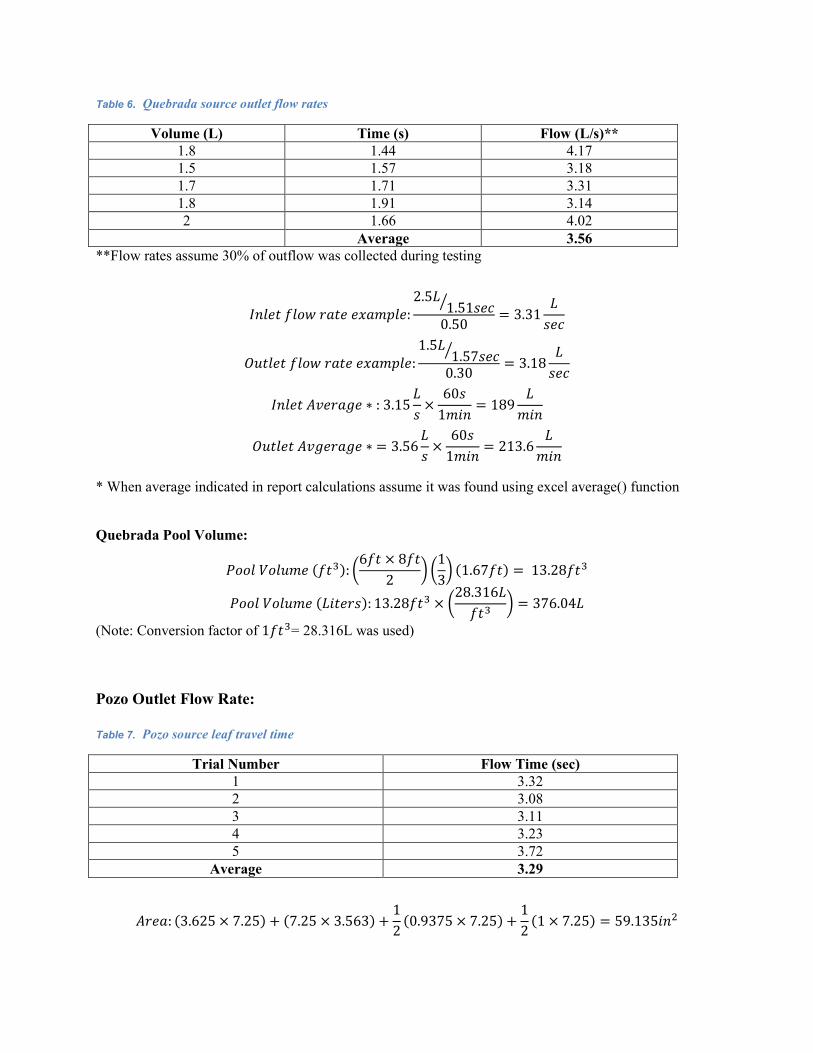
Table 6. Quebrada source outlet flow rates
Volume (L) Time (s) Flow (L/s)** 1.8 1.44 4.17 1.5 1.57 3.18 1.7 1.71 3.31 1.8 1.91 3.14 2 1.66 4.02 Average 3.56
**Flow rates assume 30% of outflow was collected during testing
:ݔ ݐݎ ݓ ݐܫܮ2.5 ൗݏ1.51
0.50 = 3.31 ܮ ݏ
:ݔ ݐݎ ݓ ݐݐݑܮ1.5 ൗݏ1.57
0.30 = 3.18 ܮ ݏ
ݎݒܣ ݐܫ כ : 3.15 ݏܮ × ݏ601 = 189 ܮ
ݎݒܣ ݐݐݑ = כ ݏܮ3.56 × ݏ601 = 213.6 ܮ
* When average indicated in report calculations assume it was found using excel average() function
Quebrada Pool Volume:
:(ଷݐ) ݑ ൬6ݐ × ݐ82 ൰ ൬1
3൰ (ݐ1.67) = ଷݐ13.28
:(ݏݎݐܮ) ݑ ଷݐ13.28 × ൬28.316ܮଷݐ ൰ = ܮ376.04
(Note: Conversion factor of 1ݐଷ= 28.316L was used)
Pozo Outlet Flow Rate: Table 7. Pozo source leaf travel time
Trial Number Flow Time (sec) 1 3.32 2 3.08 3 3.11 4 3.23 5 3.72
Average 3.29
:ݎܣ (3.625 × 7.25) + (7.25 × 3.563) + 12 (0.9375 × 7.25) + 1
2 (1 × 7.25) = 59.135ଶ

ቆ ݐ ݓܨଷ
ݏ ቇ: 30ݏ3.29 × 59.135ଶ = 539.23
ଷ
ݏ
ݐቆ ݐ ݓܨଷ
ݏ ቇ: 539.23ଷݏ × ଷݐ1
12ଷଷ = ݐ0.312ଷ
ݏ
൬ ݐ ݓܨ ܮ൰ : ଷݐ0.312
ݏ × ܮ28.316ଷݐ × ݏ60
1 = 530.08 ܮ
Water Usage Information: Table 8. Nidori Community Water Usage
Quebrada Pozo Units Per person daily: 30 30 L/person/day Per house daily: 240 293 L/house/day*
Daily volume needed: 1467 3522 L
387 930 gallons
52 124 cubic feet Max Hourly Usage: 440 1057 L/hr
* Adjusted for population growth

Appendix C: Materials List See following pages
Bolen Consulting A-4 Final Report

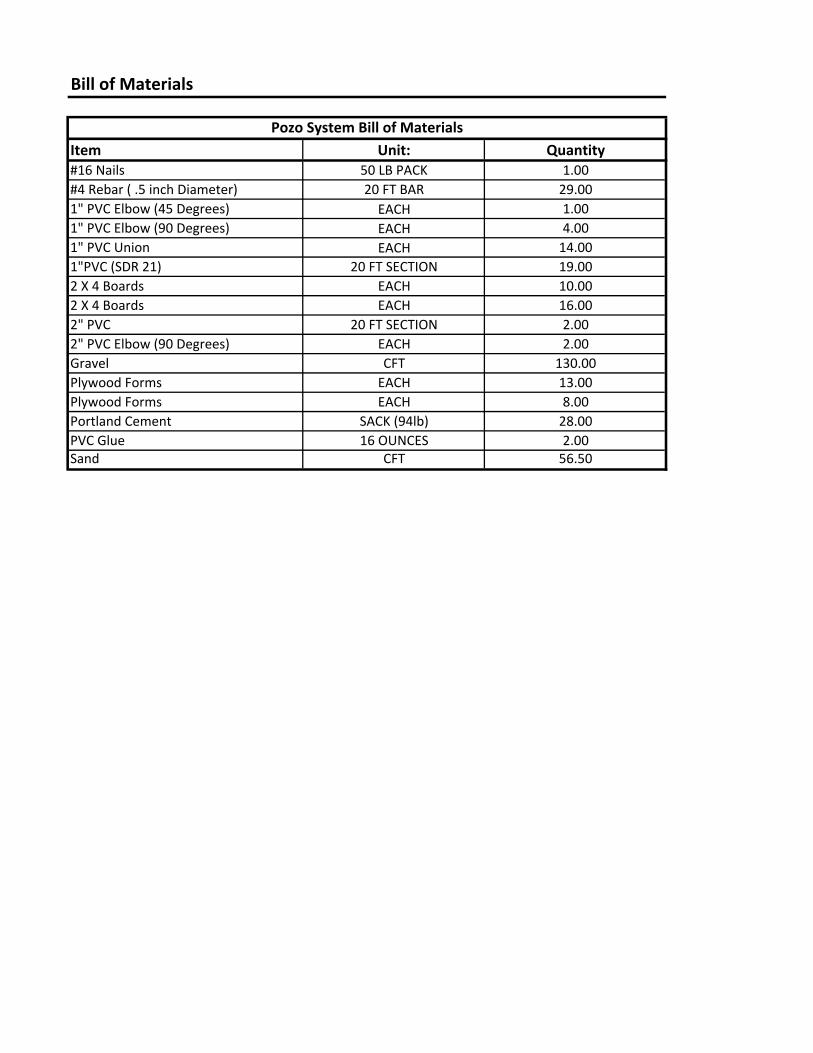
Bill�of�Materials
Item Unit: Quantity#16�Nails 50�LB�PACK 1.00
#4�Rebar�(�.5�inch�Diameter)� 20�FT�BAR 4.00
1"�"Y"�Joint EACH 2.00
1"�Air�Release�Valve EACH 1.00
1"�Cap EACH 2.00
1"�Control�Valve EACH 1.001"�PVC�Elbow�(45�Degrees) EACH 17.001"�PVC�Elbow�(90�Degrees) EACH 5.001"�PVC�Tee EACH 1.001"�PVC�Union EACH 13.001"�Threaded�PVC 20�FT�SECTION 1.001"PVC�(SDR�21) 20�FT�SECTION 35.002�X�6�Boards EACH 2.002"�PVC� 20�FT�SECTION 1.002"Ͳ1"�Reduction EACH 1.00Gravel CFT 14.50Plywood�Forms� EACH 2.00Portland�Cement SACK�(94lb) 4.00PVC�Glue 16�OUNCES 2.00Sand CFT 7.50
Quebrada�System�Bill�of�Materials

Stream�Dam:Concrete:� Page�225Ͳ http://pdf.usaid.gov/pdf_docs/PNAAG926.pdfConcrete�Calculations:�Wall�Quantity
Area= 2.15 sftDepth= 4.28 ft
Concrete�needed: 9.19 cubic�feetConcrete�needed: 0.34 cubic�yardsFloor�Quantity
Area= 7.74 sftDepth= 0.33 ft
Concrete�needed: 2.52 cubic�feetConcrete�needed: 0.09 cubic�yards
Total�Quantity�needed:� 0.50 CYD
Dry�Material�Needed: 0.8 CYD
Losses�due�to�handling 0.08 CYD
Volume�of�Dry�Materials: 0.8 CYD
Mix�Ratio: 1:2:3Volumetric�Porportion: 6
Cement�Needed: 0.138485 CYD3.739106 CFT
4 Sacks�(94�lbs)�Assuming�1�cubic�foot�per�sack
Sand�Needed: 0.276971 CYD7.5
Gravel�Needed: 0.415456 CYD11.2 CFT
Additional�Gravel
Filter: 1.1 CFTSubbase: 2.2 CFT
Total�Gravel�needed:� 14.5 CFT
Bill�of�Material�Notes:��Quebrada�Quantity�Calculations�
CFT
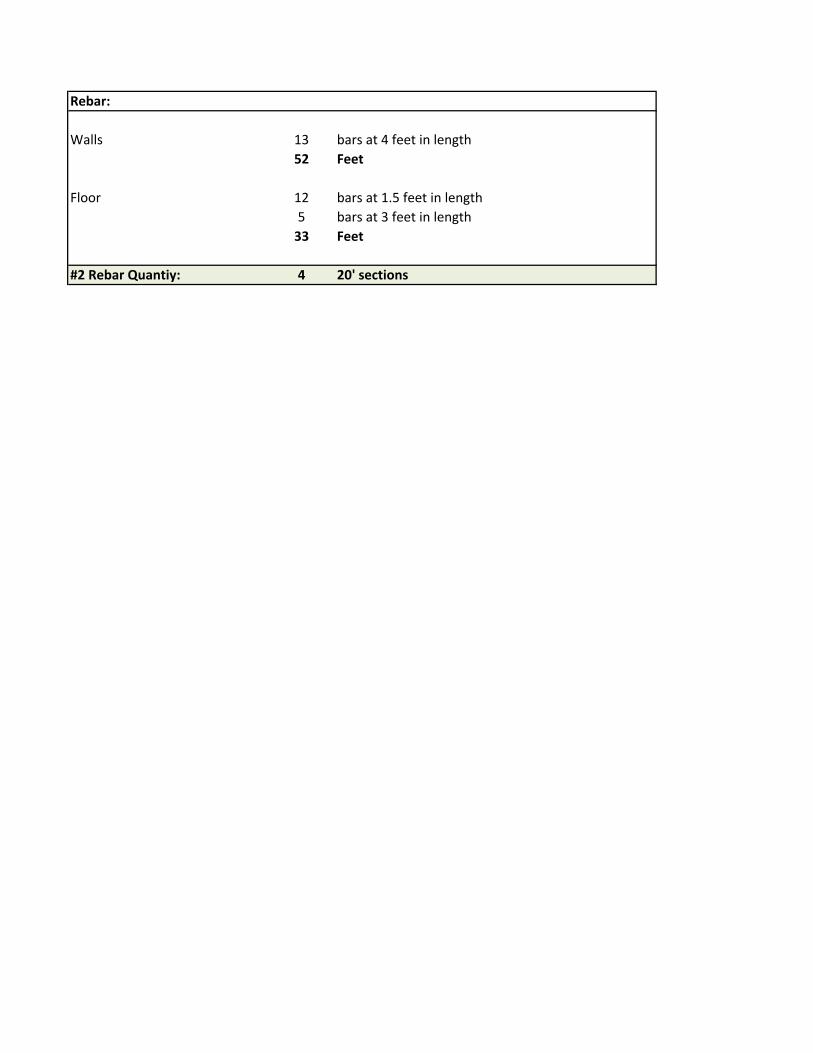
Rebar:
Walls 13 bars�at�4�feet�in�length52 Feet
Floor 12 bars�at�1.5�feet�in�length5 bars�at�3�feet�in�length33 Feet
#2�Rebar�Quantiy: 4 20'�sections
Bill�of�Materials
Item Unit: Quantity#16�Nails 50�LB�PACK 1.00#4�Rebar�(�.5�inch�Diameter)� 20�FT�BAR 29.001"�PVC�Elbow�(45�Degrees) EACH 1.001"�PVC�Elbow�(90�Degrees) EACH 4.001"�PVC�Union EACH 14.001"PVC�(SDR�21) 20�FT�SECTION 19.002�X�4�Boards EACH 10.002�X�4�Boards EACH 16.002"�PVC� 20�FT�SECTION 2.002"�PVC�Elbow�(90�Degrees) EACH 2.00Gravel CFT 130.00Plywood�Forms� EACH 13.00Plywood�Forms� EACH 8.00Portland�Cement SACK�(94lb) 28.00PVC�Glue 16�OUNCES 2.00Sand CFT 56.50
Pozo�System�Bill�of�Materials

Spring�Box:Concrete:� Page�225Ͳ http://pdf.usaid.gov/pdf_docs/PNAAG926.pdfMain�Chamber�Wall�Quantity
Outside�length= 3.99 ftOutside�width= 3.99 ftInside�length= 3.65 ftInside�width= 3.65 ft
Area= 2.60 sftWall�Height= 3.99 ft
Concrete�needed: 10.36 cubic�feetConcrete�needed: 0.38 cubic�yards
Gravel�Chamber�Wall�QuantityArea= 3.50 sft
Wall�Height= 2.83 ftConcrete�needed: 9.92 cubic�feetConcrete�needed: 0.37 cubic�yards
Lid�QuantityArea= 12.73 sft
Depth= 0.17 ftConcrete�needed: 2.12 cubic�feetConcrete�needed: 0.08 cubic�yards
Floor�QuantityArea= 30.689 sft
Depth= 0.33 ftConcrete�needed: 9.97 cubic�feetConcrete�needed: 0.37 cubic�yards
Total�Quantity�needed:� 1.20 CYD
Dry�Material�Needed: 1.8 CYD
Losses�due�to�handling 0.18 CYD
Volume�of�Dry�Materials: 2.0 CYD
Mix�Ratio: 1:2:3Volumetric�Porportion: 6
Cement�Needed: 0.3297549 CYD8.9033835 CFT
9 Sacks�(94�lbs)�Assuming�1�cubic�foot�per�sack
Sand�Needed: 0.6595099 CYD18
Bill�of�Material�Notes:��Pozo�Quantity�Calculations�
CFT
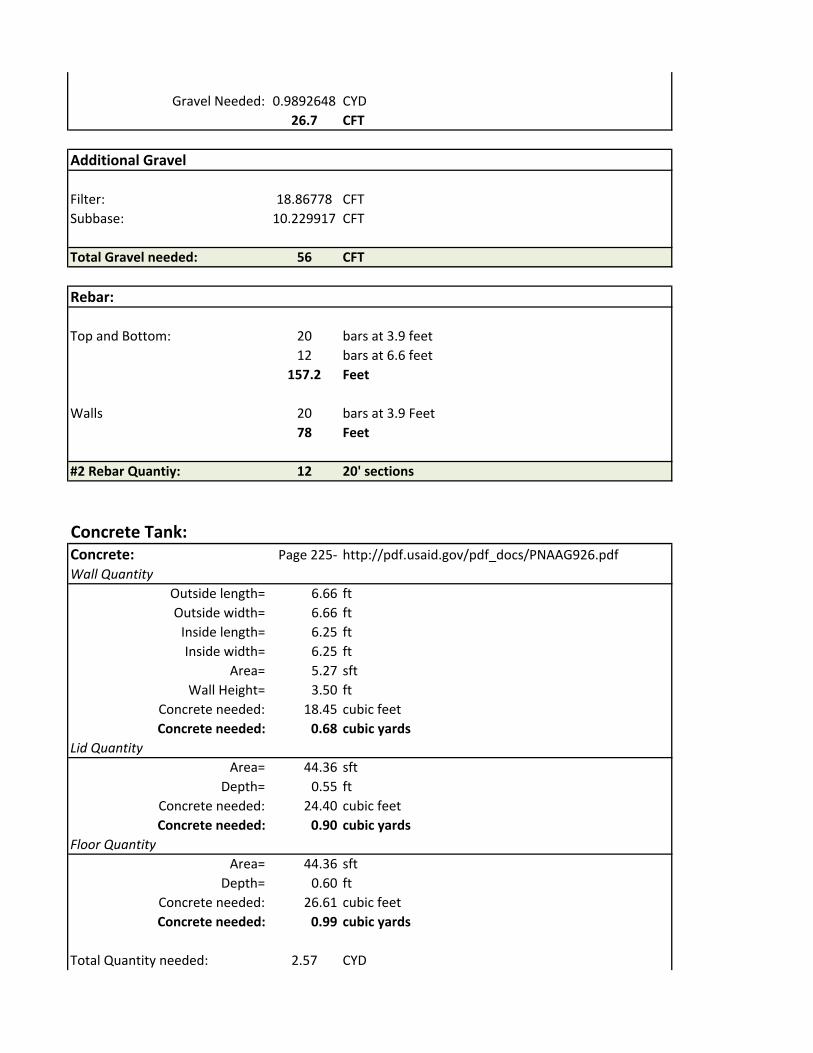
Gravel�Needed: 0.9892648 CYD
26.7 CFT
Additional�Gravel
Filter: 18.86778 CFT
Subbase: 10.229917 CFT
Total�Gravel�needed:� 56 CFT
Rebar:
Top�and�Bottom: 20 bars�at�3.9�feet12 bars�at�6.6�feet
157.2 Feet
Walls 20 bars�at�3.9�Feet78 Feet
#2�Rebar�Quantiy: 12 20'�sections
Concrete�Tank:�Concrete:� Page�225Ͳ http://pdf.usaid.gov/pdf_docs/PNAAG926.pdfWall�Quantity
Outside�length= 6.66 ft
Outside�width= 6.66 ft
Inside�length= 6.25 ft
Inside�width= 6.25 ft
Area= 5.27 sft
Wall�Height= 3.50 ft
Concrete�needed: 18.45 cubic�feetConcrete�needed: 0.68 cubic�yards
Lid�QuantityArea= 44.36 sft
Depth= 0.55 ft
Concrete�needed: 24.40 cubic�feetConcrete�needed: 0.90 cubic�yards
Floor�QuantityArea= 44.36 sft
Depth= 0.60 ft
Concrete�needed: 26.61 cubic�feetConcrete�needed: 0.99 cubic�yards
Total�Quantity�needed:� 2.57 CYD
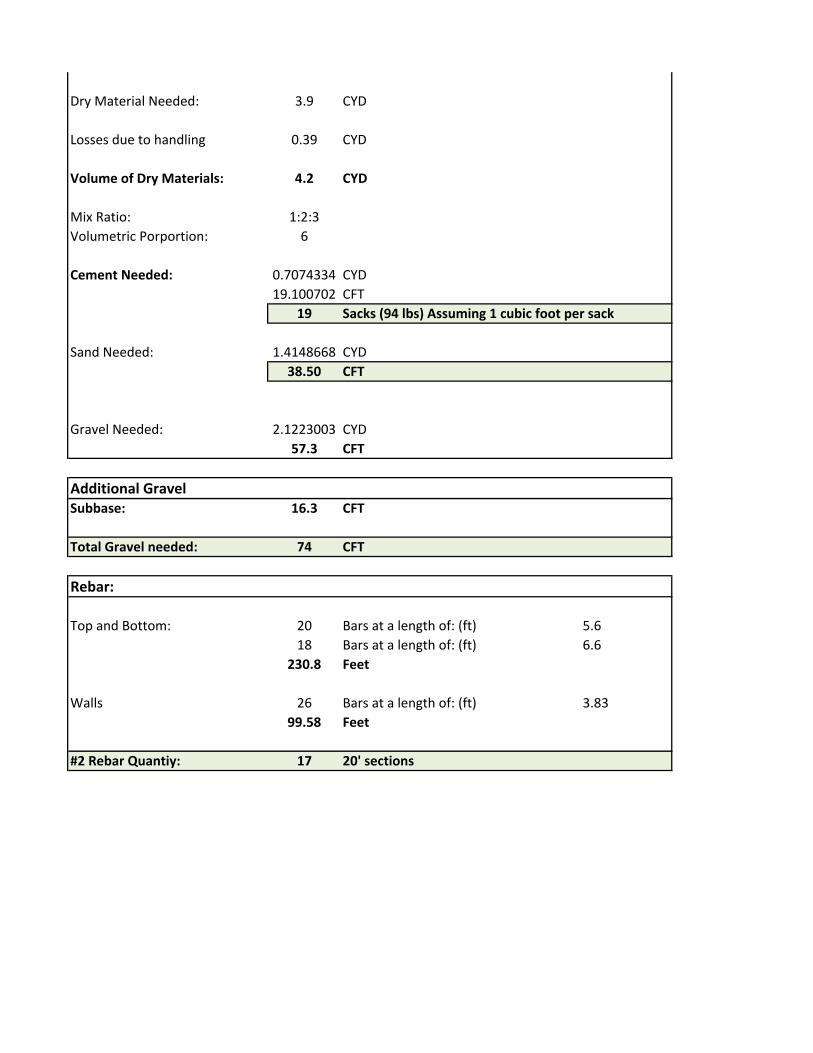
Dry�Material�Needed: 3.9 CYD
Losses�due�to�handling 0.39 CYD
Volume�of�Dry�Materials: 4.2 CYD
Mix�Ratio: 1:2:3
Volumetric�Porportion: 6
Cement�Needed: 0.7074334 CYD
19.100702 CFT
19 Sacks�(94�lbs)�Assuming�1�cubic�foot�per�sack
Sand�Needed: 1.4148668 CYD
38.50
Gravel�Needed: 2.1223003 CYD
57.3 CFT
Additional�GravelSubbase: 16.3 CFT
Total�Gravel�needed:� 74 CFT
Rebar:
Top�and�Bottom: 20 Bars�at�a�length�of:�(ft) 5.6
18 Bars�at�a�length�of:�(ft) 6.6
230.8 Feet
Walls 26 Bars�at�a�length�of:�(ft) 3.83
99.58 Feet
#2�Rebar�Quantiy: 17 20'�sections
CFT

Appendix D: Online Resources A link is provided below that shows a google map of the proposed Quebrada and Pozo projects. https://www.google.com/maps/d/edit?mid=zoBRUwGCLDIQ.kLpnYsZ06JdA
Bolen Consulting A-5 Final Report

Appendix E: EPANET Inputs and Results See following pages
Bolen Consulting A-6 Final Report
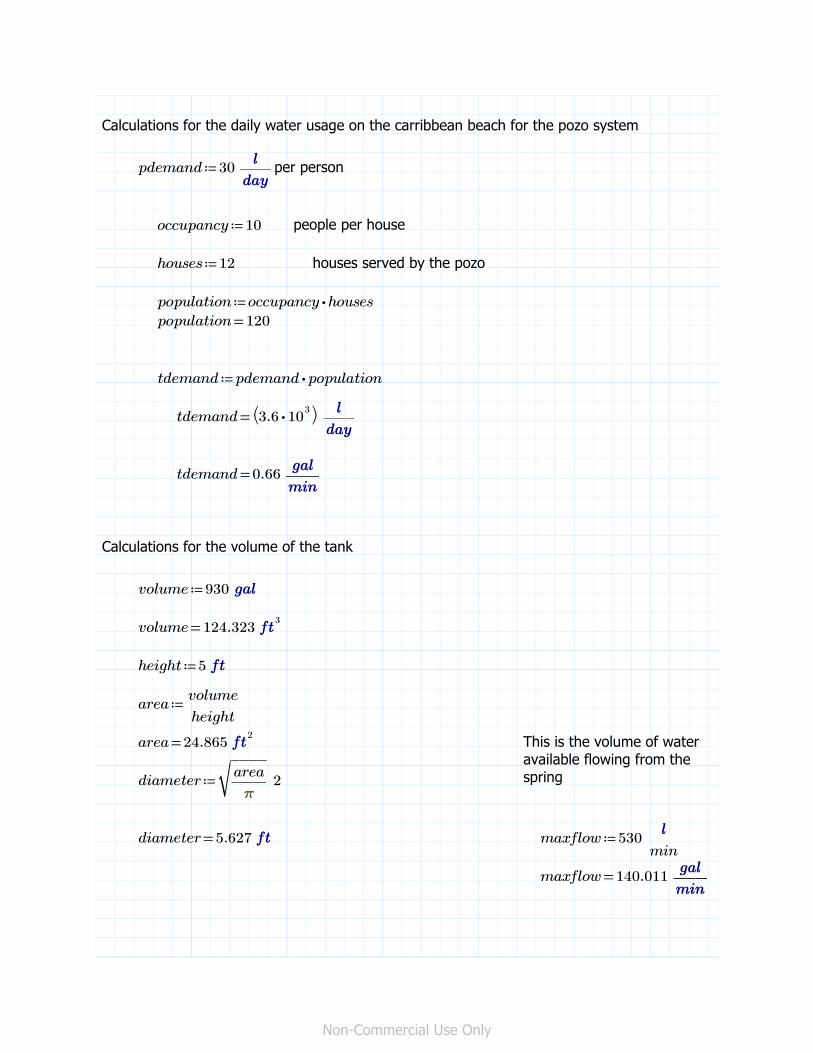
Calculations for the daily water usage on the carribbean beach for the pozo system
≔pdemand 30 ――per person
≔occupancy 10 people per house
≔houses 12 houses served by the pozo
≔population ⋅occupancy houses=population 120
≔tdemand ⋅pdemand population=tdemand ⎛⎝ ⋅3.6 103 ⎞⎠ ――
=tdemand 0.66 ――
Calculations for the volume of the tank
≔volume 930=volume 124.323 3
≔height 5≔area ―――volume
height=area 24.865 2 This is the volume of water
available flowing from the spring≔diameter ‾‾‾‾‾――area 2
=diameter 5.627 ≔maxflow 530 ――min=maxflow 140.011 ――
Non-Commercial Use Only

Calculations for the daily water usage for the quebrada system
≔pdemand 50 ――per person, WHO estimate
≔occupancy 8 people per house
≔houses 5 houses served by the pozo
≔population ⋅occupancy houses=population 40
≔tdemand ⋅pdemand population=tdemand ⎛⎝ ⋅2 103 ⎞⎠ ――
=tdemand 0.367 ――
≔hdemand ⋅occupancy pdemand=hdemand 0.073 ――
This is the volume of water available flowing from the spring
≔maxflow 200 ――min=maxflow 52.834 ――
Non-Commercial Use Only
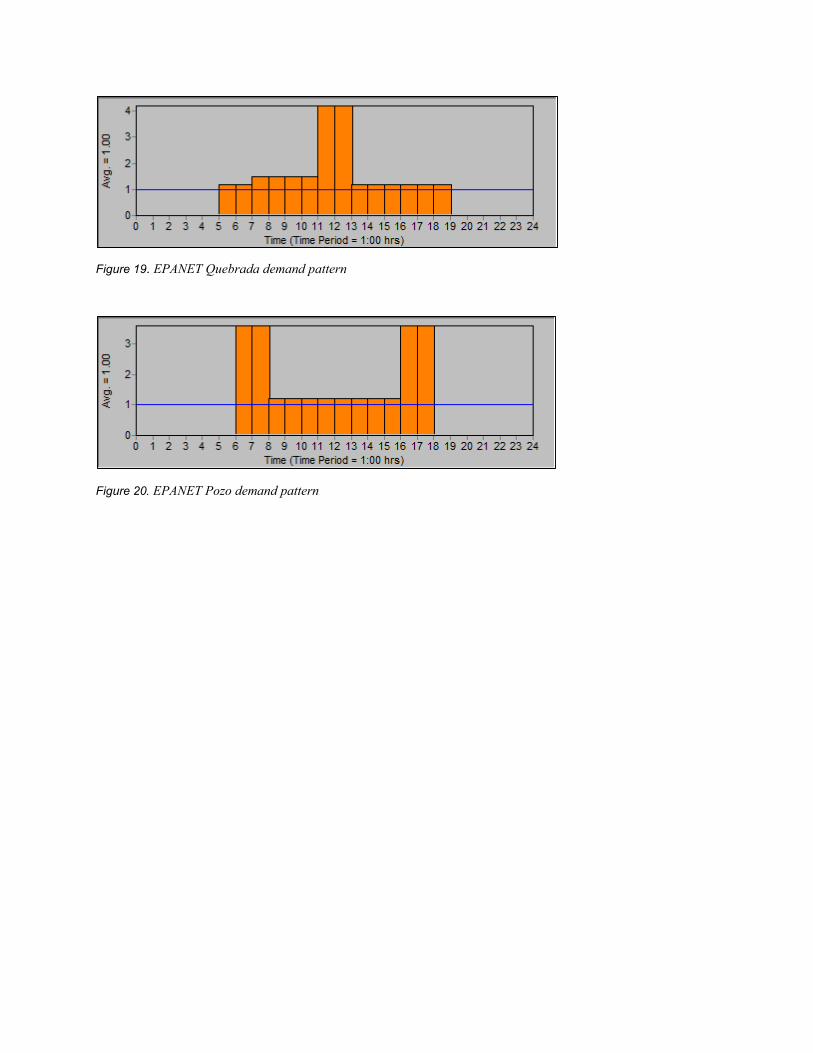
Figure 19. EPANET Quebrada demand pattern
Figure 20. EPANET Pozo demand pattern

Source
Node
Figure 21. EPANET Quebrada system model

Source/Springbox
Spigot
Storage tank
Figure 22. EPANET Pozo system model
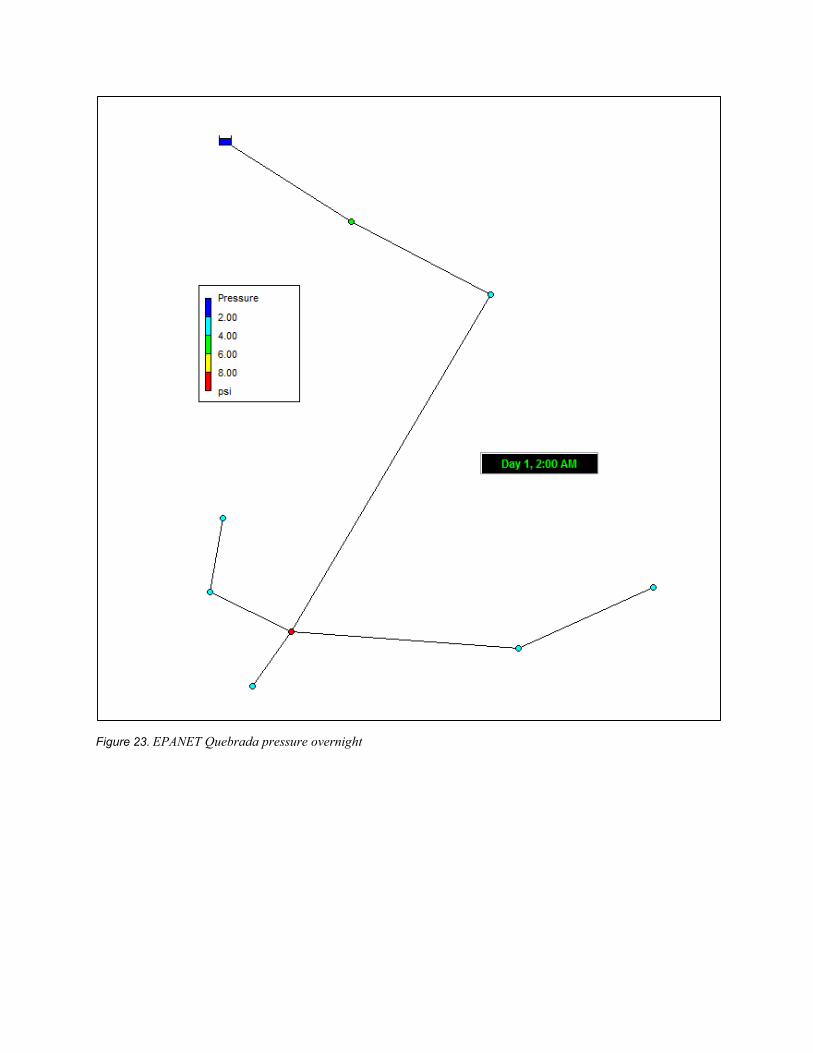
Figure 23. EPANET Quebrada pressure overnight
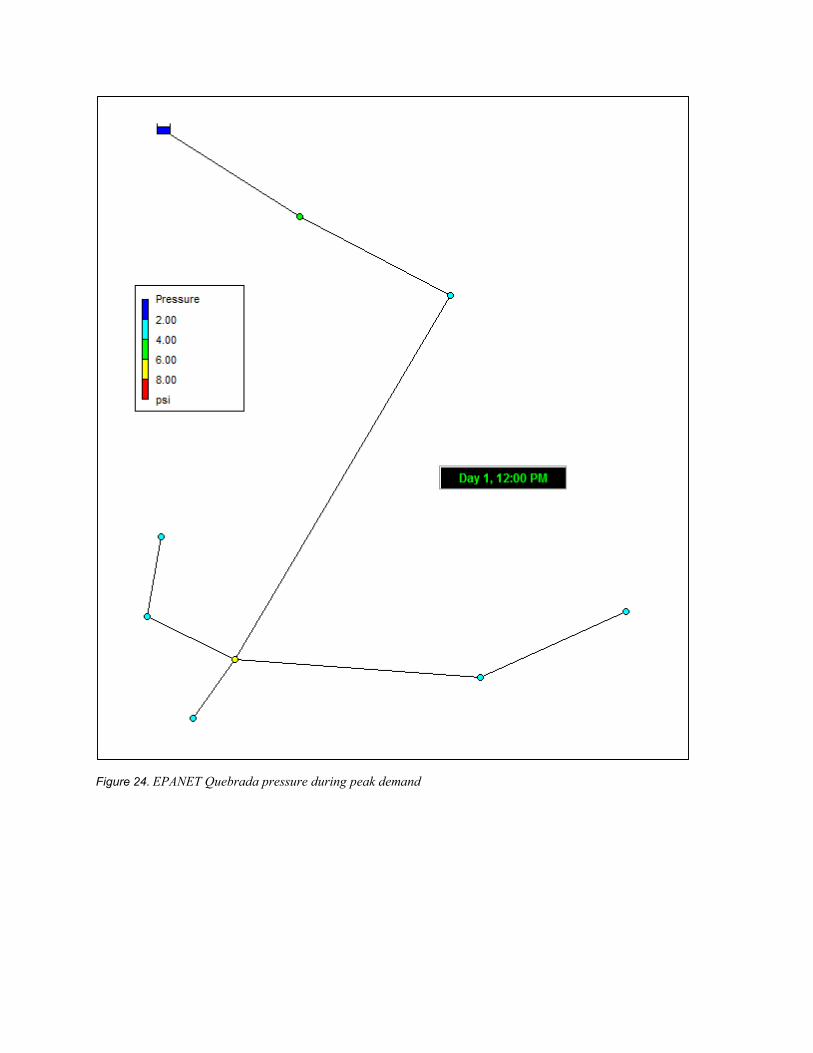
Figure 24. EPANET Quebrada pressure during peak demand

Appendix F: Water Quality Data See following pages
Bolen Consulting A-7 Final Report
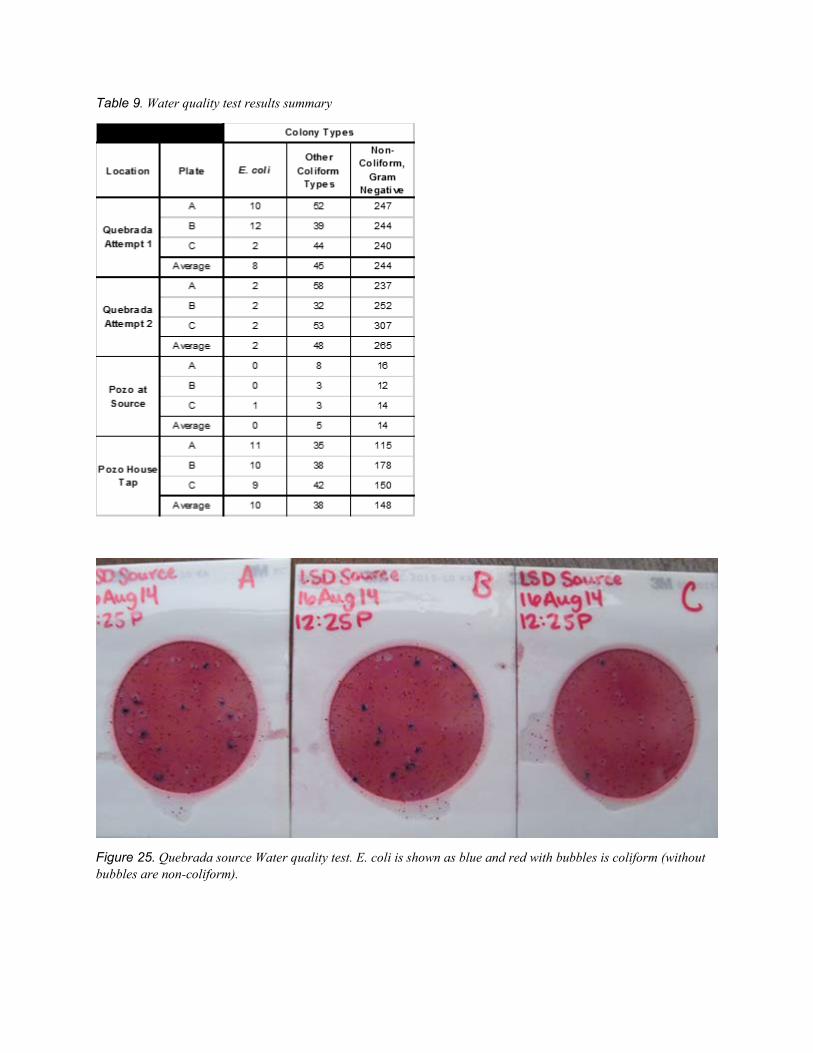
Table 9. Water quality test results summary
Figure 25. Quebrada source Water quality test. E. coli is shown as blue and red with bubbles is coliform (without bubbles are non-coliform).
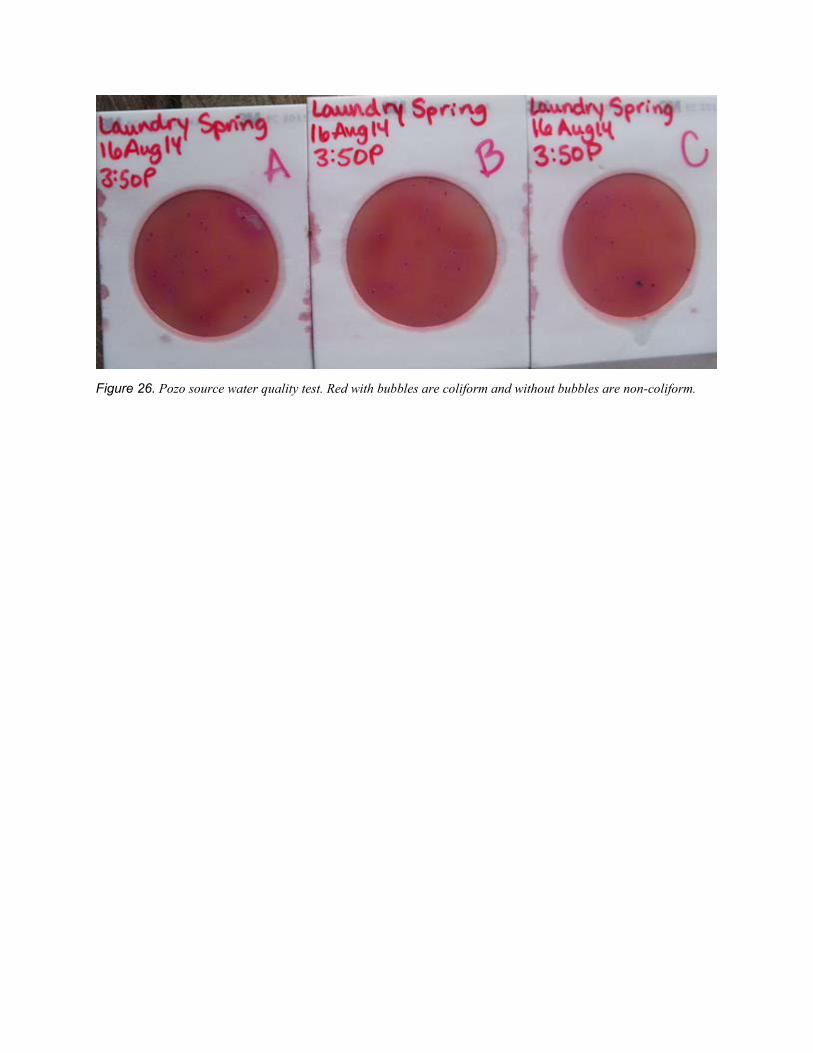
Figure 26. Pozo source water quality test. Red with bubbles are coliform and without bubbles are non-coliform.

Appendix G: Air Block Analysis See following pages
Bolen Consulting A-8 Final Report

Calculations to determine if there will be an air block in the quebrada system
≔Q 1 ――min ≔Hc 8 compression head= 32.174 ―2≔ρatm 33.9
≔ρb' +ρatm Hc atmospheric pressure=33.9ft of water=ρb' 41.9
≔Lbc 110 ≔Dpipe 1≔Vbc ⋅⋅Lbc ―――Dpipe2
4 See the figure at the end of this appendix for the location of these points in the line.
=Vbc 0.6 3
≔Vbb' ⋅Vbc ――ρatmρb'
=Vbb' 0.485 3
≔Lbb' ⋅Lbc ――Vbb'Vbc
=Lbb' 88.998≔elb 42 ≔elb' 32
≔He −ρb' ρatm=He 8 ≔L 650
≔D 1≔ε ⋅.001 10−3
=ε ⎛⎝ ⋅3.281 10−6⎞⎠ ≔υ ⋅1.08 10−5 ――2
Kinematic viscosity at 20 degrees C from Wurbs and James Water Resources Engineering
≔RR ―εD =RR ⋅3.937 10−5
≔V ――――Q⎛⎜⎝ ⋅ ⎛⎜⎝―D2
⎞⎟⎠2 ⎞⎟⎠
=V 0.408 ―Using Water Resources Engineering by Wurbs and James, pg 135-137
≔Re ⋅D ―Vυ =Re ⋅3.152 103
Non-Commercial Use Only

≔f .046≔Hl ⋅⎛⎜⎝ ++⋅f ―LD 0.8 1.0⎞⎟⎠ ――V2
(( ⋅2 )) =Hl 0.935
≔Hf −He Hl =Hf 7.065
≔finalelev +Hf elb'=finalelev 39.065
Elevation of the taps in the homes will be about 38 feet, so this would be cutting it very close
Non-Commercial Use Only

This elevation profile corresponds to the air in pipes calculations, where point A is the first low point in the system, point B is the high point where the air block will form, and B’ is the lower end of the air block. Point C is the next low point in the system.
Appendix H: Cost Estimate Engineer’s Opinion of Cost for the Quebrada System ............................................................... I Engineer’s Opinion of Cost for the Pozo System ........................................................................ II Equipment Information .............................................................................................................. IV Mobilization Information ............................................................................................................. V
Bolen Consulting A-9 Final Report

Bolen�Consulting Engineer's�Opinion�of�Cost�for�the�Quebrada�System�
Nidori�Community,�Panama
Project�No.�1
$/Unit Cost $/Unit Cost $/Unit Cost
TRIPS 8.00 2�Drivers 1.00 8.00 64.00 44.50 356.00 0.00 0.00 0.00 0.00 356.00 44.50
TOTALS LS 1 64.00 356.00 0.00 0.00 356.00
SYD 72 5�Men 72.00 1.00 40
Machetes EACH 2.00 Ͳ Ͳ Ͳ 0.00 0.00 0.00 0.00 20.00 20.00 20.00
TOTALS LS 1 39.81 0.00 0.00 20.00 20.00
LSUM 1 5�Men 0.08 12.50 500.00
Machete EACH 2.00 Ͳ Ͳ Ͳ Ͳ 0.00 0.00 0.00 0.00 20.00 20.00 20.00 20.00
Shovels EACH 5.00 Ͳ Ͳ Ͳ Ͳ 0.00 0.00 0.00 0.00 8.55 21.38 21.38 4.28
Hammers EACH 3.00 Ͳ Ͳ Ͳ Ͳ 0.00 0.00 0.00 0.00 7.44 22.32 22.32 7.44
Hand�Saw EACH 1.00 Ͳ Ͳ Ͳ Ͳ 0.00 0.00 0.00 0.00 7.44 7.44 7.44 7.44
Plywood�Forms� EACH 2.00 Ͳ Ͳ Ͳ Ͳ 36.33 72.66 0.00 0.00 0.00 0.00 72.66 36.33
2�X�6�Boards EACH 2.00 Ͳ Ͳ Ͳ Ͳ 12.79 25.58 0.00 0.00 0.00 0.00 25.58 12.79
Gravel CFT 14.50 Ͳ Ͳ Ͳ Ͳ 0.93 13.49 0.00 0.00 0.00 0.00 13.49 0.93
Sand CFT 7.50 Ͳ Ͳ Ͳ Ͳ 1.06 7.95 0.00 0.00 0.00 0.00 7.95 1.06
Portland�Cement SACK�(94lb) 4.00 Ͳ Ͳ Ͳ Ͳ 10.40 41.60 0.00 0.00 0.00 0.00 41.60 10.40
#4�Rebar�(�.5�inch�Diameter)� 20'�BAR 4.00 Ͳ Ͳ Ͳ Ͳ 1.47 5.88 0.00 0.00 0.00 0.00 5.88 1.47
2"�PVC� 20'�SECTION 1.00 Ͳ Ͳ Ͳ Ͳ 13.64 13.64 0.00 0.00 0.00 0.00 13.64 13.64
#16�Nails 50lb�PACK 1.00 Ͳ Ͳ Ͳ Ͳ 40.61 40.61 0.00 0.00 0.00 0.00 40.61 40.61
TOTALS LS 1 500.00 221.41 0.00 71.14 292.54
LFT 645 5�Men 64.50 10.00 400.00
Shovels EACH 5.00 Ͳ Ͳ Ͳ Ͳ 0.00 0.00 0.00 0.00 8.55 21.38 21.38 4.28
Pipe�Cutters EACH 1.00 Ͳ Ͳ Ͳ Ͳ 0.00 0.00 0.00 0.00 22.42 22.42 22.42 22.42
1"PVC�(SDR�26) 20'�SECTION 35.00 Ͳ Ͳ Ͳ Ͳ 4.87 170.45 0.00 0.00 0.00 0.00 170.45 4.87
1"�PVC�Elbow�(90�Degrees) EACH 5.00 Ͳ Ͳ Ͳ Ͳ 0.37 1.85 0.00 0.00 0.00 0.00 1.85 0.37
1"�PVC�Elbow�(45�Degrees) EACH 17.00 Ͳ Ͳ Ͳ Ͳ 0.48 8.16 0.00 0.00 0.00 0.00 8.16 0.48
1"�PVC�Union EACH 13.00 Ͳ Ͳ Ͳ Ͳ 1.90 24.70 0.00 0.00 0.00 0.00 24.70 1.90
1"�PVC�Tee EACH 1.00 Ͳ Ͳ Ͳ Ͳ 0.64 0.64 0.00 0.00 0.00 0.00 0.64 0.64
2"Ͳ1"�Reduction EACH 1.00 Ͳ Ͳ Ͳ Ͳ 0.79 0.79 0.00 0.00 0.00 0.00 0.79 0.79
PVC�Glue 16�ounces 2.00 Ͳ Ͳ Ͳ Ͳ 9.79 19.58 0.00 0.00 0.00 0.00 19.58 9.79
1"�"Y"�Joint EACH 2.00 Ͳ Ͳ Ͳ Ͳ 1.33 2.66 0.00 0.00 0.00 0.00 2.66 1.33
1"�Threaded�PVC 20'�SECTION 1.00 Ͳ Ͳ Ͳ Ͳ 4.87 4.87 0.00 0.00 0.00 0.00 4.87 4.87
1"�Cap EACH 2.00 Ͳ Ͳ Ͳ Ͳ 0.33 0.66 0.00 0.00 0.00 0.00 0.66 0.33
1"�Control�Valve EACH 1.00 Ͳ Ͳ Ͳ Ͳ 15.50 15.50 0.00 0.00 0.00 0.00 15.50 15.501"�Air�Release�Valve EACH 1.00 Ͳ Ͳ Ͳ Ͳ 15.00 15.00 0.00 0.00 0.00 0.00 15.00 15.00
TOTALS LS 1 400.00 $264.86 $0.00 $43.80 $308.66LS 1 1,004 $842.27 $0.00 $134.93 $977.20
Quantity CrewPhase Description Unit
2.�CLEARING
3.�SPRING�DAM�CONSTRUCTION
4.�DISTRIBUTION�PIPELINE�CONSTRUCTION
Unit�Price
1.�MOBILIZATION
MATERIALS LABOR EQUIPMENT
FINAL�TOTALS
TotalDaily�Output Task�Days Task�Hours
Construction�of�spring�dam:
Removal�of�all�vegetation�in�construction�area.
Transportation�Cost�for�all�tools�and�supplies�(from�David�to�La�Ensenada)
Construction�of�pipeline.�
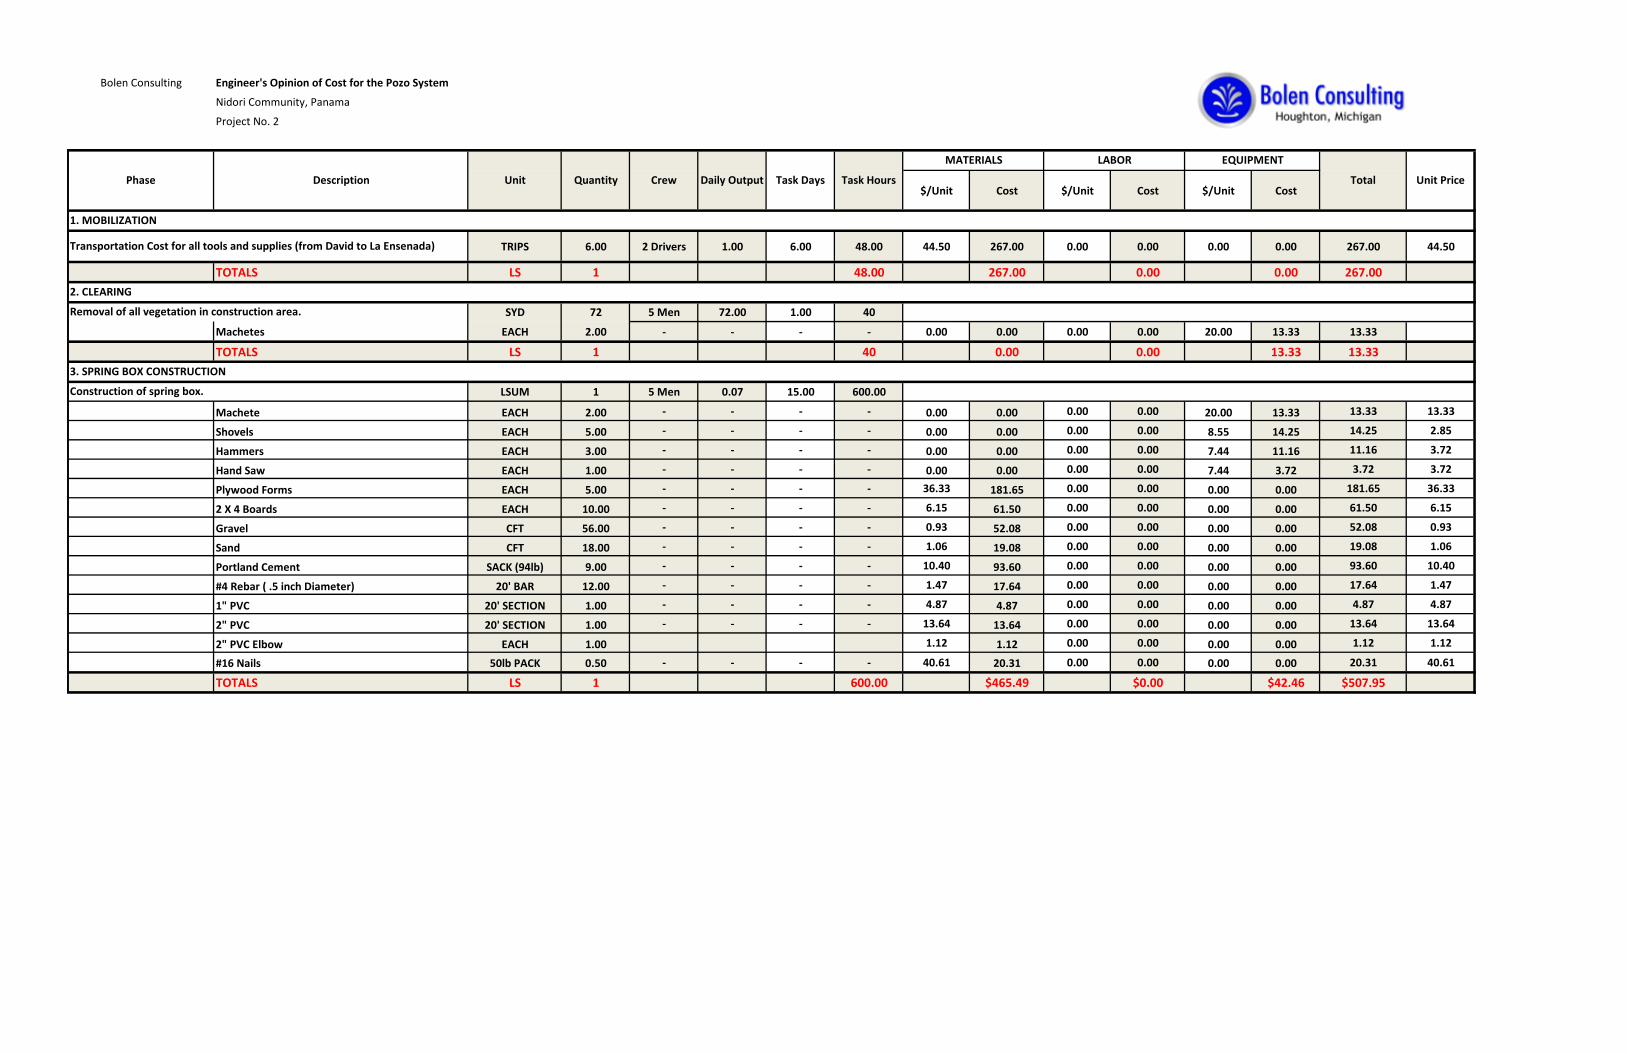
Bolen�Consulting Engineer's�Opinion�of�Cost�for�the�Pozo�System�
Nidori�Community,�Panama
Project�No.�2
$/Unit Cost $/Unit Cost $/Unit Cost
TRIPS 6.00 2�Drivers 1.00 6.00 48.00 44.50 267.00 0.00 0.00 0.00 0.00 267.00 44.50
TOTALS LS 1 48.00 267.00 0.00 0.00 267.00
SYD 72 5�Men 72.00 1.00 40
Machetes EACH 2.00 Ͳ Ͳ Ͳ Ͳ 0.00 0.00 0.00 0.00 20.00 13.33 13.33
TOTALS LS 1 40 0.00 0.00 13.33 13.33
LSUM 1 5�Men 0.07 15.00 600.00
Machete EACH 2.00 Ͳ Ͳ Ͳ Ͳ 0.00 0.00 0.00 0.00 20.00 13.33 13.33 13.33
Shovels EACH 5.00 Ͳ Ͳ Ͳ Ͳ 0.00 0.00 0.00 0.00 8.55 14.25 14.25 2.85
Hammers EACH 3.00 Ͳ Ͳ Ͳ Ͳ 0.00 0.00 0.00 0.00 7.44 11.16 11.16 3.72
Hand�Saw EACH 1.00 Ͳ Ͳ Ͳ Ͳ 0.00 0.00 0.00 0.00 7.44 3.72 3.72 3.72
Plywood�Forms� EACH 5.00 Ͳ Ͳ Ͳ Ͳ 36.33 181.65 0.00 0.00 0.00 0.00 181.65 36.33
2�X�4�Boards EACH 10.00 Ͳ Ͳ Ͳ Ͳ 6.15 61.50 0.00 0.00 0.00 0.00 61.50 6.15
Gravel CFT 56.00 Ͳ Ͳ Ͳ Ͳ 0.93 52.08 0.00 0.00 0.00 0.00 52.08 0.93
Sand CFT 18.00 Ͳ Ͳ Ͳ Ͳ 1.06 19.08 0.00 0.00 0.00 0.00 19.08 1.06
Portland�Cement SACK�(94lb) 9.00 Ͳ Ͳ Ͳ Ͳ 10.40 93.60 0.00 0.00 0.00 0.00 93.60 10.40
#4�Rebar�(�.5�inch�Diameter)� 20'�BAR 12.00 Ͳ Ͳ Ͳ Ͳ 1.47 17.64 0.00 0.00 0.00 0.00 17.64 1.47
1"�PVC� 20'�SECTION 1.00 Ͳ Ͳ Ͳ Ͳ 4.87 4.87 0.00 0.00 0.00 0.00 4.87 4.87
2"�PVC� 20'�SECTION 1.00 Ͳ Ͳ Ͳ Ͳ 13.64 13.64 0.00 0.00 0.00 0.00 13.64 13.64
2"�PVC�Elbow EACH 1.00 1.12 1.12 0.00 0.00 0.00 0.00 1.12 1.12
#16�Nails 50lb�PACK 0.50 Ͳ Ͳ Ͳ Ͳ 40.61 20.31 0.00 0.00 0.00 0.00 20.31 40.61
TOTALS LS 1 600.00 $465.49 $0.00 $42.46 $507.95
LABOR EQUIPMENT
TotalPhase Description Unit Quantity Crew Daily�Output Unit�Price
1.�MOBILIZATION
Transportation�Cost�for�all�tools�and�supplies�(from�David�to�La�Ensenada)
2.�CLEARING
Removal�of�all�vegetation�in�construction�area.
3.�SPRING�BOX�CONSTRUCTION
Task�Days Task�Hours
MATERIALS
Construction�of�spring�box.

Bolen�Consulting Engineer's�Opinion�of�Cost�for�the�Pozo�System�
Nidori�Community,�Panama
Project�No.�2
$/Unit Cost $/Unit Cost $/Unit Cost
LABOR EQUIPMENT
TotalPhase Description Unit Quantity Crew Daily�Output Unit�PriceTask�Days Task�Hours
MATERIALS
LFT 340 5�Men 68.00 5.00 200.00
Shovels EACH 5.00 Ͳ Ͳ Ͳ Ͳ 0.00 0.00 0.00 0.00 8.55 14.25 14.25 2.85
Pipe�Cutters EACH 1.00 Ͳ Ͳ Ͳ Ͳ 0.00 0.00 0.00 0.00 22.42 22.42 22.42 22.42
1"PVC�(SDR�26) 20'�SECTION 17.00 Ͳ Ͳ Ͳ Ͳ 4.87 82.79 0.00 0.00 0.00 0.00 82.79 4.87
1"�PVC�Elbow�(90�Degrees) EACH 1.00 Ͳ Ͳ Ͳ Ͳ 0.37 0.37 0.00 0.00 0.00 0.00 0.37 0.37
1"�PVC�Elbow�(45�Degrees) EACH 1.00 Ͳ Ͳ Ͳ Ͳ 0.48 0.48 0.00 0.00 0.00 0.00 0.48 0.48
1"�PVC�Union EACH 14.00 Ͳ Ͳ Ͳ Ͳ 1.90 26.60 0.00 0.00 0.00 0.00 26.60 1.90
PVC�Glue EACH 2.00 Ͳ Ͳ Ͳ Ͳ 9.79 19.58 0.00 0.00 0.00 0.00 19.58 9.79
TOTALS LS 1 200.00 $129.82 $0.00 $36.67 $166.49
LSUM 1 5�Men 0.08 12.50 500.00
Machete EACH 2.00 Ͳ Ͳ Ͳ Ͳ 0.00 0.00 0.00 0.00 20.00 13.33 13.33 13.33
Shovels EACH 5.00 Ͳ Ͳ Ͳ Ͳ 0.00 0.00 0.00 0.00 8.55 14.25 14.25 2.85
Hammers EACH 3.00 Ͳ Ͳ Ͳ Ͳ 0.00 0.00 0.00 0.00 7.44 11.16 11.16 3.72
Hand�Saw EACH 1.00 Ͳ Ͳ Ͳ Ͳ 0.00 0.00 0.00 0.00 7.44 3.72 3.72 3.72
Plywood�Forms� EACH 8.00 Ͳ Ͳ Ͳ Ͳ 36.33 290.64 0.00 0.00 0.00 0.00 290.64 36.33
2�X�4�Boards EACH 16.00 Ͳ Ͳ Ͳ Ͳ 6.15 98.40 0.00 0.00 0.00 0.00 98.40 6.15
Gravel CFT 74.00 Ͳ Ͳ Ͳ Ͳ 0.93 68.82 0.00 0.00 0.00 0.00 68.82 0.93
Sand CFT 38.50 Ͳ Ͳ Ͳ Ͳ 1.06 40.81 0.00 0.00 0.00 0.00 40.81 1.06
Portland�Cement SACK�(94lb) 19.00 Ͳ Ͳ Ͳ Ͳ 10.40 197.60 0.00 0.00 0.00 0.00 197.60 10.40
#4�Rebar�(�.5�inch�Diameter)� 20'�BAR 17.00 Ͳ Ͳ Ͳ Ͳ 1.47 24.99 0.00 0.00 0.00 0.00 24.99 1.47
1"�PVC� 20'�SECTION 1.00 Ͳ Ͳ Ͳ Ͳ 4.87 4.87 0.00 0.00 0.00 0.00 4.87 4.87
2"�PVC� 20'�SECTION 1.00 Ͳ Ͳ Ͳ Ͳ 13.64 13.64 0.00 0.00 0.00 0.00 13.64 13.64
1"�PVC�Elbow EACH 3.00 0.37 1.11 1.00 3.00 0.00 0.00 4.11 1.37
2"�PVC�Elbow EACH 1.00 1.12 1.12 0.00 0.00 0.00 0.00 1.12 1.12
#16�Nails 50lb�PACK 0.50 Ͳ Ͳ Ͳ Ͳ 40.61 20.31 0.00 0.00 0.00 0.00 20.31 40.61
TOTALS LS 1 200.00 $762.31 $0.00 $42.46 $807.77LS 1 1,088 $1,624.61 $0.00 $134.93 $1,762.54
4.�DISTRIBUTION�PIPELINE�CONSTRUCTION
Construction�of�pipeline.�
FINAL�TOTALS
5.�CONCRETE�TANK�CONSTRUCTION
Construction�of�Tank

Estimate�Notes:�Equipment�Information
Quantity Unit�Cost Total�Cost Total:
2 20.00$������������ 40.00$������������5 8.55$��������������� 42.75$������������3 7.44$��������������� 22.32$������������1 7.44$��������������� 7.44$���������������1 22.42$������������ 22.42$������������
Supplier: City Location/�Address
Novey David Corner of the American Way and Via Boquete next CC Terronal, Super Baru against Inter.
Correction�Factors:�Quebrada Correction�Factors:�Pozo
Used�by: �Division�Factor� Used�by: �Division�Factor�
1,2 2 1,2,4 32,3 2 2,3,4 32 1 2,4 22 1 2,4 23 1 3 1
The�same�equipment�has�been�incorporated�into�the�estimate�and�construction�schedule�of�both�systems�therefore,�only�one�set�of�equipment�will�need�to�be�purchased�if�the�communityconstructs�the�quebrada�and�pozo�systems.�
Source
EQUIPMENT�SUMMARY:
Small�Tools:�
MacheteShovelsHammersHand�Saw
Pipe�Cutters
Pipe�Cutters
Small�Tools:�
Machete
Shovels
Hammers
134.93$����
Small�Tools:�
Machete
Shovels
Hammers
Hand�Saw
Pipe�Cutters
*A�division�factor�was�used�to�calculate�the�equipment�cost�for�each�unit.�For�example�a�shovel�is�used�in�the�construction�of�the�spring�box,�pipeline,�and�tank�therefore�the�total�cost�for�the�shovel�was�divided�by�3�and�a�third�was�assigned�to�each�line�item
http://www.ebay.com/itm/390952057618?lpid=23&item_id=39http://www.novey.com.pa/product.php?id_product=1026650http://www.novey.com.pa/product.php?id_product=1026661http://www.novey.com.pa/product.php?id_product=1033243http://www.novey.com.pa/product.php?id_product=1034979
Equipment�and�Material�Supplier!�
Hand�Saw

Estimate�Notes:�Mobilization�InformationMobilization�being�used�to�estimate�shipping�cost�and�time�to�get�materials�from�David,�Panama�to�La�Ensenda
The�following�applies�to�all�tools�and�materials:�
Travel�Route:�
Assuming�the�use�of�a�pickͲup�truck�for�land�travel�and�use�of�La�Ensenada�ferry:Cost�per�trip:
Truck: 34.50$�������������������������� � *�Assuming�$0.50�gas�and�maintanence�cost�per�mileFerry: 10.00$�������������������������� �Total: 44.50$�����������������������
David�Supplier:�Hardware�Store(s)
TruckChiriqui�Grande�Port
BoatLa�Ensenada�
~�69�miles ~�30�miles

Appendix I: Construction Schedule Construction Schedules
Quebrada System Construction Schedule ................................................................................... I Pozo System Construction Schedule ......................................................................................... II
Bolen Consulting A-10 Final Report

ID Name Duration Start Finish Successors Early Start Early Finish Late Start Late Finish
1 Mobilization 12�days Mon�5/18/15 Mon�6/1/15 Mon�5/18/15 Mon�6/1/15 Fri�5/15/15 Fri�5/29/15
2 Ship�supplies�from�David�to�La�Ensenada
12�days Mon�5/18/15 Mon�6/1/15 4,6,7,8 Mon�5/18/15 Mon�6/1/15 Fri�5/15/15 Fri�5/29/15
3 Clearing 1�day Tue�6/2/15 Tue�6/2/15 Tue�6/2/15 Tue�6/2/15 Mon�6/22/15 Tue�6/23/15
4 Clear�pipeline�route�of�all�vegetation 1�day Tue�6/2/15 Tue�6/2/15 Tue�6/2/15 Tue�6/2/15 Mon�6/22/15 Tue�6/23/15
5 Dam�Construction 12.5�days Tue�6/2/15 Thu�6/18/15 Tue�6/2/15 Thu�6/18/15 Fri�5/29/15 Tue�6/23/15
6 Remove�existing�dam 0.25�days Tue�6/2/15 Tue�6/2/15 7 Tue�6/2/15 Tue�6/2/15 Fri�5/29/15 Mon�6/1/15
7 Create�level�space�for�spring�boxͲ�excavate�current�pond�base�and�remove�excess�vegetation�to�expose�rock�face�and�spring.�
0.5�days Tue�6/2/15 Tue�6/2/15 8 Tue�6/2/15 Tue�6/2/15 Mon�6/1/15 Mon�6/1/15
8 Place�Gravel�Subbase.� 0.5�days Tue�6/2/15 Wed�6/3/15 9 Tue�6/2/15 Wed�6/3/15 Mon�6/1/15 Tue�6/2/15
9 Form�walls�and�floor.�Place�interior�pipes.
3�days Wed�6/3/15 Mon�6/8/15 10 Wed�6/3/15 Mon�6/8/15 Tue�6/2/15 Fri�6/5/15
10 Mix�and�place�concrete�(0.8�CYD) 1�day Mon�6/8/15 Tue�6/9/15 11,15 Mon�6/8/15 Tue�6/9/15 Fri�6/5/15 Mon�6/8/15
11 Let�concrete�cure�for�5Ͳ7�days 6�days Tue�6/9/15Wed�6/17/15 12 Tue�6/9/15 Wed�6/17/15 Mon�6/8/15 Tue�6/16/15
12 Strip�forms. 1�day Wed�6/17/15 Thu�6/18/15 13,16 Wed�6/17/15 Thu�6/18/15 Tue�6/16/15 Wed�6/17/15
13 Place�filter�fabric�and�gravel�around�inlet.
0.25�days Thu�6/18/15 Thu�6/18/15 Thu�6/18/15 Thu�6/18/15 Tue�6/23/15 Tue�6/23/15
14 Pipeline�Construction 10�days Mon�6/8/15Mon�6/22/15 Mon�6/8/15 Mon�6/22/15 Mon�6/15/15 Tue�6/23/15
15 Excavate�trench�to�bury�pipeͲ�also�remove�material�to�meet�planned�elevation.
2�days Tue�6/9/15 Thu�6/11/15 16 Tue�6/9/15 Thu�6/11/15 Mon�6/15/15 Wed�6/17/15
16 Connect�pipeline�from�dam�to�tank.�Cut�pipe�as�needed�and�use�noted�
1�day Thu�6/18/15 Fri�6/19/15 17 Thu�6/18/15 Fri�6/19/15 Wed�6/17/15 Thu�6/18/15
17 Fill�and�compact�excess�material�to�cover�pipe.
2�days Fri�6/19/15 Tue�6/23/15 18 Fri�6/19/15 Tue�6/23/15 Thu�6/18/15 Mon�6/22/15
18 End�of�project 0�days Tue�6/23/15 Tue�6/23/15 Tue�6/23/15 Tue�6/23/15 Tue�6/23/15 Tue�6/23/15
8 9 10 11 12 1 2 3 4 5 6 7 8 9 10 11 12 1 2 3
13 Mon 5/18 Sat 5/23 Thu 5/28 Tue 6/2 Sun 6/7 Fri 6/12 Wed 6/17 Mon 6/22
Task
Split
Milestone
Slippage
Summary
Project Summary
Rolled Up Critical
Rolled Up Critical Split
Inactive Task
Inactive Milestone
Inactive Summary
Manual Task
Duration-only
Manual Summary Rollup
Manual Summary
Start-only
Finish-only
External Tasks
External Milestone
Deadline
Critical
Critical Split
Progress
Bolen Consulting: Quebrada System Construction Schedule Critical Path
Project:�Quebrada�System

ID Task Name Duration Start Finish Successors Early Start Early Finish Late Start Late Finish
1 Mobilization 12�days Mon�5/18/15Mon�6/1/15 Mon�5/18/15 Mon�6/1/15 Mon�5/18/15 Mon�6/1/152 Ship�supplies�from�David�to�La�Ensenada 12�days Mon�
5/18/15Mon�6/1/15 8,9,4,6 Mon�5/18/15 Mon�6/1/15 Mon�5/18/15 Mon�6/1/15
3 Clearing 1�day Tue�6/2/15 Tue�6/2/15 Tue�6/2/15 Tue�6/2/15 Fri�6/26/15 Mon�6/29/154 Clear�pipeline�route�of�all�vegetation 1�day Tue�6/2/15 Tue�6/2/15 Tue�6/2/15 Tue�6/2/15 Fri�6/26/15 Mon�6/29/155 Spring�Box�Construction 15�days Tue�6/2/15 Mon�6/22/15 Tue�6/2/15 Mon�6/22/15 Tue�6/2/15 Mon�6/22/156 Remove�existing�dam 1�hr Tue�6/2/15 Tue�6/2/15 7 Tue�6/2/15 Tue�6/2/15 Tue�6/2/15 Tue�6/2/157 Create�level�space�for�spring�boxͲ�excavate
current�pond�base�and�remove�excess�vegetation�to�expose�rock�face�and�spring.
0.5�days Tue�6/2/15 Tue�6/2/15 8 Tue�6/2/15 Tue�6/2/15 Tue�6/2/15 Tue�6/2/15
8 Place�Gravel�Subbase.� 4�hrs Tue�6/2/15 Wed�6/3/15 9 Tue�6/2/15 Wed�6/3/15 Tue�6/2/15 Wed�6/3/159 Form�base,�sides,�wings,�and�top.�Place�
interior�pipes.3�days Wed�6/3/15 Mon�6/8/15 10 Wed�6/3/15 Mon�6/8/15 Wed�6/3/15 Mon�6/8/15
10 Mix�and�place�concrete�(2.1�CYD) 1�day Mon�6/8/15 Tue�6/9/15 11,16 Mon�6/8/15 Tue�6/9/15 Mon�6/8/15 Tue�6/9/1511 Let�concrete�cure�for�5Ͳ7�days 6�days Tue�6/9/15 Wed�6/17/15 12 Tue�6/9/15 Wed�6/17/15 Wed�6/10/15 Wed�6/17/1512 Strip�forms. 1�day Wed�6/17/15Thu�6/18/15 13 Wed�6/17/15 Thu�6/18/15 Thu�6/18/15 Thu�6/18/1513 Place�filter�fabric�and�gravel�around�inlet. 1�day Thu�6/18/15 Fri�6/19/15 14 Thu�6/18/15 Fri�6/19/15 Fri�6/19/15 Fri�6/19/1514 Lift�and�set�lid�over�both�chambers. 1�day Fri�6/19/15 Mon�6/22/15 Fri�6/19/15 Mon�6/22/15 Mon�6/22/15 Mon�6/22/1515 Pipeline�Construction 5�days Tue�6/9/15 Tue�6/16/15 Tue�6/9/15 Tue�6/16/15 Tue�6/9/15 Mon�6/29/1516 Excavate�trench�to�bury�pipeͲ�also�remove
material�to�meet�planned�elevation.2�days Tue�6/9/15 Thu�6/11/15 17,20 Tue�6/9/15 Thu�6/11/15 Tue�6/9/15 Thu�6/11/15
17 Connect�pipeline�from�spring�box�to�tank.�C1�day Thu�6/11/15 Fri�6/12/15 18,22 Thu�6/11/15 Fri�6/12/15 Thu�6/11/15 Fri�6/12/1518 Fill�and�compact�excess�material�to�cover�p2�days Fri�6/12/15 Tue�6/16/15 Fri�6/12/15 Tue�6/16/15 Thu�6/25/15 Mon�6/29/1519 Concrete�Storage�Tank�Construction 12.5�days Thu�6/11/15 Mon�6/29/15 Thu�6/11/15 Mon�6/29/15 Thu�6/11/15 Mon�6/29/1520 Remove�vegetation�and�create�level�space
for�tank.0.5�days Thu�6/11/15 Thu�6/11/15 21 Thu�6/11/15 Thu�6/11/15 Thu�6/11/15 Thu�6/11/15
21 Place�gravel�subbase. 0.5�days Thu�6/11/15 Fri�6/12/15 22 Thu�6/11/15 Fri�6/12/15 Thu�6/11/15 Fri�6/12/1522 Form�base,�sides,�and�top.�Place�interior�pip3�days Fri�6/12/15 Wed�6/17/15 23 Fri�6/12/15 Wed�6/17/15 Fri�6/12/15 Wed�6/17/1523 Mix�and�place�concrete�(1.2CYD) 1�day Wed�6/17/15Thu�6/18/15 24 Wed�6/17/15 Thu�6/18/15 Wed�6/17/15 Thu�6/18/1524 Let�concrete�cure�for�5Ͳ7�days 6�days Thu�6/18/15 Fri�6/26/15 25 Thu�6/18/15 Fri�6/26/15 Thu�6/18/15 Fri�6/26/1525 Strip�forms. 1�day Fri�6/26/15 Mon�6/29/15 26,27 Fri�6/26/15 Mon�6/29/15 Fri�6/26/15 Mon�6/29/1526 Attach�external�piping 0.5�days Mon�6/29/15Mon�6/29/15 Mon�6/29/15 Mon�6/29/15 Mon�6/29/15 Mon�6/29/1527 Lift�and�set�lid�over�tank. 0.5�days Mon�6/29/15Mon�6/29/15 28 Mon�6/29/15 Mon�6/29/15 Mon�6/29/15 Mon�6/29/1528 End�of�Project 0�days Mon�6/29/15Mon�6/29/15 Mon�6/29/15 Mon�6/29/15 Mon�6/29/15 Mon�6/29/15 6/29
S M W F S T T S M W F S T T S M W F S T T S M W F15 May 17, '15 May 24, '15 May 31, '15 Jun 7, '15 Jun 14, '15 Jun 21, '15 Jun 28, '15
Task
Split
Milestone
Summary
Project Summary
Inactive Task
Inactive Milestone
Inactive Summary
Manual Task
Duration-only
Manual Summary Rollup
Manual Summary
Start-only
Finish-only
External Tasks
External Milestone
Deadline
Critical
Critical Split
Progress
Manual Progress
Bolen Consulting: Pozo System Construction Schedule Critical Path
Project:�Pozo�System

Appendix J: Engineering Drawings & System Design Maps Engineering Drawings
Quebrada System: Quebrada Dam Design ................................................................................. I Pozo System: Spring Box Design .............................................................................................. II Pozo System: Concrete Tank Design .........................................................................................III Water System Design Maps Quebrada System: Distribution Line Map .................................................................................. IV Quebrada System: Distribution Line Bearings ............................................................................ V Pozo System: Aqueduct Map .................................................................................................... VI Pozo System: Aqueduct Bearings ............................................................................................ VII
Bolen Consulting A-11 Final Report

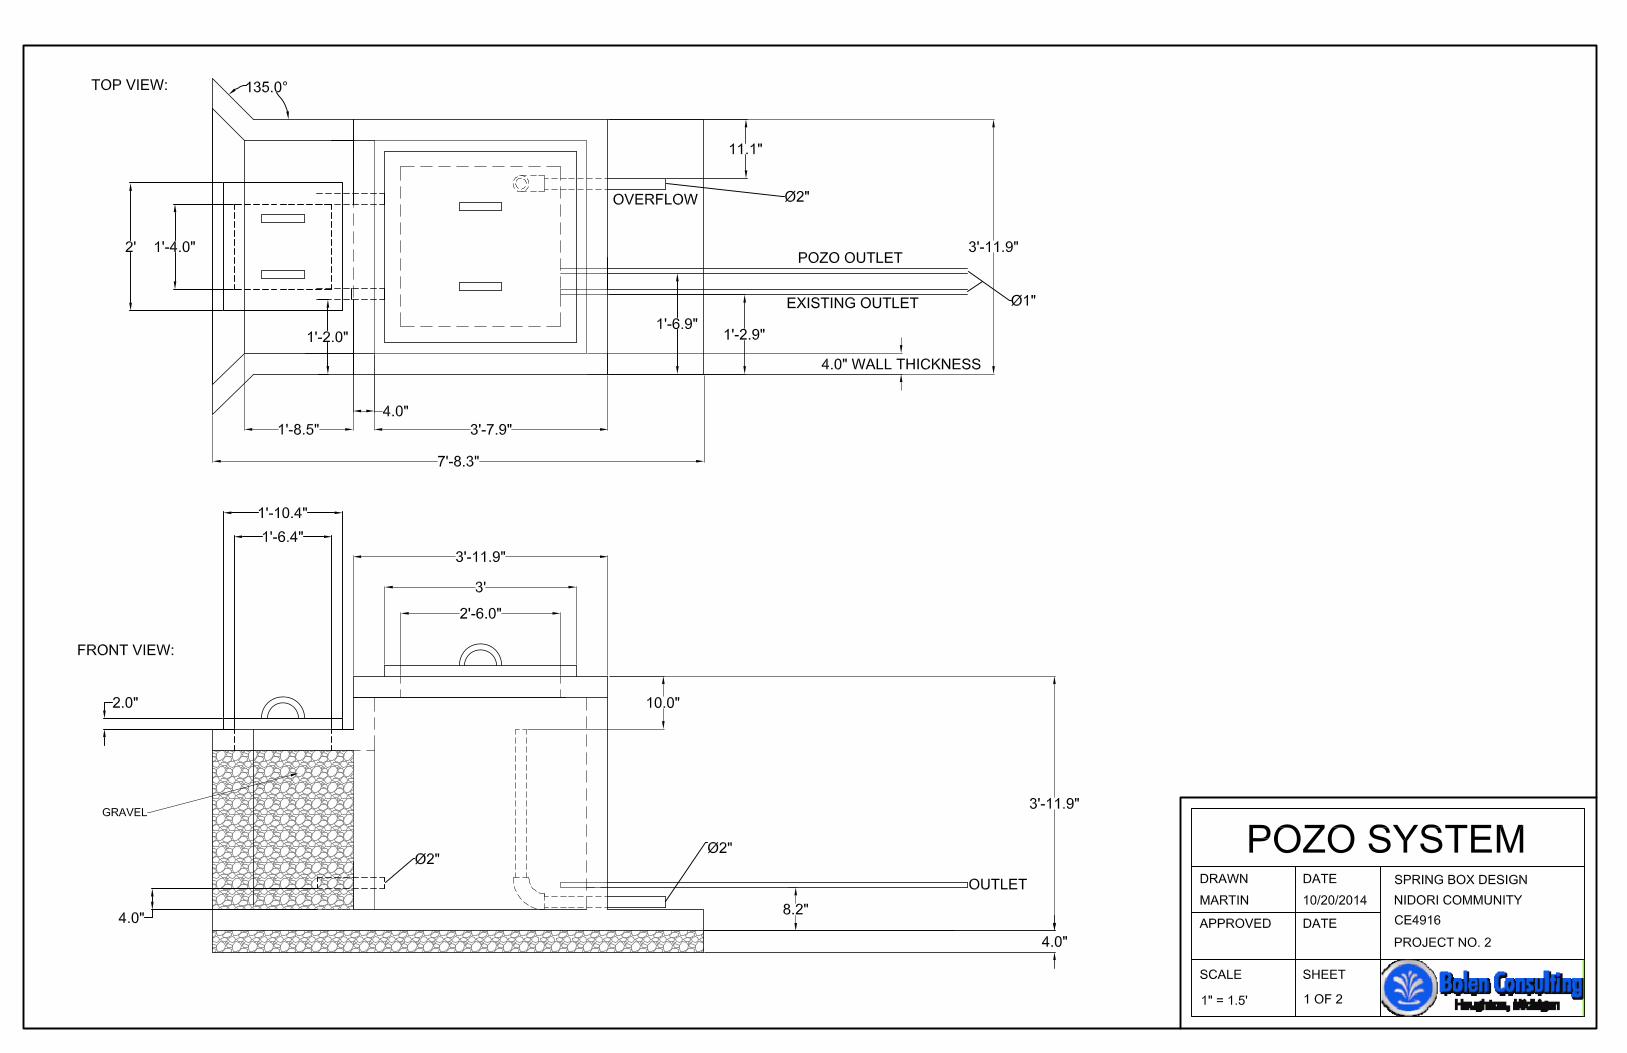

TREE
QuebradaSource
LargeBoulder
House 1
House 2
House 3 House 4 House 5
Air Release Valve
Cleanout Pipe
Cleanout PipeNOTES:1) TOTAL PIPE LENGTH IS 660 FEET.
2) LAYOUT REQUIRES THE FOLLOWING JOINTS:STRAIGHT COUPLINGS: 13 TOTAL45 DEGREE ELBOW: 17 TOTAL90 DEGREE ELBOW: 2 TOTALTEE: 1 TOTAL
LEGEND
These standard symbols will
be found in the drawing.
SURVEY ROUTE
45 DEGREE ELBOW
TEE
STRAIGHT COUPLING
UNBURIED PIPELINE
90 DEGREE ELBOW
BURIED PIPELINE
0 50 100 150
SCALE: 1" = 50'
DRAWN DATE
APPROVED DATE
SCALE SHEET\\mtucifs2.iso.mtu.edu\home\Desktop\Bolen Consulting.png
QUEBRADA SYSTEMPIPELINE LAYOUTNIDORI COMMUNITYCE4916
PROJECT NO. 1
1 OF 21"=50'
10/20/2014ANDERSON

TREE
QuebradaSource
LargeBoulder
House 1
House 2
House 3 House 4
House 5
Air Release Valve
Cleanout Pipe
Cleanout Pipe
0 50 100 150
SCALE: 1" = 50'
NOTES:1) TOTAL PIPE LENGTH IS 660 FEET.
2) LAYOUT REQUIRES THE FOLLOWING JOINTS:STRAIGHT COUPLINGS: 13 TOTAL45 DEGREE ELBOW: 17 TOTAL90 DEGREE ELBOW: 2 TOTALTEE: 1 TOTAL
LEGEND
These standard symbols will
be found in the drawing.
SURVEY ROUTE
45 DEGREE ELBOW
TEE
STRAIGHT COUPLING
UNBURIED PIPELINE
90 DEGREE ELBOW
BURIED PIPELINE
DRAWN DATE
APPROVED DATE
SCALE SHEET\\mtucifs2.iso.mtu.edu\home\Desktop\Bolen Consulting.png
QUEBRADA SYSTEMPIPELINE LAYOUTNIDORI COMMUNITYCE4916
PROJECT NO. 1
2 OF 21"=50'
10/20/2014ANDERSON

STORAGE TANK
0 50 100 150
POZO SOURCESCALE: 1" = 50'
LEGEND
These standard symbols will
be found in the drawing.
SURVEY ROUTE
90 DEGREE ELBOW
45 DEGREE ELBOW
STRAIGHT COUPLING
PIPELINE
NOTES:1) TOTAL PIPE LENGTH IS 340 FEET.
2) LAYOUT REQUIRES THE FOLLOWING JOINTS:STRAIGHT COUPLINGS: 14 TOTAL45 DEGREE ELBOW: 1 TOTAL90 DEGREE ELBOW: 1 TOTAL
3) AN ADDITIONAL FOUR FEET OF PVC USED TO RAISEAND CONNECT PIPELINE TO TANK.
SIDEWALK
STREAM
DRAWN DATE
APPROVED DATE
SCALE SHEET\\mtucifs2.iso.mtu.edu\home\Desktop\Bolen Consulting.png
POZO SYSTEMPIPELINE LAYOUTNIDORI COMMUNITYCE4916
PROJECT NO. 2
1 OF 21"=50'
10/20/2014ANDERSON


Appendix K: Construction Manual See following pages
Bolen Consulting A-12 Final Report

Quebrada Distribution Line System Construction Manual The following manual addresses the steps to complete the construction of a distribution line system in the Nidori Community. Phase 1: Material and Tool Procurement (Mobilization)
a) The following tools and materials must be purchased and shipped to the La Ensenada community. The materials will then need to be carried to the construction location.
Item Unit: Quantity
#16 Nails 50 LB PACK 1.00
#4 Rebar ( .5 inch Diameter) 20 FT BAR 4.00
1" "Y" Joint EACH 2.00
1" Air Release Valve EACH 1.00
1" Cap EACH 2.00
1" Control Valve EACH 1.00 1" PVC Elbow (45 Degrees) EACH 17.00 1" PVC Elbow (90 Degrees) EACH 5.00 1" PVC Tee EACH 1.00 1" PVC Union EACH 13.00 1" Threaded PVC 20 FT SECTION 1.00 1"PVC (SDR 21) 20 FT SECTION 35.00 2 X 6 Boards EACH 2.00 2" PVC 20 FT SECTION 1.00 2"-1" Reduction EACH 1.00 Gravel CFT 14.50 Plywood Forms EACH 2.00 Portland Cement SACK (94lb) 4.00 PVC Glue 16 OUNCES 2.00 Sand CFT 7.50
Phase 2: Clearing
a) The site must be prepared for construction. Clear all vegetation around the
current source and along the pipeline route as shown distribution maps included in Appendix J. Clear a minimum of 1 meter (approximately 1 yard) on either side of intended path using machetes and shovels. Remove all large obstructions as needed.
b) Maintain cleared route throughout construction.

Quebrada Distribution Line System Construction Manual Phase 3: Dam Construction
a) Remove existing dam and move to a location up stream to stop flow of water
or divert from construction area. Allow area to drain.
b) Level the current area in which the source is pooling.
c) Place gravel sub base, approximately 4 inches deep, over level space.
d) Using plywood, 2” by 6” boards, and small tools, cut and assemble forms to construct the dam. Cut a hole in the forms and place 2” PVC section within form with 6-8 inches of over-hang toward the source.
Forms should be cut as follows and assembled as shown Figure 1:
For main wall: Quantity Materials Dimension
1 2” x 6” Board Length= 4’ 1 Plywood Width=1’-10” Length= 4’ 2 Plywood Width=2’-8” Length= 4’ 2 Plywood Width=1’=6” Length= 4’ 1 Plywood Width=2’-5” Length= 4’ 2 Plywood Width=7” Length= 2’-8”
For base section
Quantity Materials Dimension 1 Plywood Width=1’-8” Length= 5” 1 Plywood Width=6” Length= 5” 1 Plywood Width=1’-8” Length= 3’-2”

Quebrada Distribution Line System Construction Manual
Figure 1: Form Layout for Quebrada Dam
e) Set rebar with in forms at 1-foot intervals.
f) Mix concrete according to a 1:2:3 mix ratio. To complete construction, 0.9 cubic yards are required. Therefore, 4 sacks of cement, 56 kubos of sand, and 84 kubos of gravel must be mixed together. Additionally, 23 gallons of water will be needed.
It is recommended that required materials mentioned above are measured out and then mixed using a shovel and kubo. This can be done by adding 1 shovel of cement, 2 of sand, and 3 or gravel. Lastly, add water as needed to completely hydrate the concrete. Place the concrete in the forms and level off once full. Cover the top of the form with wet cloth for continued hydration and protection from possible rain.

Quebrada Distribution Line System Construction Manual
g) Allow concrete to cure for 5-7 days.
h) Remove forms once concrete is set.
i) Place wire mesh over inlet and place gravel around the edge of the concrete
floor and inlet pipe to collect large particles and protect dam against erosion. Phase 4: Pipeline Construction
a) Connect pipe starting at the inlet pipe. Glue each joint and PVC section using
the PVC glue.
b) The first joint will be a 2” to 1” reduction. The remaining pipe will consist of 1” PVC sections connected using the joints shown on the distribution map in Appendix J. Use the pipe cutters, to cut PVC sections when necessary and noted on the map. Insert a shut off valve toward the start of the system
c) Insert an air release valve at the highest elevation of the line as shown on the
map.
d) Construct and install 2 clean out assemblies at the joints also specified on the map. This occurs at the two low points of the distribution line. Each clean out assembly should consist of a shut off valve, followed by a wye-joint, and ending with a capped pipe pointing downward as shown in Figure 2 below.
Figure 2: Clean out pipe assembly.

Quebrada Distribution Line System Construction Manual
e) Bury the pipeline whenever possible or at least in the areas denoted by the blue line on the distribution map to protect the distribution line from foot traffic and machete use.
f) Add a tap at the end of the line or have community members construct
individual pipelines to connect completed line to homes.
g) Once pipeline is completely constructed, remove temporary up stream dam and allow water to flow to the concrete dam. Ensure that all valves are open and pipes are sealed before using the system.

Pozo Aqueduct System Construction Manual
Phase 1: Material and Tool Procurement (Mobilization)
a) The following tools and materials must be purchased and shipped to the La Ensenada community. The materials will then need to be carried to the construction location.
Item Unit: Quantity #16 Nails 50 LB PACK 1.00 #4 Rebar ( .5 inch Diameter) 20 FT BAR 29.00 1" PVC Elbow (45 Degrees) EACH 1.00 1" PVC Elbow (90 Degrees) EACH 4.00 1" PVC Union EACH 14.00 1"PVC (SDR 21) 20 FT SECTION 19.00 2 X 4 Boards EACH 10.00 2 X 4 Boards EACH 16.00 2" PVC 20 FT SECTION 2.00 2" PVC Elbow (90 Degrees) EACH 2.00 Gravel CFT 130.00 Plywood Forms EACH 13.00 Plywood Forms EACH 8.00 Portland Cement SACK (94lb) 28.00 PVC Glue 16 OUNCES 2.00 Sand CFT 56.50
Phase 2: Clearing
a) The site must be prepared for construction. Clear all vegetation around the
current source and along the pipeline route as shown distribution maps included in Appendix J. Clear a minimum of 1 meter (approximately 1 yard) on either side of intended path using machetes and shovels. Remove all large obstructions as needed.
b) Maintain cleared route throughout construction.
Phase 3: Spring Box Construction
a) Remove existing dam and block the flow of water or divert from construction
area. Allow area to drain.
b) Level the current area in which the source is pooling.
c) Place gravel sub base, approximately 4 inches deep, over level space.
Pozo Aqueduct System Construction Manual
d) Using plywood, 2” by 4” boards, and small tools, cut and assemble forms to construct the spring box starting with the base and then the walls and covers. This will have to be constructed in 2 parts.
Part One Forms should be as follows: For Spring Box Base:
Quantity Materials Dimension 4 Plywood Width=5” Length=7’-9”
Part Two Forms should be as follows:
Quantity Materials Dimension 4 Plywood Width=3’-5” Length=4’-0.5” 4 Plywood Width=3’-5” Length=3’-3.5” 2 Plywood Width=7” Length=2’-6” 2 Plywood Width=9” Length=2’-6” 2 Plywood Width=1’-8” Length=2’-6” 2 Plywood Width=1’-6” Length=2’-6” 2 Plywood Width=1’ Length=2’-6”
First form and construct the concrete floor using steps F-I explained below. The forms should be arranged to create a square frame. The floor will only require 0.4 cubic yards of the concrete. Use 2” by 4” inch board for additional support and reinforcement where needed. Then form and construct the spring box walls and covers using steps E-K below and setting forms as shown in Figure 1. The cover and removable lids will need to be cast in a separate area and moved to the spring box later on.
Pozo Aqueduct System Construction Manual
Figure 1: Spring box wall form layout. Reuse and cut the base forms from Part One to frame the cover and removal lids based on the dimensions provided on the engineering drawings. These forms should create a square frame similar to the base. Rebar loops will need to be inserted into the cover to move it once cured. Rebar loops are also added to the covers to serve as handles. Use 2” by 4” inch board for additional support and reinforcement where needed
e) Cut and place interior pipes as shown in the engineering drawing included in
Appendix J. Interior piping includes: i. Current 1” existing outlet
ii. A 20 foot PVC section for the new outlet with a 1 foot extension within the spring box
iii. Large 2” diameter PVC pipe to capture overflow. Overflow pipe is a L formation created using two 3-foot sections and 1 elbow joint
iv. A 2-foot section of 2” diameter PVC to connect the two chambers with a 10” overlap in each chamber.
f) Set rebar with in forms. For the Base and cover rebar should be placed in
both directions at 8” spaced intervals. For the walls, vertical rebar bars should be placed every 1 foot.

Pozo Aqueduct System Construction Manual
g) Mix concrete according to a 1:2:3 mix ratio. To complete construction, 2.0 cubic yards are required. Therefore, 9 sacks of cement, 135 kubos of sand, and 200 kubos of gravel must be mixed together. Additionally,51 gallons of water will be needed.
It is recommended that required materials mentioned above are measured out and then mixed using a shovel and kubo. This can be done by adding 1 shovel of cement, 2 of sand, and 3 or gravel. Lastly, add water as needed to completely hydrate the concrete. Place the concrete in the forms and level off once full. Cover the top of the form with wet cloth for continued hydration and protection from possible rain.
h) Allow concrete to cure for 5-7 days.
i) Remove forms once concrete is set.
j) Place gravel within filter chamber.
k) Place top over both chambers and place removal lids. Phase 4: Pipeline Construction
a) Excavate trench to bury pipe. Remove excess material at start of system as
noted by the blue line on the pipeline map included in Appendix J.
b) Connect pipe starting at the inlet pipe. Glue each joint and PVC section using the PVC glue.
Pipeline will consist of 1” PVC sections connected using the joints shown on the distribution map in Appendix J. Use the pipe cutters, to cut PVC sections when necessary and noted on the map.
c) Fill and compact excess material to cover pipeline.
Phase 5: Concrete Tank Construction
a) Remove any excess vegetation and level location for tank.
b) Place gravel sub base, approximately 4 inches deep, over level space.
Pozo Aqueduct System Construction Manual
c) Using plywood, 2” by 4” boards, and small tools, cut and assemble forms to construct the spring box starting with the base and then the walls and cover. This will have to be constructed in 2 parts.
Part One Forms should be as follows: For tank base:
Quantity Materials Dimensions 1 Plywood Width= 8” Length= 6’-9” 1 Plywood Width= 9.5”’ Length= 6’-9” 4 Plywood Width= 9.5”’ Length= 4’-4”
Part Two Forms should be as follows:
Quantity Materials Dimension 3 Plywood Width= 3’-7” Length= 6’ 1 Plywood Width= 3’-8” Length= 6’ 3 Plywood Width= 3’-7” Length= 6’-9” 1 Plywood Width= 3’-8” Length= 6’-9”
First form and construct the concrete floor using steps D-I explained below. The forms should be arranged as shown in Figure 2. The floor will only require 1.0 cubic yards of the concrete. Use 2” by 4” inch board for additional support and reinforcement where needed.
Figure 2: Tank base concrete form layout

Pozo Aqueduct System Construction Manual
Then form and construct the tank walls and cover using steps D-I below and setting forms as shown in Figures 3. The cover and removable lids will need to be cast in a separate area and moved to the spring box later on. Reuse and cut the base forms from Part One to frame the cover and removal lids based on the dimensions provided on the engineering drawings. Rebar loops will need to be inserted into the cover to move it once cured. Rebar loops are also added to the covers to serve as handles. Use 2” by 4” inch board for additional support and reinforcement where needed.
Figure 4: Tank wall form layout
d) Cut and place interior pipes as shown in the engineering drawing included in
Appendix J. Interior piping includes: i. 1” inlet pipe entering at the top the east tank wall.
ii. 2” PVC overflow pipe exiting from the top of the west tank wall iii. 1” tap pipe approximately 3 feet in length, located on the west tank
wall and with a 32” overlap on the inside and outside of the tank. iv. 1” air release pipe located in the cover of the tank with a 1” elbow
located at the end.
Pozo Aqueduct System Construction Manual
e) Set rebar with in forms. For the base and cover rebar should be placed in both directions at 8” spaced intervals. For the walls, vertical rebar bars should be placed every 1 foot.
f) Mix concrete according to a 1:2:3 mix ratio. To complete construction, 2.0
cubic yards are required. Therefore, 19 sacks of cement, 288 kubos of sand, and 429 kubos of gravel must be mixed together. Additionally, 108 gallons of water will be needed.
It is recommended that required materials mentioned above are measured out and then mixed using a shovel and kubo. This can be done by adding 1 shovel of cement, 2 of sand, and 3 or gravel. Lastly, add water as needed to completely hydrate the concrete. Place the concrete in the forms and level off once full. Cover the top of the form with wet cloth for continued hydration and protection from possible rain.
g) Allow concrete to cure for 5-7 days.
h) Remove forms once concrete is set.
i) Place top over the tank as well as removal lids
j) Once the tank is assembly is complete. The system can be opened for use.

Appendix L: Maintenance Manual See following pages
Bolen Consulting A-13 Final Report
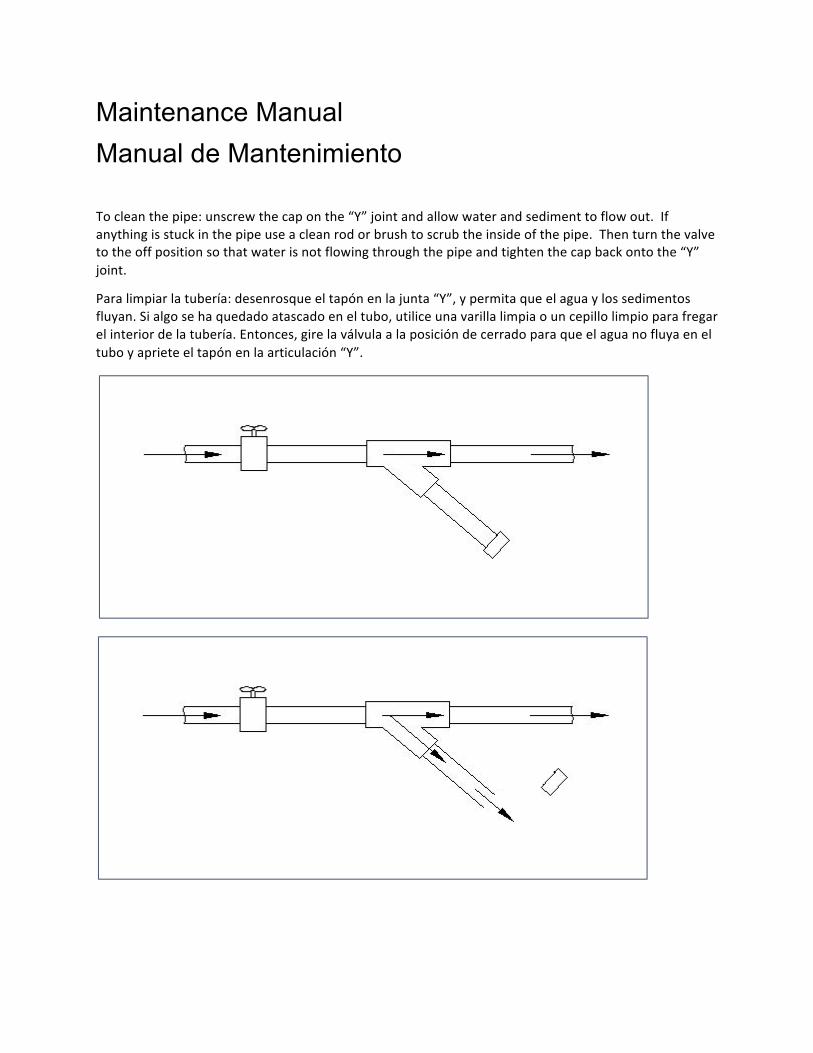
Maintenance Manual Manual de Mantenimiento !
To!clean!the!pipe:!unscrew!the!cap!on!the!“Y”!joint!and!allow!water!and!sediment!to!flow!out.!!If!anything!is!stuck!in!the!pipe!use!a!clean!rod!or!brush!to!scrub!the!inside!of!the!pipe.!!Then!turn!the!valve!to!the!off!position!so!that!water!is!not!flowing!through!the!pipe!and!tighten!the!cap!back!onto!the!“Y”!joint.!
Para!limpiar!la!tubería:!desenrosque!el!tapón!en!la!junta!“Y”,!y!permita!que!el!agua!y!los!sedimentos!fluyan.!Si!algo!se!ha!quedado!atascado!en!el!tubo,!utilice!una!varilla!limpia!o!un!cepillo!limpio!para!fregar!el!interior!de!la!tubería.!Entonces,!gire!la!válvula!a!la!posición!de!cerrado!para!que!el!agua!no!fluya!en!el!tubo!y!apriete!el!tapón!en!la!articulación!“Y”.!
!
!
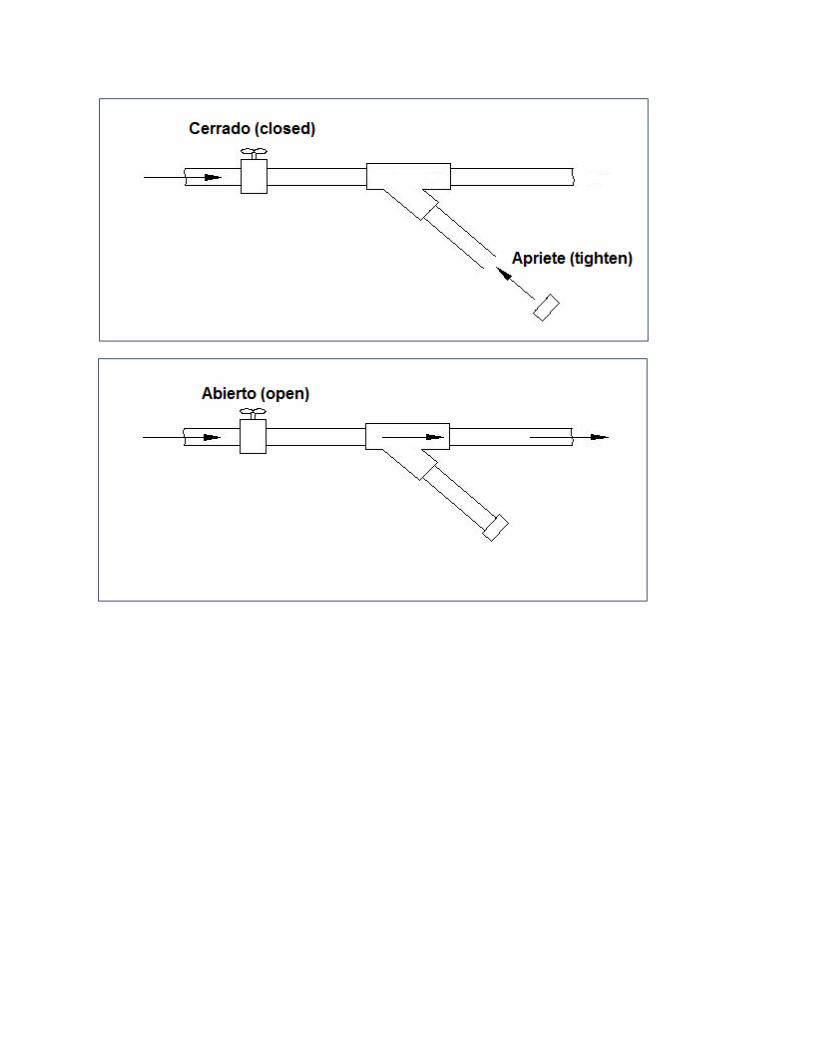
!
!
! !

If!water!is!not!flowing!through!the!system:!There!may!be!an!air!bubble!in!the!pipe,!check!to!make!sure!the!air!release!valve!is!not!stuck.!
Si!el!agua!no!fluye!en!el!sistema:!Puede!haber!una!burbuja!de!aire!en!el!tubo,!compruebe!que!la!válvula!de!escape!de!aire!no!está!bloqueada.!
! !
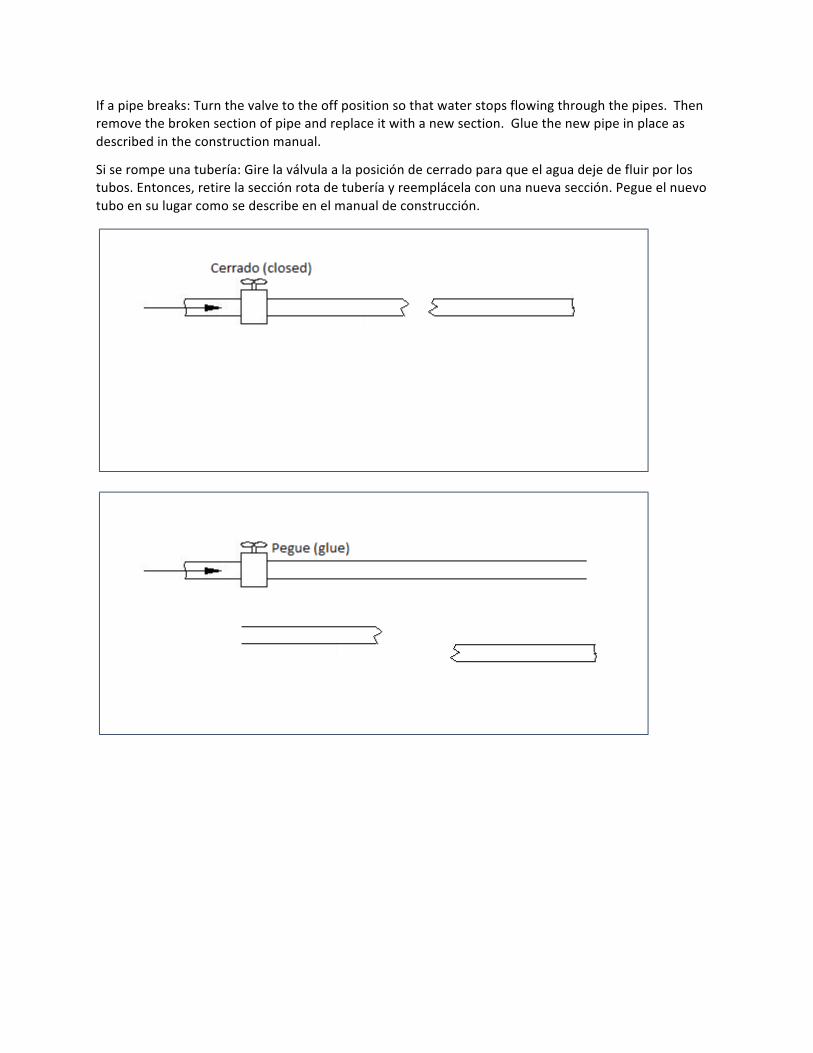
If!a!pipe!breaks:!Turn!the!valve!to!the!off!position!so!that!water!stops!flowing!through!the!pipes.!!Then!remove!the!broken!section!of!pipe!and!replace!it!with!a!new!section.!!Glue!the!new!pipe!in!place!as!described!in!the!construction!manual.!
Si!se!rompe!una!tubería:!Gire!la!válvula!a!la!posición!de!cerrado!para!que!el!agua!deje!de!fluir!por!los!tubos.!Entonces,!retire!la!sección!rota!de!tubería!y!reemplácela!con!una!nueva!sección.!Pegue!el!nuevo!tubo!en!su!lugar!como!se!describe!en!el!manual!de!construcción.!
!
!

!
! !

To!clean!the!tank:!Block!the!inlet!pipe!in!the!springbox!so!that!water!is!not!flowing!into!the!tank,!then!open!the!spigot!on!the!tank!and!allow!the!tank!to!drain.!!Once!there!is!no!more!water!in!the!tank!scrub!the!tank!with!clean!water!and!a!clean!brush!until!all!debris!is!removed.!!Then!allow!the!tank!to!refill!
Para!limpiar!el!tanque:!Bloquee!el!tubo!de!entrada!en!la!toma!para!que!el!agua!no!fluya!al!tanque,!entonces,!abra!la!pluma!del!tanque!para!que!el!tanque!se!vacíe.!Cuando!no!haya!más!agua!en!el!tanque,!friegue!el!tanque!con!agua!limpia!y!un!cepillo!limpio!hasta!que!se!retire!toda!la!suciedad.!Por!último!deje!que!el!tanque!se!vuelva!a!llenar.!
!
!
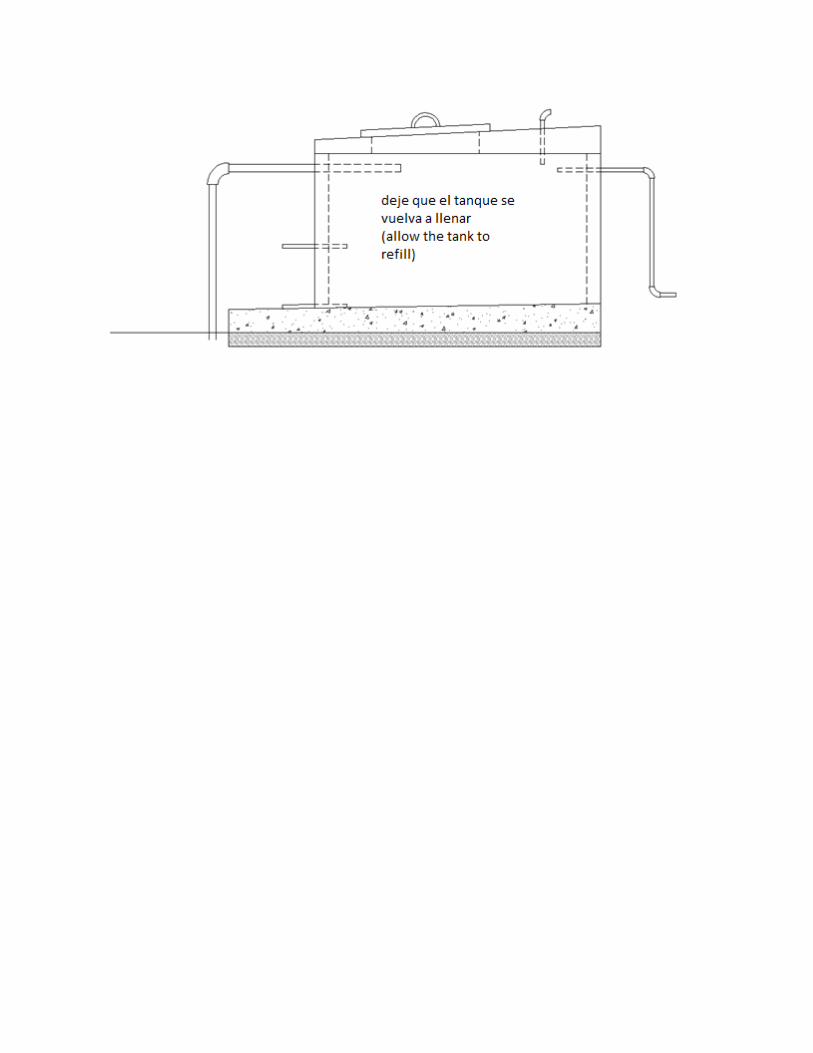
!
! !

To!clean!the!springbox:!Open!up!the!overflow!on!the!springbox!to!allow!the!springbox!to!drain.!!Then!scrub!the!inside!of!the!springbox!with!a!clean!brush!and!clean!water.!!Remove!and!rinse!the!gravel!with!clean!water!then!put!the!gravel!back!in!place!and!close!the!overflow!to!allow!the!springbox!to!refill!with!water!
Para!limpiar!la!toma:!Abra!el!tapón!de!desbordamiento!en!la!toma!para!permitir!que!la!toma!drene.!Luego!frote!el!interior!de!la!toma!con!un!cepillo!limpio!y!agua!limpia.!Saque!la!grava!de!la!toma!y!enjuague!la!grava!con!agua!limpia.!A!continuación,!ponga!la!grava!en!su!lugar!y!cierre!tapón!del!desbordamiento!para!permitir!que!la!toma!se!vuelva!a!llenar!con!agua!
!
!

!
!