Embed Size (px)
Citation preview

National Aeronautics andSpace Administration
NASA Technical Memorandum 104276
Water Tunnel Flow VisualizationStudy of a 4.4% Scale X-31Forebody
Brent R. Cobleigh and John Del Frate
September 1994
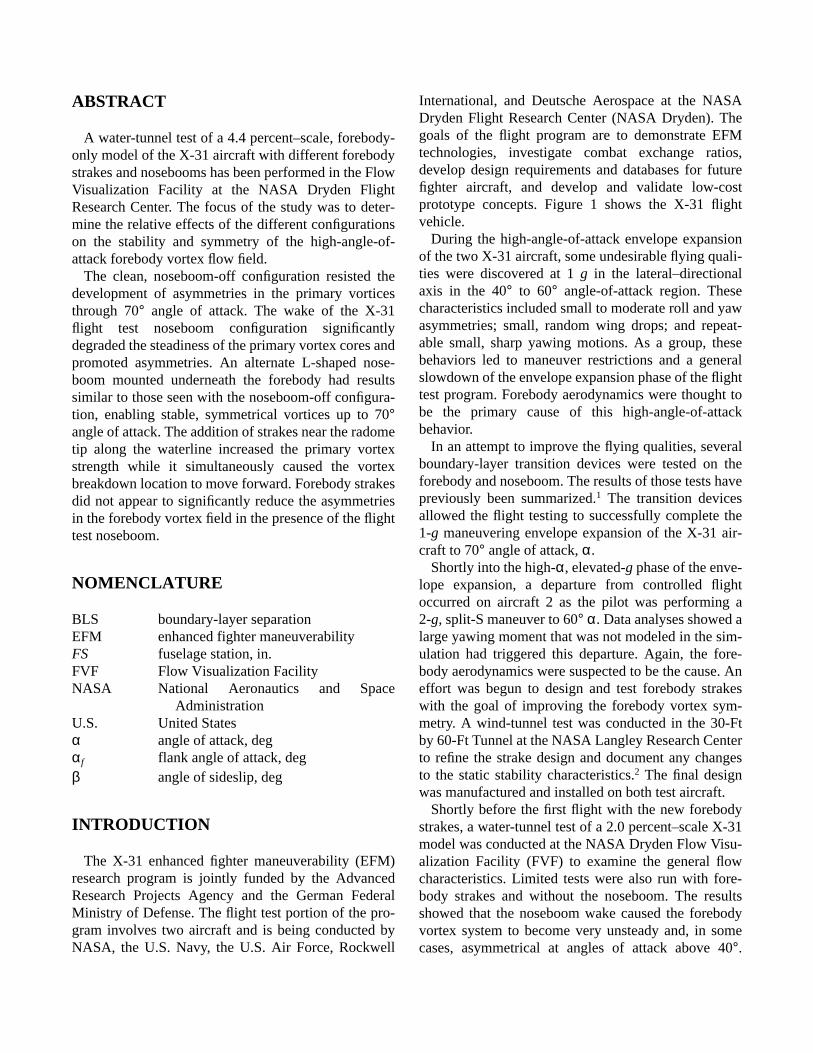
ABSTRACT
A water-tunnel test of a 4.4 percent–scale, forebody-only model of the X-31 aircraft with different forebodystrakes and nosebooms has been performed in the FlowVisualization Facility at the NASA Dryden FlightResearch Center. The focus of the study was to deter-mine the relative effects of the different configurationson the stability and symmetry of the high-angle-of-attack forebody vortex flow field.
The clean, noseboom-off configuration resisted thedevelopment of asymmetries in the primary vorticesthrough 70° angle of attack. The wake of the X-31flight test noseboom configuration significantlydegraded the steadiness of the primary vortex cores andpromoted asymmetries. An alternate L-shaped nose-boom mounted underneath the forebody had resultssimilar to those seen with the noseboom-off configura-tion, enabling stable, symmetrical vortices up to 70°angle of attack. The addition of strakes near the radometip along the waterline increased the primary vortexstrength while it simultaneously caused the vortexbreakdown location to move forward. Forebody strakesdid not appear to significantly reduce the asymmetriesin the forebody vortex field in the presence of the flighttest noseboom.
NOMENCLATURE
BLS boundary-layer separationEFM enhanced fighter maneuverabilityFS fuselage station, in.FVF Flow Visualization FacilityNASA National Aeronautics and Space
AdministrationU.S. United Statesα angle of attack, degαf flank angle of attack, degβ angle of sideslip, deg
INTRODUCTION
The X-31 enhanced fighter maneuverability (EFM)research program is jointly funded by the AdvancedResearch Projects Agency and the German FederalMinistry of Defense. The flight test portion of the pro-gram involves two aircraft and is being conducted byNASA, the U.S. Navy, the U.S. Air Force, Rockwell
International, and Deutsche Aerospace at the NASADryden Flight Research Center (NASA Dryden). Thegoals of the flight program are to demonstrate EFMtechnologies, investigate combat exchange ratios,develop design requirements and databases for futurefighter aircraft, and develop and validate low-costprototype concepts. Figure 1 shows the X-31 flightvehicle.
During the high-angle-of-attack envelope expansionof the two X-31 aircraft, some undesirable flying quali-ties were discovered at 1g in the lateral–directionalaxis in the 40° to 60° angle-of-attack region. Thesecharacteristics included small to moderate roll and yawasymmetries; small, random wing drops; and repeat-able small, sharp yawing motions. As a group, thesebehaviors led to maneuver restrictions and a generalslowdown of the envelope expansion phase of the flighttest program. Forebody aerodynamics were thought tobe the primary cause of this high-angle-of-attackbehavior.
In an attempt to improve the flying qualities, severalboundary-layer transition devices were tested on theforebody and noseboom. The results of those tests havepreviously been summarized.1 The transition devicesallowed the flight testing to successfully complete the1-g maneuvering envelope expansion of the X-31 air-craft to 70° angle of attack,α.
Shortly into the high-α, elevated-g phase of the enve-lope expansion, a departure from controlled flightoccurred on aircraft 2 as the pilot was performing a2-g, split-S maneuver to 60° α. Data analyses showed alarge yawing moment that was not modeled in the sim-ulation had triggered this departure. Again, the fore-body aerodynamics were suspected to be the cause. Aneffort was begun to design and test forebody strakeswith the goal of improving the forebody vortex sym-metry. A wind-tunnel test was conducted in the 30-Ftby 60-Ft Tunnel at the NASA Langley Research Centerto refine the strake design and document any changesto the static stability characteristics.2 The final designwas manufactured and installed on both test aircraft.
Shortly before the first flight with the new forebodystrakes, a water-tunnel test of a 2.0 percent–scale X-31model was conducted at the NASA Dryden Flow Visu-alization Facility (FVF) to examine the general flowcharacteristics. Limited tests were also run with fore-body strakes and without the noseboom. The resultsshowed that the noseboom wake caused the forebodyvortex system to become very unsteady and, in somecases, asymmetrical at angles of attack above 40°.

2
Although the addition of the strakes slightly reducedthis unsteadiness, it appeared that the noseboom wakewas blanketing the forebody. Even though the resultswere repeatable, the small model size and resultinglack of geometric detail brought the accuracy of theresults into question.
In order to better understand the forebody aerody-namics with differing noseboom and strake configura-tions, a 4.4 percent–scale model of the X-31 forebodywas built for continued testing in the NASA DrydenFVF. The test results were needed in order to make rec-ommendations on what forebody changes should beinvestigated if the X-31 flight vehicle was unableto achieve its goals with the strake-installedconfiguration.
WATER-TUNNEL SUITABILITY
Flow visualization in low-speed water tunnels hasbeen an effective method for the analysis of complexflow fields. Although this type of test is conducted atmuch lower Reynolds numbers than those of flight,there are types of flow which are relatively insensitiveto Reynolds number. Phenomena such as vortices andtheir generation, interaction, and breakdown are in thiscategory and are ideally studied in a facility such as awater tunnel. Erickson concluded that flow fields thatare vortex-dominated are similar regardless of Rey-nolds number.3 The flow field surrounding the X-31configuration at high angles of attack can be character-ized as vortex-dominated; therefore, Erickson’s find-ings provide confidence that the results from the water-tunnel test are reliable. Erickson also noted thatalthough the water tunnel is not appropriate for obtain-ing quantitative data about Reynolds number–sensitiveeffects such as boundary-layer separation (BLS) loca-tion, it can be effectively used to evaluate qualitativechanges in the flow field caused by changes in aircraftconfiguration.3
MODEL DESCRIPTION
The subject of this test was a 4.4 percent–scale modelof the X-31 forebody. Figure 2 shows the model withthe N3 noseboom and the S1 strakes installed. Only theforward 40 percent of the flight vehicle was modeled inorder to place the largest possible representation of theX-31 forebody in the FVF for maximum fidelity and
detail of the model and the resulting flow field. The aftend of the model terminated just aft of the canopy, sothe complete forebody, canards, canopy, and inlet weremodeled. Although the wing leading-edge strakescome forward of the aft end of the canopy on the full-scale aircraft, the lack of the wing and aft fuselage onthe model would have corrupted any effect of thestrakes. Thus, the leading-edge strakes were notincluded on the model.
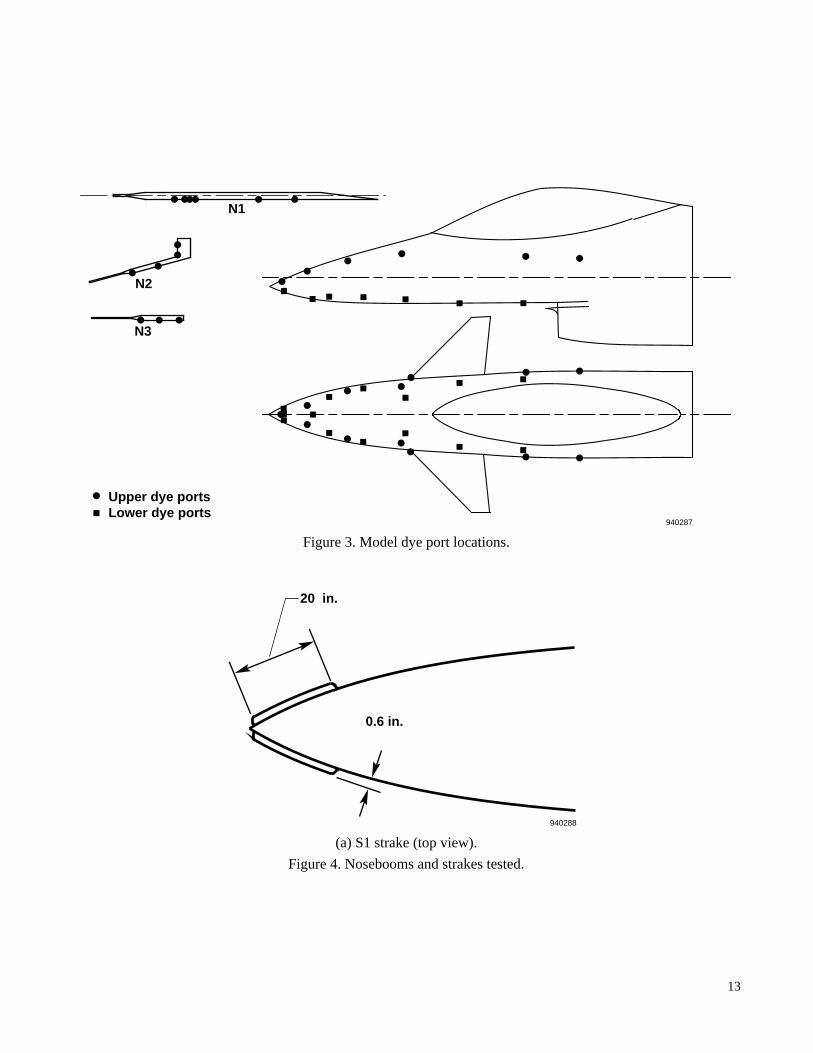
The model was fabricated by stacking brass tem-plates of the fuselage cross sections every 0.44 in. andsandwiching high-density styrofoam between the tem-plates. Brass alignment rods were used to hold all ofthe pieces together. The foam was then shaped flushwith the templates. The model was covered using avery thin coating of fiberglass cloth and epoxy and waspainted white. The forebody was marked with fuselagestation,FS, reference lines every 10 full-scale inches.The nose tip of the aircraft was located atFS –20.Stainless steel tubes with a 0.024 in. inner diameterwere installed through the aft end of the model. Thesetubes carried the different colors of dye and exited atthe dye port locations shown in figure 3.
The canard was adjustable from outside of the watertunnel using an internal bell crank–style adjustingdevice. All of the nosebooms tested had dye-carryingcapability, which allowed investigation of the nose-boom wake. The lower lip of the engine inlet wasdrooped 26° to duplicate the X-31 high-α configura-tion. A mass flow meter regulated the flow through theinlet.
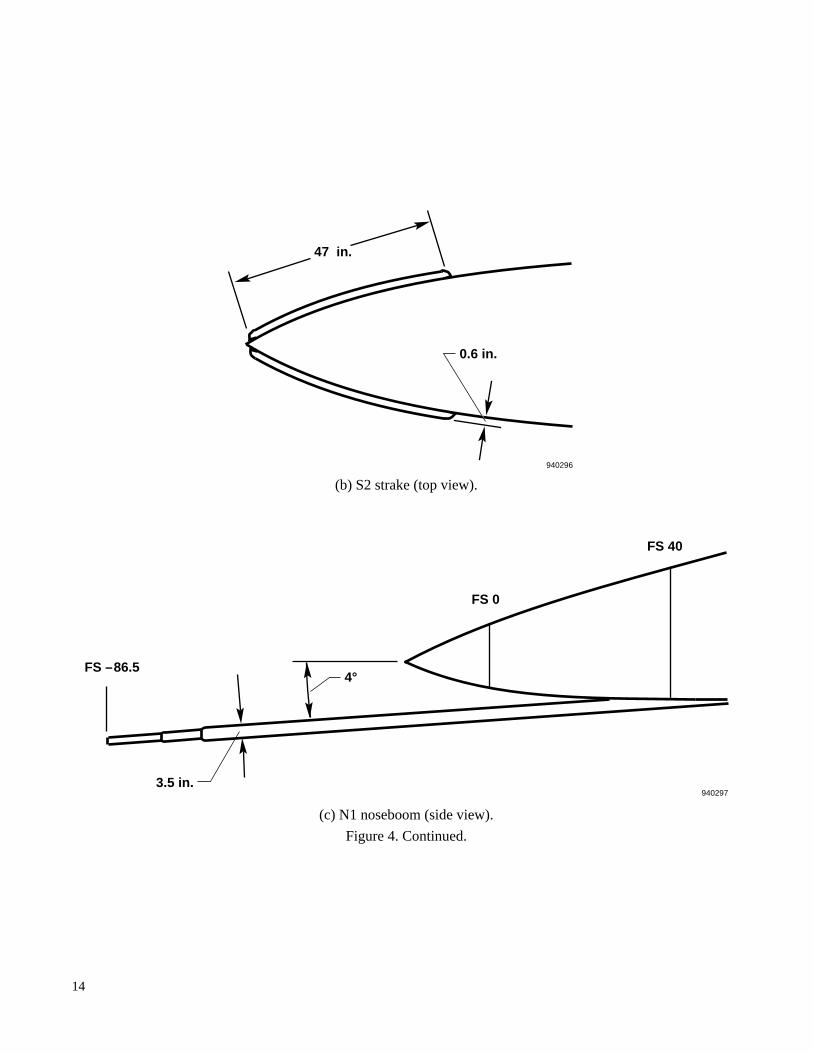
Results from seven X-31 model configurations testedin the FVF are presented. Table 1 shows the compo-nents tested on each of the configurations. Figure 4shows sketches of each of the strakes and noseboomsand includes some basic dimensions. All dimensionsgiven in this paper refer to full-scale aircraft unless oth-erwise specified.
DESIGN OF STRAKES ANDNOSEBOOMS
The strake designs tested in this investigation origi-nated from a wind-tunnel test in the 30-Ft by 60-FtTunnel at the NASA Langley Research Center.1 Thepurpose of the wind-tunnel test was to design a strakethat would minimize the forebody yawing asymmetrieswithout adversely affecting the static rolling, yawing,and pitching moment characteristics. Many strake
3
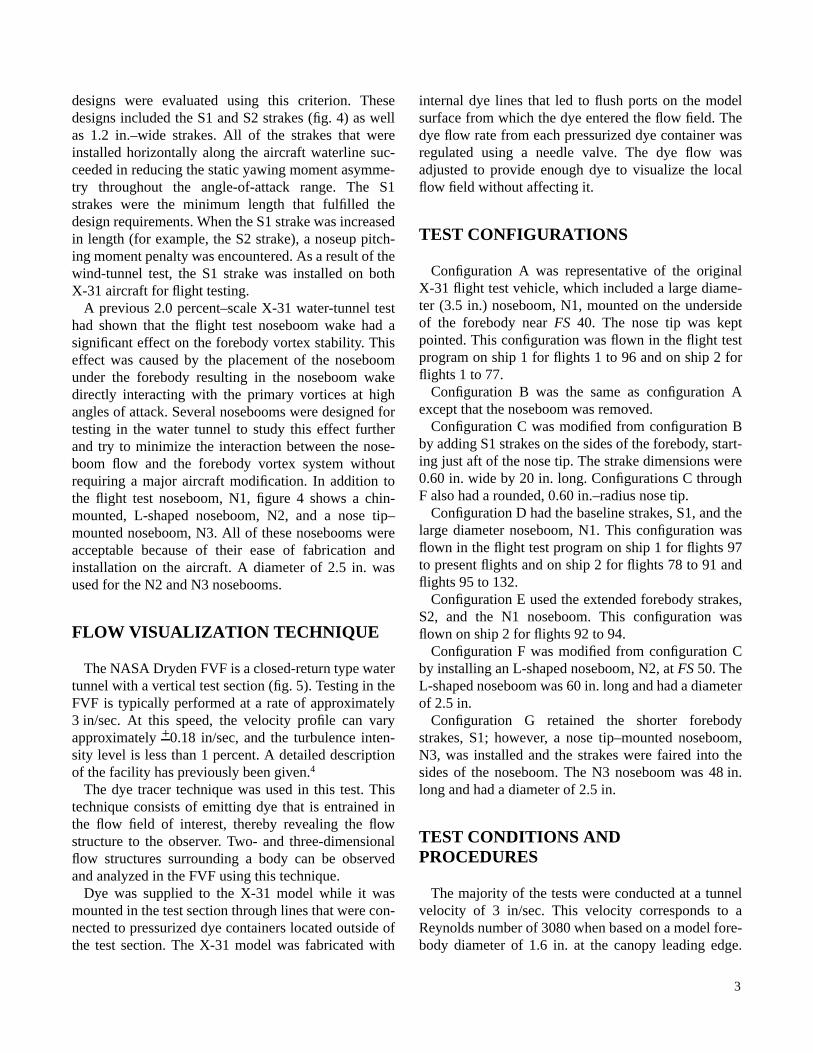
designs were evaluated using this criterion. Thesedesigns included the S1 and S2 strakes (fig. 4) as wellas 1.2 in.–wide strakes. All of the strakes that wereinstalled horizontally along the aircraft waterline suc-ceeded in reducing the static yawing moment asymme-try throughout the angle-of-attack range. The S1strakes were the minimum length that fulfilled thedesign requirements. When the S1 strake was increasedin length (for example, the S2 strake), a noseup pitch-ing moment penalty was encountered. As a result of thewind-tunnel test, the S1 strake was installed on bothX-31 aircraft for flight testing.
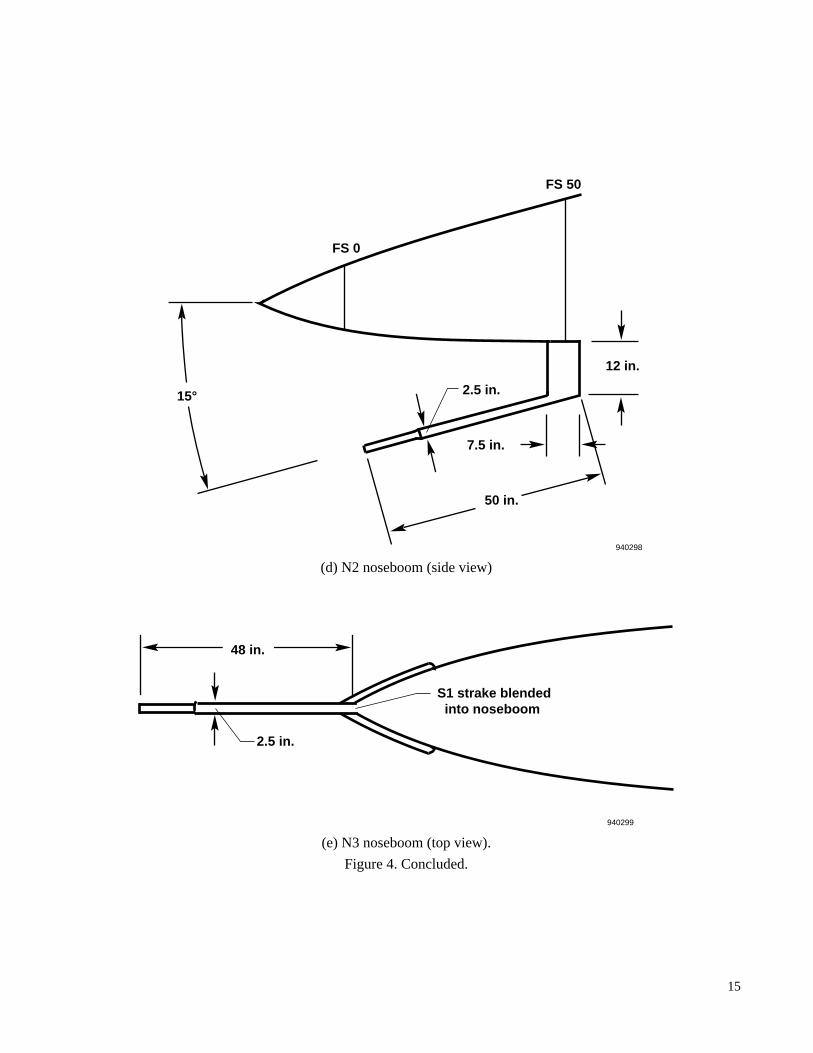
A previous 2.0 percent–scale X-31 water-tunnel testhad shown that the flight test noseboom wake had asignificant effect on the forebody vortex stability. Thiseffect was caused by the placement of the noseboomunder the forebody resulting in the noseboom wakedirectly interacting with the primary vortices at highangles of attack. Several nosebooms were designed fortesting in the water tunnel to study this effect furtherand try to minimize the interaction between the nose-boom flow and the forebody vortex system withoutrequiring a major aircraft modification. In addition tothe flight test noseboom, N1, figure 4 shows a chin-mounted, L-shaped noseboom, N2, and a nose tip–mounted noseboom, N3. All of these nosebooms wereacceptable because of their ease of fabrication andinstallation on the aircraft. A diameter of 2.5 in. wasused for the N2 and N3 nosebooms.
FLOW VISUALIZATION TECHNIQUE
The NASA Dryden FVF is a closed-return type watertunnel with a vertical test section (fig. 5). Testing in theFVF is typically performed at a rate of approximately3 in/sec. At this speed, the velocity profile can varyapproximately+0.18 in/sec, and the turbulence inten-sity level is less than 1 percent. A detailed descriptionof the facility has previously been given.4
The dye tracer technique was used in this test. Thistechnique consists of emitting dye that is entrained inthe flow field of interest, thereby revealing the flowstructure to the observer. Two- and three-dimensionalflow structures surrounding a body can be observedand analyzed in the FVF using this technique.
Dye was supplied to the X-31 model while it wasmounted in the test section through lines that were con-nected to pressurized dye containers located outside ofthe test section. The X-31 model was fabricated with
internal dye lines that led to flush ports on the modelsurface from which the dye entered the flow field. Thedye flow rate from each pressurized dye container wasregulated using a needle valve. The dye flow wasadjusted to provide enough dye to visualize the localflow field without affecting it.
TEST CONFIGURATIONS
Configuration A was representative of the originalX-31 flight test vehicle, which included a large diame-ter (3.5 in.) noseboom, N1, mounted on the undersideof the forebody nearFS 40. The nose tip was keptpointed. This configuration was flown in the flight testprogram on ship 1 for flights 1 to 96 and on ship 2 forflights 1 to 77.
Configuration B was the same as configuration Aexcept that the noseboom was removed.
Configuration C was modified from configuration Bby adding S1 strakes on the sides of the forebody, start-ing just aft of the nose tip. The strake dimensions were0.60 in. wide by 20 in. long. Configurations C throughF also had a rounded, 0.60 in.–radius nose tip.
Configuration D had the baseline strakes, S1, and thelarge diameter noseboom, N1. This configuration wasflown in the flight test program on ship 1 for flights 97to present flights and on ship 2 for flights 78 to 91 andflights 95 to 132.
Configuration E used the extended forebody strakes,S2, and the N1 noseboom. This configuration wasflown on ship 2 for flights 92 to 94.
Configuration F was modified from configuration Cby installing an L-shaped noseboom, N2, atFS50. TheL-shaped noseboom was 60 in. long and had a diameterof 2.5 in.
Configuration G retained the shorter forebodystrakes, S1; however, a nose tip–mounted noseboom,N3, was installed and the strakes were faired into thesides of the noseboom. The N3 noseboom was 48 in.long and had a diameter of 2.5 in.
TEST CONDITIONS ANDPROCEDURES
The majority of the tests were conducted at a tunnelvelocity of 3 in/sec. This velocity corresponds to aReynolds number of 3080 when based on a model fore-body diameter of 1.6 in. at the canopy leading edge.
4
Past experience has shown this velocity to be an appro-priate setting for good flow visualization. Prior to tak-ing data at each condition, the flow was allowed tostabilize for approximately 2 min.
During the tests, the angle of attack and the yawangle, which is also referred to as flank angle of attack,were varied. The sideslip angle,β, is related to theflank angle of attack by the equation
β = atan [tan (αf) cos (α)]whereαf is the flank angle of attack. Notes, videotape,and still photographs were taken at angles of attack of20°, 30°, 35°, 40°, 45°, 50°, 55°, 60°, 65°, and 70° foreach of the configurations tested. In addition, several ofthe configurations were tested with flank-angle-of-attack values of –10°, –5°, 0°, 5°, and 10° at angles ofattack of 45°, 55°, and 65°. Prior to testing each of theconfigurations, the yaw angle of the model was alignedwith a calibration rig, and the pitch and roll angleswere adjusted using a level.
Because the emphasis of the water-tunnel test was onthe relative changes in the forebody flow field with dif-ferent nosebooms and strakes, other variables wereeither kept constant or scheduled as a function of theangle of attack. Figure 6 shows an approximation to theactual flight test canard schedule used. The canard wasaligned with the freestream flow up to 45° α, afterwhich it was fixed at a 45° deflection. In order to maxi-mize air intake, the inlet lip was fixed at –26° for all ofthe test conditions, which corresponds to the full-down,high-α position. The inlet mass flow ratio was adjustedto approximately 1.0, which equates the velocitythrough the inlet to the freestream tunnel velocity. Thewater pressure in the FVF test section forced waterthrough the model inlet and was then adjusted using avalve outside of the test section. Adjustments of themass flow were found to slightly alter the primary vor-tex breakdown location; however, this effect was ofminor concern.
RESULTS AND DISCUSSION
The flow characteristics of each of the forebody con-figurations are described in the first subsection. Thegeneral canard flow field, which was similar for each ofthe configurations, is discussed second. In the thirdsubsection, a comparison of the configurations illus-trates the relative effects of the various noseboom andstrake changes, with particular attention paid to vortex
asymmetries, vortex breakdown, BLS, and flow-fieldstability.
Forebody Flow Field
The following sub-subsections detail the flow char-acteristics of each forebody configuration.
Configuration A: N1 Noseboom, No Strake
Configuration A was representative of the originalX-31 flight test vehicle forebody, having a large diame-ter noseboom, N1, and no forebody strakes. At 20° α,the flow over the X-31 forebody was attached and lam-inar (fig.7). At 30° α, the flow was beginning to sepa-rate from the forebody; however, the flow remainedlaminar (fig. 8). The flow over the noseboom was lami-nar and steady as it traveled into the forebody flowfield. The primary forebody vortices, although weak,started to form at approximately 35° α (fig. 9). Thebenign effect of the noseboom ended as the modelreached 40° α. At this condition, an eddy developedbetween the noseboom and forebody (fig. 10). In addi-tion to the eddy, a periodic flow disturbance alternatedfrom each side of the noseboom. This disturbancecaused the primary vortices to oscillate at the same fre-quency. As the angle of attack reached 50°, the primaryvortices increased in strength while still subject to theperiodic flow from the noseboom (fig. 11). The fore-body flow disturbances became more random at thiscondition.
Figure 12 shows that at 55° α, the primary vorticesstarted to show a slight asymmetry. The right vortexcore is higher off the body and slightly more outboardfrom the model centerline than the left vortex is.Another asymmetrical feature of the flow field was thevortex core breakdown, which occurred further aft onthe right vortex. In addition, the BLS line occurred ear-lier (lower) on the right side of the forebody. Becausethe unsteadiness in the flow field renders the other fea-tures of the flow asymmetry in figure 12 not easily dis-cernible, a generic sketch of the asymmetrical flowcondition on the model is shown in figure 13. Asshown, the resulting vortex-induced side force on theforebody is in the direction of the lower vortex. Thisside force is caused by the increased amount of suctionprovided by the boundary layer, which is attached overa larger forebody area than the opposite forebody side,and the high vortex velocity near the model surface.
5
As the angle of attack increased to 60°, the flowasymmetry switched sides. The right vortex becamethe lower vortex and moved inboard nearly to the cen-terline (fig. 14). The left vortex moved high and awayfrom the model centerline. The difference in vortexheights and the amount of deflection in the vortex pathsat 60° α (fig. 14(a)) suggest that the magnitude of theasymmetry is greater than the magnitude at 55° α.Once again, the higher vortex resisted breakdown untilfurther downstream. The BLS occurred significantlyearlier on the left side of the forebody, again corre-sponding to the higher, more outboard vortex. Notesand videotape indicate that vortex symmetry wasrestored as the model approached 65° α ; however, theflow continued to have a large unsteady component.Although the primary vortex breakdown locationmoved forward of the canopy at 70° α (fig. 15), thevortex cores remained symmetrical.
Configuration B: No Noseboom, No Strakes
Configuration B was the clean forebody with nonoseboom or forebody strake. With the removal of theN1 noseboom, the primary vortices started to form at alower angle of attack than they had with the noseboom-on configurations. Figure 16 shows that the vorticeshad formed by 30° α. From 40° to 50° α, the forebodyflow field was steady and symmetrical (figs. 17 and18). Figure 19(a) shows that with the noseboom off, theprimary vortex cores are at an equal distance above theforebody surface at 55° α . This flow symmetry is incontrast to the asymmetry observed at the same condi-tions with configuration A (fig. 12).
From 35° to 70° α, the primary vortices remainedvery symmetrical, as shown at 40°, 50°, 55°, and 65° αin figures 17, 18, 19(b), and 20. The increase instrength of the primary vortices accompanying increas-ing angle of attack can be observed by noting thereduction in distance between consecutive vortex rota-tions. These stronger vortices have a sharper helixangle than those seen at lesser angles of attack becauseof their higher rotational velocity.5 A comparison of theresults shown in figures 21 and 14(a) reveals that,unlike the noseboom-on example, the unsteady flowfield component forward of the canard was absent fromthe forebody flow field. This steadiness of the flowfield forward of the canard was seen over the entireangle of attack range for this configuration. The vorti-ces remained symmetrical and stable to 70° α.
Unlike configuration A, which had the N1 noseboominstalled, configuration B had no asymmetries in theprimary vortex cores throughout the angle-of-attackrange tested. No other configuration tested yielded theuniformity and steadiness in the flow observed withthis configuration.
Configuration C: No Noseboom, S1 Strake
Configuration C consisted of the X-31 model withthe longitudinal S1 forebody strakes installed and anose tip that was rounded to a 0.60 in. radius. Forma-tion of the primary vortices initiated along the strake at30° α (fig. 22). From 35° to 50° α, the primary vorticesgained in strength while staying symmetrical. Thissymmetry was evidenced by the tightly wound vortexcore at 40° α (fig. 23), which was not present withoutthe strake (fig. 17). Stable symmetrical vortices werealso observed at 50° α (fig. 24). The forward move-ment of the primary vortex breakdown location withincreasing angle of attack is clearly shown by compar-ing figures 23 and 24. A small difference in the longitu-dinal breakdown location occurred at 55° α (fig. 25(a)),although the vortex paths were at the same distanceabove the forebody (fig. 25(b)). A smaller, but notice-able, difference in the primary vortex breakdown loca-tion was also seen at 60° α (fig. 26). Some unsteadinessin the flow field was noticed above 55° α, but not asmuch as was seen in the presence of the N1 noseboom.The primary vortex breakdown symmetry was restoredat 65° α (fig. 27). The vortex symmetry remainedthrough 70° α.
Configuration D: N1 Noseboom, S1 Strake
Configuration D included the N1 noseboom and theS1 strake in addition to the rounded nose tip. This con-figuration matched the flight test aircraft configurationafter the aircraft was modified with strakes. The flowfield around the forebody below 40° α was similar tothe strake-on, noseboom-off configuration C. At andabove 40° α, the flow around the noseboom caused theprimary vortices to become unsteady, although thesymmetry in the flow was not altered (fig. 28). Theeffect of the noseboom addition can be seen by com-paring this configuration at 40° α to the same conditionwith the noseboom removed (fig. 23). The unsteadinessappears as a random component in the streamlines andvortex cores with the noseboom on. This unsteadiness

6
increased with angle of attack and by 55° α, the pri-mary vortices became asymmetrical as shown in figure29. Both vortices were shifted to the right with respectto their symmetrical position, with the left vortex lowerthan the right vortex. The left vortex broke down at thecanopy leading edge while the right remained intact forapproximately 20 in. further downstream. The BLSoccurred earlier on the right side of the forebody.
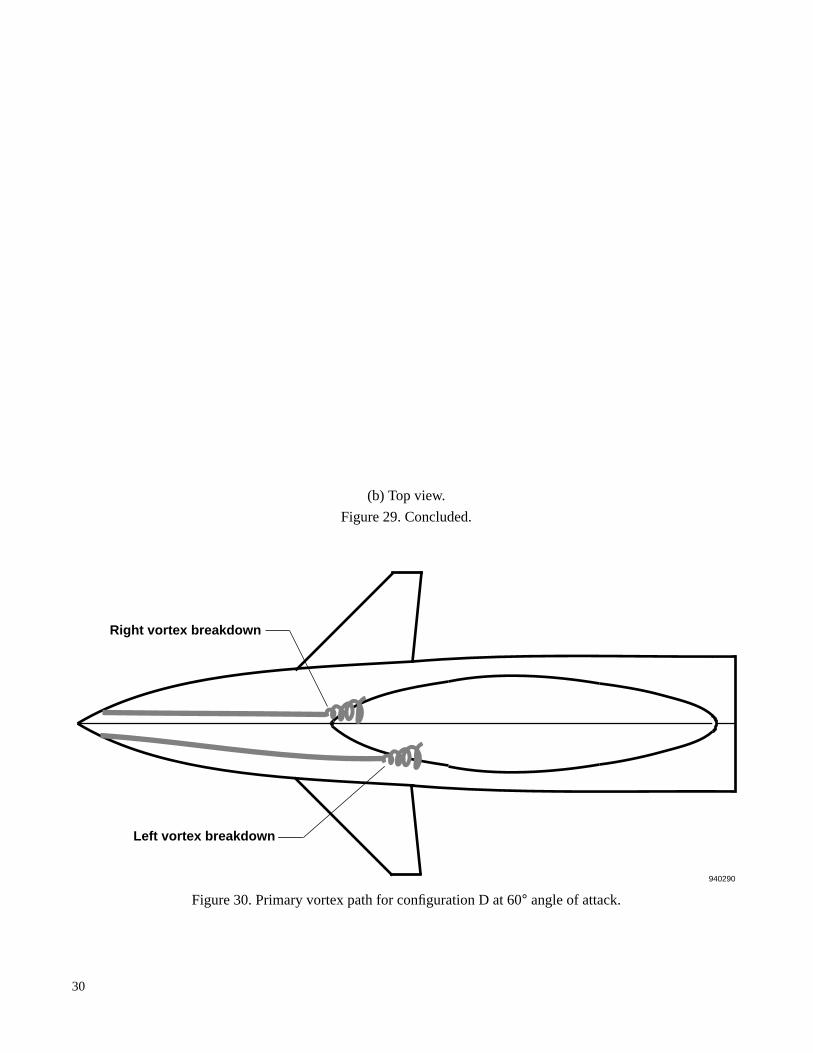
At 60° α, the vortex asymmetry switched, the rightvortex now moving low and inboard and the left vortexmoving high and away from the centerline (fig. 30). Asexpected, the vortex breakdown occurred further for-ward on the right side and the BLS occurred lower onthe left side of the forebody. The symmetry of the vor-tex system was restored between 65° and 70° α,although the unsteadiness of the flow field remained.At and above 50° α, a significant flow interactionbetween the noseboom and the forebody existed. Flowtraveling forward from the attachment point of thenoseboom met flow traveling aft from the forward por-tion of the boom and then traversed into the forebodyvortex field (fig. 29(a)). Notes and videotape showedthat this behavior continued up to 70° α.
Configuration E: N1 Noseboom, S2 Strake
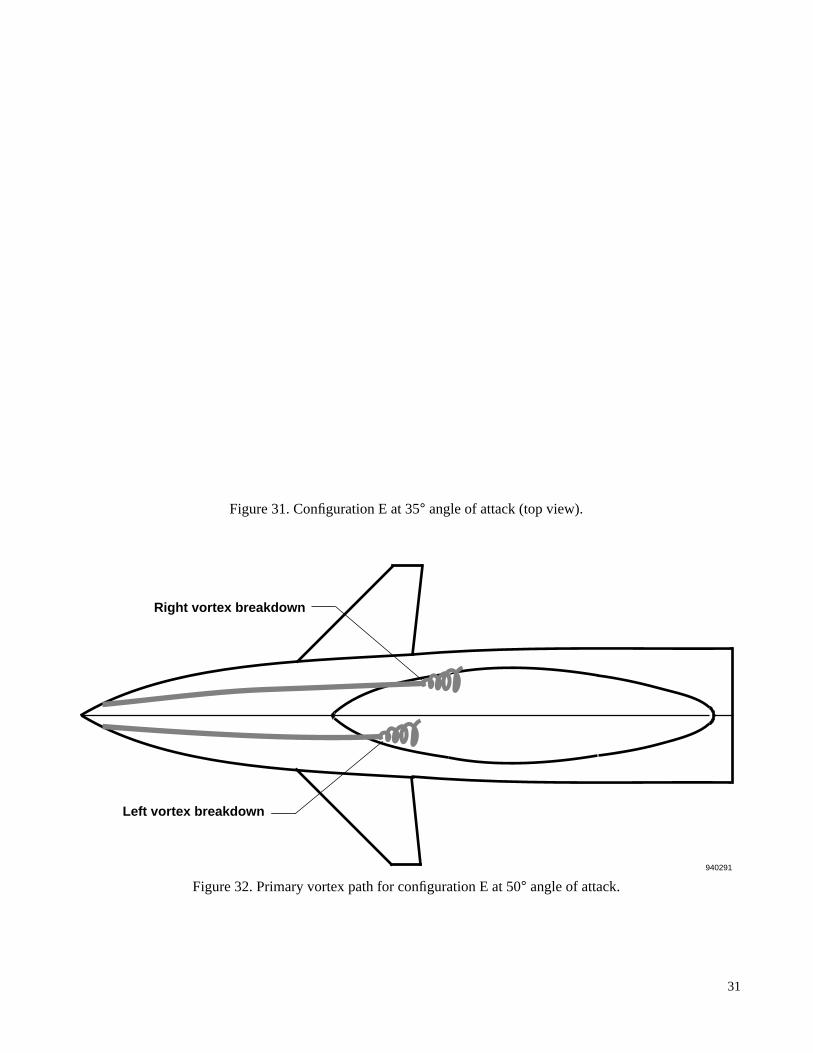
Configuration E included the extended strakes, S2;the flight test noseboom, N1; and the rounded nose tip.As with previous strake-on configurations, the primaryvortices started to form at 30° α, increasing in strengthas angle of attack increased. The unsteady forebodyflow field caused by the noseboom developed atapproximately 35° α (fig. 31). The extreme unsteadi-ness of the flow field made analyses difficult. Symme-try in the vortex cores was noted up to 45° α. Thetypical noseboom-on asymmetry, seen in configura-tions A and D at 55° α, started at 50° α. The asymmet-rical flow patterns, though, were the same as those seenpreviously. The left vortex moved lower and towardthe centerline, and the right vortex moved high andaway. The right vortex breakdown occurred further afton the model, and the boundary layer on the right sideof the forebody separated earlier. Figure 32 shows asketch of the vortex paths and breakdown locations.
At 55° α, the vortex asymmetry switched sides. Fig-ure 33 shows that the right vortex tracked closer to thecenterline. The symmetrical flow field was restored at60° α and above. The effect of the S2 strake, relative tothe S1 strake or plain forebody configurations, was toreduce the asymmetry onset angle of attack. Thus, the
S2 strake did not improve the forebody vortex flowfield relative to the S1 strake.
Configuration F: N2 Noseboom, S1 Strake
Configuration F included an alternate noseboom thatwas designed with the goal of minimizing the effect ofthe noseboom wake on the forebody vortical flow. ThisL-shaped noseboom, N2, was mounted under the fore-body nearFS 50 (fig. 34). The baseline S1 strake androunded nose tip were also installed on configuration F.
A concern was that this noseboom might feed vorti-cal flow into the engine inlet at high angles of attackwhere the stall margins of the engine are reduced.Above 20° α, the flow over the noseboom missed theinlet and traveled around the fuselage (fig. 34). Atlower angles of attack, the wake of the noseboom didenter the inlet.
The primary vortices formed at 30° α, as they hadpreviously with the S1 strake. Although previous testsshowed that the flight test noseboom, N1, triggeredflow unsteadiness throughout the forebody flow field atand above 40° α, this effect was not found with the N2noseboom. A comparison at 40° α between the N1 andN2 nosebooms (figs. 28 and 35) shows that the fore-body flow field with the N2 noseboom installed had nounsteady components in the primary vortices. As theangle of attack was increased above 40°, the primaryvortices continued to remain symmetrical and stable. Acomparison of figures 25(b), 29(a), and 36 shows thatthe forebody flow field with the N2 noseboom installedmore closely matched the flow field of the configura-tion without a noseboom than the unsteady flow fieldcaused by the N1 noseboom.
Vortex shedding from the noseboom was first noticedat 60° α (fig. 37). This vortex shedding did not affectthe symmetry or stability of the vortex flow field. Inaddition to the vortex shedding, a slowly rotating eddydeveloped between the noseboom and forebody at andabove 60° α (fig. 37). Figure 38 shows that the additionof the N2 noseboom appeared to eliminate the unevenleft and right vortex breakdown observed at 55° α inconfigurations without nosebooms. The wake of the N2noseboom entered into the forebody flow field betweenFS15 andFS60 at approximately 65° α (fig. 38); how-ever, the primary vortices remained stable and symmet-rical. Some minor flow field unsteadiness was observedat 70° α ; however, the primary vortices remained sym-metrical.
7
Configuration G: N3 Noseboom, S1 Strake
Configuration G included a noseboom similar indesign to that flown during the X-29A (GrummanAerospace Corporation, Bethpage, New York) high-αflight test program.6 Figures 39 and 40 show the N3noseboom mounted at the apex of the radome with theS1 forebody strakes blended into the side. As the pho-tographs were analyzed, it was noticed that the nose-boom had been offset slightly to the right during thesetests.
The primary vortices developed in a fashion similarto the noseboom-off test (configuration C). A compari-son of the flow field in the presence of the N3 nose-boom (fig. 39) with the noseboom-off configuration(fig. 23) shows a similar vortex pattern at 40° α.Although flow from the noseboom is clearly feedinginto the vortex cores in figure 39, no unsteadiness wasnoted. In all of the photographs above 30° α, the pri-mary vortex pair was shifted slightly to the right side ofthe forebody. Because this shift was not seen for theother configurations with the S1 strake, it is likely thatthis shift was caused by the slight noseboom misalign-ment during the test. Through 45° α, the vorticesstrengthened and remained symmetrical (except for theslight shift to the right).
At 50° α, the wake from the noseboom was vorticalin nature and was being drawn into the forebody vortexsystem (fig. 40). This vortical wake may have beenresponsible for a difference in the left and right vortexbreakdown locations. The left vortex broke downapproximately 10 in. forward of the right vortex,although no difference in height above the model sur-face was noticed. The asymmetrical breakdown of theprimary vortices was not discernible in the photo-graphs; therefore, only notes and videotape could beused. This asymmetrical breakdown of the primaryvortices continued through 60° α as the unsteadiness inthe forebody flow field increased. The noseboom wakecontinued to feed into the vortices throughout thisangle-of-attack range. Above 60° α, the vorticesbecame more unsteady with increasing angles ofattack, but the breakdown location of the primary vorti-ces became nearly symmetrical.
Canard Influence
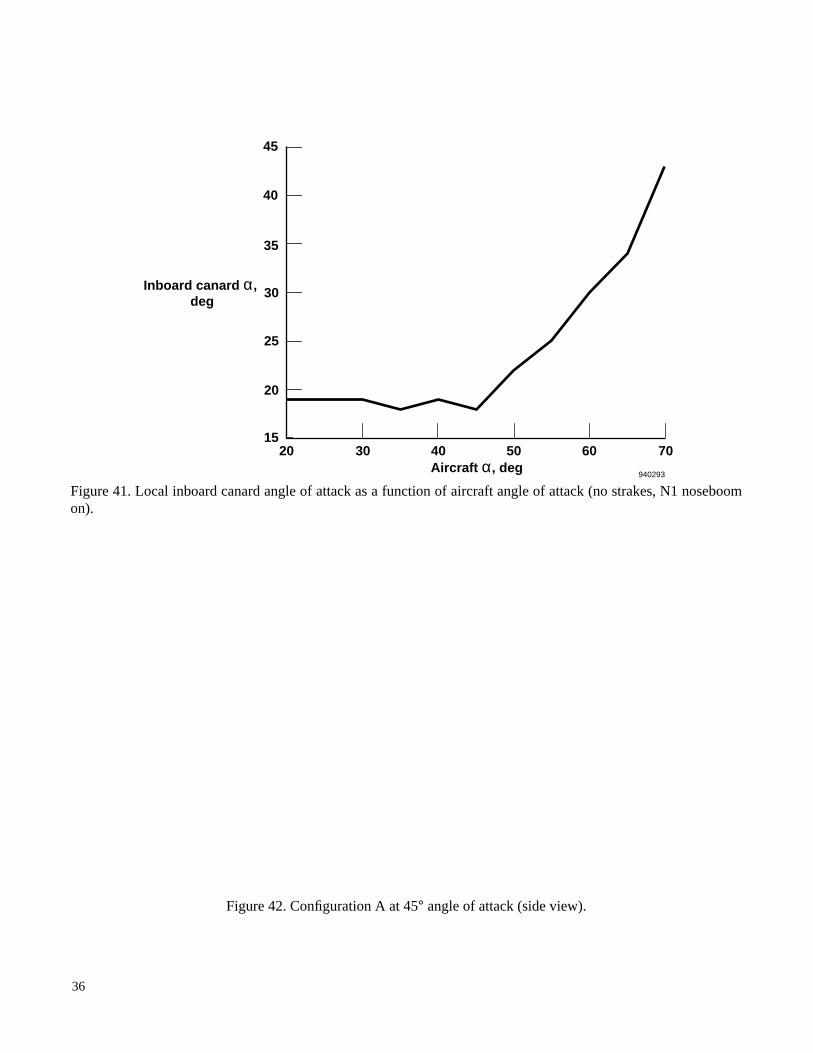
Although the canard was aligned with the freestreamflow up to 45° α (fig. 6), the local canard angleof attack was not 0°. It has been documented that the
forebody induces an upwash effect on the surface flowat high angles of attack.7, 8 Although flow visualizationtests were not performed for the outboard portion of thecanard, the inboard section was subject to this forebodyupwash effect. The dye flow from the port located for-ward of the canard atFS 31 (fig. 2(a)) was used to mea-sure the upwash angle on the photographs as thestreamline crossed the waterline which passes throughthe canard rotation point. The difference between thesurface flow angle and the canard angle was used toapproximate the local inboard canard angle of attack.
Below 45° α, the canard had a nearly constant, non-zero local angle of attack (fig. 41). At 20° α (fig. 7), thelow pressure area over the top of the canard turned theforebody surface flow downward. The streamlines con-verged near the canard trailing edge. At 30° α (fig. 8), aflow pattern similar to a Karman vortex street started toform aft of the canard trailing edge. This flow-fieldcondition continued to higher angles of attack (fig. 42).The wake behind the canard was fully stalled at 55° α(fig 12). Since the local canard angle of attackincreases almost linearly with the model angle of attackabove 45° α, the canard remained fully stalled at anglesof attack above 55°.
In general, the onset of the canard stall was observedto coincide with a slight increase in instability of theforebody vortex cores at the point of their intersectionwith the canard wake and aft. This instability promotedpremature vortex breakdown with increasing angles ofattack, which will be covered in the next subsection.
Comparison of Configurations
Because the X-31 model consisted of a forebodyonly, the absolute value of some of the data taken (suchas vortex breakdown location) is of less importancethan the relative changes in the flow field between thestrake and noseboom configuration changes. These rel-ative differences were considered to be the most impor-tant information obtained from the test series.Comparisons between configurations include vortexsymmetry, vortex breakdown location, flow-fieldstability, and BLS. Vortex symmetry was defined withrespect to the centering of the vortex pair around themodel centerline and the relative distance of the indi-vidual vortex cores from the forebody along theirtrajectories. Vortex breakdown location was given asthe longitudinal position at which the diameter of thevortex cores increased rapidly and the rotational veloc-ity simultaneously decreased. Flow-field stability

8
consisted of the presence or lack of oscillations or ran-dom unsteadiness. The BLS line was defined as theposition along the forebody where the dye flow left themodel surface.
Primary Vortex Asymmetry
One of the main goals of the water-tunnel investiga-tion was to look for the tendency of the primary vortexcores to become asymmetrical with various noseboomand strake changes. Asymmetry of the vortex coreswith respect to the model centerline and height abovethe forebody surface was noted on configurations A, D,and E. These configurations had only one common ele-ment, which was the flight test noseboom, N1. Unfor-tunately, the unsteady wake of the N1 noseboom alsomakes it difficult to visualize the asymmetry in the stillphotographs. Thus, notes and videotape were usedextensively for this analysis.
The development of the asymmetry with the N1noseboom installed was similar for each of the fore-body configurations (fig. 13). Typically, the left vortexmoved low and inboard toward the model centerlineand the right vortex moved high and away from thecenterline at a specific angle of attack. This movementwas followed by a switch in the positions as the modelangle of attack was increased by 5°. The lower vortextended to break down about 10 to 20 full-scale inchesforward of the higher vortex. The BLS line was loweron the side of the forebody that had the higher, moreoutboard vortex.
The onset angle of attack of the asymmetry with theN1 noseboom was affected by the strake configuration.With the S1 strake or no strake installed, the first asym-metry started at 55° α. The extended strake, S2, causedthis asymmetry to occur at 50° α.
The L-shaped noseboom, N2, showed no tendency tocause the vortices to become asymmetrical at highangles of attack. The nose tip–mounted noseboom, N3,showed a slight tendency of the vortex cores to breakdown asymmetrically between 50° and 60° α.
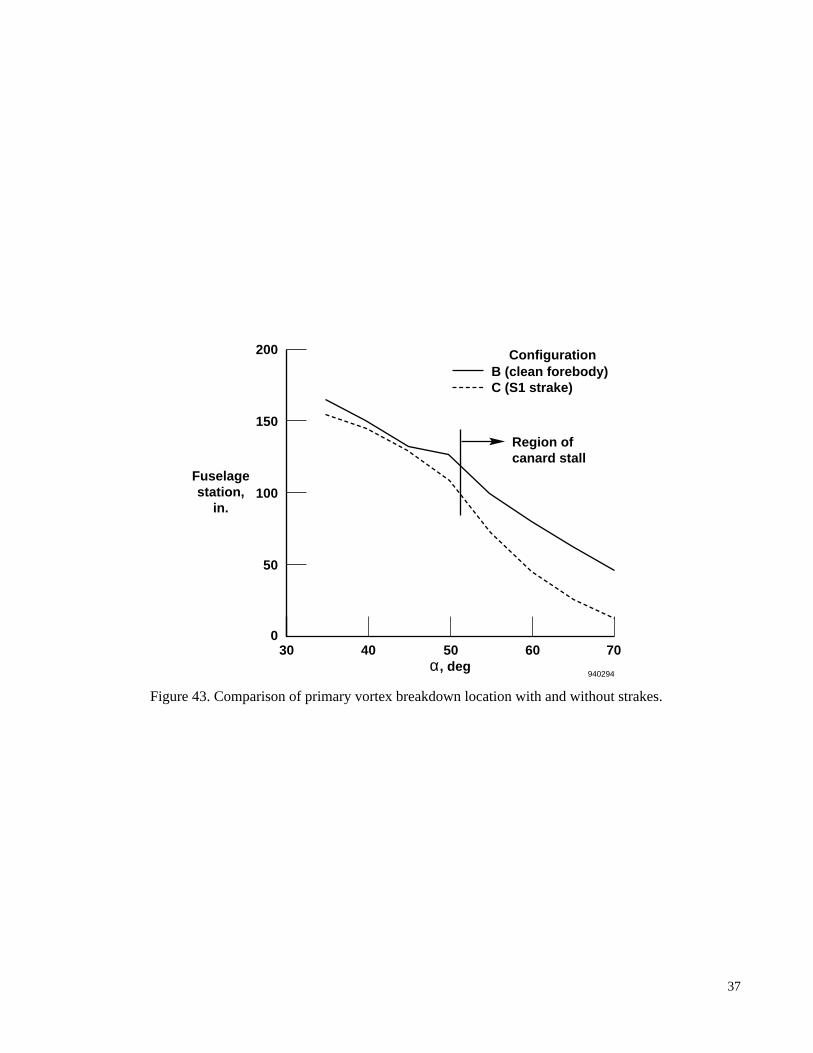
Primary Vortex Breakdown
The longitudinal position of the vortex breakdownlocation was directly affected by the installation ofstrakes on the model. Comparing figures 26 and 21illustrates the change in the primary vortex breakdownlocation with the addition of the S1 strakes for the 60°α test condition. Figure 43 shows the longitudinal
breakdown location of the primary vortices as a func-tion of angle of attack, with and without the S1 strakes.As stated earlier, the S1 strake significantly increasedthe rotational velocity in the primary vortex cores. Theincreased rotational velocity required a smaller adversepressure gradient downstream to induce breakdown.9
As a result, the addition of the strakes shifted the pri-mary vortex breakdown location forward at a givenangle of attack.
Figure 43 also shows the change in slope of the graphfor both configurations at 50° α. Above 50° α, the vor-tex breakdown location moved further forward with agiven amount of angle-of-attack change. This changein slope correlates with the onset of canard stall. Thecanard schedule froze the canard at 45° as the modelmoved above 45° α (fig. 6). This canard schedule,combined with the fuselage upwash effect describedpreviously, caused the canard to stall by 55° α. Canardstall produced the adverse pressure field downstream ofthe vortex path that caused the earlier breakdown.
Flow-Field Stability
Another important component of the forebody flowfield was the stability of the vortices. Up to 40° α, all ofthe configurations had laminar, stable flow throughoutthe forebody area, excluding the canard trailing edgewake. Above this angle of attack, many of the configu-rations had unsteady or oscillatory flow. The cleanforebody model without strakes showed no tendency tobecome unsteady or oscillatory. As the primary vorti-ces formed, their paths remained stationary withrespect to the X-31 model, with and without strakes.The flight test noseboom, N1, created an oscillatingwake that entered and altered the forebody flow field.
Figures 18 and 24 show that the vortex cores runsymmetrically over the forebody in a stationary posi-tion for noseboom-off configurations at 50° α, but add-ing the noseboom (fig. 11) introduced randomcomponents to the flow field that affected the vortexpath. The L-shaped noseboom, N2, was designed sothat its wake would not intersect with the forward por-tion of the forebody. This design proved successful inreducing the wake influence through 65° α, althoughsome unsteadiness in the flow field was observed at 70°α. The nose tip–mounted noseboom, N3, producedsome unsteady flow disturbances above 55° α, thoughof much smaller magnitude than the N1 noseboomproduced.
9
Boundary-Layer Separation
The primary BLS line was observed on the forebodyof the model by noting the location where the dye leftthe model surface. An adequate amount of dye wasavailable for visualizing the separation line up toapproximately 60° α. Although the water tunnel hasnot been established as an accurate tool in the predic-tion of the separation line position on forebodies athigh angles of attack because of low Reynolds numbereffects,3 the relative differences in the separation linewere analyzed to establish general trends with configu-ration changes.
Figure 44 shows a comparison of the separation linewith S1 strakes, S2 strakes, and no strakes at angles ofattack of 35°, 45°, and 55°. The data plotted are projec-tions of the separation line on the vertical plane mea-sured from photographs of the left side view. Asexpected, BLS occurred at the strake edge, which was5 in. below the zero waterline. Aft of the strake, theseparation line curved sharply up and asymptoticallyapproached the same separation line as that of the fore-body without strakes at 35° and 45° α. At these anglesof attack, the separation lines with and without thestrake were nearly identical at a point 20 in. aft of eachstrake aft end. As previously described, all configura-tions with the N1 noseboom installed had asymmetriesin the BLS between the left and right sides at 55° α.With the S1 strake, the left side BLS was higher thanthe right. With the S2 strake, the right side BLS washigher than the left at 55° α. Figure 44 shows that, as aresult, the S1 strake separation line is slightly higherand the S2 strake is lower than the strake-off separationline at this condition.
CONCLUDING REMARKS
A water-tunnel study of a 4.4 percent–scale forebodymodel of the X-31 aircraft was conducted in the FlowVisualization Facility at the NASA Dryden FlightResearch Center. The primary focus of the study wasthe investigation of the effects of various combinationsof nosebooms and strakes on the high-angle-of-attackforebody flow field. Particular attention was paid to thedevelopment or reduction of asymmetries andunsteadiness with the different configurations.
The most important findings were as follows:
• The X-31 model without a noseboom or strakesinstalled had stable, symmetrical forebody vorti-ces through 70° angle of attack,α.
• With the addition of the flight test noseboom, N1,the flow field became unsteady and oscillatory atand above 40° α. The N1 noseboom addition alsocorrelated with the development of asymmetricalprimary vortices. The onset of the asymmetry wasat 55° α with no strake or the S1 strake anddecreased to 50° α with the longer S2 strake.
• Adding strakes to the forebody increased thestrength of the vortex cores and resulted in earliervortex core breakdown.
• Adding strakes did not significantly reduce thetendency of the noseboom influence to causeasymmetries.
• The extended strakes, S2, did not show a signifi-cant improvement in flow-field symmetry relativeto the S1 strakes.
• The L-shaped noseboom, N2, allowed the flowfield to remain stable and symmetrical up to 65°α. Some minor flow-field unsteadiness wasobserved at approximately 70° α.
• The nose tip–mounted noseboom, N3, delayed theonset of flow-field unsteadiness to a higher angleof attack. Although the vortex pair remainednearly symmetrical with respect to the model cen-terline, some asymmetry in the vortex breakdownwas noted between 50° and 60° α.
As observed in this study, the wake of the flight testnoseboom plays an important role in the developmentof the primary vortices at high angles of attack. Theeffect is not nullified with the application of strakes onthe forebody. The L-shaped noseboom, N2, combinedwith the basic S1 strake appears to be the bestcombination to minimize the high-angle-of-attackasymmetries and reduce unsteady, oscillating flowdisturbances.
Dryden Flight Research CenterNational Aeronautics and Space AdministrationEdwards, California, August 29, 1994
ACKNOWLEDGMENTS
Special thanks is owed to Daniel Garrabrant for hiscraftsmanship and endless patience in building andmodifying the X-31 model.

10
REFERENCES
1Cobleigh, Brent R., “High-Angle-of-Attack YawingMoment Asymmetry of the X-31 Aircraft from FlightTest,” AIAA-94-1803, June 1994.
2Croom, Mark A., Fratello, David J., Whipple, Ray-mond D., O’Rourke, Matthew J., and Trilling, ToddW., “Dynamic Model Testing of the X-31 Configura-tion for High-Angle-of-Attack Flight Dynamics Re-search,” AIAA-93-3674 CP, Aug. 1993.
3Erickson, Gary E.,Vortex Flow Correlation, AFW-AL-TR-80-3143, Jan. 1981.
4Del Frate, John,NASA Dryden Flight ResearchCenter, Flow Visualization Facility, NASA TM-4631,1994.
5Payne, Francis M.,The Structure of Leading EdgeVortex Flows Including Vortex Breakdown, Universityof Notre Dame, May 1987.
6Fisher, David F., Richwine, David M., and Landers,Stephen,Correlation of Forebody Pressures and Air-craft Yawing Moments on the X-29A Aircraft at HighAngles of Attack, NASA TM-4417, 1992.
7Keener, Earl R.,Flow-Separation Patterns on Sym-metric Forebodies, NASA TM-86016, 1986.
8Fisher, David F., Richwine, David M., and Banks,Daniel W., Surface Flow Visualization of SeparatedFlows on the Forebody of an F-18 Aircraft and Wind-Tunnel Model, NASA TM-100436, 1988.
9Wedemeyer, E., “Vortex Breakdown,”High Angleof Attack Aerodynamics, AGARD-LS-121, Mar. 1982,pp. 9-1–9-17.
Table 1. The X-31 model configurations.
Component Configuration
ABCDE F G
Nosebooms Flight testnoseboom, N1
X XX
L-shapednoseboom, N2
X
Nose tipnoseboom, N3
X
Strakes Short Strake,S1
XX XX
Extended strake,S2
X
Nose tip shapes Rounded nosetip (0.6 in. radius)
XXXX
Sharp tip XX

11
EC92-09164-1
Figure 1. The X-31 flight vehicle.
(a) The model.
Figure 2. The 4.4 percent–scale X-31 forebody model.

12
(b) Front view.
(c) Side view.
Figure 2. Concluded.
13
Figure 3. Model dye port locations.
(a) S1 strake (top view).
Figure 4. Nosebooms and strakes tested.
Upper dye ports Lower dye ports
N1
N2
N3
940287
20 in.
0.6 in.
940288
14
(b) S2 strake (top view).
(c) N1 noseboom (side view).
Figure 4. Continued.
0.6 in.
47 in.
940296
FS 0
FS 40
FS –86.54°
3.5 in.940297
15
(d) N2 noseboom (side view)
(e) N3 noseboom (top view).
Figure 4. Concluded.
FS 0
FS 50
50 in.
2.5 in.15°
7.5 in.
12 in.
940298
S1 strake blended into noseboom
2.5 in.
940299
48 in.

16
Figure 5. The Flow Visualization Facility.
Figure 6. Canard deflection schedule.
940329
Settling tank
Flow straighteners
Vertical test section
Gate valve
Pump
6.0'
15.5 '
24.0'
–60
–50
–40
–30
–20
–10
0
Canard, deg
0α, deg
Water-tunnel test Flight 1 g Flight >1 g
10 20 30 40 50 60 70
940289

17
Figure 7. Configuration A at 20° angle of attack (side view).
Figure 8. Configuration A at 30° angle of attack (side view).

18
Figure 9. Configuration A at 35° angle of attack (top view).
Figure 10. Configuration A at 40° angle of attack (side view).
19
Figure 11. Configuration A at 50° angle of attack (top view).
Figure 12. Configuration A at 55° angle of attack (side view).

20
Figure 13. Generic flow asymmetry.
(a) Side view.
Figure 14. Configuration A at 60° angle of attack.
Section AA
A A
Higher, outboard vortex results in later vortex breakdown Lower, inboard vortex results
in earlier vortex breakdown
Later separation corresponds to lower, inboard vortex
Earlier separation corresponds to higher, outboard vortex
Resulting force
Vortex breakdown
940002

21
(b) Top view.
Figure 14. Concluded.
Figure 15. Configuration A at 70° angle of attack (side view).

22
Figure 16. Configuration B at 30° angle of attack (top view).
Figure 17. Configuration B at 40° angle of attack (top view).

23
Figure 18. Configuration B at 50° angle of attack (top view).
(a) Side view.
Figure 19. Configuration B at 55° angle of attack.

24
(b) Top view.
Figure 19. Concluded.
Figure 20. Configuration B at 65° angle of attack (top view).

25
Figure 21. Configuration B at 60° angle of attack (side view).
Figure 22. Configuration C at 30° angle of attack (top view).

26
Figure 23. Configuration C at 40° angle of attack (top view).
Figure 24. Configuration C at 50° angle of attack (top view).

27
(a) Top view.
(b) Side view.
Figure 25. Configuration C at 55° angle of attack.

28
Figure 26. Configuration C at 60° angle of attack (side view).
Figure 27. Configuration C at 65° angle of attack (top view).

29
Figure 28. Configuration D at 40° angle of attack (top view).
(a) Side view.
Figure 29. Configuration D at 55° angle of attack.
30
(b) Top view.
Figure 29. Concluded.
Figure 30. Primary vortex path for configuration D at 60° angle of attack.
Left vortex breakdown
Right vortex breakdown
940290
31
Figure 31. Configuration E at 35° angle of attack (top view).
Figure 32. Primary vortex path for configuration E at 50° angle of attack.
Left vortex breakdown
Right vortex breakdown
940291

32
Figure 33. Primary vortex path for configuration E at 55° angle of attack.
Figure 34. Configuration F at 20° angle of attack (side view).
Left vortex breakdown
Right vortex breakdown
940292

33
Figure 35. Configuration F at 40° angle of attack (top view).
Figure 36. Configuration F at 55° angle of attack (side view).
34
Figure 37. Configuration F at 60° angle of attack (side view).
Figure 38. Configuration F at 65° angle of attack (side view).

35
Figure 39. Configuration G at 40° angle of attack (top view).
Figure 40. Configuration G at 50° angle of attack (side view).
36
Figure 41. Local inboard canard angle of attack as a function of aircraft angle of attack (no strakes, N1 noseboomon).
Figure 42. Configuration A at 45° angle of attack (side view).
15
20
25
30
35
40
45
Inboard canard α, deg
20 30 40 50 60 70Aircraft α, deg
940293
37
Figure 43. Comparison of primary vortex breakdown location with and without strakes.
200
150
100
50
030 40 50 60 70
ConfigurationB (clean forebody) C (S1 strake)
α, deg
Fuselage station,
in.
Region of canard stall
940294

38
Figure 44. High-angle-of-attack primary separation line with and without strakes.
–20
–10
0
10
20
30
Vertical distance,
in.
55°α
–20
–10
0
10
20
30
45°α
No strakeS1 strakeS2 strake
–20
–10
0
10
20
30
–30 –20 –10 0 10 20 30 40
35°α
50 60 70
Vertical distance,
in.
Vertical distance,
in.
Fuselage station, in. 940295

REPORT DOCUMENTATION PAGE Form ApprovedOMB No. 0704-0188
Public reporting burden for this collection of information is estimated to average 1 hour per response, including the time for reviewing instructions, searching existing data sources,gathering and maintaining the data needed, and completing and reviewing the collection of information. Send comments regarding this burden estimate or any other aspect of thiscollection of information, including suggestions for reducing this burden, to Washington Headquarters Services, Directorate for Information Operations and Reports, 1215 JeffersonDavis Highway, Suite 1204, Arlington, VA 22202-4302, and to the Office of Management and Budget, Paperwork Reduction Project (0704-0188), Washington, DC 20503.
1. AGENCY USE ONLY (Leave blank) 2. REPORT DATE 3. REPORT TYPE AND DATES COVERED
4. TITLE AND SUBTITLE 5. FUNDING NUMBERS
6. AUTHOR(S)
8. PERFORMING ORGANIZATIONREPORT NUMBER
7. PERFORMING ORGANIZATION NAME(S) AND ADDRESS(ES)
9. SPONSORING/MONOTORING AGENCY NAME(S) AND ADDRESS(ES) 10. SPONSORING/MONITORINGAGENCY REPORT NUMBER
11. SUPPLEMENTARY NOTES
12a. DISTRIBUTION/AVAILABILITY STATEMENT 12b. DISTRIBUTION CODE
Unclassified—UnlimitedSubject Category 02
13. ABSTRACT (Maximum 200 words)
14. SUBJECT TERMS 15. NUMBER OF PAGES
16. PRICE CODE
17. SECURITY CLASSIFICATIONOF REPORT
18. SECURITY CLASSIFICATIONOF THIS PAGE
19. SECURITY CLASSIFICATIONOF ABSTRACT
20. LIMITATION OF ABSTRACT
NSN 7540-01-280-5500 Standard Form 298 (Rev. 2-89)Prescribed by ANSI Std. Z39-18298-102
Water Tunnel Flow Visualization Study of a 4.4% Scale X-31 Forebody
WU-533-02
Brent Cobleigh and John Del Frate
NASA Dryden Flight Research CenterP.O. Box 273Edwards, California 93523-0273
H-1997
National Aeronautics and Space AdministrationWashington, DC 20546-0001 NASA TM-104276
A water-tunnel test of a 4.4 percent–scale, forebody-only model of the X-31 aircraft with different forebodystrakes and nosebooms has been performed in the Flow Visualization Facility at the NASA Dryden FlightResearch Center. The focus of the study was to determine the relative effects of the different configurations onthe stability and symmetry of the high-angle-of-attack forebody vortex flow field.
The clean, noseboom-off configuration resisted the development of asymmetries in the primary vorticesthrough 70° angle of attack. The wake of the X-31 flight test noseboom configuration significantly degraded thesteadiness of the primary vortex cores and promoted asymmetries. An alternate L-shaped noseboom mountedunderneath the forebody had results similar to those seen with the noseboom-off configuration, enabling stable,symmetrical vortices up to 70° angle of attack. The addition of strakes near the radome tip along the waterlineincreased the primary vortex strength while it simultaneously caused the vortex breakdown location to moveforward. Forebody strakes did not appear to significantly reduce the asymmetries in the forebody vortex field inthe presence of the flight test noseboom.
Asymmetry; Forebody; High angle of attack; Noseboom; Strake; Vortex flow; Watertunnel; X-31 AO3
41
Unclassified Unclassified Unclassified Unlimited
September 1994 Technical Memorandum
For sale by the National Technical Information Service, Springfield, Virginia 22161-2171