Embed Size (px)
Citation preview
BUSINESS CONFIDENTIAL ©2013 Antea®Group
Water Use Benchmarking Study:
Executive Summary
Prepared for International Bottled Water Association October 21, 2013 Antea Group
WATER USE RATIO BENCHMARKING STUDY – EXECUTIVE SUMMARY, OCTOBER 2013 | 1
www.anteagroup.com
“Promoting an environmentally responsible and
sustainable industry” is one of two key tenets of the IBWA
mission statement. As part of that mission, in 2012, IBWA
commissioned its first water use benchmarking study to
evaluate water use efficiencies and trends among North
American (United States and Canadian) bottlers. Water use
efficiency is a critical focus area in the bottled water industry –
efficient water use in operations positively impacts the viability
of water resources and business sustainability. Conducting a
benchmarking study is a first step toward understanding the
impacts of water use in the bottled water industry, and opens
the door for future evaluations of the industry’s broader water
footprint.
To establish a robust, consistent data set, each IBWA
member was asked to provide three years (2009, 2010 and
2011) of facility-specific information, including facility
type, total water use, total production, and
supplementary process information (e.g., type of water
treatment, use of refillable bottles). The key performance
metric for this study is the water use ratio, which presents
the average amount of water used within the facility to
produce one liter of bottled water. The study was
managed by Antea®Group, a third-party consultant, who
conducted the data collection process, verification,
analysis, and reporting.
In total, nine IBWA member companies and one industry peer contributed to the study. The study represents
14.5 million liters1 of bottled water production – an impressive 43 percent of total 2011 United States bottled
water consumption2. This exemplary measure of first-year participation demonstrates the dedication of North
American bottlers to better understand the industry’s water use performance.
1 This study presents results in liters to align with other beverage industry studies (1 liter = 0.2641 US gallon) 2 “U.S. Consumption of Bottled Water Shows Continued Growth, Increasing 6.2 Percent in 2012; Sales up 6.7 Percent”; IBWA, April 2013
Key Study Definitions
Total Water Use: all water used by the facility, including product water, and water used for facility processes (e.g., treatment, cleaning, maintenance, etc.)
Total Production: the volume of finished product developed at the facility
Water Use Ratio: a measure of efficiency defined as total water use / total production

WATER USE RATIO BENCHMARKING STUDY – EXECUTIVE SUMMARY, OCTOBER 2013 | 2
www.anteagroup.com
Industry Performance In total, 62 North American bottled water facilities contributed to the study. These facilities comprise the fixed
data set used as the basis for evaluations throughout this summary report. As seen in Figure 1, total water use
and total water production increased by about 3 percent, while water use ratio remained relatively flat over the
study period. This trend demonstrates that process efficiencies are being recognized while the industry
experiences sustainable growth.
The 2011 water use ratio for North American bottled water facilities was 1.39 L/L, demonstrating a higher level of
performance when compared to the global 2011 average for bottled water facilities3 (1.47 L/L). In general,
bottled water facilities have the lowest water use ratio intensity when compared to other beverage sectors.
According to the 2011 ratio, on average, it takes 1 liter of ingredient water and 4/10 of a liter of water used for
facility processes (e.g., treatment, bottling, etc.) to produce 1 liter of finished bottled water product. In
comparison, other beverage sectors4 such as carbonated soft drink bottling and beer production average have
larger water use ratios driven by higher intensity processes unique to these other beverages, such as flavor mixing,
blending, carbonation, fermentation, etc.
3 Beverage Industry Environmental Roundtable, 2012. 4 Ibid.
Sector Comparison of Process-Driven Water Use Ratios
BOTTLED WATER (1.39 L/L): 1 liter of water for product + 0.39 liter of process water (treatment, bottling, sanitization, etc.) = 1 liter finished bottled water
14.1 14.7 14.5
0.0
5.0
10.0
15.0
20.0
25.0
2009 2010 2011
Prod
uctio
n (M
illio
n KL
)
19.5 20.5 20.1
0.0
5.0
10.0
15.0
20.0
25.0
2009 2010 2011
Wat
er U
se (M
illio
n KL
)
1.38 1.40 1.39
0.00
0.50
1.00
1.50
2.00
2009 2010 2011
Wat
er U
se R
atio
(L/L
)
Figure 1: Industry Water Use, Production, and Efficiency 2009-2011
CARBONATED SOFT DRINKS (2.02 L/L): 1 liter of water for product + 1.02 liters of process water (treatment, bottling, blending, product changeover, sanitization, etc.) = 1 liter finished carbonated soft drink
WATER USE RATIO BENCHMARKING STUDY – EXECUTIVE SUMMARY, OCTOBER 2013 | 3
www.anteagroup.com
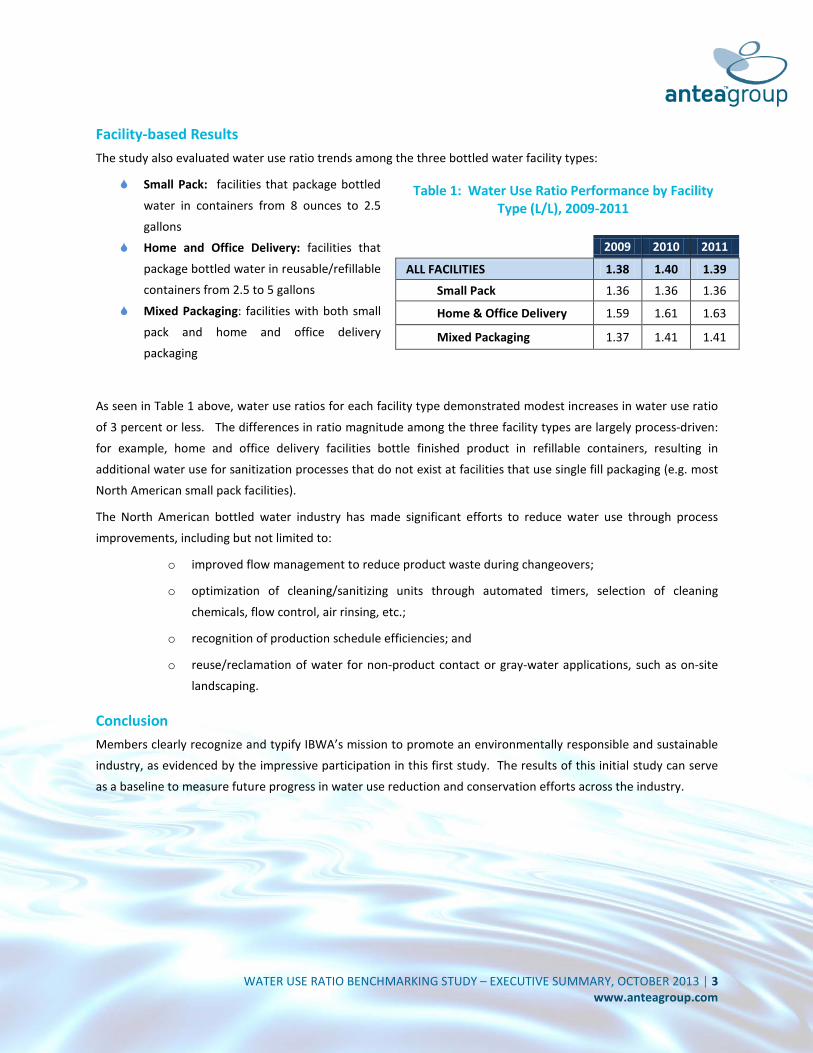
Facility-based Results The study also evaluated water use ratio trends among the three bottled water facility types:
Small Pack: facilities that package bottled
water in containers from 8 ounces to 2.5
gallons
Home and Office Delivery: facilities that
package bottled water in reusable/refillable
containers from 2.5 to 5 gallons
Mixed Packaging: facilities with both small
pack and home and office delivery
packaging
As seen in Table 1 above, water use ratios for each facility type demonstrated modest increases in water use ratio
of 3 percent or less. The differences in ratio magnitude among the three facility types are largely process-driven:
for example, home and office delivery facilities bottle finished product in refillable containers, resulting in
additional water use for sanitization processes that do not exist at facilities that use single fill packaging (e.g. most
North American small pack facilities).
The North American bottled water industry has made significant efforts to reduce water use through process
improvements, including but not limited to:
o improved flow management to reduce product waste during changeovers;
o optimization of cleaning/sanitizing units through automated timers, selection of cleaning
chemicals, flow control, air rinsing, etc.;
o recognition of production schedule efficiencies; and
o reuse/reclamation of water for non-product contact or gray-water applications, such as on-site
landscaping.
Conclusion Members clearly recognize and typify IBWA’s mission to promote an environmentally responsible and sustainable
industry, as evidenced by the impressive participation in this first study. The results of this initial study can serve
as a baseline to measure future progress in water use reduction and conservation efforts across the industry.
Table 1: Water Use Ratio Performance by Facility Type (L/L), 2009-2011
2009 2010 2011
ALL FACILITIES 1.38 1.40 1.39
Small Pack 1.36 1.36 1.36
Home & Office Delivery 1.59 1.61 1.63
Mixed Packaging 1.37 1.41 1.41

Better Business, Better World℠
North American Operations Center
5910 Rice Creek Parkway, Suite 100
St. Paul, MN 55126, USA
800 477 7411 or +1 651 639 9443
European Operations Center
Rivium Westlaan 72
2909 LD Capelle aan den IJssel
P.O. Box 8590
3009 AN Rotterdam
The Netherlands
+31 (0) 10 235 17 45
Latin America Operations Center
Calle 35, No. 7-25 Piso 12
Bogotá, D.C., Colombia
+57 1 327 6300
www.anteagroup.com