Embed Size (px)
Citation preview
Water Utilization Program - Modelling of the Flow Regime and Water Quality of the Tonle Sap MRCS/WUP-FIN DATA REPORT November 2001, Revised August 2002
Water Utilization Program - Modelling of the Flow Regime and Water Quality of the Tonle Sap MRCS/WUP-FIN DATA REPORT November 2001, Revised August 2002 Karri Eloheimo, Seppo Hellsten, Teemu Jantunen, Janos Jozsa, Mikko Kiirikki, Hannu Lauri, Jorma Koponen, Juha Sarkkula, Olli Varis, Markku Virtanen
Acknowledgements The WUP-FIN team wishes to express their deep regrets of the unexpected death of Nop Vanna. He was a vital CNMC counterpart officer to the project, and a friend and respected companion to the team members. This report is dedicated to his memory. The persons responsible for this report are: Juha Sarkkula, team leader - measurements and process description Jorma Koponen – topography and editing of the report Teemu Jantunen - topography Hannu Lauri - GIS and database tools, data products Markku Virtanen – hydrology and water quality Janos Jozsa – meteorology, hydrodynamics and sediments Seppo Hellsten – ecology and impact assessment Olli Varis – socio-economy
MRCS/WUP-FIN Data Report Table of Contents
SUMMARY.................................................................................. 2 1 SUMMARY........................................................................ 2 TOPOGRAPHIC DATA .................................................................. 4 1 TOPOGRAPHIC DATA ACQUISITION.................................... 4 2 REMOTE SENSING IMAGERY.............................................. 6 3 ERS ................................................................................. 7 4 VERTICAL DATUM IN CAMBODIA ...................................... 8 5 TOPOGRAPHIC DATA ACCURACY ASSESSMENT................... 9
5.1 Basis ...............................................................................................9
5.2 Assessment...................................................................................10 6 DESCRIPTION OF THE MAIN TOPOGRAPHIC DATA SETS..... 11
6.1 JICA (Reconnaissance Survey).....................................................11
6.2 Sogreah........................................................................................12
6.3 US Army map...............................................................................13
6.4 Hydrographic Atlas ......................................................................13
6.5 Certeza survey..............................................................................14 7 RADARSAT IMAGES......................................................... 20 8 VOLUMES....................................................................... 23 9 SENSITIVITY OF THE HYDRODYNAM IC AND WATER QUALITY
MODELS TO DEPTHS........................................................ 24 10 DISCUSSION.................................................................... 25 11 BIBLIOGRAPHY............................................................... 28 HYDROLOGY............................................................................ 32 1 HYDROMETEOROLOGY................................................... 32
1.1 General access to the historical weather records ..........................32
1.2 Main emphases in the analysis of historical weather records ........33
1.3 Recorded precipitations................................................................34 1.4 Comparisons with the additional sources of rainfall data............. 36
1.5 Measured evaporations ................................................................37
1.6 Other weather records .................................................................37
1.7 Mutual correlations ......................................................................38 2 HYDROLOGY .................................................................. 39
2.1 General access to the historical flow and water level records ........39
2.2 Emphases in the analysis of historical flow records ......................40
2.3 Recorded water levels...................................................................43
2.4 Direct flow records .......................................................................44
2.5 Relations between the water levels................................................45
2.6 Relations between the flows ..........................................................45
MRCS/WUP-FIN Data Report Table of Contents
2.7 Rating curves ...............................................................................47
2.8 Dependences with weather records ...............................................48 3 SUSPENDED SEDIMENTS AND WATER QUALITY................. 49
3.1 Stations and years ........................................................................49
3.2 Quantities analyzed......................................................................49
3.3 Nutrients, suspended solids and other indicators of water quality50 ECOLOGY AND IMPACT ASSESSMENT........................................ 72 1 PROJECT TASKS AND THE REAL NEEDS IN THE LIGHT OF
TONLE SAP ECOSYSTEM PROPERTIES .............................. 72 2 ESTIMATION OF DATA AVAILABILITY OF TASK “D EFINITION
AND QUANTIFICATION OF LINKS BETWEEN HYDROGRAPHY AND ENVIRONMENTAL IN DICATORS” ............................... 74
2.1 Subtask 1. Areal data of the Tonle Sap floodplain........................74 2.1.1 Hydrological background data...............................................................................75 2.1.2 Areal background data.............................................................................................76 2.1.3 Background data of biodiversity and biological indicators...............................79 2.2 Subtask 2. Creating the links and indicators ................................ 81
3 CONCLUSIONS OF DATA AVAILABILITY............................ 83 4 WORK PLAN AND SCHEDULE ........................................... 84 5 LITERATURE .................................................................. 85 SOCIO-ECONOMICS.................................................................. 86 1 INTRODUCTION .............................................................. 86
1.1 Background..................................................................................86 1.2 Objectives.....................................................................................87
1.3 Target region................................................................................88 2 METHODOLOGY ............................................................. 90
2.1 Structure of the analysis ...............................................................90 2.2 Interviews of local communities....................................................90
2.3 Literature, GIS data and other data.............................................91
2.4 Modelling .....................................................................................92
2.5 An example case study: Management model for the Senegal River 93
3 THE ISSUES..................................................................... 95
3.1 Outline ......................................................................................... 95
3.2 Scenarios ...................................................................................... 96
3.3 External drivers and tendencies ................................................... 97 3.3.1 Local economic progress.........................................................................................97 3.3.2 Local population growth .........................................................................................98 3.3.3 Urbanisation ..............................................................................................................99 3.4 Policy tools ................................................................................... 99
MRCS/WUP-FIN Data Report Table of Contents
3.4.1 Infrastructure construction and rehabilitation......................................................99 3.4.2 Intensification and commercialisation of agriculture and aquaculture..........100 3.4.3 Fisheries management: the lot system and other practices..............................101 3.4.4 Empowerment and development of community-based and traditional management systems ............................................................................................................104 3.4.5 Development of formal institutions.....................................................................105 3.4.6 Enhancing biodiversity conservation..................................................................105 3.4.7 Improvement of education, health care and water supply in villages............106 3.4.8 Waste management systems including sanitation.............................................107 3.5 Environmental impacts .............................................................. 107 3.5.1 Land cover change..................................................................................................108 3.5.2 Soil degradation......................................................................................................109 3.5.3 Eutrophication, oxygen problems and aquatic weeds......................................109 3.5.4 Suspended solids.....................................................................................................110 3.5.5 Water quality: toxic substances............................................................................110 3.5.6 Groundwater degradation and acidity.................................................................110 3.5.7 Biodiversity decline ...............................................................................................111 3.5.8 Fish population decline..........................................................................................111
3.6 Socioeconomic impacts ............................................................... 112 3.6.1 Political instability and social cohesion breakdown.........................................112 3.6.2 Local food security.................................................................................................113 3.7 Local stakeholders ...................................................................... 113 3.7.1 Floating villagers ....................................................................................................113 3.7.2 Other villagers .........................................................................................................115 3.7.3 Commercial producers...........................................................................................115 3.7.4 Tourism services providers...................................................................................115 3.8 National development objectives ................................................ 116 3.8.1 National economy ...................................................................................................116 3.8.2 Urban livelihood.....................................................................................................116 3.8.3 Environmental sustainability ................................................................................116
4 SCHEDULE.....................................................................117 DATA MANAGEMENT ...............................................................120 1 DATA MANAGEMENT .....................................................120
ANNEXES ANNEX 1 Certeza mapping specifications ANNEX 2 List of the meteorological stations in Cambodia ANNEX 3 List of the hydrological stations in Cambodia ANNEX 4 Inception Workshop minutes ANNEX 5 Informal WUP - FIN Model Review Meeting ANNEX 6 Contact list ANNEX 7 Literature lists
MRCS/WUP-FIN Data Report
ACRONYMS AND ABBREVIATIONS
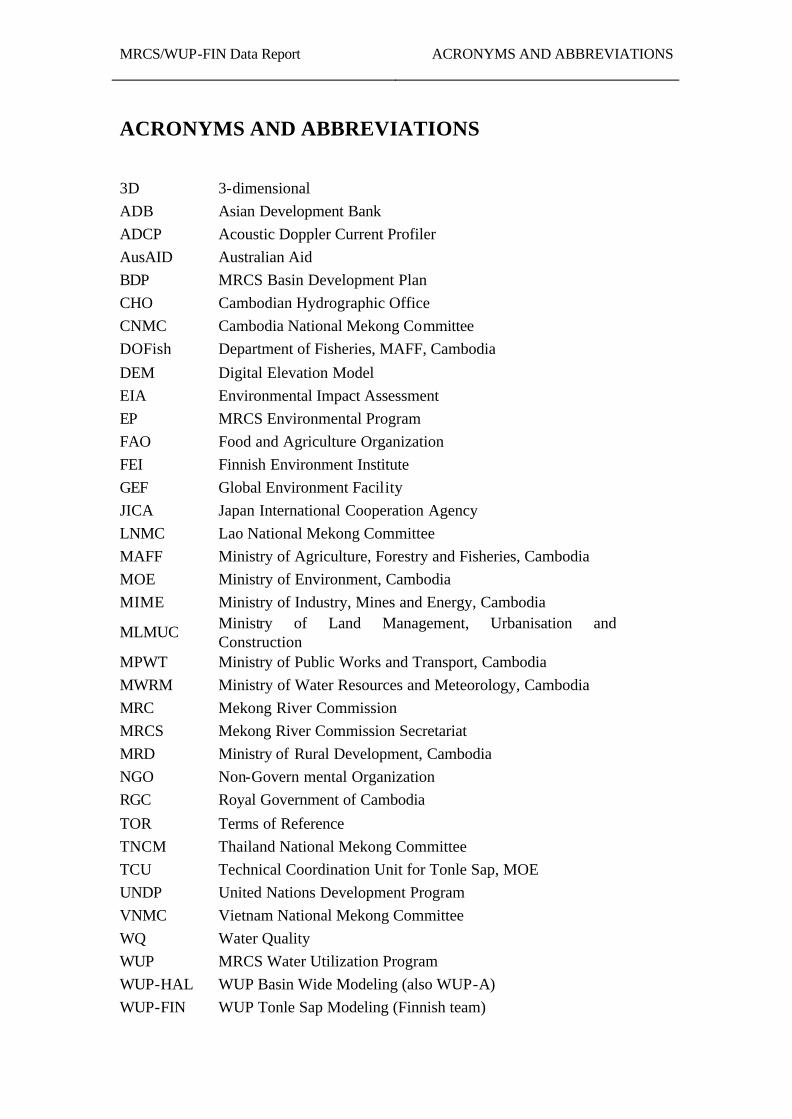
ACRONYMS AND ABBREVIATIONS 3D 3-dimensional ADB Asian Development Bank ADCP Acoustic Doppler Current Profiler AusAID Australian Aid BDP MRCS Basin Development Plan CHO Cambodian Hydrographic Office CNMC Cambodia National Mekong Committee DOFish Department of Fisheries, MAFF, Cambodia DEM Digital Elevation Model EIA Environmental Impact Assessment EP MRCS Environmental Program FAO Food and Agriculture Organization FEI Finnish Environment Institute GEF Global Environment Facility JICA Japan International Cooperation Agency LNMC Lao National Mekong Committee MAFF Ministry of Agriculture, Forestry and Fisheries, Cambodia MOE Ministry of Environment, Cambodia MIME Ministry of Industry, Mines and Energy, Cambodia
MLMUC Ministry of Land Management, Urbanisation and Construction
MPWT Ministry of Public Works and Transport, Cambodia MWRM Ministry of Water Resources and Meteorology, Cambodia MRC Mekong River Commission MRCS Mekong River Commission Secretariat MRD Ministry of Rural Development, Cambodia NGO Non-Govern mental Organization RGC Royal Government of Cambodia TOR Terms of Reference TNCM Thailand National Mekong Committee TCU Technical Coordination Unit for Tonle Sap, MOE UNDP United Nations Development Program VNMC Vietnam National Mekong Committee WQ Water Quality WUP MRCS Water Utilization Program WUP-HAL WUP Basin Wide Modeling (also WUP-A) WUP-FIN WUP Tonle Sap Modeling (Finnish team)
MRCS/WUP-FIN Data Report
ACRONYMS AND ABBREVIATIONS
2
SUMMARY
1 Summary Project “Modelling of the Flow Regime and Water Quality of the Tonle Sap” (WUP-FIN) is a complementary project to the Mekong River Commission Water Utilization Programme (WUP). It is funded by the Development Cooperation Department, Ministry of Foreign Affairs, Finland. Project has started on June 4th 2001. Project aims at creating means to understand physical, chemical and biological processes in the Tonle Sap and to assist in the maintenance of sustainable conditions of the lake. The main objectives are:
− to support MRCS, NMCs, Cambodian line agencies, and NGO’s by providing an enhanced knowledge base, analytical tools and guidelines, that are based on improved understanding of the interaction between the physical and biological features of the lake and their changes that may occur due to human activities;
− to create means to assist in the maintenance of sustainable conditions of the Tonle Sap system;
− to assist, through on-the-job and other training, in increasing the modelling capability of the MRCS, CNMC and the line agencies and to help create a sustainable modelling group
− to ensure that the modelling framework allows future adaptation to include new modules for analysing and predicting impacts of proposed actions on the aquatic ecosystem, water uses and socio-economic functions.
Project consists of field measurements, modelling, socio-economic analysis and preparation of management tools as well as training program. Advanced hydrological, hydrodynamic, water quality and eutrophication models will be used in the project. The present report summarizes the data review and phase of the project. The data collected includes topography, meteorology, hydrology, water quality, habitats, fisheries and socio-economy. Available literature of the lake has been collected. Preliminary data analysis has been conducted and a concepts of the processes is described. It will be tested and complemented with future measurements and model results. The main sections of the data report are:
• Topographic data • Wind • Hydrology • Water quality • Ecology and impact assessment • Socio-economy
MRCS/WUP-FIN Data Report
ACRONYMS AND ABBREVIATIONS
3
• Data management system • Data collection plan
Analysis of the existing data reveals that by far the largest data gaps are connected to the watershed and lake processes - for instance rainfall, detailed rainfall- runoff response, floodplain and lake hydrodynamics, mass balances, behaviour of sediments in the lake, flood plain water quality and nature of the primary production. These are essential features that determine the future development of the lake, morphological changes affecting navigation and water levels, condition of the fisheries and response to the upstream changes in flow and water quality. Cooperation with the University of Washington which have done similar studies in the Amazon basin has been initiated by the MRCS. It offers an opportunity to expand the restricted scope of the field measurements especially to the primary production. The primary topographic data used in the project has been Certeza survey from 1964 which is based on existing (at that time) first and second order levelling around the lake, 1400 linear km’s of profile surveys and photogrammetry. The data has been compared to other topographic data, satellite data and a recent survey. Comparison indicates that data is accurate enough for the modelling purposes.
MRCS/WUP-FIN, Data Report
Topographic Data
4
TOPOGRAPHIC DATA
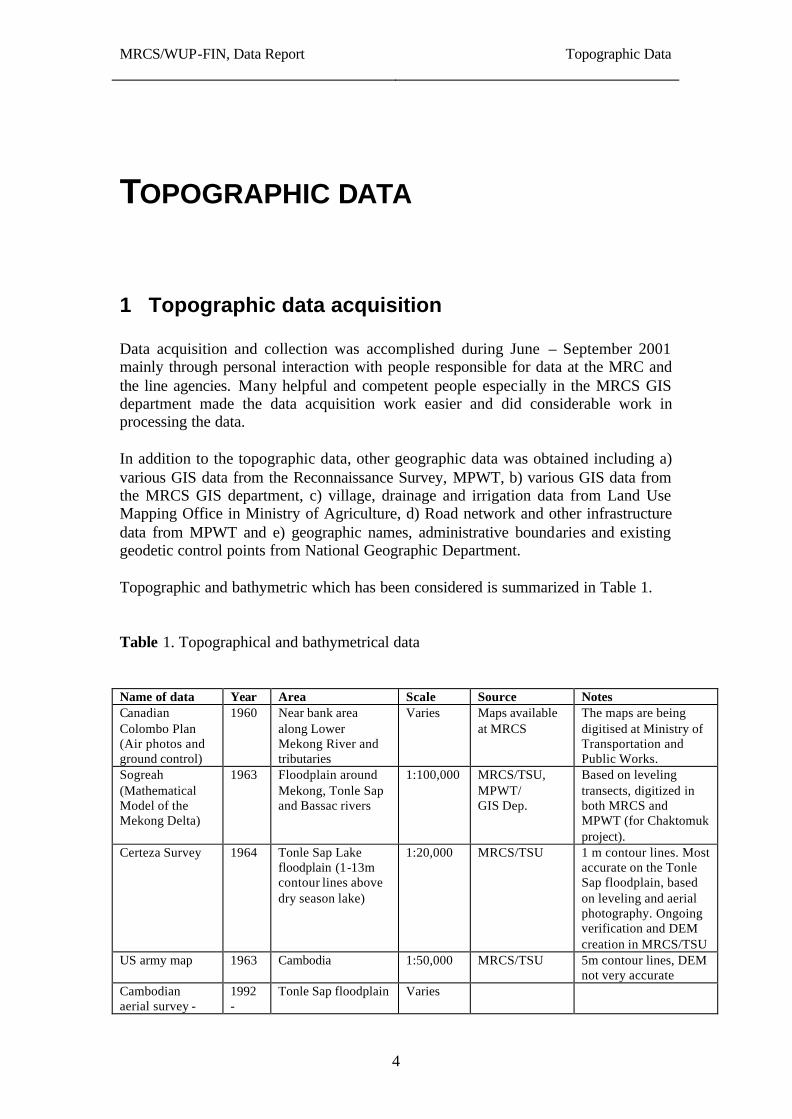
1 Topographic data acquisition Data acquisition and collection was accomplished during June – September 2001 mainly through personal interaction with people responsible for data at the MRC and the line agencies. Many helpful and competent people especially in the MRCS GIS department made the data acquisition work easier and did considerable work in processing the data. In addition to the topographic data, other geographic data was obtained including a) various GIS data from the Reconnaissance Survey, MPWT, b) various GIS data from the MRCS GIS department, c) village, drainage and irrigation data from Land Use Mapping Office in Ministry of Agriculture, d) Road network and other infrastructure data from MPWT and e) geographic names, administrative boundaries and existing geodetic control points from National Geographic Department. Topographic and bathymetric which has been considered is summarized in Table 1. Table 1. Topographical and bathymetrical data Name of data Year Area Scale Source Notes Canadian Colombo Plan (Air photos and ground control)
1960 Near bank area along Lower Mekong River and tributaries
Varies Maps available at MRCS
The maps are being digitised at Ministry of Transportation and Public Works.
Sogreah (Mathematical Model of the Mekong Delta)
1963 Floodplain around Mekong, Tonle Sap and Bassac rivers
1:100,000 MRCS/TSU, MPWT/ GIS Dep.
Based on leveling transects, digitized in both MRCS and MPWT (for Chaktomuk project).
Certeza Survey 1964 Tonle Sap Lake floodplain (1-13m contour lines above dry season lake)
1:20,000 MRCS/TSU 1 m contour lines. Most accurate on the Tonle Sap floodplain, based on leveling and aerial photography. Ongoing verification and DEM creation in MRCS/TSU
US army map 1963 Cambodia 1:50,000 MRCS/TSU 5m contour lines, DEM not very accurate
Cambodian aerial survey -
1992 -
Tonle Sap floodplain Varies
MRCS/WUP-FIN, Data Report
Topographic Data
5
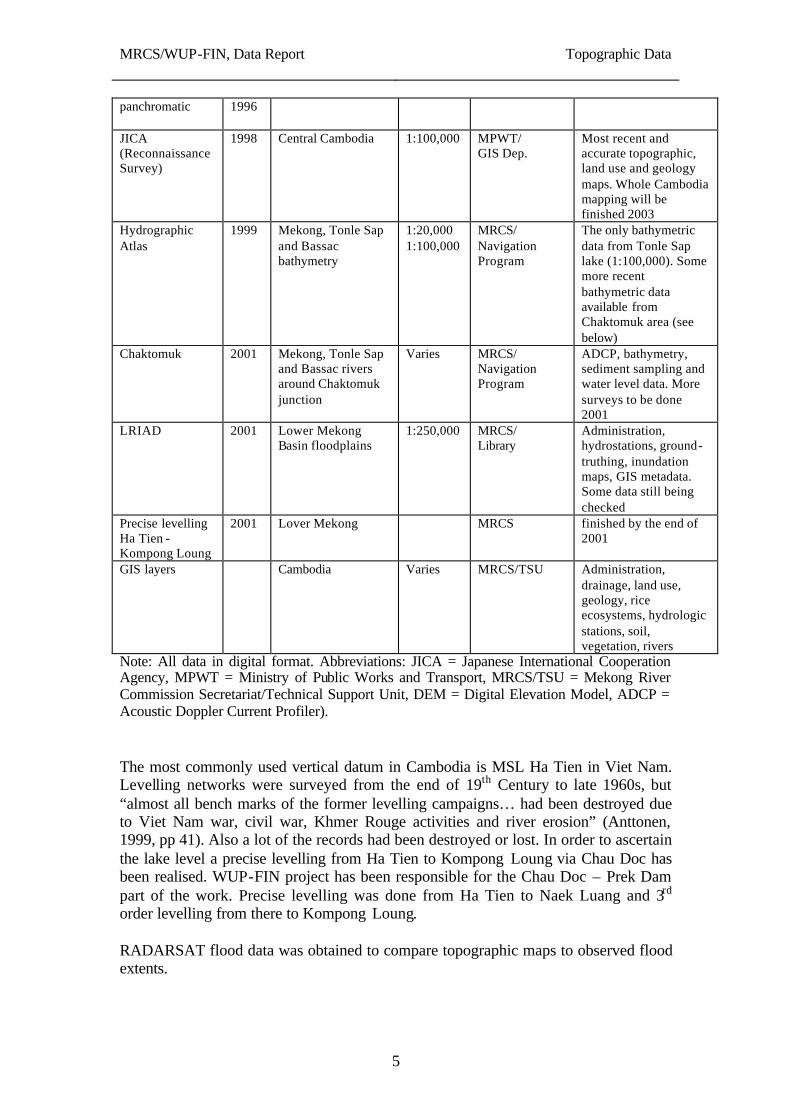
panchromatic
1996
JICA (Reconnaissance Survey)
1998 Central Cambodia 1:100,000 MPWT/ GIS Dep.
Most recent and accurate topographic, land use and geology maps. Whole Cambodia mapping will be finished 2003
Hydrographic Atlas
1999 Mekong, Tonle Sap and Bassac bathymetry
1:20,000 1:100,000
MRCS/ Navigation Program
The only bathymetric data from Tonle Sap lake (1:100,000). Some more recent bathymetric data available from Chaktomuk area (see below)
Chaktomuk 2001 Mekong, Tonle Sap and Bassac rivers around Chaktomuk junction
Varies MRCS/ Navigation Program
ADCP, bathymetry, sediment sampling and water level data. More surveys to be done 2001
LRIAD 2001 Lower Mekong Basin floodplains
1:250,000 MRCS/ Library
Administration, hydrostations, ground-truthing, inundation maps, GIS metadata. Some data still being checked
Precise levelling Ha Tien - Kompong Loung
2001 Lover Mekong MRCS finished by the end of 2001
GIS layers Cambodia Varies MRCS/TSU Administration, drainage, land use, geology, rice ecosystems, hydrologic stations, soil, vegetation, rivers
Note: All data in digital format. Abbreviations: JICA = Japanese International Cooperation Agency, MPWT = Ministry of Public Works and Transport, MRCS/TSU = Mekong River Commission Secretariat/Technical Support Unit, DEM = Digital Elevation Model, ADCP = Acoustic Doppler Current Profiler). The most commonly used vertical datum in Cambodia is MSL Ha Tien in Viet Nam. Levelling networks were surveyed from the end of 19th Century to late 1960s, but “almost all bench marks of the former levelling campaigns… had been destroyed due to Viet Nam war, civil war, Khmer Rouge activities and river erosion” (Anttonen, 1999, pp 41). Also a lot of the records had been destroyed or lost. In order to ascertain the lake level a precise levelling from Ha Tien to Kompong Loung via Chau Doc has been realised. WUP-FIN project has been responsible for the Chau Doc – Prek Dam part of the work. Precise levelling was done from Ha Tien to Naek Luang and 3rd order levelling from there to Kompong Loung. RADARSAT flood data was obtained to compare topographic maps to observed flood extents.
MRCS/WUP-FIN, Data Report
Topographic Data
6
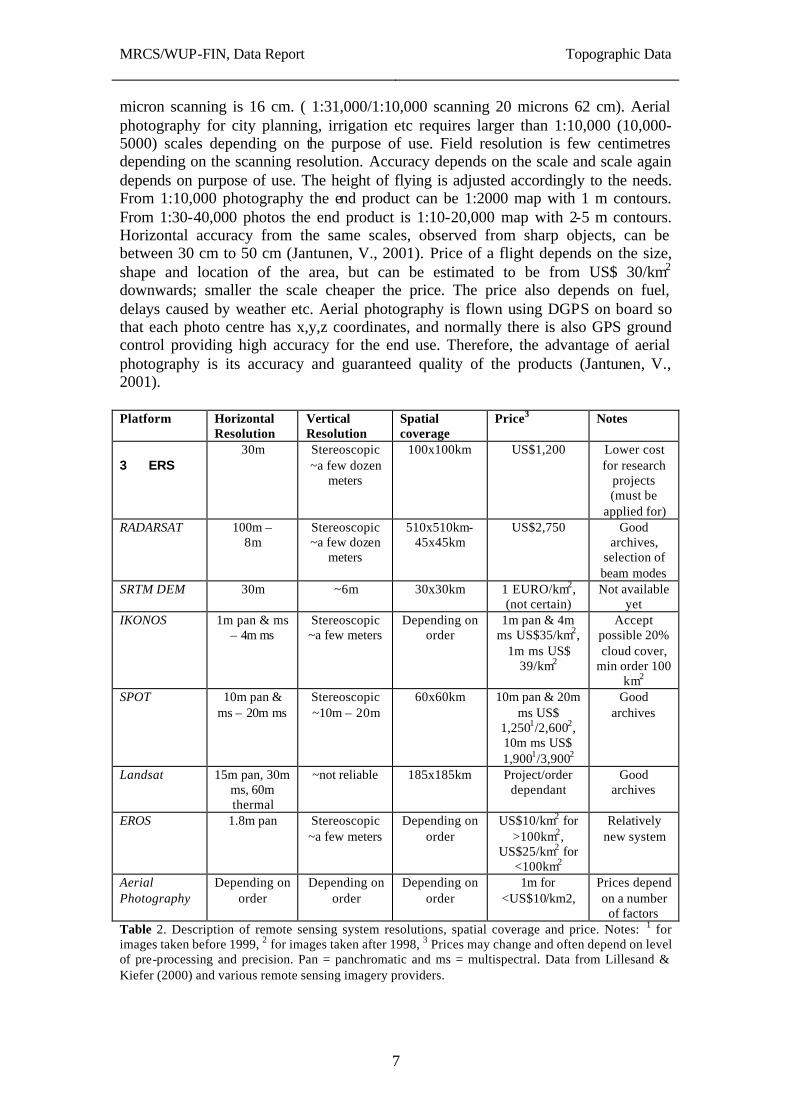
2 Remote sensing imagery Remote sensing imagery was limited in availability and often only the end products, such as thematic maps produced from remote sensing imagery, were available for the project. Nevertheless, for the purpose of assessing the usability of optical imagery Landsat and SPOT images were obtained from MOWRAM and additional SPOT and Landsat images requested from MPWT GIS department through the MRCS/CNMC, but these images have not yet been obtained. Further use of remote sensing imagery would be useful for the model verification in terms of ana lysis of flow patterns in the lake and changes in floodplain from optical imagery. Also, image archives enable the study of environmental change in the area in terms of vegetation patterns and biological production. Biological production after the flood has receded could also be studied using the NDVI (Normalized Difference Vegetation Index) from eg. Landsat images. However, the limitation of using optical imagery (IKONOS, SPOT, Landsat and EROS) is that persistent cloud cover prevents image acquisition for much of the year. The best time for optical image acquisition is from November to March, leaving most of the annual flooding cycle out of the reach of optical images. This is when aerial photography is mainly done in Cambodia to ensure good quality images. However, from archive images the extent of cloud cover can be checked before acquisition and a good collection of these exist in the Centre for Remote Imaging, Sensing and Processing in Singapore (CRISP). Additional problems are caused by poor vertical accuracy and infrequent fly-passes by many of the satellites. The radar imagery are proven to be useful for inundation extent mapping, because they are able to penetrate the persisting cloud cover in almost any conditions and are remarkably good for water surface delineation (HATFIELD, 2000 and 2001). However, field verification and good base data (DEM and land use) is required because paddy fields can often be misinterpreted as flooded areas. Also, the radar imagery usefulness is limited because of their fairly poor resolution. Stereoscopic imaging is a possibility in many of the remote sensing systems listed below (table 2). However, if stereoscopic imagery is used for DEM production the cost will be much higher because at least twice the amount of images is required. Moreover, DEMs produced from very flat areas (such as Tonle Sap floodplain) is inaccurate and often useless. SRTM (Shuttle Radar Topographic Mission) is an international project led by NASA and National Imagery and Mapping Agency (NIMA). “The information collected by SRTM will be used to provide a tool to enhance the activities of scientists, the military, commercial, and civilian users” (SRTM homepage, 23.2.2002). However, the data analysis is not complete yet and therefore the overall accuracy and price of the data is not known. However, the whole dataset is predicted to be finished by mid- 2003 and its accuracy looks fairly promising so far. Data and price request has been filed to the company responsible for data distribution. Aerial photography is flown for different purposes depending on the use and the scale and the height of flying is selected according to the purpose. Air photos are flown on smaller scale for the sake of coverage and then enlarged to the actual scale of use. Characteristic for an air photo is the powerful enlargement that can be obtained by several means. Normally aerial photography is used for national mapping, forest (environmental) management etc. The scale of such photography is normally 1:15,000 or smaller corresponding to mapping scales such as 1:5 000. Field resolution on 10
MRCS/WUP-FIN, Data Report
Topographic Data
7
micron scanning is 16 cm. ( 1:31,000/1:10,000 scanning 20 microns 62 cm). Aerial photography for city planning, irrigation etc requires larger than 1:10,000 (10,000-5000) scales depending on the purpose of use. Field resolution is few centimetres depending on the scanning resolution. Accuracy depends on the scale and scale again depends on purpose of use. The height of flying is adjusted accordingly to the needs. From 1:10,000 photography the end product can be 1:2000 map with 1 m contours. From 1:30-40,000 photos the end product is 1:10-20,000 map with 2-5 m contours. Horizontal accuracy from the same scales, observed from sharp objects, can be between 30 cm to 50 cm (Jantunen, V., 2001). Price of a flight depends on the size, shape and location of the area, but can be estimated to be from US$ 30/km2 downwards; smaller the scale cheaper the price. The price also depends on fuel, delays caused by weather etc. Aerial photography is flown using DGPS on board so that each photo centre has x,y,z coordinates, and normally there is also GPS ground control providing high accuracy for the end use. Therefore, the advantage of aerial photography is its accuracy and guaranteed quality of the products (Jantunen, V., 2001).
Platform Horizontal
Resolution Vertical Resolution
Spatial coverage
Price3 Notes
3 ERS 30m Stereoscopic
~a few dozen meters
100x100km US$1,200 Lower cost for research
projects (must be
applied for) RADARSAT 100m –
8m Stereoscopic ~a few dozen
meters
510x510km- 45x45km
US$2,750 Good archives,
selection of beam modes
SRTM DEM 30m ~6m 30x30km 1 EURO/km2, (not certain)
Not available yet
IKONOS 1m pan & ms – 4m ms
Stereoscopic ~a few meters
Depending on order
1m pan & 4m ms US$35/km2,
1m ms US$ 39/km2
Accept possible 20% cloud cover,
min order 100 km2
SPOT 10m pan & ms – 20m ms
Stereoscopic ~10m – 20m
60x60km 10m pan & 20m ms US$
1,2501/2,6002, 10m ms US$ 1,9001/3,9002
Good archives
Landsat 15m pan, 30m ms, 60m thermal
~not reliable 185x185km Project/order dependant
Good archives
EROS 1.8m pan Stereoscopic ~a few meters
Depending on order
US$10/km2 for >100km2,
US$25/km2 for <100km2
Relatively new system
Aerial Photography
Depending on order
Depending on order
Depending on order
1m for <US$10/km2,
Prices depend on a number
of factors Table 2. Description of remote sensing system resolutions, spatial coverage and price. Notes: 1 for images taken before 1999, 2 for images taken after 1998, 3 Prices may change and often depend on level of pre-processing and precision. Pan = panchromatic and ms = multispectral. Data from Lillesand & Kiefer (2000) and various remote sensing imagery providers.
MRCS/WUP-FIN, Data Report
Topographic Data
8
4 Vertical datum in Cambodia Datums are calculated to best fit the surveys in each country to the true terrain. Selection of datum depends on the shape of the country. Survey data is made to fit the datum by control points (x,y), which are known in that particular datum (as a skeleton). The control points can be horizontal (x,y) as well as vertical (z), which are often referred to MSL. Vertical control points are called Bench marks and MSL takes ten to thirty years to establish. Single survey data must be calculated, adjusted and converted to the national control points and national datum. Georeferencing connects the used data to existing datum. Accuracy of the data is good with or without georeferencing, but if the georeferencing is not done the data is alone (floating) in its own system, and cannot be used together with other data or compared (Jantunen, V., 2001). The accuracy of different topographic maps comes from the control network, skeleton. If the network is for example precise levelling and other levelling lines are connected and adjusted to the precise line, the accuracy can be expected to be good. If such work is old, it is normally checked by sets of observations to establish the quality of the work (done by earlier instruments, manual adjustments vs. computerised etc). If the network is not precise levelling the accuracy is less and it is also more difficult to establish its quality level. The most commonly used vertical datum in Cambodia is MSL Ha Tien in Viet Nam. Levelling networks were surveyed from the end of 19th Century to late 1960s, but “almost all bench marks of the former levelling campaigns… had been destroyed due to Viet Nam war, civil war, Khmer Rouge activities and river erosion” (Anttonen, 1999, pp 41). Also a lot of the records had been destroyed or lost. In order to ascertain the lake level a precise levelling from Ha Tien to Kompong Loung via Chau Doc has been realised. WUP-FIN project has been responsible for the Chau Doc to Prek Dam part of the work. The new precise levelling campaign is taking place from Ha Tien in Viet Nam to Prek Kdam in Cambodia, extended by 3rd order levelling line to Kampong Loung. The levelling work is expected to be finished by the end of January 2002 (Järvinen, 2001). Still, this levelling does not cover the very flat floodplain of the Tonle Sap Lake, where last levelling campaign covering the floodplain was done some 37 years ago. Quite clearly an estimation of the rate and extent of environment changes during this period is required in order to assess the accuracy of the old topographic maps from the area. “One can clearly see that a vertical difference in centimeters will represent a huge variation in the water volume of the Great Lake. Many studies have challenged the issue of the siltation rate of the lake bed but not one study can claim perfect accuracy because no clear comparison can be made with respect to an official vertical base reference” (MRC, 1999; In: Anttonen, 1999, pp 84). In addition, the Tonle Sap Lake is influenced by tidal variations and therefore it is essential to know the precise elevation of the lake in relation to MSL. The effect of tide is not known due to the lack of accurate elevation points around the lake (the level of comparison). Even if there were elevation observations from water gauges the estimation of the effect of the tide is not possible if there is no precise comparison to the MSL.
MRCS/WUP-FIN, Data Report
Topographic Data
9
5 Topographic data accuracy assessment
5.1 Basis Field survey data is defined according to the requirements of the final use of data, or the end product. The measurements can be planned to reach any accuracy, but obtaining high accuracy is can be expensive and compromises are often required. For example the accuracy in elevations for water and sewarage pipe lines depend on the terrain. On a flat land the gradient needed to provide the flow requires accuracy of centimetres and therefore there cannot be compromises. Field survey is today done by GPS, total stations and levelling instruments, and each instrument is designed for different accuracy beginning from millimeters. Often high precision work is time consuming, and more so in difficult terrain, which also needs to be considered. Technical development has brought accuracy and simplicity to surveying instruments. The more simple (looking) the more accurate the systems are. When comparing the performance of e.g. GPS survey against total station in traversing control points through forest or shrub the same points must be compared. In levelling digital instruments have brought improvements and reliability when compared to the old systems. The normal procedure is to establish the quality of an old surveys is by redoing part of it by present instruments. Topographic data accuracy is essential in terms of model accuracy and therefore the data was checked. The accuracy of a DEM is a function of interrelations of a number of variables, which are the method of data acquisition, nature (density and distribution) of the input data and methods employed in creating the DEM (the system used). The horizontal accuracy of a contour is a matter of map drawing accuracy. Table 3 provides average map accuracies when compared to the scale of the map. On a 1:10,000 scale the drawing accuracy (0,2 mm) is +/- 2m, or on 1:50,000 scale +/- 20 m in the field. The vertical accuracy is important, because it defines the amount of water in the basin. For example in the Finnish Base Mapping (1948-1975), where photography was flown on 1:31,000 scale, the field work was made on 1:10,000 scale and final colour printing on 1:20,000 scale, and then the contour intervals of 5 m was achieved. This comes from the flight altitude and from the typical Finnish terrain, which is mostly rolling little hills, with angle of terrain slope around 10-15 gons. If the terrain is more flat this altitude of flying is not suitable for contouring. Taking as an example the country of Bangladesh, which is very flat, the basic mapping was done on 1:10,000 scale with 0,25 cm contour intervals. Such interval is not possible by photogrammetric means, but need to be done in the field by levelling (Jantunen, V., 2001). From the higher altitude and smaller scale photography, for example 1:40,000, the accuracy of contouring can be satisfactory only on a hilly terrain. The Tonle Sap areas terrain can be compared to Bangladesh. Therefore five meter contours from high altitude flight may produce spot heights with an accuracy of 2-3 meters. Clearly this is not sufficient, especially in cases where water volumes are calculated from very flat areas, where 1 m error in elevation has tremendous effect. Scale normally explains what can be expected from a map. The mapping originates from the purpose of the mapping. Maps for municipal engineering are on scales 1:500-1:2000, cadastral map
MRCS/WUP-FIN, Data Report
Topographic Data
10
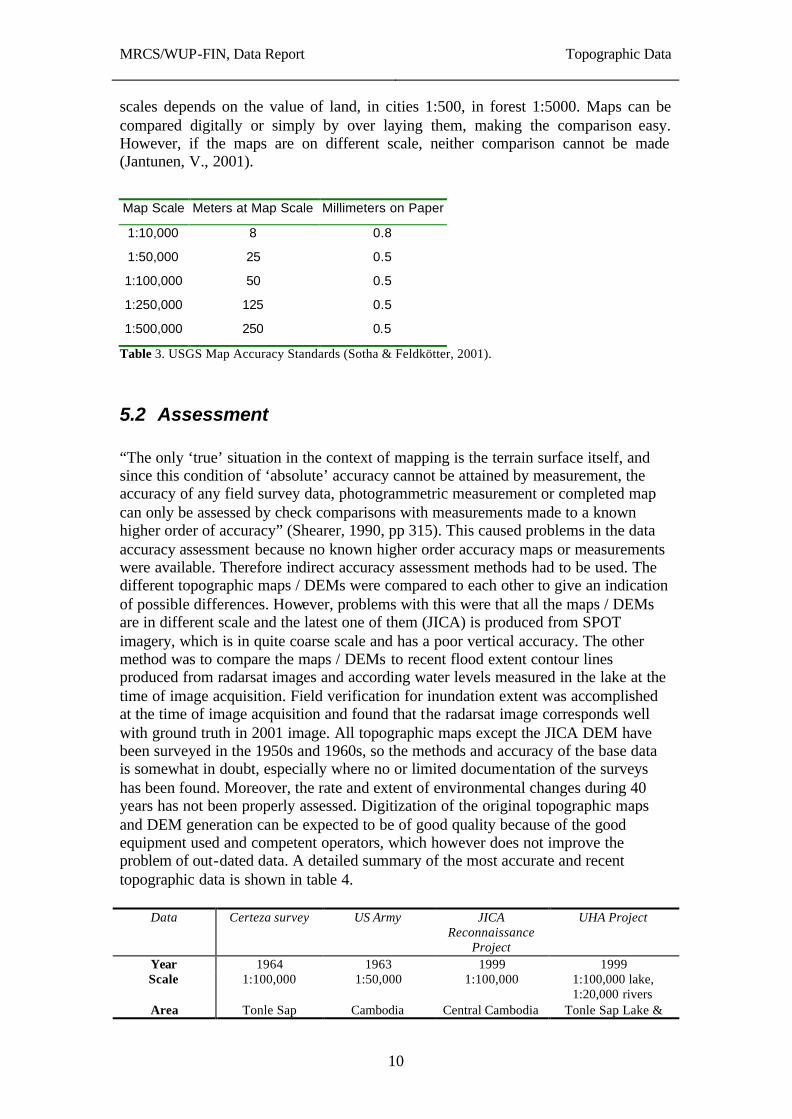
scales depends on the value of land, in cities 1:500, in forest 1:5000. Maps can be compared digitally or simply by over laying them, making the comparison easy. However, if the maps are on different scale, neither comparison cannot be made (Jantunen, V., 2001).
Map Scale Meters at Map Scale Millimeters on Paper
1:10,000 8 0.8
1:50,000 25 0.5
1:100,000 50 0.5
1:250,000 125 0.5
1:500,000 250 0.5
Table 3. USGS Map Accuracy Standards (Sotha & Feldkötter, 2001).
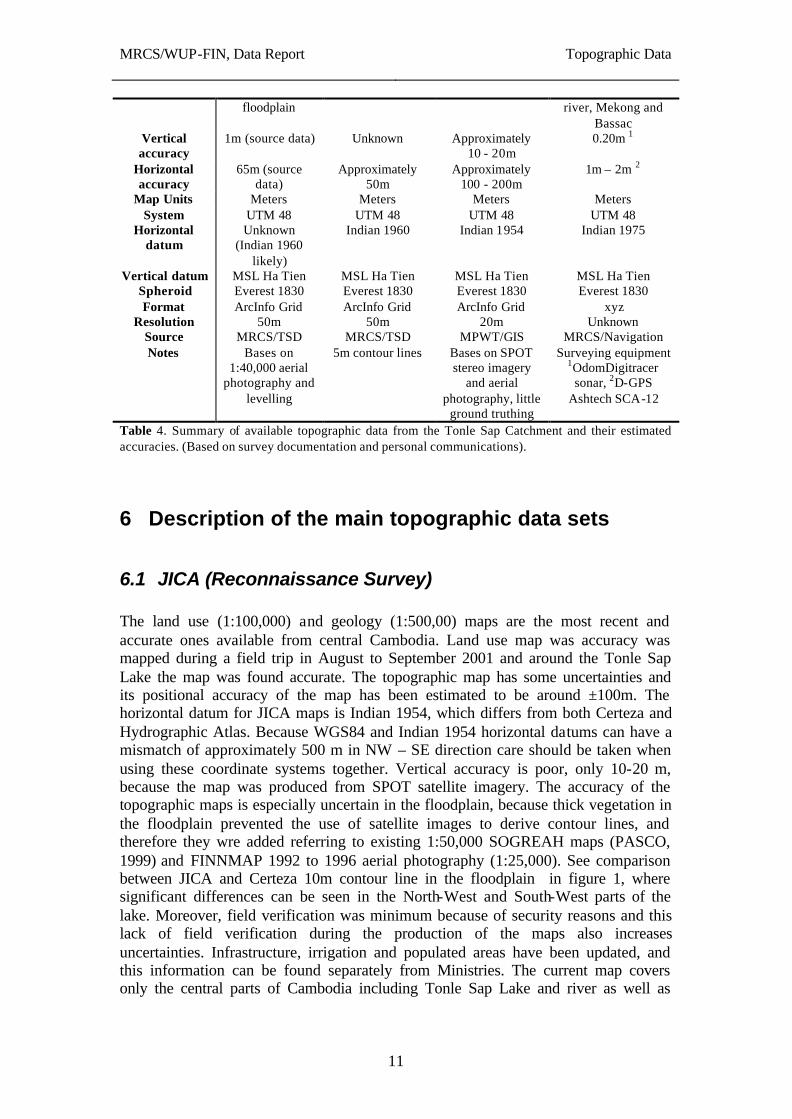
5.2 Assessment “The only ‘true’ situation in the context of mapping is the terrain surface itself, and since this condition of ‘absolute’ accuracy cannot be attained by measurement, the accuracy of any field survey data, photogrammetric measurement or completed map can only be assessed by check comparisons with measurements made to a known higher order of accuracy” (Shearer, 1990, pp 315). This caused problems in the data accuracy assessment because no known higher order accuracy maps or measurements were available. Therefore indirect accuracy assessment methods had to be used. The different topographic maps / DEMs were compared to each other to give an indication of possible differences. However, problems with this were that all the maps / DEMs are in different scale and the latest one of them (JICA) is produced from SPOT imagery, which is in quite coarse scale and has a poor vertical accuracy. The other method was to compare the maps / DEMs to recent flood extent contour lines produced from radarsat images and according water levels measured in the lake at the time of image acquisition. Field verification for inundation extent was accomplished at the time of image acquisition and found that the radarsat image corresponds well with ground truth in 2001 image. All topographic maps except the JICA DEM have been surveyed in the 1950s and 1960s, so the methods and accuracy of the base data is somewhat in doubt, especially where no or limited documentation of the surveys has been found. Moreover, the rate and extent of environmental changes during 40 years has not been properly assessed. Digitization of the original topographic maps and DEM generation can be expected to be of good quality because of the good equipment used and competent operators, which however does not improve the problem of out-dated data. A detailed summary of the most accurate and recent topographic data is shown in table 4.
Data Certeza survey US Army JICA Reconnaissance
Project
UHA Project
Year 1964 1963 1999 1999 Scale 1:100,000
1:50,000 1:100,000 1:100,000 lake,
1:20,000 rivers Area Tonle Sap Cambodia Central Cambodia Tonle Sap Lake &
MRCS/WUP-FIN, Data Report
Topographic Data
11
floodplain river, Mekong and Bassac
Vertical accuracy
1m (source data) Unknown Approximately 10 - 20m
0.20m 1
Horizontal accuracy
65m (source data)
Approximately 50m
Approximately 100 - 200m
1m – 2m 2
Map Units Meters Meters Meters Meters System UTM 48 UTM 48 UTM 48 UTM 48
Horizontal datum
Unknown (Indian 1960
likely)
Indian 1960 Indian 1954 Indian 1975
Vertical datum MSL Ha Tien MSL Ha Tien MSL Ha Tien MSL Ha Tien Spheroid Everest 1830 Everest 1830 Everest 1830 Everest 1830 Format ArcInfo Grid ArcInfo Grid ArcInfo Grid xyz
Resolution 50m 50m 20m Unknown Source MRCS/TSD MRCS/TSD MPWT/GIS MRCS/Navigation Notes Bases on
1:40,000 aerial photography and
levelling
5m contour lines Bases on SPOT stereo imagery
and aerial photography, little
ground truthing
Surveying equipment 1OdomDigitracer
sonar, 2D-GPS Ashtech SCA-12
Table 4. Summary of available topographic data from the Tonle Sap Catchment and their estimated accuracies. (Based on survey documentation and personal communications).
6 Description of the main topographic data sets
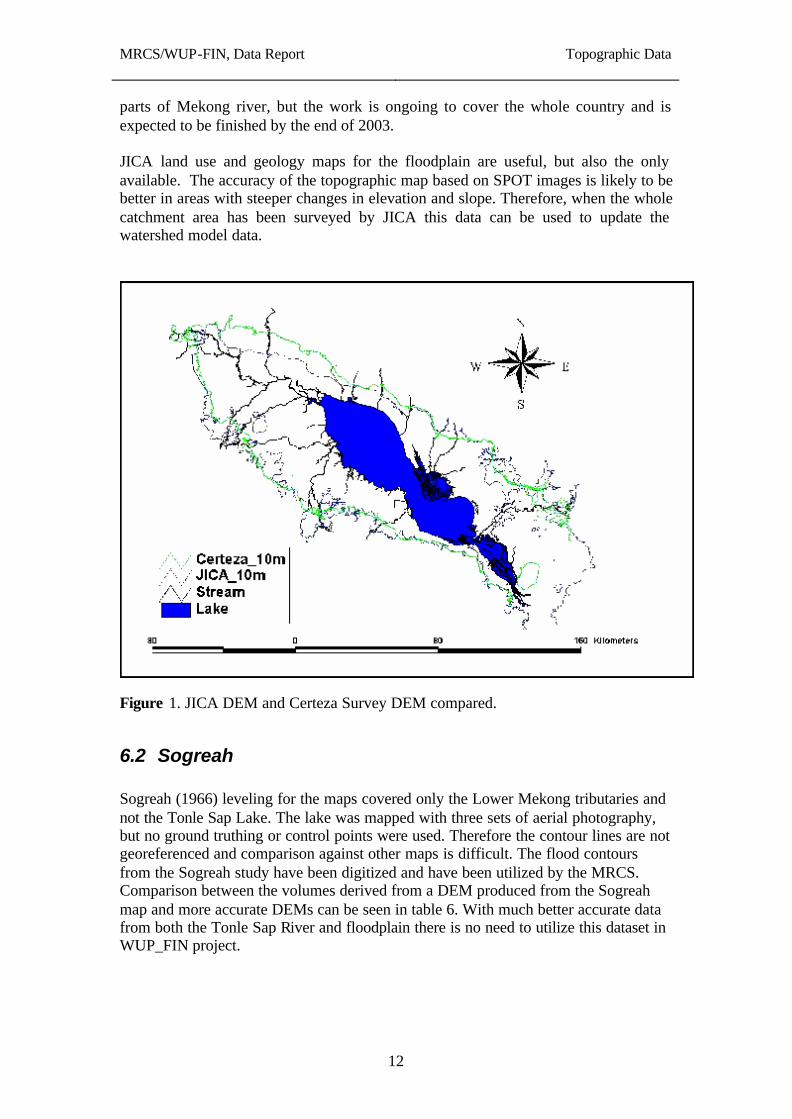
6.1 JICA (Reconnaissance Survey) The land use (1:100,000) and geology (1:500,00) maps are the most recent and accurate ones available from central Cambodia. Land use map was accuracy was mapped during a field trip in August to September 2001 and around the Tonle Sap Lake the map was found accurate. The topographic map has some uncertainties and its positional accuracy of the map has been estimated to be around ±100m. The horizontal datum for JICA maps is Indian 1954, which differs from both Certeza and Hydrographic Atlas. Because WGS84 and Indian 1954 horizontal datums can have a mismatch of approximately 500 m in NW – SE direction care should be taken when using these coordinate systems together. Vertical accuracy is poor, only 10-20 m, because the map was produced from SPOT satellite imagery. The accuracy of the topographic maps is especially uncertain in the floodplain, because thick vegetation in the floodplain prevented the use of satellite images to derive contour lines, and therefore they wre added referring to existing 1:50,000 SOGREAH maps (PASCO, 1999) and FINNMAP 1992 to 1996 aerial photography (1:25,000). See comparison between JICA and Certeza 10m contour line in the floodplain in figure 1, where significant differences can be seen in the North-West and South-West parts of the lake. Moreover, field verification was minimum because of security reasons and this lack of field verification during the production of the maps also increases uncertainties. Infrastructure, irrigation and populated areas have been updated, and this information can be found separately from Ministries. The current map covers only the central parts of Cambodia including Tonle Sap Lake and river as well as
MRCS/WUP-FIN, Data Report
Topographic Data
12
parts of Mekong river, but the work is ongoing to cover the whole country and is expected to be finished by the end of 2003. JICA land use and geology maps for the floodplain are useful, but also the only available. The accuracy of the topographic map based on SPOT images is likely to be better in areas with steeper changes in elevation and slope. Therefore, when the whole catchment area has been surveyed by JICA this data can be used to update the watershed model data.
Figure 1. JICA DEM and Certeza Survey DEM compared.
6.2 Sogreah Sogreah (1966) leveling for the maps covered only the Lower Mekong tributaries and not the Tonle Sap Lake. The lake was mapped with three sets of aerial photography, but no ground truthing or control points were used. Therefore the contour lines are not georeferenced and comparison against other maps is difficult. The flood contours from the Sogreah study have been digitized and have been utilized by the MRCS. Comparison between the volumes derived from a DEM produced from the Sogreah map and more accurate DEMs can be seen in table 6. With much better accurate data from both the Tonle Sap River and floodplain there is no need to utilize this dataset in WUP_FIN project.
MRCS/WUP-FIN, Data Report
Topographic Data
13
6.3 US Army map
The US Defence Mapping Agency (DMA) produced this topographic map from aerial photography and related ground surveys, and it was digitized by MRCS/TSU for DEM production. The map and DEM are not very useful in the floodplain because of the 5m contour lines. However, the map is the only one available covering the whole catchment at the moment. Documentation for the digitization and DEM generation can be found, but the map has been digitized many times and the original topographic maps have not been found (Himel, 2001, personal communication). Positional accuracy of the DEM is about ±50m, but in the maps infrastructure, irrigation and populated places are largely outdated. The extent of environmental changes are not known, but digitization and DEM production can be expected to be good quality. The DEM is used for the catchment-wide topographic data for now, as nothing more accarate is available. When the JICA country-wide 1:100,000 DEM is finished additional accuracy assessment and comparison between the two can be done. US DMA DEM is compared to the Certeza Survey DEM in figure 5 which shows that it is accurate enough for watershed modelling.
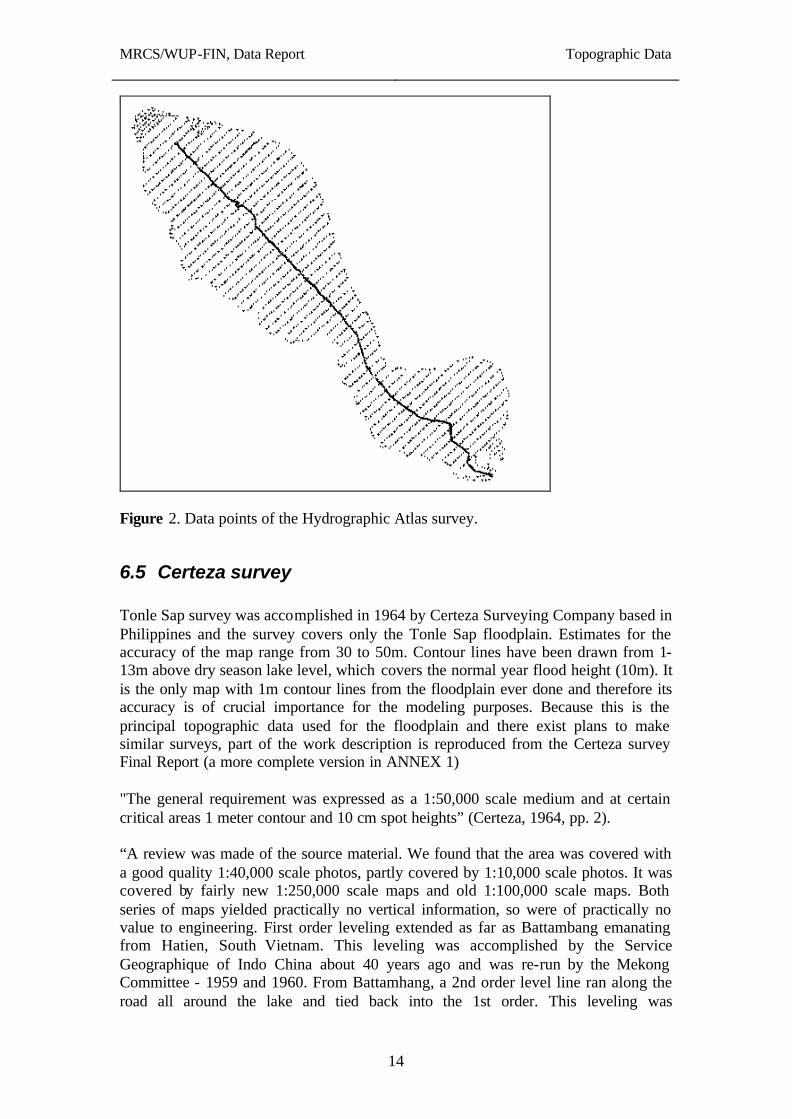
6.4 Hydrographic Atlas A topo-hydrographic survey of the Lower Mekong Basin was carried out by the Mekong Committee between 1960 and 1965 and an update was clearly needed. Updating of the Hydrographic Atlas (UHA) project in Cambodia was done between 1994 and 1999 by FINNMAP and it included Mekong, Bassac and Tonle Sap rivers as well as Tonle Sap Lake. The Tonle Sap lake was surveyed from October to November 1998 and LLW (Lowest Low Water) chart datum was used for the measurements (see figure 2 for the data points). Precision DGPS coordinates were surveyed for each depth measurement point with 20-30cm accuracy (Järvinen, 26.11.2001, personal communication). Although the bottom is in many places loose mud the echo sounding method is expected to yield relatively reliable results (Jozsa personal communication) with estimated accuracy of 20cm (Järvinen, 26.11.2001, personal communication). The Hydrogphic Atlas data from Tonle Sap lake (1:100,000) is the only bathymetric data available from the lake. Some more recent bathymetric data is available from the Chaktomuk junction and some more surveys in the area are being done. The bathymetric data is used for the lake and river modeling. It is interesting that “considering that the Tonle Sap River and its floodplain receive a relatively heavy load of sediment, the lack of change in the river channels compared with 1965 topographic maps is amazing. Even in Chhnoc Trou, which is considered a point of heavy sedimentation, all channels still are at the same place where they were in 1965 and in navigation channel, that is used when sailing from Phnom Penh to Siem Reap, the depth does not appear to have changed dramatically either” (MRC/UNDP, 1998, vol 1 pp 14).
MRCS/WUP-FIN, Data Report
Topographic Data
14
Figure 2. Data points of the Hydrographic Atlas survey.
6.5 Certeza survey Tonle Sap survey was accomplished in 1964 by Certeza Surveying Company based in Philippines and the survey covers only the Tonle Sap floodplain. Estimates for the accuracy of the map range from 30 to 50m. Contour lines have been drawn from 1-13m above dry season lake level, which covers the normal year flood height (10m). It is the only map with 1m contour lines from the floodplain ever done and therefore its accuracy is of crucial importance for the modeling purposes. Because this is the principal topographic data used for the floodplain and there exist plans to make similar surveys, part of the work description is reproduced from the Certeza survey Final Report (a more complete version in ANNEX 1) "The general requirement was expressed as a 1:50,000 scale medium and at certain critical areas 1 meter contour and 10 cm spot heights” (Certeza, 1964, pp. 2). “A review was made of the source material. We found that the area was covered with a good quality 1:40,000 scale photos, partly covered by 1:10,000 scale photos. It was covered by fairly new 1:250,000 scale maps and old 1:100,000 scale maps. Both series of maps yielded practically no vertical information, so were of practically no value to engineering. First order leveling extended as far as Battambang emanating from Hatien, South Vietnam. This leveling was accomplished by the Service Geographique of Indo China about 40 years ago and was re-run by the Mekong Committee - 1959 and 1960. From Battamhang, a 2nd order level line ran along the road all around the lake and tied back into the 1st order. This leveling was
MRCS/WUP-FIN, Data Report
Topographic Data
15
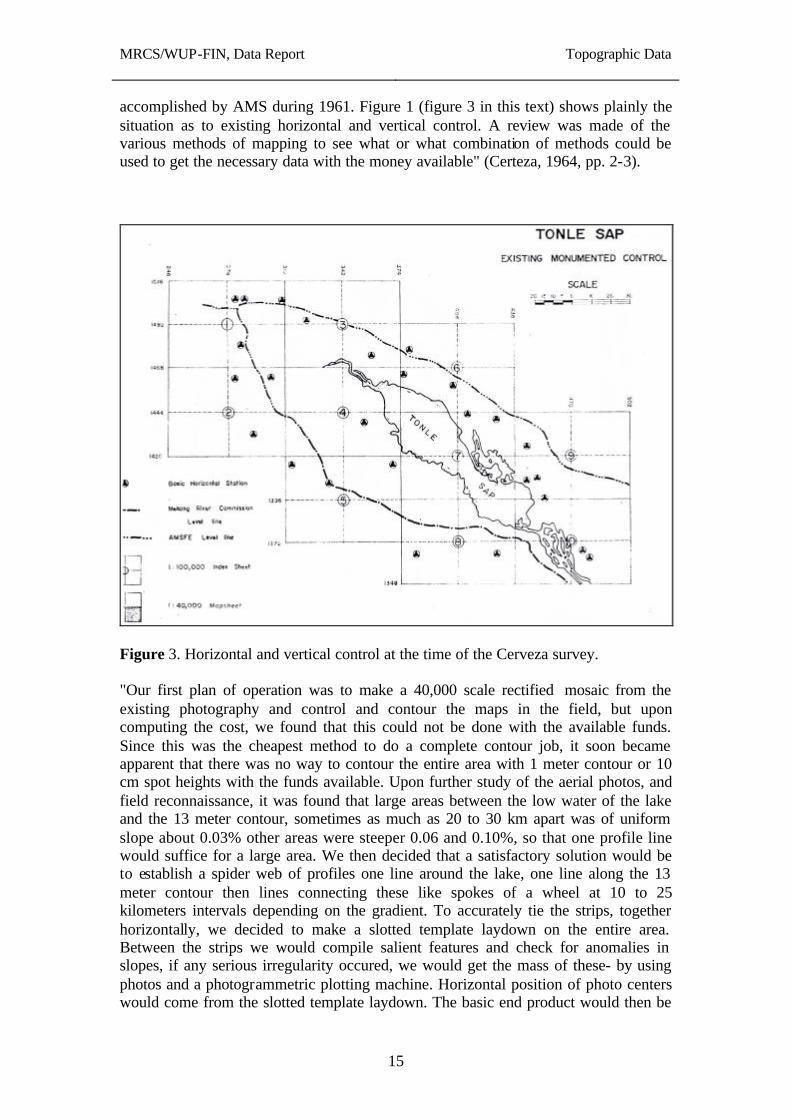
accomplished by AMS during 1961. Figure 1 (figure 3 in this text) shows plainly the situation as to existing horizontal and vertical control. A review was made of the various methods of mapping to see what or what combination of methods could be used to get the necessary data with the money available" (Certeza, 1964, pp. 2-3).
Figure 3. Horizontal and vertical control at the time of the Cerveza survey. "Our first plan of operation was to make a 40,000 scale rectified mosaic from the existing photography and control and contour the maps in the field, but upon computing the cost, we found that this could not be done with the available funds. Since this was the cheapest method to do a complete contour job, it soon became apparent that there was no way to contour the entire area with 1 meter contour or 10 cm spot heights with the funds available. Upon further study of the aerial photos, and field reconnaissance, it was found that large areas between the low water of the lake and the 13 meter contour, sometimes as much as 20 to 30 km apart was of uniform slope about 0.03% other areas were steeper 0.06 and 0.10%, so that one profile line would suffice for a large area. We then decided that a satisfactory solution would be to establish a spider web of profiles one line around the lake, one line along the 13 meter contour then lines connecting these like spokes of a wheel at 10 to 25 kilometers intervals depending on the gradient. To accurately tie the strips, together horizontally, we decided to make a slotted template laydown on the entire area. Between the strips we would compile salient features and check for anomalies in slopes, if any serious irregularity occured, we would get the mass of these- by using photos and a photogrammetric plotting machine. Horizontal position of photo centers would come from the slotted template laydown. The basic end product would then be
MRCS/WUP-FIN, Data Report
Topographic Data
16
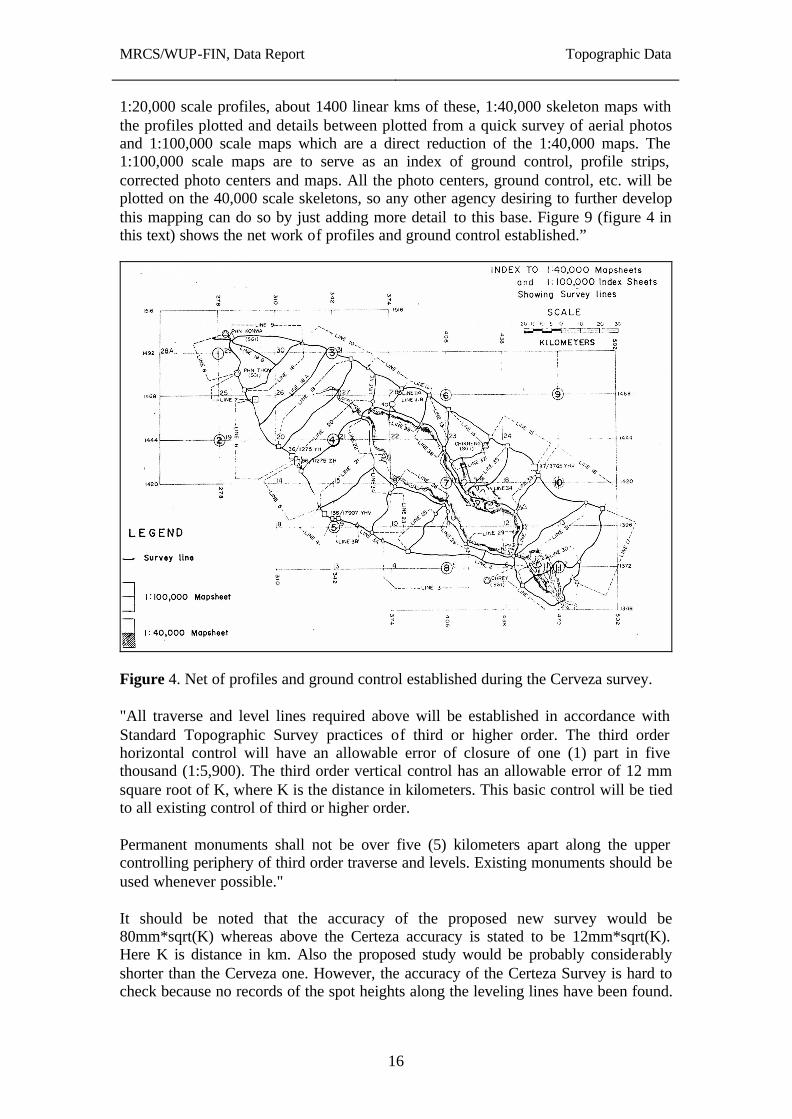
1:20,000 scale profiles, about 1400 linear kms of these, 1:40,000 skeleton maps with the profiles plotted and details between plotted from a quick survey of aerial photos and 1:100,000 scale maps which are a direct reduction of the 1:40,000 maps. The 1:100,000 scale maps are to serve as an index of ground control, profile strips, corrected photo centers and maps. All the photo centers, ground control, etc. will be plotted on the 40,000 scale skeletons, so any other agency desiring to further develop this mapping can do so by just adding more detail to this base. Figure 9 (figure 4 in this text) shows the net work of profiles and ground control established.”
Figure 4. Net of profiles and ground control established during the Cerveza survey. "All traverse and level lines required above will be established in accordance with Standard Topographic Survey practices of third or higher order. The third order horizontal control will have an allowable error of closure of one (1) part in five thousand (1:5,900). The third order vertical control has an allowable error of 12 mm square root of K, where K is the distance in kilometers. This basic control will be tied to all existing control of third or higher order. Permanent monuments shall not be over five (5) kilometers apart along the upper controlling periphery of third order traverse and levels. Existing monuments should be used whenever possible." It should be noted that the accuracy of the proposed new survey would be 80mm*sqrt(K) whereas above the Certeza accuracy is stated to be 12mm*sqrt(K). Here K is distance in km. Also the proposed study would be probably considerably shorter than the Cerveza one. However, the accuracy of the Certeza Survey is hard to check because no records of the spot heights along the leveling lines have been found.
MRCS/WUP-FIN, Data Report
Topographic Data
17
Also, most of the monuments have been destroyed except for a handful situated around the Tonle Sap Lake. The the Certeza Survey map is compared with a number of datasets:
• Figure 1. JICA 10m contour line on the floodplain (above) • Figure 5. DEM derived from the 1:50,000 US Army map with 5 m contour
lines • Figure 6 and 7. A Recent topographic survey near Siem Reap (Teng, 1998) • Table 5. Five sets of radarsat derived surface areas compared to Certeza
Survey DEM derived surface areas • Figure 8, 9 and 10. Radarsat images from August 2001 and September 2000,
as well as field verification sites (table 7 / annex) • Table 6. Lake volumes and areas derived from satellite data (Teng, 1998) • Table 6. DEM derived from the Sogreah data and spot heights (Sopharith,
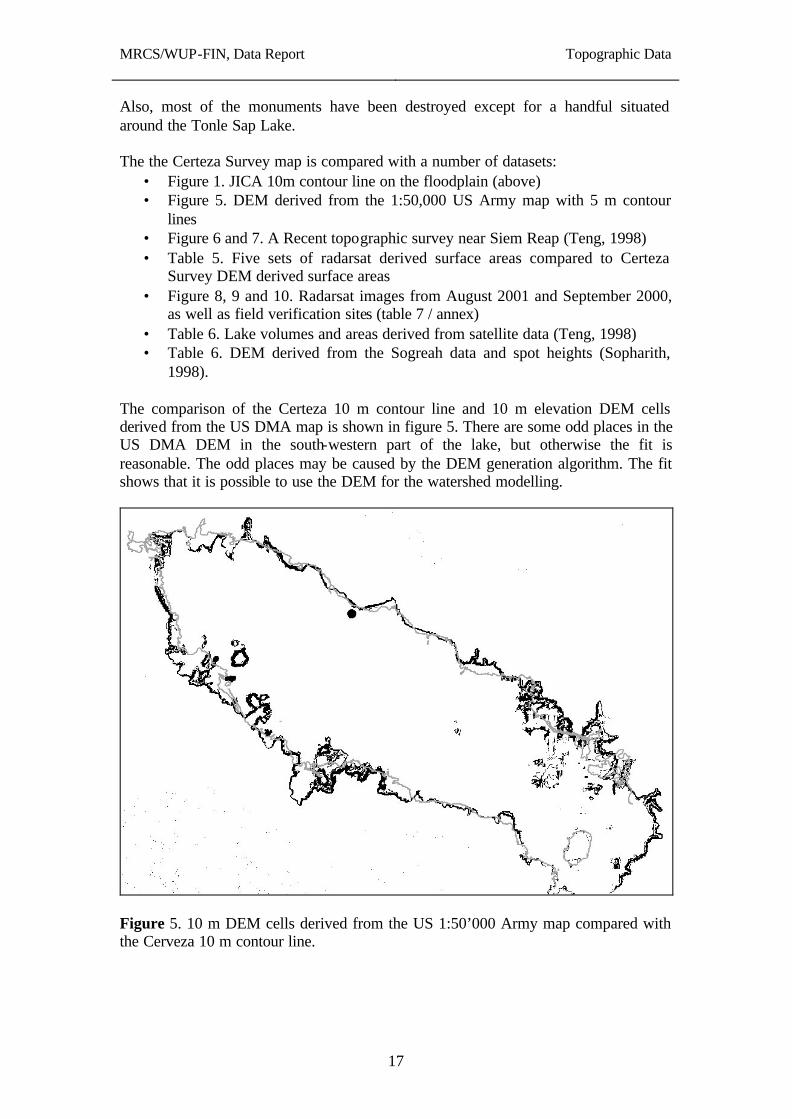
1998). The comparison of the Certeza 10 m contour line and 10 m elevation DEM cells derived from the US DMA map is shown in figure 5. There are some odd places in the US DMA DEM in the south-western part of the lake, but otherwise the fit is reasonable. The odd places may be caused by the DEM generation algorithm. The fit shows that it is possible to use the DEM for the watershed modelling.
Figure 5. 10 m DEM cells derived from the US 1:50’000 Army map compared with the Cerveza 10 m contour line.
MRCS/WUP-FIN, Data Report
Topographic Data
18
Teng (1998) study Teng Peng Seang has prepared M.Sc. thesis “Monitoring of water surface and estimation of water volume of Tonlesap Lake Using Satellite Imagery” in 1998 for the Asian Institute of Technology (AIT). The aims of the work are
1. “To produce a water depth map at the dry season with the minimum water level using the relationship between the brightness temperature obtained from NOAA/AVHRR and the water depth surveyed at the Tonle Sap Lake,
2. To detect the coast lines at different times during the monsoon season up to
the maximum water level using JERS-1 and ERS-1 SAR imagery along with other referent data,
3. To interpolate coast lines from the minimum to the maximum water level at
one meter interval,
4. To estimate the perimeter, water surface area and water volume of the Tonle Sap Lake at different water levels and to compare the results with the ones obtained from the existing topographic map.”
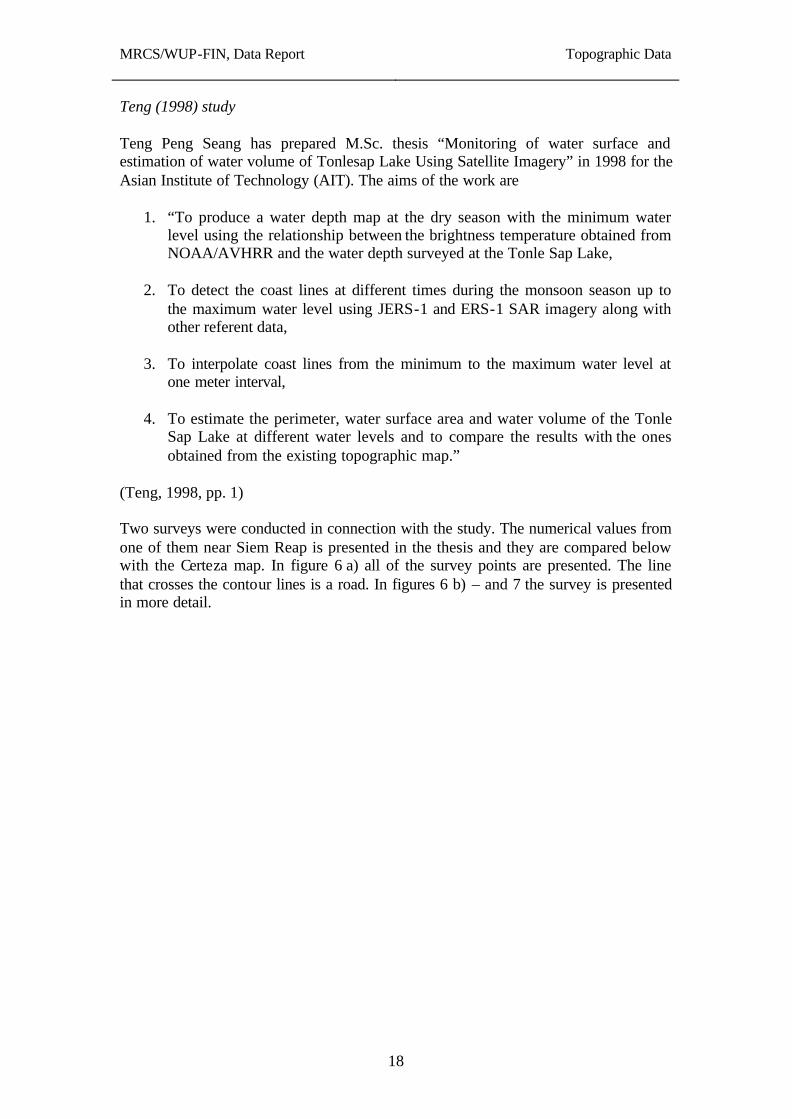
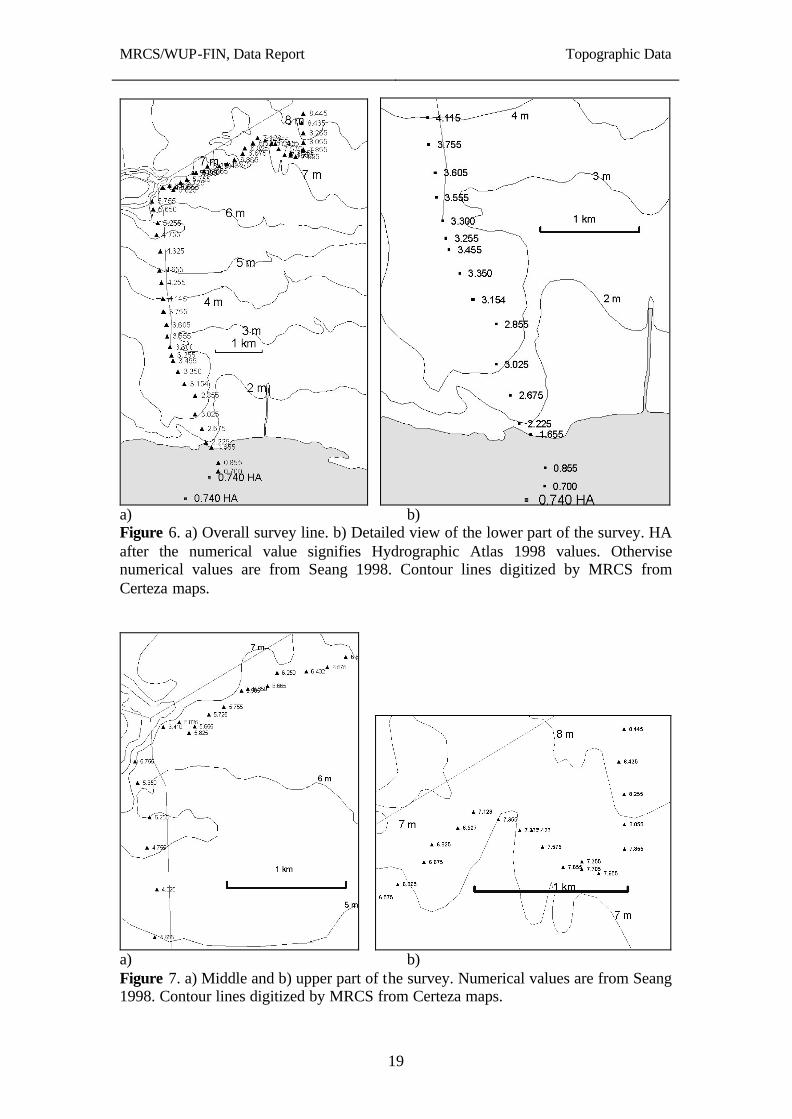
(Teng, 1998, pp. 1) Two surveys were conducted in connection with the study. The numerical values from one of them near Siem Reap is presented in the thesis and they are compared below with the Certeza map. In figure 6 a) all of the survey points are presented. The line that crosses the contour lines is a road. In figures 6 b) – and 7 the survey is presented in more detail.
MRCS/WUP-FIN, Data Report
Topographic Data
19
a) b) Figure 6. a) Overall survey line. b) Detailed view of the lower part of the survey. HA after the numerical value signifies Hydrographic Atlas 1998 values. Othervise numerical values are from Seang 1998. Contour lines digitized by MRCS from Certeza maps.
a) b) Figure 7. a) Middle and b) upper part of the survey. Numerical values are from Seang 1998. Contour lines digitized by MRCS from Certeza maps.
MRCS/WUP-FIN, Data Report
Topographic Data
20
The lower survey fits well with the contour lines. Also Hydrographic Atlas values fit with the surveyed heights. In the middle part of the survey (figure 7 a) 5 m contour line seems to be somewhat too south. Elevations drop going north of 5 m contour line and start to rise again. It is difficult to judge whether 4.755 m value is a local drop or the 6 m contour line is in error. The variations from 5.655 to 8.025 heights within a short distance in the north–west part of the survey line and the near location of 140 m high hill suggest irregular small scale topography which the surveying method used for the Cerveza study can’t catch in all cases. In the north–east part of the survey values are again in good agreement with the contour lines.
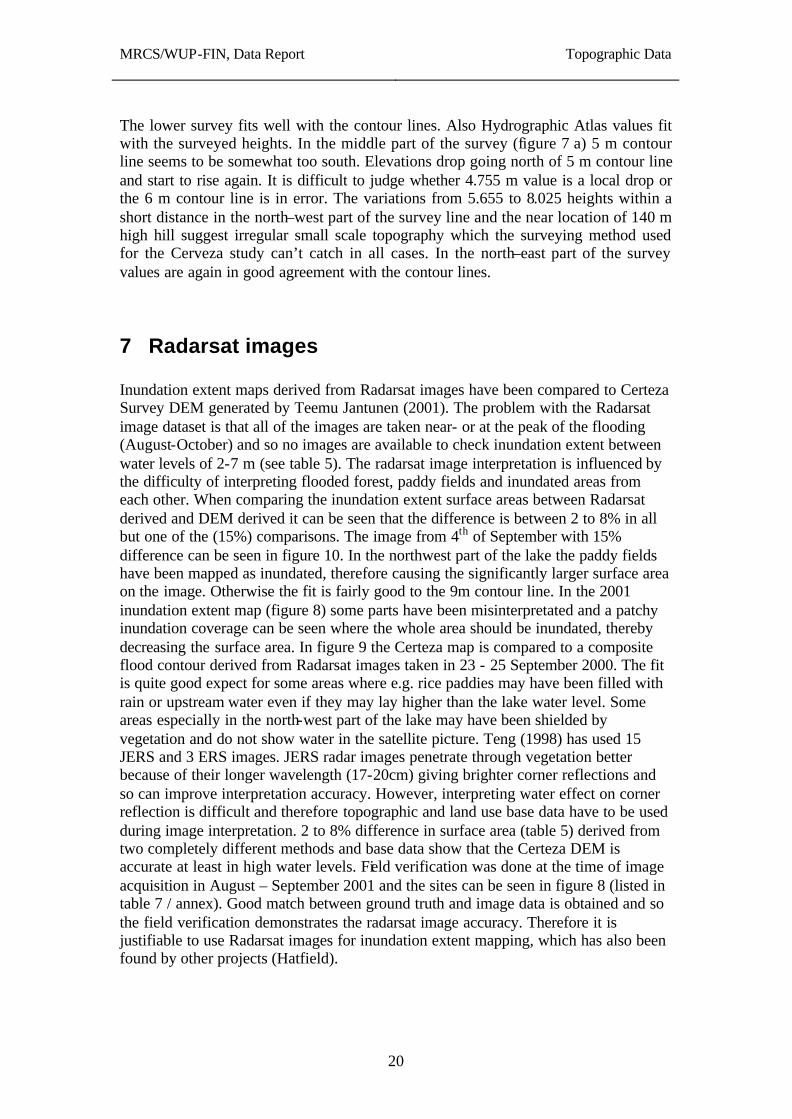
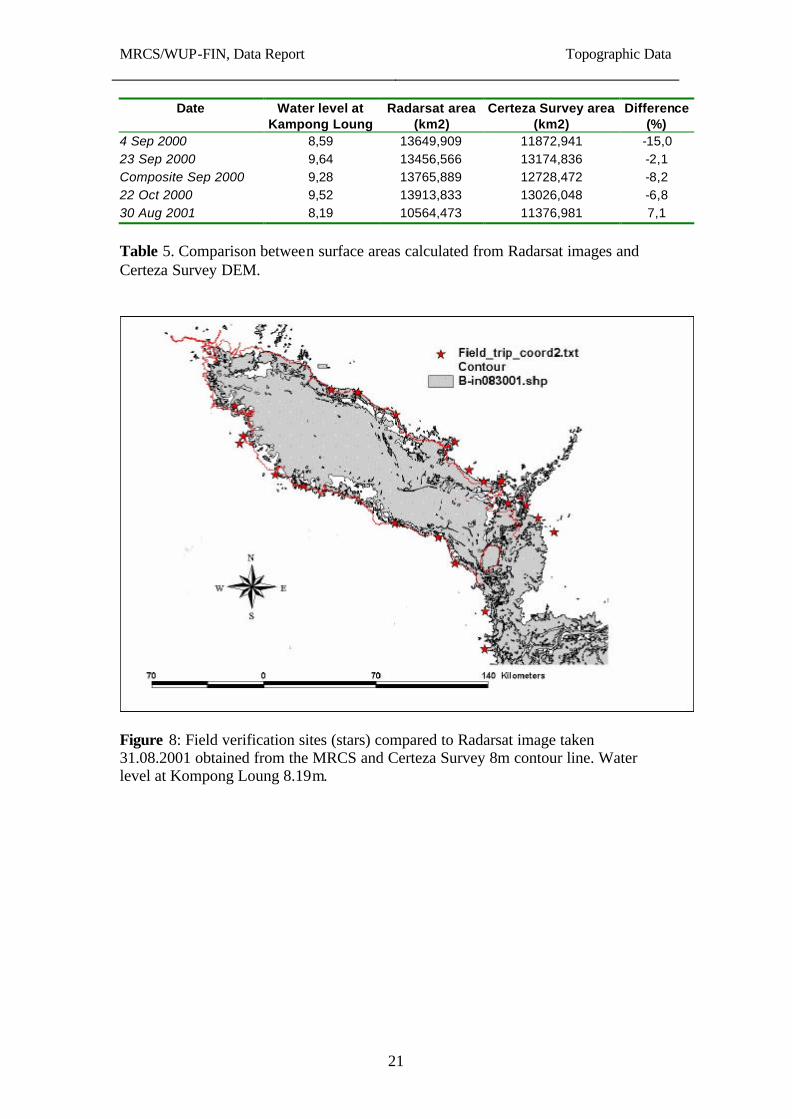
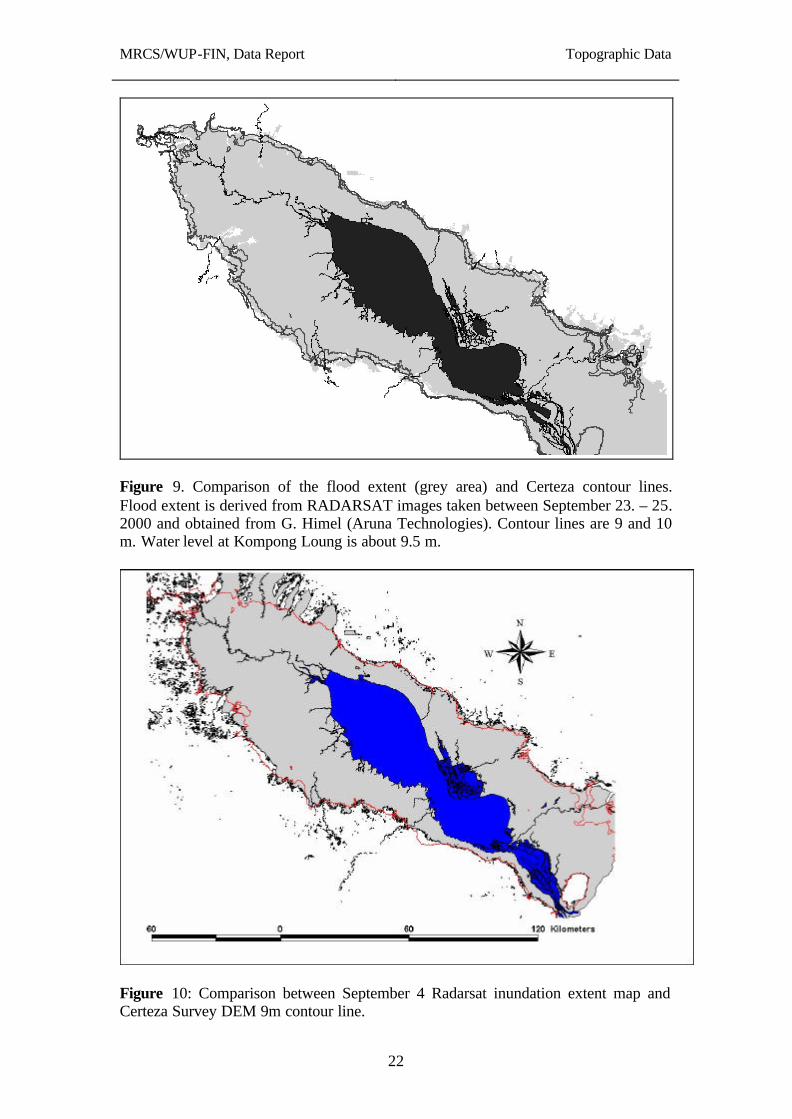
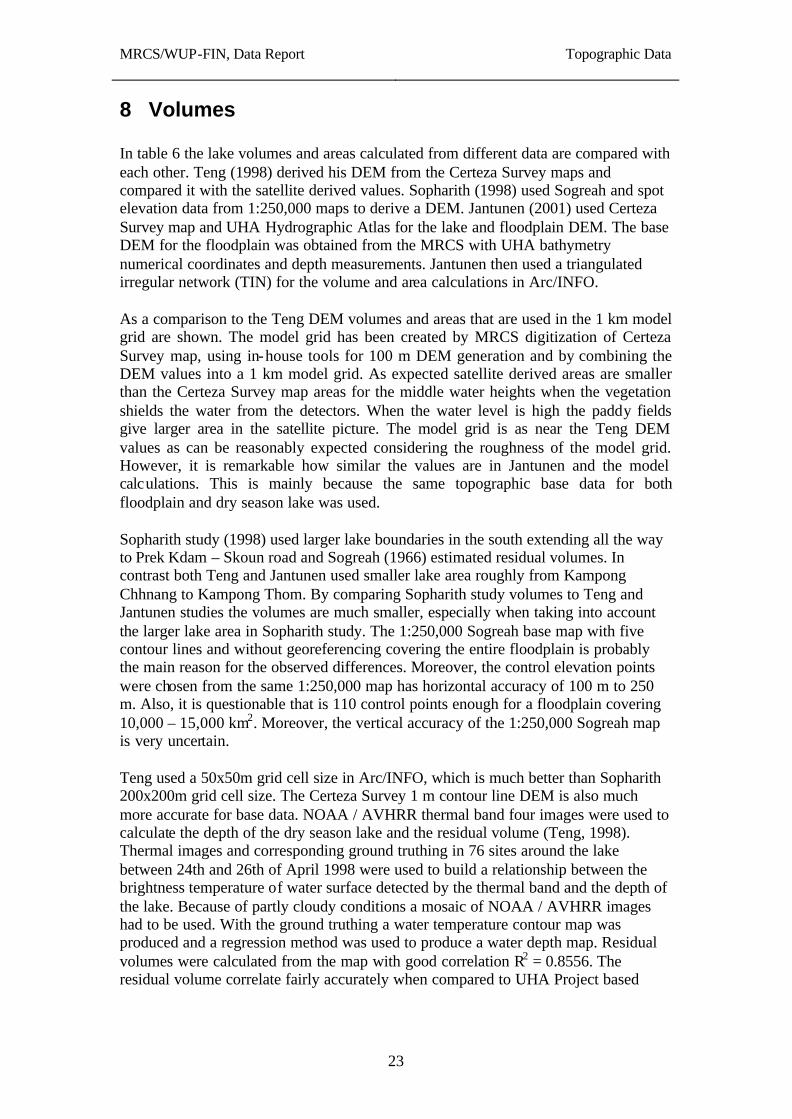
7 Radarsat images Inundation extent maps derived from Radarsat images have been compared to Certeza Survey DEM generated by Teemu Jantunen (2001). The problem with the Radarsat image dataset is that all of the images are taken near- or at the peak of the flooding (August-October) and so no images are available to check inundation extent between water levels of 2-7 m (see table 5). The radarsat image interpretation is influenced by the difficulty of interpreting flooded forest, paddy fields and inundated areas from each other. When comparing the inundation extent surface areas between Radarsat derived and DEM derived it can be seen that the difference is between 2 to 8% in all but one of the (15%) comparisons. The image from 4th of September with 15% difference can be seen in figure 10. In the northwest part of the lake the paddy fields have been mapped as inundated, therefore causing the significantly larger surface area on the image. Otherwise the fit is fairly good to the 9m contour line. In the 2001 inundation extent map (figure 8) some parts have been misinterpretated and a patchy inundation coverage can be seen where the whole area should be inundated, thereby decreasing the surface area. In figure 9 the Certeza map is compared to a composite flood contour derived from Radarsat images taken in 23 - 25 September 2000. The fit is quite good expect for some areas where e.g. rice paddies may have been filled with rain or upstream water even if they may lay higher than the lake water level. Some areas especially in the north-west part of the lake may have been shielded by vegetation and do not show water in the satellite picture. Teng (1998) has used 15 JERS and 3 ERS images. JERS radar images penetrate through vegetation better because of their longer wavelength (17-20cm) giving brighter corner reflections and so can improve interpretation accuracy. However, interpreting water effect on corner reflection is difficult and therefore topographic and land use base data have to be used during image interpretation. 2 to 8% difference in surface area (table 5) derived from two completely different methods and base data show that the Certeza DEM is accurate at least in high water levels. Field verification was done at the time of image acquisition in August – September 2001 and the sites can be seen in figure 8 (listed in table 7 / annex). Good match between ground truth and image data is obtained and so the field verification demonstrates the radarsat image accuracy. Therefore it is justifiable to use Radarsat images for inundation extent mapping, which has also been found by other projects (Hatfield).
MRCS/WUP-FIN, Data Report
Topographic Data
21
Date Water level at Kampong Loung
Radarsat area (km2)
Certeza Survey area (km2)
Difference (%)
4 Sep 2000 8,59 13649,909 11872,941 -15,0 23 Sep 2000 9,64 13456,566 13174,836 -2,1 Composite Sep 2000 9,28 13765,889 12728,472 -8,2 22 Oct 2000 9,52 13913,833 13026,048 -6,8 30 Aug 2001 8,19 10564,473 11376,981 7,1
Table 5. Comparison between surface areas calculated from Radarsat images and Certeza Survey DEM.
Figure 8: Field verification sites (stars) compared to Radarsat image taken 31.08.2001 obtained from the MRCS and Certeza Survey 8m contour line. Water level at Kompong Loung 8.19m.
MRCS/WUP-FIN, Data Report
Topographic Data
22
Figure 9. Comparison of the flood extent (grey area) and Certeza contour lines. Flood extent is derived from RADARSAT images taken between September 23. – 25. 2000 and obtained from G. Himel (Aruna Technologies). Contour lines are 9 and 10 m. Water level at Kompong Loung is about 9.5 m.
Figure 10: Comparison between September 4 Radarsat inundation extent map and Certeza Survey DEM 9m contour line.
MRCS/WUP-FIN, Data Report
Topographic Data
23
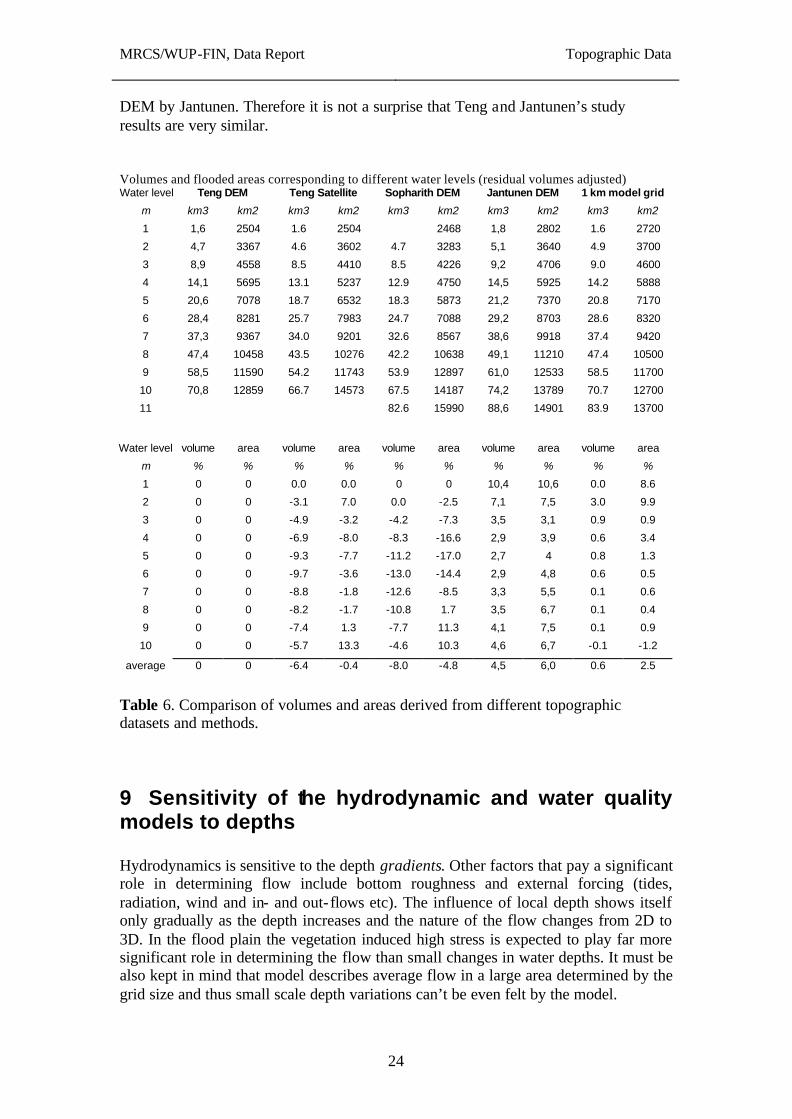
8 Volumes In table 6 the lake volumes and areas calculated from different data are compared with each other. Teng (1998) derived his DEM from the Certeza Survey maps and compared it with the satellite derived values. Sopharith (1998) used Sogreah and spot elevation data from 1:250,000 maps to derive a DEM. Jantunen (2001) used Certeza Survey map and UHA Hydrographic Atlas for the lake and floodplain DEM. The base DEM for the floodplain was obtained from the MRCS with UHA bathymetry numerical coordinates and depth measurements. Jantunen then used a triangulated irregular network (TIN) for the volume and area calculations in Arc/INFO. As a comparison to the Teng DEM volumes and areas that are used in the 1 km model grid are shown. The model grid has been created by MRCS digitization of Certeza Survey map, using in-house tools for 100 m DEM generation and by combining the DEM values into a 1 km model grid. As expected satellite derived areas are smaller than the Certeza Survey map areas for the middle water heights when the vegetation shields the water from the detectors. When the water level is high the paddy fields give larger area in the satellite picture. The model grid is as near the Teng DEM values as can be reasonably expected considering the roughness of the model grid. However, it is remarkable how similar the values are in Jantunen and the model calculations. This is mainly because the same topographic base data for both floodplain and dry season lake was used. Sopharith study (1998) used larger lake boundaries in the south extending all the way to Prek Kdam – Skoun road and Sogreah (1966) estimated residual volumes. In contrast both Teng and Jantunen used smaller lake area roughly from Kampong Chhnang to Kampong Thom. By comparing Sopharith study volumes to Teng and Jantunen studies the volumes are much smaller, especially when taking into account the larger lake area in Sopharith study. The 1:250,000 Sogreah base map with five contour lines and without georeferencing covering the entire floodplain is probably the main reason for the observed differences. Moreover, the control elevation points were chosen from the same 1:250,000 map has horizontal accuracy of 100 m to 250 m. Also, it is questionable that is 110 control points enough for a floodplain covering 10,000 – 15,000 km2. Moreover, the vertical accuracy of the 1:250,000 Sogreah map is very uncertain. Teng used a 50x50m grid cell size in Arc/INFO, which is much better than Sopharith 200x200m grid cell size. The Certeza Survey 1 m contour line DEM is also much more accurate for base data. NOAA / AVHRR thermal band four images were used to calculate the depth of the dry season lake and the residual volume (Teng, 1998). Thermal images and corresponding ground truthing in 76 sites around the lake between 24th and 26th of April 1998 were used to build a relationship between the brightness temperature of water surface detected by the thermal band and the depth of the lake. Because of partly cloudy conditions a mosaic of NOAA / AVHRR images had to be used. With the ground truthing a water temperature contour map was produced and a regression method was used to produce a water depth map. Residual volumes were calculated from the map with good correlation R2 = 0.8556. The residual volume correlate fairly accurately when compared to UHA Project based
MRCS/WUP-FIN, Data Report
Topographic Data
24
DEM by Jantunen. Therefore it is not a surprise that Teng and Jantunen’s study results are very similar. Volumes and flooded areas corresponding to different water levels (residual volumes adjusted) Water level Teng DEM Teng Satellite Sopharith DEM Jantunen DEM 1 km model grid
m km3 km2 km3 km2 km3 km2 km3 km2 km3 km2
1 1,6 2504 1.6 2504 2468 1,8 2802 1.6 2720
2 4,7 3367 4.6 3602 4.7 3283 5,1 3640 4.9 3700
3 8,9 4558 8.5 4410 8.5 4226 9,2 4706 9.0 4600
4 14,1 5695 13.1 5237 12.9 4750 14,5 5925 14.2 5888
5 20,6 7078 18.7 6532 18.3 5873 21,2 7370 20.8 7170
6 28,4 8281 25.7 7983 24.7 7088 29,2 8703 28.6 8320
7 37,3 9367 34.0 9201 32.6 8567 38,6 9918 37.4 9420
8 47,4 10458 43.5 10276 42.2 10638 49,1 11210 47.4 10500
9 58,5 11590 54.2 11743 53.9 12897 61,0 12533 58.5 11700
10 70,8 12859 66.7 14573 67.5 14187 74,2 13789 70.7 12700
11 82.6 15990 88,6 14901 83.9 13700
Water level volume area volume area volume area volume area volume area
m % % % % % % % % % %
1 0 0 0.0 0.0 0 0 10,4 10,6 0.0 8.6
2 0 0 -3.1 7.0 0.0 -2.5 7,1 7,5 3.0 9.9
3 0 0 -4.9 -3.2 -4.2 -7.3 3,5 3,1 0.9 0.9
4 0 0 -6.9 -8.0 -8.3 -16.6 2,9 3,9 0.6 3.4
5 0 0 -9.3 -7.7 -11.2 -17.0 2,7 4 0.8 1.3
6 0 0 -9.7 -3.6 -13.0 -14.4 2,9 4,8 0.6 0.5
7 0 0 -8.8 -1.8 -12.6 -8.5 3,3 5,5 0.1 0.6
8 0 0 -8.2 -1.7 -10.8 1.7 3,5 6,7 0.1 0.4
9 0 0 -7.4 1.3 -7.7 11.3 4,1 7,5 0.1 0.9
10 0 0 -5.7 13.3 -4.6 10.3 4,6 6,7 -0.1 -1.2
average 0 0 -6.4 -0.4 -8.0 -4.8 4,5 6,0 0.6 2.5
Table 6. Comparison of volumes and areas derived from different topographic datasets and methods.
9 Sensitivity of the hydrodynamic and water quality models to depths Hydrodynamics is sensitive to the depth gradients. Other factors that pay a significant role in determining flow include bottom roughness and external forcing (tides, radiation, wind and in- and out- flows etc). The influence of local depth shows itself only gradually as the depth increases and the nature of the flow changes from 2D to 3D. In the flood plain the vegetation induced high stress is expected to play far more significant role in determining the flow than small changes in water depths. It must be also kept in mind that model describes average flow in a large area determined by the grid size and thus small scale depth variations can’t be even felt by the model.
MRCS/WUP-FIN, Data Report
Topographic Data
25
Analytical solutions can be used to understand effect of lake volumes to the concentrations. Although analytical solutions can be only derived for simplified cases they offer valuable insights to the sensitivity of concentration on errors in lake volumes. Equations can be derived for non-conservative substances taking into account e.g. sedimentation, decay, growth, biological oxygen demand etc. Below only a conservative substance is discussed in order to keep the presentation concise. Let us assume a discharge L of a conservative substance c in a volume V when the in- and out- flows are Qin and Qout. The inflow concentration is cin and the initial lake volume and concentration are Vo and co. Then the equation for the concentration in a well-mixed reservoir is:
0( ) ( ) ( )f fc t c c c f t= + − Here the asymptotic (final) concentration cf is
, 0f in inin
Lc c Q
Q= + >
and the time dependent factor f(t)
0-
1-1
0
( ) ,
( ) 1 - (1- ) ) , .
inQt
Vin out
sin
in out
f t e Q Q
Qf t s t Q Q
V
= =
= ≠
s = Qout/Qin (it is assumed that Qin > 0). The remarkable feature of the above equations is that asymptotic concentration (if there is an asymptotic solution) of a substance never depends on the volume of the lake! The only factors affecting the asymptotic concentration are the concentration of the incoming water, inflow and load. Volume of the lake affects only the magnitude of the concentration changes. This suggests that for water quality modeling inflow, load and incoming concentration should be prescribed accurately whereas concentrations tend not to be so sensitive to volumes, at least when long term behavior of substances is considered.
10 Discussion There has been discussion about various aspects of the topographic surveys and especially about the need for them in connection with the modelling work. One justification given for the surveys is the sedimentation occurring in the floodplains. The best past estimates of sediment accumulation have been about 0.3 mm/y (Carbonnel and Guiscafré, 1963). Present study has estimated the accumulation between 0.25 – 0.9 mm/y. This would mean maximum 4 cm accumulation since the Cerveza survey. Even if the accumulation is uneven it is doubtful if it can be detected
MRCS/WUP-FIN, Data Report
Topographic Data
26
based on old maps and new surveys. A possible more realistic method would be analysis of geological samples that could tell the history and magnitude of the accumulation. Recently Ian Bishop has taken and analysed bottom sediment samples from the lake and these could be supplemented with sampling from the floodplain. Though if old still existing benchmarks around the lake can be used first of all to check the accuracy of the levelling line surrounding lake, some benchmarks could be used as starting points for levelling transects to the floodplain. However, the quality of the benchmarks has to be very good in order to have a reliable starting point, and therefore leve lling network around the lake would be necessary. Also, it has to be remembered that the levelling transects surveyed towards the lake would be automatically lower accuracy, because the same accuracy level as the benchmarks (3rd order) cannot be maintained. Because the sedimentation around the lake cannot be expected to be uniform a couple of levelling transects would need to be surveyed around the lake in different environments to have a reasonable understanding of the sedimentation rate. Remote sensing imagery could be used to identify different types of environments. Eg optical (Landsat/SPOT) imagery or aerial photography could be used to predict what are the flow directions and where sedimentation is highest. Nevertheless, in the near future a precise levelling network has to be established again in Cambodia. Otherwise all future topographic surveys and numerous projects do not have a reference elevation available, which is especially important in such annually flooding flat area as the Tonle Sap region. The utility to use satellite data to map depth contours have been questioned. The examples above give some indication of the usability. The errors are connected with three factors: 1) shielding by vegetation, 2) water accumulation in paddies or natural formations higher up than the water level and 3) water level differences in different parts of the lake. The vegetation shielding plays a role when the water level is low compared to the vegetation height. As an average the terrain is rather open in large parts of the lake and the shielding can be corrected with vegetation maps and referring to existing topographic maps. Water accumulation is expected to happen mostly in the high flood reaches where the paddies are situated. Obviously this must be taken into account in the interpretation of the pictures, emphasizing the use of recent land use maps and field verification. Water level differences in different parts of the lake can be induced by a) seiche motion, c) wind, d) flow and flow induced shear stress. According to the water level measurements made in the project the large scale water surface oscillations (seiche) is damped in the lake and play no significant role. The wind velocities are usually relatively slow and on the average wind blows across the main axis of the lake. Thus the fetch is limited and the usual inclination of the water surface is a few centimetres. The large water volumes entering in or flowing out the lake can induce inclination of the lake surface especially when the water level is low. The constriction in the middle of the lake induces the highest resistance to the flow. The water level measurements in both ends of the lake can be used to define the inclination and to correct the satellite data interpretation. Otherwise the effect of tributaries on the water levels is very local because the water volumes entering the lake are relatively small compared to the cross sections in the lake. However, in oder to make precise water level measurements the exact elevation of the water level measurement site is required. Then the water level measurements around the lake could be tied in to the MSL. When the precise elevation is known the use of radar
MRCS/WUP-FIN, Data Report
Topographic Data
27
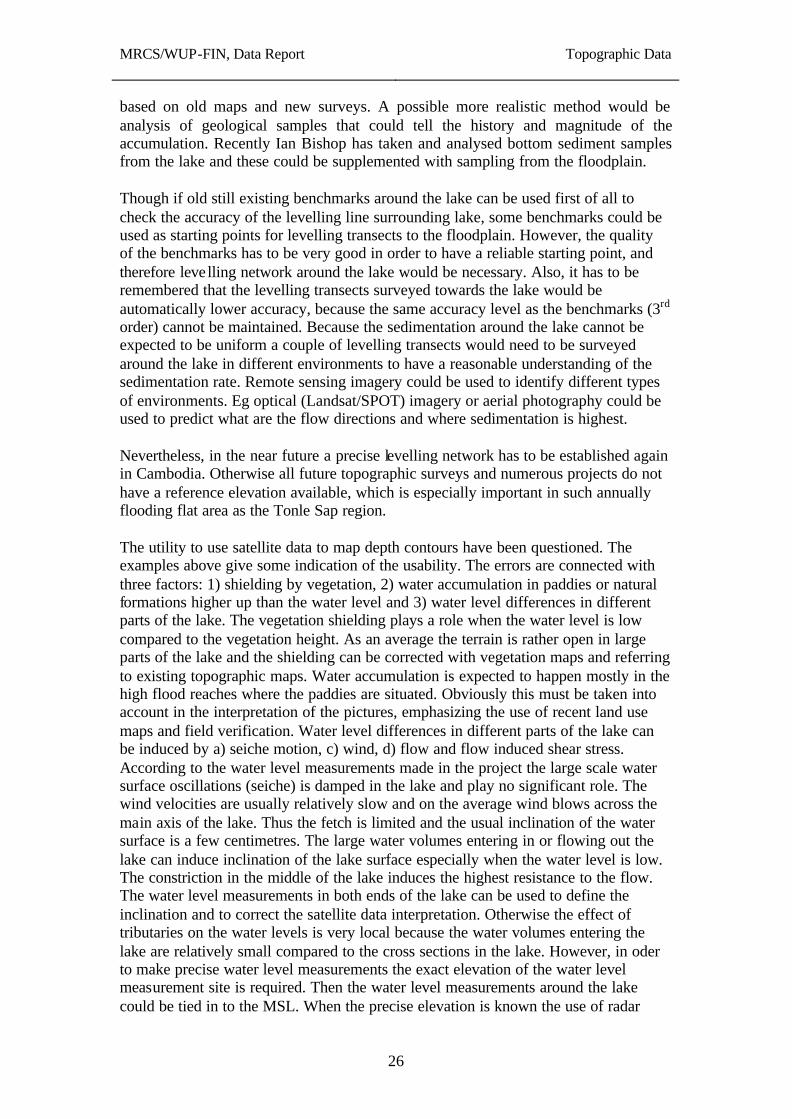
imagery for flood contour generation, especially during receding or rising flood, would be justifiable and the accuracy could be expected to be reasonably good. However, parallel field verifications have to be done in order to quarantee accuracy and to aid interpretation process. It has been argued that few centimetres error in elevation measurements represent huge water volumes and/or flooded areas. Figure 11 illustrates the effect of errors. Figure 11 a) shows the effect of a constant error ∆z in elevations caused e.g. by sedimentation. If the slope is small then the error in volumes is
2
2z
V lk
∆∆ =
when old elevations (dotted line) are used instead of real ones (solid line). Here k is the slope and l average length of the floodplain strip. Typically slope varies between 0.03 and 0.1 % in the Tonle Sap floodplain. The relative error in floodplain volumes is (∆z/z)2. The relative error is high when the water level is low but then also the error is small compared to the whole lake volume. If 10 cm error is assumed (this would signify high 40 year sedimentation compared to estimates) the relative error in the floodplain volumes would be at 5 m water level 0.04%. The error in the whole lake volumes would be even smaller. The error in the flooded area is
zA l
k∆
∆ =
The relative error in the flooded areas would be ∆z/z. With the values above the relative error would be approximately 2%. With the smallest typical slopes the error in shoreline position ∆x would be ∆z/k. With ∆z = 10 cm and k = 0.03 this would give about 330 m error in shoreline position.
a)
MRCS/WUP-FIN, Data Report
Topographic Data
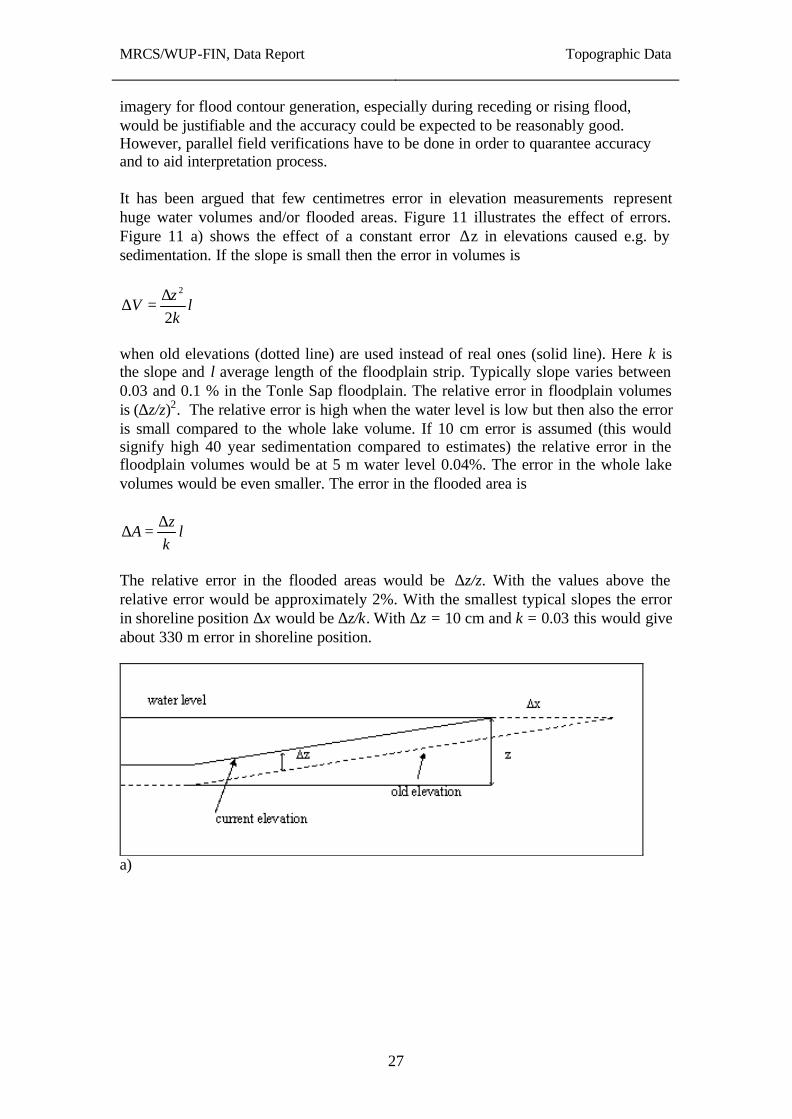
28
b) Figure 11. a) Effect of constant error on estimated water volumes and flooded areas. b) Effect of random error on estimated water volumes and flooded areas. Effect of a random error in measured elevations can be studied with the help of figure 11 b). Obviously the errors tend to cancel themselves out when the water volumes are calculated assuming there is no systematic error. Assuming that the slope of the measurements is close to the real one the error in floodplain areas is same as in the previous case. In case of the random surveying error, the error in total area tends to cancel out when separate floodplain areas are summed up. This is because in different places the error in elevations is opposite.
11 Bibliography Anttonen, J., 1999, Study of the Vertical and Horizontal Datum and the Geodetic Surveys Carrier out in Cambodia, Master’s Thesis, Helsinki. Carbonnel, J. P., and Guiscafré, J., 1963, Grand Lac du Cambodge: Sedimentologie et Hydrologie, Final Report, Paris. Certeza Surveying, 1964, Final Report, Certeza, Quezon City. DHI/MRC, 2001, Chaktomuk Area: Environment, Hydraulics and Morphology, Draft Final Report, MRCS, Phnom Penh. HATFIELD Consultants, 2000, Using RADARSAT for Improving Fisheries Management and Food Security in the Mekong River Watershed, Southeast Asia, Final Report CD-ROM, Vancouver. HATFIELD Consultants, 2001, Inundation Mapping in the Lower Mekong Basin and Land Resources Inventory for Agricultural Development Project (LRIAD), Final Report CD-ROM, Vancouver. Jantunen, T., 2001, Volumetric study of the Great Lake Tonle Sap, Cambodia, MA Dissertation, Dundee, UK. Jantunen, V., 2001, Personal Information, FINNMAP Cambodia Marketing Manager, Phnom Penh.
MRCS/WUP-FIN, Data Report
Topographic Data
29
Jozsa, J., 2002, Personal Information, … Järvinen, T., 2001, Personal Information, FINNMAP Cambodia UHA Project Manager, Phnom Penh. Lillesand, T. M. and R. W. Kiefer, 2000, Remote Sensing and Image Interpretation, John Wiley & Sons, New York. Mekong Reconnaissance Team, 1961, Comprehensive Reconnaissance Report on the Major Tributaries of the Lower Mekong Basin, Final Report, Tokyo. MRCS/UNDP, 1998, A Natural Resources Based Development Strategy for the Tonle Sap Area, Cambodia, MRCS, Phnom Penh. Pasco, 1999, The Reconnaissance Survey Project for the Establishment of an Emergency Rehabilitation and Reconstruction of Kingdom of Cambodia, Final Report, MPWT, Phnom Penh. Sotha, I., Feldkotter, C., Management and Exchange of Geographic Information in Cambodia, Proceedings of the First Workshop, 5-6 March 2001. Organized by Ministry of Land Management, Urban Planning and Construction. SRTM Homepage, 23.2.2002, http://www.jpl.nasa.gov/srtm/index.html. Teng, S. P., 1998, Monitoring of water surface and estimation of water volume of Tonle Sap Lake using satellite imagery, AIT Thesis, Bangkok. UN, 1956, Development of water resources in the Lower Mekong Basin, ECAFE. Unesco/Sogreah, 1966, Modèle Mathématique de Delta du Mekong: Rapport d’ensemble sur les différentes déterminations de la Capacité de Grand Lac, Société Grenobloise d’études et d’applications hydrauliques, Grenoble. Virtanen, M., Koponen, J., Hellsten, S. 1996. Revisions and supplements to the KEVE-project final report. Research report, Kemijoki Oy, 75 pp. + 150 appendixes. (in Finnish)
MRCS/WUP-FIN, Data Report
Topographic Data
30
ANNEX
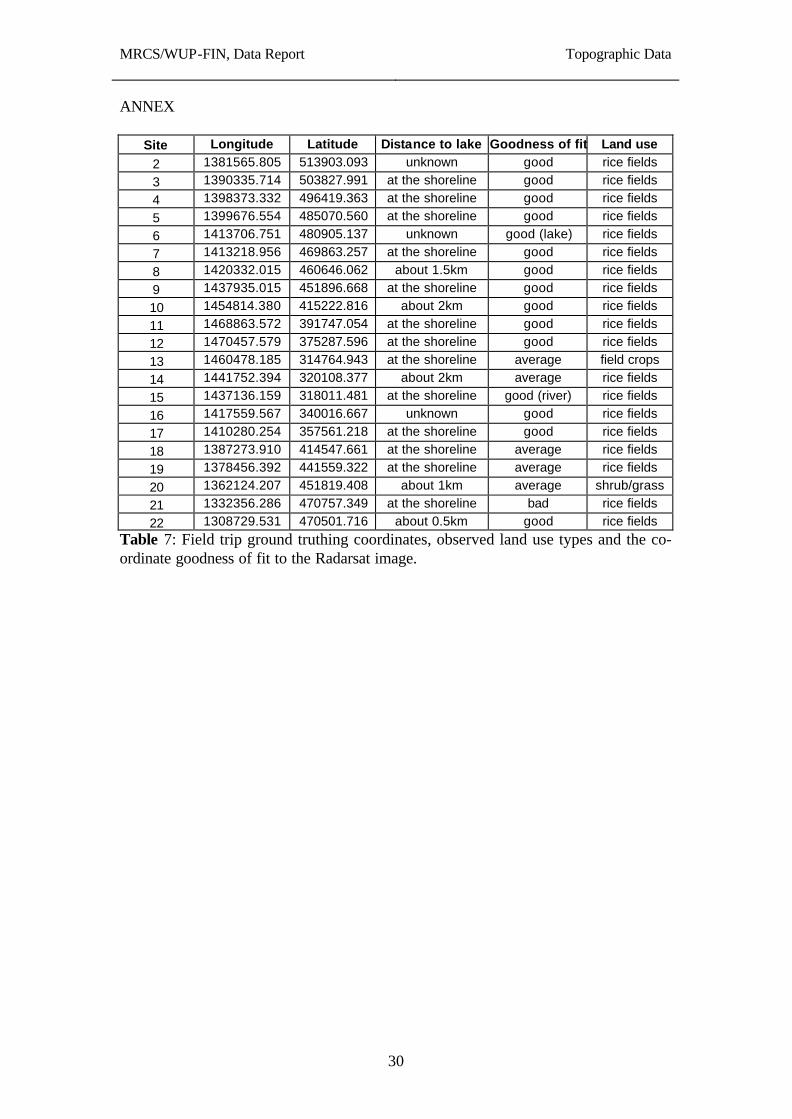
Site Longitude Latitude Distance to lake Goodness of fit Land use
2 1381565.805 513903.093 unknown good rice fields
3 1390335.714 503827.991 at the shoreline good rice fields
4 1398373.332 496419.363 at the shoreline good rice fields
5 1399676.554 485070.560 at the shoreline good rice fields
6 1413706.751 480905.137 unknown good (lake) rice fields
7 1413218.956 469863.257 at the shoreline good rice fields
8 1420332.015 460646.062 about 1.5km good rice fields
9 1437935.015 451896.668 at the shoreline good rice fields
10 1454814.380 415222.816 about 2km good rice fields
11 1468863.572 391747.054 at the shoreline good rice fields
12 1470457.579 375287.596 at the shoreline good rice fields
13 1460478.185 314764.943 at the shoreline average field crops
14 1441752.394 320108.377 about 2km average rice fields
15 1437136.159 318011.481 at the shoreline good (river) rice fields
16 1417559.567 340016.667 unknown good rice fields
17 1410280.254 357561.218 at the shoreline good rice fields
18 1387273.910 414547.661 at the shoreline average rice fields
19 1378456.392 441559.322 at the shoreline average rice fields
20 1362124.207 451819.408 about 1km average shrub/grass
21 1332356.286 470757.349 at the shoreline bad rice fields
22 1308729.531 470501.716 about 0.5km good rice fields Table 7: Field trip ground truthing coordinates, observed land use types and the co-ordinate goodness of fit to the Radarsat image.
MRCS/WUP-FIN, Data Report
Topographic Data
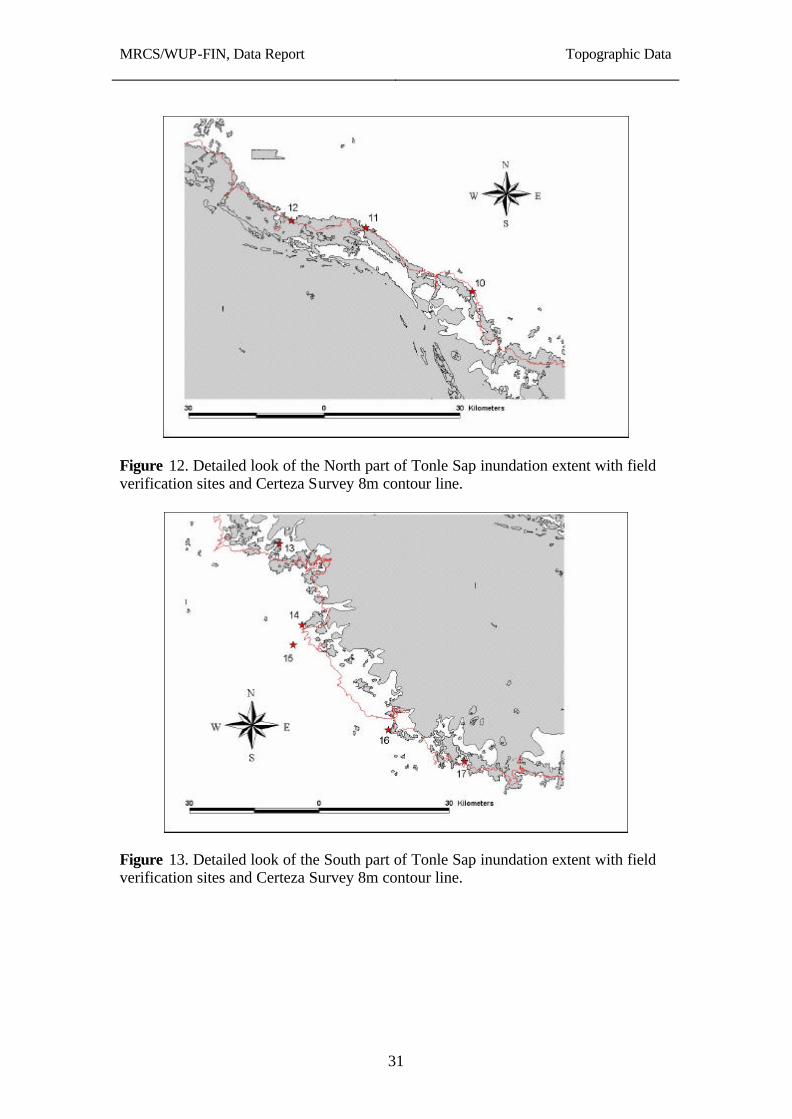
31
Figure 12. Detailed look of the North part of Tonle Sap inundation extent with field verification sites and Certeza Survey 8m contour line.
Figure 13. Detailed look of the South part of Tonle Sap inundation extent with field verification sites and Certeza Survey 8m contour line.
MRCS/WUP-FIN, Data Report
Data management
120
DATA MANAGEMENT
1 Data management The overall aim of the data management system is to integrate and handle extensive and heterogeneous data for analysis and modelling purposes. The overall data organisation, database structure and connection to MRCS databases have not yet been decided for the project. Project database should be compatible with the MRCS databases and especially with the WUP database which has not yet been constructed. Meanwhile there has to be a working solution which is presented here. Probably the solution will be maintained internally also in the future but the system will be changed so that it is compatible with required systems. The system offers flexibility because it has been built to process data to wide variety of models and it works together with the graphical model user interfaces. Data and user needs change with time and the system must be flexible to accommodate new features. Direct retrieval of data from the MRCS databases would be an ideal solution to the project needs. Because MRCS is in the process building the integrated database (see Vanderstighelen 2001) and its connections to the outside world, the needed GIS and time series data is currently retrieved from the MRCS databases, stored on CD’s and copied to a local WUP-FIN server. Before the obtained data can be used for modelling is usually needs to be converted to a different format. In addition to data format conversion, several datasets often need to be combined, reduced or otherwise handled in order to be useful in the modelling process. Necessary data conversion and the converted data management can be done using the WUP-FIN data management application. The application can import, display and process GIS and time series data. As an example of the data management, figures 1 and 2 show precipitation measurement points and monthly average precipitations computed from two measurement points.
The data management interface also supports display and handling of gridded data such as elevation models and land use data. In figure 3 elevation data is displayed along with sub-catchments and precipitation measurement points. These features are needed in producing hydrological model input data.
The model output data is usually processed using model graphical user interfaces, (hydrological model user interface is shown in figure 4), but also the data management interface can handle model results. Computed model results area normally used as figures that are included in reports. For example, maps, time series and 2D figures showing computed data can be produced. Export of pictures and
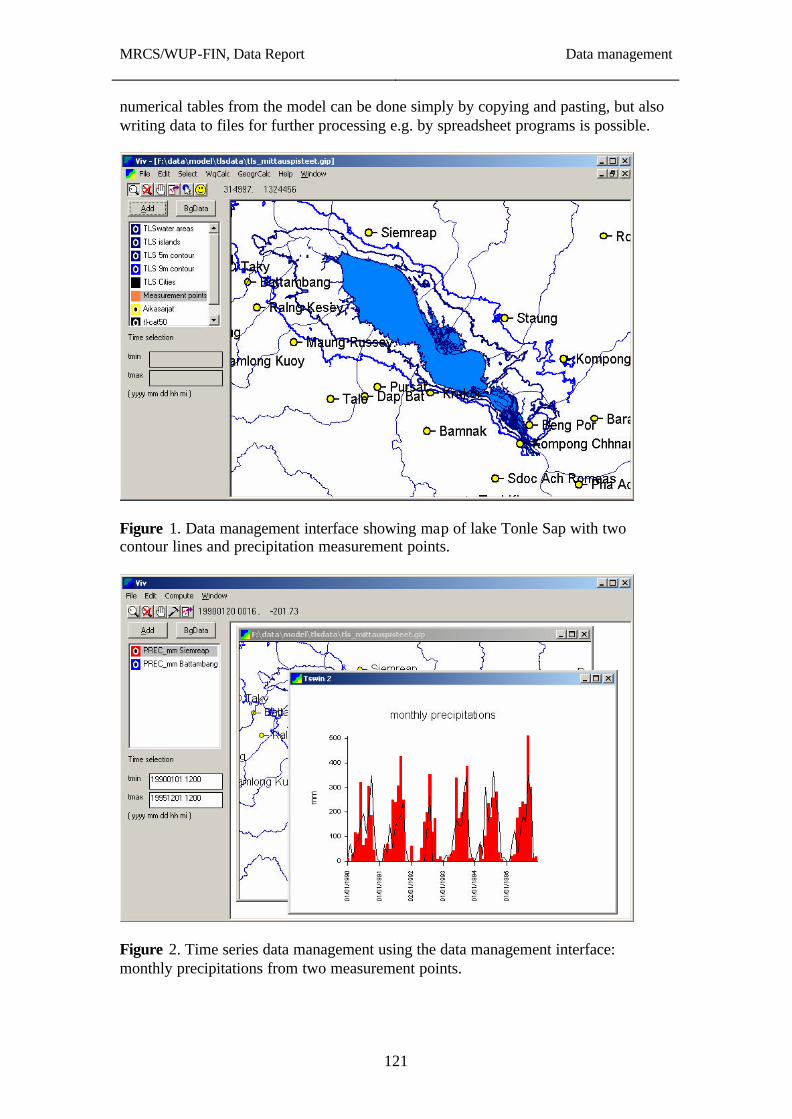
MRCS/WUP-FIN, Data Report
Data management
121
numerical tables from the model can be done simply by copying and pasting, but also writing data to files for further processing e.g. by spreadsheet programs is possible.
Figure 1. Data management interface showing map of lake Tonle Sap with two contour lines and precipitation measurement points.
Figure 2. Time series data management using the data management interface: monthly precipitations from two measurement points.
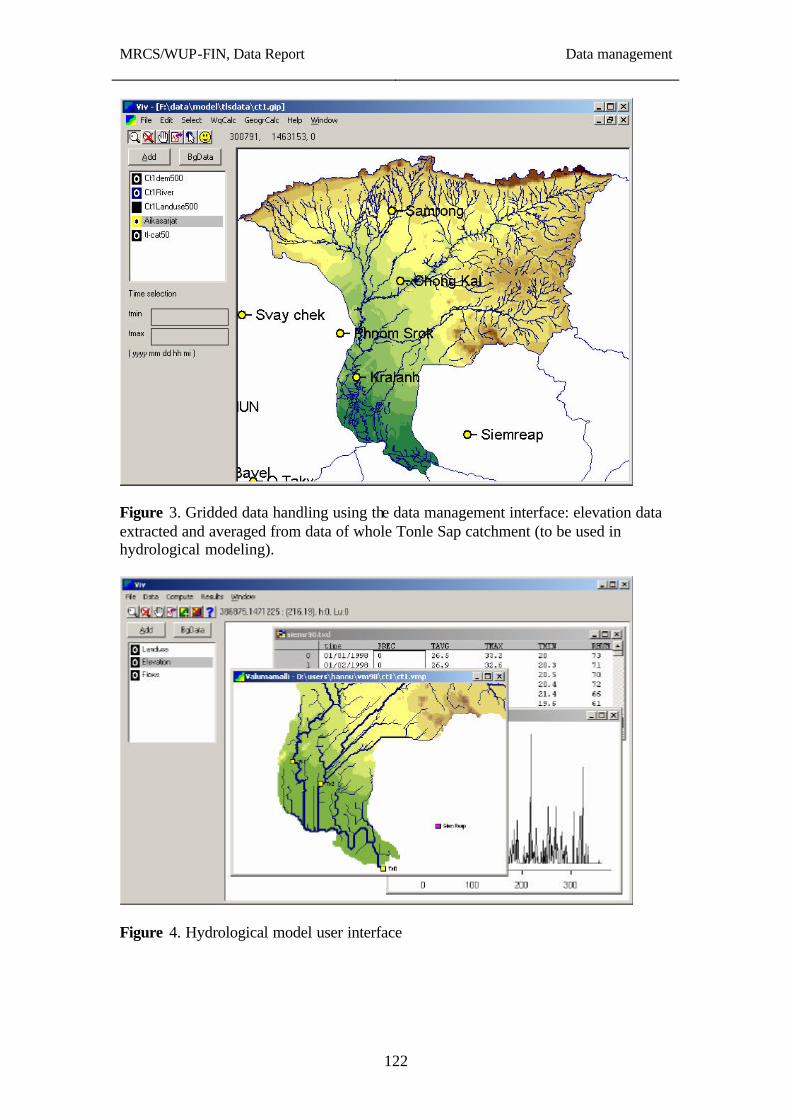
MRCS/WUP-FIN, Data Report
Data management
122
Figure 3. Gridded data handling using the data management interface: elevation data extracted and averaged from data of whole Tonle Sap catchment (to be used in hydrological modeling).
Figure 4. Hydrological model user interface
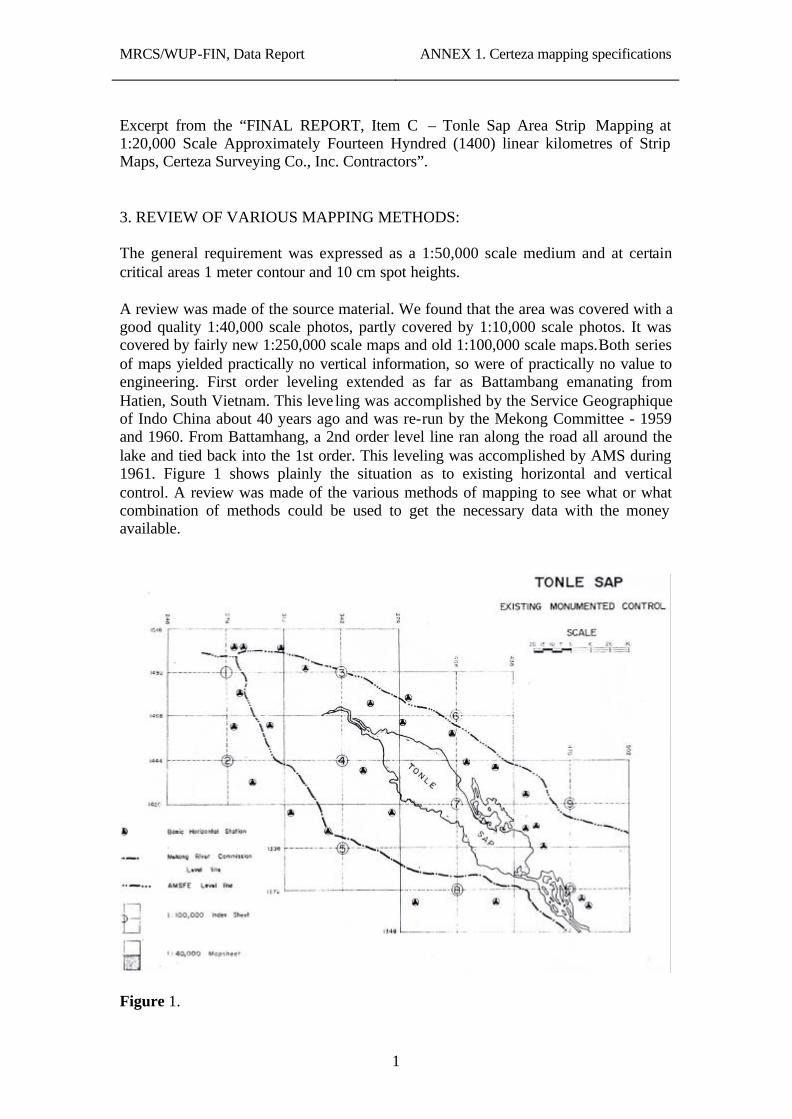
MRCS/WUP-FIN, Data Report
ANNEX 1. Certeza mapping specifications
1
Excerpt from the “FINAL REPORT, Item C – Tonle Sap Area Strip Mapping at 1:20,000 Scale Approximately Fourteen Hyndred (1400) linear kilometres of Strip Maps, Certeza Surveying Co., Inc. Contractors”. 3. REVIEW OF VARIOUS MAPPING METHODS: The general requirement was expressed as a 1:50,000 scale medium and at certain critical areas 1 meter contour and 10 cm spot heights. A review was made of the source material. We found that the area was covered with a good quality 1:40,000 scale photos, partly covered by 1:10,000 scale photos. It was covered by fairly new 1:250,000 scale maps and old 1:100,000 scale maps.Both series of maps yielded practically no vertical information, so were of practically no value to engineering. First order leveling extended as far as Battambang emanating from Hatien, South Vietnam. This leve ling was accomplished by the Service Geographique of Indo China about 40 years ago and was re-run by the Mekong Committee - 1959 and 1960. From Battamhang, a 2nd order level line ran along the road all around the lake and tied back into the 1st order. This leveling was accomplished by AMS during 1961. Figure 1 shows plainly the situation as to existing horizontal and vertical control. A review was made of the various methods of mapping to see what or what combination of methods could be used to get the necessary data with the money available.
Figure 1.
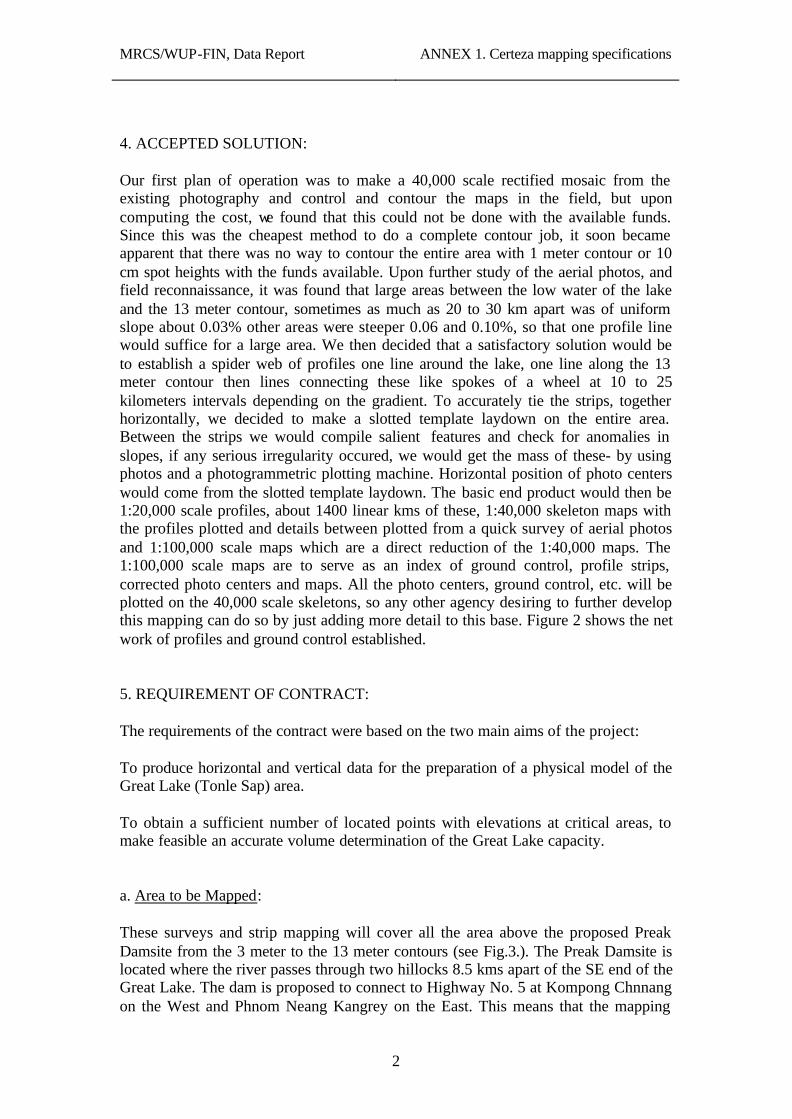
MRCS/WUP-FIN, Data Report
ANNEX 1. Certeza mapping specifications
2
4. ACCEPTED SOLUTION: Our first plan of operation was to make a 40,000 scale rectified mosaic from the existing photography and control and contour the maps in the field, but upon computing the cost, we found that this could not be done with the available funds. Since this was the cheapest method to do a complete contour job, it soon became apparent that there was no way to contour the entire area with 1 meter contour or 10 cm spot heights with the funds available. Upon further study of the aerial photos, and field reconnaissance, it was found that large areas between the low water of the lake and the 13 meter contour, sometimes as much as 20 to 30 km apart was of uniform slope about 0.03% other areas were steeper 0.06 and 0.10%, so that one profile line would suffice for a large area. We then decided that a satisfactory solution would be to establish a spider web of profiles one line around the lake, one line along the 13 meter contour then lines connecting these like spokes of a wheel at 10 to 25 kilometers intervals depending on the gradient. To accurately tie the strips, together horizontally, we decided to make a slotted template laydown on the entire area. Between the strips we would compile salient features and check for anomalies in slopes, if any serious irregularity occured, we would get the mass of these- by using photos and a photogrammetric plotting machine. Horizontal position of photo centers would come from the slotted template laydown. The basic end product would then be 1:20,000 scale profiles, about 1400 linear kms of these, 1:40,000 skeleton maps with the profiles plotted and details between plotted from a quick survey of aerial photos and 1:100,000 scale maps which are a direct reduction of the 1:40,000 maps. The 1:100,000 scale maps are to serve as an index of ground control, profile strips, corrected photo centers and maps. All the photo centers, ground control, etc. will be plotted on the 40,000 scale skeletons, so any other agency desiring to further develop this mapping can do so by just adding more detail to this base. Figure 2 shows the net work of profiles and ground control established. 5. REQUIREMENT OF CONTRACT: The requirements of the contract were based on the two main aims of the project: To produce horizontal and vertical data for the preparation of a physical model of the Great Lake (Tonle Sap) area. To obtain a sufficient number of located points with elevations at critical areas, to make feasible an accurate volume determination of the Great Lake capacity. a. Area to be Mapped: These surveys and strip mapping will cover all the area above the proposed Preak Damsite from the 3 meter to the 13 meter contours (see Fig.3.). The Preak Damsite is located where the river passes through two hillocks 8.5 kms apart of the SE end of the Great Lake. The dam is proposed to connect to Highway No. 5 at Kompong Chnnang on the West and Phnom Neang Kangrey on the East. This means that the mapping
MRCS/WUP-FIN, Data Report
ANNEX 1. Certeza mapping specifications
3
will be from Kompong Chnnang to Battambang on the SW side of the lake and from Battambang to Kompong Thom on the NE side of the lake with the 3 and 13 meter contours as the limit. b. Required Products for Submittal: The following are the products to be furnished:
(1) 1:20,000 scale strip maps covering all traverse and level lines run - the original drawings in reproducible form and two (2) prints of all maps (black and white).
(2) 1:100,000 scale index maps with the strip maps plotted thereon including soundings if any for the 3 m contour and one (1) meter contouring - the original drawings in reproducible form and six (6) prints of the maps.
(3) Listing of all monumented control. (4) One (1) set of aerial photography of the area with selected points along
the survey lines identified thereon. (5) Field books, sketches and other original data. (6) 1:40,000 scale map, not required but being furnished.
c. Specifications for Field Survey Procedures: A third order traverse shall be run from the Preak Damsite all around the lake, following the highway which is about ten - eleven (10 - 11) meter line. A third order traverse will be run down each strip to be mapped, along the low water of the lake then up to the next strip to the existing control along the highway. The area to be mapped above the highway will be treated in the same manner, while traversing ties will be made to all third or higher order horizontal control in the area. Side shots to points of detail within the area to be mapped may be made by angle and distance. The width to be mapped in each strip will generally be governed by the maximum length of a side shot, however, in cases where there are unusual terrain feature, these will be run out and plotted. Third order level will follow the third order traverse as outlined above. Traverse stations will be controlled vertically and spot heights will be taken to an accuracy of 10 cm. All traverse and level lines required above will be established in accordance with Standard Topographic Survey practices of third or higher order. The third order horizontal control will have an allowable error of closure of one (1) part in five thousand (1:5,900). The third order vertical control has an allowable error of 12 mm ? K , where K is the distance in kilometers. This basic control will be tied to all existing control of third or higher order. Permanent monuments shall not be over five (5) kilometers apart along the upper controlling periphery of third order traverse and levels. Existing monuments should be used whenever possible. New monuments should be marked such that they do not conflict with the markings of existing monuments. The director of Service Geographique Khmer will be consulted on the markings of these new monuments.
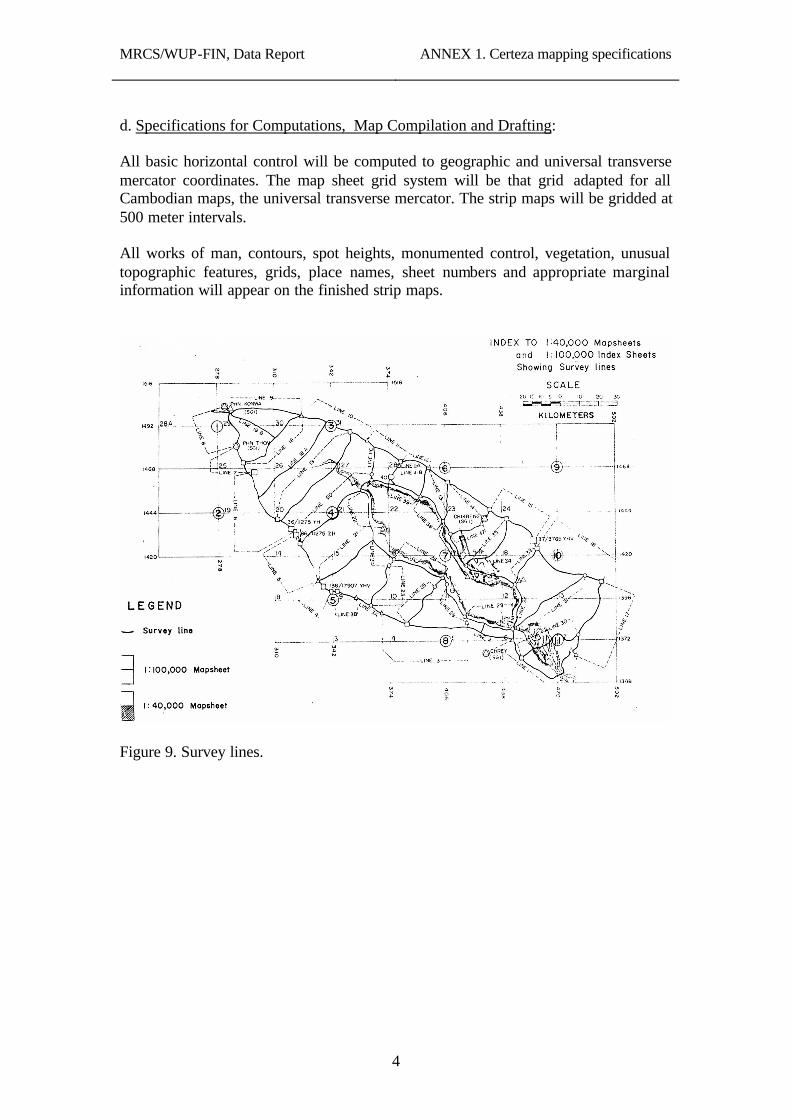
MRCS/WUP-FIN, Data Report
ANNEX 1. Certeza mapping specifications
4
d. Specifications for Computations, Map Compilation and Drafting: All basic horizontal control will be computed to geographic and universal transverse mercator coordinates. The map sheet grid system will be that grid adapted for all Cambodian maps, the universal transverse mercator. The strip maps will be gridded at 500 meter intervals. All works of man, contours, spot heights, monumented control, vegetation, unusual topographic features, grids, place names, sheet numbers and appropriate marginal information will appear on the finished strip maps.
Figure 9. Survey lines.
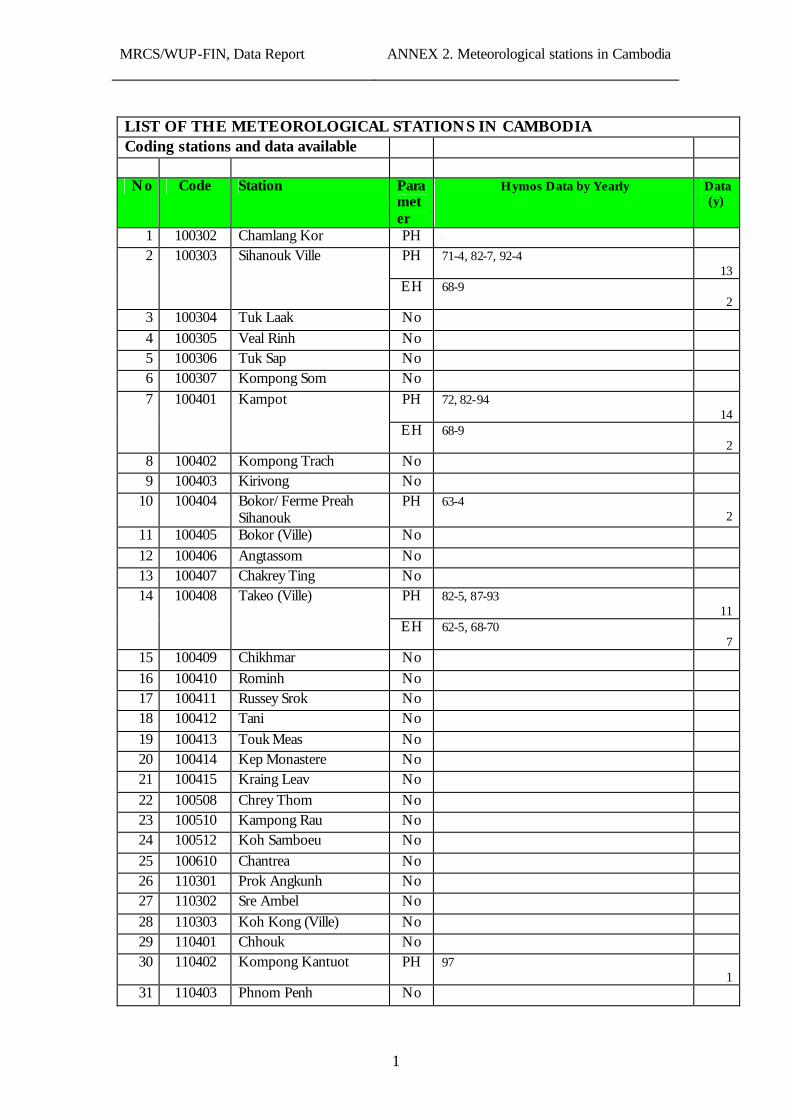
MRCS/WUP-FIN, Data Report
ANNEX 2. Meteorological stations in Cambodia
1
LIST OF THE METEOROLOGICAL STATIONS IN CAMBODIA Coding stations and data available
No Code Station Para
meter
Hymos Data by Yearly Data (y)
1 100302 Chamlang Kor PH 2 100303 Sihanouk Ville PH 71-4, 82-7, 92-4
13 EH 68-9
2 3 100304 Tuk Laak No
4 100305 Veal Rinh No 5 100306 Tuk Sap No 6 100307 Kompong Som No
7 100401 Kampot PH 72, 82-94 14
EH 68-9 2
8 100402 Kompong Trach No 9 100403 Kirivong No
10 100404 Bokor/Ferme Preah Sihanouk
PH 63-4 2
11 100405 Bokor (Ville) No
12 100406 Angtassom No 13 100407 Chakrey Ting No 14 100408 Takeo (Ville) PH 82-5, 87-93
11 EH 62-5, 68-70
7 15 100409 Chikhmar No
16 100410 Rominh No 17 100411 Russey Srok No 18 100412 Tani No
19 100413 Touk Meas No 20 100414 Kep Monastere No 21 100415 Kraing Leav No
22 100508 Chrey Thom No 23 100510 Kampong Rau No 24 100512 Koh Samboeu No
25 100610 Chantrea No 26 110301 Prok Angkunh No 27 110302 Sre Ambel No
28 110303 Koh Kong (Ville) No 29 110401 Chhouk No 30 110402 Kompong Kantuot PH 97
1 31 110403 Phnom Penh No
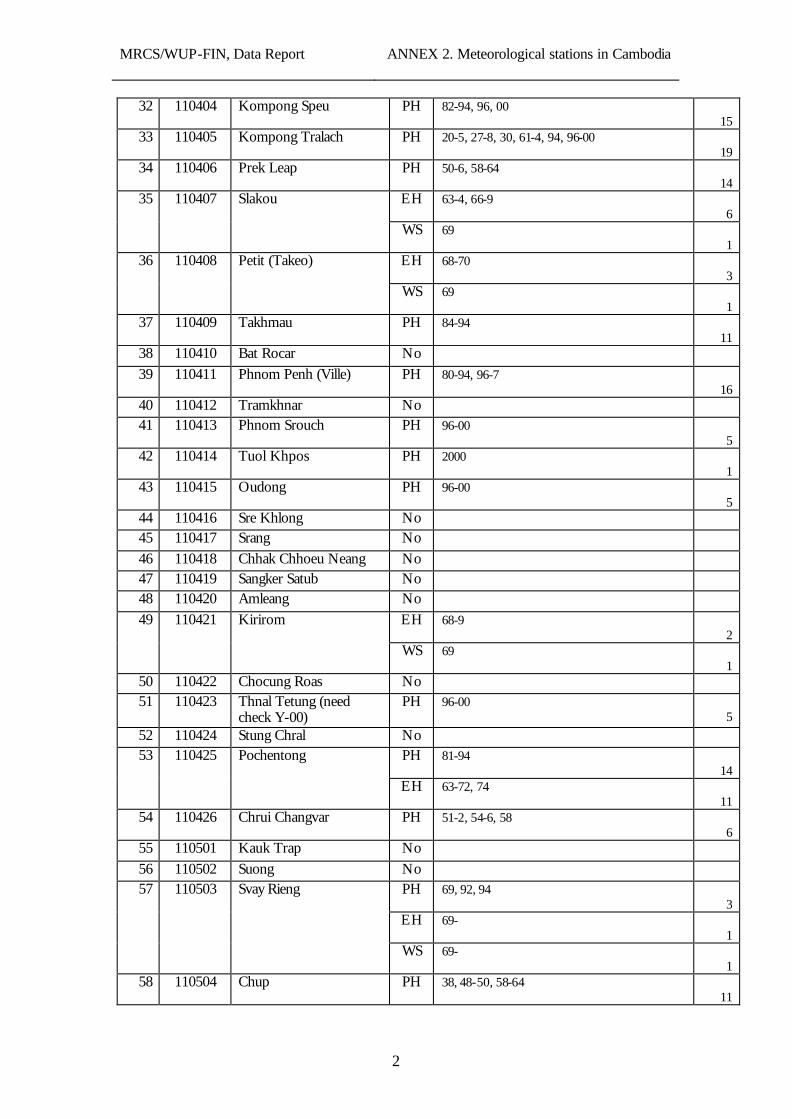
MRCS/WUP-FIN, Data Report
ANNEX 2. Meteorological stations in Cambodia
2
32 110404 Kompong Speu PH 82-94, 96, 00 15
33 110405 Kompong Tralach PH 20-5, 27-8, 30, 61-4, 94, 96-00 19
34 110406 Prek Leap PH 50-6, 58-64 14
35 110407 Slakou EH 63-4, 66-9 6
WS 69 1
36 110408 Petit (Takeo) EH 68-70 3
WS 69 1
37 110409 Takhmau PH 84-94 11
38 110410 Bat Rocar No
39 110411 Phnom Penh (Ville) PH 80-94, 96-7 16
40 110412 Tramkhnar No 41 110413 Phnom Srouch PH 96-00
5 42 110414 Tuol Khpos PH 2000
1 43 110415 Oudong PH 96-00
5 44 110416 Sre Khlong No 45 110417 Srang No
46 110418 Chhak Chhoeu Neang No 47 110419 Sangker Satub No 48 110420 Amleang No
49 110421 Kirirom EH 68-9 2
WS 69 1
50 110422 Chocung Roas No 51 110423 Thnal Tetung (need
check Y-00) PH 96-00
5 52 110424 Stung Chral No 53 110425 Pochentong PH 81-94
14 EH 63-72, 74
11 54 110426 Chrui Changvar PH 51-2, 54-6, 58
6 55 110501 Kauk Trap No
56 110502 Suong No 57 110503 Svay Rieng PH 69, 92, 94
3 EH 69-
1 WS 69-
1 58 110504 Chup PH 38, 48-50, 58-64
11
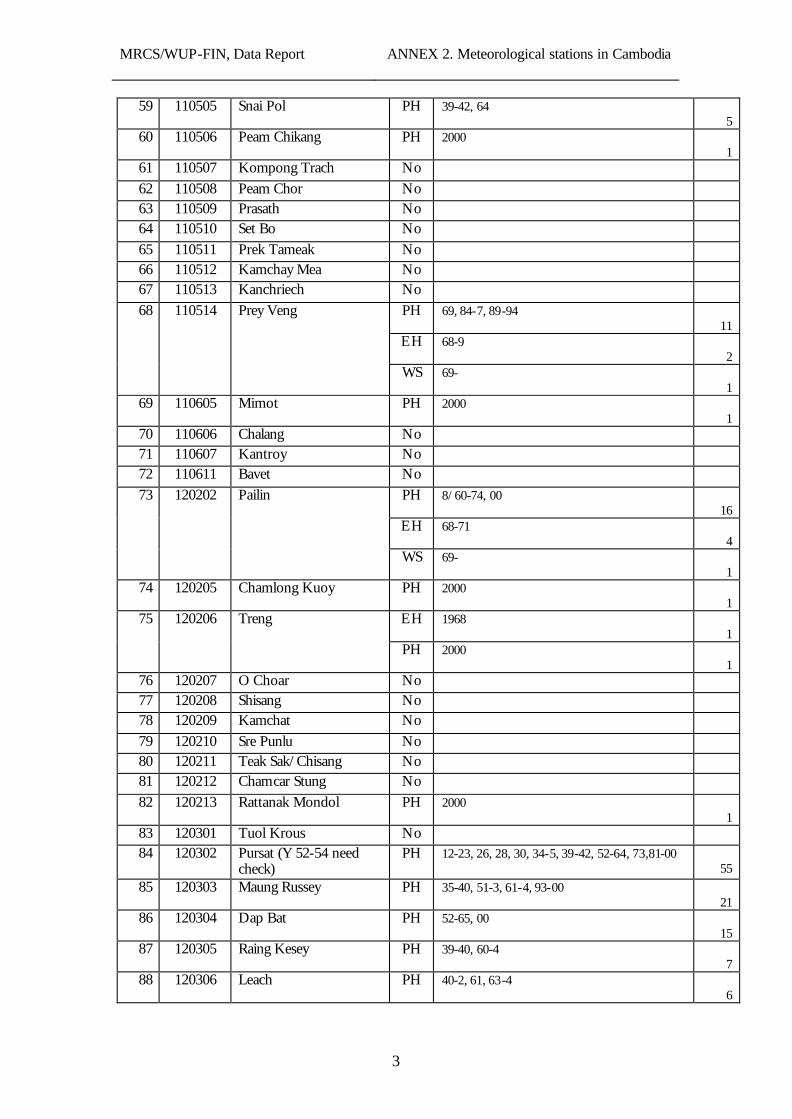
MRCS/WUP-FIN, Data Report
ANNEX 2. Meteorological stations in Cambodia
3
59 110505 Snai Pol PH 39-42, 64 5
60 110506 Peam Chikang PH 2000 1
61 110507 Kompong Trach No
62 110508 Peam Chor No 63 110509 Prasath No 64 110510 Set Bo No
65 110511 Prek Tameak No 66 110512 Kamchay Mea No 67 110513 Kanchriech No
68 110514 Prey Veng PH 69, 84-7, 89-94 11
EH 68-9 2
WS 69- 1
69 110605 Mimot PH 2000 1
70 110606 Chalang No 71 110607 Kantroy No 72 110611 Bavet No
73 120202 Pailin PH 8/60-74, 00 16
EH 68-71 4
WS 69- 1
74 120205 Chamlong Kuoy PH 2000 1
75 120206 Treng EH 1968 1
PH 2000 1
76 120207 O Choar No 77 120208 Shisang No 78 120209 Kamchat No
79 120210 Sre Punlu No 80 120211 Teak Sak/Chisang No 81 120212 Chamcar Stung No
82 120213 Rattanak Mondol PH 2000 1
83 120301 Tuol Krous No 84 120302 Pursat (Y 52-54 need
check) PH 12-23, 26, 28, 30, 34-5, 39-42, 52-64, 73,81-00
55 85 120303 Maung Russey PH 35-40, 51-3, 61-4, 93-00
21 86 120304 Dap Bat PH 52-65, 00
15 87 120305 Raing Kesey PH 39-40, 60-4
7 88 120306 Leach PH 40-2, 61, 63-4
6
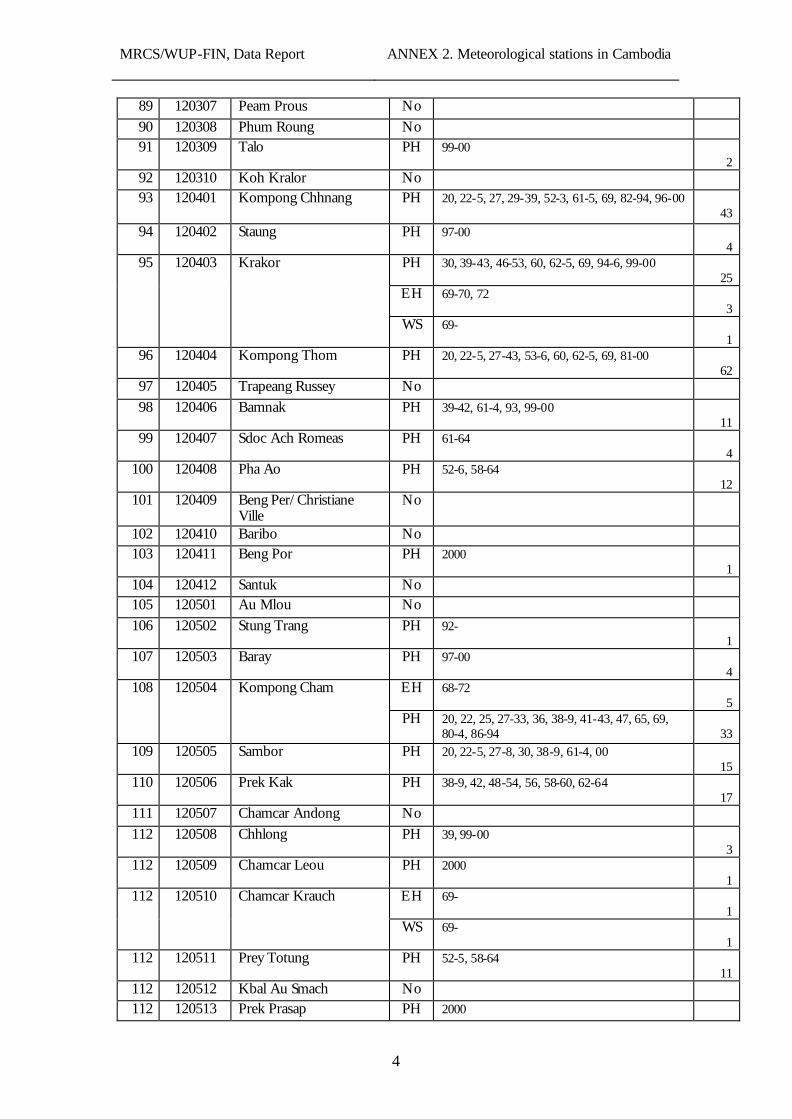
MRCS/WUP-FIN, Data Report
ANNEX 2. Meteorological stations in Cambodia
4
89 120307 Peam Prous No
90 120308 Phum Roung No 91 120309 Talo PH 99-00
2 92 120310 Koh Kralor No 93 120401 Kompong Chhnang PH 20, 22-5, 27, 29-39, 52-3, 61-5, 69, 82-94, 96-00
43 94 120402 Staung PH 97-00
4 95 120403 Krakor PH 30, 39-43, 46-53, 60, 62-5, 69, 94-6, 99-00
25 EH 69-70, 72
3 WS 69-
1 96 120404 Kompong Thom PH 20, 22-5, 27-43, 53-6, 60, 62-5, 69, 81-00
62 97 120405 Trapeang Russey No
98 120406 Bamnak PH 39-42, 61-4, 93, 99-00 11
99 120407 Sdoc Ach Romeas PH 61-64 4
100 120408 Pha Ao PH 52-6, 58-64 12
101 120409 Beng Per/Christiane Ville
No
102 120410 Baribo No 103 120411 Beng Por PH 2000
1 104 120412 Santuk No 105 120501 Au Mlou No
106 120502 Stung Trang PH 92- 1
107 120503 Baray PH 97-00 4
108 120504 Kompong Cham EH 68-72 5
PH 20, 22, 25, 27-33, 36, 38-9, 41-43, 47, 65, 69, 80-4, 86-94
33
109 120505 Sambor PH 20, 22-5, 27-8, 30, 38-9, 61-4, 00 15
110 120506 Prek Kak PH 38-9, 42, 48-54, 56, 58-60, 62-64 17
111 120507 Chamcar Andong No
112 120508 Chhlong PH 39, 99-00 3
112 120509 Chamcar Leou PH 2000 1
112 120510 Chamcar Krauch EH 69- 1
WS 69- 1
112 120511 Prey Totung PH 52-5, 58-64 11
112 120512 Kbal Au Smach No 112 120513 Prek Prasap PH 2000
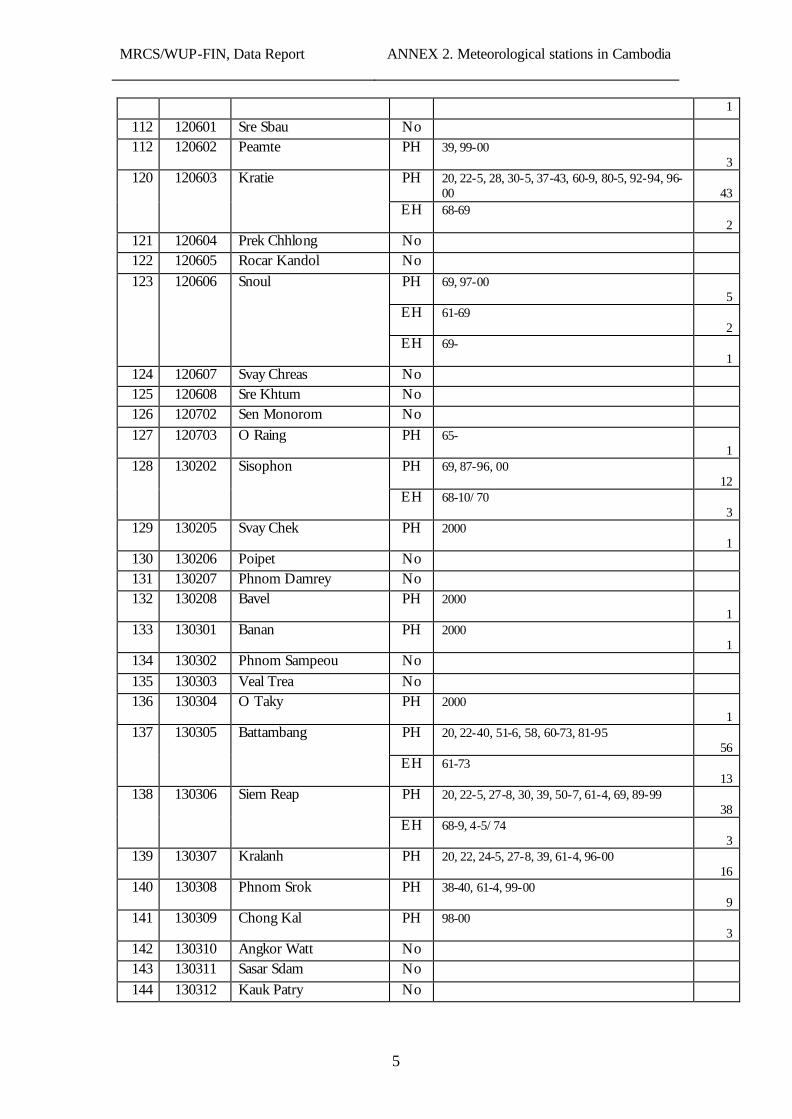
MRCS/WUP-FIN, Data Report
ANNEX 2. Meteorological stations in Cambodia
5
1
112 120601 Sre Sbau No 112 120602 Peamte PH 39, 99-00
3 120 120603 Kratie PH 20, 22-5, 28, 30-5, 37-43, 60-9, 80-5, 92-94, 96-
00
43 EH 68-69
2 121 120604 Prek Chhlong No 122 120605 Rocar Kandol No
123 120606 Snoul PH 69, 97-00 5
EH 61-69 2
EH 69- 1
124 120607 Svay Chreas No 125 120608 Sre Khtum No 126 120702 Sen Monorom No
127 120703 O Raing PH 65- 1
128 130202 Sisophon PH 69, 87-96, 00 12
EH 68-10/70 3
129 130205 Svay Chek PH 2000 1
130 130206 Poipet No 131 130207 Phnom Damrey No 132 130208 Bavel PH 2000
1 133 130301 Banan PH 2000
1 134 130302 Phnom Sampeou No
135 130303 Veal Trea No 136 130304 O Taky PH 2000
1 137 130305 Battambang PH 20, 22-40, 51-6, 58, 60-73, 81-95
56 EH 61-73
13 138 130306 Siem Reap PH 20, 22-5, 27-8, 30, 39, 50-7, 61-4, 69, 89-99
38 EH 68-9, 4-5/74
3 139 130307 Kralanh PH 20, 22, 24-5, 27-8, 39, 61-4, 96-00
16 140 130308 Phnom Srok PH 38-40, 61-4, 99-00
9 141 130309 Chong Kal PH 98-00
3 142 130310 Angkor Watt No 143 130311 Sasar Sdam No
144 130312 Kauk Patry No
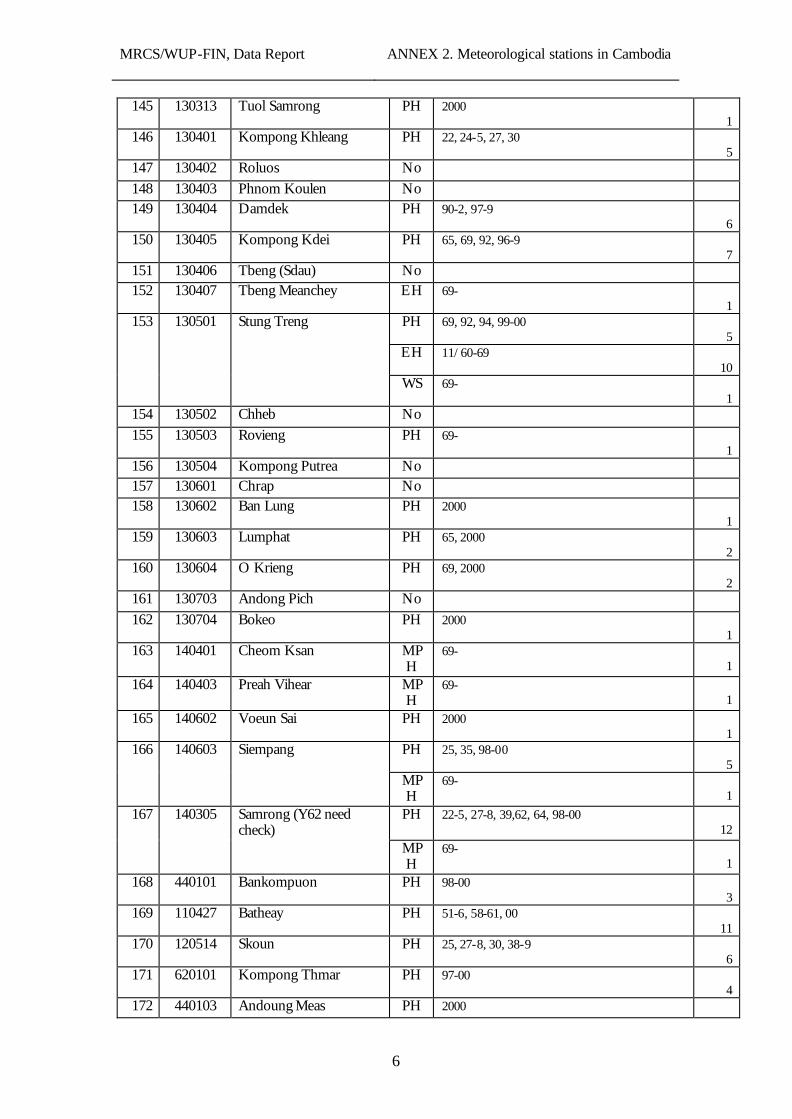
MRCS/WUP-FIN, Data Report
ANNEX 2. Meteorological stations in Cambodia
6
145 130313 Tuol Samrong PH 2000 1
146 130401 Kompong Khleang PH 22, 24-5, 27, 30 5
147 130402 Roluos No
148 130403 Phnom Koulen No 149 130404 Damdek PH 90-2, 97-9
6 150 130405 Kompong Kdei PH 65, 69, 92, 96-9
7 151 130406 Tbeng (Sdau) No 152 130407 Tbeng Meanchey EH 69-
1 153 130501 Stung Treng PH 69, 92, 94, 99-00
5 EH 11/60-69
10 WS 69-
1 154 130502 Chheb No
155 130503 Rovieng PH 69- 1
156 130504 Kompong Putrea No 157 130601 Chrap No 158 130602 Ban Lung PH 2000
1 159 130603 Lumphat PH 65, 2000
2 160 130604 O Krieng PH 69, 2000
2 161 130703 Andong Pich No
162 130704 Bokeo PH 2000 1
163 140401 Cheom Ksan MPH
69- 1
164 140403 Preah Vihear MPH
69- 1
165 140602 Voeun Sai PH 2000 1
166 140603 Siempang PH 25, 35, 98-00 5
MPH
69- 1
167 140305 Samrong (Y62 need check)
PH 22-5, 27-8, 39,62, 64, 98-00 12
MPH
69- 1
168 440101 Bankompuon PH 98-00 3
169 110427 Batheay PH 51-6, 58-61, 00 11
170 120514 Skoun PH 25, 27-8, 30, 38-9 6
171 620101 Kompong Thmar PH 97-00 4
172 440103 Andoung Meas PH 2000

MRCS/WUP-FIN, Data Report
ANNEX 2. Meteorological stations in Cambodia
7
1
173 130314 Bac Prea PH 33-40 8
174 Bkantuot Beoung Kantuot PH 94-96 3
175 Bkhnar Beoung Khnar PH 94-96 3
176 Kravann Kravann PH 94-96, 98-00 6
177 Preypros Prey Pros PH 97-00 4
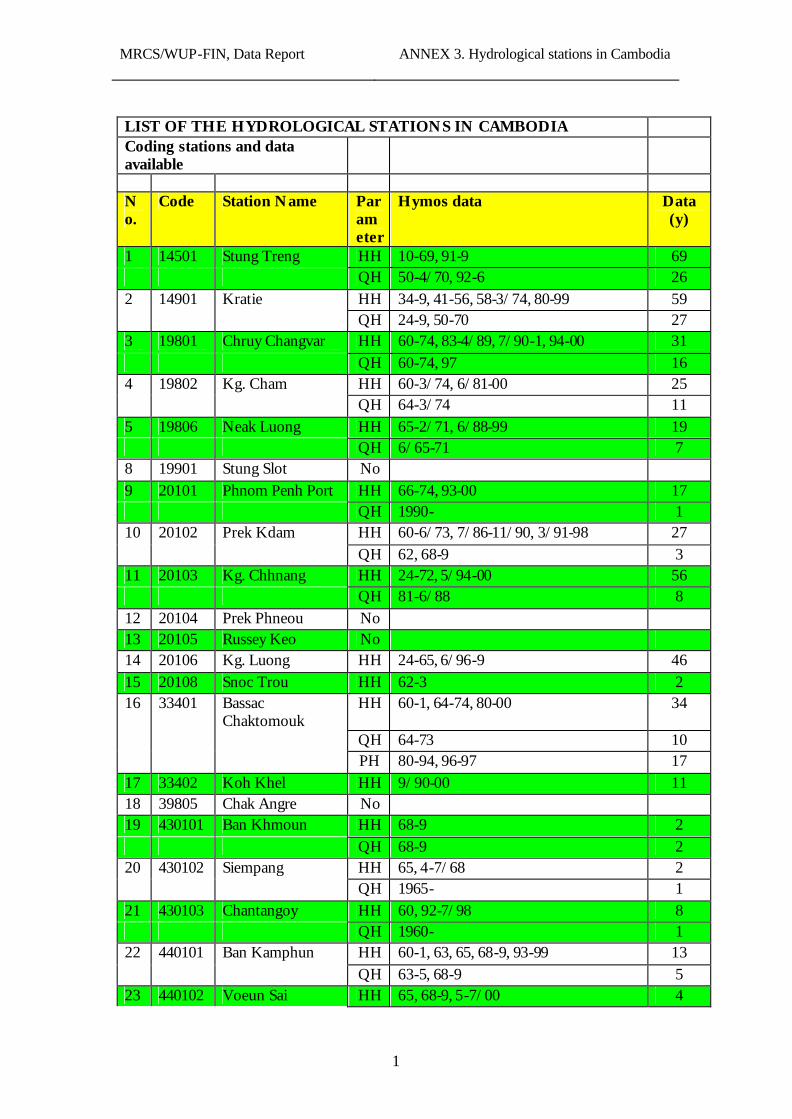
MRCS/WUP-FIN, Data Report
ANNEX 3. Hydrological stations in Cambodia
1
LIST OF THE HYDROLOGICAL STATIONS IN CAMBODIA Coding stations and data available
No.
Code Station Name Parameter
Hymos data Data (y)
1 14501 Stung Treng HH 10-69, 91-9 69 QH 50-4/70, 92-6 26 2 14901 Kratie HH 34-9, 41-56, 58-3/74, 80-99 59 QH 24-9, 50-70 27 3 19801 Chruy Changvar HH 60-74, 83-4/89, 7/90-1, 94-00 31 QH 60-74, 97 16 4 19802 Kg. Cham HH 60-3/74, 6/81-00 25 QH 64-3/74 11 5 19806 Neak Luong HH 65-2/71, 6/88-99 19 QH 6/65-71 7 8 19901 Stung Slot No 9 20101 Phnom Penh Port HH 66-74, 93-00 17 QH 1990- 1 10 20102 Prek Kdam HH 60-6/73, 7/86-11/90, 3/91-98 27 QH 62, 68-9 3 11 20103 Kg. Chhnang HH 24-72, 5/94-00 56 QH 81-6/88 8 12 20104 Prek Phneou No 13 20105 Russey Keo No 14 20106 Kg. Luong HH 24-65, 6/96-9 46 15 20108 Snoc Trou HH 62-3 2 16 33401 Bassac
Chaktomouk HH 60-1, 64-74, 80-00 34
QH 64-73 10 PH 80-94, 96-97 17 17 33402 Koh Khel HH 9/90-00 11 18 39805 Chak Angre No 19 430101 Ban Khmoun HH 68-9 2 QH 68-9 2 20 430102 Siempang HH 65, 4-7/68 2 QH 1965- 1 21 430103 Chantangoy HH 60, 92-7/98 8 QH 1960- 1 22 440101 Ban Kamphun HH 60-1, 63, 65, 68-9, 93-99 13 QH 63-5, 68-9 5 23 440102 Voeun Sai HH 65, 68-9, 5-7/00 4
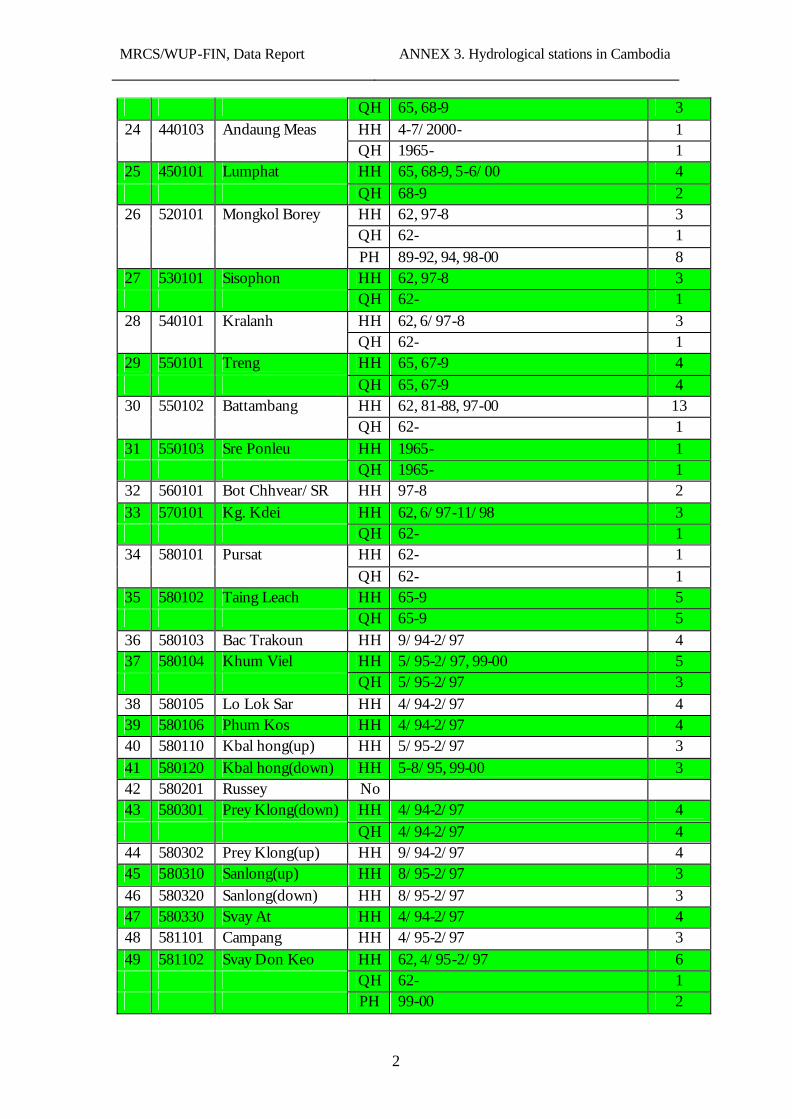
MRCS/WUP-FIN, Data Report
ANNEX 3. Hydrological stations in Cambodia
2
QH 65, 68-9 3 24 440103 Andaung Meas HH 4-7/2000- 1 QH 1965- 1 25 450101 Lumphat HH 65, 68-9, 5-6/00 4 QH 68-9 2 26 520101 Mongkol Borey HH 62, 97-8 3 QH 62- 1 PH 89-92, 94, 98-00 8 27 530101 Sisophon HH 62, 97-8 3 QH 62- 1 28 540101 Kralanh HH 62, 6/97-8 3 QH 62- 1 29 550101 Treng HH 65, 67-9 4 QH 65, 67-9 4 30 550102 Battambang HH 62, 81-88, 97-00 13 QH 62- 1 31 550103 Sre Ponleu HH 1965- 1 QH 1965- 1 32 560101 Bot Chhvear/SR HH 97-8 2 33 570101 Kg. Kdei HH 62, 6/97-11/98 3 QH 62- 1 34 580101 Pursat HH 62- 1 QH 62- 1 35 580102 Taing Leach HH 65-9 5 QH 65-9 5 36 580103 Bac Trakoun HH 9/94-2/97 4 37 580104 Khum Viel HH 5/95-2/97, 99-00 5 QH 5/95-2/97 3 38 580105 Lo Lok Sar HH 4/94-2/97 4 39 580106 Phum Kos HH 4/94-2/97 4 40 580110 Kbal hong(up) HH 5/95-2/97 3 41 580120 Kbal hong(down) HH 5-8/95, 99-00 3 42 580201 Russey No 43 580301 Prey Klong(down) HH 4/94-2/97 4 QH 4/94-2/97 4 44 580302 Prey Klong(up) HH 9/94-2/97 4 45 580310 Sanlong(up) HH 8/95-2/97 3 46 580320 Sanlong(down) HH 8/95-2/97 3 47 580330 Svay At HH 4/94-2/97 4 48 581101 Campang HH 4/95-2/97 3 49 581102 Svay Don Keo HH 62, 4/95-2/97 6 QH 62- 1 PH 99-00 2
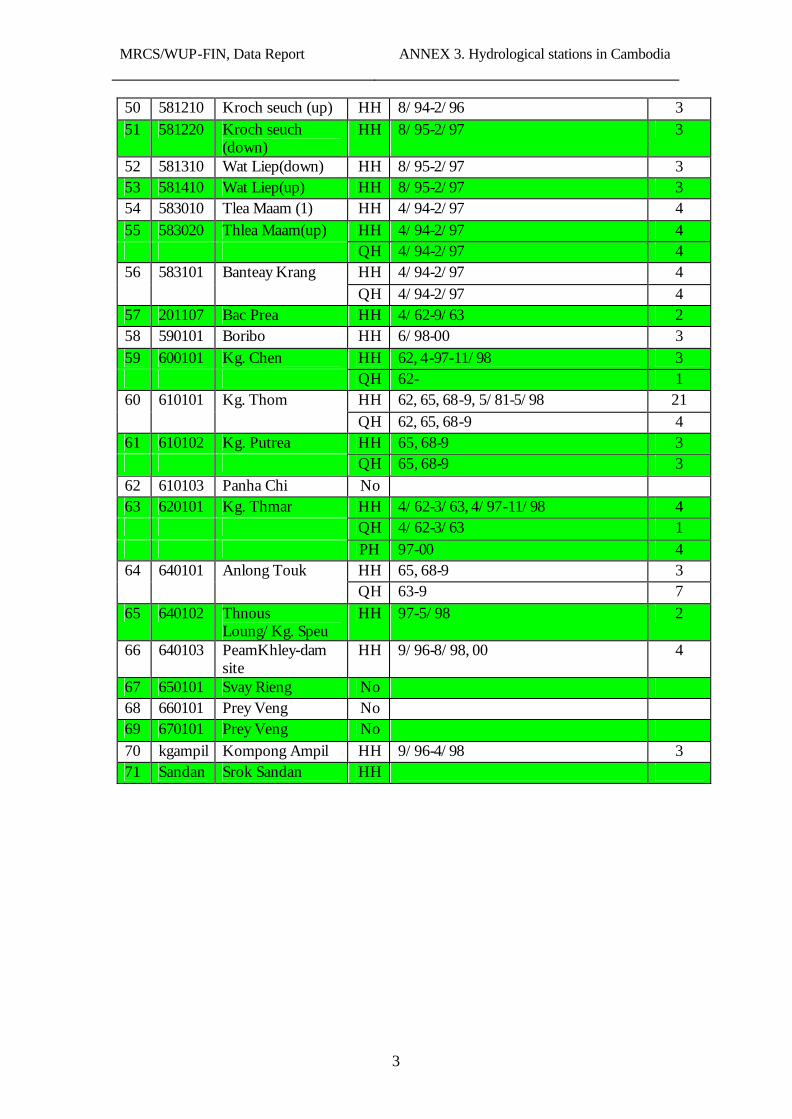
MRCS/WUP-FIN, Data Report
ANNEX 3. Hydrological stations in Cambodia
3
50 581210 Kroch seuch (up) HH 8/94-2/96 3 51 581220 Kroch seuch
(down) HH 8/95-2/97 3
52 581310 Wat Liep(down) HH 8/95-2/97 3 53 581410 Wat Liep(up) HH 8/95-2/97 3 54 583010 Tlea Maam (1) HH 4/94-2/97 4 55 583020 Thlea Maam(up) HH 4/94-2/97 4 QH 4/94-2/97 4 56 583101 Banteay Krang HH 4/94-2/97 4 QH 4/94-2/97 4 57 201107 Bac Prea HH 4/62-9/63 2 58 590101 Boribo HH 6/98-00 3 59 600101 Kg. Chen HH 62, 4-97-11/98 3 QH 62- 1 60 610101 Kg. Thom HH 62, 65, 68-9, 5/81-5/98 21 QH 62, 65, 68-9 4 61 610102 Kg. Putrea HH 65, 68-9 3 QH 65, 68-9 3 62 610103 Panha Chi No 63 620101 Kg. Thmar HH 4/62-3/63, 4/97-11/98 4 QH 4/62-3/63 1 PH 97-00 4 64 640101 Anlong Touk HH 65, 68-9 3 QH 63-9 7 65 640102 Thnous
Loung/Kg. Speu HH 97-5/98 2
66 640103 PeamKhley-dam site
HH 9/96-8/98, 00 4
67 650101 Svay Rieng No 68 660101 Prey Veng No 69 670101 Prey Veng No 70 kgampil Kompong Ampil HH 9/96-4/98 3 71 Sandan Srok Sandan HH
MRCS/WUP-FIN, Data Report
ANNEX 4. Inception Workshop minutes
1
Mekong River Commission Water Utilization Program Modelling of the Flow Regime and Water Quality of the Tonle Sap Finnish Environment Institute Consultancy Consortium (MRCS WUP-FIN project)
Water Utilization Program - Modelling of the Flow Regime and Water Quality of the Tonle Sap MRCS/WUP-FIN MINUTES OF THE INCEPTION WORKSHOP ON JULY 20. 2001 AT THE MRCS Finnish Environment Institute Consultancy Consortium
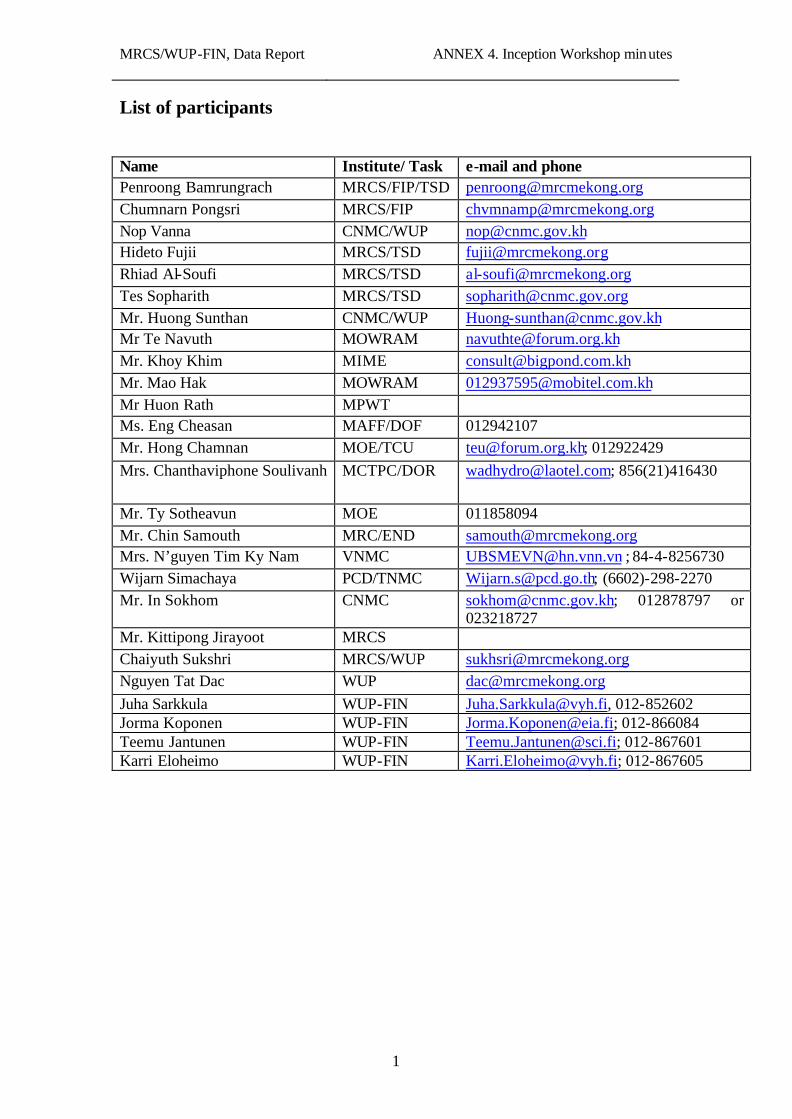
MRCS/WUP-FIN, Data Report
ANNEX 4. Inception Workshop minutes
1
List of participants Name Institute/ Task e-mail and phone Penroong Bamrungrach MRCS/FIP/TSD [email protected] Chumnarn Pongsri MRCS/FIP [email protected] Nop Vanna CNMC/WUP [email protected] Hideto Fujii MRCS/TSD [email protected] Rhiad Al-Soufi MRCS/TSD [email protected] Tes Sopharith MRCS/TSD [email protected] Mr. Huong Sunthan CNMC/WUP [email protected] Mr Te Navuth MOWRAM [email protected] Mr. Khoy Khim MIME [email protected] Mr. Mao Hak MOWRAM [email protected] Mr Huon Rath MPWT Ms. Eng Cheasan MAFF/DOF 012942107 Mr. Hong Chamnan MOE/TCU [email protected]; 012922429 Mrs. Chanthaviphone Soulivanh MCTPC/DOR [email protected]; 856(21)416430
Mr. Ty Sotheavun MOE 011858094 Mr. Chin Samouth MRC/END [email protected] Mrs. N’guyen Tim Ky Nam VNMC [email protected] ; 84-4-8256730
Wijarn Simachaya PCD/TNMC [email protected]; (6602)-298-2270 Mr. In Sokhom CNMC [email protected]; 012878797 or
023218727 Mr. Kittipong Jirayoot MRCS Chaiyuth Sukshri MRCS/WUP [email protected] Nguyen Tat Dac WUP [email protected] Juha Sarkkula WUP-FIN [email protected], 012-852602 Jorma Koponen WUP-FIN [email protected]; 012-866084 Teemu Jantunen WUP-FIN [email protected]; 012-867601 Karri Eloheimo WUP-FIN [email protected]; 012-867605

MRCS/WUP-FIN, Data Report
ANNEX 4. Inception Workshop minutes
1
Agenda 8.45 Registration 9.00 Opening and WUP overview (Chaiyuth Sukshri) 9.30 Overall project plan (Juha Sarkkula) 10.15 Coffee break 10.35 Demonstration of the modelling concept (Jorma Koponen) 11.00 Detailed work plan (Project team) -data collection and review 11.30 Discussion 12.00 Lunch break 13.30 Detailed work plan (Project team) -training and workshops
Links to other projects and data sharing Sustainability
14.30 Coffee break 15.00 Discussion 16.00 Wrap up and Closing
MRCS/WUP-FIN, Data Report
ANNEX 4. Inception Workshop minutes
2
The aims of the minutes are mainly 1) summing up of the inception report, 2) clarifying project implementation and 3) highlighting of critical questions and issues to be solved in the future. Opening Mr. Chaiyuth Sukhsri opened the meeting. He welcomed the participants and especially Cambodian National Mekong Commission and the national line agencies. All of the participants introduced themselves after the welcoming words. Sukhsri apologized about the delayed distribution of the Inception Report. The delay was because project initialization and Inception Report preparation have required many tasks. In the future project should perform better and reports should be sent well before workshops to the participants so that they can familiarize themselves properly with the material. Sukhsri described objectives, organization, functions and relations to other MRCS programs of the Water Utilization Program (WUP). WUP is in a central role for developing the rules for water utilization and supporting sustainable development of the Mekong basin. Impacts of water uses on the socio-economic issues are the focal point of WUP. WUP consists of three working groups: 1) modeling, 2) trans-boundary analysis and 3) rules. Project presentation Below is a short summary of the project presentations. Questions and discussions followed each presentation. A summary of them have been collected in a separate chapter. Overall project plan Juha Sarkkula presented the overall project objectives, staff, organization, tasks and risks involved. Tasks are: Part I: Creating the base for modelling and guidelines
Task 1: Collection and assessment of existing relevant data and information on meteorology, hydrology, water use and water quality
Task 2: Additional data collection. Part II: Modelling and utilisation
Task 3: Develop, calibrate and verify a set of model components developed for the Lake and the catchment
Task 4: Scenario Applications and Eva luation Task 5: Develop guidelines for water quality and pollution control
strategy/program for the Great Lake.
MRCS/WUP-FIN, Data Report
ANNEX 4. Inception Workshop minutes
3
Task 6: Training and Workshops, which can be regarded to be a horizontal task having links to all tasks in Part I and Part II.
The project is divided into two phases. So far the financing is secured only for the first phase. The risks include sustainability, wide scope and multidisciplinary character of the project, right balancing between the project components, coordination with other projects and difficult field conditions. Demonstration of the modelling concept Jorma Koponen presented a tentative modelling concept. This is used as a working tool in the initial phases of the project. A pilot version of the system will be prepared before the next October workshop. It will help in deciding architecture of the final system and guide field measurements. Open system architecture consists of watershed and lake models and user interface including data processing and graphical tools. Internet, GIS and database functionality are part of the system. To what extent different modules will be finished depends on the client specifications, available resources and practical possibilities. Open architecture - even incorporating use of alternative models - should guarantee wide acceptance of the system and future sustainability. The emphasis of the modelling work was reviewed. The idea is to create solid basis for future development. For that end watershed and lake physical models are developed and tested most extensively. Because of limited resources ecological and water quality models have to be realised in a more basic way. However, the intention is to have a long term development work where also the water quality and ecological models will be realised to the fullest possible extent. Field measurements, data collection, interviews etc. support this long term development. The user interface and model functionality was demonstrated with Tonle Sap model examples. One of the main points here is the 3D (three dimensional) character of the hydrodynamic and water quality processes especially during intermediate and high water levels. Koponen brought up coordination with the Basin Wide WUP. There is a risk that work is duplicated unnecessarily. This concerns especially training, data collection, model review, model development, application of models, scenario runs and system software development. The optimal use of resources, avoidance of overlapping work and good connectivity between the system components necessitates good coordination between the projects right from the beginning.
MRCS/WUP-FIN, Data Report
ANNEX 4. Inception Workshop minutes
4
Detailed work plan – data review and collection of existing data Koponen described briefly data collection efforts which concentrate in the first phase on data directly needed for modeling, that is topographic, geological, land use, atmospheric, hydrological, hydrodynamic and water quality data of the Tonle Sap and its catchment area. At a later stage ecological and socio-economic data will be collected. Topographic data collection will use all available cartographic, survey and remote sensing data. Data from different sources will be compared and integrated in order to improve the existing topography of the Tonle Sap area. As a by-product of the efforts the vegetation and land use data needed for the catchment area modeling will be produced as well as figures of the optical characteristics of the Tonle Sap Lake showing suspended solids distribution. The latter data can be used to verify the hydrodynamic and sediment transport models. Examples of the optical imagery showing clear patterns of sediment transport were presented. Detailed work plan – collection of new data Juha Sarkkula described the started and planned field measurement activities. They include hydrology, meteorology, water quality and sedimentation. Field measurement program has been initiated in co-operation with CNMC and MWRM. River water quality measurement points consist of 12 stations. In the lake there are 2 water level and meteorology stations and 5 - 6 water quality stations. Water samples are analyzed at the laboratory of the MWRM. Frequent sampling, quick transport of samples, emphasis on nutrient analyses, quality control and assurance, inter-calibration are part of the water quality sampling program. Sampling is planned to be done twice a month in July-October, in four regions, one day each. Parameters are the same as in the national program plus chlorophyll-a and Secchi depth in the lake. A few samples for heavy metals (tributaries) and algal biomass and species (lake) will be taken and analyzed in FEI laboratory. Suspended solids are the basis for the high productivity of the lake and its flood plain. Also vessel route planning and sustainable maintenance of dredged channels needs knowledge about erosion, sediment movement and sedimentation. Suspended solids and sedimentation studies will be realized in the lake and in Chhnok Tru area mostly at the end of end of 2001 and summer 2002. However a pilot study is planned to be realized already during summer 2001. Measurements include sediment traps, turbidity and current measurements. Lake-wide cruises will be realized in November 2001, March 2002 and August 2002. Measurements include at least water quality sampling, dissolved oxygen, pH conductivity (CTD-probe), primary production and lake circulation (ADCP-current meter). Quality control is a necessary part of the sampling program. One of the most urgent tasks is to improve the MWRM laboratory with the following equipment (based on discussions with Lars Lundmark):
MRCS/WUP-FIN, Data Report
ANNEX 4. Inception Workshop minutes
5
- new autoclave (the old is broken) (1000 USD) - spectrometer with double beam facility and using 10 cm cyvetes (1000 USD) - Ultra Pure Water system (2000-3000 USD) - new refrigerator for storing the samples (100 l) - new glassware used only for ‘Tonle Sap’ project (200 USD) - oven to dry the glassware (buy locally) - filter paper for filtering the nitrate and phosphate samples (100 USD)
Coordination and cooperation with MRCS Environment, Navigation and Fisheries Programs is a starting point for the measurement program. Partnership with line agencies is essential for the successful implementation and sustainability of the field work. Partnership consists of measurements, data processing and analysis and training. Detailed work plan – training and workshops Koponen and Sarkkula described the training and workshop plan. Training of the local modeling team is expected to start in the beginning of September. The initial phase of the training consists of lectures and planning of the training program with the potential trainees. The final selection of the trainees will be done during September after in-depth examination of their backgrounds and capabilities. Practical on-the-job training will commence as soon as possible. The initial task is to establish the pilot modeling system before the November workshop. One person will be trained as a field work assistant. He will also participate in data processing and model verification. Three workshops have been added to the original workshop plan. In October 2001 two provincial workshops will be done in Siem Reap and Pursat. The tentative agenda includes:
- information of the project and its objectives - demonstration of the practical use of the models - discussion on the development issues in the catchment area and the lake - training of the local staff in handling and maintaining measurement devices
brought by the project - training in water quality sampling methodology and quality assurance - organization by CNMC and the line agencies.
The third added workshop will be done in March 2002. It is an interim workshop on model development and calibration. The workshop is intended for discussing and agreeing about the model development strategies to be adopted within the project. Participants will be mainly modelers, technical experts and scientists. However the workshop is subject to change depending on the coordination with the Basin Wide Modeling Package. The other workshops based on TOR and original project plan are on:
- working papers 1 (data review) and 2 (additional data collection); November 2001
MRCS/WUP-FIN, Data Report
ANNEX 4. Inception Workshop minutes
6
- model development, verification and validation (working paper 3); August 2002
- environmental and socio-economic management scenario applications and model simulations (working paper 4), guidelines for water quality and pollution control strategy (working paper 5) and training (working paper 6); February 2003
- Draft Final Report; April 2003 In the November 2001 also the pilot model system and results will be discussed. It is possible that project gives seminars and lectures on academic institutions. This would contribute to the sustainability of the project and connect activities in the universities to the project work. There have been initial connections to this end. Links to other projects and data sharing Representatives for the JICA project “Filling the Gaps” and ADP project “Critical Wetlands” participated in the workshop. They presented briefly the projects. Coordination and cooperation between WUP-FIN, JICA and Critical Wetlands were discussed. JICA can support the WUP-FIN project by providing flow boundary values for the Tonle Sap River, in data collection and preparation, overland flow estimation during the flooded period and comparison of the results of the hydrological models. The aim of the Critical Wetlands project is to prepare feasibility studies for investment projects. There is an expectation from the financer (Finnish Government) that WUP-FIN and Critical Wetlands would support each other. The WUP-FIN work could be used for the wetland data base and providing basic information for the planning of the investments. On the other hand the Tonle Sap project would benefit from a close connection to the development and investment activities. For the time being there is no centralized database which would support basic data needs when for instance development and management issues are encountered. There are many important links to the MRCS programs which are discussed in the Inception Report. Because of the lack of time they were not discussed in depth during the workshop. Discussion Security The security problem of the field teams was raised and it was asked is the team expecting specific measures from the counterparts. Juha Sarkkula answered that the security issue has been brought up in the inception report in order to highlight that the team is aware of the risk and that the team is taking it in account during the field trips. However the real risk should not be over-estimated. The security issue has been handled in practice with the assistance of CNMC, line agencies and provincial offices. An additional measure would be support from the MRCS security framework.
MRCS/WUP-FIN, Data Report
ANNEX 4. Inception Workshop minutes
7
Water quality It was asked whether the 5 – 6 water quality sampling points in the lake will be enough to reveal the behavior of the lake. The answer was that the sampling program is dictated by the available resources and practical possibilities and that the intensive sampling points will be supplemented with a spatially more comprehensive sampling program during the lake cruises. As a result there will be high frequency data from the selected sampling points that are complemented with periodic comprehensive distribution maps. It was clarified that the main water quality parameters that are followed are suspended solids, nutrients, dissolved oxygen and chlorophyll. Of course temperature, conductivity and all of the other parameters in the national monitoring program will be measured as well. It was clarified that the project doesn’t intend to define water quality standards. They will be assessed by the MRCS Environment Program. However project has to take the standards into account when translating the modeling results into management guidelines. It was pointed out that the point source nutrient load from the floating villages and most of the municipalities is probably much less than the diffuse load from the catchment area and from the flood plains during the flood. A new portable in-situ chlorophyll-a and phytoplankton groups measurement instrument was discussed. The problem with the instrument is that it is relatively expensive, there may not be sufficient information on the accuracy of the measurements in the lake conditions and durability of the instrument is not guaranteed under the very rough field trips. However, if the device turns out to be rugged and reliable, the promise of continuous primary production measurements combined with species analysis would make it valuable tool in the future for biological process studies. Chaiyuth suggested that if there are any open questions concerning the sampling they should be resolved primarily with the Environment Program and the Ministry of Environment, Cambodia. Training and local participation It was clarified that although consultant’s training work has been cut by 50% compared to the original proposal and there has been also other major cuts in various other tasks, no cuts have been made in the local participation. This means in practice that trainees and local people working for the project are expected to do more independent work and the consultant is no t able to devote as much time to specific training issues as has originally planned. The issue of CNMCS’ participation in the evaluation of the trainees was brought up. The procedure that will be applied consist of following stages:
1. MRCS together with the consultant prepares recruitment TOR
MRCS/WUP-FIN, Data Report
ANNEX 4. Inception Workshop minutes
8
2. TOR is distributed by the CNMCS 3. CNMCS, MRCS and the consultant evaluate of the candidates 4. MRCS and the consultant prepare a list of trainees that CNMCS accepts or
rejects. Two open questions concerning the training were pointed out: 1) MRCS has not yet decided in what way it will participate in training and 2) the training has to be coordinated with the Basin Wide WUP. These two issues are connected to each other. Scenario development It was pointed out that scenario definition is very important. It can’t be made without full cooperation form the NMCs and line agencies. Development scenarios will be worked in MRCS through the BDP (Basin Development Plan Program). Also Fisheries Program will be in key position in providing data and scenarios. WUP-FIN has to develop set of boundary conditions that can be defined by outside parties. Scenarios will be discussed also in the November 2001 workshop. Coordination with other projects The overlapping of work with the JICA project was discussed. Chaiyuth responded that MRCS will do their utmost to avoid overlapping of work, but in practice it is sometimes difficult because of the multi-project and multi-donor environment MRCS has to work with. Koponen responded that overlapping in the hydrological modeling with the JICA and WUP-FIN teams can be seen also as a positive thing because the approaches are quite different and the results can be compared for verification and for model evaluation in the Basin Wide WUP. It was emphasized that parallel tasks and avoidance of duplicating same work necessitates early coordination with the WUP Basin Wide Modelling and flexibility in resource allocation in both Basin Wide and Tonle Sap modelling. Watershed modeling Concern was raised that physically based watershed models are generally too heavy for large scale modeling. Al-Soufi and Koponen answered that the suggested approach is physical but contains sufficient simplifications for practical modeling of large watersheds. The intent is no t to make an academic exercise but to create a practical tool for management purposes.
MRCS/WUP-FIN, Data Report
ANNEX 4. Inception Workshop minutes
9
Fisheries Linkage of model results to the habitat and fish production issues is critical for the model utilization. There is an ongoing consultancy service under the Fisheries Program that can be used for this purpose. Draft final report of this work will be published in the middle of September and final report in the middle of October 2001. Socio-economic issues It was pointed out that modeling is often the forum where natural sciences and socio-economic issues can meet on a common ground. Topographic surveys The precise leveling from Chau Doc to Prek Kdam was discussed. This leveling is complemented with the precise leveling from Hat Tien to Chau Doc and from Prek Kdam to Kompong Loung within other projects. The leveling will help bringing elevations in large part of the lower Mekong to the same reference system. The system serves directly MRCS Navigation Program and Basin Wide WUP. There is no need or intention to impose any specific reference system to any of the Mekong countries and the countries decide their own systems based on their national needs. In Cambodia the National Geographic Agency is the main counterpart for survey works. Main resolutions and recommendations It was concluded that because the Inception Report has been published in a final format, the necessary clarifications for the report can be distributed with the minutes of the meeting. Chaiyuth summarized the main resolutions:
1. Remote sens ing activities within MRCS and line agencies should be clarified in order to avoid overlapping of efforts. The project officers should coordinate the work.
2. Monitoring network and program should be further discussed with the Ministry of Environment, Cambodia; the discussions should be organized through the NMCS.
3. Relationship and data sharing with the ADP and Finnish Government funded Critical Wetlands Project should be clarified.
4. CNMC participation in the trainee evaluation should be clarified (compare to Training and local participation in Chapter 3).
5. When needed clarification of the aims and implementation of the leveling work should be carried out (compare to Topographic surveys in Chapter 3). Discussion should be coordinated by the CNMCS.

MRCS/WUP-FIN, Data Report
ANNEX 4. Inception Workshop minutes
10
The WUP-FIN project suggests urgent solution of the quality issues of the MWRM laboratory by purchase of necessary laboratory equipment (see Detailed work plan – collection of new data in Chapter 2). For this memo should be sent to the Environment Program.
MRCS/WUP-FIN, Data Report
ANNEX 5. Informal WUP-FIN Model Review Meeting
11
November 15. 2001 Mekong River Commission Water Utilization Program Modelling of the Flow Regime and Water Quality of the Tonle Sap Finnish Environment Institute Consultancy Consortium (MRCS WUP-FIN project)
Memorandum of the Informal WUP-FIN Model Review Meeting On November 14, 2001, from 3.30 to 5 pm. at MRCS Participants Nguyen Tat Dac, Tes Sopharith, Riyadh Al-Soufi, MRCS, Jorma Koponen, Hannu Lauri and Markku Virtanen, WUP-FIN I Session concentrating on general issues and 3D modelling 1) Overall project status – field measurements, quality control, precise levelling, data review, data analysis and training;
Jorma Koponen reviewed briefly the situation with the project tasks: - more than 400 water quality samples, numerous in-situ measurements,
automatic recording of water quality (oxygen, temperature, turbidity, pressure, pH), water levels, lake winds, air temperature, humidity and solar radiation have been collected in the field measurements until now,
- the quality of laboratory analysis of water quality samples is confirmed by two sets of inter-calibration between three laboratories, in-situ observations are checked with parallel sampling several times,
- precise levelling of height benchmarks has been done between Prek Kdam and Phnom Penh and is estimated to be completed between Phnom Penh and Chau Doc within three weeks,
- data review and data analysis have been proceeded as planned, preliminary reports and results are already submitted for pre-evaluation and -use,
- two modelling trainees have been selected and have started their work - the selection of the GIS-, socio-economic/ environmental and field work
trainees is under way. Discussions were concentrated on the direction of the levelling, whether it should
have been started from downstream, whether it is done piecewise to both directions, how the directions will affect the results and what reasons have forced the work to be started from upstream. Jorma Koponen will inform the levelling team of these and ask answers.
As another question the influence of the possible water level inclination for the lake surface and boundaries was widely discussed. Several arguments were presented to support the sufficiency of one benchmark for the whole lake. Later work will provide more precise and more convincing furthe r information about the water level
MRCS/WUP-FIN, Data Report
ANNEX 5. Informal WUP-FIN Model Review Meeting
12
differences within the lake. Additional information available of the contour lines and height profiles will be taken into account when received. 2) Status of the 3D lake and floodplain model including new evidence in favour of 3D approach;
The status of the 3D lake and floodplain model was illustrated with an example of the model run describing the transport of suspended solids in different water layers during the rising stage of water level. In addition to this, field results to show the steep vertical gradient of oxygen in the floodplains were presented.
It was agreed that a 3D (three-dimensional) approach will be adopted for the modelling of the lake and floodplain. Two-dimensional (2D) vertically integrated runs will be made available for the users as an option. It is extremely easy to change the model calculation from 2D to 3D or vice versa.
The south boundary of the model area was agreed to be set at Prek Kdam in the Tonle Sap River about 50 km south of the lake especially because during the flooding stage it is the only narrow section within a range of 200 km. Modelling of the flows into Tonle Sap river would require a Mekong upstream and delta model with flooding and overland description which is clearly out of the scope of the work. The boundary values in Prek Dam are gotten from rating curves, measurements, JICA model study and WUP-HAL project.
The over-saturation of oxygen at the water surface can be described with the model when the work has proceeded to simulation of biomass and algal growth. II Session concentrating on data management and watershed modelling 1) Status and applicability of the model data management tools – database, GIS and user interface; Status of the watershed model;
Hannu Lauri presented briefly the status and application alternatives of the data management tools including the status and alternatives of the watershed model:
- main attention in the work until now has been paid to the data processing, database management and to fluent input of the MRCS GIS data for model input,
- in watershed analyses the measurement data and GIS is used a) for statistical illustrations and time-series, b) for the basis of conceptual lumped-data calculations and c) for the basis of distributed-data modelling,
- the data management and user interface software has been designed to provide inputs for different models
- advantages of distributed-data models include their possibilities for spatial resolution, for what- if –predictions, for long term analysis under varying land use or climatological conditions, for intermediate validity checks, for illustrative visualization and for direct usability to water quality calculations for loading estimates to the lake model (at first stage at least for suspended solids and total phosphorus),
- preliminary test runs of the watershed model have been carried out for a northern sub-basin of the Tonle Sap Lake with horizontal resolution of 500 m and with 30 000 active grid boxes,
- in addition to meteorological data, the model uses as input the land use or land cover (eg. for leaf-area-index and interception capacity estimates and for water quality loading estimates), soil type (for infiltration, water conductivity, erosion and leakage potential etc.) and elevation (for determination of slopes and course of river beds etc),
MRCS/WUP-FIN, Data Report
ANNEX 5. Informal WUP-FIN Model Review Meeting
13
- as an indication of the versatile applicability of the data management software and user interface, the same software is used to control the watershed model and the 3D lake and floodplain model,
- commercial GIS packages are not directly used as a basis for the model user interface since clients don’t necessarily want to have licenses for them and they are not designed for modelling purposes; instead use of standard GIS shape and raster files and appropriate GIS capabilities (e.g. layers, data analysis and information tools) are provided by the user interface. 2) Watershed modelling objectives, requirements and applicability of different models; Alternative approaches and models – viable options and integration possibilities;
For long-term purposes the approach presented was considered appropriate. For short-term purposes closer attention to responses, statistics and stochastic features were hoped. (As an example long-term purposes can mean e.g. loading estimates, monthly discharges, effects of land-use changes, construction works, other management efforts etc. Short-term phenomena pay attention e.g. to responses of flow to precipitation, peak flood and other extreme situations, acute flood forecasts and flood protection etc.)
The current system architecture of a) data analysis tools, b) simple conceptual models and c) more advanced physical distributed models could respond to both MRCS immediate needs and future expandability of the system.
High demands are set for the user interface if different countries want to use different model systems. Different problems and circumstances may also need different model types. Selection of the interface will thus be even more essential than the selection of the models. It was stated that more discussions are needed for proper combination of the total system of input interface, model(s) and output interface.
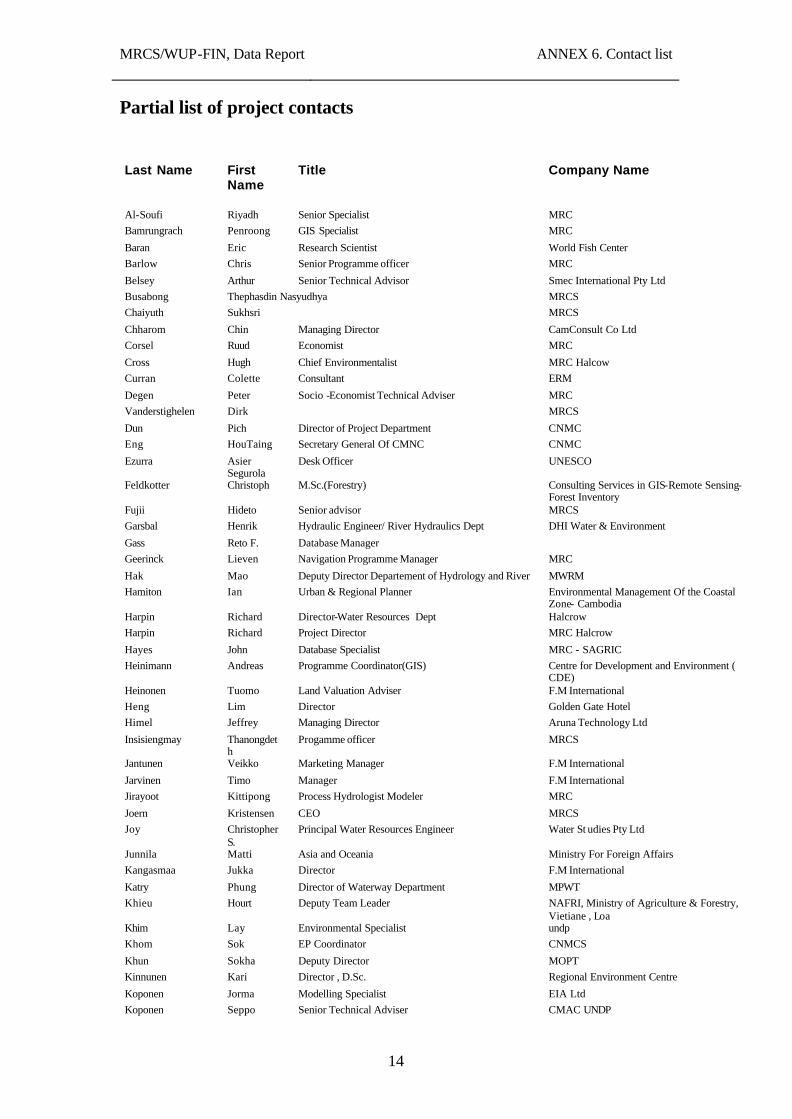
MRCS/WUP-FIN, Data Report
ANNEX 6. Contact list
14
Partial list of project contacts Last Name First
Name Title Company Name
Al-Soufi Riyadh Senior Specialist MRC Bamrungrach Penroong GIS Specialist MRC
Baran Eric Research Scientist World Fish Center Barlow Chris Senior Programme officer MRC
Belsey Arthur Senior Technical Advisor Smec International Pty Ltd Busabong Thephasdin Nasyudhya MRCS Chaiyuth Sukhsri MRCS
Chharom Chin Managing Director CamConsult Co Ltd Corsel Ruud Economist MRC
Cross Hugh Chief Environmentalist MRC Halcow Curran Colette Consultant ERM
Degen Peter Socio -Economist Technical Adviser MRC Vanderstighelen Dirk MRCS
Dun Pich Director of Project Department CNMC Eng HouTaing Secretary General Of CMNC CNMC
Ezurra Asier Segurola
Desk Officer UNESCO
Feldkotter Christoph M.Sc.(Forestry) Consulting Services in GIS-Remote Sensing-Forest Inventory
Fujii Hideto Senior advisor MRCS Garsbal Henrik Hydraulic Engineer/ River Hydraulics Dept DHI Water & Environment
Gass Reto F. Database Manager Geerinck Lieven Navigation Programme Manager MRC
Hak Mao Deputy Director Departement of Hydrology and River MWRM Hamiton Ian Urban & Regional Planner Environmental Management Of the Coastal
Zone- Cambodia Harpin Richard Director-Water Resources Dept Halcrow Harpin Richard Project Director MRC Halcrow
Hayes John Database Specialist MRC - SAGRIC Heinimann Andreas Programme Coordinator(GIS) Centre for Development and Environment (
CDE) Heinonen Tuomo Land Valuation Adviser F.M International Heng Lim Director Golden Gate Hotel Himel Jeffrey Managing Director Aruna Technology Ltd
Insisiengmay Thanongdeth
Progamme officer MRCS
Jantunen Veikko Marketing Manager F.M International
Jarvinen Timo Manager F.M International Jirayoot Kittipong Process Hydrologist Modeler MRC
Joern Kristensen CEO MRCS Joy Christopher
S. Principal Water Resources Engineer Water St udies Pty Ltd
Junnila Matti Asia and Oceania Ministry For Foreign Affairs Kangasmaa Jukka Director F.M International
Katry Phung Director of Waterway Department MPWT Khieu Hourt Deputy Team Leader NAFRI, Ministry of Agriculture & Forestry,
Vietiane , Loa Khim Lay Environmental Specialist undp Khom Sok EP Coordinator CNMCS
Khun Sokha Deputy Director MOPT Kinnunen Kari Director , D.Sc. Regional Environment Centre
Koponen Jorma Modelling Specialist EIA Ltd Koponen Seppo Senior Technical Adviser CMAC UNDP
MRCS/WUP-FIN, Data Report
ANNEX 6. Contact list
15
Korishita Kanehiro Manager CTI
Lund Torben Chief Finance and Administration Section MRC Lundmark Lars Specialist/ Chemical Instruments University of Umea Chemistry Department
Makin Ian W. Asian Regional Director IWMI Manithaphone Mahaxay MRCS
Mills Geoff Training Specialist MRC SAGRIC Mya Sein Specialist.Environmental Data and Monitoring MRC
Nareth Men Head of Depart. of Rural Engineering ITC Nhan Quang Nguyen Assistant Chief Executive Office and Director, MRC Niny Sin Voice-Chaiman of CNMC CNMC
Paulson Richard W. Flood Management Expert MRC Poulsen Anders
Faaborg Senior Fisheries Biologist / Ecologist MRC
Richey Jeffery E Professor/ School of Oceanograpy University of Washington Ruokoranta Keijo First Secretary Ministry For Foreign Affairs
Saing Im Sok Senior Hydrologist MRC Sandercock Daniel System Administrator/ AMO British Embassy
Sary Ly Department Chief of Land Management Urban Planning Construction and Cadatre Beanteay Mean Chey
Ministry of Land Management, Urban Planning and Construction
Scheffczyk Roland B. Team Leader NAFRI,Ministry of Agricuture and Forestry Simachaya Wijarn Chief of Inland Water Quality Subdivision MRCS
Sinara Hong Deputy Director MPWT Sokha Chin Chief Office of Water and ,Soil Quality Management Ministry of Environment Sokharavuth Pak Chief Officer Environmental Laboratory Ministry of Environment
Sophannareth Doung Acting Chief of Cabinet Provincal Office Sopharith Tes Modeller/ Technical Support Division MRC
Soulivanh Chanthaviphone
Assistant Hydrologist Ministry of Communication Transport Post & Construction Department of Roads
Sunthan Houng WUP Coordinator CNMCS
Syvutha Cheat Director of Department MWRM T Evans Patrick Team Leader FAO
Tat Dac Nguyen Head of working group No1 MRC Thanh Tin Nguyen Specialist, Environmental Data Monitoring MRC
Thomas Greg IEC Specialist MRC-SAGRIC Thouk Noa Director General MAFF
Thuren Anders Programme Manager Environment Division MRC Van Zalinge Nicolaas Chief Technical Advisor MRC
Vanna Chhith General Manager F.M International Vanna Nop Head WG-I, WUP CNMC
Wrigley Tim Specialist, Environmental Data Monitoring MRCS
MRCS/WUP-FIN, Data Report
ANNEX 7. Literature lists
16
List of books and reports at the WUP-FIN office Author Title Year
Aczel Statistics 1995
Al-Soufi (Ed) Hydrological and Environmental Modelling 2000 An AusAID Fund Project Appropriate Hydrological Network Improvement Project 2001
Anttonen Study on The Vertical and Horizonal Datum and the Geodetic Surveys Carried Out in Cambodia
1999
Binnie Partners Consulting and Engineers
Tonle Sap and Chakdomuk Development plan 1993
Biswas ( Ed) Modelling of Water Resources Systems II 1972 Biswas ( Ed) Models for Water Quality Management 1981
Broson Operation Research. 1982 Bruijnzeel Hydrology of the Moist Tropical Forests and Effects of Conversion : A State of
Knowledge Review 1990
Carbonnel Sedimentologie et Hydrologie 1963 CARERE- Battambang/CEMP Report on Research in to the Use of the Natural Resources in Battambang
Province 1997
CDE The WSC Data User Guide 1997 CDE The WSC Map Users Guide 1997
Certeza Surveying Co, Inc, Final Report Item C - Tonle Sap Area Strip Mapping at 1.:20,000 Scale 1964 Chaktomuk Project Management Unit
Chaktomuk Area: Environment, Hydraulics and Morphology 2001
Chaktomuk Project / DHI Chaktomuk Area: Environment, Hydraulics and Morphology Phase 1 2001 Chapra Surface Water -Quality Modeling 1997 Chin Water Resources Engineering 2000
Crebas Mission on data base management and processing systems 1987 Cushman A Report on Program of Ground- Water Investigation for Cambodia 1958
DANIDA Flood Forecasting and Damage Reduction Study in the Lower Mekong Basin 1995 Dec Lao Flood Forecasting and Damage Reduction Study 1995
Dingman Physical Hydrology 1994 Division of Eastern Europe and Central Asia Unit
Guidelines for Project Planning, Monitoring and Reporting 2000
Duxbury World Ocean 1997 Dzurik Water Resources Planning 1996
Economic and Social Commission For Asia, Pacific
Atlas of Mineral Resources of the Escap Region 1993
Edgrer Lower Mekong Basin 1982
Environmental System Research Institute- Inc
Understanding GIS 1990
ESRI Arc View GIS 1996
FAO Participatory Natural Resources Management in the Tonle Sap Region 1994 FAO/MRC Flood Management and Mitigation in the Mekong River Basin 1999
Fily Cambodge Grand Lac - Tonle Sap 1963 Global Witness The Credilibity Gap and the Need to Bridge it 2001
Griles Fluid Mechanics and Hydraulics 1995 Harza Engineering Company Lower Mekong River Project 1962
Herath Mekong Basin Studies 2000 Hervouet (Ed) The TELEMAC Modelling System 2000 Hirsch Natural Resource Mangement in the Mekong River Basin 1996
Hoggan Floodplain Hydrology and Hydraulics 1997
Hydrogeologic Reconnaissance of the Mekong Delta in South Vietnam and Cambodia
1978
Insisiengmay Stochastic Data Generation as an Inputs into Simulation Model for the Lower Mekong Basin
1993
Institute of Hydrology Investigtion of Dry Season Flows 1988
Institute of Hydrology Investigat ion of Dry Season Flows 1988 Institute of Hydrology Lower Mekong Basin 1984
Kokusai kogyo, LTD The Study On Groundwater Development in the Southern Cambodia 1999
MRCS/WUP-FIN, Data Report
ANNEX 7. Literature lists
17
Japan Marine Science Inc. Industrial Policy Support Research Report on Survey for Det ermining Basic Plan Relating to means of High-Speed Transport to Enhance Physical Distribuion
2001
Jhonson ( Ed) Hydrology in the Humid Tropic Environment 1998 Infrastructure Development Institute Pasco International Inc,
The Reconnaissance Survey Project 1999
Nippon Koei Co Ltd, Nihon Sudo Consultants Co , Ltd
The Study on Water Supply System For Siem Reap 2000
The Mekong Reconnaissance Team Major Tributaries of Lower Mekong Basin 1961
Julien Erosion and Sedimentation 1995 Kirby ( Ed) Integrated River Basin Development 1994
Kuusisto International river basins and the use of water resources 1998 Lagle Fisheries and Integrated Mekong River Basin Development 1976
Lamberts Base Line Information on the Ecology of the Fish and Habitats of the Flood Area of the Tonle Sap Lake in the Siem Reap Province
1997
L'evesque Water Resource Development in the Province of the Pursat 1995
Lillesand Remote Sensing and Image Interpretation. 1999 Mahfuzuddin Socio-Economic Assessment of Freshwater Capture Fisheries of Cambodia 1998
Mahfuzuddin Issues of Sustainability and Subsistence 2000 Mannio Monographs of the Boreal Environment Research 2001
Martin Hydrodynamics and Transport for Water Quality Modeling 1999 McElwee Environment and Society in the Lower Mekong Basin a Landscaping Review 1999 Mekong Secretariat Mekong Publications 1995
Mekong Secretariat The Mekong Committee a Historical Account ( 1957-89 ) 1989 Ministry of Environment Tonle Sap Watershed 1996
Montgomery GIS Data Conversion Handbook 1993 Morris Reservoir Sedimentation Handbook 1998
Mekong River Commission Secretariat
Natural Resource -Based Development Strategy for the Tonle Sap Area 1998
MRC Strategic Master Scheme for Hydro-Meteorological Network in the Mekong River Basin
2001
MRC Natural Resources-Based Development Strategy, Workshop on Options For the Development Of the Tonle Sap Region
1998
MRC Workshop on Hydrological and Environmental Modelling in the Mekong Basin 2000
MRC Lower Mekong Hydrologic Yearbook 1996 MRC Consultant Workshop on Formulation of a Regional Strategy for Flood
Management and Mitigation in the Mekong River Basin Phnom Penh 13-14 February 2001
2001
MRC Long Term Environment Programme2001-2005 1998
MRC Annual Report 1999 1999 MRC and UNDP Natural Resources Based development Strategy for the Tonle Sap Area,cambodia 1999
MRC/UNEP Mekong River Basin Diagnostic Study 1997 MRCS Mekong Program/ Project Manual 1994 MRCS Terminal Report 1998
MRCS Supplemental Studies 1998 MRCS Potential For Basin Development Plan 1998
MWRM/ Japanese Institute of Irrigation&Drainage
Workshop On Establishing A New Monitoring System 2001
National Environment Action Plan Report of the Workshop on the Management of the Tonle Sap Ecosystem 1996
NEDECO Natural Resources-Based Development Strategy For the Tonle Sap Area, Cambodia; Sectorial Studies
1998
NEDECO Natural Resource -Based Development Strategy for the Tole Sap Area,Cambodia 1998
Ngoc Phien Review of Previous Model Studies and Possible Base-Line Situations 1990 Nuding Fliesswiderstandsverhalten in Gerinnen mit Ufergebusch 1991
Öjendal The Mighty Mekong Mystery 1997 Opdam Strategy Development Plan for Tonle Sap Area: Some Issues 1997
Overseas Technical Cooperation Agency, Japan
Interim Report For the ReconnaissanceSurvey Of the Multi-Purposte Development Of the Area S-W Of the Great Lake In Cambodia
1968
Peng Seang Monitoring of Water Surface and Estimation of Water Volume of Tonle Sap Lake Using Satellite Imagery
1998
Press Numerical Recipes in C The Art of Scientific Computing 1996 Raper GIS Tutor The Quick Reference Guide 1993
Rasmussen Ground-Water Resources of Cambodia 1977
MRCS/WUP-FIN, Data Report
ANNEX 7. Literature lists
18
Romshoo Monitoring of Soil Erosion In Thailand and Using NOAA AVHRR Satellite Image and GIS
1997
Sluiter The Mekong Currency 1992 Sopharith Hydrological Studies of The Tonle Sap / Great Lake 1997
Sotha Management and Exchange of Geographic Information in Cambodia 2001 Swierczek Development St rategy, Integrated Development and Strategic Management 1996
TCU, UNESCO Strategy and Action Plan For the Protection of The Tonle Sap 1992 Thammongkol Status of the Lower Mekong Hydrologic Network 1995
The Fishery Office, Ratanakiri Province
Study of downstream Impacts of the Yali Falls Dam in the Se San River in Ratanakiri Province
2000
UNDP Natural Resource Based Development Strategy for the Tonle Sap Area 1997
UNDP Natural Resources Development Strategy for the Tonle Sap Region 1995 UNESCO/ United Nation Special Fund
Backwater Cure of the Stream Mekong River 1964
UNESCO/ United Nation Special Fund
Measurement Campaign 1965
UNESCO Rapport d'esemble sur les diff'erentes d'eterminations de la Capacit'e du Grand Lac 1966
UNESCO, United Nation Special Fund
Measurement Campaign 1964
UNESCO/ UN Operation of Final Model 1964
UNESCO/SOGREAH Flood Prediction in the Cambodia Delta 1962 UNESCO/UN Tide Model 1964
UNESCO/UN Adjustment of the Final Model 1964 United Nations Development of Water Resource in the Lower Mekong Basin 1957 United Nations Special Fund Mekong Delta Monograph 1962
Van Mierlo River Model 1991 Van Mierlo Delta Flood Model 1991
Wetzel Limnology Lake and River Ecosystems 2001 White ( Ed) River Flood Hydraulics 1994
Zalinge Management Aspects of Cambodia' s Freshwater Capture Fisheries 2000
MRCS/WUP-FIN, Data Report
Hydrology
32
HYDROLOGY
1 Hydrometeorology
1.1 General access to the historical weather records The runoff to surface and subsurface waters is centrally caused and affected by several hydro-meteorological factors, in the first place by the rainfall (precipitation P) and further by evapo(transpi)ration (E), air temperature (AT), relative humidity (RH), several components of solar radiation (S), and by the wind speeds (WS). Main emphasis in the available data has been in the rainfall, in harmony with its inducing importance to the water flows and amounts. The list of meteorological stations in Cambodia includes 177 locations of observations, 83 of these containing until now no recordings at all (ANNEX 2). The remaining 94 stations contain 943 years of observation records from 1920 to year 2000. These include (in Hymos data base) altogether 849 years of historical rainfall records (PH) from 91 stations, 85 years of evaporation studies (EH) at 22 stations, and 9 years of wind observations (WS) at 9 stations. Directly available at the moment were the results of an observation network of 49 meteorological stations. Each of them had recorded the rainfall, for 590 years altogether. Ten of them had records of evaporation at least for some periods, for 43 years altogether. Winds were recorded at five stations and additional data of air pressure, air temperature, relative humidity and irradiations at one station for 9 months in year 2000. The locations of the stations are seen in Fig.1 Main attention in the data was paid to the records of the last 51 years period, 1950 – 2000. This reduced the number of the recorded station-years of rainfall to 429 but did not affect at all to the evaporation and other types of meteorological data. Observations are strongly concentrated on the last 1 – 4 years 1997 – 2000 and around the years 1962 – 1963 when comprehensive sets of observation data have been recorded from up to 20 stations each year. Records of more than 10 stations are available also from the beginning of 1950’s (1952 – 53), end of 1960’s (1968 – 69) and the first half of 1990’s (1990 – 94). On the contrary, no observations are available from the years 1975 – 79. Annually the numbers of hydrological (water height or flow) and meteorological recording stations has varied as follows:
MRCS/WUP-FIN, Data Report
Hydrology
33
Year 50 51 52 53 54 55 56 57 58 59 60 61 62 63 64 65 66 67 68 69 70 71 72 73 74 Hydrology 2 2 2 2 2 2 2 2 2 2 5 5 13 13 5 10 6 7 9 9 7 5 5 4 3 Rainfall 4 6 10 11 7 7 7 3 5 4 10 16 20 20 19 9 3 3 11 12 5 3 4 3 2 Year 75 76 77 78 79 80 81 82 83 84 85 86 87 88 89 90 91 92 93 94 95 96 97 98 99 00 Hydrology 0 0 0 0 0 0 4 4 5 5 5 6 5 6 4 5 4 3 5 13 17 17 22 14 9 8 Rainfall 0 0 0 0 0 2 5 6 6 6 5 8 9 7 9 10 10 13 10 12 9 13 17 15 20 33
1.2 Main emphases in the analysis of historical weather records
Closest analyses were concentrated at stations of the longest unbroken (gapless) time-series and of the widest selection of the observed quantities, preferably also located at different sides of the Tonle Sap catchment area. Until the end of 1990’s the most continuous observations were available from the following stations with their average values (and numbers of non-empty recordings, in parenthesis): 130305 Battambang
1951 – 54, -56, 1958 – 73, 1981 – Oct.95 rainfall 3.3 mm/d (13 879) Jan.-Nov.1961, 1962 – 70, Apr.71 - 1973 evaporation 5.7 mm/d (4 623) Jan.-Nov.1961 wind speed 60 units (334) 120202 Pailin Aug.1960 – March 1974 rainfall 3.0 mm/d (5 631) 1968 – 71 evaporation 4.4 mm/d (1 014) 1969 wind speed 17 units (282) 120302 Pursat 1952 – 64, -73, 1981 – 2000 rainfall 3.3 mm/d (12 418) 120404 Kampong Thom 1953 – 56, -60, 1962 – 65, -69, 1981 – 2000 rainfall 3.4 mm/d (10 957) 130306 Siem Reap 1950 – 57, 1961 – 64 &
Jan.-Apr.1968, Aug.68 – 69, -74, -89 – 99 rainfall 3.7 mm/d (8 765) Jan-Apr.68, Aug.68 – 1969, Apr.-May 1974 evaporation 5.0 mm/d (699) 130501 Stung Treng 1968 – 69, 1986 – 87 & 1992, 1994 – 1997, 1999 – Oct.2000 rainfall 2.7 mm/d (3 958) Nov.60 – 61, Mar.62 – Jan.69, Mar.-Dec.69 evaporation 5.3 mm/d (3 134) Jan.1969, March – Dec. 1969 wind speed 28 units (337). In addition, for the years 1995 – 1999 there was a special collection of the rainfall records of Battambang , Kampong Cham, Kampong Thom, Siem Reap, Kratie (since 1996) and Pursat (since 1997). These were used to separate analyses and to complement the longer timeseries of observations. As further records of complementary data, copies of the original observation diaries of Siem Reap airport 1998 – 2000 with versatile set of recorded quantities were
MRCS/WUP-FIN, Data Report
Hydrology
34
utilized. The Cambodian rainfall records were further complemented with the corresponding records of seven stations in Thailand near the Cambodian border. The time-series of the stations at the Western border (130203 and 140101) were very short, 2 and 5 years only, whereas those behind the Northern border (140205, 140302, 150301, 150401 and 150404), at the catchment area of Tonle Sap, contained within the period of 1950 – 1998 records of 46, 46, 36.5, 46 and 44 years. Full areal coverage with spatial resolution of 0.25 degrE x 0.25 degrN was obtained with the daily and 6-hourly satellite rain data between the longitudes 70 – 110 degrE and latitudes 5 – 35 degrN from the beginning of March, 2000 to April 21, 2001.
1.3 Recorded precipitations The annual distribution of rainfall is most clear (e.g. Fig.2). As an average about 18% of annual precipitation is received in September. Each of the other 5 months from May to October contribute to the annual rainfall with 12 – 14 %. In April and November the rainfalls are half of that, 7 % of the annual sums in each of them, whereas from January to March altogether less than 5% of the annual rains are received. The areal distribution of rainfall, on its part, is much more unclear and more irregular than the monthly variations. As half-year sums (for periods of May – October and November – April) of the 51 year rain records (with common periods between the recordings of two stations about 8 – 30 years) the mutual correlations between different stations are quite weak. The correlation coefficients squared vary from 0.2 to 0.7 as their extremes, and most frequently between 0.35 and 0.5. The correlations between the annual values were even weaker, correlation coefficients squared from 0 to 0.2 only. As the annual (or in practice summertime) sums of the rainfalls, however, some differences in the records between certain stations were repeated to some extent. Incoherently depending on the stations and their possible periods of comparisons the most frequent values of annual rainfall compared to the average of data available varied roughly as follows: Stung Treng 15 % above the average Kratie 30 % above the average Kampong Cham 15 % above the average Kampong Chhnang 30 % above the average Kampong Thom around the average Siem Reap around the average (or 5 % below) Pursat 5 % below the average Battambang 10 % below the average Pailin 10 % above the average. The sum of the deviations is not zero since there are usually more observations from the dryer than from the most rainy stations. When weighted by the number of observation years the sum of decreases and increases will closer cancel each other. As a more direct example of the variation of the proportion of the local rains to the average of several stations the values of Kampong Thom, Pursat and Battambang 1981 – 2000 are shown in Fig.3 As an average of a variable number of observation stations the variations of annual rainfall in the last 51 years are shown in Fig. 4. Between 1950 and 2000 the range of annual rainfall has varied from 1000 mm/a in 1954 to almost 1900 mm/a in 1966.
MRCS/WUP-FIN, Data Report
Hydrology
35
Between 1980 and 2000 the variation has been a little less, from 1200 mm/a in 1993 to almost 1800 mm/a in 1996. The mean value of annual station-averages has been 1370 mm/a for the whole period of 1950 – 2000 and 1425 mm/a for 1980 – 2000. In the time-series of the five stations containing the largest number of rainfall records, viz. Kampong Thom 30 years, Pursat 29 years, Kampong Chhnang 27 years, Battambang 38 years and Siem Reap 26 years, there are only six years common for all these stations in the period of 1950 – 2000, viz. the years 1991, 1994 and 1996 – 99. In 14 years rainfall records of variable combinations of four stations are available, in ten years three stations, in 6 years two stations, in 8 years one station and 7 years no stations. The occurrence of common years is illustrated in Fig.5 and more closely specified in Table 1 Table 1. Coincidences of the useful records in the longest time-series of precipitation
Years of recordings
altogether (useful) 30 (27) 34 (29) 27 (20) 38 (34) 26 (25) Station name Kg.Thom Pursat Kg.Chhnang Battambang Seam Reap nr. of Station nr.
120404 120302 120401 130305 130306 useful
Year stations
1950 --- --- --- --- OK 1 1951 --- --- --- Jan-Aug=0 OK 1 1952 --- Jan-Jun=0 Jan-Jul=0 OK OK 2 1953 only Nov >0 Jul-Dec=0 OK OK (Oct=0) 3 1954 (Jan,Oct=0) only May >0 --- OK OK 3 1955 OK Jan-Aug=0 --- OK OK 3 1956 OK OK --- OK OK 4 1957 --- OK --- --- OK 2 1958 --- Jul=0 --- OK --- 2 1959 --- OK --- --- --- 1 1960 Jan-Jul=0 OK --- OK --- 2 1961 --- OK Jan-Aug=0 OK OK 3 1962 Jun,Jul=0 Jun=0 OK OK OK 3 1963 OK OK --- OK OK 4 1964 OK --- OK OK OK 4 1965 OK --- OK OK --- 3 1966 --- --- ? OK --- 2 1967 --- --- --- OK --- 1 1968 --- --- OK OK --- 2 1969 (only Jun-
Sep) --- OK OK OK 4
1970 --- --- --- OK --- 1 1971 --- --- --- Jan-Jun=0 --- 1 1972 --- --- --- Jun=0 --- 1 1973 --- Mar-Jun=0 --- (Apr=0) --- 1 1974 --- --- --- --- --- 0 1975 --- --- --- --- --- 0 1976 --- --- --- --- --- 0 1977 --- --- --- --- --- 0 1978 --- --- --- --- --- 0 1979 --- --- --- --- --- 0 1980 --- --- --- --- --- 0 1981 OK OK --- OK --- 3 1982 OK OK OK OK --- 4 1983 OK OK OK (May-Apr=0) --- 4 1984 OK OK (Mar=0) OK --- 4
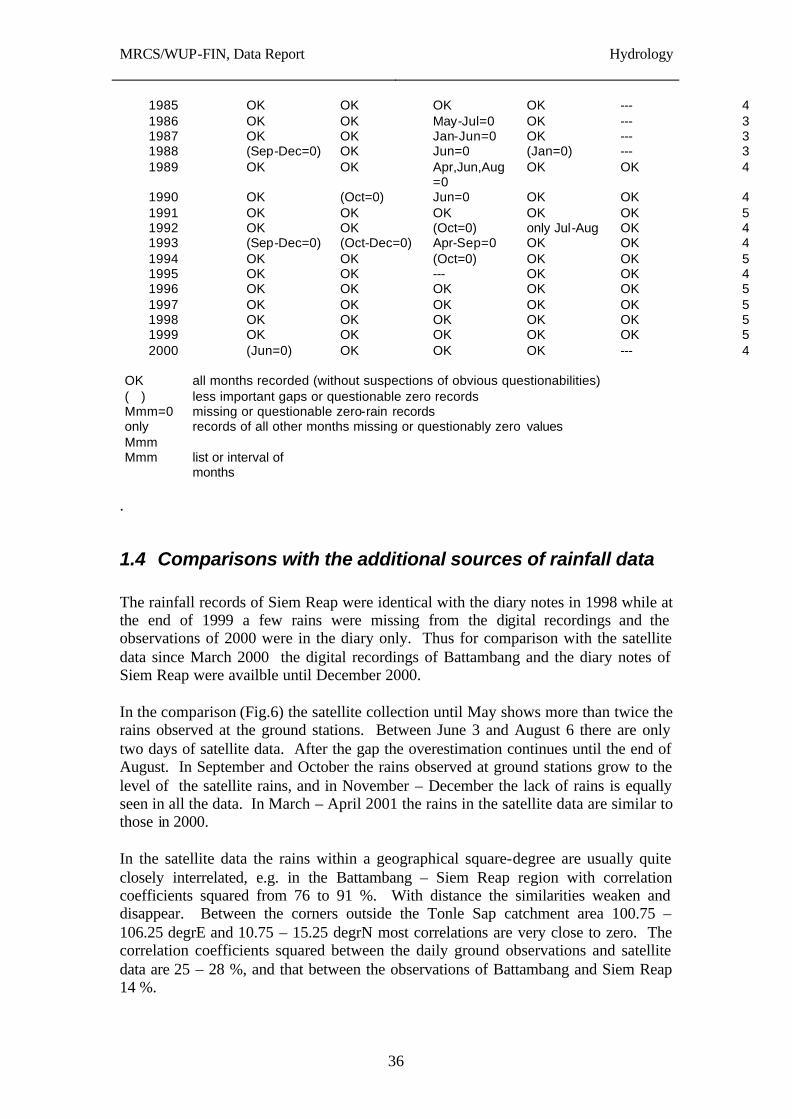
MRCS/WUP-FIN, Data Report
Hydrology
36
1985 OK OK OK OK --- 4 1986 OK OK May-Jul=0 OK --- 3 1987 OK OK Jan-Jun=0 OK --- 3 1988 (Sep-Dec=0) OK Jun=0 (Jan=0) --- 3 1989 OK OK Apr,Jun,Aug
=0 OK OK 4
1990 OK (Oct=0) Jun=0 OK OK 4 1991 OK OK OK OK OK 5 1992 OK OK (Oct=0) only Jul-Aug OK 4 1993 (Sep-Dec=0) (Oct-Dec=0) Apr-Sep=0 OK OK 4 1994 OK OK (Oct=0) OK OK 5 1995 OK OK --- OK OK 4 1996 OK OK OK OK OK 5 1997 OK OK OK OK OK 5 1998 OK OK OK OK OK 5 1999 OK OK OK OK OK 5 2000 (Jun=0) OK OK OK --- 4
OK all months recorded (without suspections of obvious questionabilities) ( ) less important gaps or questionable zero records Mmm=0 missing or questionable zero-rain records only Mmm
records of all other months missing or questionably zero values
Mmm list or interval of months
.
1.4 Comparisons with the additional sources of rainfall data The rainfall records of Siem Reap were identical with the diary notes in 1998 while at the end of 1999 a few rains were missing from the digital recordings and the observations of 2000 were in the diary only. Thus for comparison with the satellite data since March 2000 the digital recordings of Battambang and the diary notes of Siem Reap were availble until December 2000. In the comparison (Fig.6) the satellite collection until May shows more than twice the rains observed at the ground stations. Between June 3 and August 6 there are only two days of satellite data. After the gap the overestimation continues until the end of August. In September and October the rains observed at ground stations grow to the level of the satellite rains, and in November – December the lack of rains is equally seen in all the data. In March – April 2001 the rains in the satellite data are similar to those in 2000. In the satellite data the rains within a geographical square-degree are usually quite closely interrelated, e.g. in the Battambang – Siem Reap region with correlation coefficients squared from 76 to 91 %. With distance the similarities weaken and disappear. Between the corners outside the Tonle Sap catchment area 100.75 – 106.25 degrE and 10.75 – 15.25 degrN most correlations are very close to zero. The correlation coefficients squared between the daily ground observations and satellite data are 25 – 28 %, and that between the observations of Battambang and Siem Reap 14 %.
MRCS/WUP-FIN, Data Report
Hydrology
37
1.5 Measured evaporations The historical time-series of evaporation are much shorter than those of precipitation. In the data received until now only Battambang and Stung Treng have evaporation records from about 10 years, Siem Reap and Pailin from 3 years and the others hardly for a full year, e.g. MRC403 for 9 months. The variation of evaporation between different months is as regular as but much smaller than the variation of rainfall as shown in Fig.7. In March and April almost 11 % of the annual evaporation takes place, in February 10% and in May 9%. The evaporation in January, June and July is close to the annual average, about 8% of the annual sum and from August to December in each of the 5 months about 7% of the sum. The variations of evaporation at four places for their common years 1968 - 69 are compared with each other in Fig.8. The mutual correlations between the evaporations at different stations are of the same order of magnitude than those of the precipitations. For smaller variations this means smaller differences. The correlation coefficients squared vary from 0.25 to 0.7, most frequently between 0.4 and 0.5. When corrected with the average weights of the months recorded, the following values were received for the annual evaporations: Battambang 1961 – 1973 2070 mm/a Siem Reap 1968 – 1969, 1974 1760 mm/a Stung Treng 1960 – 1967, 1969 1940 mm/a Pailin 1968 – 1971 1620 mm/a MRC403 2000 1430 mm/a. The variations of evaporation between years have been smaller than those of rainfall. In the longest time-series of Battambang the range of annual evaporation has varied from 1910 mm/a in 1970 to almost 2290 mm/a in 1973.
1.6 Other weather records Records of weather variables other than precipitation and evaporation are very few and short, only examples for the beginning, the longest ones for not more than one year. Wind speed records from Battambang Jan.- Nov.1961, Pailin Jan.- May & August – December 1969 and Stung Treng Jan. & April – December 1969 give information about the annual variation of the daily wind speeds relative to their average. Together with the records at MRC403 in 2000, these ranges have varied as follows: Battambang 1961 0.002 - 3.16 Pailin 1969 0.01 - 4.70 Stung Treng 1969 0.10 - 3.56 MRC403 2000 0.025 - 2.03. In addition to the relative variation, the wind speed averege at MRC403 is measured to be 1.7 m/s and the extremes of daily wind speed 0.04 and 3.45 m/s.
MRCS/WUP-FIN, Data Report
Hydrology
38
In all stations the winds are fastest from February to April, as monthly averages 1.2 – 1.4 times the annual average. On the other side, the slowest monthly mean winds in October are 55 % of the average, in September 75 % and in November 90 %, respectively. The mutual correlation between the wind velocities at Pailin and Stung Treng in 1969 was similar to the corresponding comparisons of rainfall and evaporation, with correlation coefficient squared about 38 %. Records of wind directions are ava ilable from the 9 months of MRC403 in 2000. In the spring, in April and May the wind has been quite steadily from South, thereafter from June to September from South-West, in October predominantly from West, and finally in November and December from East. The variations in wind direction start to increase towards the end of the year, starting from September, along with the decrease of wind speeds. As the daily values air temperatures (AT) vary from 23.6 to 30.9 degrees Centigrade with an average at 28.0 °C, decreasing from April to October and thereafter slightly warming again (as monthly means from 28.94 in April to 27.08 °C in October and 27.21°C in December). The ranges of irradiation (SR and SW) are 3.18 – 25.43 and 0.59 – 1.19 with averages of 17.29 and 0.76, respectively. Their monthly means vary from 20.73 and 0.91 in April to 13.93 (and 0.78) in October and (16.11 and) 0.68 in December, much in line with the changes of air temperature (as a reason to temperature variations). The values of relative humidity (RH) are quite steadily around their average at 80 % although occasional daily extremes vary from 66 to 97 %. As monthly averages the extremes have been 86.4 % in October and 74.2 % in December. Even much smaller are the changes of daily air pressure (AP) between 1001 and 1012 mbar with an average of 1007 mbar and the range monthly averages from 1005.7 in July to 1009.3 in December. On the contrary to them, the variations of DS are quite substantial, between 0 and 9.97 with an average of 5.98 and the extremes of monthly averages 7.48 in April (7.38 in November) and 4.74 in October (5.07 in July).
1.7 Mutual correlations As can be expected from the comparison of the long-term and all-stations averages of evaporation and rainfall (Fig.7), and even more by theoretical reasoning, there is a negative correlation between the evaporation and rainfall. The correlation coefficients squared between the monthly averages of rainfall and evaporation at Siem Reap, Stung Treng and Pailin varied from 25 – 30 %. In the longest time-series at Battambang the agreement was more scattered and the correlation coefficient squared at the level of 7.5 %. Although statistically not very significant, quite coherent values for the evaporation corresponding to zero rain were received whereas the regression slope varied between the places: Siem Reap EH = 172 mm/mo – 0.128*PH Stung Treng EH = 173 mm/mo – 0.076*PH Pailin EH = 155 mm/mo – 0.165*PH
MRCS/WUP-FIN, Data Report
Hydrology
39
Battambang EH = 182 mm/mo – 0.086*PH. A positive correlation between wind speed and evaporation was quite clear. The correlation coefficients squared between the monthly averages for Stung Treng, Pailin and Battambang in 1960 - 70’ies were 42, 69 and 59 %, respectively. Evaporations corresponding to zero wind were 108, 61 and 78 mm/mo (and the slopes 1.64, 4.01 and 1.62 mm/mo/the wind velocity unit). The correlations between precipitation, evaporation and wind speed result further in weak and incoherent negative dependence between the wind speed and rainfall, with correlation coefficient squared for the three stations 41, 8 and 0.04 %, respectively. In the 9 months’ data of MRC403 from April to December 2000 as daily values the strongest dependence is between DS and the solar radiation SR. Their positive correlation coefficient squared (R2) is as high as 82 % of full similarity. Other relations with R2 slightly more than 50 % are the positive dependences between evaporation and SR and DS closely related above and a negative correlation between the evaporation and relative humidity. Air temperature is positively correlated with solar radiation (as a reason) and evaporation (as a consequence) with R2 = 47 and 30 %, respectively. Furthermore, these mutual dependences appear as negative correlations with R2 = 40 and 33 % between the relative humidity and SR and DS. Outside the mutual dependences between SR, DS, air temperature, evaporation and relative humidity the next highest values of R2 = 29 and 25 % belong to the negative correlations of air pressure against the wind components from South and West. As daily data the mutual correlations between precipitation, evaporation and wind speed are weaker than at the stations of longer time-series, viz. R2 = 16 and 5 % (and 4 % between rainfall and wind speed) with regression dependences at MRC403 in 2000 as follows: EH = 121 mm/mo – 0.046*PH and EH = 83 mm/mo + 17.72*WS mm/(mo*m/s).
2 Hydrology
2.1 General access to the historical flow and water level records
The main factors for hydrological information recorded at the hydrological stations are water level (HH) and water flow (or discharge, QH). These are coupled with each other through a rating curve by means of which the usually longer time-series of water level can be approximately converted into water flows. The list of hydrological stations in Cambodia (ANNEX 3) contains 69 stations. In 60 of them the water level records as a sum from the 91 years 1910 – 2000 amount to 590 years altogether. In 35 stations the water flow has reported recorded for 172 years, the precipitation (PH) in four stations for 31 years while nine of the listed
MRCS/WUP-FIN, Data Report
Hydrology
40
stations are without records until now. From the 60 stations there are thus listed 99 time-series with a total length of 793 years. Directly available at the moment were the results of 31 hydrological stations from the last 51 years 1950 – 2000. In addition, two of the stations of combined records of flow, water level and precipitation belonged to the network of the 49 meteorological stations at hands. In these 33 stations the water levels were recorded for 293 years altogether, for 1 – 37 years/station. The water flows, for their part, were recorded at 20 stations for 1 – 15 years each and for 62 years altogether.
2.2 Emphases in the analysis of historical flow records The stations containing water flow records are collected in Table 2 with a brief summary of the length of their time-series, the average and maximum values of records and a specification of the period where their data is from. The list reveals mainly four periods of more intensive measurement of water flow, viz. April 1962 – March 1963 including records from Chruy Changvar 019801 Prek Dam 020102 Mongkol Borey 520101 Sisophon 530101 Kralanh 540101 Battambang 550102 Kampong Kdei 570101 Pursat 580101 Kampong Chen 600101 Kampong Thom 610101 and Kampong Thmar 620101; Year 1965 with flow records from Chruy Changvar 019801 Kampong Cham 019802 Treng 550101 Sre Ponleu 550103 Taing Louch 580102 Kampong Thom 610101 and Kampong Putrea 610102; April 1968 – March 1970 with data from Chruy Changvar 019801 Kampong Cham 019802 Prek Dam 020102 Treng 550101 Kampong Thom 610101 (until Dec.11, 1969) Taing Louch 580102 and (until Dec.31, 1969) Kampong Putrea 610102; April 1994 – February 1997 with data from Prey Klong 580301
MRCS/WUP-FIN, Data Report
Hydrology
41
Banteau Krang 583101 and
(since May 1995) Khum Viel 580104. Other periods of flow recordings, partly overlapping with each other and with those above are January 1960 – March 1974 Chruy Changvar 019801 January 1964 – March 1974 Kampong Cham 019802 Year 1990 Phnom Penh Port 020101 and January – October 1997 Chruy Changvar 019801. Among the three most comprehensive observation periods (four year cycles) in 1960’ies there are only two stations present in all of them, viz. Chruy Changvar and Kampong Thom. Four have been included in the two last of them, viz. Kampong Cham, Treng and for most part Taing Loung and Kampong Putrea, and one, Prek Dam in the first and the third one wheras 9 other stations have flow records only for one year. On the other hand, the length of water level recordings directed attention to the stations 019802 Kampong Cham 12285 days from 36 years 1960 – 1974, 1980 – 2000 019802 Chruy Changvar 10834 days from 31 years 1960 – 74, 83 – 91, 94 – 2000 020102 Prek Dam 9052 days from 27 years 1960 – 1973, 1986 – 1998 610101 Kampong Thom 7670 days from 24 years 62 – 63, 65, 68 – 70, 81 – 98 020101 Phnom Penh Port 6204 days from 18 years 1966 – 1974, 1993 – 2000 550102 Battambang 4058 days from 14 years 62 – 63, 81 – 88, 97 – 2000. The first comparisons were started with the records of these six stations. In addition, two other stations had water level records of comparable length, from 37 years in 020103 Kampong Chhnang and from 20 years in 020106 Kampong Loung, but no flow data included in their records. Furthermore, the daily records were completed with the monthly discharges of the Tonle Sap river at Prek Dam 1960 – 1973 printed in the Hydrological Studies of the Tonle Sap/ Great Lake Area by Tes Sopharith, November 1997. The completed monthly discharges of 13 tributaries of Tonle Sap and the lake calculated and collected in the same report for the entire period of 35 years from 1962 to 1996 were used for further comparison of the tributary discharges which included in the daily records listed above. The upsteam records of flow and water levels at 014901 Kratie (QH 7565 days in 21 years 1950 – 70; HH 12271 days in 31 years 1950 – 56, 58 – 71, 80 – 89 & 90 - 96) and 014501 Stung Treng (QH 8543 days in 25 years 1950 – 70, 1990 & 1991 – 93; HH 5590 days in 17 years 1960 – 70, 1990 & 1991 – 95) were used as further background information.
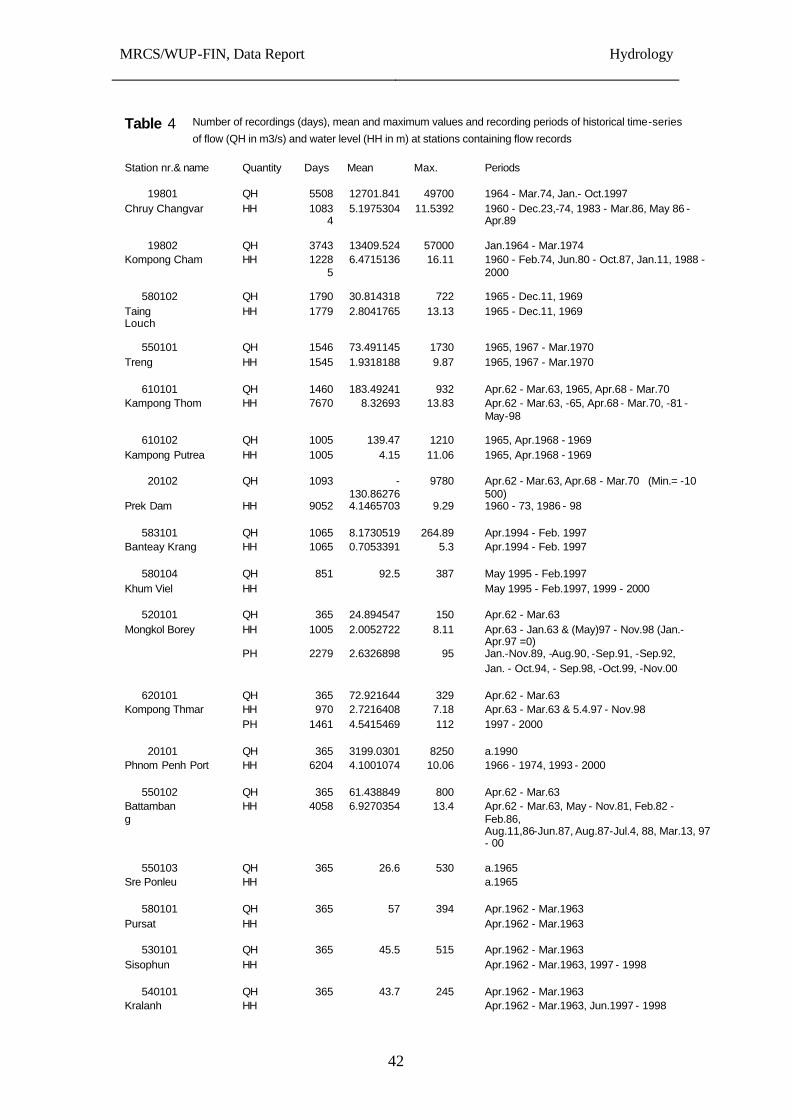
MRCS/WUP-FIN, Data Report
Hydrology
42
Table 4 Number of recordings (days), mean and maximum values and recording periods of historical time-series
of flow (QH in m3/s) and water level (HH in m) at stations containing flow records
Station nr.& name Quantity Days Mean Max. Periods
19801 QH 5508 12701.841 49700 1964 - Mar.74, Jan.- Oct.1997 Chruy Changvar HH 1083
4 5.1975304 11.5392 1960 - Dec.23,-74, 1983 - Mar.86, May 86 -
Apr.89
19802 QH 3743 13409.524 57000 Jan.1964 - Mar.1974 Kompong Cham HH 1228
5 6.4715136 16.11 1960 - Feb.74, Jun.80 - Oct.87, Jan.11, 1988 -
2000
580102 QH 1790 30.814318 722 1965 - Dec.11, 1969 Taing Louch
HH 1779 2.8041765 13.13 1965 - Dec.11, 1969
550101 QH 1546 73.491145 1730 1965, 1967 - Mar.1970
Treng HH 1545 1.9318188 9.87 1965, 1967 - Mar.1970
610101 QH 1460 183.49241 932 Apr.62 - Mar.63, 1965, Apr.68 - Mar.70 Kampong Thom HH 7670 8.32693 13.83 Apr.62 - Mar.63, -65, Apr.68 - Mar.70, -81 -
May-98
610102 QH 1005 139.47 1210 1965, Apr.1968 - 1969 Kampong Putrea HH 1005 4.15 11.06 1965, Apr.1968 - 1969
20102 QH 1093 -
130.86276 9780 Apr.62 - Mar.63, Apr.68 - Mar.70 (Min.= -10
500) Prek Dam HH 9052 4.1465703 9.29 1960 - 73, 1986 - 98
583101 QH 1065 8.1730519 264.89 Apr.1994 - Feb. 1997
Banteay Krang HH 1065 0.7053391 5.3 Apr.1994 - Feb. 1997
580104 QH 851 92.5 387 May 1995 - Feb.1997 Khum Viel HH May 1995 - Feb.1997, 1999 - 2000
520101 QH 365 24.894547 150 Apr.62 - Mar.63
Mongkol Borey HH 1005 2.0052722 8.11 Apr.63 - Jan.63 & (May)97 - Nov.98 (Jan.-Apr.97 =0)
PH 2279 2.6326898 95 Jan.-Nov.89, -Aug.90, -Sep.91, -Sep.92, Jan. - Oct.94, - Sep.98, -Oct.99, -Nov.00
620101 QH 365 72.921644 329 Apr.62 - Mar.63 Kompong Thmar HH 970 2.7216408 7.18 Apr.63 - Mar.63 & 5.4.97 - Nov.98
PH 1461 4.5415469 112 1997 - 2000
20101 QH 365 3199.0301 8250 a.1990 Phnom Penh Port HH 6204 4.1001074 10.06 1966 - 1974, 1993 - 2000
550102 QH 365 61.438849 800 Apr.62 - Mar.63
Battambang
HH 4058 6.9270354 13.4 Apr.62 - Mar.63, May - Nov.81, Feb.82 - Feb.86,
Aug.11,86-Jun.87, Aug.87-Jul.4, 88, Mar.13, 97 - 00
550103 QH 365 26.6 530 a.1965
Sre Ponleu HH a.1965
580101 QH 365 57 394 Apr.1962 - Mar.1963 Pursat HH Apr.1962 - Mar.1963
530101 QH 365 45.5 515 Apr.1962 - Mar.1963
Sisophun HH Apr.1962 - Mar.1963, 1997 - 1998
540101 QH 365 43.7 245 Apr.1962 - Mar.1963 Kralanh HH Apr.1962 - Mar.1963, Jun.1997 - 1998
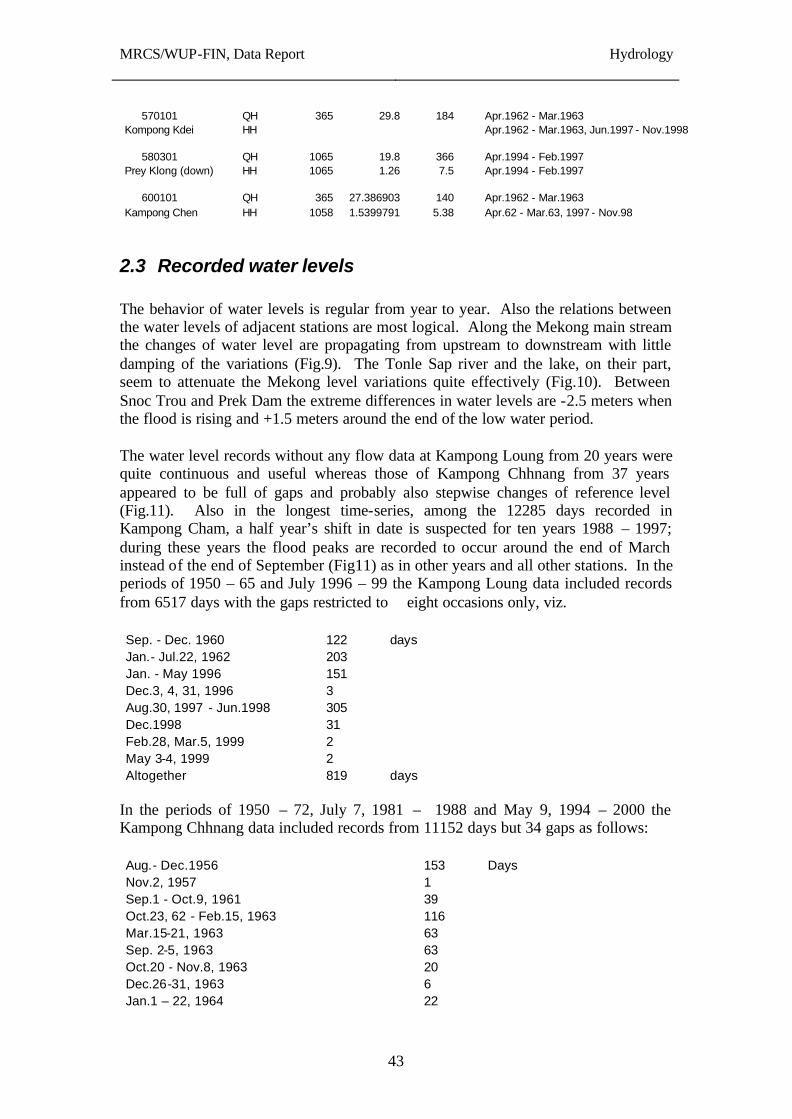
MRCS/WUP-FIN, Data Report
Hydrology
43
570101 QH 365 29.8 184 Apr.1962 - Mar.1963
Kompong Kdei HH Apr.1962 - Mar.1963, Jun.1997 - Nov.1998
580301 QH 1065 19.8 366 Apr.1994 - Feb.1997 Prey Klong (down) HH 1065 1.26 7.5 Apr.1994 - Feb.1997
600101 QH 365 27.386903 140 Apr.1962 - Mar.1963
Kampong Chen HH 1058 1.5399791 5.38 Apr.62 - Mar.63, 1997 - Nov.98
2.3 Recorded water levels The behavior of water levels is regular from year to year. Also the relations between the water levels of adjacent stations are most logical. Along the Mekong main stream the changes of water level are propagating from upstream to downstream with little damping of the variations (Fig.9). The Tonle Sap river and the lake, on their part, seem to attenuate the Mekong level variations quite effectively (Fig.10). Between Snoc Trou and Prek Dam the extreme differences in water levels are -2.5 meters when the flood is rising and +1.5 meters around the end of the low water period. The water level records without any flow data at Kampong Loung from 20 years were quite continuous and useful whereas those of Kampong Chhnang from 37 years appeared to be full of gaps and probably also stepwise changes of reference level (Fig.11). Also in the longest time-series, among the 12285 days recorded in Kampong Cham, a half year’s shift in date is suspected for ten years 1988 – 1997; during these years the flood peaks are recorded to occur around the end of March instead of the end of September (Fig11) as in other years and all other stations. In the periods of 1950 – 65 and July 1996 – 99 the Kampong Loung data included records from 6517 days with the gaps restricted to eight occasions only, viz. Sep. - Dec. 1960 122 days Jan.- Jul.22, 1962 203 Jan. - May 1996 151 Dec.3, 4, 31, 1996 3 Aug.30, 1997 - Jun.1998 305 Dec.1998 31 Feb.28, Mar.5, 1999 2 May 3-4, 1999 2 Altogether 819 days
In the periods of 1950 – 72, July 7, 1981 – 1988 and May 9, 1994 – 2000 the Kampong Chhnang data included records from 11152 days but 34 gaps as follows: Aug.- Dec.1956 153 Days Nov.2, 1957 1 Sep.1 - Oct.9, 1961 39 Oct.23, 62 - Feb.15, 1963 116 Mar.15-21, 1963 63 Sep. 2-5, 1963 63 Oct.20 - Nov.8, 1963 20 Dec.26-31, 1963 6 Jan.1 – 22, 1964 22
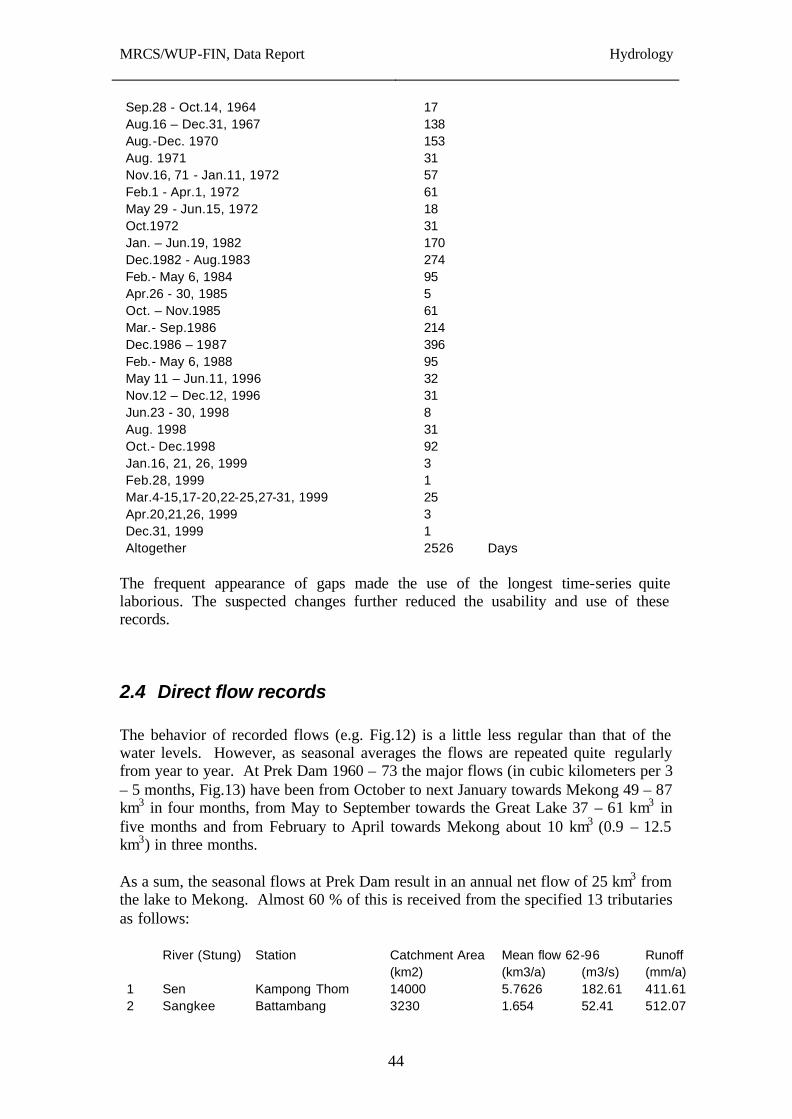
MRCS/WUP-FIN, Data Report
Hydrology
44
Sep.28 - Oct.14, 1964 17 Aug.16 – Dec.31, 1967 138 Aug.-Dec. 1970 153 Aug. 1971 31 Nov.16, 71 - Jan.11, 1972 57 Feb.1 - Apr.1, 1972 61 May 29 - Jun.15, 1972 18 Oct.1972 31 Jan. – Jun.19, 1982 170 Dec.1982 - Aug.1983 274 Feb.- May 6, 1984 95 Apr.26 - 30, 1985 5 Oct. – Nov.1985 61 Mar.- Sep.1986 214 Dec.1986 – 1987 396 Feb.- May 6, 1988 95 May 11 – Jun.11, 1996 32 Nov.12 – Dec.12, 1996 31 Jun.23 - 30, 1998 8 Aug. 1998 31 Oct.- Dec.1998 92 Jan.16, 21, 26, 1999 3 Feb.28, 1999 1 Mar.4-15,17-20,22-25,27-31, 1999 25 Apr.20,21,26, 1999 3 Dec.31, 1999 1 Altogether 2526 Days
The frequent appearance of gaps made the use of the longest time-series quite laborious. The suspected changes further reduced the usability and use of these records.
2.4 Direct flow records The behavior of recorded flows (e.g. Fig.12) is a little less regular than that of the water levels. However, as seasonal averages the flows are repeated quite regularly from year to year. At Prek Dam 1960 – 73 the major flows (in cubic kilometers per 3 – 5 months, Fig.13) have been from October to next January towards Mekong 49 – 87 km3 in four months, from May to September towards the Great Lake 37 – 61 km3 in five months and from February to April towards Mekong about 10 km3 (0.9 – 12.5 km3) in three months. As a sum, the seasonal flows at Prek Dam result in an annual net flow of 25 km3 from the lake to Mekong. Almost 60 % of this is received from the specified 13 tributaries as follows: River (Stung) Station Catchment Area Mean flow 62-96 Runoff (km2) (km3/a) (m3/s) (mm/a) 1 Sen Kampong Thom 14000 5.7626 182.61 411.61 2 Sangkee Battambang 3230 1.654 52.41 512.07
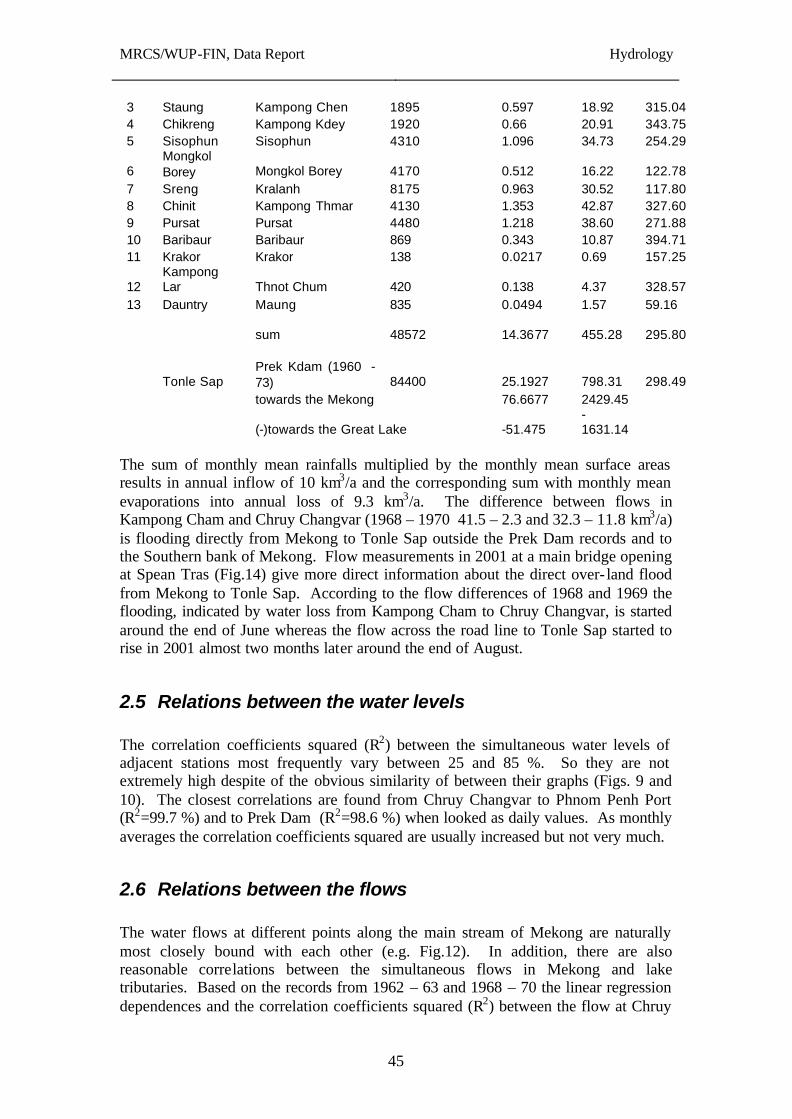
MRCS/WUP-FIN, Data Report
Hydrology
45
3 Staung Kampong Chen 1895 0.597 18.92 315.04 4 Chikreng Kampong Kdey 1920 0.66 20.91 343.75 5 Sisophun Sisophun 4310 1.096 34.73 254.29
6 Mongkol Borey Mongkol Borey 4170 0.512 16.22 122.78
7 Sreng Kralanh 8175 0.963 30.52 117.80 8 Chinit Kampong Thmar 4130 1.353 42.87 327.60 9 Pursat Pursat 4480 1.218 38.60 271.88 10 Baribaur Baribaur 869 0.343 10.87 394.71 11 Krakor Krakor 138 0.0217 0.69 157.25
12 Kampong Lar Thnot Chum 420 0.138 4.37 328.57
13 Dauntry Maung 835 0.0494 1.57 59.16
sum 48572 14.3677 455.28 295.80
Tonle Sap Prek Kdam (1960 - 73) 84400 25.1927 798.31 298.49
towards the Mekong 76.6677 2429.45
(-)towards the Great Lake -51.475 -1631.14
The sum of monthly mean rainfalls multiplied by the monthly mean surface areas results in annual inflow of 10 km3/a and the corresponding sum with monthly mean evaporations into annual loss of 9.3 km3/a. The difference between flows in Kampong Cham and Chruy Changvar (1968 – 1970 41.5 – 2.3 and 32.3 – 11.8 km3/a) is flooding directly from Mekong to Tonle Sap outside the Prek Dam records and to the Southern bank of Mekong. Flow measurements in 2001 at a main bridge opening at Spean Tras (Fig.14) give more direct information about the direct over- land flood from Mekong to Tonle Sap. According to the flow differences of 1968 and 1969 the flooding, indicated by water loss from Kampong Cham to Chruy Changvar, is started around the end of June whereas the flow across the road line to Tonle Sap started to rise in 2001 almost two months later around the end of August.
2.5 Relations between the water levels The correlation coefficients squared (R2) between the simultaneous water levels of adjacent stations most frequently vary between 25 and 85 %. So they are not extremely high despite of the obvious similarity of between their graphs (Figs. 9 and 10). The closest correlations are found from Chruy Changvar to Phnom Penh Port (R2=99.7 %) and to Prek Dam (R2=98.6 %) when looked as daily values. As monthly averages the correlation coefficients squared are usually increased but not very much.
2.6 Relations between the flows The water flows at different points along the main stream of Mekong are naturally most closely bound with each other (e.g. Fig.12). In addition, there are also reasonable correlations between the simultaneous flows in Mekong and lake tributaries. Based on the records from 1962 – 63 and 1968 – 70 the linear regression dependences and the correlation coefficients squared (R2) between the flow at Chruy
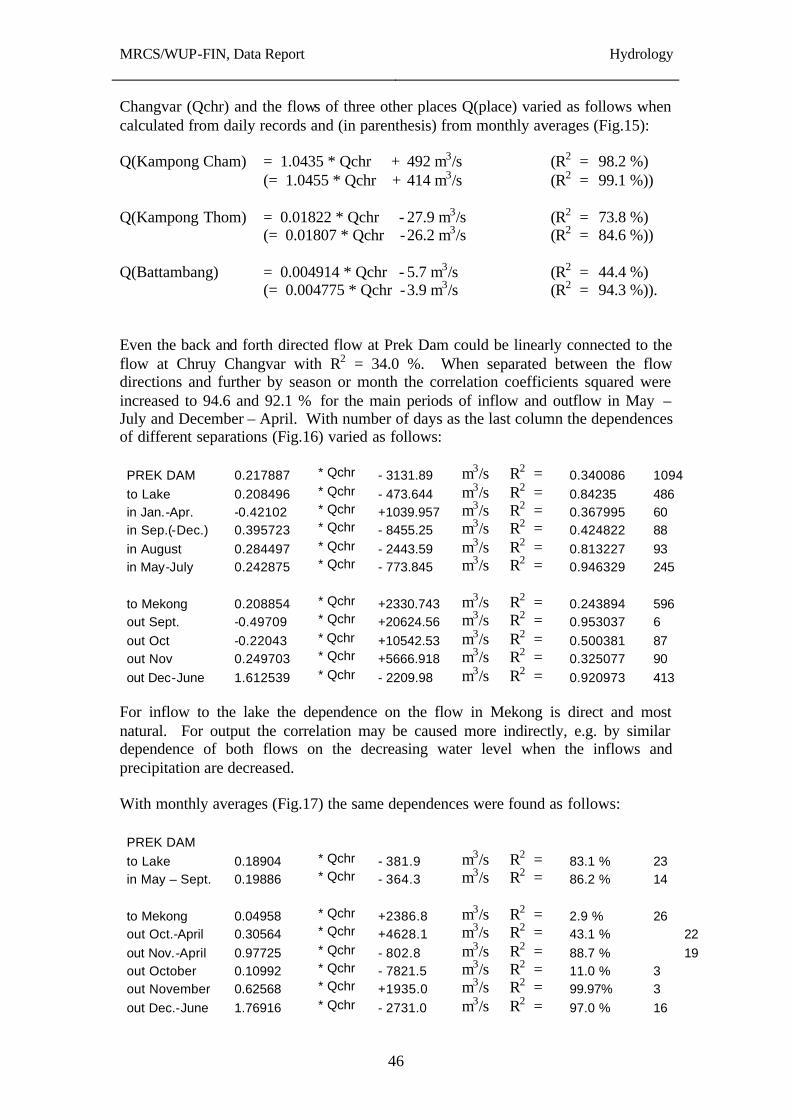
MRCS/WUP-FIN, Data Report
Hydrology
46
Changvar (Qchr) and the flows of three other places Q(place) varied as follows when calculated from daily records and (in parenthesis) from monthly averages (Fig.15): Q(Kampong Cham) = 1.0435 * Qchr + 492 m3/s (R2 = 98.2 %) (= 1.0455 * Qchr + 414 m3/s (R2 = 99.1 %)) Q(Kampong Thom) = 0.01822 * Qchr - 27.9 m3/s (R2 = 73.8 %) (= 0.01807 * Qchr -26.2 m3/s (R2 = 84.6 %)) Q(Battambang) = 0.004914 * Qchr - 5.7 m3/s (R2 = 44.4 %) (= 0.004775 * Qchr -3.9 m3/s (R2 = 94.3 %)). Even the back and forth directed flow at Prek Dam could be linearly connected to the flow at Chruy Changvar with R2 = 34.0 %. When separated between the flow directions and further by season or month the correlation coefficients squared were increased to 94.6 and 92.1 % for the main periods of inflow and outflow in May – July and December – April. With number of days as the last column the dependences of different separations (Fig.16) varied as follows: PREK DAM 0.217887 * Qchr - 3131.89 m3/s R2 = 0.340086 1094 to Lake 0.208496 * Qchr - 473.644 m3/s R2 = 0.84235 486 in Jan.-Apr. -0.42102 * Qchr +1039.957 m3/s R2 = 0.367995 60 in Sep.(-Dec.) 0.395723 * Qchr - 8455.25 m3/s R2 = 0.424822 88 in August 0.284497 * Qchr - 2443.59 m3/s R2 = 0.813227 93 in May-July 0.242875 * Qchr - 773.845 m3/s R2 = 0.946329 245 to Mekong 0.208854 * Qchr +2330.743 m3/s R2 = 0.243894 596 out Sept. -0.49709 * Qchr +20624.56 m3/s R2 = 0.953037 6 out Oct -0.22043 * Qchr +10542.53 m3/s R2 = 0.500381 87 out Nov 0.249703 * Qchr +5666.918 m3/s R2 = 0.325077 90 out Dec-June 1.612539 * Qchr - 2209.98 m3/s R2 = 0.920973 413
For inflow to the lake the dependence on the flow in Mekong is direct and most natural. For output the correlation may be caused more indirectly, e.g. by similar dependence of both flows on the decreasing water level when the inflows and precipitation are decreased. With monthly averages (Fig.17) the same dependences were found as follows: PREK DAM to Lake 0.18904 * Qchr - 381.9 m3/s R2 = 83.1 % 23 in May – Sept. 0.19886 * Qchr - 364.3 m3/s R2 = 86.2 % 14 to Mekong 0.04958 * Qchr +2386.8 m3/s R2 = 2.9 % 26 out Oct.-April 0.30564 * Qchr +4628.1 m3/s R2 = 43.1 % 22 out Nov.-April 0.97725 * Qchr - 802.8 m3/s R2 = 88.7 % 19 out October 0.10992 * Qchr - 7821.5 m3/s R2 = 11.0 % 3 out November 0.62568 * Qchr +1935.0 m3/s R2 = 99.97% 3 out Dec.-June 1.76916 * Qchr - 2731.0 m3/s R2 = 97.0 % 16
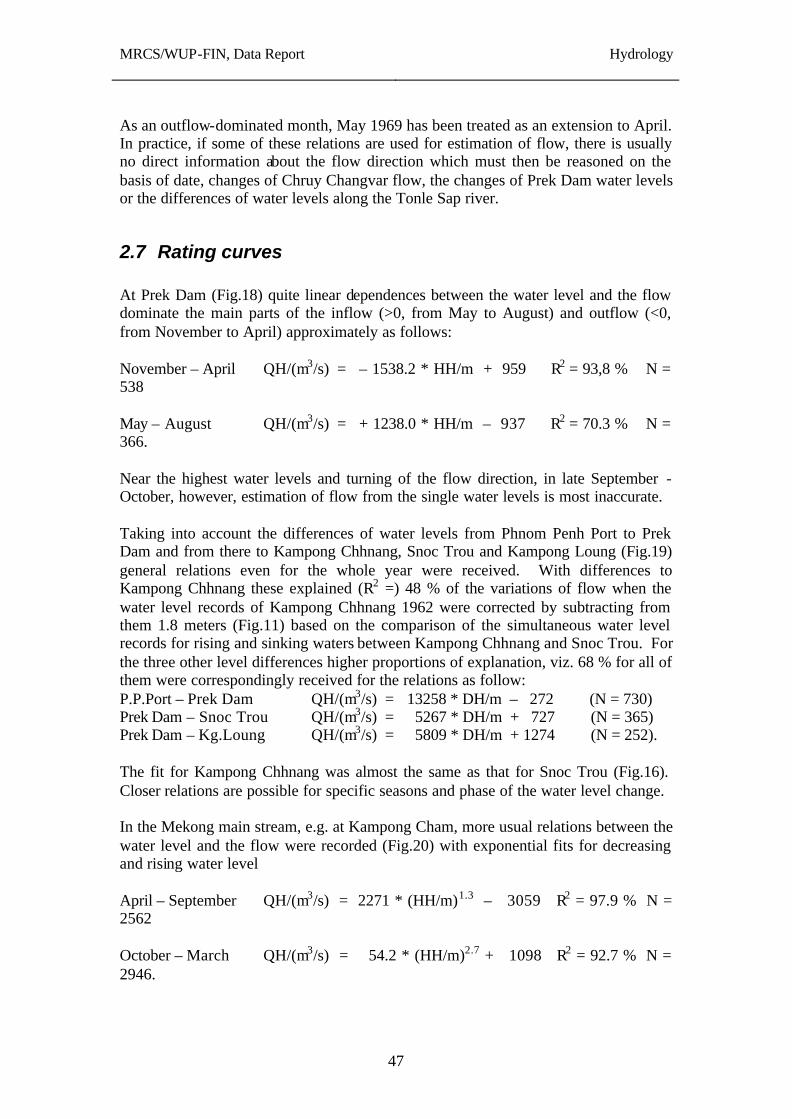
MRCS/WUP-FIN, Data Report
Hydrology
47
As an outflow-dominated month, May 1969 has been treated as an extension to April. In practice, if some of these relations are used for estimation of flow, there is usually no direct information about the flow direction which must then be reasoned on the basis of date, changes of Chruy Changvar flow, the changes of Prek Dam water levels or the differences of water levels along the Tonle Sap river.
2.7 Rating curves At Prek Dam (Fig.18) quite linear dependences between the water level and the flow dominate the main parts of the inflow (>0, from May to August) and outflow (<0, from November to April) approximately as follows: November – April QH/(m3/s) = – 1538.2 * HH/m + 959 R2 = 93,8 % N = 538 May – August QH/(m3/s) = + 1238.0 * HH/m – 937 R2 = 70.3 % N = 366. Near the highest water levels and turning of the flow direction, in late September - October, however, estimation of flow from the single water levels is most inaccurate. Taking into account the differences of water levels from Phnom Penh Port to Prek Dam and from there to Kampong Chhnang, Snoc Trou and Kampong Loung (Fig.19) general relations even for the whole year were received. With differences to Kampong Chhnang these explained (R2 =) 48 % of the variations of flow when the water level records of Kampong Chhnang 1962 were corrected by subtracting from them 1.8 meters (Fig.11) based on the comparison of the simultaneous water level records for rising and sinking waters between Kampong Chhnang and Snoc Trou. For the three other level differences higher proportions of explanation, viz. 68 % for all of them were correspondingly received for the relations as follow: P.P.Port – Prek Dam QH/(m3/s) = 13258 * DH/m – 272 (N = 730) Prek Dam – Snoc Trou QH/(m3/s) = 5267 * DH/m + 727 (N = 365) Prek Dam – Kg.Loung QH/(m3/s) = 5809 * DH/m + 1274 (N = 252). The fit for Kampong Chhnang was almost the same as that for Snoc Trou (Fig.16). Closer relations are possible for specific seasons and phase of the water level change. In the Mekong main stream, e.g. at Kampong Cham, more usual relations between the water level and the flow were recorded (Fig.20) with exponential fits for decreasing and rising water level April – September QH/(m3/s) = 2271 * (HH/m)1.3 – 3059 R2 = 97.9 % N = 2562 October – March QH/(m3/s) = 54.2 * (HH/m)2.7 + 1098 R2 = 92.7 % N = 2946.
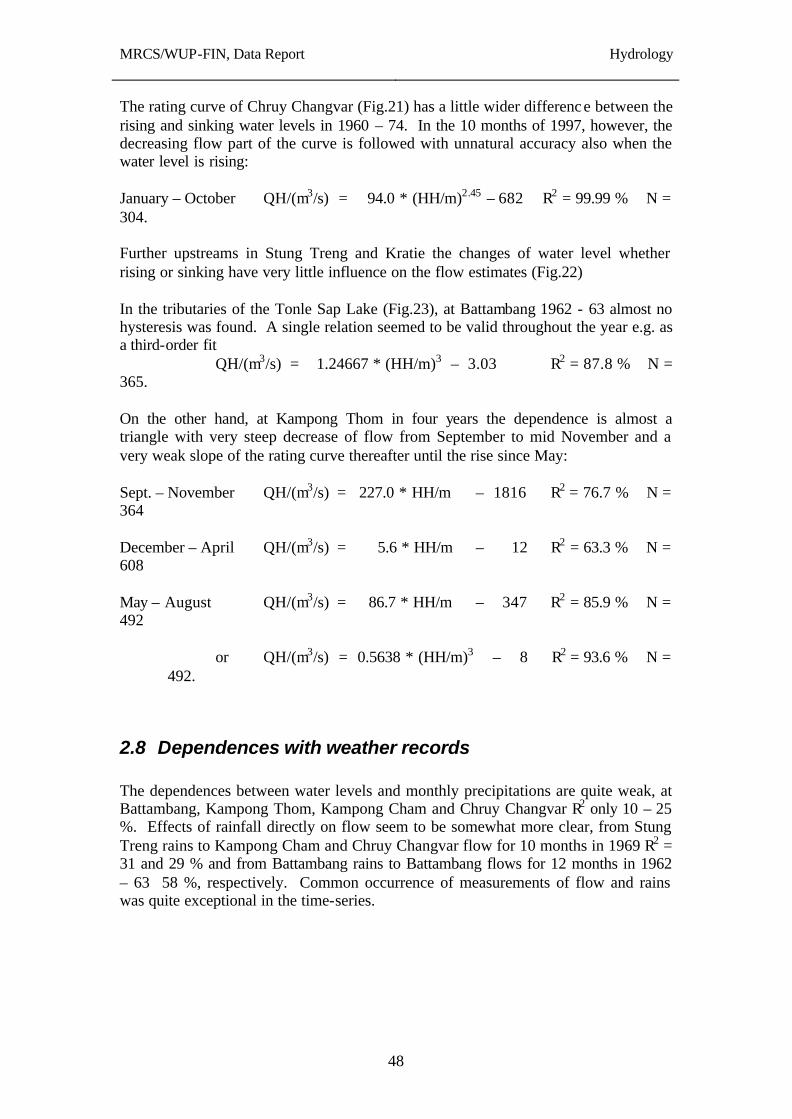
MRCS/WUP-FIN, Data Report
Hydrology
48
The rating curve of Chruy Changvar (Fig.21) has a little wider difference between the rising and sinking water levels in 1960 – 74. In the 10 months of 1997, however, the decreasing flow part of the curve is followed with unnatural accuracy also when the water level is rising: January – October QH/(m3/s) = 94.0 * (HH/m)2.45 – 682 R2 = 99.99 % N = 304. Further upstreams in Stung Treng and Kratie the changes of water level whether rising or sinking have very little influence on the flow estimates (Fig.22) In the tributaries of the Tonle Sap Lake (Fig.23), at Battambang 1962 - 63 almost no hysteresis was found. A single relation seemed to be valid throughout the year e.g. as a third-order fit QH/(m3/s) = 1.24667 * (HH/m)3 – 3.03 R2 = 87.8 % N = 365. On the other hand, at Kampong Thom in four years the dependence is almost a triangle with very steep decrease of flow from September to mid November and a very weak slope of the rating curve thereafter until the rise since May: Sept. – November QH/(m3/s) = 227.0 * HH/m – 1816 R2 = 76.7 % N = 364 December – April QH/(m3/s) = 5.6 * HH/m – 12 R2 = 63.3 % N = 608 May – August QH/(m3/s) = 86.7 * HH/m – 347 R2 = 85.9 % N = 492
or QH/(m3/s) = 0.5638 * (HH/m)3 – 8 R2 = 93.6 % N = 492.
2.8 Dependences with weather records The dependences between water levels and monthly precipitations are quite weak, at Battambang, Kampong Thom, Kampong Cham and Chruy Changvar R2 only 10 – 25 %. Effects of rainfall directly on flow seem to be somewhat more clear, from Stung Treng rains to Kampong Cham and Chruy Changvar flow for 10 months in 1969 R2 = 31 and 29 % and from Battambang rains to Battambang flows for 12 months in 1962 – 63 58 %, respectively. Common occurrence of measurements of flow and rains was quite exceptional in the time-series.
MRCS/WUP-FIN, Data Report
Hydrology
49
3 Suspended sediments and water quality
3.1 Stations and years Historical recordings of water quality were available as monthly observations since August 1993 from 11 locations in Mekong, Tonle Sap River, the Great Lake and its tributaries. With interruptions from July 1998 to August 1999 and in December 1999 the stations and their annual numbers of sampling occasions were as follows: Station 1993 1994 1995 1996 1997 1998 1999 2000 H014901 Kratie 6 12 12 6 3 12 H019801 Chruy Changvar 5 12 12 12 13 6 3 12 H019802 Kampong Cham 5 12 12 12 12 6 3 12 H019806 Neak Loung 5 12 12 12 12 6 3 12 H020101 Phnom Penh Port 6 12 12 6 3 12 H020102 Prek Dam 5 12 12 12 12 6 3 12 H020103 Kampong Chhnang 6 12 12 6 3 12 H020106 Kampong Loung 6 12 12 6 3 12 H033402 Bassac Chamtomuk 6 12 12 6 3 12 H033402 Koh Khel 5 12 12 12 12 6 3 12 H640110 Kampong Toul 6 12 12 6 3 12. Treatment of these results were concentrated in two groups, viz. those along or near the Mekong main stream, i.e. Kratie, Neak Loung, Kampong Cham, Chruy Changvar and Phnom Penh Port, and those along the Tonle Sap system, i.e. Kampong Loung, Kampong Chhnang and Prek Dam. Direct comparisons with flow recordings is possible only for the 10 months of Chruy Changvar 1997.
3.2 Quantities analyzed In recordings the water quality was indicated by the values or concentrations of 19 quantities, viz. the water temperature (Temp, ?C), inverse of the logarithm of Hydrogen ion concentration (pH, 0 – 14), suspended solids (TSS, mg/l), conductivity (Cond, mS /m), Calcium (Ca), Magnesium (Mg), Sodium (Na), Potassium (K), alkalinity (Alk), Cloride (Cl), Sulphate (SO4), Iron (Fe), Nitrate and Nitrite Nitrogen (NO23), Ammonium Nitrogen (NH4N), Phosphate Phosphorus (PO4P), total Phosphorus (TotP), Silicon (Si), dissolved Oxygen (O2 or Oxyg) and Chemical Oxygen Demand COD measured as the consumption of Potassium Permagnate KMnO4. Their total number of samples, maximum, minimum and average values in the recordings were as follows:
MRCS/WUP-FIN, Data Report
Hydrology
50
variable number max min mean TEMP 677 38 21 29.3836 PH 677 8.72 5.84 7.332954 TSS 676 1145 0 89.47253 COND 677 26.3 1.2 11.51981 CA 677 1.494 0.113 0.609716 MG 677 0.998 0.004 0.273941 NA 677 0.92 0.02 0.26283 K 677 0.13 0 0.040027 ALK 677 1.804 0.0873 0.858435 CL 677 0.84 0.0051 0.11832 SO4 677 1.158 0.009 0.146071 TFE 598 5.6 0 1.032642 NO32 672 3.24 0.001 0.230098 NH4N 677 1.81 0 0.067147 PO4P 675 0.16 0 0.02065 TOTP 676 0.38 0.001 0.034821 SI 671 16.25 0.33 4.113972 O2 653 10.96 0.95 6.260585 CODMN 677 12.7 0.3 3.150742
The closest mutual correlations among the quantities are those between Calcium and alkalinity (R2 = 80.4 %), conductivity and alkalinity (76.4 %) and Calcium and conductivity (75.5 %). Quite closely with these is coupled also Magnesium: to alkalinity with R2 = 64.0 %, to conductivity 62.7 % and to Calcium 50.9 %. The correlation coefficient squared between phosphate phosphorus and total phosphorus is 47.2 %. Nine other correlation coefficients squared are between 30 and 41 %, 33 between 10 and 30 %, 33 between 5 and 10 % and more than half, 89, are less than 5 %. As the most traditional indicators of water quality TSS, COD, O2, conductivity and water temperature are grouped together as well as are the main nutrients NO23, NH4N, PO4P and TotP, the alkaline compounds Ca, Mg, Na, K and alkalinity, and as rest of the indicators Fe, Si, Cl, SO4 and pH.
3.3 Nutrients, suspended solids and other indicators of water quality
As monthly averages of 6 – 8 years, mainly three types of annual distributions of the main indicators of water quality can be distinguished, viz. one for the Mekong upstream, one for the Tonle Sap River and one for the Lake and the downstream tributary. The reasons for the similarity between the lake and the tributary can be contributed by the existence of a reservoir upstream in the tributary and by the dominance of watershed effects on both of them. The importance of the latter factor would support the use of the tributary records as first estimates for the water quality of the lake tributaries, too.
MRCS/WUP-FIN, Data Report
Hydrology
51
The nutrient concentrations in the lake and in the tributary start to increase already in March (Fig.4.7). They reach their maximum (TotP 160, PO4P 100 and NO3N in lake only 1000 ug/l, in tributary no Nitrogen peak) in April – May. Thereafter from August to February they are very low, with the exception of an increase of total Phosphorus in the tributary in October to 80 ug/l. In the Mekong, on the contrary, the concentrations increase for June to December (to TotP 60, PO4P 45, and NO3N 350 ug/l) and are very low from January to May. In the Tonle Sap River there in an Nitrogen peak (NO3N 950 ug/l) from the lake in April but otherwise the nutrient levels follow those of the Mekong at somewhat lower level with maximums of TotP 45, PO4P 30, and NO3N 300 ug/l. The total concentration of suspended solids is at its maximum, almost 400 mg/l, in the tributary from June to August, in the lake almost 200 mg/l even earlier, in April and May (Fig.4.8a), when the water levels and volumes are at their minimum. In Mekong the maximum 300 mg/l is recorded in September. From June to October the concentrations are above 100 mg/l. In the Tonle Sap River, along with the maximum water level and decrease and turn of the flow, the concentrations start to decrease already in September From January to May the chemical oxygen demand COD is 5 – 6 mg/l in the lake and the Tonle Sap River, and rises from 3 to 5 mg/l in the tributary (Fig.4.8b). From June to December, the concentrations in lake and in tributary decrease from 5 to 3 mg/l. In Mekong the concentrations throughout the year are relatively low, 1 – 3 mg/l. In the Tonle Sap river, COD most clearly follows the COD of the upstream waters, from June to October Mekong, from November to May mainly the lake. The behavior of conductivity is opposite to that of COD. Quite low values 5 – 10 mS/m prevail throughout the year in the lake and the tributary (Fig.4.8c). In Mekong from January to June the values are 15 – 21, thereafter between 10 and 13. The conductivity in the Tonle Sap River follow that of the upstream waters, from June to September Mekong. Conductivity is correlated most closely with alkalinity, calcium and magnesium but also with other ions. This means that these vary quite much like conductivity.
MRCS/WUP-FIN, Data Report
Hydrology
52
List of Figures Fig.1. Location of the main meteorological and hydrological stations analyzed Fig.2. Annual distribution of rainfall in five stations 1996 - 99 Fig.3. Proportion of the annual rainfall at three stations compared to the annual average of the recorded rains 1981 - 2000 Fig.4. Annual rainfall as an average of observation stations in Cambodia 1950 -2000 Fig.5. Available annual precipitations at five stations 1950 - 2000 Table 2. Coincidences of the annual weather records at five stations 1950 - 2000 Fig.6. Cumulative sums of ground and satellite observations of rainfall at Battambang and Seam Reap March - December 2000 Fig.7. Mean monthly evaporations and rainfalls of 17 full station-years at three stations (Stung Treng 1961, 63 - 66, Battambang 1962 - 70, 72 - 73 and Seam Reap 1969) Fig.8. Monthly variation of evaporation at four stations 1968 - 69 Table 3. List of Hydrological Stations in Cambodia Table 4. Stations Containing Water Flow Records Fig.9. Water levels at Kampong Cham, Chruy Changvar and Prek Dam 1962 - 63 Fig.10. Water levels at Prek Dam, Snoc Trou and Kampong Loung 1962 - 63 Fig.11. Water levels at Kampong Cham, Kampong Loung and Kampong Chhnang 1950 - 2000 Fig.12. Recorded flows at Kampong Cham, Chruy Changvar, their difference, Prek Dam, Kampong Thom and Battambang from April to March 1962 - 63 and 1968 - 70 Fig.13. The seasonal flows (km3/period) at Prek Dam 1960 - 1973 Fig.14. Recorded direct overflow from Mekong to Tonle Sap in autumn 2001 compared with the decrease of flow from Kampong Cham to Chruy Changvar 1968 and -69 Fig.15. Dependences of the flow records at Kampong Cham, Kampong Thom and Battambang on the flow records at Chruy Changvar as monthly averages from April to March 1962 - 63 and 1968 - 70 Fig.16. Dependence of the daily flow records at Prek Dam on the flow records at Chruy Changvar in 1962 - 63 and 1968 - 70
MRCS/WUP-FIN, Data Report
Hydrology
53
Fig.17. Dependence of the flow records of different seasons at Prek Dam on the flow records at Chruy Changvar as monthly averages 1962 - 63 and 1968 - 70 Fig.18. Recorded flows (in the middle) and water levels (below) at Prek Dam form April to March 1962 - 63 and 1968 - 70, and the seasonal dependences of the flows on the water level (on the top) Fig.19. Dependences of the flow at Prek Dam 1962 - 63 and 1968 - 70 on the adjacent water level differences (without attention to the season or flow direction) Fig.20. Dependence of flow at Kampong Cham on its water level 1964 - 74 Fig.21. Dependence of flow at Chruy Changvar by seasons or months on its water level 1960 - 74 (above) and 1997 (below) Fig.22. Dependence of flow on water level in Stung Treng and Kratie Fig.23. Dependence of flow on water level in Battambang 1962 - 63 and Kampong Thom Fig.24. Monthly average nutrient concentrations Fig.25. Monthly average values of suspended solis, COD and conductivity
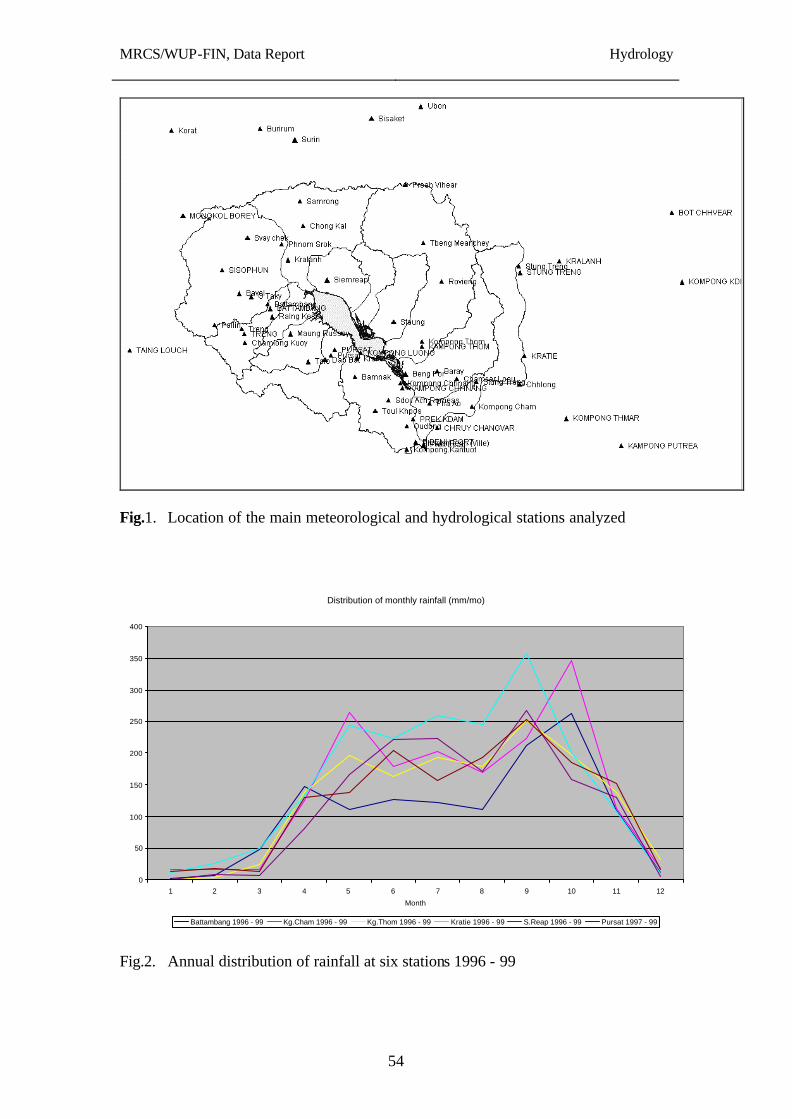
MRCS/WUP-FIN, Data Report
Hydrology
54
Fig.1. Location of the main meteorological and hydrological stations analyzed
Distribution of monthly rainfall (mm/mo)
0
50
100
150
200
250
300
350
400
1 2 3 4 5 6 7 8 9 10 11 12
Month
Battambang 1996 - 99 Kg.Cham 1996 - 99 Kg.Thom 1996 - 99 Kratie 1996 - 99 S.Reap 1996 - 99 Pursat 1997 - 99 Fig.2. Annual distribution of rainfall at six stations 1996 - 99
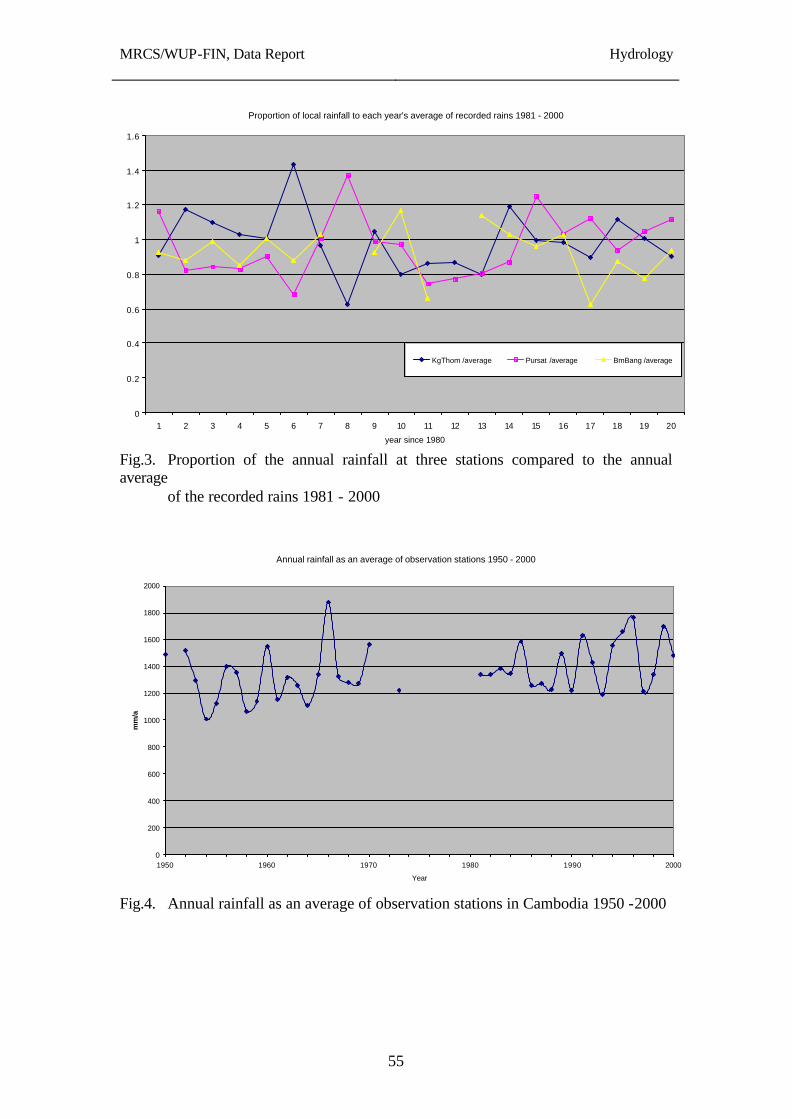
MRCS/WUP-FIN, Data Report
Hydrology
55
Proportion of local rainfall to each year's average of recorded rains 1981 - 2000
0
0.2
0.4
0.6
0.8
1
1.2
1.4
1.6
1 2 3 4 5 6 7 8 9 10 11 12 13 14 15 16 17 18 19 20
year since 1980
KgThom /average Pursat /average BmBang /average
Fig.3. Proportion of the annual rainfall at three stations compared to the annual average of the recorded rains 1981 - 2000
Annual rainfall as an average of observation stations 1950 - 2000
0
200
400
600
800
1000
1200
1400
1600
1800
2000
1950 1960 1970 1980 1990 2000
Year
mm
/a
Fig.4. Annual rainfall as an average of observation stations in Cambodia 1950 -2000
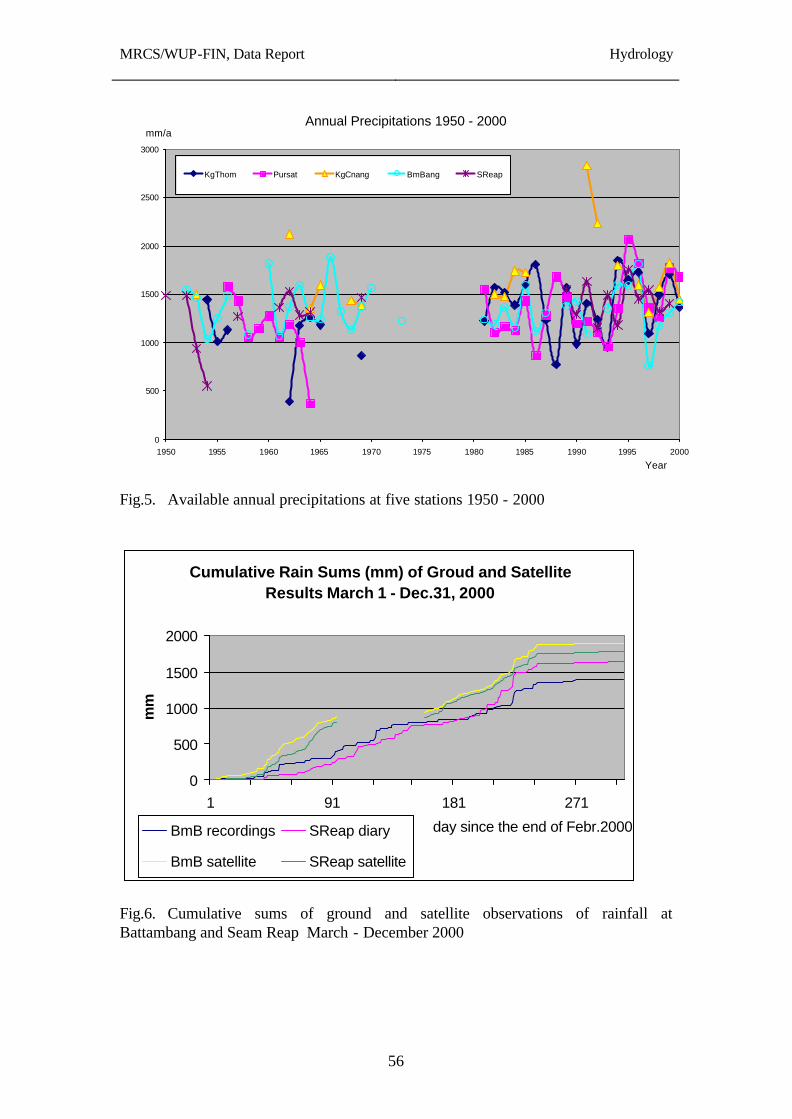
MRCS/WUP-FIN, Data Report
Hydrology
56
Annual Precipitations 1950 - 2000
0
500
1000
1500
2000
2500
3000
1950 1955 1960 1965 1970 1975 1980 1985 1990 1995 2000
Year
mm/a
KgThom Pursat KgCnang BmBang SReap
Fig.5. Available annual precipitations at five stations 1950 - 2000
Cumulative Rain Sums (mm) of Groud and Satellite Results March 1 - Dec.31, 2000
0
500
1000
1500
2000
1 91 181 271
day since the end of Febr.2000
mm
BmB recordings SReap diary
BmB satellite SReap satellite
Fig.6. Cumulative sums of ground and satellite observations of rainfall at Battambang and Seam Reap March - December 2000
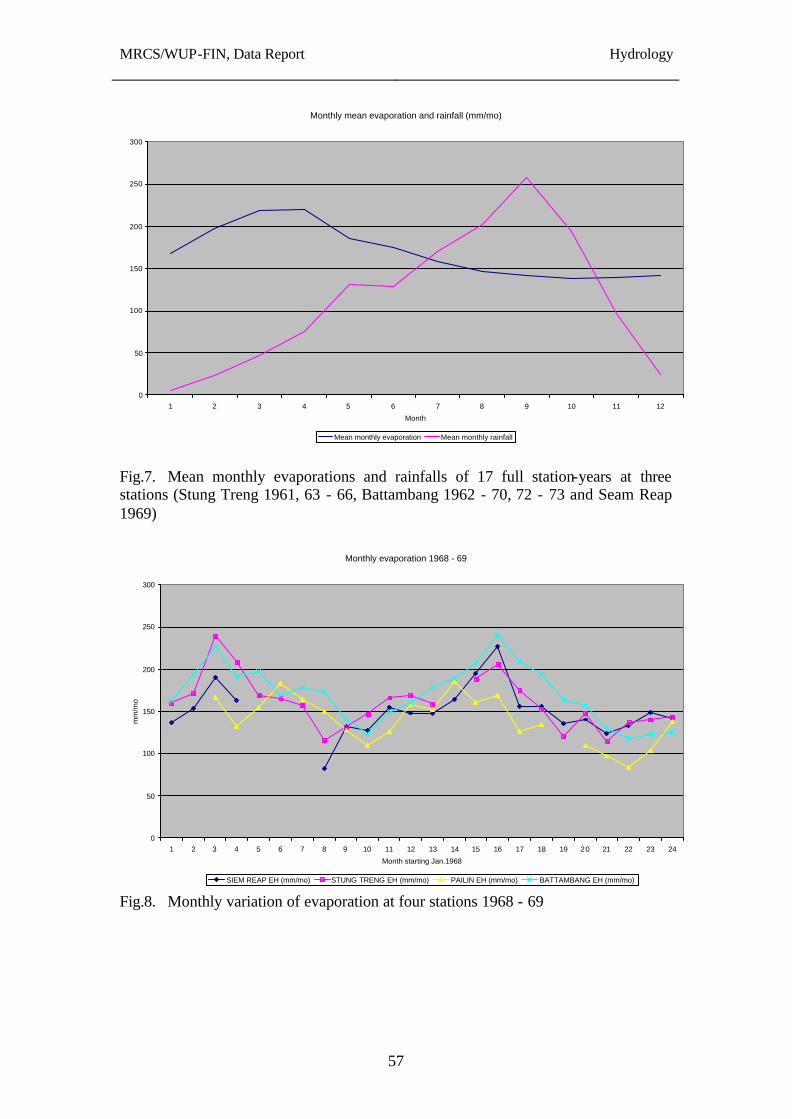
MRCS/WUP-FIN, Data Report
Hydrology
57
Monthly mean evaporation and rainfall (mm/mo)
0
50
100
150
200
250
300
1 2 3 4 5 6 7 8 9 10 11 12
Month
Mean monthly evaporation Mean monthly rainfall Fig.7. Mean monthly evaporations and rainfalls of 17 full station-years at three stations (Stung Treng 1961, 63 - 66, Battambang 1962 - 70, 72 - 73 and Seam Reap 1969)
Monthly evaporation 1968 - 69
0
50
100
150
200
250
300
1 2 3 4 5 6 7 8 9 10 11 12 13 14 15 16 17 18 19 20 21 22 23 24
Month starting Jan.1968
mm
/mo
SIEM REAP EH (mm/mo) STUNG TRENG EH (mm/mo) PAILIN EH (mm/mo) BATTAMBANG EH (mm/mo) Fig.8. Monthly variation of evaporation at four stations 1968 - 69

MRCS/WUP-FIN, Data Report
Hydrology
58
Water levels (m) Apr.1962 - Dec.1963
0
2
4
6
8
10
12
14
16
1 20 39 58 77 96 115 134 153 172 191 210 229 248 267 286 305 324 343 362 381 400 419 438 457 476 495 514 533 552 571 590 609 628
KgCham ChrCgvar PrekDam Fig.9. Water levels at Kampong Cham, Chruy Changvar and Prek Dam 1962 - 63
Water levels (m) Apr.1962 - Dec.1963
0
1
2
3
4
5
6
7
8
9
10
1 20 39 58 77 96 115 134 153 172 191 210 229 248 267 286 305 324 343 362 381 400 419 438 457 476 495 514 533 552 571 590 609 628
PrekDam SnocTrou KgLoung Fig.10. Water levels at Prek Dam, Snoc Trou and Kampong Loung 1962 - 63
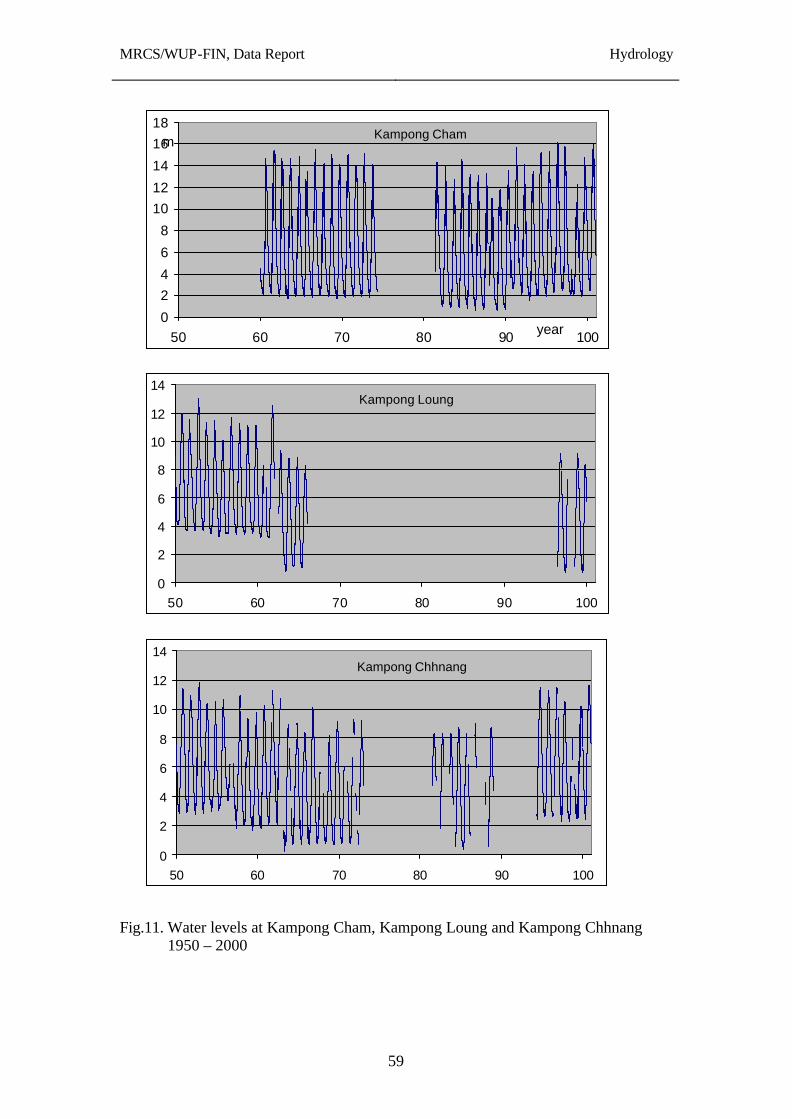
MRCS/WUP-FIN, Data Report
Hydrology
59
Kampong Chhnang
0
2
4
6
8
10
12
14
50 60 70 80 90 100
Kampong Loung
0
2
4
6
8
10
12
14
50 60 70 80 90 100
Kampong Cham
0
24
6
8
1012
14
1618
50 60 70 80 90 100year
m
Fig.11. Water levels at Kampong Cham, Kampong Loung and Kampong Chhnang 1950 – 2000
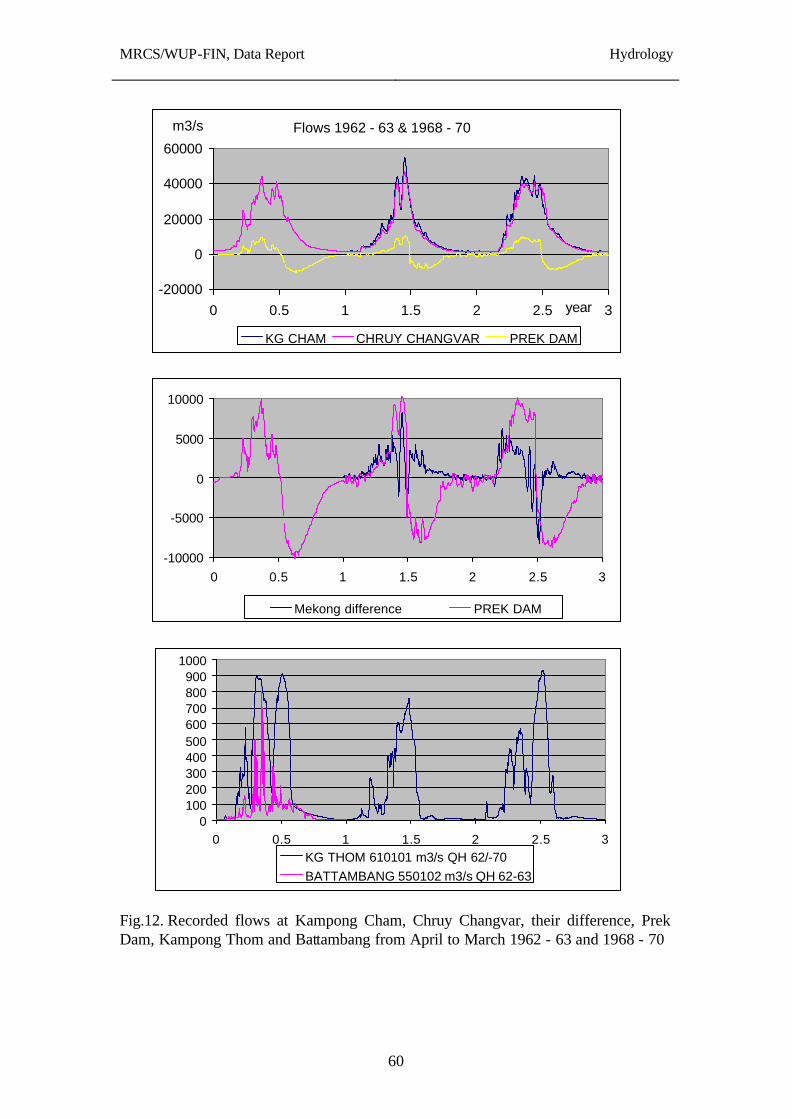
MRCS/WUP-FIN, Data Report
Hydrology
60
Flows 1962 - 63 & 1968 - 70
-20000
0
20000
40000
60000
0 0.5 1 1.5 2 2.5 3year
m3/s
KG CHAM CHRUY CHANGVAR PREK DAM
-10000
-5000
0
5000
10000
0 0.5 1 1.5 2 2.5 3
Mekong difference PREK DAM
0100200300400500600700800900
1000
0 0.5 1 1.5 2 2.5 3KG THOM 610101 m3/s QH 62/-70BATTAMBANG 550102 m3/s QH 62-63
Fig.12. Recorded flows at Kampong Cham, Chruy Changvar, their difference, Prek Dam, Kampong Thom and Battambang from April to March 1962 - 63 and 1968 - 70
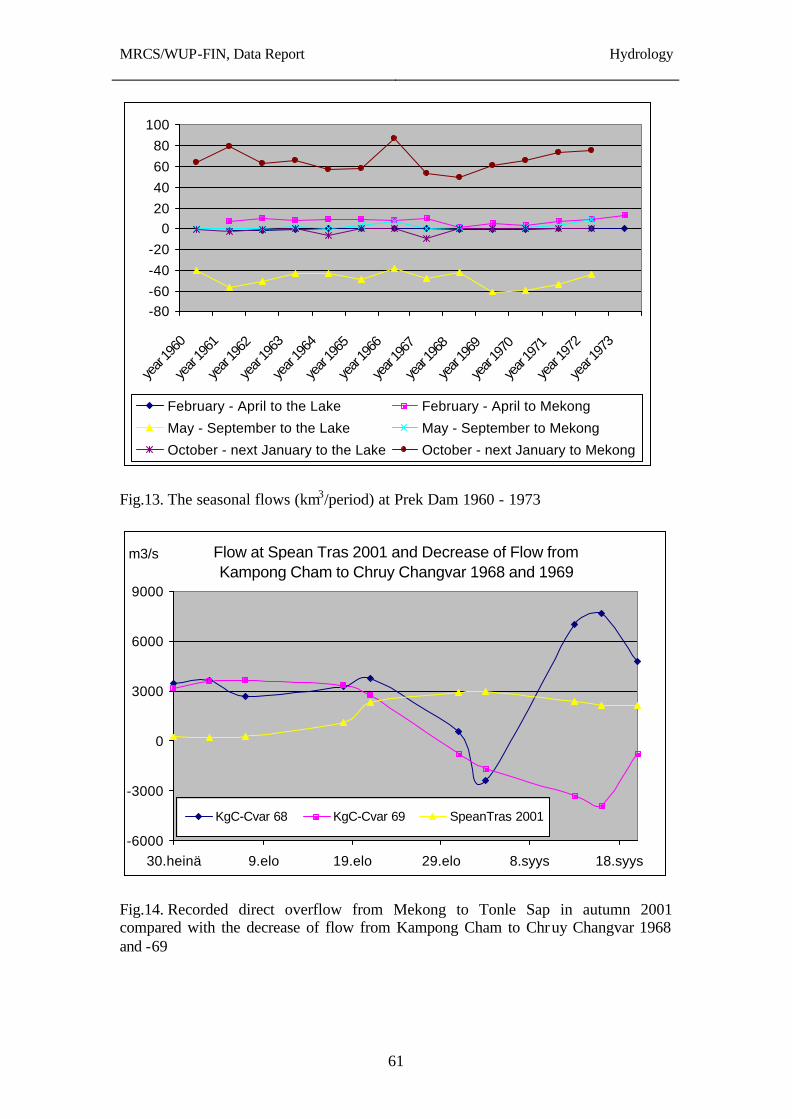
MRCS/WUP-FIN, Data Report
Hydrology
61
-80-60-40-20
020406080
100
year
1960
year
1961
year
1962
year
1963
year
1964
year
1965
year
1966
year
1967
year
1968
year
1969
year
1970
year
1971
year
1972
year
1973
February - April to the Lake February - April to Mekong
May - September to the Lake May - September to Mekong
October - next January to the Lake October - next January to Mekong
Fig.13. The seasonal flows (km3/period) at Prek Dam 1960 - 1973
Flow at Spean Tras 2001 and Decrease of Flow from Kampong Cham to Chruy Changvar 1968 and 1969
-6000
-3000
0
3000
6000
9000
30.heinä 9.elo 19.elo 29.elo 8.syys 18.syys
m3/s
KgC-Cvar 68 KgC-Cvar 69 SpeanTras 2001
Fig.14. Recorded direct overflow from Mekong to Tonle Sap in autumn 2001 compared with the decrease of flow from Kampong Cham to Chruy Changvar 1968 and -69
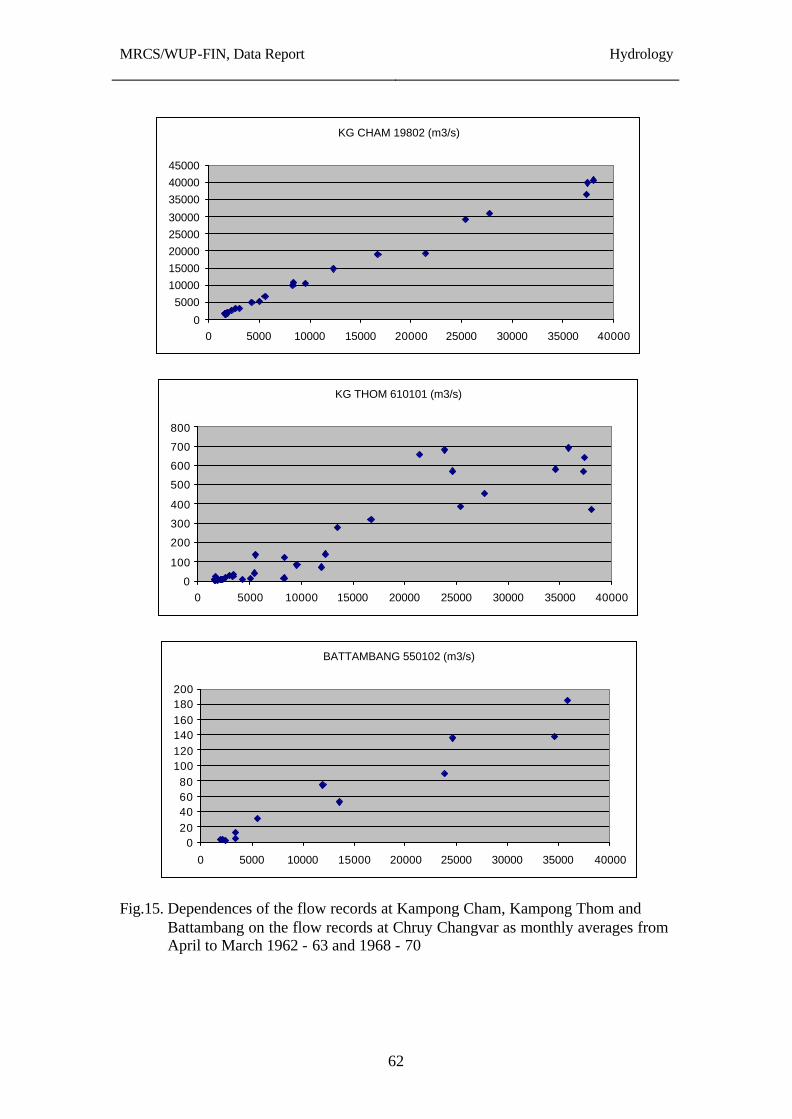
MRCS/WUP-FIN, Data Report
Hydrology
62
KG CHAM 19802 (m3/s)
0
50001000015000200002500030000
350004000045000
0 5000 10000 15000 20000 25000 30000 35000 40000
KG THOM 610101 (m3/s)
0
100
200
300
400
500
600
700
800
0 5000 10000 15000 20000 25000 30000 35000 40000
BATTAMBANG 550102 (m3/s)
020406080
100120140160180200
0 5000 10000 15000 20000 25000 30000 35000 40000
Fig.15. Dependences of the flow records at Kampong Cham, Kampong Thom and Battambang on the flow records at Chruy Changvar as monthly averages from April to March 1962 - 63 and 1968 - 70
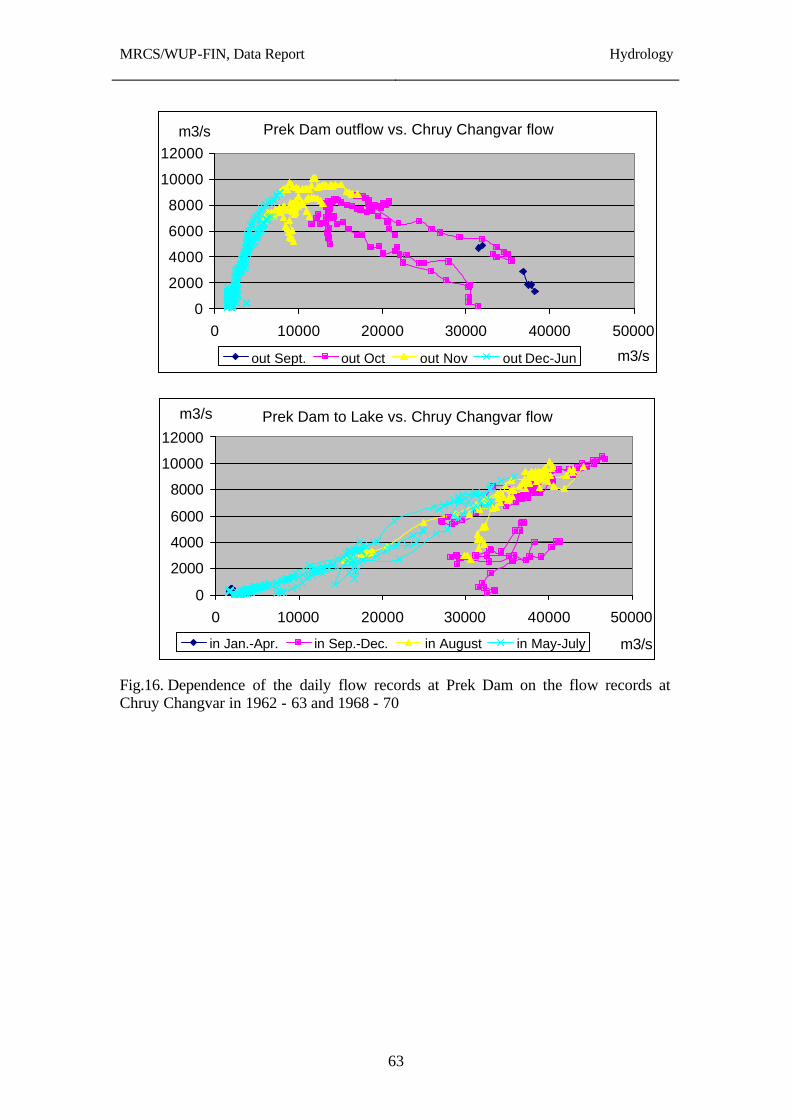
MRCS/WUP-FIN, Data Report
Hydrology
63
Prek Dam outflow vs. Chruy Changvar flow
0
2000
4000
6000
8000
10000
12000
0 10000 20000 30000 40000 50000
m3/s
m3/s
out Sept. out Oct out Nov out Dec-Jun
Prek Dam to Lake vs. Chruy Changvar flow
0
2000
4000
6000
8000
10000
12000
0 10000 20000 30000 40000 50000
m3/s
m3/s
in Jan.-Apr. in Sep.-Dec. in August in May-July
Fig.16. Dependence of the daily flow records at Prek Dam on the flow records at Chruy Changvar in 1962 - 63 and 1968 - 70
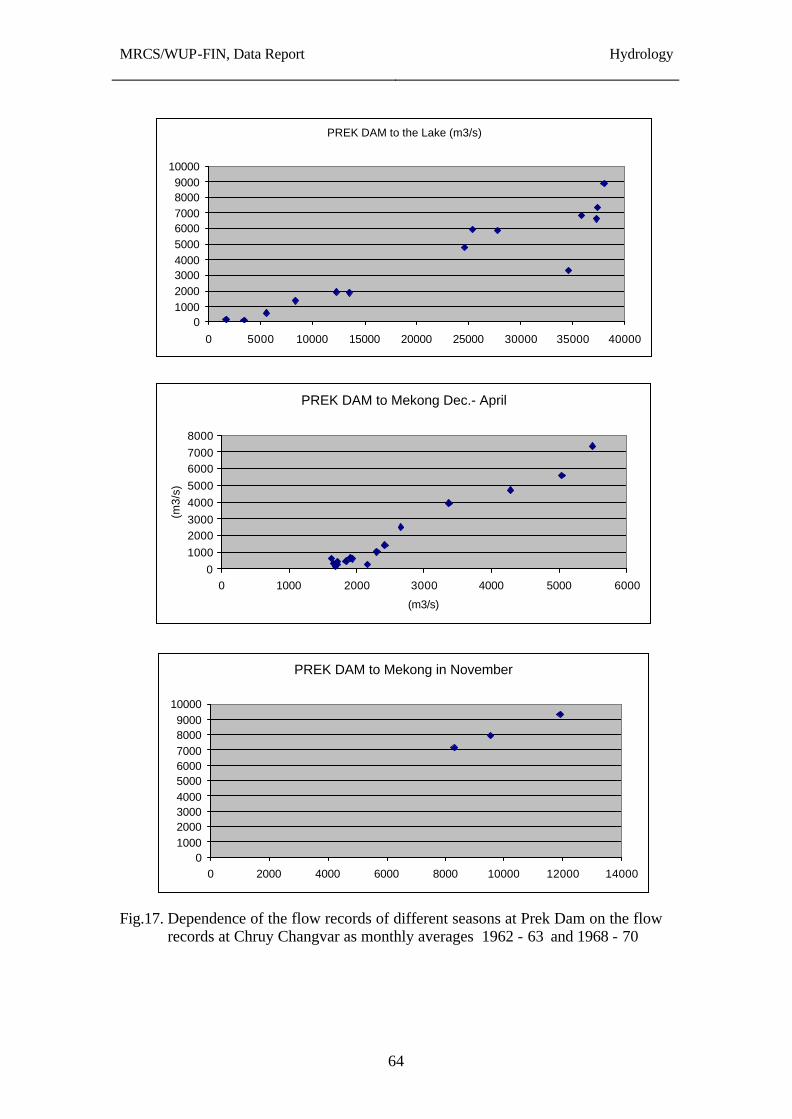
MRCS/WUP-FIN, Data Report
Hydrology
64
PREK DAM to the Lake (m3/s)
0100020003000400050006000700080009000
10000
0 5000 10000 15000 20000 25000 30000 35000 40000
PREK DAM to Mekong Dec.- April
010002000300040005000600070008000
0 1000 2000 3000 4000 5000 6000
(m3/s)
(m3/
s)
PREK DAM to Mekong in November
0100020003000400050006000700080009000
10000
0 2000 4000 6000 8000 10000 12000 14000
Fig.17. Dependence of the flow records of different seasons at Prek Dam on the flow records at Chruy Changvar as monthly averages 1962 - 63 and 1968 - 70
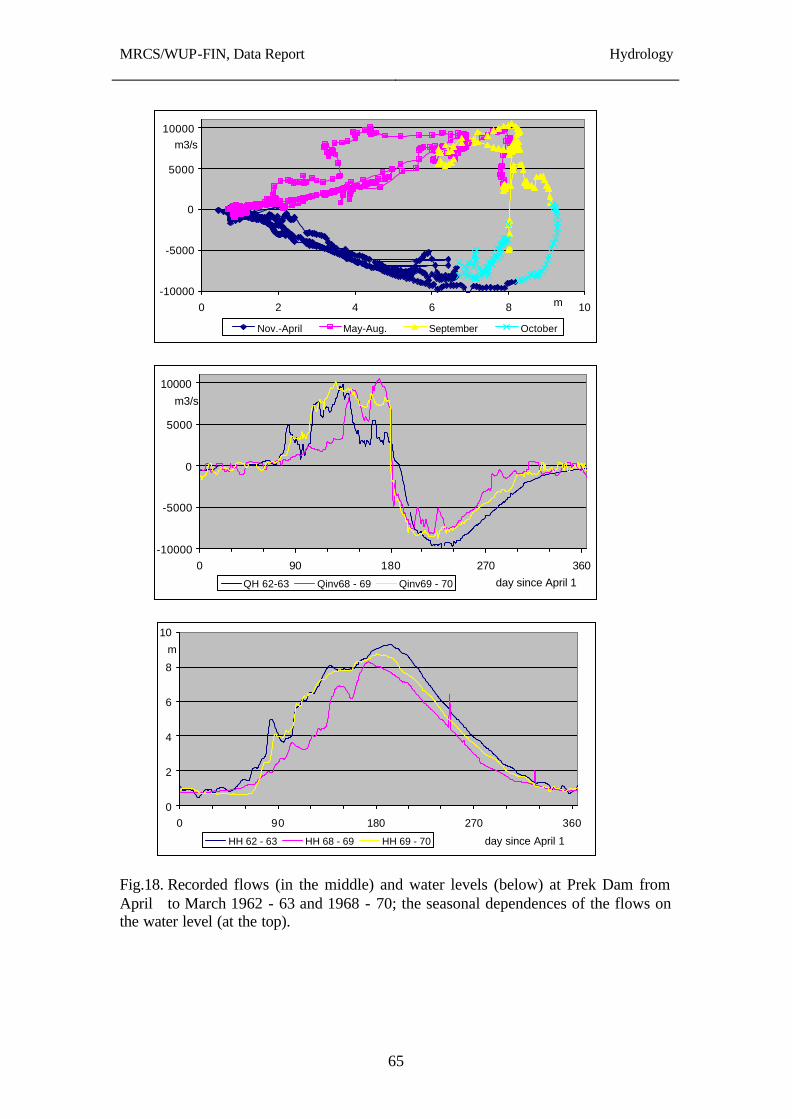
MRCS/WUP-FIN, Data Report
Hydrology
65
-10000
-5000
0
5000
10000
0 2 4 6 8 10m
m3/s
Nov.-April May-Aug. September October
-10000
-5000
0
5000
10000
0 90 180 270 360
day since April 1
m3/s
QH 62-63 Qinv68 - 69 Qinv69 - 70
0
2
4
6
8
10
0 90 180 270 360
day since April 1
m
HH 62 - 63 HH 68 - 69 HH 69 - 70
Fig.18. Recorded flows (in the middle) and water levels (below) at Prek Dam from April to March 1962 - 63 and 1968 - 70; the seasonal dependences of the flows on the water level (at the top).
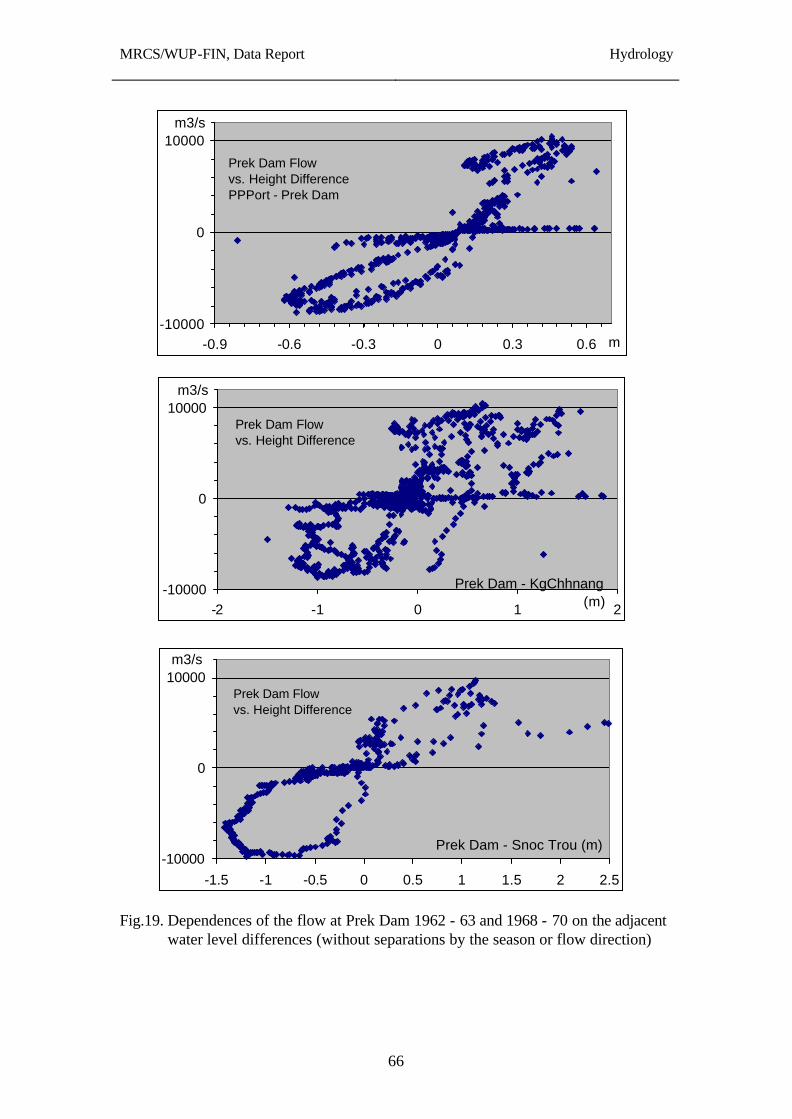
MRCS/WUP-FIN, Data Report
Hydrology
66
Prek Dam Flow vs. Height DifferencePPPort - Prek Dam
-10000
0
10000
-0.9 -0.6 -0.3 0 0.3 0.6 m
m3/s
Prek Dam Flowvs. Height Difference
-10000
0
10000
-2 -1 0 1 2
Prek Dam - KgChhnang (m)
m3/s
Prek Dam Flowvs. Height Difference
-10000
0
10000
-1.5 -1 -0.5 0 0.5 1 1.5 2 2.5
Prek Dam - Snoc Trou (m)
m3/s
Fig.19. Dependences of the flow at Prek Dam 1962 - 63 and 1968 - 70 on the adjacent water level differences (without separations by the season or flow direction)
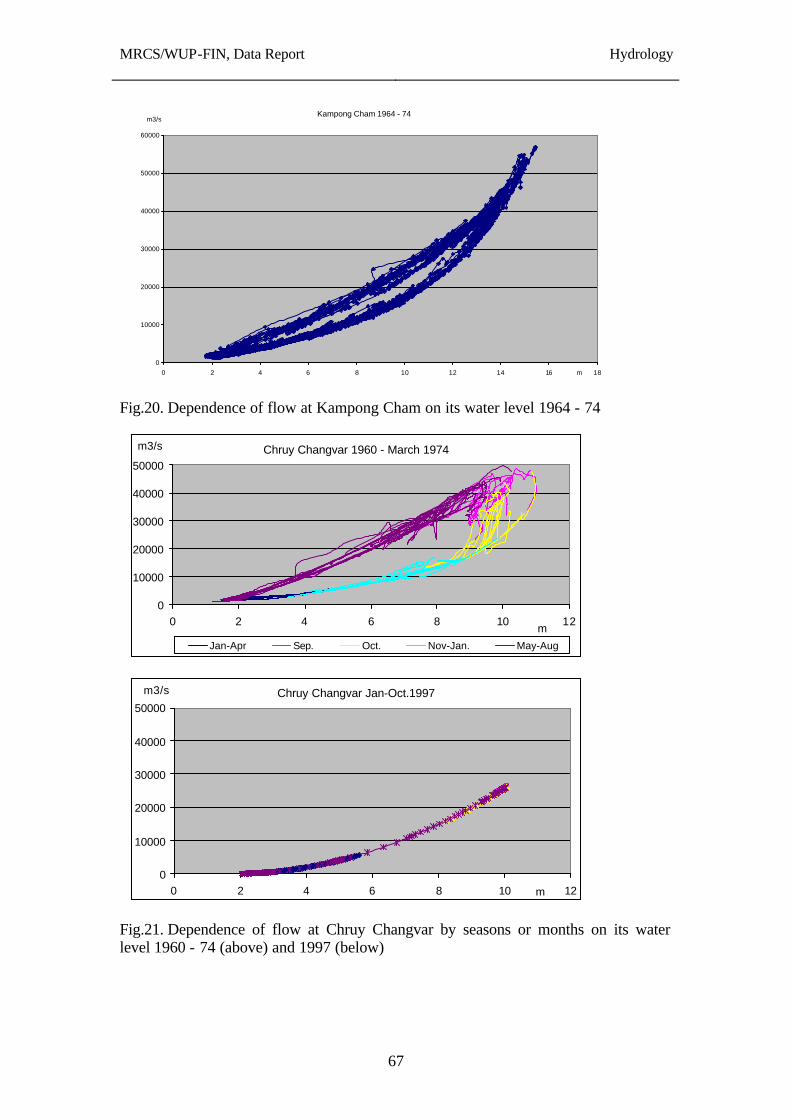
MRCS/WUP-FIN, Data Report
Hydrology
67
Kampong Cham 1964 - 74
0
10000
20000
30000
40000
50000
60000
0 2 4 6 8 10 12 14 16 18m
m3/s
Fig.20. Dependence of flow at Kampong Cham on its water level 1964 - 74
Chruy Changvar 1960 - March 1974
0
10000
20000
30000
40000
50000
0 2 4 6 8 10 12m
m3/s
Jan-Apr Sep. Oct. Nov-Jan. May-Aug
Chruy Changvar Jan-Oct.1997
0
10000
20000
30000
40000
50000
0 2 4 6 8 10 12m
m3/s
Fig.21. Dependence of flow at Chruy Changvar by seasons or months on its water level 1960 - 74 (above) and 1997 (below)
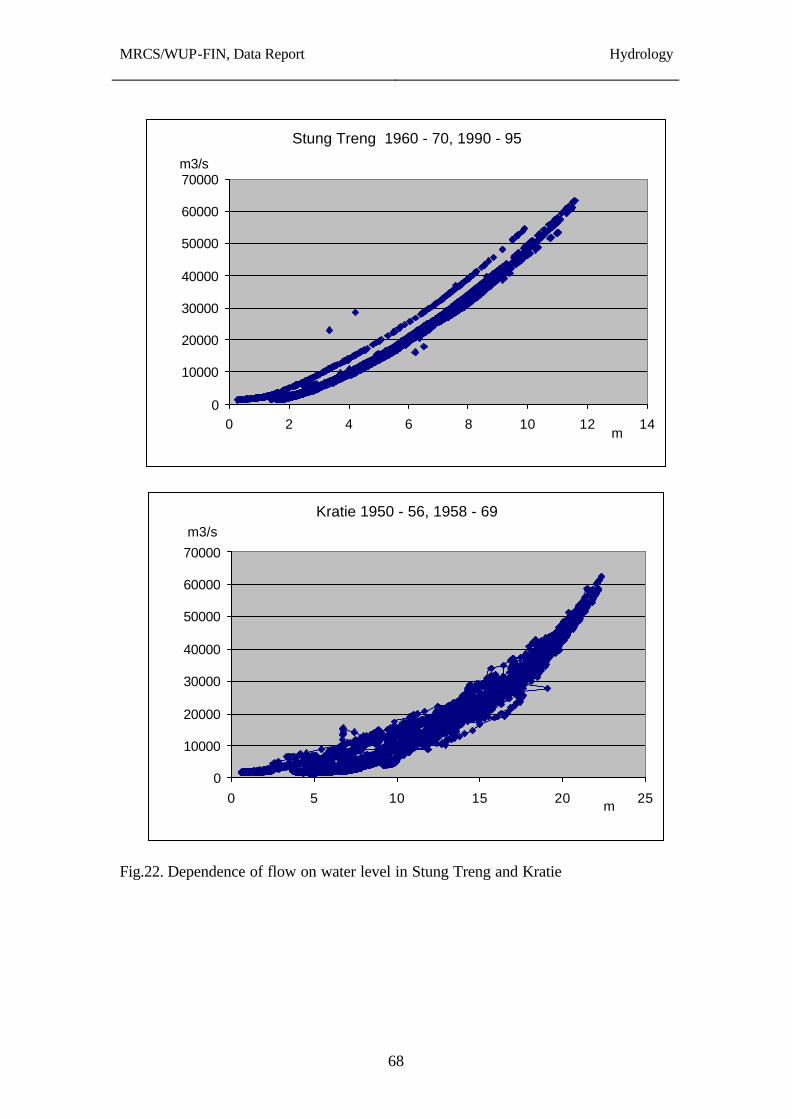
MRCS/WUP-FIN, Data Report
Hydrology
68
Stung Treng 1960 - 70, 1990 - 95
0
10000
20000
30000
40000
50000
60000
70000
0 2 4 6 8 10 12 14m
m3/s
Kratie 1950 - 56, 1958 - 69
0
10000
20000
30000
40000
50000
60000
70000
0 5 10 15 20 25m
m3/s
Fig.22. Dependence of flow on water level in Stung Treng and Kratie
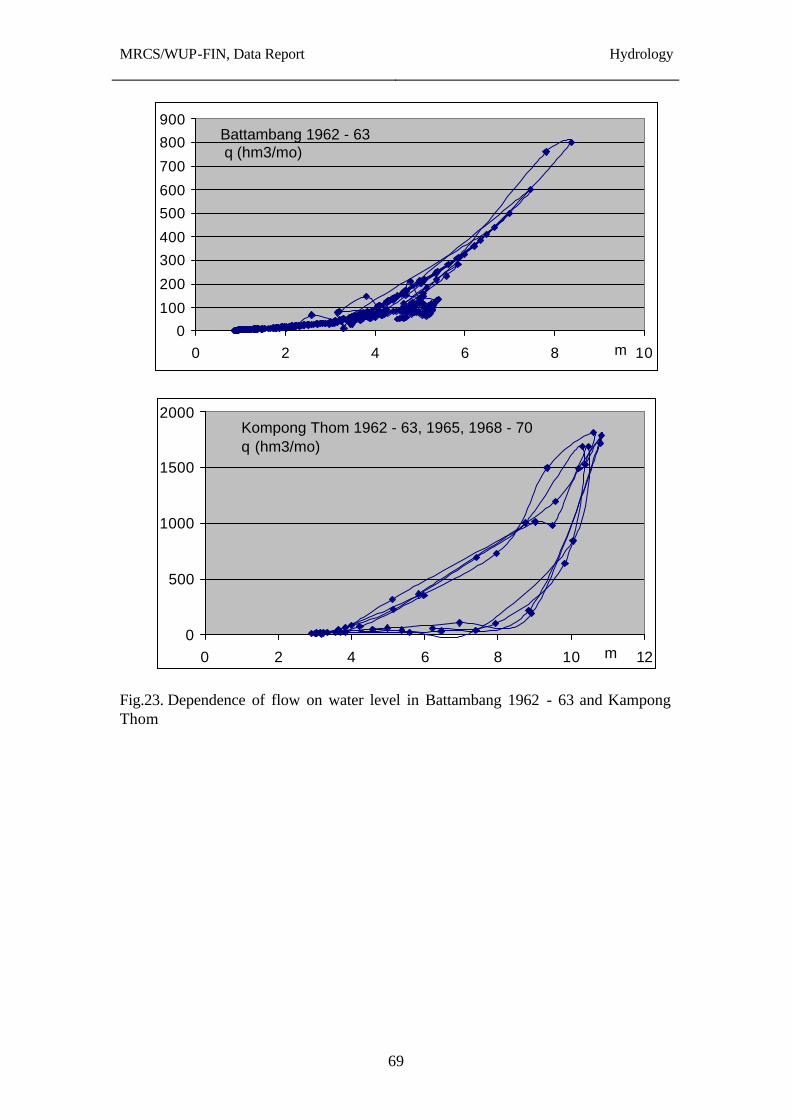
MRCS/WUP-FIN, Data Report
Hydrology
69
Battambang 1962 - 63 q (hm3/mo)
0
100
200
300
400
500
600
700
800
900
0 2 4 6 8 10m
Kompong Thom 1962 - 63, 1965, 1968 - 70q (hm3/mo)
0
500
1000
1500
2000
0 2 4 6 8 10 12m
Fig.23. Dependence of flow on water level in Battambang 1962 - 63 and Kampong Thom
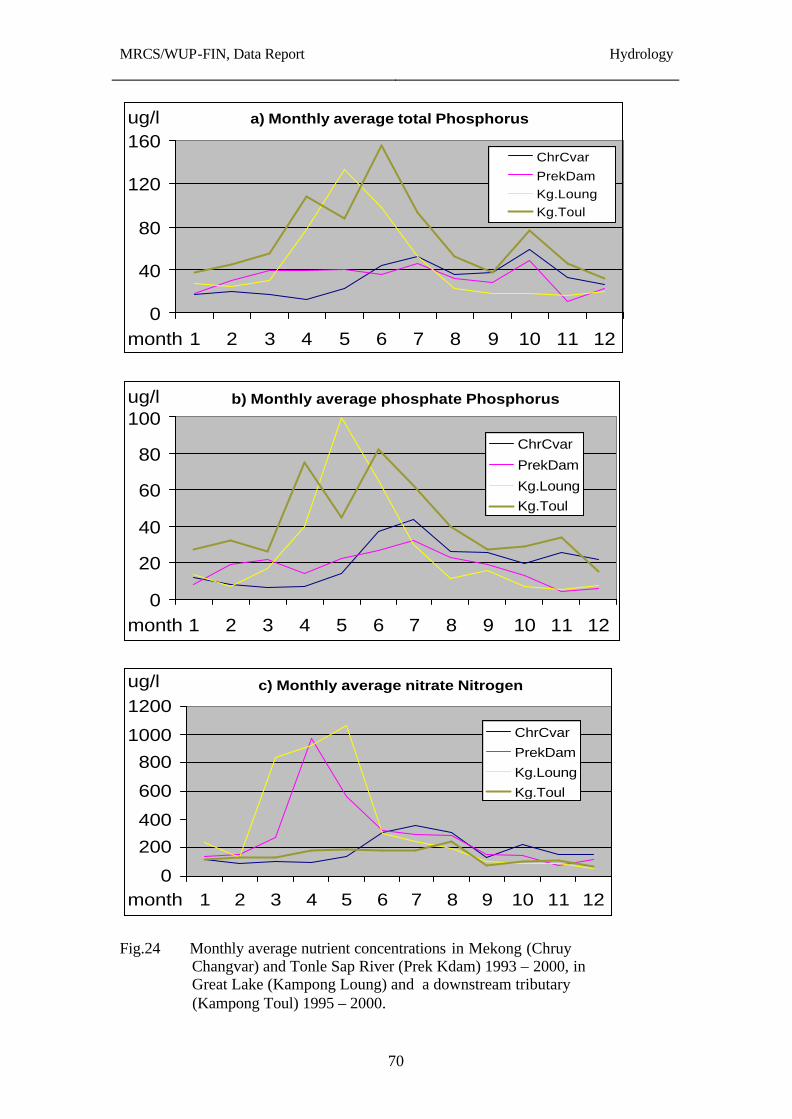
MRCS/WUP-FIN, Data Report
Hydrology
70
a) Monthly average total Phosphorus
0
40
80
120
160
1 2 3 4 5 6 7 8 9 10 11 12month
ug/l
ChrCvar
PrekDamKg.LoungKg.Toul
b) Monthly average phosphate Phosphorus
0
20
40
60
80
100
1 2 3 4 5 6 7 8 9 10 11 12month
ug/l
ChrCvar
PrekDam
Kg.LoungKg.Toul
c) Monthly average nitrate Nitrogen
0
200
400
600
800
1000
1200
1 2 3 4 5 6 7 8 9 10 11 12month
ug/l
ChrCvar
PrekDam
Kg.Loung
Kg.Toul
Fig.24 Monthly average nutrient concentrations in Mekong (Chruy
Changvar) and Tonle Sap River (Prek Kdam) 1993 – 2000, in Great Lake (Kampong Loung) and a downstream tributary (Kampong Toul) 1995 – 2000.
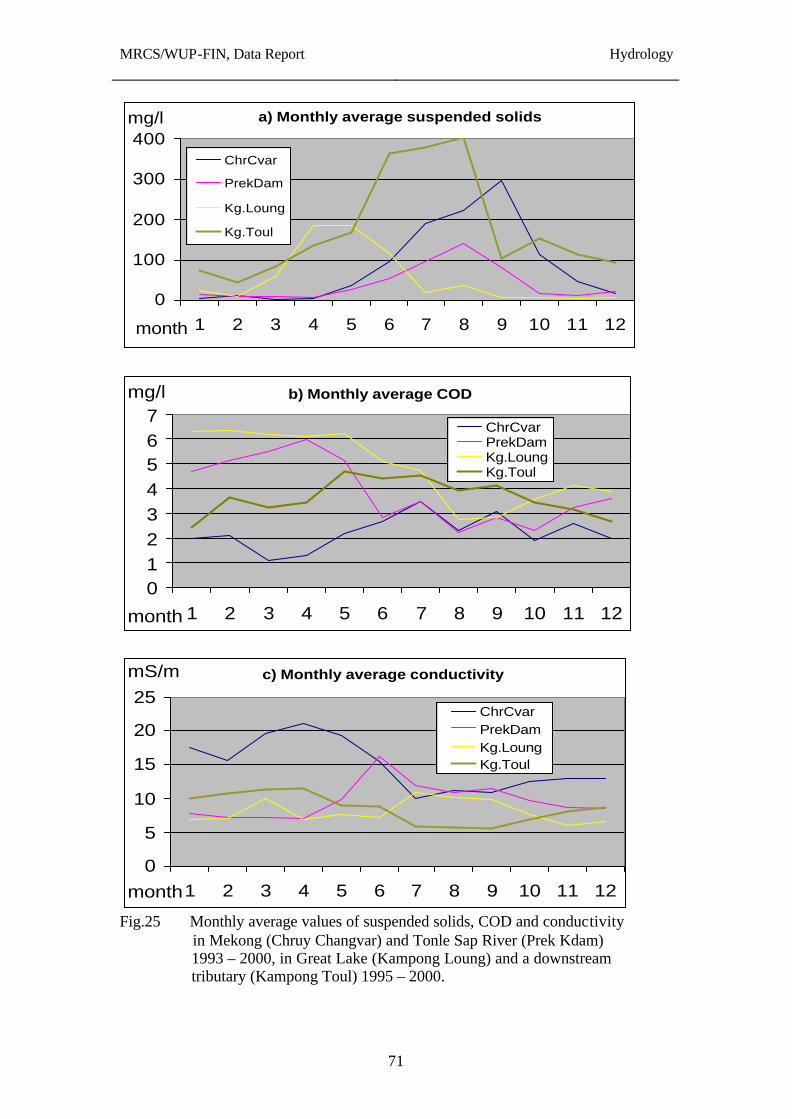
MRCS/WUP-FIN, Data Report
Hydrology
71
a) Monthly average suspended solids
0
100
200
300
400
1 2 3 4 5 6 7 8 9 10 11 12month
mg/l
ChrCvar
PrekDam
Kg.Loung
Kg.Toul
b) Monthly average COD
01234567
1 2 3 4 5 6 7 8 9 10 11 12month
mg/l
ChrCvarPrekDamKg.LoungKg.Toul
c) Monthly average conductivity
0
5
10
15
20
25
1 2 3 4 5 6 7 8 9 10 11 12month
mS/m
ChrCvarPrekDamKg.LoungKg.Toul
Fig.25 Monthly average values of suspended solids, COD and conductivity
in Mekong (Chruy Changvar) and Tonle Sap River (Prek Kdam) 1993 – 2000, in Great Lake (Kampong Loung) and a downstream tributary (Kampong Toul) 1995 – 2000.
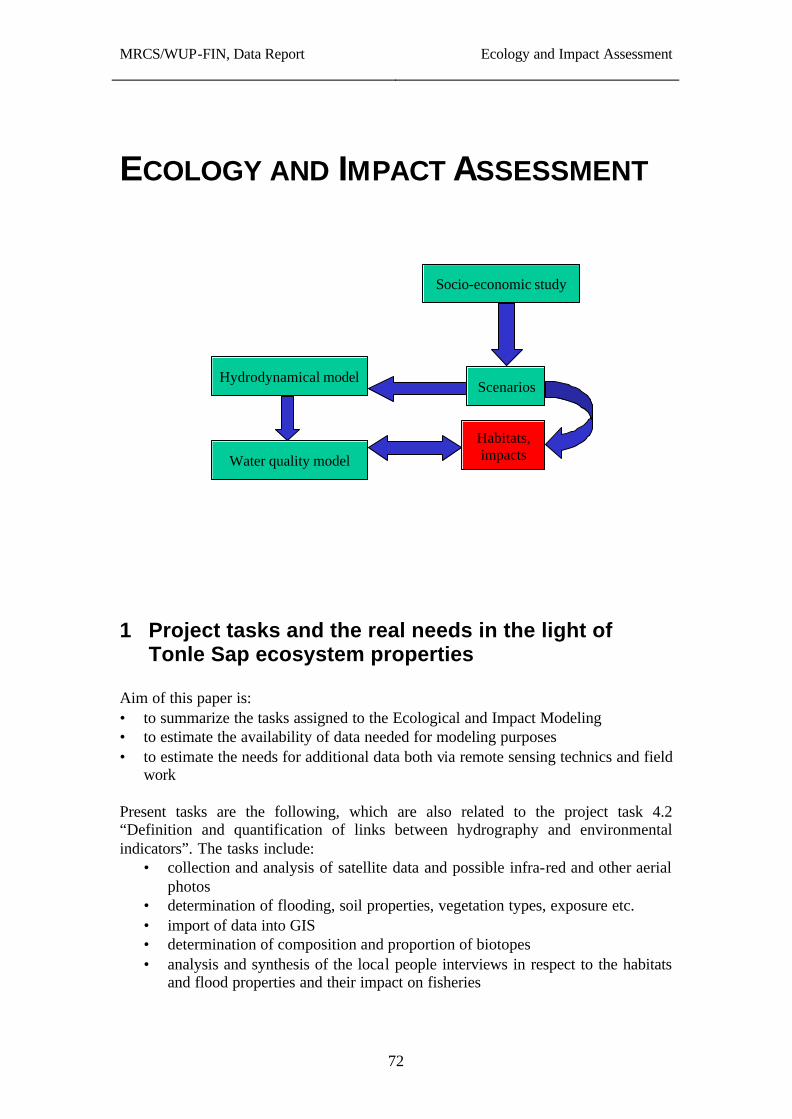
MRCS/WUP-FIN, Data Report
Ecology and Impact Assessment
72
ECOLOGY AND IMPACT ASSESSMENT
1 Project tasks and the real needs in the light of Tonle Sap ecosystem properties
Aim of this paper is: • to summarize the tasks assigned to the Ecological and Impact Modeling • to estimate the availability of data needed for modeling purposes • to estimate the needs for additional data both via remote sensing technics and field
work Present tasks are the following, which are also related to the project task 4.2 “Definition and quantification of links between hydrography and environmental indicators”. The tasks include:
• collection and analysis of satellite data and possible infra-red and other aerial photos
• determination of flooding, soil properties, vegetation types, exposure etc. • import of data into GIS • determination of composition and proportion of biotopes • analysis and synthesis of the local people interviews in respect to the habitats
and flood properties and their impact on fisheries
Water quality model
Hydrodynamical model
Socio-economic study
Scenarios
Habitats,impacts
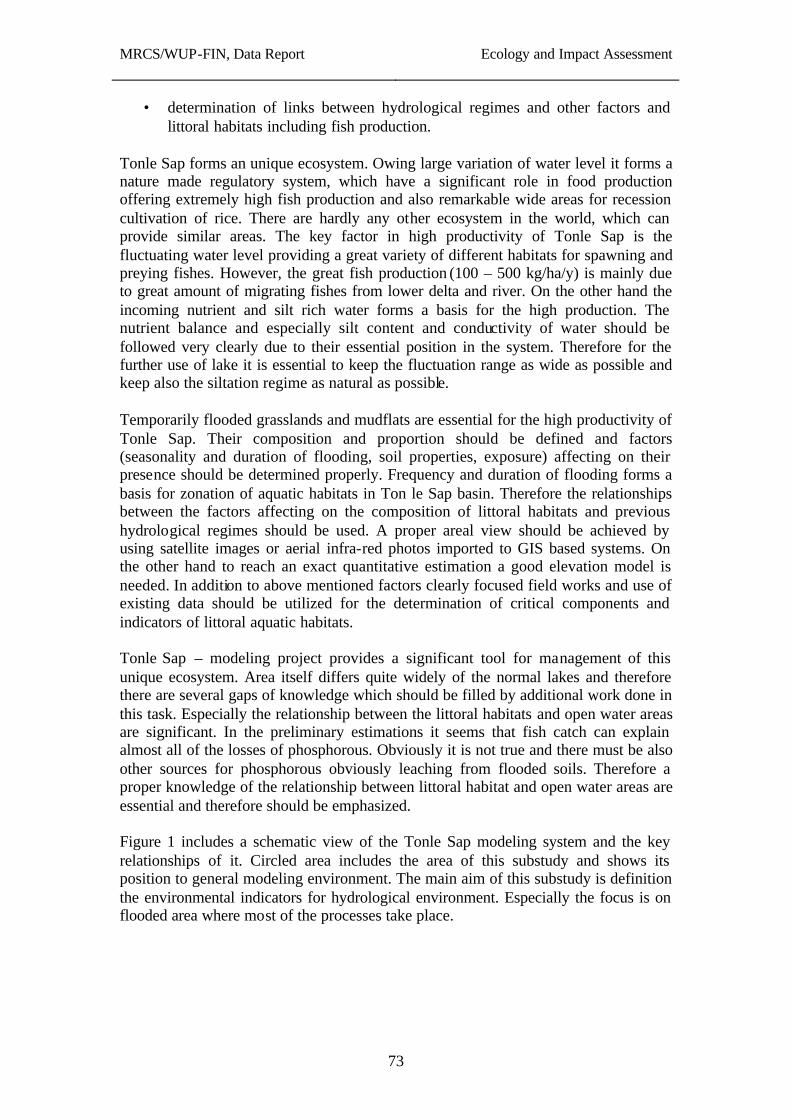
MRCS/WUP-FIN, Data Report
Ecology and Impact Assessment
73
• determination of links between hydrological regimes and other factors and littoral habitats including fish production.
Tonle Sap forms an unique ecosystem. Owing large variation of water level it forms a nature made regulatory system, which have a significant role in food production offering extremely high fish production and also remarkable wide areas for recession cultivation of rice. There are hardly any other ecosystem in the world, which can provide similar areas. The key factor in high productivity of Tonle Sap is the fluctuating water level providing a great variety of different habitats for spawning and preying fishes. However, the great fish production (100 – 500 kg/ha/y) is mainly due to great amount of migrating fishes from lower delta and river. On the other hand the incoming nutrient and silt rich water forms a basis for the high production. The nutrient balance and especially silt content and conductivity of water should be followed very clearly due to their essential position in the system. Therefore for the further use of lake it is essential to keep the fluctuation range as wide as possible and keep also the siltation regime as natural as possible. Temporarily flooded grasslands and mudflats are essential for the high productivity of Tonle Sap. Their composition and proportion should be defined and factors (seasonality and duration of flooding, soil properties, exposure) affecting on their presence should be determined properly. Frequency and duration of flooding forms a basis for zonation of aquatic habitats in Ton le Sap basin. Therefore the relationships between the factors affecting on the composition of littoral habitats and previous hydrological regimes should be used. A proper areal view should be achieved by using satellite images or aerial infra-red photos imported to GIS based systems. On the other hand to reach an exact quantitative estimation a good elevation model is needed. In addition to above mentioned factors clearly focused field works and use of existing data should be utilized for the determination of critical components and indicators of littoral aquatic habitats. Tonle Sap – modeling project provides a significant tool for management of this unique ecosystem. Area itself differs quite widely of the normal lakes and therefore there are several gaps of knowledge which should be filled by additional work done in this task. Especially the relationship between the littoral habitats and open water areas are significant. In the preliminary estimations it seems that fish catch can explain almost all of the losses of phosphorous. Obviously it is not true and there must be also other sources for phosphorous obviously leaching from flooded soils. Therefore a proper knowledge of the relationship between littoral habitat and open water areas are essential and therefore should be emphasized. Figure 1 includes a schematic view of the Tonle Sap modeling system and the key relationships of it. Circled area includes the area of this substudy and shows its position to general modeling environment. The main aim of this substudy is definition the environmental indicators for hydrological environment. Especially the focus is on flooded area where most of the processes take place.
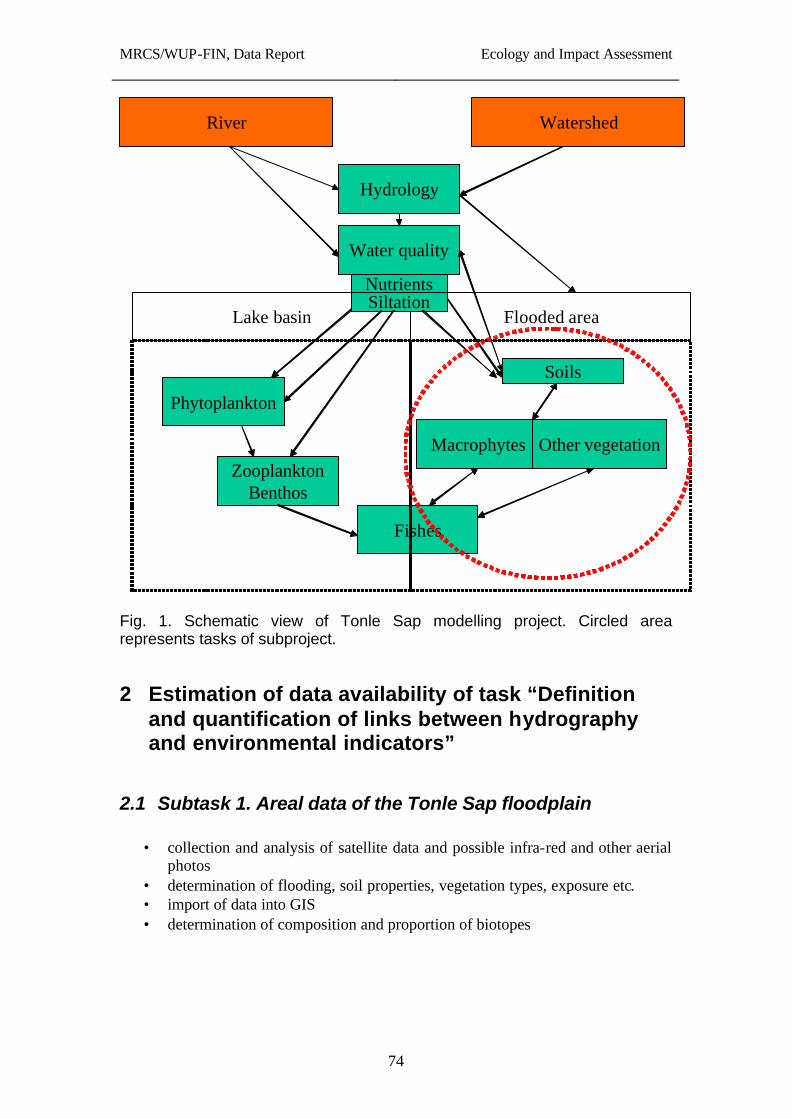
MRCS/WUP-FIN, Data Report
Ecology and Impact Assessment
74
Lake basin
Water quality
Flooded area
Watershed
Hydrology
River
Phytoplankton
ZooplanktonBenthos
Fishes
Macrophytes
Soils
Other vegetation
NutrientsSiltation
Other vegetation
Fig. 1. Schematic view of Tonle Sap modelling project. Circled area represents tasks of subproject.
2 Estimation of data availability of task “Definition and quantification of links between hydrography and environmental indicators”
2.1 Subtask 1. Areal data of the Tonle Sap floodplain
• collection and analysis of satellite data and possible infra-red and other aerial photos
• determination of flooding, soil properties, vegetation types, exposure etc. • import of data into GIS • determination of composition and proportion of biotopes
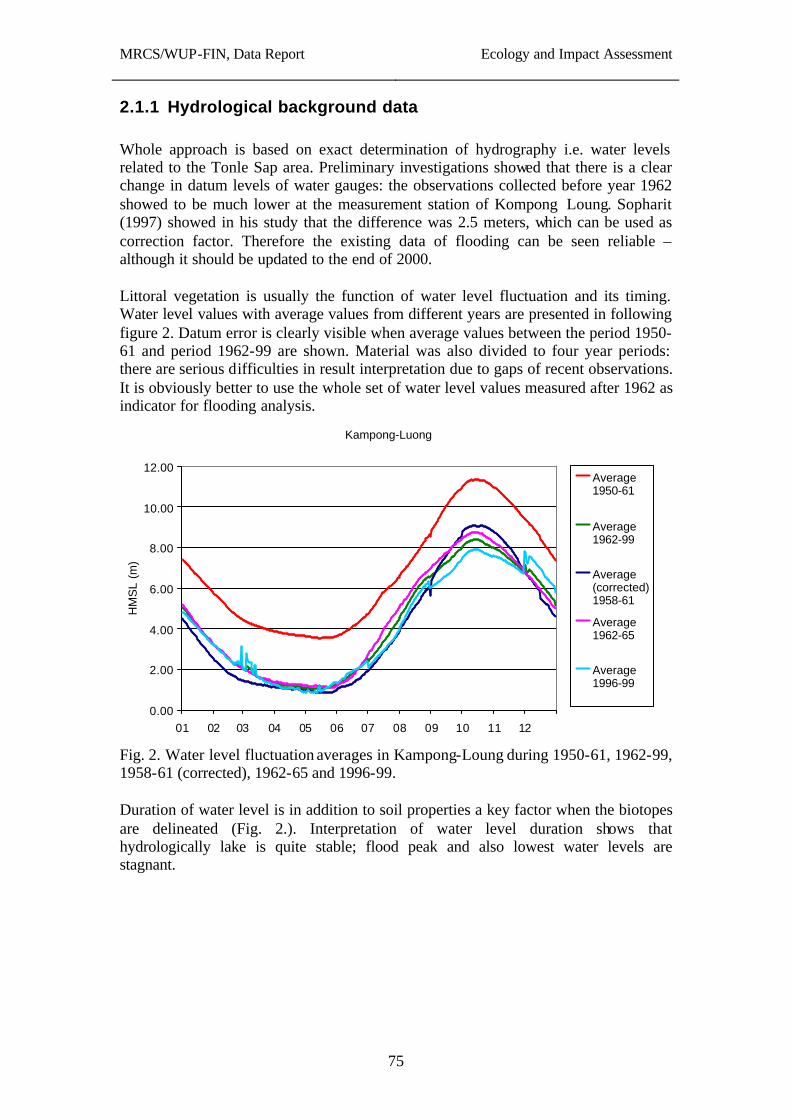
MRCS/WUP-FIN, Data Report
Ecology and Impact Assessment
75
2.1.1 Hydrological background data Whole approach is based on exact determination of hydrography i.e. water levels related to the Tonle Sap area. Preliminary investigations showed that there is a clear change in datum levels of water gauges: the observations collected before year 1962 showed to be much lower at the measurement station of Kompong Loung. Sopharit (1997) showed in his study that the difference was 2.5 meters, which can be used as correction factor. Therefore the existing data of flooding can be seen reliable – although it should be updated to the end of 2000. Littoral vegetation is usually the function of water level fluctuation and its timing. Water level values with average values from different years are presented in following figure 2. Datum error is clearly visible when average values between the period 1950-61 and period 1962-99 are shown. Material was also divided to four year periods: there are serious difficulties in result interpretation due to gaps of recent observations. It is obviously better to use the whole set of water level values measured after 1962 as indicator for flooding analysis.
Kampong-Luong
0.00
2.00
4.00
6.00
8.00
10.00
12.00
01 02 03 04 05 06 07 08 09 10 11 12
HM
SL
(m)
Average1950-61
Average1962-99
Average(corrected)1958-61
Average1962-65
Average1996-99
Fig. 2. Water level fluctuation averages in Kampong-Loung during 1950-61, 1962-99, 1958-61 (corrected), 1962-65 and 1996-99. Duration of water level is in addition to soil properties a key factor when the biotopes are delineated (Fig. 2.). Interpretation of water level duration shows that hydrologically lake is quite stable; flood peak and also lowest water levels are stagnant.
MRCS/WUP-FIN, Data Report
Ecology and Impact Assessment
76
0
1
2
3
4
5
6
7
8
9
10
0 10 20 30 40 50 60 70 80 90 100
Duration (%)
(m)
1962-99
Fig. 3. Water level duration during 1962-99 in Kampong-Loung. Some hydrological parameters are collected in Table 1. There is a minor tendency that average low levels are rising, but highest flood peaks are cut of. On the other hand the rising of the flood starts a bit earlier but the timing of end of the flood is unchangeable. Table 1. Average values of water levels in Tonle Sap in 1950-61 and in 1962-99. * values are corrected by -2.5 metres. 1950-61* 1962-99 HW 10.49 9.36 MHW 8.78 8.29 MW 4.13 4.57 MNW 1.02 1.43 NW 0.70 0.61 Beg. of flood 15-May 8-May Stop of flood 15-Oct 14-Oct
2.1.2 Areal background data There are several relative good satellite interpretations of the Tonle Sap area. Japan International Cooperation Agency (JICA) has prepared a detailed map of the area based on SPOT images acquired in from November 1996 to March 1997. Aerial photos from 1992 to 1995 and Landsat images of 1996 were used for vegetation/land use interpretation. This project has produced a map (1:100 000), where area was divided to vegetation types such as flooded grassland, flooded shrub and flooded forests. This data is available also in digital format. In addition to above mentioned vegetation types a very detailed land use database exists also and available for modeling project. Example of the map is presented in following figure 4.
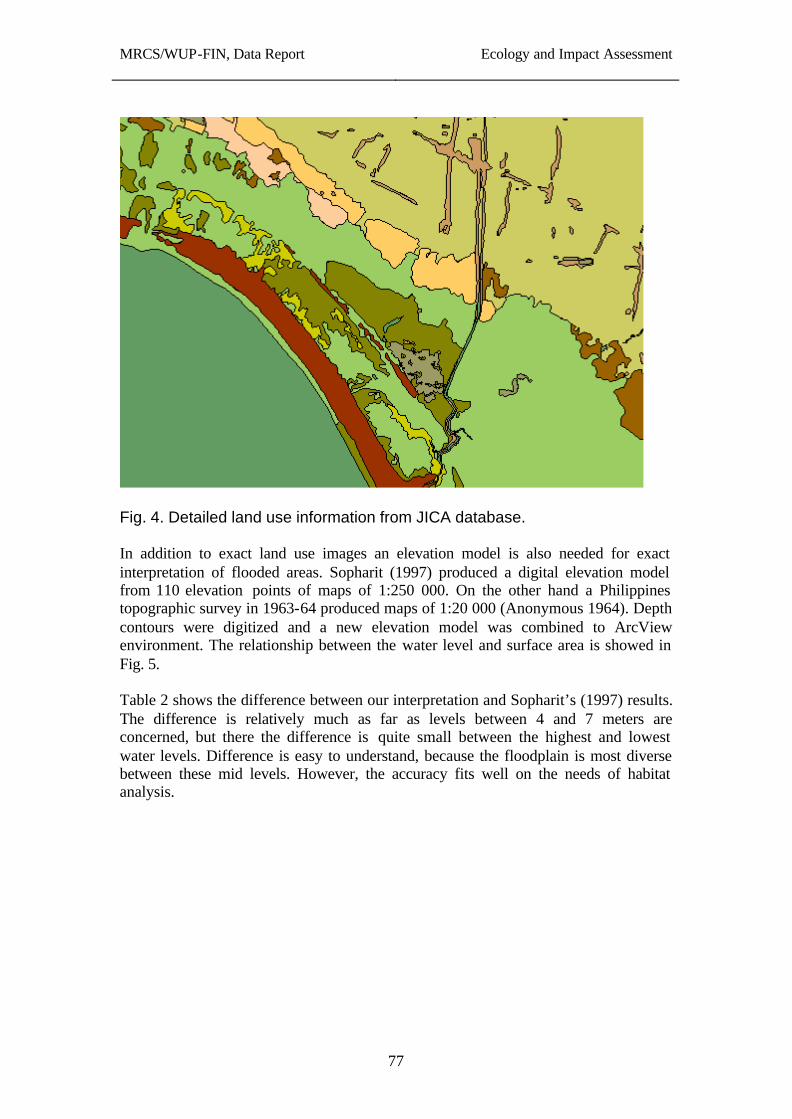
MRCS/WUP-FIN, Data Report
Ecology and Impact Assessment
77
Fig. 4. Detailed land use information from JICA database. In addition to exact land use images an elevation model is also needed for exact interpretation of flooded areas. Sopharit (1997) produced a digital elevation model from 110 elevation points of maps of 1:250 000. On the other hand a Philippines topographic survey in 1963-64 produced maps of 1:20 000 (Anonymous 1964). Depth contours were digitized and a new elevation model was combined to ArcView environment. The relationship between the water level and surface area is showed in Fig. 5. Table 2 shows the difference between our interpretation and Sopharit’s (1997) results. The difference is relatively much as far as levels between 4 and 7 meters are concerned, but there the difference is quite small between the highest and lowest water levels. Difference is easy to understand, because the floodplain is most diverse between these mid levels. However, the accuracy fits well on the needs of habitat analysis.
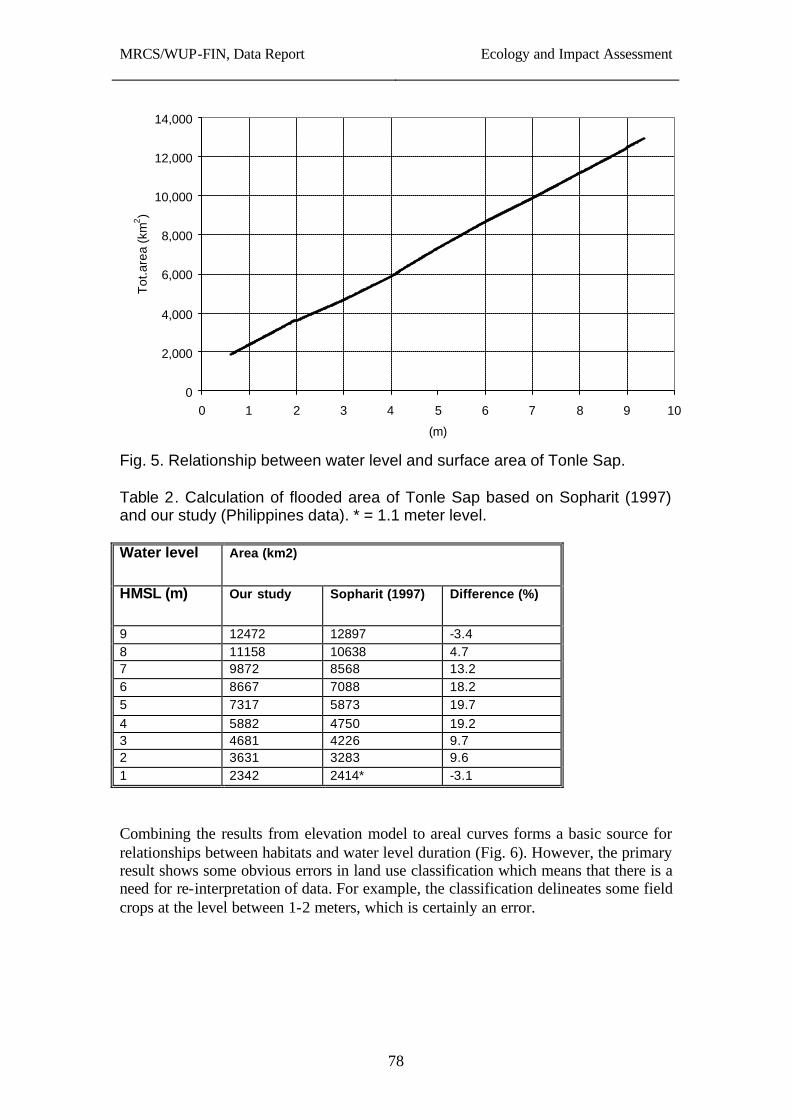
MRCS/WUP-FIN, Data Report
Ecology and Impact Assessment
78
0
2,000
4,000
6,000
8,000
10,000
12,000
14,000
0 1 2 3 4 5 6 7 8 9 10
(m)
Tot
.are
a (k
m2 )
Fig. 5. Relationship between water level and surface area of Tonle Sap. Table 2. Calculation of flooded area of Tonle Sap based on Sopharit (1997) and our study (Philippines data). * = 1.1 meter level. Water level Area (km2)
HMSL (m) Our study Sopharit (1997) Difference (%)
9 12472 12897 -3.4 8 11158 10638 4.7 7 9872 8568 13.2 6 8667 7088 18.2 5 7317 5873 19.7 4 5882 4750 19.2 3 4681 4226 9.7 2 3631 3283 9.6 1 2342 2414* -3.1
Combining the results from elevation model to areal curves forms a basic source for relationships between habitats and water level duration (Fig. 6). However, the primary result shows some obvious errors in land use classification which means that there is a need for re-interpretation of data. For example, the classification delineates some field crops at the level between 1-2 meters, which is certainly an error.
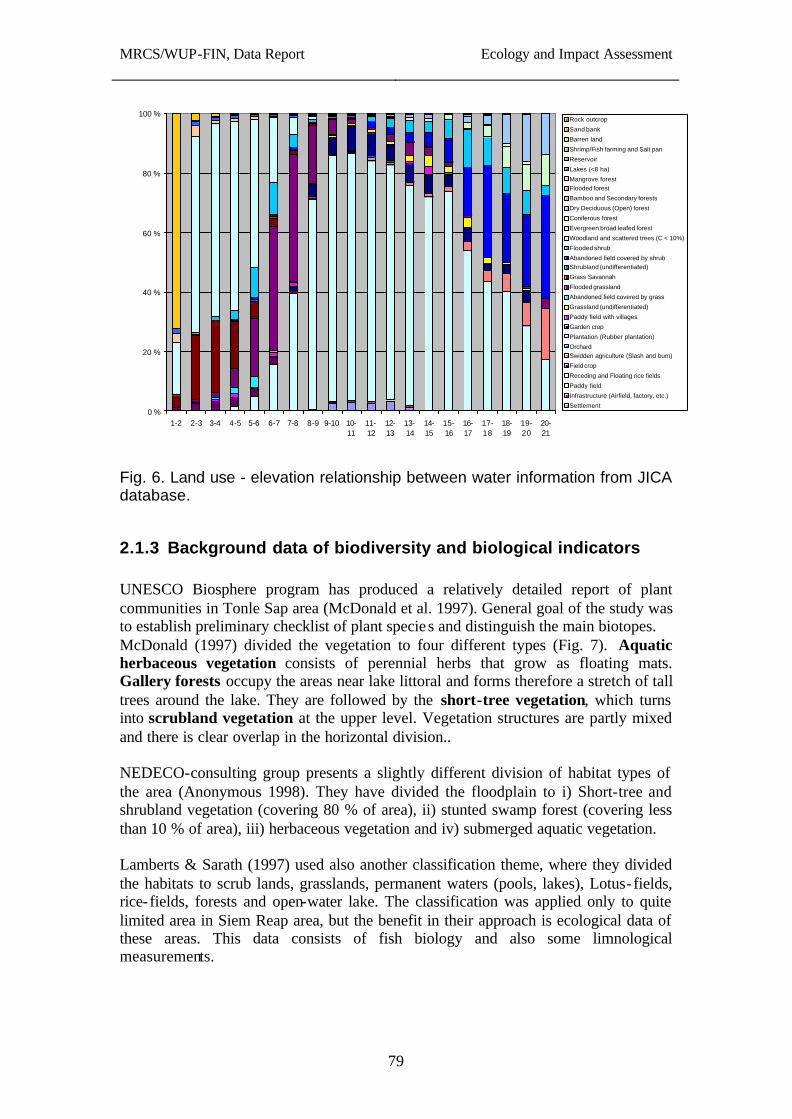
MRCS/WUP-FIN, Data Report
Ecology and Impact Assessment
79
0 %
20 %
40 %
60 %
80 %
100 %
1-2 2-3 3-4 4-5 5-6 6-7 7-8 8-9 9-10 10-11
11-12
12-13
13-14
14-15
15-16
16-17
17-18
18-19
19-20
20-21
Rock outcrop
Sand bank
Barren land
Shrimp/Fish farming and Salt pan
Reservoir
Lakes (<8 ha)
Mangrove forestFlooded forest
Bamboo and Secondary forests
Dry Deciduous (Open) forest
Coniferous forest
Evergreen broad leafed forest
Woodland and scattered trees (C < 10%)
Flooded shrub
Abandoned field covered by shrubShrubland (undifferentiated)
Grass Savannah
Flooded grassland
Abandoned field covered by grass
Grassland (undifferentiated)
Paddy field with villages
Garden crop
Plantation (Rubber plantation)
OrchardSwidden agriculture (Slash and burn)
Field crop
Receding and Floating rice fields
Paddy field
Infrastructure (Airfield, factory, etc.)
Settlement
Fig. 6. Land use - elevation relationship between water information from JICA database.
2.1.3 Background data of biodiversity and biological indicators UNESCO Biosphere program has produced a relatively detailed report of plant communities in Tonle Sap area (McDonald et al. 1997). General goal of the study was to establish preliminary checklist of plant specie s and distinguish the main biotopes. McDonald (1997) divided the vegetation to four different types (Fig. 7). Aquatic herbaceous vegetation consists of perennial herbs that grow as floating mats. Gallery forests occupy the areas near lake littoral and forms therefore a stretch of tall trees around the lake. They are followed by the short-tree vegetation, which turns into scrubland vegetation at the upper level. Vegetation structures are partly mixed and there is clear overlap in the horizontal division.. NEDECO-consulting group presents a slightly different division of habitat types of the area (Anonymous 1998). They have divided the floodplain to i) Short-tree and shrubland vegetation (covering 80 % of area), ii) stunted swamp forest (covering less than 10 % of area), iii) herbaceous vegetation and iv) submerged aquatic vegetation. Lamberts & Sarath (1997) used also another classification theme, where they divided the habitats to scrub lands, grasslands, permanent waters (pools, lakes), Lotus-fields, rice-fields, forests and open-water lake. The classification was applied only to quite limited area in Siem Reap area, but the benefit in their approach is ecological data of these areas. This data consists of fish biology and also some limnological measurements.
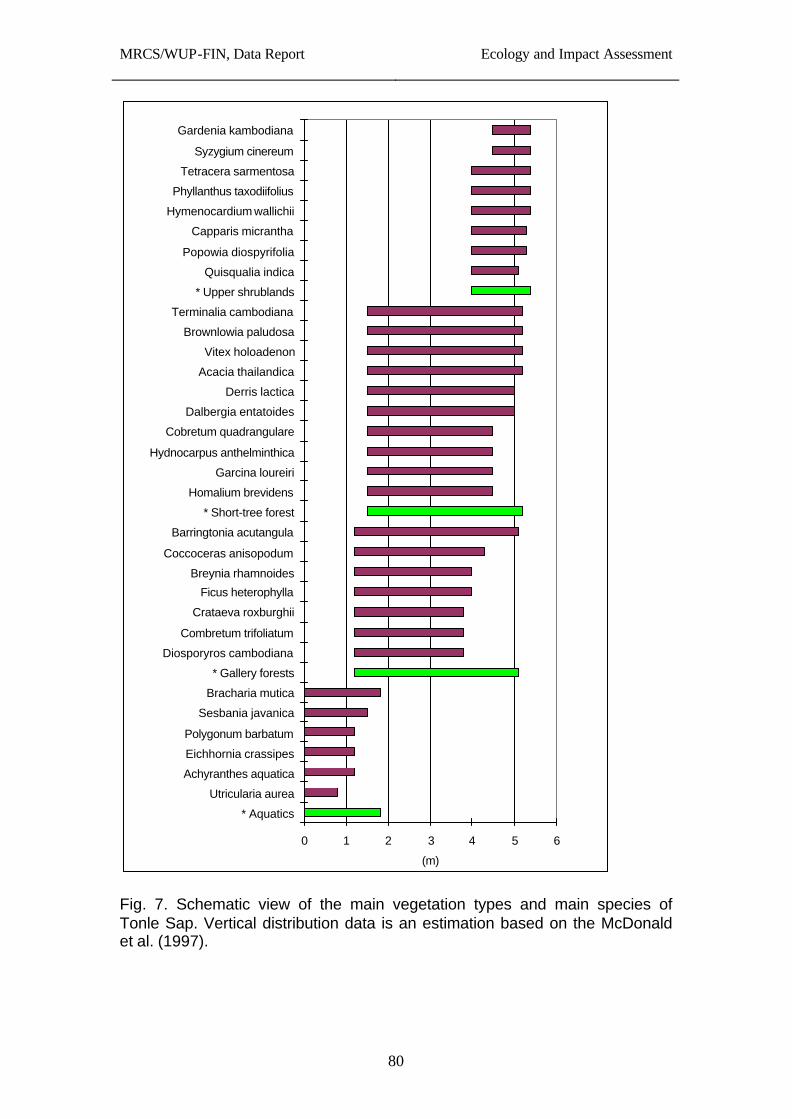
MRCS/WUP-FIN, Data Report
Ecology and Impact Assessment
80
0 1 2 3 4 5 6
* Aquatics
Utricularia aurea
Achyranthes aquatica
Eichhornia crassipes
Polygonum barbatum
Sesbania javanica
Bracharia mutica
* Gallery forests
Diosporyros cambodiana
Combretum trifoliatum
Crataeva roxburghii
Ficus heterophylla
Breynia rhamnoides
Coccoceras anisopodum
Barringtonia acutangula
* Short-tree forest
Homalium brevidens
Garcina loureiri
Hydnocarpus anthelminthica
Cobretum quadrangulare
Dalbergia entatoides
Derris lactica
Acacia thailandica
Vitex holoadenon
Brownlowia paludosa
Terminalia cambodiana
* Upper shrublands
Quisqualia indica
Popowia diospyrifolia
Capparis micrantha
Hymenocardium wallichii
Phyllanthus taxodiifolius
Tetracera sarmentosa
Syzygium cinereum
Gardenia kambodiana
(m)
Fig. 7. Schematic view of the main vegetation types and main species of Tonle Sap. Vertical distribution data is an estimation based on the McDonald et al. (1997).
MRCS/WUP-FIN, Data Report
Ecology and Impact Assessment
81
According to McDonalds et al. (1997) the whole floodpla in has a high biodiversity consisting more than 200 plant species. Surprisingly the diversity was lowest near the edge of the water and highest on the scrub lands. It seems that extend study of McDonalds et al. (1997) forms a good basis for all further works and is useful for habitat and indicator studies. Quite much effort should be focused on combination of these results to water level fluctuation regime, soil properties and land use schemes. There are also few older studies such as Rollet (1972) whose information should be added on the data, but obviously also some additional field studies should be done. These studies should be focused on the dry season, when all of the habitat types are visible. Additional aerial photos could be also useful for more exact determination of habitats. Aerial mapping done by FINMAP in January 1996 could offer suitable information of the factors. In addition to normal flora there exists also some invasive weeds in the area. Water hyacint (Eichornia crassipes) forms sometimes very dense floating mats, but disappears with drying very rapidly. Obviously also many fishes benefits of the fauna rich roots of Eichornia and therefore it cannot be seen as big trouble in the lake. On the other hand it can form a significant problem if for example the water level fluctuation is reduced. It is also a quite new incomer, Hirsch & Cheong (1996, ref. in McElwee & Horowitz 1999) could not found it in Lower Mekong basin, where it is now present at all places. Another harmful weed is Mimosa pigra, which hinders some fishery activities and even hurt fishes by spiky stems. This weed originated from Central-America has invaded to Australia and Thailand during 1970ies. It forms dense thickets and can also resist submersion. There are no clear view of its significance and therefore a rough estimation is included in additional study.
2.2 Subtask 2. Creating the links and indicators
• analysis and synthesis of the local people interviews in respect to the habitats and flood properties and their impact on fisheries
• determination of links between hydrological regimes and other factors and littoral habitats including fish production.
Tonle Sap – ecosystem forms a relatively stable ecosystem, which is however, easily affected by external disturbance. Most of the factors are somehow related to flooding and its timing – for example the flood peaks have been too early during last two years which has in turn disabled the growth of floating rice, which is always sawed and there fore sensitive for early flooding. It should be noted that whole ecosystem is largely affected already by human activities and therefore pristine environment is difficult to find (McDonald et al. 1997). Definition of the indicators needs some additional knowledge of the relationships between the factors and their effects on the habitats. As most of the habitats relate clearly on the use of the lake, the indicators should be also as pragmatic as possible. Habitats which are clearly suitable for fish biotopes forms one of the best indicators
MRCS/WUP-FIN, Data Report
Ecology and Impact Assessment
82
Lamberts & Sarath (1997) study provides a basic information of the habitats and their distribution on the lake although the results are geographically limited only to Kampong Kleang and Chong Kneas areas. They found that the highest diversity of fish species exist at the crass land and rice field areas. Also the catch was highest near the grass lands, but flooded forests played also as significant role. One of the most common fish species is Trey Riel (Henicrhynchus sp.), which is according to stomach content analysis eating mainly detritus and plant remnants. Grass lands and bushy areas form quite suitable habitats for such a fish. They are obviously also playing a significant role in the nutrient circulation of such a floodplain. Lamberts & Sarath (1997) divided functionally all biotypes according to depth gradient to the following four zones. Inundated rice fields are shallow zone presenting highly productive environment with high amount of nutrients and re-suspended sediments. Main food resources are obviously phyto- and zooplankton. Scrub lands are located at lower elevation and having rather deep water column and owns lower turbidity. Obviously periphytic growth of algae is much larger and plays important role in nutrient cycling. Forests present most stable environment with higher transparency and phytoplankton production. They plays also quite important role in wave protection purposes. Open lake represents quite homogenous environment, but the conditions vary largely depending on water level in lake. Production is mainly consisting of phytoplankton, zooplankton and zoobenthos. Their main conclusion was that the most suitable way to protect the environment is to preserve whole variety of biotopes. Despite of relatively preliminary study of Lamberts & Sarath (1997) there is still a need for additional data collection. Most of the data was based on experimental gill nets and therefore it cannot express any details of the main spawning and feeding habitats of the fishes. In the socio-economic survey a special questionary will be done during spring 2001. Some questions can be related to the spawning and feeding habitats of different species as well as the properties of main fishing areas. Determination of links and indicators forms obviously the most difficult part of the work. In addition to existing data of Tonle Sap basin a literature survey of other similar ecotypes should be done. There are quite large dataset of Senegal river ecosystem where a similar floodplain lake Lac de Guiers is significantly modified by cutting the flood and damming the river by two large dams (Pieterse et al. 2001). As a consequence large areas are covered by thick helophyte vegetation and aquatic weeds have increased in alarming rate. Determination of indicators focuses finally on submodel, which can be used as a part of the Tonle Sap model (Fig. 1). It describes relationship between flood plain habitats and water level as well as changes in land use parameters. Input values are received from socio-economic scenarios as well as hydrological changes due to global environmental change via Tonle Sap model. On the other hand as a feedback it provides a coarse estimation of the impacts of changed habitats on e.g. loading and other parameters used in model. Schematic view of the process is presented in Fig. 8.
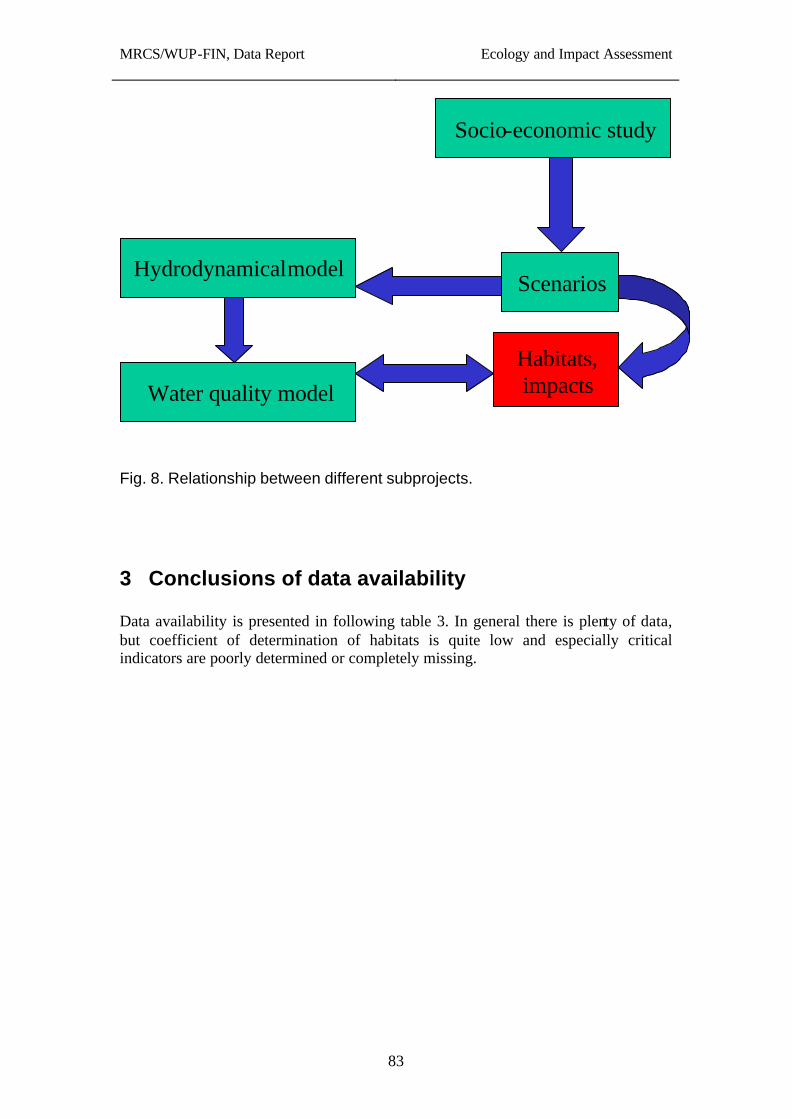
MRCS/WUP-FIN, Data Report
Ecology and Impact Assessment
83
Fig. 8. Relationship between different subprojects.
3 Conclusions of data availability Data availability is presented in following table 3. In general there is plenty of data, but coefficient of determination of habitats is quite low and especially critical indicators are poorly determined or completely missing.
Water quality model
Hydrodynamical model
Socio -economic study
Scenarios
Habitats, impacts

MRCS/WUP-FIN, Data Report
Ecology and Impact Assessment
84
Table 3. Summary of data availability of subprojects.
Task Data Gap Additional data needs
Hydrology ? Water level data is moderate
? Missing data of water levels 1966-95
? None (2000-2001- data
Areal information
? JICA classification is adequate ? Elevation model is good
? Misinter-pretations
? Aerial (FINMAP) images
Biodiversity ? McDonalds report is adequate
? Species-elevation relationship is unknown
? Satellite image interpretation ? F ield works
Habitats ? FAO reports are moderate
? Relationship between water level and habitats is disturbed by human impact
? Satellite image interpretation ? F ield works ? Questionnaires
Indicators and links
? Present information limited
? No available indicator system
? Literature review
4 Work plan and schedule Work plan as well as preliminary schedule for the subproject is collected together with schedule in table 4. In addition tasks primarily serving subproject some additional works will be done e.g. in littoral loading calculations. Table 4. Work plan and schedule of subprojects. Task
4.1.1.1.1 Methods Timing
Background data analysis
- literature review - expert interviews
Nov 2001
Biodiversity and habitats
- aerial photo interpretation - field research - interview - reporting
March 2001 April 2001 May 2001
Indicators and links - water level habitats relationship - land use habitats relationship - reporting
May 2001 October 2001
Scenarios - hydrological, limnological and land use scenarios
- reporting
October 2001-
MRCS/WUP-FIN, Data Report
Ecology and Impact Assessment
85
5 Literature Anonymous 1998. Sectoral Studies Environment in the Tonle Sap area. Final report Volume 2.Natural resources-based development strategy for the Tonle Sap area, Cambodia. CNMC, NEDECO, MIDAS Agronomics. Anonymous 1964. Final Report. Contract Between the Committee for Coordination of Investigations of the Lower Mekong Basin and Certeza Surveying Co., Inc. Item C-Tonle Sap Area Strip Mapping at 1:20000 Scale Approximately Fourteen Hundred (1400) linear kilometers of Strip Maps. 23 p. + app. Descy, J.P. 1997. Report on Limnology Consultancy (02/11/97-16/11/97). Draft. FAO Project GCP/CMB/002/BEL. Hirsch, P. & Cheong, C. 1996. Natural Resource Management in the Mekong River Basin: Perspectives for Australian Development Cooperation – Final Overview Report to AusAID. Sydney,: University of Sydney. Lamberts, D. & Sarath, T. 1997. Baseline Line Information on the Ecology of the Fish and the Habitats of the Flood Area of the Tonle Sap Lake in Siem Reap Province. Participatory Natural Resource Management in the Tonle Sap Region. FAO. 88 pp. McDonald, J.A., Bunnat, P., Virak, P. & Bunton, L. 1997. Plant communities of the Tonle Sap Floodpla in. Final report in contribution to the nomination of Tonle Sap as a Biosphere Reserve for UNESCO’s Man in the Bioshere Program. 30 pages, 10 maps, 6 figures, 6 app. McElwee, P. and Horowitz, M.M. 1999. Environment and Society in the Lower Mekong Basin: a Landscaping Review. IDA Working Paper 99, Mekong River Basin Research and Capacity Building Initiative, Oxfam America SEA 15 / 97-99. Pieterse, A.H., Hellsten, S.K., Janauer, G.A., Dieme, C., Diouf, S. & N. Exler (2001): Management of Aquatic Vegetation on the Lower Senegal River Basin. Verh. Internat. Verein. Limnol. 28 (accepted). Rollet, B. 1972. La vegetation du Cambodge, du Laos et du Vietnam, 27 vols., Musee Nationale D’Histoire Naturelle, Paris. Sopharith, T. 1997. Hydrological studies of the Tonle Sap/Great lake area. Prepared for the Project: CMB\95\003 “Natural Resources-Based Development Strategy for the Tonle Sap Area. 32 p. + 2 app.
MRCS/WUP-FIN, Data Report
Data collection report and plan
86
SOCIO-ECONOMICS
1 Introduction
1.1 Background Environmental and socioeconomic impacts of water resources management are tightly interwoven. This is particularly true in conditions such as in the surroundings of the Tonle Sap Lake, Cambodia, where the livelihood is mainly based on subsistence fisheries and agriculture, and poverty is widespread. The average income level in that area is US$ 150 per year, which is only 41% of the international poverty line of US$ 1 a day. Therefore environmental and socioeconomic impact analyses must meet in a fairly basic level. It is not always unambiguously clear whether environmental degradation is a root cause for the deterioration of the living conditions of the rural communities that live in poverty, or vice versa. In most cases, these issues constitute a vicious circle, which needs to be analysed in a multidisciplinary and holistic manner. The methodology used for this task—Bayesian Causal Networks—is based on the systematic analysis of causal interconnections in a complex environmental-socioeconomic systems. The objective is to assess risks to various components of the environmental and social system under concern, as consequences of different policy strategies under evaluation. The social system components consist typically of stakeholders, i.e., different communties and groupings of people that are influenced by the implementation of policies in the studied geographical area. It is not rare that their aspirations and interests are in conflict with one another. The environmental components, in turn, are issues such as eutrophication level of a lake, vegetation around a lake, land degradation, and so forth, issues which are under specific analysis in other phases of the WUP-FIN project. The results of such specific studies are condensed in a risk analysis framework, and a multidisciplinary analysis is performed, that reveals the major risks, uncertainties, mismatches of information, and opportunities to find win-win solutions among the various stakeholders and the environment. The experience of the team in this subtask stems from various, complex analyses of socioeconomic and environmental systems, including Baltic salmon management, nationwide climatic change impact assessment of Finland, various lake management studies, and the water policy evaluation of the Senegal River Basin. The latter one is used here as an example.
MRCS/WUP-FIN, Data Report
Data collection report and plan
87
The local populations are those who feel most basically the impacts of any changes within a watershed. The conventional wisdom is an important source of information in planning water management policies. At the same time, the level of awareness of those communities on water-related issues such as spreading of diseases, environmentally sound waste management, erosion control, risks of overfishing, etc., can be very superficial and biased. The involvement and analysis of local communities to policy analysis and policy making is important everywhere, but particularly momentous albeit too often ignored in conditions where public education has shortcomings, and where informal institutions and traditions govern more than the institutions of a modern society do. Such is the case in notable parts of the rural Mekong Basin, in the surroundings of Tonle Sap lake as well. The socioeconomic and environmental analysis will be based—besides up-to-date empirical data analyses and environmental models—on surveys of the components of the livelihood of the local people. These surveys will be focused on the fisheries communities in the immediate vicinity of the lake.
1.2 Objectives The objectives of this data report are to answer to the following questions:
1) What are the main issues that should be included in the socioeconomic analysis of the basin of the Tonle Sap lake?
2) What information and data exists and/or is needed for those variables from
a. Literature b. Other components of WUP-FIN c. Local interviews?
With these questions in mind, a brief geographic definition of the target region is presented first. Then, an overview of the research methodology is presented. A set of initial scenarios follow. It must be emphasized that these scenarios are not final ones, but serve solely as a starting point for the study design. They must be iterated and revised at later stages of WUP-FIN to comply fully with the rest of the project. After that, the issues planned to be included in the analysis are presented item by item. In that context, a brief literature review has been made for each of them. Accordingly, data and information needs form other WUP-FIN components as well as from the community interviews are presented. A preliminary plan for community interviews is presented and an example case study from the Senegal River is summarized as an example of the modelling approach to be used in this part of WUP-FIN.
MRCS/WUP-FIN, Data Report
Data collection report and plan
88
1.3 Target region This analysis focuses on the Tonle Sap lake and its flood plain. This area is usually understood to be bordered by the National Roads 5 and 6, and called subsequently the Tonle Sap lake and its surroundings. In addition, this analysis gives a perspective to the whole basin of the Tonle Sap lake (excluding the Mekong River). This area is called the Tonle Sap Basin (Figure 1). Some comparison is additionally made to the whole nation, as well as some neighbouring countries. The population density map of Cambodia is very illustrative in his context.
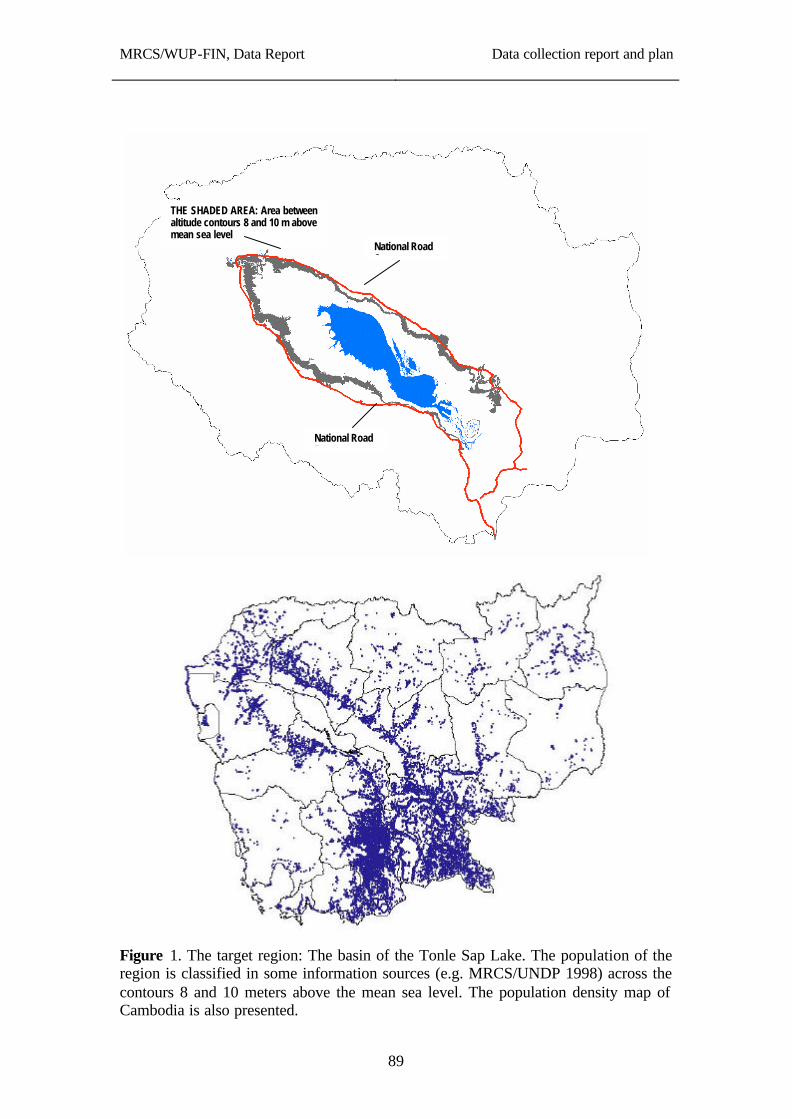
MRCS/WUP-FIN, Data Report
Data collection report and plan
89
Figure 1. The target region: The basin of the Tonle Sap Lake. The population of the region is classified in some information sources (e.g. MRCS/UNDP 1998) across the contours 8 and 10 meters above the mean sea level. The population density map of Cambodia is also presented.
National Road 6
National Road 5
THE SHADED AREA: Area between altitude contours 8 and 10 m above mean sea level
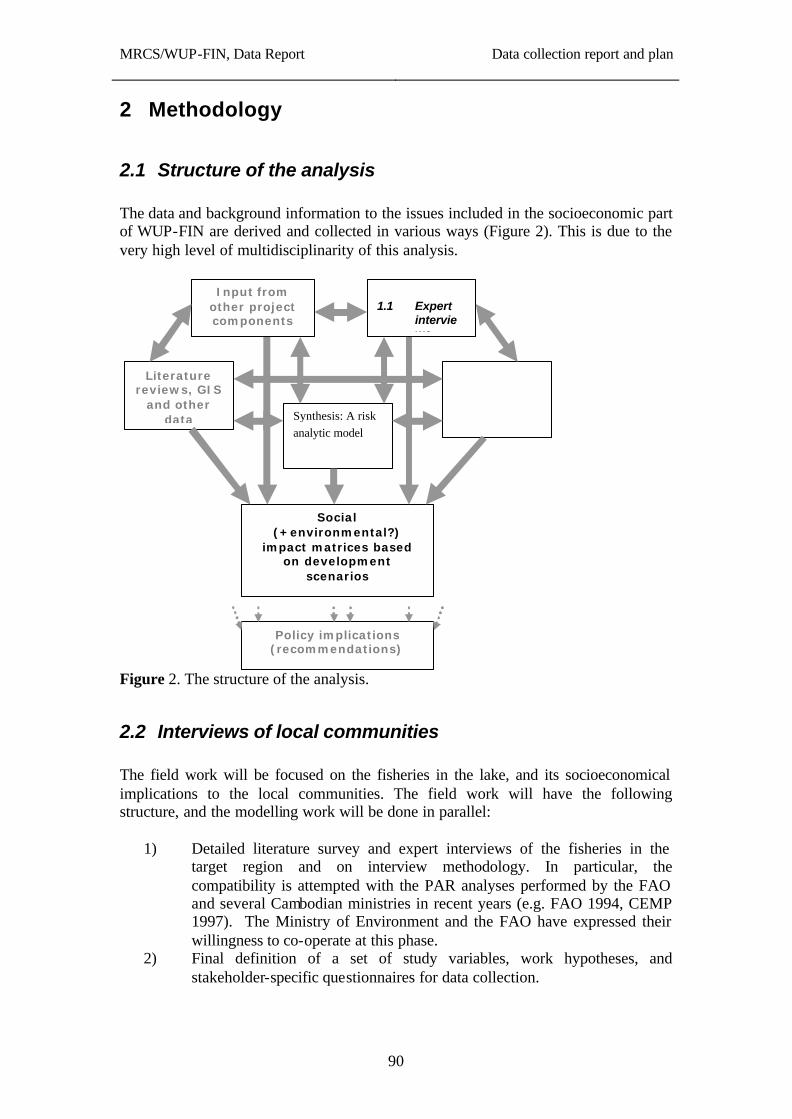
MRCS/WUP-FIN, Data Report
Data collection report and plan
90
2 Methodology
2.1 Structure of the analysis The data and background information to the issues included in the socioeconomic part of WUP-FIN are derived and collected in various ways (Figure 2). This is due to the very high level of multidisciplinarity of this analysis.
Figure 2. The structure of the analysis.
2.2 Interviews of local communities The field work will be focused on the fisheries in the lake, and its socioeconomical implications to the local communities. The field work will have the following structure, and the modelling work will be done in parallel:
1) Detailed literature survey and expert interviews of the fisheries in the target region and on interview methodology. In particular, the compatibility is attempted with the PAR analyses performed by the FAO and several Cambodian ministries in recent years (e.g. FAO 1994, CEMP 1997). The Ministry of Environment and the FAO have expressed their willingness to co-operate at this phase.
2) Final definition of a set of study variables, work hypotheses, and stakeholder-specific questionnaires for data collection.
Literature reviews, GIS
and other data
Social (+environmental?)
impact matrices based on development
scenarios
Synthesis: A risk analytic model
1.1 Expert interviews
Input from other project components
Policy implications (recommendations)
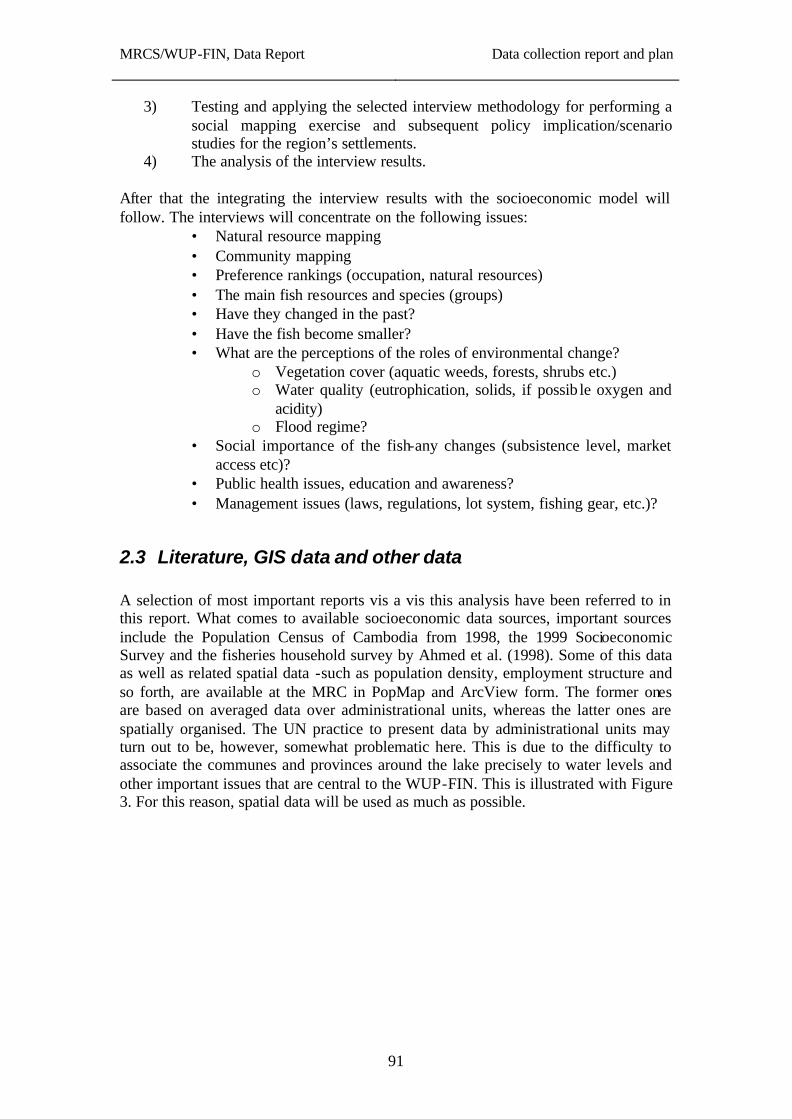
MRCS/WUP-FIN, Data Report
Data collection report and plan
91
3) Testing and applying the selected interview methodology for performing a social mapping exercise and subsequent policy implication/scenario studies for the region’s settlements.
4) The analysis of the interview results. After that the integrating the interview results with the socioeconomic model will follow. The interviews will concentrate on the following issues:
• Natural resource mapping • Community mapping • Preference rankings (occupation, natural resources) • The main fish resources and species (groups) • Have they changed in the past? • Have the fish become smaller? • What are the perceptions of the roles of environmental change?
o Vegetation cover (aquatic weeds, forests, shrubs etc.) o Water quality (eutrophication, solids, if possib le oxygen and
acidity) o Flood regime?
• Social importance of the fish-any changes (subsistence level, market access etc)?
• Public health issues, education and awareness? • Management issues (laws, regulations, lot system, fishing gear, etc.)?
2.3 Literature, GIS data and other data A selection of most important reports vis a vis this analysis have been referred to in this report. What comes to available socioeconomic data sources, important sources include the Population Census of Cambodia from 1998, the 1999 Socioeconomic Survey and the fisheries household survey by Ahmed et al. (1998). Some of this data as well as related spatial data -such as population density, employment structure and so forth, are available at the MRC in PopMap and ArcView form. The former ones are based on averaged data over administrational units, whereas the latter ones are spatially organised. The UN practice to present data by administrational units may turn out to be, however, somewhat problematic here. This is due to the difficulty to associate the communes and provinces around the lake precisely to water levels and other important issues that are central to the WUP-FIN. This is illustrated with Figure 3. For this reason, spatial data will be used as much as possible.
MRCS/WUP-FIN, Data Report
Data collection report and plan
92
Figure 3. Sample PopMap (UN 1999) data for Cambodia: percentage of farmers of labour force.
2.4 Modelling The different management options and their effects on various stakeholders will be examined by using a methodology based on the Bayesian causal network approach. In order to analyse systematically complex, integrated and multidisciplinary problems such as the environmental and socioeconomic impacts of water resources management in the Mekong River Basin, particularly in the basin of the Tonle Sap lake, a mathematical model is useful. The proposed approach enables systematic analysis of the big number of highly uncertain and interconnected variables, which traditionally belong to the domain of various scientific disciplines. The model can be used as a tool in understand ing scattered, scarce, inconsistent, and subjective information by making it more transparent, causally structured, consistent and communicative (Varis 1998). The focus is on a probabilistic, risk-analytic way of interconnecting semi-qualitatively defined variables, which are expressed in relative scales. Attributes such as small increase, large decline, etc., and characterizations of the level of connaissance of these expected tendencies are used. Each variable can be linked with any other one. In mathematical terms, this connection is a conditional probability distribution.
MRCS/WUP-FIN, Data Report
Data collection report and plan
93
2.5 An example case study: Management model for the Senegal River
As an illustration of the modelling methodology used, an example case study of the management of the Senegal River is summarised. The study is documented in detail by Varis and Lahtela (2001). Senegal River is a 1,800 km long lifeline in the Sahel region in West Africa shared by four nations: Guinea, Mali, Mauritania, and Senegal. The rainy uplands of Guinea are the source of a major part of the river water, which is then conveyed through the lowlands, which become increasingly arid towards the mouth of the river. The river and the surrounding valley have supported its population during centuries rather reasonably taken into account the harsh and highly variable climatic conditions. The traditional livelihood methods have proven to be successful. However, the history is rich with dry climatic periods, which have forced people to leave the valley, caused mass starvation and conflicts. The last few decades have seen an augmentation of various problems to this fragile river valley. Severe droughts have hit the region, the population growth rate has been extreme, economy has declined, food security has been instable, and consequently, people have emigrated in masses, mainly to the mushrooming cities such as Dakar and Nouakchott. Since the last three decades the river has been seen as a means to enhance the national economies of its member states. An attempt to food self-sufficiency boosted by the problem of feeding the growing urban population and the possibility of future droughts are the major driving forces for national and international organisations. Large-scale schemes, i.e. modernizing agriculture, hydropower generation, and enabling navigation are listed as the major means to support such attempt. So far the success of these has been flimsy and mostly negative. At the national level the development is strongly driven by the proneness to drought and consequently food crisis. An attempt to hinder the human suffering in case of renewable drought is to modernise the agricultural sector, e.g. by expanding irrigated agriculture. This kind of development has been strongly supported along the river valley and especially in Senegal, where the complementary use of modern technology over rural peasantry is seen as the biggest means to overall economic growth. However, the action of modernisation is politically volatile, and the risk of disintegrating the old, traditional social patterns is present. The purpose of the modelling analysis was to identify the main variables along the Senegal River and carry out a systematic stakeholder analysis on a set of key policy options along the lines of the above question. Figure 4 shows the model variables and some of the interconnections between those variables.
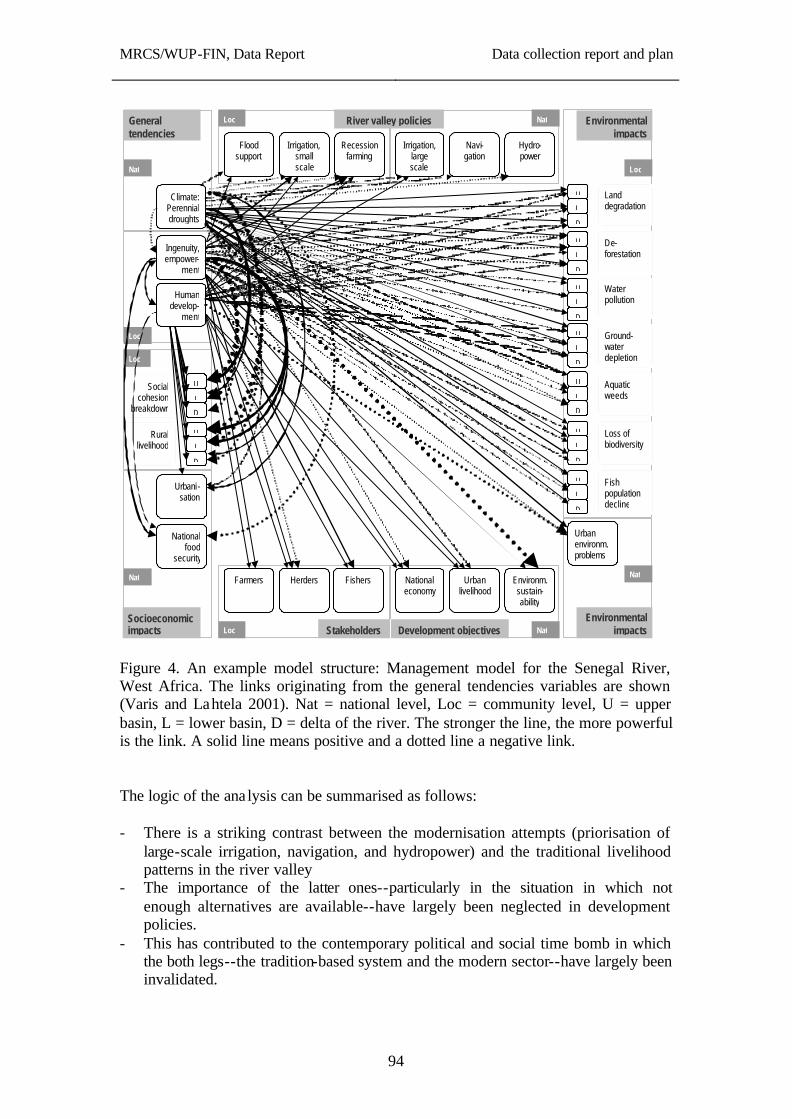
MRCS/WUP-FIN, Data Report
Data collection report and plan
94
Nat
General tendencies
Human develop-
ment
Ingenuity, empower-
ment
Climate: Perennial droughts
Flood support
Irrigation, small scale
Recession farming
Irrigation, large scale
Navi-gation
Hydro- power
Environm. sustain-ability
Urban livelihood
National economy
Fishers Herders Farmers
National food
security
Urbani-sation
Rural livelihood
U
D
L
Social cohesion
breakdown
U
D
L
Loc
Loc
Loc
Nat
Nat
Socioeconomic impacts
River valley policies
Stakeholders Loc Nat Development objectives
Land degradation
U
D
L
De-forestation
U
D
L
Water pollution
U
D
L
Ground- water depletion
U
D
L
Aquatic weeds
U
D
L
Loss of biodiversity
U
D
L
Fish population decline
U
D
L
Urban environm. problems
Loc
Nat
Environmental impacts
Environmental impacts
Figure 4. An example model structure: Management model for the Senegal River, West Africa. The links originating from the general tendencies variables are shown (Varis and Lahtela 2001). Nat = national level, Loc = community level, U = upper basin, L = lower basin, D = delta of the river. The stronger the line, the more powerful is the link. A solid line means positive and a dotted line a negative link. The logic of the ana lysis can be summarised as follows: - There is a striking contrast between the modernisation attempts (priorisation of
large-scale irrigation, navigation, and hydropower) and the traditional livelihood patterns in the river valley
- The importance of the latter ones--particularly in the situation in which not enough alternatives are available--have largely been neglected in development policies.
- This has contributed to the contemporary political and social time bomb in which the both legs--the tradition-based system and the modern sector--have largely been invalidated.
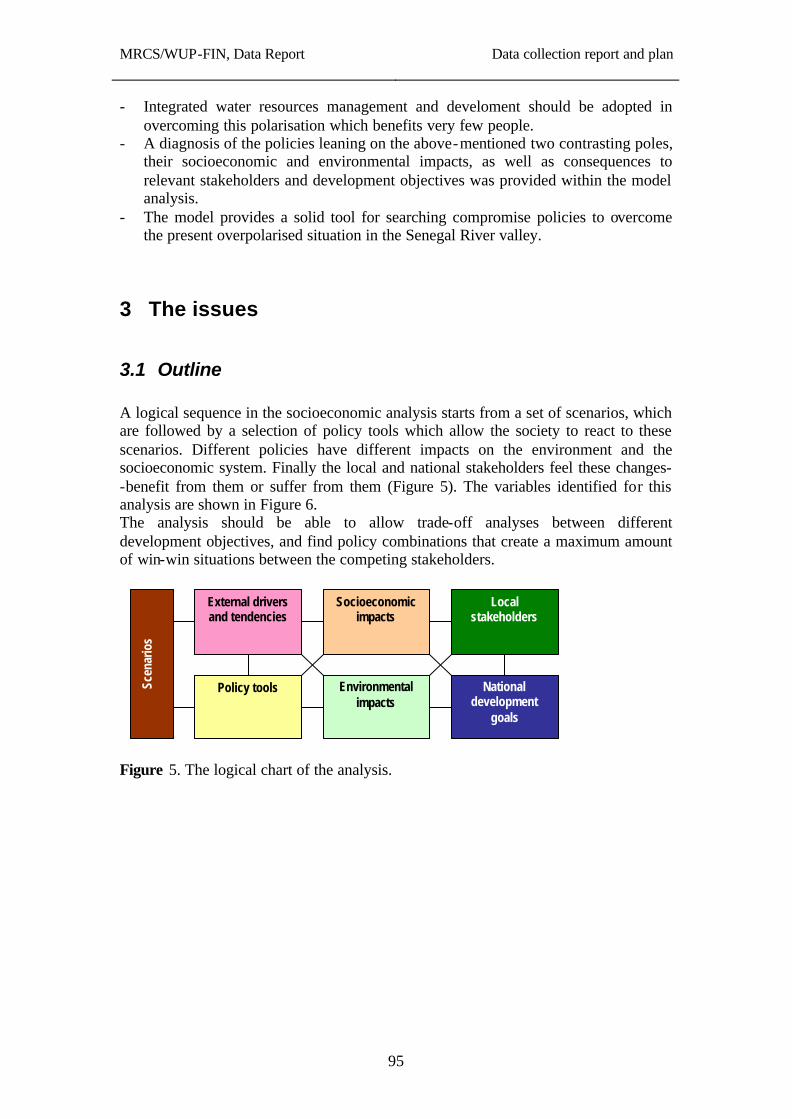
MRCS/WUP-FIN, Data Report
Data collection report and plan
95
- Integrated water resources management and develoment should be adopted in overcoming this polarisation which benefits very few people.
- A diagnosis of the policies leaning on the above-mentioned two contrasting poles, their socioeconomic and environmental impacts, as well as consequences to relevant stakeholders and development objectives was provided within the model analysis.
- The model provides a solid tool for searching compromise policies to overcome the present overpolarised situation in the Senegal River valley.
3 The issues
3.1 Outline A logical sequence in the socioeconomic analysis starts from a set of scenarios, which are followed by a selection of policy tools which allow the society to react to these scenarios. Different policies have different impacts on the environment and the socioeconomic system. Finally the local and national stakeholders feel these changes--benefit from them or suffer from them (Figure 5). The variables identified for this analysis are shown in Figure 6. The analysis should be able to allow trade-off analyses between different development objectives, and find policy combinations that create a maximum amount of win-win situations between the competing stakeholders.
Scen
ario
s
Socioeconomic impacts
Environmental impacts
External drivers and tendencies
Policy tools
Local stakeholders
National development
goals
Figure 5. The logical chart of the analysis.
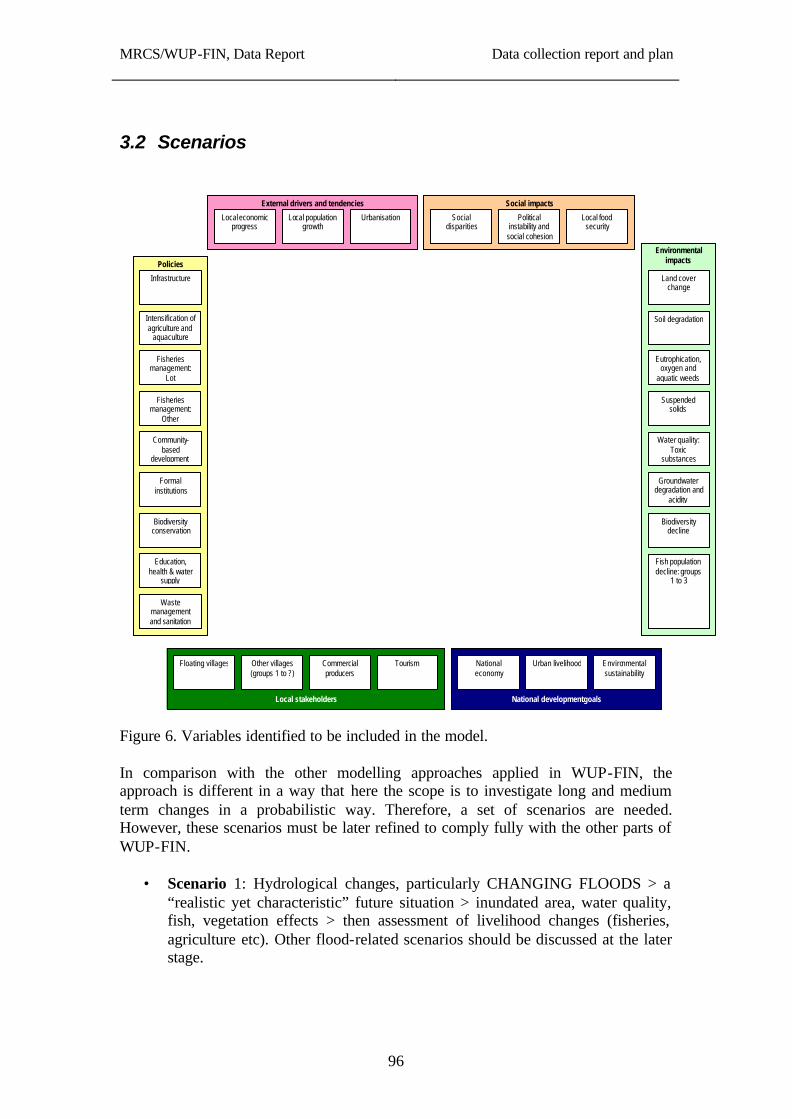
MRCS/WUP-FIN, Data Report
Data collection report and plan
96
3.2 Scenarios
National development goals
Local stakeholders
Policies
Social impacts External drivers and tendencies
Environmental impacts
Biodiversity conservation
Formal institutions
Community-based
development
Fisheries management:
Lot
Intensification of agriculture and
aquaculture
Local economic progress
Urbanisation
Education, health & water
supply
Local population growth
Infrastructure
Social disparities
Fish population decline: groups
1 to 3
Eutrophication, oxygen and
aquatic weeds
Biodiversity decline
Groundwater degradation and
acidity
Suspended solids
Water quality: Toxic
substances
Waste management and sanitation
Land cover change
Soil degradation
Political instability and
social cohesion
National economy
Urban livelihood Tourism
Local food security
Floating villages Other villages (groups 1 to ?)
Commercial producers
Environmental sustainability
Fisheries management:
Other
Figure 6. Variables identified to be included in the model. In comparison with the other modelling approaches applied in WUP-FIN, the approach is different in a way that here the scope is to investigate long and medium term changes in a probabilistic way. Therefore, a set of scenarios are needed. However, these scenarios must be later refined to comply fully with the other parts of WUP-FIN.
• Scenario 1: Hydrological changes, particularly CHANGING FLOODS > a “realistic yet characteristic” future situation > inundated area, water quality, fish, vegetation effects > then assessment of livelihood changes (fisheries, agriculture etc). Other flood-related scenarios should be discussed at the later stage.
MRCS/WUP-FIN, Data Report
Data collection report and plan
97
• Scenario 2: EROSION INCREASING > impacts on the basin morphology (filling), water quality, spawning, production etc. Both local and upstream effects are included.
• Scenario 3: EUTROPHICATION GROWING > impacts on oxygen conditions, phosphorus balance, algal growth and shift to bluegreen algae, spread of water hyacinth.
• Scenario 4: SERIOUS OVERFISHING > destructive catching practices continue and worsen (electrofishing, drying etc), the management system remains unsustainable (lot system with small contracts, no involvement and access of local communities, partially informal and illegal managers).
Irrespective of how the scenarios will be defined at the WUP-FIN level, there definitely will be a spectrum of data and information needs for them. Some of them could include:
• Scenario 1: inundated area, water quality, fish, vegetation effects • Scenario 2: water quality, fish production, vegetation effects • Scenario 3: oxygen, phosphorus balance, algal growth, possible shift to
bluegreens • Scenario 4: a relation to nutrient cycles, oxygen regime and so forth
3.3 External drivers and tendencies The issues selected to be included under this title are: • Local economic progress • Local population growth • Urbanisation A concise description and background for them is presented below.
3.3.1 Local economic progress Cambodian economy has been very underdeveloped and the role of informal activities has been notable over the recent history, yet the situation appears to be towards more macroeconomic stability through political stabilisation, and microeconomic vitality through entrepreneurship and gradual liberalisation. However, the GNP per capita has still dropped slightly from US$ 280 of 1995 to US$ 260 in 2000. Hence, the country has remained among the 20 poorest nations of the world, and among the 4 poorest ones in Asia (Figure 7).
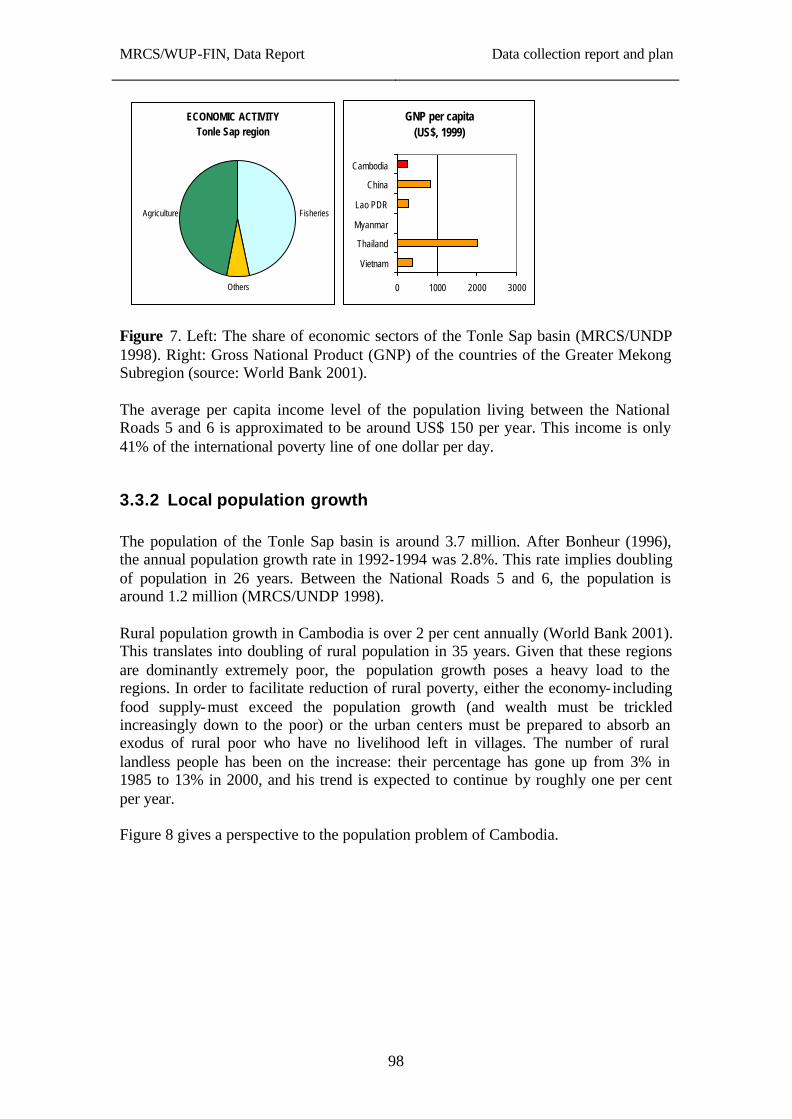
MRCS/WUP-FIN, Data Report
Data collection report and plan
98
ECONOMIC ACTIVITYTonle Sap region
Fisheries
Others
Agriculture
GNP per capita(US$, 1999)
0 1000 2000 3000
Cambodia
China
Lao PDR
Myanmar
Thailand
Vietnam
Figure 7. Left: The share of economic sectors of the Tonle Sap basin (MRCS/UNDP 1998). Right: Gross National Product (GNP) of the countries of the Greater Mekong Subregion (source: World Bank 2001). The average per capita income level of the population living between the National Roads 5 and 6 is approximated to be around US$ 150 per year. This income is only 41% of the international poverty line of one dollar per day.
3.3.2 Local population growth The population of the Tonle Sap basin is around 3.7 million. After Bonheur (1996), the annual population growth rate in 1992-1994 was 2.8%. This rate implies doubling of population in 26 years. Between the National Roads 5 and 6, the population is around 1.2 million (MRCS/UNDP 1998). Rural population growth in Cambodia is over 2 per cent annually (World Bank 2001). This translates into doubling of rural population in 35 years. Given that these regions are dominantly extremely poor, the population growth poses a heavy load to the regions. In order to facilitate reduction of rural poverty, either the economy-including food supply-must exceed the population growth (and wealth must be trickled increasingly down to the poor) or the urban centers must be prepared to absorb an exodus of rural poor who have no livelihood left in villages. The number of rural landless people has been on the increase: their percentage has gone up from 3% in 1985 to 13% in 2000, and his trend is expected to continue by roughly one per cent per year. Figure 8 gives a perspective to the population problem of Cambodia.
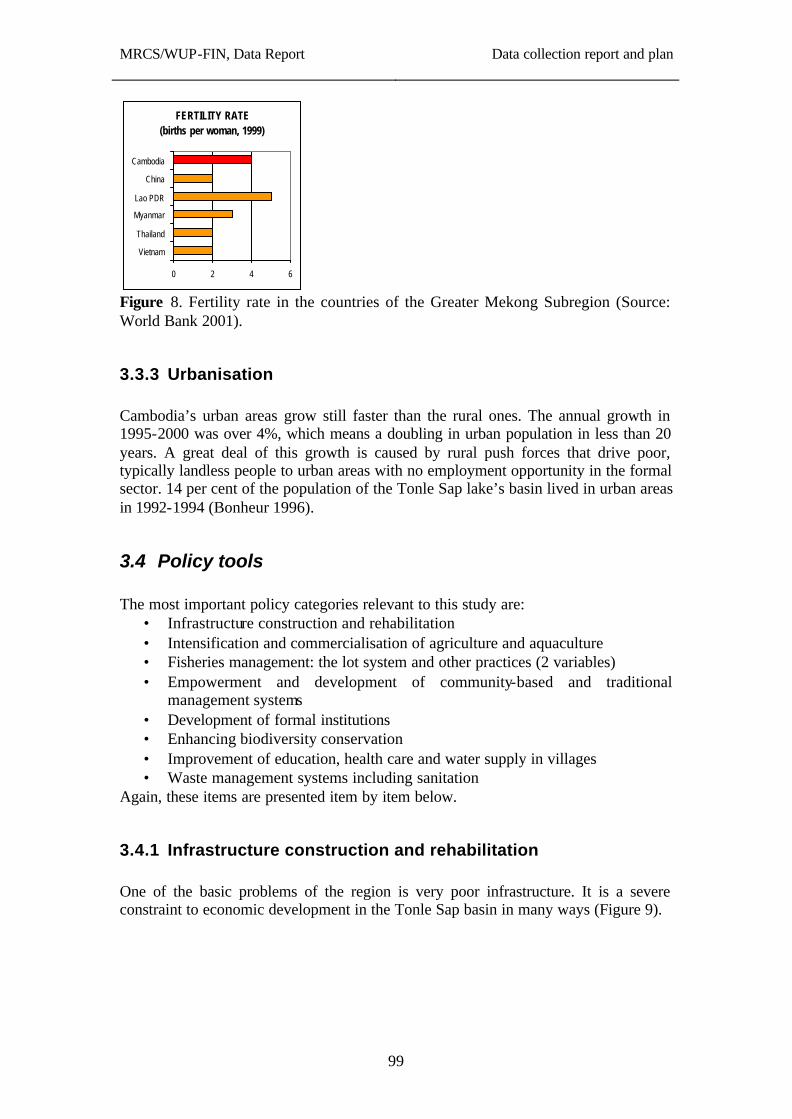
MRCS/WUP-FIN, Data Report
Data collection report and plan
99
FERTILITY RATE(births per woman, 1999)
0 2 4 6
Cambodia
China
Lao PDR
Myanmar
Thailand
Vietnam
Figure 8. Fertility rate in the countries of the Greater Mekong Subregion (Source: World Bank 2001).
3.3.3 Urbanisation Cambodia’s urban areas grow still faster than the rural ones. The annual growth in 1995-2000 was over 4%, which means a doubling in urban population in less than 20 years. A great deal of this growth is caused by rural push forces that drive poor, typically landless people to urban areas with no employment opportunity in the formal sector. 14 per cent of the population of the Tonle Sap lake’s basin lived in urban areas in 1992-1994 (Bonheur 1996).
3.4 Policy tools The most important policy categories relevant to this study are:
• Infrastructure construction and rehabilitation • Intensification and commercialisation of agriculture and aquaculture • Fisheries management: the lot system and other practices (2 variables) • Empowerment and development of community-based and traditional
management systems • Development of formal institutions • Enhancing biodiversity conservation • Improvement of education, health care and water supply in villages • Waste management systems including sanitation
Again, these items are presented item by item below.
3.4.1 Infrastructure construction and rehabilitation One of the basic problems of the region is very poor infrastructure. It is a severe constraint to economic development in the Tonle Sap basin in many ways (Figure 9).
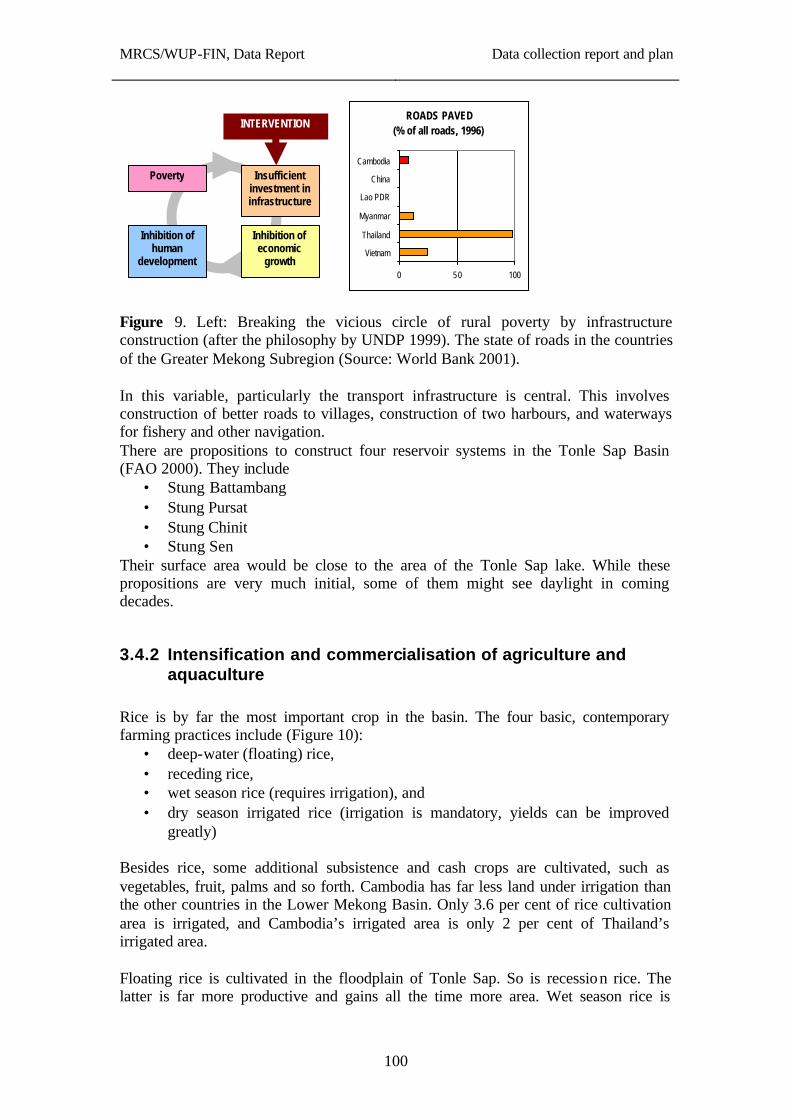
MRCS/WUP-FIN, Data Report
Data collection report and plan
100
Insufficient investment in infrastructure
Poverty
Inhibition of economic
growth
Inhibition of human
development
INTERVENTION ROADS PAVED
(% of all roads, 1996)
0 50 100
Cambodia
China
Lao PDR
Myanmar
Thailand
Vietnam
Figure 9. Left: Breaking the vicious circle of rural poverty by infrastructure construction (after the philosophy by UNDP 1999). The state of roads in the countries of the Greater Mekong Subregion (Source: World Bank 2001). In this variable, particularly the transport infrastructure is central. This involves construction of better roads to villages, construction of two harbours, and waterways for fishery and other navigation. There are propositions to construct four reservoir systems in the Tonle Sap Basin (FAO 2000). They include
• Stung Battambang • Stung Pursat • Stung Chinit • Stung Sen
Their surface area would be close to the area of the Tonle Sap lake. While these propositions are very much initial, some of them might see daylight in coming decades.
3.4.2 Intensification and commercialisation of agriculture and aquaculture
Rice is by far the most important crop in the basin. The four basic, contemporary farming practices include (Figure 10):
• deep-water (floating) rice, • receding rice, • wet season rice (requires irrigation), and • dry season irrigated rice (irrigation is mandatory, yields can be improved
greatly) Besides rice, some additional subsistence and cash crops are cultivated, such as vegetables, fruit, palms and so forth. Cambodia has far less land under irrigation than the other countries in the Lower Mekong Basin. Only 3.6 per cent of rice cultivation area is irrigated, and Cambodia’s irrigated area is only 2 per cent of Thailand’s irrigated area. Floating rice is cultivated in the floodplain of Tonle Sap. So is recession rice. The latter is far more productive and gains all the time more area. Wet season rice is
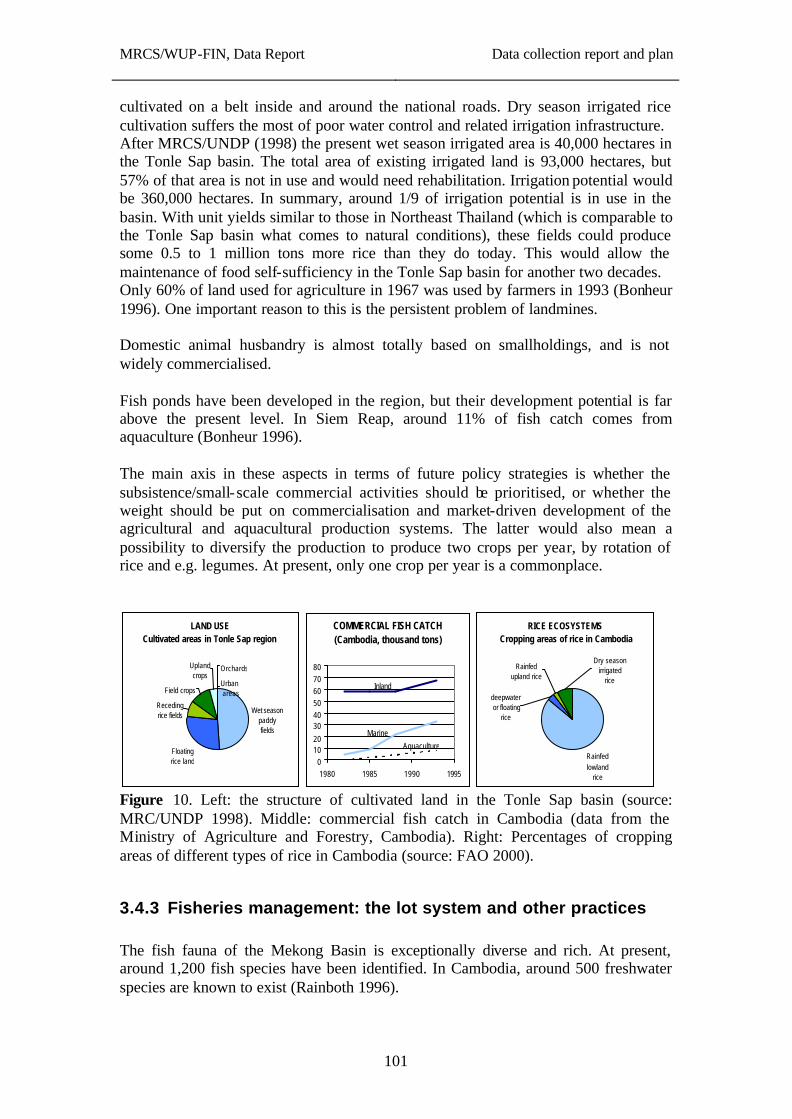
MRCS/WUP-FIN, Data Report
Data collection report and plan
101
cultivated on a belt inside and around the national roads. Dry season irrigated rice cultivation suffers the most of poor water control and related irrigation infrastructure. After MRCS/UNDP (1998) the present wet season irrigated area is 40,000 hectares in the Tonle Sap basin. The total area of existing irrigated land is 93,000 hectares, but 57% of that area is not in use and would need rehabilitation. Irrigation potential would be 360,000 hectares. In summary, around 1/9 of irrigation potential is in use in the basin. With unit yields similar to those in Northeast Thailand (which is comparable to the Tonle Sap basin what comes to natural conditions), these fields could produce some 0.5 to 1 million tons more rice than they do today. This would allow the maintenance of food self-sufficiency in the Tonle Sap basin for another two decades. Only 60% of land used for agriculture in 1967 was used by farmers in 1993 (Bonheur 1996). One important reason to this is the persistent problem of landmines. Domestic animal husbandry is almost totally based on smallholdings, and is not widely commercialised. Fish ponds have been developed in the region, but their development potential is far above the present level. In Siem Reap, around 11% of fish catch comes from aquaculture (Bonheur 1996). The main axis in these aspects in terms of future policy strategies is whether the subsistence/small-scale commercial activities should be prioritised, or whether the weight should be put on commercialisation and market-driven development of the agricultural and aquacultural production systems. The latter would also mean a possibility to diversify the production to produce two crops per year, by rotation of rice and e.g. legumes. At present, only one crop per year is a commonplace.
LAND USECultivated areas in Tonle Sap region
Wet season paddy fields
Floating rice land
Receding rice fields
Field crops
Upland crops
Orchards
Urban areas
COMMERCIAL FISH CATCH(Cambodia, thousand tons)
01020
304050607080
1980 1985 1990 1995
Inland
Aquaculture
Marine
RICE ECOSYSTEMSCropping areas of rice in Cambodia
Rainfed lowland
rice
Rainfed upland rice
deepwater or floating
rice
Dry season irrigated
rice
Figure 10. Left: the structure of cultivated land in the Tonle Sap basin (source: MRC/UNDP 1998). Middle: commercial fish catch in Cambodia (data from the Ministry of Agriculture and Forestry, Cambodia). Right: Percentages of cropping areas of different types of rice in Cambodia (source: FAO 2000).
3.4.3 Fisheries management: the lot system and other practices The fish fauna of the Mekong Basin is exceptionally diverse and rich. At present, around 1,200 fish species have been identified. In Cambodia, around 500 freshwater species are known to exist (Rainboth 1996).
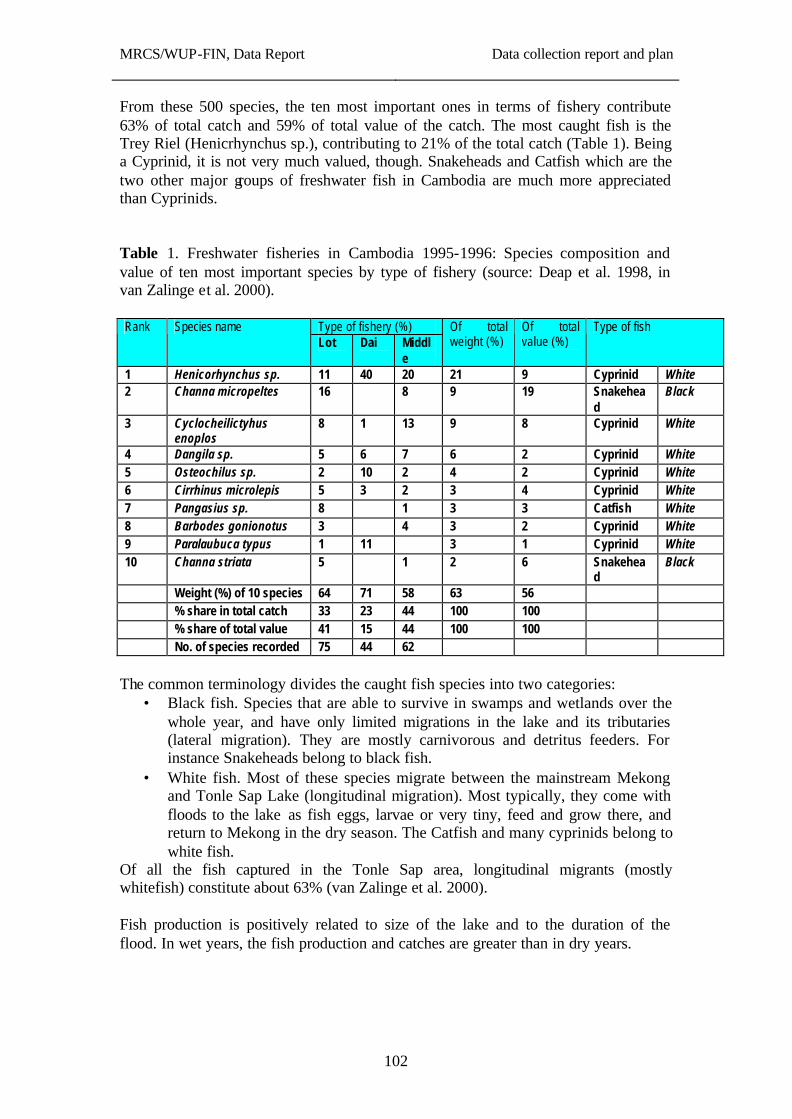
MRCS/WUP-FIN, Data Report
Data collection report and plan
102
From these 500 species, the ten most important ones in terms of fishery contribute 63% of total catch and 59% of total value of the catch. The most caught fish is the Trey Riel (Henicrhynchus sp.), contributing to 21% of the total catch (Table 1). Being a Cyprinid, it is not very much valued, though. Snakeheads and Catfish which are the two other major groups of freshwater fish in Cambodia are much more appreciated than Cyprinids. Table 1. Freshwater fisheries in Cambodia 1995-1996: Species composition and value of ten most important species by type of fishery (source: Deap et al. 1998, in van Zalinge et al. 2000).
Type of fishery (%) Rank Species name Lot Dai Middl
e
Of total weight (%)
Of total value (%)
Type of fish
1 Henicorhynchus sp. 11 40 20 21 9 Cyprinid White 2 Channa micropeltes 16 8 9 19 Snakehea
d Black
3 Cyclocheilictyhus enoplos
8 1 13 9 8 Cyprinid White
4 Dangila sp. 5 6 7 6 2 Cyprinid White 5 Osteochilus sp. 2 10 2 4 2 Cyprinid White 6 Cirrhinus microlepis 5 3 2 3 4 Cyprinid White 7 Pangasius sp. 8 1 3 3 Catfish White 8 Barbodes gonionotus 3 4 3 2 Cyprinid White 9 Paralaubuca typus 1 11 3 1 Cyprinid White 10 Channa striata 5 1 2 6 Snakehea
d Black
Weight (%) of 10 species 64 71 58 63 56 % share in total catch 33 23 44 100 100 % share of total value 41 15 44 100 100 No. of species recorded 75 44 62
The common terminology divides the caught fish species into two categories:
• Black fish. Species that are able to survive in swamps and wetlands over the whole year, and have only limited migrations in the lake and its tributaries (lateral migration). They are mostly carnivorous and detritus feeders. For instance Snakeheads belong to black fish.
• White fish. Most of these species migrate between the mainstream Mekong and Tonle Sap Lake (longitudinal migration). Most typically, they come with floods to the lake as fish eggs, larvae or very tiny, feed and grow there, and return to Mekong in the dry season. The Catfish and many cyprinids belong to white fish.
Of all the fish captured in the Tonle Sap area, longitudinal migrants (mostly whitefish) constitute about 63% (van Zalinge et al. 2000). Fish production is positively related to size of the lake and to the duration of the flood. In wet years, the fish production and catches are greater than in dry years.

MRCS/WUP-FIN, Data Report
Data collection report and plan
103
There are four dominating types of fisheries. They are: 1. Fishing lots: Concessions auctioned by the Government for a two-year
period for commercial operators. In the whole country, there exist 164 lots in lakes, rivers, and river beaches.
2. Dai (bagnet) lots: A dai is a stationary trawl constructed in a river to capture fish migrating downstream. This technique is much cheaper than a lot. The rights to position a bagnet in a river is also auctioned. Tonle Sap River is the most important area for bagnets, where their season is from October to March when the flood recedes. Half of the catch comes in January. In 1997-1999 68 bagnets operated in the river.
3. Medium-scale (open-access) fishing: This activity is controlled by licenses by the government. A variety of gears are allowed including gillnets, traps, encircling seine nets, trawls, hooks, lines and so forth. Gillnets contribute to 52% of the catch.
4. Family fishing and ricefield fisheries. No license is required, but the gear allowed is far more restricted than in medium-scale fisheries. Family fishers have an access to fishing lots in the closed season from June to October.
On the top of them, there exist 15 fish sanctuaries. A hot topic in the Tonle Sap Lake fisheries has been the debate of the present lot system. It is now based on 58 regions (lots). This system has been criticized for
1) leaving customary public rights of the communities and landless people powerless and thus hampering notably the livelihood of the local population and
2) leading easily to overfishing, since the lot operators have no stake in taking care of sustainable fisheries practices.
On the other hand, many alerts have been issued on the risks that the customary-right based traditional family fisheries would lead to overfishing due to the present, dense and growing human population in the region, and the lot system is said to protect the resource from overexploitation. The proponents of the lot system claim that only the principles for selecting the lot operations needs revision, not the system itself. Destructive fisheries practices are widely applied, such as electrofishing, too small mesh-size nets, drying of parts of the lake, samras fisheries, and so forth. In the model, there are two fisheries management variables
• The lot system: favour local communities or external operators • Other types: relax or tighten control.
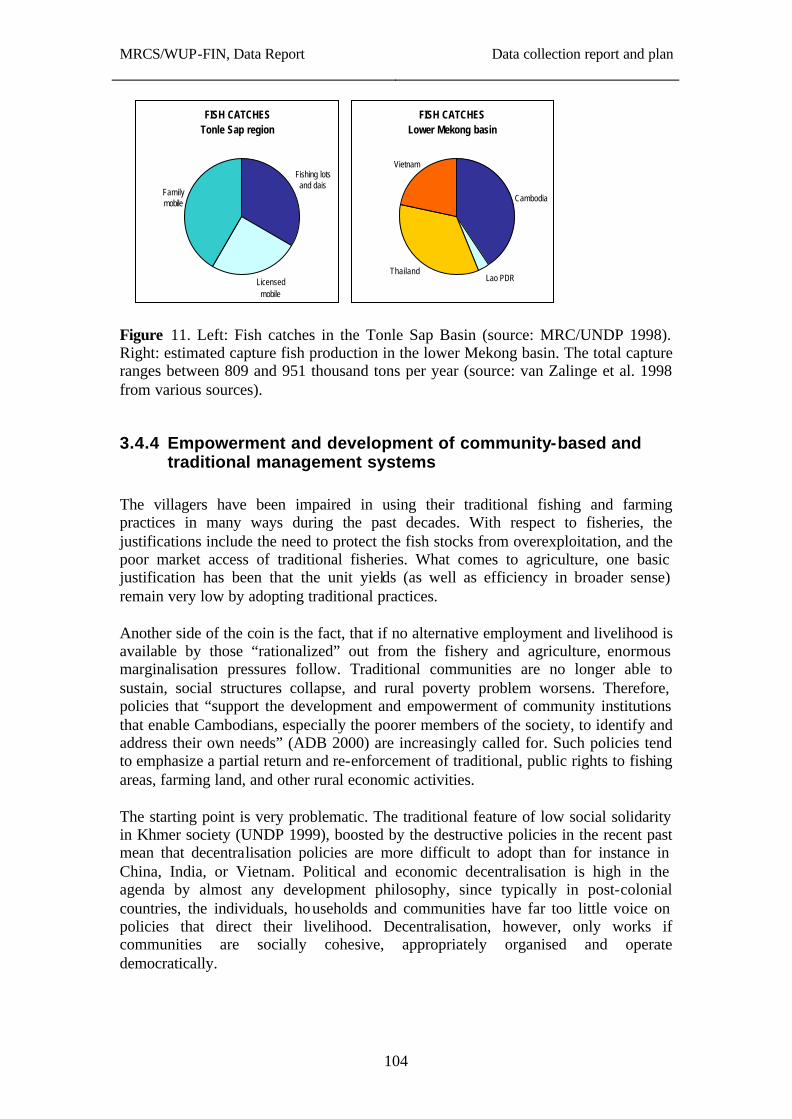
MRCS/WUP-FIN, Data Report
Data collection report and plan
104
FISH CATCHESTonle Sap region
Fishing lots and dais
Licensed mobile
Family mobile
FISH CATCHESLower Mekong basin
Cambodia
Lao PDRThailand
Vietnam
Figure 11. Left: Fish catches in the Tonle Sap Basin (source: MRC/UNDP 1998). Right: estimated capture fish production in the lower Mekong basin. The total capture ranges between 809 and 951 thousand tons per year (source: van Zalinge et al. 1998 from various sources).
3.4.4 Empowerment and development of community-based and traditional management systems
The villagers have been impaired in using their traditional fishing and farming practices in many ways during the past decades. With respect to fisheries, the justifications include the need to protect the fish stocks from overexploitation, and the poor market access of traditional fisheries. What comes to agriculture, one basic justification has been that the unit yields (as well as efficiency in broader sense) remain very low by adopting traditional practices. Another side of the coin is the fact, that if no alternative employment and livelihood is available by those “rationalized” out from the fishery and agriculture, enormous marginalisation pressures follow. Traditional communities are no longer able to sustain, social structures collapse, and rural poverty problem worsens. Therefore, policies that “support the development and empowerment of community institutions that enable Cambodians, especially the poorer members of the society, to identify and address their own needs” (ADB 2000) are increasingly called for. Such policies tend to emphasize a partial return and re-enforcement of traditional, public rights to fishing areas, farming land, and other rural economic activities. The starting point is very problematic. The traditional feature of low social solidarity in Khmer society (UNDP 1999), boosted by the destructive policies in the recent past mean that decentralisation policies are more difficult to adopt than for instance in China, India, or Vietnam. Political and economic decentralisation is high in the agenda by almost any development philosophy, since typically in post-colonial countries, the individuals, households and communities have far too little voice on policies that direct their livelihood. Decentralisation, however, only works if communities are socially cohesive, appropriately organised and operate democratically.
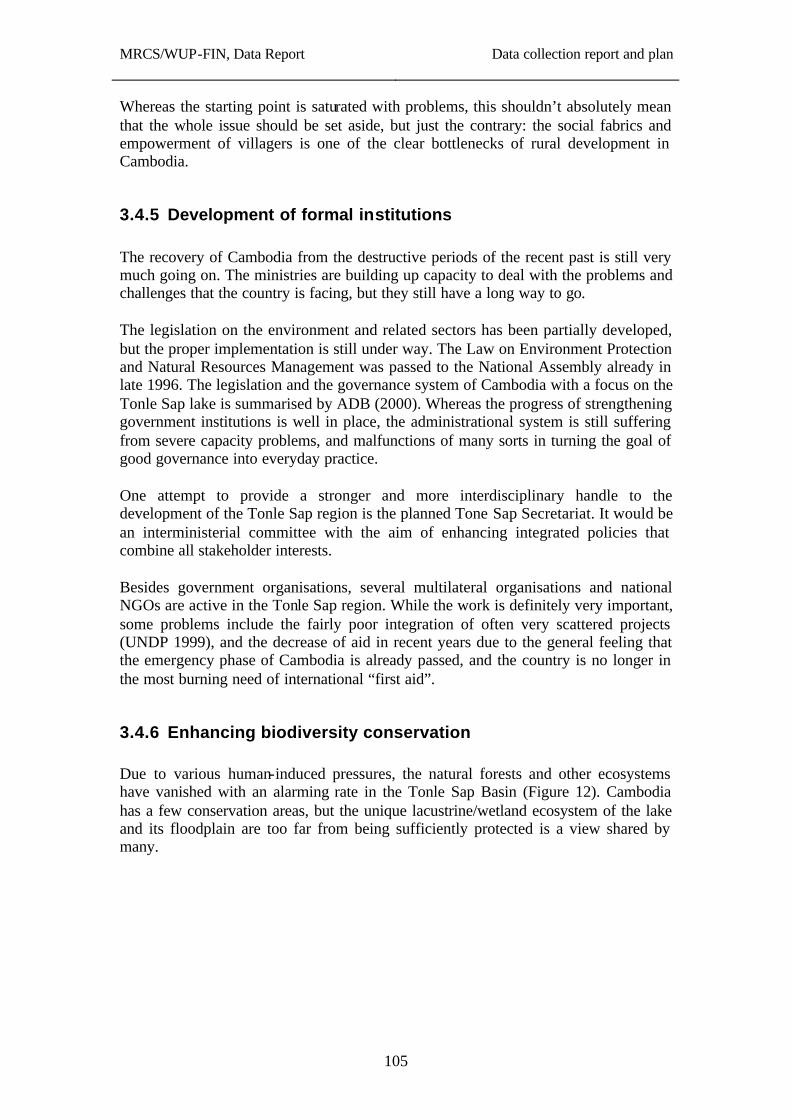
MRCS/WUP-FIN, Data Report
Data collection report and plan
105
Whereas the starting point is saturated with problems, this shouldn’t absolutely mean that the whole issue should be set aside, but just the contrary: the social fabrics and empowerment of villagers is one of the clear bottlenecks of rural development in Cambodia.
3.4.5 Development of formal institutions The recovery of Cambodia from the destructive periods of the recent past is still very much going on. The ministries are building up capacity to deal with the problems and challenges that the country is facing, but they still have a long way to go. The legislation on the environment and related sectors has been partially developed, but the proper implementation is still under way. The Law on Environment Protection and Natural Resources Management was passed to the National Assembly already in late 1996. The legislation and the governance system of Cambodia with a focus on the Tonle Sap lake is summarised by ADB (2000). Whereas the progress of strengthening government institutions is well in place, the administrational system is still suffering from severe capacity problems, and malfunctions of many sorts in turning the goal of good governance into everyday practice. One attempt to provide a stronger and more interdisciplinary handle to the development of the Tonle Sap region is the planned Tone Sap Secretariat. It would be an interministerial committee with the aim of enhancing integrated policies that combine all stakeholder interests. Besides government organisations, several multilateral organisations and national NGOs are active in the Tonle Sap region. While the work is definitely very important, some problems include the fairly poor integration of often very scattered projects (UNDP 1999), and the decrease of aid in recent years due to the general feeling that the emergency phase of Cambodia is already passed, and the country is no longer in the most burning need of international “first aid”.
3.4.6 Enhancing biodiversity conservation Due to various human-induced pressures, the natural forests and other ecosystems have vanished with an alarming rate in the Tonle Sap Basin (Figure 12). Cambodia has a few conservation areas, but the unique lacustrine/wetland ecosystem of the lake and its floodplain are too far from being sufficiently protected is a view shared by many.
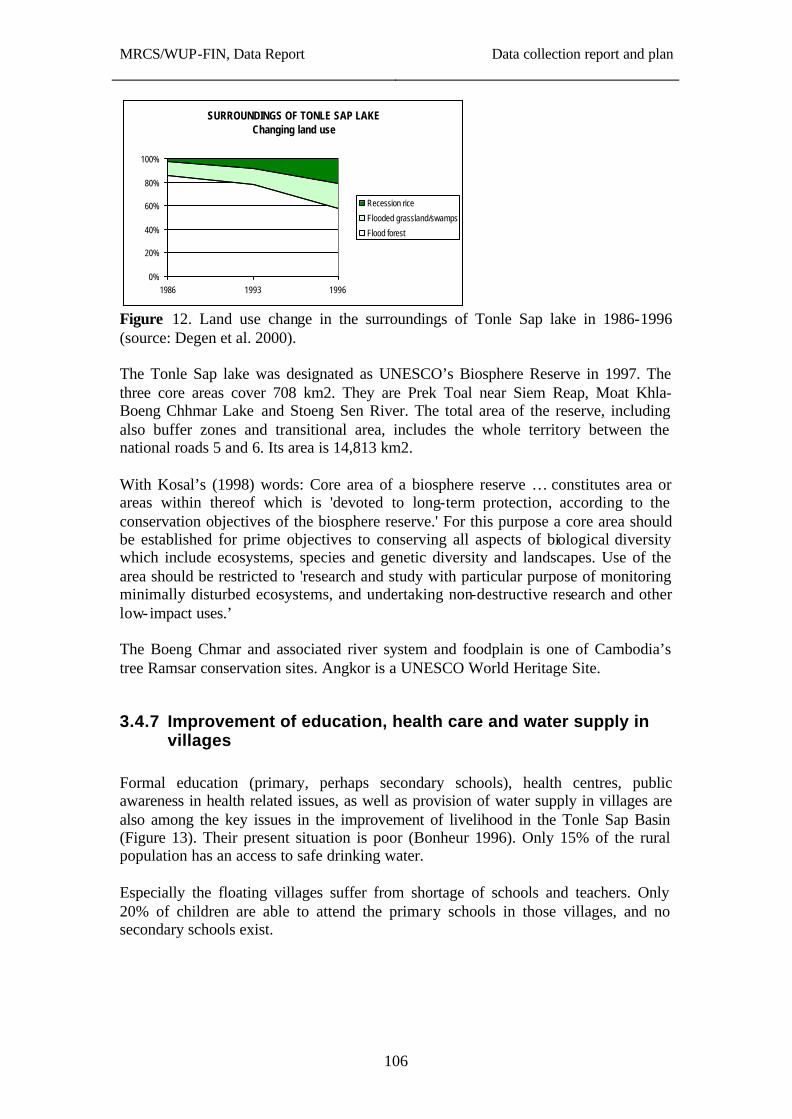
MRCS/WUP-FIN, Data Report
Data collection report and plan
106
SURROUNDINGS OF TONLE SAP LAKEChanging land use
0%
20%
40%
60%
80%
100%
1986 1993 1996
Recession rice
Flooded grassland/swamps
Flood forest
Figure 12. Land use change in the surroundings of Tonle Sap lake in 1986-1996 (source: Degen et al. 2000). The Tonle Sap lake was designated as UNESCO’s Biosphere Reserve in 1997. The three core areas cover 708 km2. They are Prek Toal near Siem Reap, Moat Khla-Boeng Chhmar Lake and Stoeng Sen River. The total area of the reserve, including also buffer zones and transitional area, includes the whole territory between the national roads 5 and 6. Its area is 14,813 km2. With Kosal’s (1998) words: Core area of a biosphere reserve … constitutes area or areas within thereof which is 'devoted to long-term protection, according to the conservation objectives of the biosphere reserve.' For this purpose a core area should be established for prime objectives to conserving all aspects of biological diversity which include ecosystems, species and genetic diversity and landscapes. Use of the area should be restricted to 'research and study with particular purpose of monitoring minimally disturbed ecosystems, and undertaking non-destructive research and other low-impact uses.’ The Boeng Chmar and associated river system and foodplain is one of Cambodia’s tree Ramsar conservation sites. Angkor is a UNESCO World Heritage Site.
3.4.7 Improvement of education, health care and water supply in villages
Formal education (primary, perhaps secondary schools), health centres, public awareness in health related issues, as well as provision of water supply in villages are also among the key issues in the improvement of livelihood in the Tonle Sap Basin (Figure 13). Their present situation is poor (Bonheur 1996). Only 15% of the rural population has an access to safe drinking water. Especially the floating villages suffer from shortage of schools and teachers. Only 20% of children are able to attend the primary schools in those villages, and no secondary schools exist.
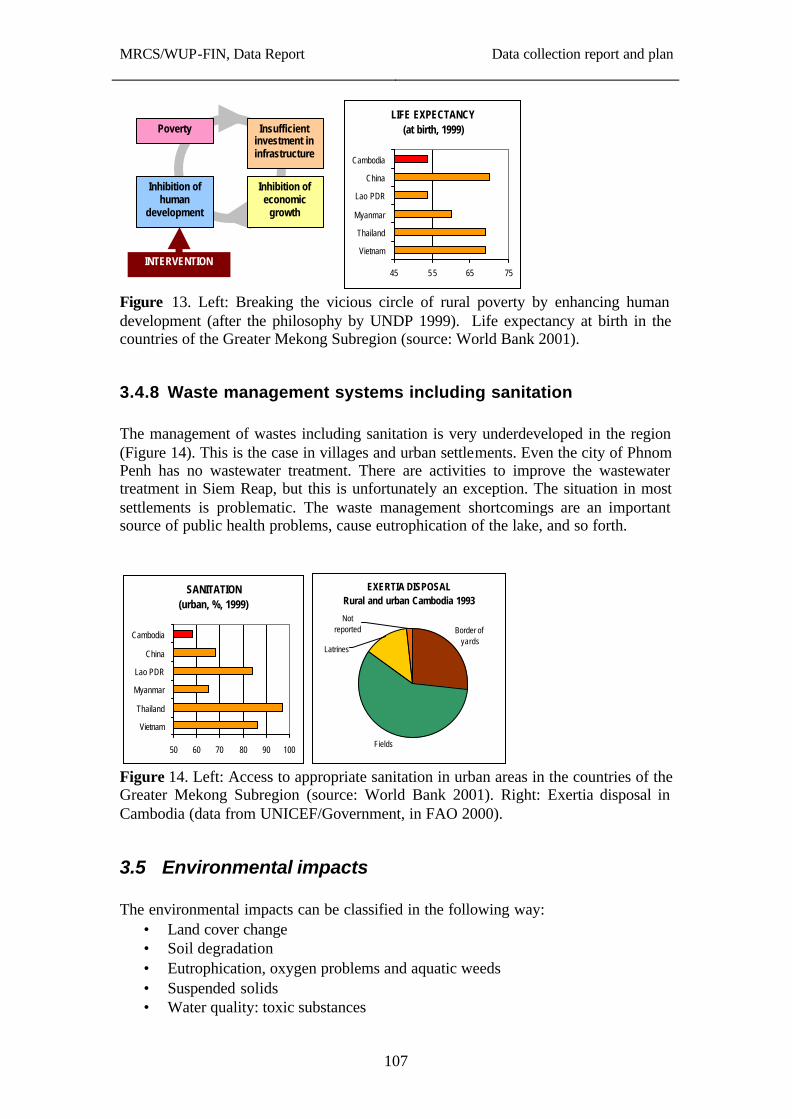
MRCS/WUP-FIN, Data Report
Data collection report and plan
107
Insufficient investment in infrastructure
Poverty
Inhibition of economic
growth
Inhibition of human
development
INTERVENTION
LIFE EXPECTANCY(at birth, 1999)
45 55 65 75
Cambodia
China
Lao PDR
Myanmar
Thailand
Vietnam
Figure 13. Left: Breaking the vicious circle of rural poverty by enhancing human development (after the philosophy by UNDP 1999). Life expectancy at birth in the countries of the Greater Mekong Subregion (source: World Bank 2001).
3.4.8 Waste management systems including sanitation The management of wastes including sanitation is very underdeveloped in the region (Figure 14). This is the case in villages and urban settlements. Even the city of Phnom Penh has no wastewater treatment. There are activities to improve the wastewater treatment in Siem Reap, but this is unfortunately an exception. The situation in most settlements is problematic. The waste management shortcomings are an important source of public health problems, cause eutrophication of the lake, and so forth.
SANITATION(urban, %, 1999)
50 60 70 80 90 100
Cambodia
China
Lao PDR
Myanmar
Thailand
Vietnam
EXERTIA DISPOSALRural and urban Cambodia 1993
Border of yards
Fields
Not reported
Latrines
Figure 14. Left: Access to appropriate sanitation in urban areas in the countries of the Greater Mekong Subregion (source: World Bank 2001). Right: Exertia disposal in Cambodia (data from UNICEF/Government, in FAO 2000).
3.5 Environmental impacts The environmental impacts can be classified in the following way:
• Land cover change • Soil degradation • Eutrophication, oxygen problems and aquatic weeds • Suspended solids • Water quality: toxic substances
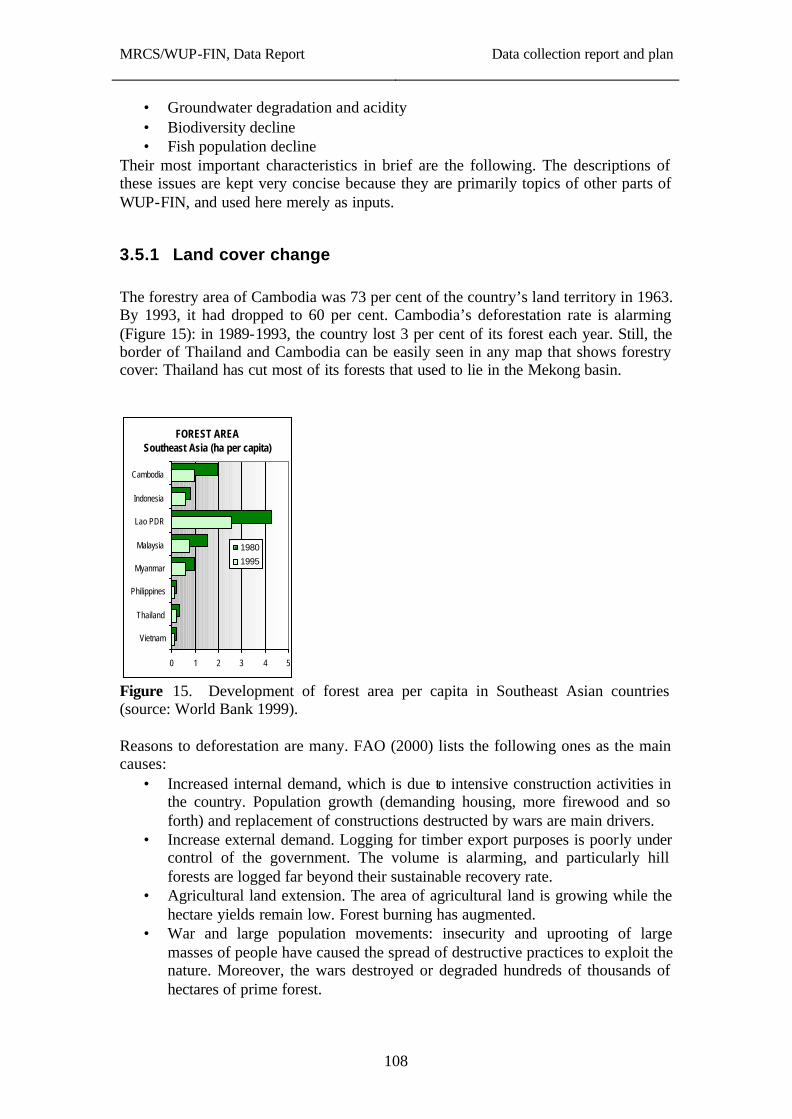
MRCS/WUP-FIN, Data Report
Data collection report and plan
108
• Groundwater degradation and acidity • Biodiversity decline • Fish population decline
Their most important characteristics in brief are the following. The descriptions of these issues are kept very concise because they are primarily topics of other parts of WUP-FIN, and used here merely as inputs.
3.5.1 Land cover change The forestry area of Cambodia was 73 per cent of the country’s land territory in 1963. By 1993, it had dropped to 60 per cent. Cambodia’s deforestation rate is alarming (Figure 15): in 1989-1993, the country lost 3 per cent of its forest each year. Still, the border of Thailand and Cambodia can be easily seen in any map that shows forestry cover: Thailand has cut most of its forests that used to lie in the Mekong basin.
FOREST AREA Southeast Asia (ha per capita)
0 1 2 3 4 5
Cambodia
Indonesia
Lao PDR
Malaysia
Myanmar
Philippines
Thailand
Vietnam
1980
1995
Figure 15. Development of forest area per capita in Southeast Asian countries (source: World Bank 1999). Reasons to deforestation are many. FAO (2000) lists the following ones as the main causes:
• Increased internal demand, which is due to intensive construction activities in the country. Population growth (demanding housing, more firewood and so forth) and replacement of constructions destructed by wars are main drivers.
• Increase external demand. Logging for timber export purposes is poorly under control of the government. The volume is alarming, and particularly hill forests are logged far beyond their sustainable recovery rate.
• Agricultural land extension. The area of agricultural land is growing while the hectare yields remain low. Forest burning has augmented.
• War and large population movements: insecurity and uprooting of large masses of people have caused the spread of destructive practices to exploit the nature. Moreover, the wars destroyed or degraded hundreds of thousands of hectares of prime forest.
MRCS/WUP-FIN, Data Report
Data collection report and plan
109
• The government lacks a clear forest policy and is incapable of controlling the forest sector.
3.5.2 Soil degradation Soil degradation can be due to various reasons. Erosion, caused by either water or wind, is increasing in the Tonle Sap basin. This is chiefly due to deforestation, which enhances water erosion in particular. Chemical problems in the region are due to salinisation, to accumulation of toxics, demineralisation and so forth. Demineralisation is the most important among them in the Tonle Sap Basin. The natural low fertility and acidity are further worsened in some areas due to unsustainable cropping practices. A natural process which is enhanced by human activity in many tropical areas including the Tonle Sap basin is laterisation of soils. Soil loses its structure and hardens so much, that it can be cut into blocks and used after drying as construction material. This laterite has a yellow/red colour. Large areas of Southeast Asia and India suffer from this problem. These areas are often called red deserts.
3.5.3 Eutrophication, oxygen problems and aquatic weeds Opening material flows of nutrients (nitrogen and phosphorus in particular) cause increasing concentrations of these elements in the aquatic ecosystem, which in turn translates into enhanced growth of algae and macrovegetation. Sources of these nutrients in the Tonle Sap region are in human wastes, manure of the livestock, and most importantly, in agricultural fertilisers. Low dissolved oxygen (DO) concentrations occur in the lake. Most interesting areas are the surroundings of the flooded forests and wetlands, which tend to suffer from DO depletion. Enhanced eutrophication (caused by increased concentrations of plant nutrients in the aquatic ecosystem), physical conditions with low water exchange, increased load of organic matter and changes in vegetation cover can cause this. It remains to be found out to what extent the DO depletion is caused by human and how much by naturally occurring conditions. Mekong has so far suffered much less from invading and other aquatic weeds than most other major rivers of the world. This is obviously due to the fairly pristine state of the catchment in comparison to the other rivers. Nutrient levels are relatively low, and other ecosystem changes as well are fairly modest. The water hyacinth (Eichhornia crassipiens) is common in the river, but it does not typically grow in such problematic amounts as in most rivers in Southeast Asia. The most troublesome weed in Tonle Sap is Mimosa pigra, yet its effects to the ecosystem of the lake are not accurately known.
MRCS/WUP-FIN, Data Report
Data collection report and plan
110
3.5.4 Suspended solids Increased erosion of soils in a watershed leads to washoff of suspended matter into streams and lakes. Suspended solids cause many ecological changes besides direct aesthetic and water-use related problems. Increased sedimentation is harmful to fauna and flora in the bottom. This hampers fish production. Light penetration is less efficient. This is harmful to primary producers. Sediments also contain nutrients which may lead to increased eutrohpication. On the other hand, sediment fertilises the floodplain and adds to agricultural productivity. Mekong’s sediments, however, are relatively nutrient-poor. The Mekong carries approximately 170 million tons of sediment per year (Wolanski et al. 1996). This is 3 tons per person, or 215 tons per km2 of catchment area. It has been estimated that 4.5 million tons are trapped in Tonle Sap lake annually (Carbonnel and Guiscafré 1963). The sedimentation rate in the Tonle Sap lake has been approximated to be around 0.4 mm per year. This is, however, very unevenly distributed. Most silt sediments in the flood plain. There are diverging views on the trend of sedimentation. The fisheries Department has estimated that it has doubled since the 1960s (see McElwee and Horowitz 1999), while MRCS/UNDP (1998) doubts that any remarkable increase has taken place.
3.5.5 Water quality: toxic substances There is evidence of growing use of agrochemicals in the basin, as well as the mobilisation of other environmental pollutants such as heavy metals due to various activities. Many of these accumulate in the food chains and may cause problems in ecological food chains as well as human health in the long term. At this point, the lake is relatively unpolluted. However, the current practices are unsustainable. For instance, the most used pesticides in the region are classified by WHO as being ‘extremely hazardous’.
3.5.6 Groundwater degradation and acidity Although the groundwaters of the region are obviously still in fairly good condition, some deterioration is due to the leaching of nutrients and pesticides from agricultural fields, overpumping as well as deforestation. Some features of natural origin cause problems to human uses. These problems include acidity and occasional arsenic risk, which cause problems in certain region. Problems of this kind tend to grow by almost any departure from the condition that has lasted over a long period of time. After FAO (2000), there exists no detailed investigation of groundwater resources in Cambodia. Aquifers do not have, however, sufficient potential for large scale irrigation.
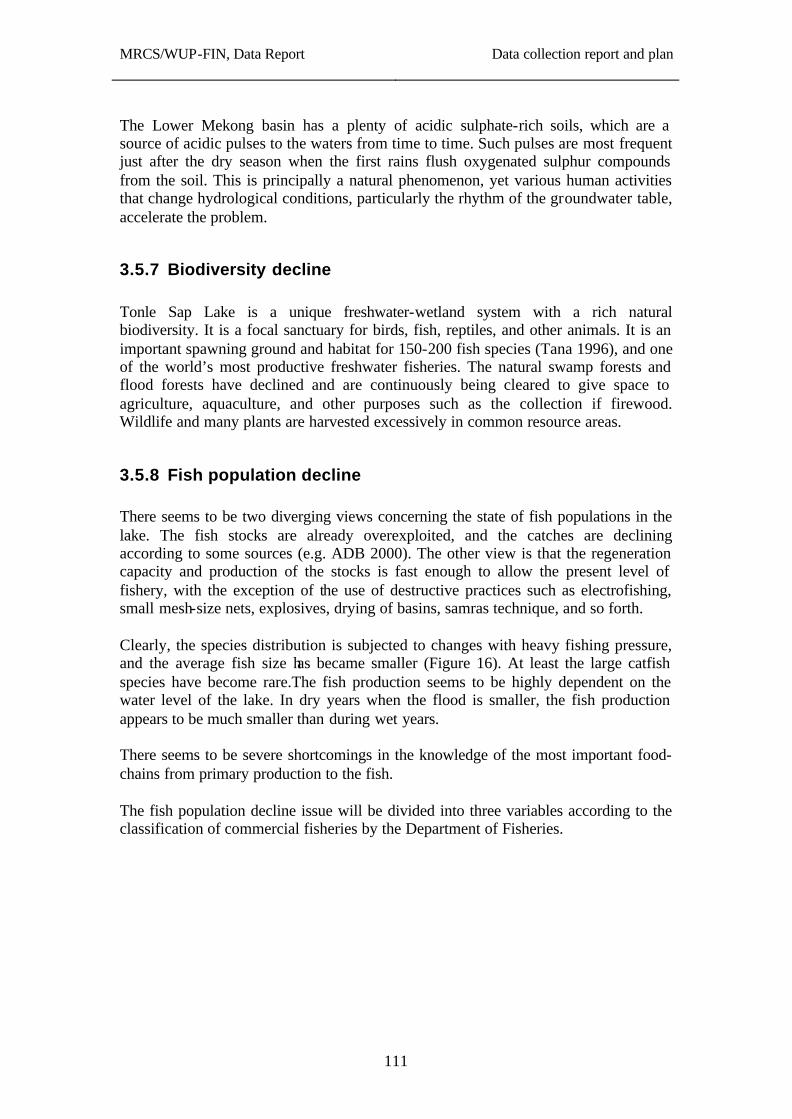
MRCS/WUP-FIN, Data Report
Data collection report and plan
111
The Lower Mekong basin has a plenty of acidic sulphate-rich soils, which are a source of acidic pulses to the waters from time to time. Such pulses are most frequent just after the dry season when the first rains flush oxygenated sulphur compounds from the soil. This is principally a natural phenomenon, yet various human activities that change hydrological conditions, particularly the rhythm of the groundwater table, accelerate the problem.
3.5.7 Biodiversity decline Tonle Sap Lake is a unique freshwater-wetland system with a rich natural biodiversity. It is a focal sanctuary for birds, fish, reptiles, and other animals. It is an important spawning ground and habitat for 150-200 fish species (Tana 1996), and one of the world’s most productive freshwater fisheries. The natural swamp forests and flood forests have declined and are continuously being cleared to give space to agriculture, aquaculture, and other purposes such as the collection if firewood. Wildlife and many plants are harvested excessively in common resource areas.
3.5.8 Fish population decline There seems to be two diverging views concerning the state of fish populations in the lake. The fish stocks are already overexploited, and the catches are declining according to some sources (e.g. ADB 2000). The other view is that the regeneration capacity and production of the stocks is fast enough to allow the present level of fishery, with the exception of the use of destructive practices such as electrofishing, small mesh-size nets, explosives, drying of basins, samras technique, and so forth. Clearly, the species distribution is subjected to changes with heavy fishing pressure, and the average fish size has became smaller (Figure 16). At least the large catfish species have become rare.The fish production seems to be highly dependent on the water level of the lake. In dry years when the flood is smaller, the fish production appears to be much smaller than during wet years. There seems to be severe shortcomings in the knowledge of the most important food-chains from primary production to the fish. The fish population decline issue will be divided into three variables according to the classification of commercial fisheries by the Department of Fisheries.
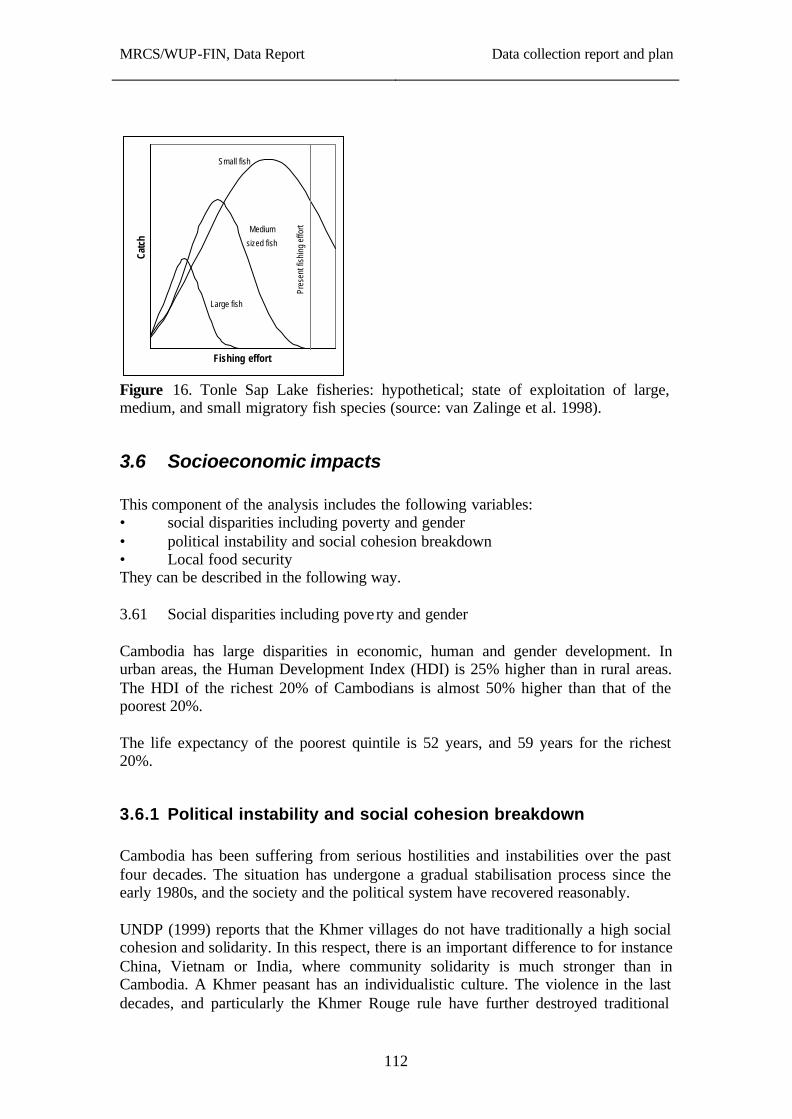
MRCS/WUP-FIN, Data Report
Data collection report and plan
112
Fishing effort
Catc
h
Pres
ent f
ishi
ng e
ffort
Large fish
Small fish
Medium
sized fish
Figure 16. Tonle Sap Lake fisheries: hypothetical; state of exploitation of large, medium, and small migratory fish species (source: van Zalinge et al. 1998).
3.6 Socioeconomic impacts This component of the analysis includes the following variables: • social disparities including poverty and gender • political instability and social cohesion breakdown • Local food security They can be described in the following way. 3.61 Social disparities including poverty and gender Cambodia has large disparities in economic, human and gender development. In urban areas, the Human Development Index (HDI) is 25% higher than in rural areas. The HDI of the richest 20% of Cambodians is almost 50% higher than that of the poorest 20%. The life expectancy of the poorest quintile is 52 years, and 59 years for the richest 20%.
3.6.1 Political instability and social cohesion breakdown Cambodia has been suffering from serious hostilities and instabilities over the past four decades. The situation has undergone a gradual stabilisation process since the early 1980s, and the society and the political system have recovered reasonably. UNDP (1999) reports that the Khmer villages do not have traditionally a high social cohesion and solidarity. In this respect, there is an important difference to for instance China, Vietnam or India, where community solidarity is much stronger than in Cambodia. A Khmer peasant has an individualistic culture. The violence in the last decades, and particularly the Khmer Rouge rule have further destroyed traditional
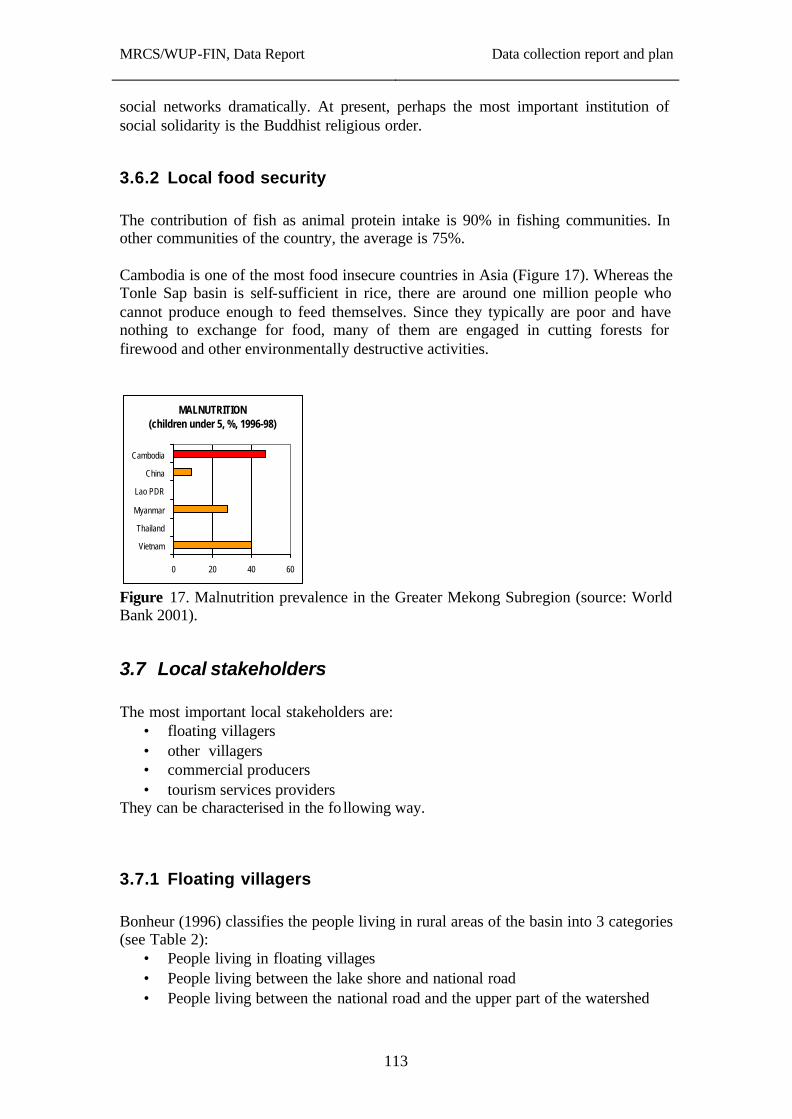
MRCS/WUP-FIN, Data Report
Data collection report and plan
113
social networks dramatically. At present, perhaps the most important institution of social solidarity is the Buddhist religious order.
3.6.2 Local food security The contribution of fish as animal protein intake is 90% in fishing communities. In other communities of the country, the average is 75%. Cambodia is one of the most food insecure countries in Asia (Figure 17). Whereas the Tonle Sap basin is self-sufficient in rice, there are around one million people who cannot produce enough to feed themselves. Since they typically are poor and have nothing to exchange for food, many of them are engaged in cutting forests for firewood and other environmentally destructive activities.
MALNUTRITION(children under 5, %, 1996-98)
0 20 40 60
Cambodia
China
Lao PDR
Myanmar
Thailand
Vietnam
Figure 17. Malnutrition prevalence in the Greater Mekong Subregion (source: World Bank 2001).
3.7 Local stakeholders The most important local stakeholders are:
• floating villagers • other villagers • commercial producers • tourism services providers
They can be characterised in the fo llowing way.
3.7.1 Floating villagers Bonheur (1996) classifies the people living in rural areas of the basin into 3 categories (see Table 2):
• People living in floating villages • People living between the lake shore and national road • People living between the national road and the upper part of the watershed
MRCS/WUP-FIN, Data Report
Data collection report and plan
114
Keeping in mind the primary focus of this study to the surroundings of the lake, the floating villages are considered separately here, but the two other groups are merged together. The number of floating villages is around 170 (Bonheur 1996). These people rely heavily on fisheries and other resources of the lake. Nearly 90% of the people are engaged in fisheries and related activities. Flooded forests are used as a source of firewood. It is important to note that the floating villages house only about 3.5% of the basin’s population (Figure 18). Table 2. Use of lake resources by people of 3 categories (Bonheur 1996). Type of resource People living in floating
villages People living between the lake shore and national road
People living between the national road and the upper part of the watershed
Flooded forest Heavy Medium Not at all Fish Heavy Low Not at all Land for farming receding rice Low Low Not at all Land for farming rainfed rice Not at all Heavy Heavy Land for slash and burn agriculture
Low Data not available Low
Land for animal grazing Not at all Low Low Forests Not at all Low Heavy Land for farming upland crops Not at all Medium Medium
POPULATIONTonle Sap region
< 8 m8 - 10 m
10 m to roads
Outside roads
Figure 18. Population distribution by altitude from the mean sea level in the Tonle Sap Basin. The floating village population can be approximated with the < 8 m category (source: MRC/UNDP 1998).
MRCS/WUP-FIN, Data Report
Data collection report and plan
115
3.7.2 Other villagers The main engagement of these people is agriculture. They are those who cut forests in the floodplain and in upland for their own use and for trading with wood (Bonheur 1996). The aspects to be considered in the context of village communities include public health, education, empowerment, employment, and so forth. This variable will possibly be split into two or more ones, depending on the detailed design and outcome of the interviews.
3.7.3 Commercial producers The commercial, high- input high-output farming is not very developed in the Tonle Sap basin. The rice yields per hectare are two to four times lower than in China, in Thailand, or in the Mekong delta in Vietnam. Subsistence farming still dominates, and only one tenth of the population is engaged in agriculture which produces remarkable surplus. With the possible advent of rehabilitation of irrigation systems, application of agrochemicals, introduction of new varieties, and organisation of education to farmers, a higher number of farms could be able to produce food for markets in this undernourished country, and by that generate income. On the other hand, the vicious circle of poverty-no money for investments, no savings, small markets and so forth-keep the introduction of the green revolution to Cambodia well damped. Poor infrastructure adds to that. In terms of environmental sustainability this damping has many positive aspects, yet also negative ones. From the former ones the opening material cycles and remains of pesticides are important issues, and among the latter ones the fact, that with higher unit yields more crops can be produced on a smaller area, and land resources can be saved for other purposes such as forests or biodiversity reserves.
3.7.4 Tourism services providers Angkor temples which are located to the western end of the lake is the main touristic attraction of Cambodia. Tonle Sap lake has a plenty of potential as an eco-tourist attraction as the largest lake in Southeast Asia, and as an important bird sanctuary. Tourism industry is very undeveloped in Cambodia. The annual number of visits to the country approaches 200,000, whereas countries such as Thailand and Singapore receive 7 million tourists each year (MRCS/UNDP 1998). The number of tourists viswiting Siem Reap is expected to grow to 350,000 by 2008. This would raise the economic importance of tourism to the same level as the basin’s agriculture or fisheries is today (cf. Figure 7).

MRCS/WUP-FIN, Data Report
Data collection report and plan
116
Despite of the very low volume of tourism, its contribution to Cambodia’s GNP has already climbed to 3%.
3.8 National development objectives The national development objectives relevant to this analysis are: • National economy • Urban livelihood • Environmental sustainability
3.8.1 National economy Cambodia’s national economy is one of the poorest ones in the world. Food insecurity is widespread, and domestic production hardly meets the needs of the country’s population. The neighbouring countries Thailand and Vietnam—having very similar natural conditions—belong to the major rice exporters of the world. With the present high population growth and low rate of agricultural development the food insecurity should be met with imports. This in turn is difficult given the very weak and deficit national economy.
3.8.2 Urban livelihood Urban citizens would benefit the most from the commercial irrigated agriculture schemes because they are the biggest consumers of rice and other commodities that an economically active rural area could produce in Cambodia. However, this is a group in between the two main development poles (national and local), since when traditional rural livelihood is impaired the population is pushed to move into towns.
3.8.3 Environmental sustainability People along the Tonle Sap lake live from and with the nature and therefore changes in people’s behaviour affect the environment, and vice versa. The natural equilibrium between humans and the nature has been perturbed in many ways, but still less than in most other tropical and subtropical lakes of the world. The biggest negative effects of the river development on nature include the loss of forests and shrubs, the changing aquatic vegetation, destruction of habitats for a number of mammals and reptiles, and obvious changes in the fish fauna due to intensive fishing. Nature as a stakeholder can be considered as passive recipient, for it will not demand its part of the lake’s water, but the consequences of disadvantaged management actions are seen in its deterioration.
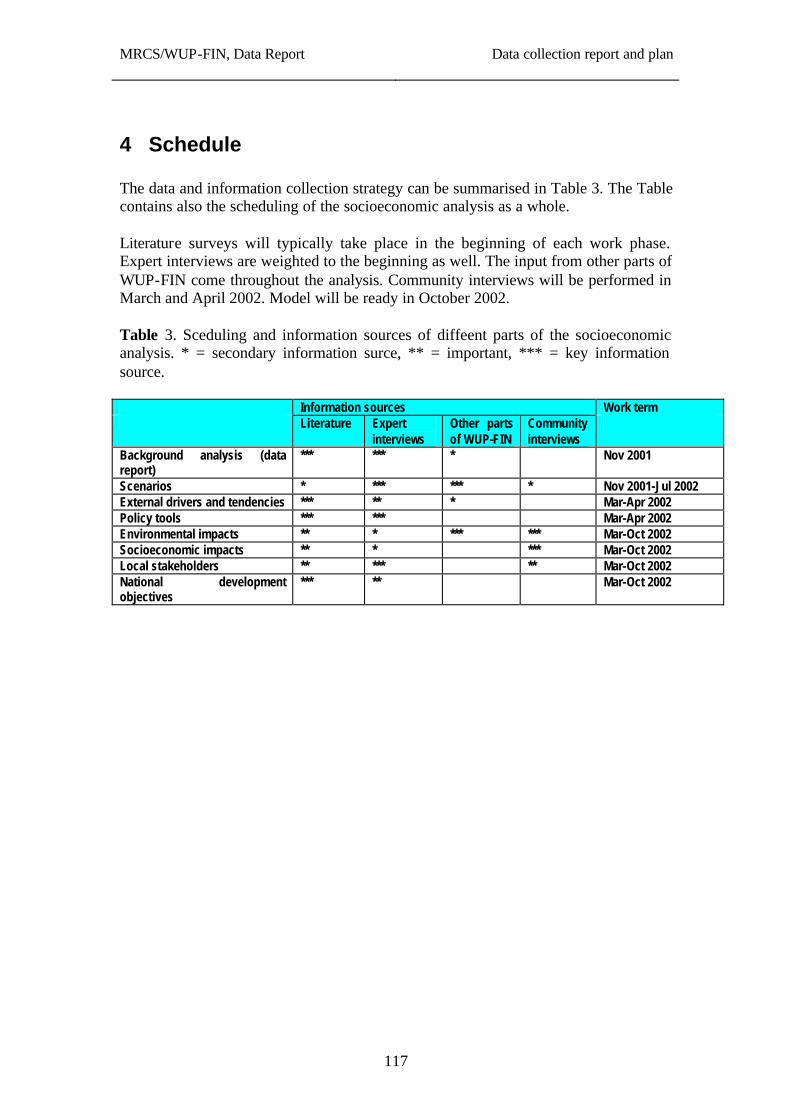
MRCS/WUP-FIN, Data Report
Data collection report and plan
117
4 Schedule The data and information collection strategy can be summarised in Table 3. The Table contains also the scheduling of the socioeconomic analysis as a whole. Literature surveys will typically take place in the beginning of each work phase. Expert interviews are weighted to the beginning as well. The input from other parts of WUP-FIN come throughout the analysis. Community interviews will be performed in March and April 2002. Model will be ready in October 2002. Table 3. Sceduling and information sources of diffeent parts of the socioeconomic analysis. * = secondary information surce, ** = important, *** = key information source. Information sources Work term Literature Expert
interviews Other parts of WUP-FIN
Community interviews
Background analysis (data report)
*** *** * Nov 2001
Scenarios * *** *** * Nov 2001-Jul 2002 External drivers and tendencies *** ** * Mar-Apr 2002 Policy tools *** *** Mar-Apr 2002 Environmental impacts ** * *** *** Mar-Oct 2002 Socioeconomic impacts ** * *** Mar-Oct 2002 Local stakeholders ** *** ** Mar-Oct 2002 National development objectives
*** ** Mar-Oct 2002
MRCS/WUP-FIN, Data Report
Data collection report and plan
118
REFERENCES ADB 2000. Protection and Management of Critical Wetlands in the Lower Mekong Basin-Interim Report ADB TA No 5822-REG. Asian Development Bank, Manila. Bonheur, N. 1996. Socio-economic study around Tonle Sap lake. In: Tonle Sap Watershed, Paper Presentations from the Tonle Sap Technical Workshop, 26 March, Ministry of Environment. Carbonnel, J.P. and Guiscafré, J. 1963. Grand Lac du Cambodge : Sédimentologie et Hydrologie 1962-1963. Mininstere des affaires étrangeres ? Comite du Mekong / Gouvernement du Cambodge. CEMP 1997. Report on Research in to the Use of Natural Resources in Bak Prea Village, Prey Chas Commune, Ek Phnom District, Battambang Province 23-28 June 1997. CEMP / CARERE-Battambang. Deap, L., Ly, S. and Van Zalinge, N.P. (Eds.) 1998. Catch Statistics of Cambodian Freshwater Fisheries. MRC/DoF/DANIDA Project for the Management of the Freshwater Capture Fisheries of Cambodia. Mekong River Commission, Phnom Penh. Degen, P., van Acker, F., van Zalinge, N., Thuok, N. and Loeung, D. 2000. Taken for granted: Conflicts over Cambodia’s freshwater fish resources. 8th IASCP Conference, Bloomington, IN, 31 May - 4 June, 2000. FAO 1994. Participatory Natural Resources Management in the Tonle Sap Region. GCP/CMB/002/BEL. Ministry of Agriculture, Ministry of Environment, Ministry of Rural Developemnt and FAO, Phnom Penh. FAO 2000. Environment: Concepts and Issues. FAO, Phnom Penh. www.un.org.kh/fao/environment/index.html Kosal, M. 1998. Social Implication of conservation of the designated “Prek Toal” core Area of the Tonle Sap Biosphere Reserve, Cambodia. 1998 UNESCO-MAB Young Scientists Research Award Report. Department of Nature Conservation and Protection, Ministry of Environment, Phnom Penh, Cambodia. www.unesco.org McElwee, P. and Horowitz, M.M. 1999. Environment and Society in the Lower Mekong Basin: a Landscaping Review. IDA Working Paper 99, Mekong River Basin Research and Capacity Building Initiative, Oxfam America SEA 15 / 97-99. MRCS/UNDP 1998. Natural Resources Based Developemnt Strategy for the Tonle Sap Area, Cambodia. Mekong River Commission Secretariat / United Nations Development Programme, Phnom Penh. Rainboth, W.J. 1996. Fishes of the Cambodian Mekong. FAO Species Identification Sheets for Fishery Purposes. FAO, Rome. Tana, T.S. 1996. Status of biodiversity of the Great Lake (Boeung Tonle Sap), an approach for better conservation and future sustainable development. In: Tonle Sap Watershed, Paper Presentations from the Tonle Sap Technical Workshop, 26 March, Ministry of Environment.
MRCS/WUP-FIN, Data Report
Data collection report and plan
119
UN 1999. PopMap: An Information and Decision Support System for Population Activities. United Nations, Statistical Division. http://www.un.org/Depts/unsd/softproj/download.htm UNDP 1999. Cambodia Human Development Report 1999. Ministry of Planning/UNDP, Phnom Penh. Van Zalinge, N.P., Nao, T., Touch, T.S. and Deap, L. 2000. Where there is water, there is fish? Cambodian fisheries issue in a Mekong River perspective. In: Ahmad, M. and Hirsch, P. (Ed.): Common Property in the Mekong: Issues of Sustainability and Subsistence: 37-48. ICLARM Studies and Reviews 26. Varis, O. 1998. A belief network approach to optimisation and parameter estimation: application to resource and environmental management. Artificial Intelligence, 101: 135-163. Varis, O. and Lahtela, V. 2001. Stakeholder analysis on the Senega l River and policy options. Manuscript. Helsinki University of Technology, Espoo, Finland. Wolanski, E.N., Nhan, N.H. and Spagnol, S. 1996 Fine sediment dynamics in the Mekong River Estuary, Vietnam. Estuarine, Coastal, and Shelf Science 43(5): 565-582. World Bank 1999. World Development Indicators on CD-ROM. World Bank, Washington D.C. World Bank 2001. World Development Indicators. World Bank, Washington D.C. Books and reports from MRC Library: Deap, L., Ly, S. and Van Zalinge, N.P. (Eds.) 1998. Catch Statistics of Cambodian Freshwater Fisheries. MRC/DoF/DANIDA Project for the Management of the Freshwater Capture Fisheries of Cambodia. Mekong River Commission, Phnom Penh. CIAP (Cambodia IRRI-Australia Project). Annual Reports.