Embed Size (px)
Citation preview
Waterfall ice: formation, structure and evolution
M. MONTAGNAT,1 J. WEISS,1 B. CINQUIN-LAPIERRE,1 P.A. LABORY,1 L. MOREAU,2
F. DAMILANO,3 D. LAVIGNE3
1Laboratoire de Glaciologie et Geophysique de l’Environnement, CNRS/Universite Joseph Fourier–Grenoble I, 54 rueMoliere, BP 96, 38402 Saint-Martin-d’Heres Cedex, France
E-mail: [email protected] EDYTEM, CNRS, Universite de Savoie, 73365 Le Bourget-du-Lac, France
3Mountain guide, Chamonix, France
ABSTRACT. For the first time, to our knowledge, a scientific study of the formation and evolution ofwaterfall ice, the ephemeral ice structures that form from the freezing of liquid water seeping on steeprock, was performed. We surveyed and analysed three waterfall ice structures near Glacier d’Argentiere,Mont Blanc massif, France, between winter 2007 and spring 2009. We reconstruct the global evolutionof two vertical ice structures using automatic digital cameras, while the internal ice microstructure wasanalysed using ice coring and sampling. Macro- and microstructural observations are considered, alongwith temperature conditions recorded at a nearby meteorological station and directly within the icestructure. They reveal that vertical structures initially grow rapidly from the aggregation of stalactiteswith microstructures indicative of temperature conditions during their crystallization. After this initialstage, the volume of the ice structure reaches an asymptotic value, as water continues to flow inside thestructure, isolated from the outside cold ice; the outer surface remains dry. At the end of the season, thecollapse of the free-standing structure does not occur by progressive melting, but is initiated by ahorizontal crack propagation at the top. The initiation of this crack seems to be triggered by a drastictemperature decrease.
1. INTRODUCTIONIn the early days of alpinism at the end of the 18th century,activity was intimately associated with scientific exploration.De Saussure performed barometric measurements at thesummit of Mont Blanc, France, in 1786, as well as extensiveobservations of the nature of glaciers (de Saussure, 1779–96). This helped to overcome the fear previously associatedwith high altitudes and with glaciers. Today, glacierstructure, dynamics and evolution are better understood.This understanding helps to guarantee the security ofalpinists and is generally included as a part of mountainguide education and training.
Until the 1970s, ice and snow climbing was largelyrestricted to the summer season on glaciers and perennialsnow/ice couloirs or gullies, i.e. on ice formed essentiallyfrom the densification of snow. In the early 1970s, someclimbers, particularly in North America, started to climb inwinter on ephemeral ice structures formed from the freezingof liquid water seeping on steep rock, i.e. on waterfall ice.This activity appeared a few years later in the Alps anddeveloped rapidly in the 1980s–90s. Nowadays, waterfallice climbing is a fully developed winter alpine activity: inFrance the number of ice climbers, regular or occasional,can be roughly estimated from the number of ice axes sold,~10 000. Ice climbing can be a risky activity as a result of theclimbers’ inaptitude, lack of experience or misjudgement(subjective risks), or due to natural hazards such as snowavalanches, ice-block falls, or collapse of the waterfallstructure (objective risks). This is not an anecdotal problem:for example, in France from 2000 to 2006, ice-climbingaccidents led to 148 rescue interventions, 47 severe injuriesand 22 deaths. Among these, subjective risks were the maincause, but ice-block falls and collapse of the structurecaused 14% and 5.5% of the accidents respectively.
To our knowledge, with the exception of one internalreport (Bianchi, 2004), there is no scientific study ofwaterfall ice in the literature. Beginning in the 2006/07winter, we have performed a case study of waterfall iceformation, structure, evolution and mechanical stability. Oursubject is a famous ice-climbing site near the icefall ofGlacier d’Argentiere, in the Mont Blanc massif. In this paper,we focus on ice formation, internal microstructure andevolution with weather conditions: How fast does a frozenwaterfall form in relation to air temperature? What can welearn about the growth mechanism from an analysis of icemicrostructure? Does this mechanism depend on the orien-tation of the waterfall, on its steepness? At this stage, ourgoal is of a fundamental nature rather than to evaluateobjective risks, even less to build a scale of risk in a waysimilar to that developed for snow avalanches (Ancey,1996). However, we hope that the observations reportedhere, when properly summarized for a non-scientificaudience, will ultimately help climbers and professionalguides to improve their evaluation of field conditions.
As the literature on this subject is nearly non-existent, ouraim is to provide initial observations and analyses that couldserve as a basis for future work.
2. SITUATIONFieldwork and observations were performed during theboreal winters of 2006/07, 2007/08 and 2008/09, on threedifferent frozen waterfalls situated on the left and right sidesof Glacier d’Argentiere below the icefall (458580 N; 68580 E)at ~2100ma.s.l. (top of the climbs) (Fig. 1). This altitude israther high for waterfall ice climbs in the Alps. Frozenwaterfalls form every year, during a relatively long periodapproximately from early December to March or April.
Journal of Glaciology, Vol. 56, No. 196, 2010 225

The main subject of our study, where most of theobservations and ice sampling were performed, is NuitBlanche, a very steep frozen waterfall, graded 6 on a scale of7 in climbing difficulty and first climbed in January 1994(Damilano and Perroux, 1998). It is about 120m long andthe top two-thirds is nearly vertical (Fig. 2). It is orientednorth-northeast and remains in shade for nearly all thewinter. The water flow feeding Nuit Blanche is mainlyartificial, emanating from the galleries of the Emosson Damat a regular rate throughout the season. In this study, we
focus on the top of Nuit Blanche, consisting, in most years,of a 16.5� 1m high vertical ice pillar, generally separatedfrom the rock cliff between its extremities, a situation knownas ‘free-standing’ by the international ice-climbing commu-nity (Fig. 3). Nuit Blanche’s configuration is supposed to berepresentative of similar steep ice climbs. Free-standing iceclimbs are challenging, owing to a higher risk of mechanicalcollapse than in other vertical ice structures such asstalactites (free at the bottom) or ice ‘columns’ anchoredto the cliff (Fig. 3).
Less frequent observations were also performed on twoother frozen waterfalls situated on the other side of theglacier canyon: Shiva Lingam (orientation west, length120m, graded 6) consisting of an impressive vertical free-standing section of 35�1m at the top, and Le Grand Bleu(orientation southwest, length 100m, graded 4+), a wide,less steep (~75–808) wall of ice anchored to the cliff(Damilano and Perroux, 1998) (Fig. 4). Owing to theirorientation, these two frozen waterfalls are affected by thesun for part of the afternoon, even in December. This differsstrongly from the situation at Nuit Blanche, and is expectedto affect the frozen waterfall evolution during the season (seebelow). The water flow feeding these frozen waterfalls isentirely natural, i.e. more dependent on precipitation andtemperature conditions (snowmelting).
These three frozen waterfalls are representative of high-level ice climbing, owing to their verticality and theobjective risks associated with the free-standing configura-tion of Nuit Blanche and Shiva Lingam.
Fig. 1. Summer satellite image of the Argentiere frozen waterfallarea (458580 N, 68580 E). Image # 2009 Institut GeographiqueNational, France.
Fig. 2. Overall view of the Nuit Blanche frozen waterfall. Camerasview the top free-standing section, where sampling and pressuremeasurements were performed.
Fig. 3. Sketch of (a) a stalactite, (b) a free-standing and (c) a columnsection of a frozen waterfall.
Fig. 4. View of the right bank of the free-standing section of the NuitBlanche frozen waterfall.
Montagnat and others: Waterfall ice226
3. EXPERIMENTAL PROTOCOL ANDOBSERVATIONS PERFORMEDVarious instruments, observations and samplings wereutilized to study the formation and evolution of the frozenwaterfalls at both the macro- and microstructural scale, andto relate the structure to meteorological conditions, waterfalltypology and possible other factors.
To follow the local meteorological conditions, we useddata recorded by a meteorological station installed withinthe framework of the GLACIOCLIM project (http://www-lgge.obs.ujf-grenoble.fr/ServiceObs/index.html) at 2400ma.s.l., on the moraine on the right-hand side of the glacierjust above the serac fall (Fig. 1). This station measures, with a30min periodicity, air temperature at 4.15m above ground,humidity, wind speed and direction, as well as incidentshort- and longwave radiation. We focused here essentiallyon air temperature, which has been corrected by atemperature/elevation gradient of 0.68C (100m)–1 to obtaintemperature at 2100ma.s.l. (top of the waterfalls).
During the 2007/08 and 2008/09 winters, two internalsensors were installed within the free-standing section ofNuit Blanche, one at the top of the ice column, the other 1mfrom the bottom. These sensors measured internal pressuredata which will be discussed elsewhere. They also recordedthe temperature within the ice, with a 10min periodicity. Atthe date of installation of the sensors, the ice temperature wasrecorded at a horizontal distance of a few centimetres fromthe surface, but this distance increased during the season asthe sensors were covered by newly grown ice, up to ~50 cm.
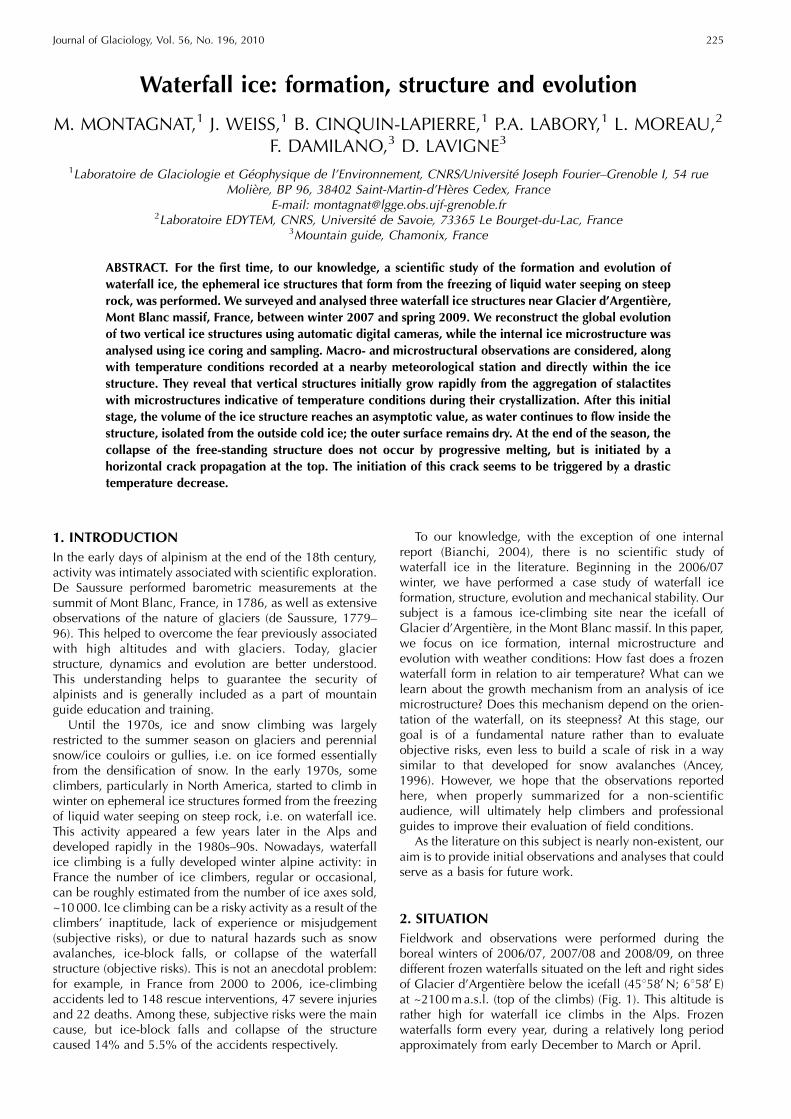
Ice was regularly (about every 2 weeks) sampled alongthe length and at the bottom of the free-standing section ofNuit Blanche. Two types of samples were taken, individualstalactites hanging parallel to the length of the free-standingsection, and horizontal 600mm ice cores (diameter70mm). These ice cores were sampled using a newportable drilling system (Fig. 5) developed at Laboratoirede Glaciologie et Geophysique de l’Environnement. Icecores were also sampled at different levels along the GrandBleu wall, as the mechanism of ice formation along thisnon-vertical wall is expected to be different. From all icesamples, we cut thin sections and measured ice micro-structure (grain size and shape) and associated fabrics usingan automatic ice-texture analyser (AITA; Russell-Head andWilson, 2001) (section 4.3).
To follow the global evolution of the frozen waterfallsthroughout the freezing season, digital cameras were
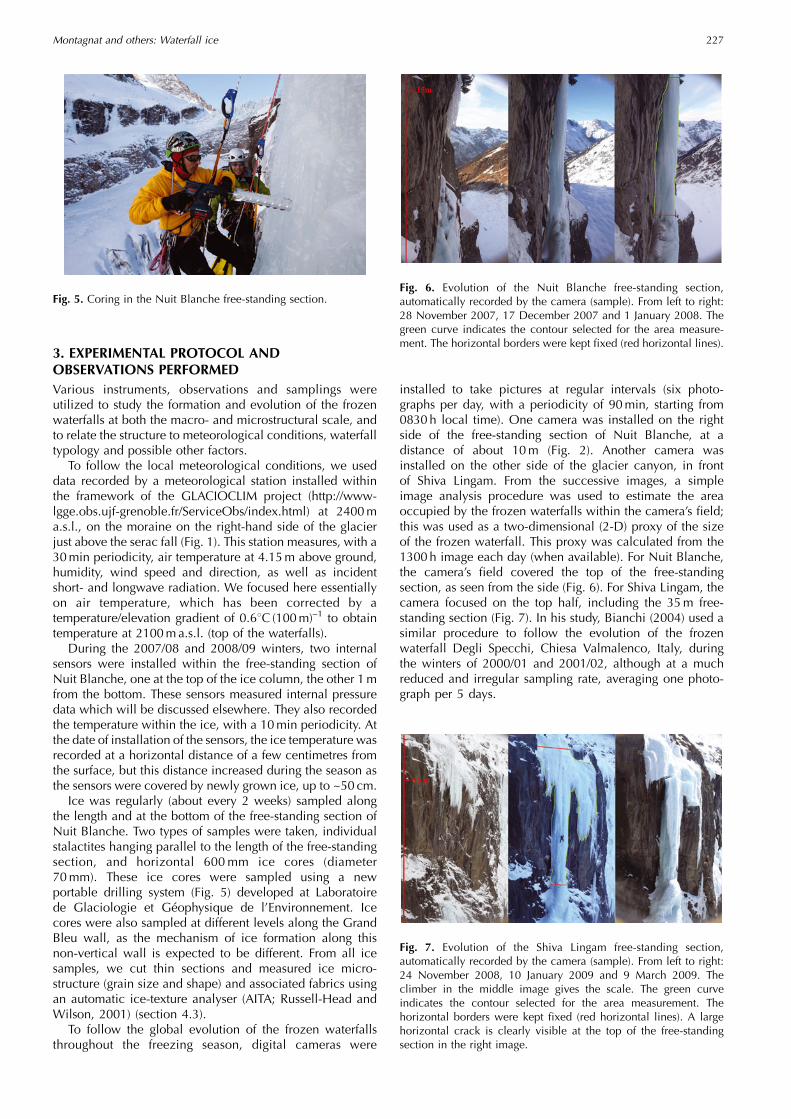
installed to take pictures at regular intervals (six photo-graphs per day, with a periodicity of 90min, starting from0830h local time). One camera was installed on the rightside of the free-standing section of Nuit Blanche, at adistance of about 10m (Fig. 2). Another camera wasinstalled on the other side of the glacier canyon, in frontof Shiva Lingam. From the successive images, a simpleimage analysis procedure was used to estimate the areaoccupied by the frozen waterfalls within the camera’s field;this was used as a two-dimensional (2-D) proxy of the sizeof the frozen waterfall. This proxy was calculated from the1300h image each day (when available). For Nuit Blanche,the camera’s field covered the top of the free-standingsection, as seen from the side (Fig. 6). For Shiva Lingam, thecamera focused on the top half, including the 35m free-standing section (Fig. 7). In his study, Bianchi (2004) used asimilar procedure to follow the evolution of the frozenwaterfall Degli Specchi, Chiesa Valmalenco, Italy, duringthe winters of 2000/01 and 2001/02, although at a muchreduced and irregular sampling rate, averaging one photo-graph per 5 days.
Fig. 5. Coring in the Nuit Blanche free-standing section.Fig. 6. Evolution of the Nuit Blanche free-standing section,automatically recorded by the camera (sample). From left to right:28 November 2007, 17 December 2007 and 1 January 2008. Thegreen curve indicates the contour selected for the area measure-ment. The horizontal borders were kept fixed (red horizontal lines).
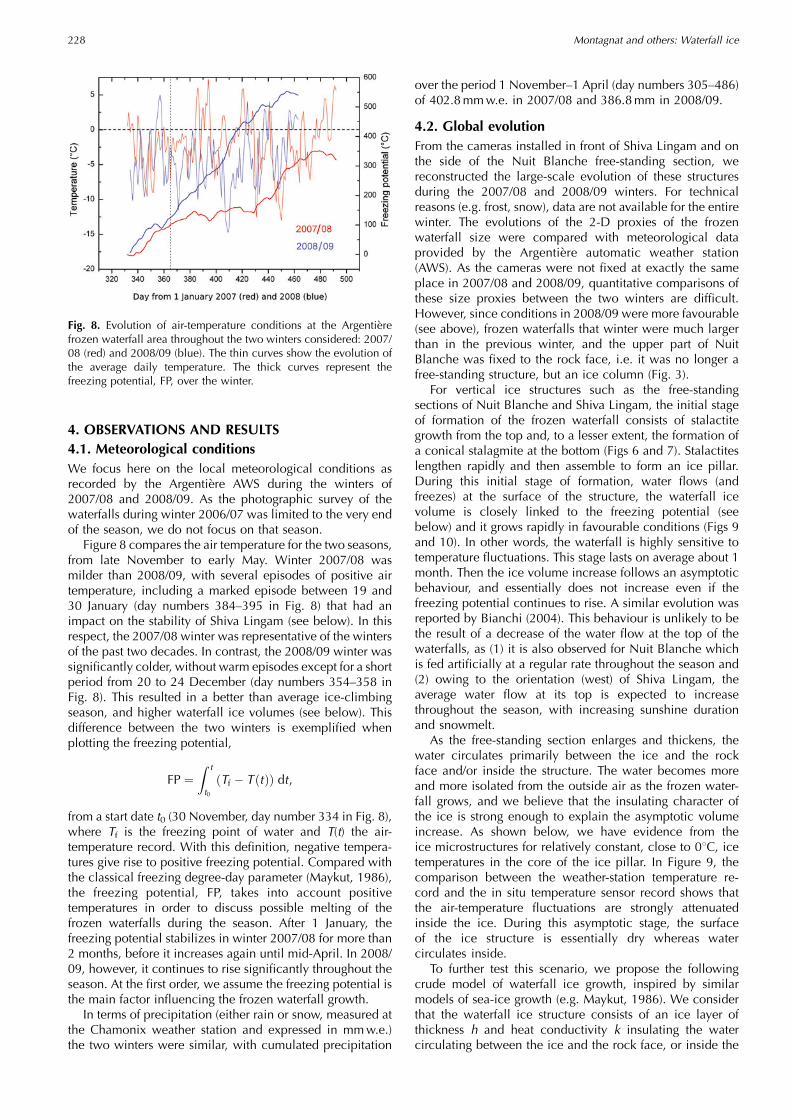
Fig. 7. Evolution of the Shiva Lingam free-standing section,automatically recorded by the camera (sample). From left to right:24 November 2008, 10 January 2009 and 9 March 2009. Theclimber in the middle image gives the scale. The green curveindicates the contour selected for the area measurement. Thehorizontal borders were kept fixed (red horizontal lines). A largehorizontal crack is clearly visible at the top of the free-standingsection in the right image.
Montagnat and others: Waterfall ice 227
4. OBSERVATIONS AND RESULTS4.1. Meteorological conditionsWe focus here on the local meteorological conditions asrecorded by the Argentiere AWS during the winters of2007/08 and 2008/09. As the photographic survey of thewaterfalls during winter 2006/07 was limited to the very endof the season, we do not focus on that season.
Figure 8 compares the air temperature for the two seasons,from late November to early May. Winter 2007/08 wasmilder than 2008/09, with several episodes of positive airtemperature, including a marked episode between 19 and30 January (day numbers 384–395 in Fig. 8) that had animpact on the stability of Shiva Lingam (see below). In thisrespect, the 2007/08 winter was representative of the wintersof the past two decades. In contrast, the 2008/09 winter wassignificantly colder, without warm episodes except for a shortperiod from 20 to 24 December (day numbers 354–358 inFig. 8). This resulted in a better than average ice-climbingseason, and higher waterfall ice volumes (see below). Thisdifference between the two winters is exemplified whenplotting the freezing potential,
FP ¼Z t
t0Tf � T ðtÞð Þ dt,
from a start date t0 (30 November, day number 334 in Fig. 8),where Tf is the freezing point of water and T(t) the air-temperature record. With this definition, negative tempera-tures give rise to positive freezing potential. Compared withthe classical freezing degree-day parameter (Maykut, 1986),the freezing potential, FP, takes into account positivetemperatures in order to discuss possible melting of thefrozen waterfalls during the season. After 1 January, thefreezing potential stabilizes in winter 2007/08 for more than2 months, before it increases again until mid-April. In 2008/09, however, it continues to rise significantly throughout theseason. At the first order, we assume the freezing potential isthe main factor influencing the frozen waterfall growth.
In terms of precipitation (either rain or snow, measured atthe Chamonix weather station and expressed in mmw.e.)the two winters were similar, with cumulated precipitation
over the period 1 November–1 April (day numbers 305–486)of 402.8mmw.e. in 2007/08 and 386.8mm in 2008/09.
4.2. Global evolutionFrom the cameras installed in front of Shiva Lingam and onthe side of the Nuit Blanche free-standing section, wereconstructed the large-scale evolution of these structuresduring the 2007/08 and 2008/09 winters. For technicalreasons (e.g. frost, snow), data are not available for the entirewinter. The evolutions of the 2-D proxies of the frozenwaterfall size were compared with meteorological dataprovided by the Argentiere automatic weather station(AWS). As the cameras were not fixed at exactly the sameplace in 2007/08 and 2008/09, quantitative comparisons ofthese size proxies between the two winters are difficult.However, since conditions in 2008/09 were more favourable(see above), frozen waterfalls that winter were much largerthan in the previous winter, and the upper part of NuitBlanche was fixed to the rock face, i.e. it was no longer afree-standing structure, but an ice column (Fig. 3).
For vertical ice structures such as the free-standingsections of Nuit Blanche and Shiva Lingam, the initial stageof formation of the frozen waterfall consists of stalactitegrowth from the top and, to a lesser extent, the formation ofa conical stalagmite at the bottom (Figs 6 and 7). Stalactiteslengthen rapidly and then assemble to form an ice pillar.During this initial stage of formation, water flows (andfreezes) at the surface of the structure, the waterfall icevolume is closely linked to the freezing potential (seebelow) and it grows rapidly in favourable conditions (Figs 9and 10). In other words, the waterfall is highly sensitive totemperature fluctuations. This stage lasts on average about 1month. Then the ice volume increase follows an asymptoticbehaviour, and essentially does not increase even if thefreezing potential continues to rise. A similar evolution wasreported by Bianchi (2004). This behaviour is unlikely to bethe result of a decrease of the water flow at the top of thewaterfalls, as (1) it is also observed for Nuit Blanche whichis fed artificially at a regular rate throughout the season and(2) owing to the orientation (west) of Shiva Lingam, theaverage water flow at its top is expected to increasethroughout the season, with increasing sunshine durationand snowmelt.
As the free-standing section enlarges and thickens, thewater circulates primarily between the ice and the rockface and/or inside the structure. The water becomes moreand more isolated from the outside air as the frozen water-fall grows, and we believe that the insulating character ofthe ice is strong enough to explain the asymptotic volumeincrease. As shown below, we have evidence from theice microstructures for relatively constant, close to 08C, icetemperatures in the core of the ice pillar. In Figure 9, thecomparison between the weather-station temperature re-cord and the in situ temperature sensor record shows thatthe air-temperature fluctuations are strongly attenuatedinside the ice. During this asymptotic stage, the surfaceof the ice structure is essentially dry whereas watercirculates inside.
To further test this scenario, we propose the followingcrude model of waterfall ice growth, inspired by similarmodels of sea-ice growth (e.g. Maykut, 1986). We considerthat the waterfall ice structure consists of an ice layer ofthickness h and heat conductivity k insulating the watercirculating between the ice and the rock face, or inside the
Fig. 8. Evolution of air-temperature conditions at the Argentierefrozen waterfall area throughout the two winters considered: 2007/08 (red) and 2008/09 (blue). The thin curves show the evolution ofthe average daily temperature. The thick curves represent thefreezing potential, FP, over the winter.
Montagnat and others: Waterfall ice228

ice structure, from the outside air (Fig. 11). The temperatureat the ice/water interface is at the freezing point of water, Tf,while the temperature at the outer surface follows the airtemperature T. This last point constitutes a first approximationof this model, especially when h is small. We assume a lineartemperature gradient within the ice, and Equation (1) definesthe conductive heat flux, Fc, knowing that Fc(x=0) = Fc(x= h):
Fc ¼ kh
T � Tfð Þ: ð1Þ
The growth (or melt) rate of the ice layer is then determinedfrom the energy balance:
��iLwdhdt
¼ Fc þ Fw, ð2Þ
where �i is the ice density, Lw is the specific latent heat offusion for water and Fw is the water heat flux. If the right-handside of Equation (2) is negative, i.e. if a negative conductiveheat flux induced by negative air temperatures overcomesthe heat flux carried by the water, the waterfall ice structuregrows, whereas a positive sum implies ice melting.
Assuming further a negligible water heat flux (Fw�0) aswell as h(t= t0) = 0 allows an analytical integration of
Equation (2):
hðtÞ2 ¼ 2k�iLw
Z t
t0Tf � T ðtÞð Þ dt ¼ 2k
�iLwFP: ð3Þ
If the freezing potential increases roughly linearly with time,
Fig. 9. Global evolution of the Nuit Blanche free-standing section:(a) 2007/08, (b) 2008/09. Blue thick curve: normalized waterfallarea as seen from the camera (Fig. 5), a proxy of the ice structuresize. Red thin curve: evolution of air temperature. Black thin curve:evolution of the ice temperature inside the structure. Magenta thickcurve: freezing potential.
Fig. 10. Global evolution of Shiva Lingam: (a) 2007/08, (b) 2008/09.Blue thick curve: normalized waterfall area as seen from thecamera (Fig. 6), a proxy of the ice structure size. Red thin curve:evolution of air temperature. Magenta thick curve: freezingpotential.
Fig. 11. Schematic illustration of a simple waterfall ice-growthmodel (details in text).
Montagnat and others: Waterfall ice 229
such as in 2008/09 (Fig. 8), then h(t) ~ t1/2, i.e. the growthrate decreases with time but never vanishes, in contradictionwith our observations (Fig. 10) and stressing the role of thewater heat flux Fw.
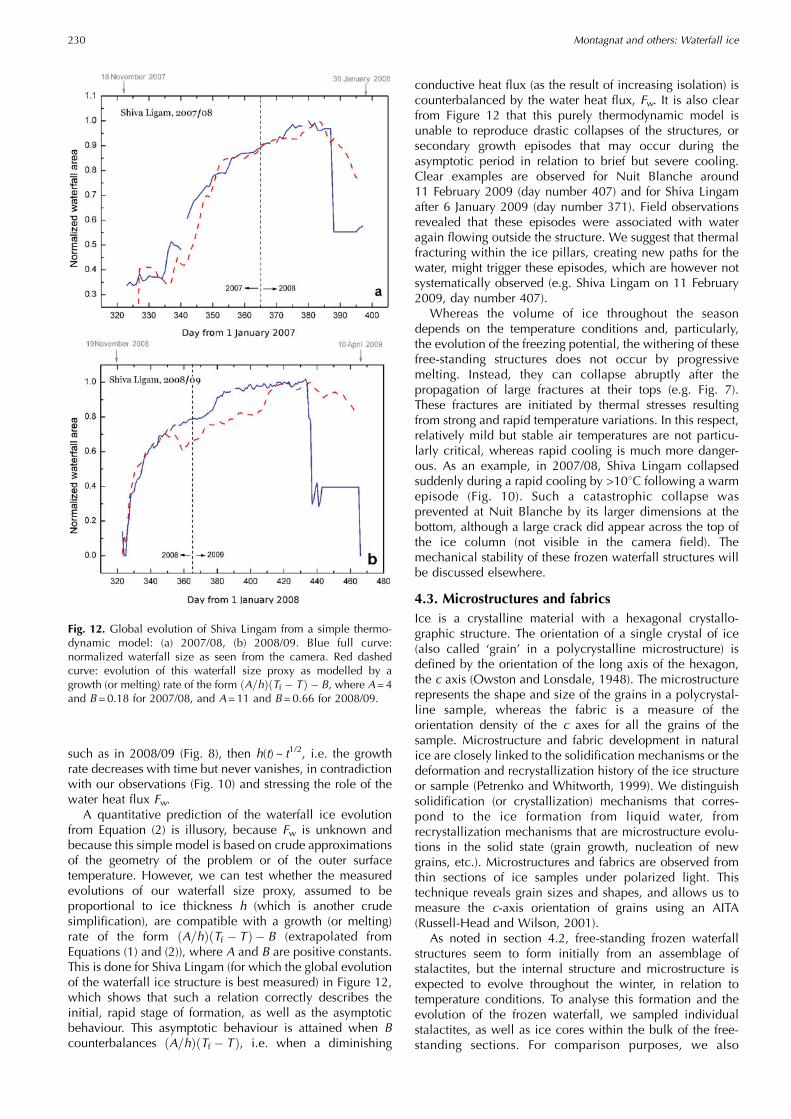
A quantitative prediction of the waterfall ice evolutionfrom Equation (2) is illusory, because Fw is unknown andbecause this simple model is based on crude approximationsof the geometry of the problem or of the outer surfacetemperature. However, we can test whether the measuredevolutions of our waterfall size proxy, assumed to beproportional to ice thickness h (which is another crudesimplification), are compatible with a growth (or melting)rate of the form ðA=hÞðTf � T Þ � B (extrapolated fromEquations (1) and (2)), where A and B are positive constants.This is done for Shiva Lingam (for which the global evolutionof the waterfall ice structure is best measured) in Figure 12,which shows that such a relation correctly describes theinitial, rapid stage of formation, as well as the asymptoticbehaviour. This asymptotic behaviour is attained when Bcounterbalances ðA=hÞ Tf � Tð Þ, i.e. when a diminishing
conductive heat flux (as the result of increasing isolation) iscounterbalanced by the water heat flux, Fw. It is also clearfrom Figure 12 that this purely thermodynamic model isunable to reproduce drastic collapses of the structures, orsecondary growth episodes that may occur during theasymptotic period in relation to brief but severe cooling.Clear examples are observed for Nuit Blanche around11 February 2009 (day number 407) and for Shiva Lingamafter 6 January 2009 (day number 371). Field observationsrevealed that these episodes were associated with wateragain flowing outside the structure. We suggest that thermalfracturing within the ice pillars, creating new paths for thewater, might trigger these episodes, which are however notsystematically observed (e.g. Shiva Lingam on 11 February2009, day number 407).
Whereas the volume of ice throughout the seasondepends on the temperature conditions and, particularly,the evolution of the freezing potential, the withering of thesefree-standing structures does not occur by progressivemelting. Instead, they can collapse abruptly after thepropagation of large fractures at their tops (e.g. Fig. 7).These fractures are initiated by thermal stresses resultingfrom strong and rapid temperature variations. In this respect,relatively mild but stable air temperatures are not particu-larly critical, whereas rapid cooling is much more danger-ous. As an example, in 2007/08, Shiva Lingam collapsedsuddenly during a rapid cooling by >108C following a warmepisode (Fig. 10). Such a catastrophic collapse wasprevented at Nuit Blanche by its larger dimensions at thebottom, although a large crack did appear across the top ofthe ice column (not visible in the camera field). Themechanical stability of these frozen waterfall structures willbe discussed elsewhere.
4.3. Microstructures and fabricsIce is a crystalline material with a hexagonal crystallo-graphic structure. The orientation of a single crystal of ice(also called ‘grain’ in a polycrystalline microstructure) isdefined by the orientation of the long axis of the hexagon,the c axis (Owston and Lonsdale, 1948). The microstructurerepresents the shape and size of the grains in a polycrystal-line sample, whereas the fabric is a measure of theorientation density of the c axes for all the grains of thesample. Microstructure and fabric development in naturalice are closely linked to the solidification mechanisms or thedeformation and recrystallization history of the ice structureor sample (Petrenko and Whitworth, 1999). We distinguishsolidification (or crystallization) mechanisms that corres-pond to the ice formation from liquid water, fromrecrystallization mechanisms that are microstructure evolu-tions in the solid state (grain growth, nucleation of newgrains, etc.). Microstructures and fabrics are observed fromthin sections of ice samples under polarized light. Thistechnique reveals grain sizes and shapes, and allows us tomeasure the c-axis orientation of grains using an AITA(Russell-Head and Wilson, 2001).
As noted in section 4.2, free-standing frozen waterfallstructures seem to form initially from an assemblage ofstalactites, but the internal structure and microstructure isexpected to evolve throughout the winter, in relation totemperature conditions. To analyse this formation and theevolution of the frozen waterfall, we sampled individualstalactites, as well as ice cores within the bulk of the free-standing sections. For comparison purposes, we also
Fig. 12. Global evolution of Shiva Lingam from a simple thermo-dynamic model: (a) 2007/08, (b) 2008/09. Blue full curve:normalized waterfall size as seen from the camera. Red dashedcurve: evolution of this waterfall size proxy as modelled by agrowth (or melting) rate of the form ðA=hÞ Tf � Tð Þ � B, where A=4and B=0.18 for 2007/08, and A=11 and B=0.66 for 2008/09.
Montagnat and others: Waterfall ice230
analysed ice cores extracted from frozen waterfalls whosestructure is a non-vertical ice layer anchored to the rock-face(e.g. Le Grand Bleu).
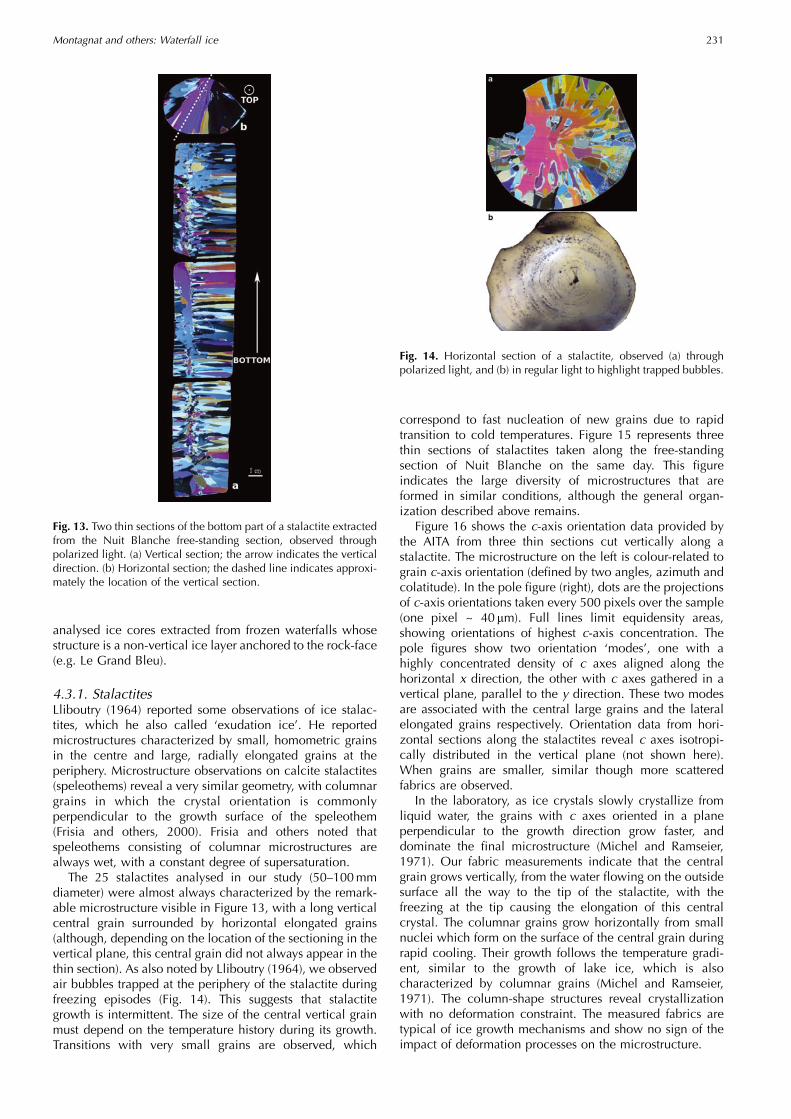
4.3.1. StalactitesLliboutry (1964) reported some observations of ice stalac-tites, which he also called ‘exudation ice’. He reportedmicrostructures characterized by small, homometric grainsin the centre and large, radially elongated grains at theperiphery. Microstructure observations on calcite stalactites(speleothems) reveal a very similar geometry, with columnargrains in which the crystal orientation is commonlyperpendicular to the growth surface of the speleothem(Frisia and others, 2000). Frisia and others noted thatspeleothems consisting of columnar microstructures arealways wet, with a constant degree of supersaturation.
The 25 stalactites analysed in our study (50–100mmdiameter) were almost always characterized by the remark-able microstructure visible in Figure 13, with a long verticalcentral grain surrounded by horizontal elongated grains(although, depending on the location of the sectioning in thevertical plane, this central grain did not always appear in thethin section). As also noted by Lliboutry (1964), we observedair bubbles trapped at the periphery of the stalactite duringfreezing episodes (Fig. 14). This suggests that stalactitegrowth is intermittent. The size of the central vertical grainmust depend on the temperature history during its growth.Transitions with very small grains are observed, which
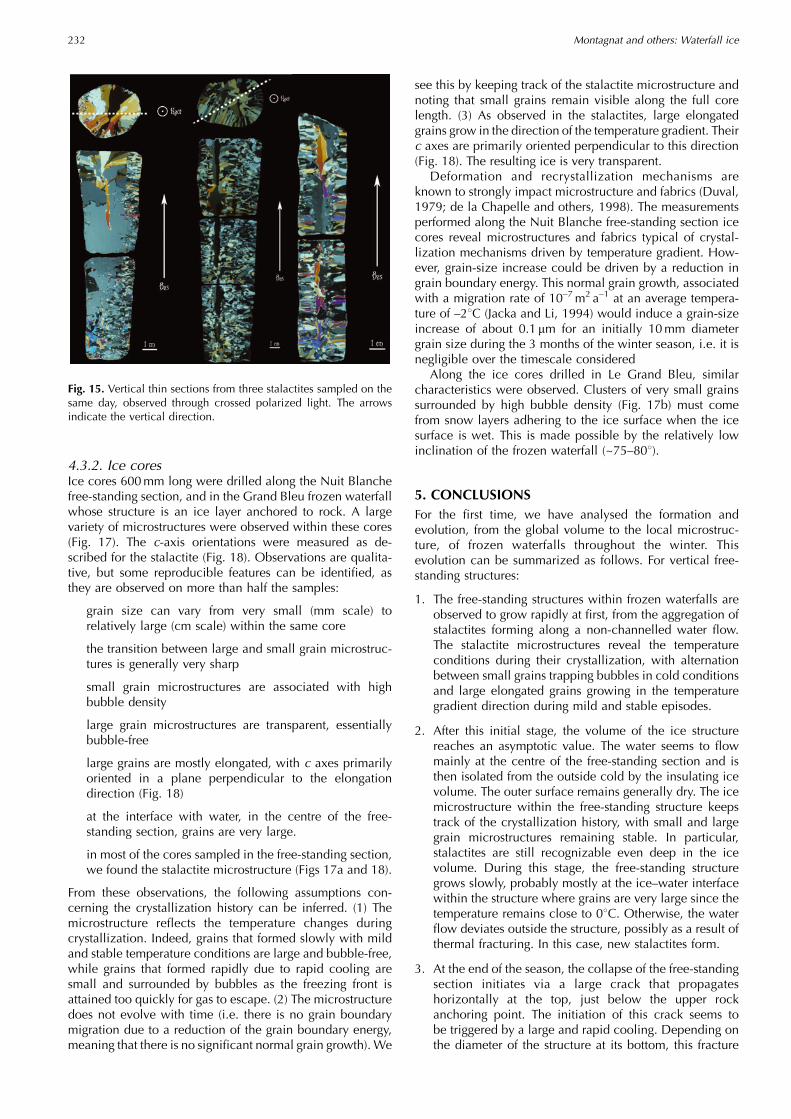
correspond to fast nucleation of new grains due to rapidtransition to cold temperatures. Figure 15 represents threethin sections of stalactites taken along the free-standingsection of Nuit Blanche on the same day. This figureindicates the large diversity of microstructures that areformed in similar conditions, although the general organ-ization described above remains.
Figure 16 shows the c-axis orientation data provided bythe AITA from three thin sections cut vertically along astalactite. The microstructure on the left is colour-related tograin c-axis orientation (defined by two angles, azimuth andcolatitude). In the pole figure (right), dots are the projectionsof c-axis orientations taken every 500 pixels over the sample(one pixel ~ 40 mm). Full lines limit equidensity areas,showing orientations of highest c-axis concentration. Thepole figures show two orientation ‘modes’, one with ahighly concentrated density of c axes aligned along thehorizontal x direction, the other with c axes gathered in avertical plane, parallel to the y direction. These two modesare associated with the central large grains and the lateralelongated grains respectively. Orientation data from hori-zontal sections along the stalactites reveal c axes isotropi-cally distributed in the vertical plane (not shown here).When grains are smaller, similar though more scatteredfabrics are observed.
In the laboratory, as ice crystals slowly crystallize fromliquid water, the grains with c axes oriented in a planeperpendicular to the growth direction grow faster, anddominate the final microstructure (Michel and Ramseier,1971). Our fabric measurements indicate that the centralgrain grows vertically, from the water flowing on the outsidesurface all the way to the tip of the stalactite, with thefreezing at the tip causing the elongation of this centralcrystal. The columnar grains grow horizontally from smallnuclei which form on the surface of the central grain duringrapid cooling. Their growth follows the temperature gradi-ent, similar to the growth of lake ice, which is alsocharacterized by columnar grains (Michel and Ramseier,1971). The column-shape structures reveal crystallizationwith no deformation constraint. The measured fabrics aretypical of ice growth mechanisms and show no sign of theimpact of deformation processes on the microstructure.
Fig. 13. Two thin sections of the bottom part of a stalactite extractedfrom the Nuit Blanche free-standing section, observed throughpolarized light. (a) Vertical section; the arrow indicates the verticaldirection. (b) Horizontal section; the dashed line indicates approxi-mately the location of the vertical section.
Fig. 14. Horizontal section of a stalactite, observed (a) throughpolarized light, and (b) in regular light to highlight trapped bubbles.
Montagnat and others: Waterfall ice 231
4.3.2. Ice coresIce cores 600mm long were drilled along the Nuit Blanchefree-standing section, and in the Grand Bleu frozen waterfallwhose structure is an ice layer anchored to rock. A largevariety of microstructures were observed within these cores(Fig. 17). The c-axis orientations were measured as de-scribed for the stalactite (Fig. 18). Observations are qualita-tive, but some reproducible features can be identified, asthey are observed on more than half the samples:
grain size can vary from very small (mm scale) torelatively large (cm scale) within the same core
the transition between large and small grain microstruc-tures is generally very sharp
small grain microstructures are associated with highbubble density
large grain microstructures are transparent, essentiallybubble-free
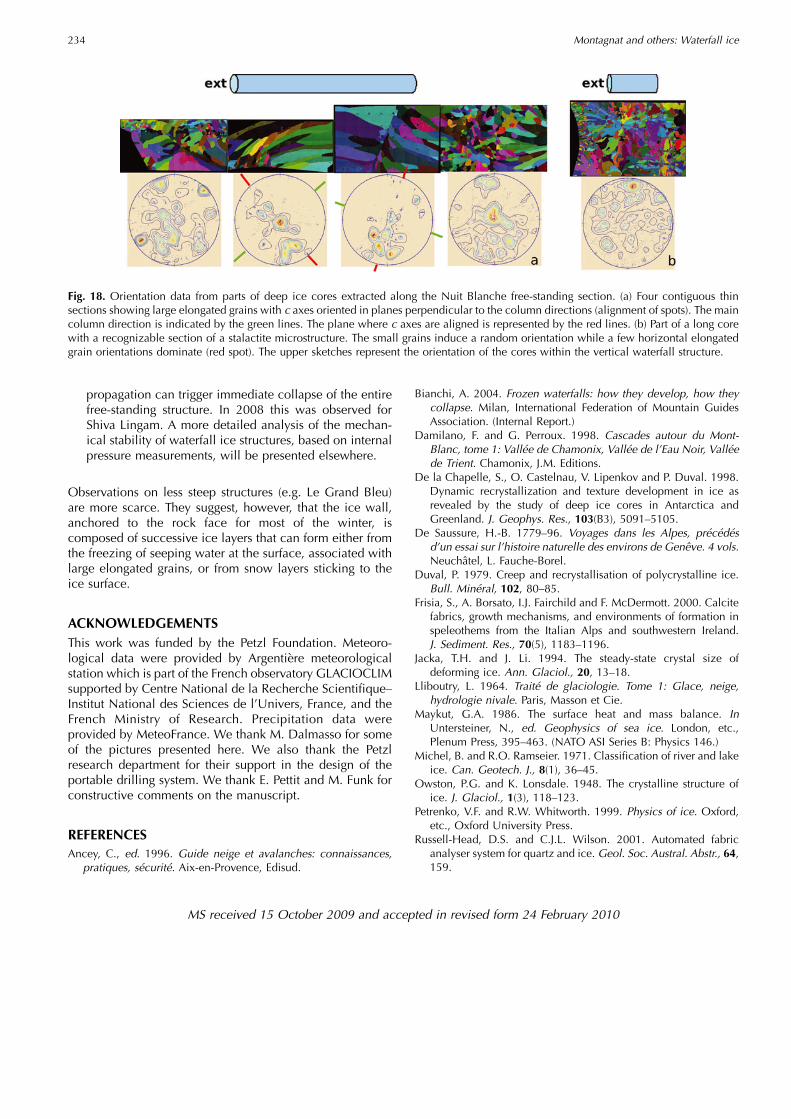
large grains are mostly elongated, with c axes primarilyoriented in a plane perpendicular to the elongationdirection (Fig. 18)
at the interface with water, in the centre of the free-standing section, grains are very large.
in most of the cores sampled in the free-standing section,we found the stalactite microstructure (Figs 17a and 18).
From these observations, the following assumptions con-cerning the crystallization history can be inferred. (1) Themicrostructure reflects the temperature changes duringcrystallization. Indeed, grains that formed slowly with mildand stable temperature conditions are large and bubble-free,while grains that formed rapidly due to rapid cooling aresmall and surrounded by bubbles as the freezing front isattained too quickly for gas to escape. (2) The microstructuredoes not evolve with time (i.e. there is no grain boundarymigration due to a reduction of the grain boundary energy,meaning that there is no significant normal grain growth). We
see this by keeping track of the stalactite microstructure andnoting that small grains remain visible along the full corelength. (3) As observed in the stalactites, large elongatedgrains grow in the direction of the temperature gradient. Theirc axes are primarily oriented perpendicular to this direction(Fig. 18). The resulting ice is very transparent.
Deformation and recrystallization mechanisms areknown to strongly impact microstructure and fabrics (Duval,1979; de la Chapelle and others, 1998). The measurementsperformed along the Nuit Blanche free-standing section icecores reveal microstructures and fabrics typical of crystal-lization mechanisms driven by temperature gradient. How-ever, grain-size increase could be driven by a reduction ingrain boundary energy. This normal grain growth, associatedwith a migration rate of 10–7m2 a–1 at an average tempera-ture of –28C (Jacka and Li, 1994) would induce a grain-sizeincrease of about 0.1 mm for an initially 10mm diametergrain size during the 3 months of the winter season, i.e. it isnegligible over the timescale considered
Along the ice cores drilled in Le Grand Bleu, similarcharacteristics were observed. Clusters of very small grainssurrounded by high bubble density (Fig. 17b) must comefrom snow layers adhering to the ice surface when the icesurface is wet. This is made possible by the relatively lowinclination of the frozen waterfall (~75–808).
5. CONCLUSIONSFor the first time, we have analysed the formation andevolution, from the global volume to the local microstruc-ture, of frozen waterfalls throughout the winter. Thisevolution can be summarized as follows. For vertical free-standing structures:
1. The free-standing structures within frozen waterfalls areobserved to grow rapidly at first, from the aggregation ofstalactites forming along a non-channelled water flow.The stalactite microstructures reveal the temperatureconditions during their crystallization, with alternationbetween small grains trapping bubbles in cold conditionsand large elongated grains growing in the temperaturegradient direction during mild and stable episodes.
2. After this initial stage, the volume of the ice structurereaches an asymptotic value. The water seems to flowmainly at the centre of the free-standing section and isthen isolated from the outside cold by the insulating icevolume. The outer surface remains generally dry. The icemicrostructure within the free-standing structure keepstrack of the crystallization history, with small and largegrain microstructures remaining stable. In particular,stalactites are still recognizable even deep in the icevolume. During this stage, the free-standing structuregrows slowly, probably mostly at the ice–water interfacewithin the structure where grains are very large since thetemperature remains close to 08C. Otherwise, the waterflow deviates outside the structure, possibly as a result ofthermal fracturing. In this case, new stalactites form.
3. At the end of the season, the collapse of the free-standingsection initiates via a large crack that propagateshorizontally at the top, just below the upper rockanchoring point. The initiation of this crack seems tobe triggered by a large and rapid cooling. Depending onthe diameter of the structure at its bottom, this fracture
Fig. 15. Vertical thin sections from three stalactites sampled on thesame day, observed through crossed polarized light. The arrowsindicate the vertical direction.
Montagnat and others: Waterfall ice232
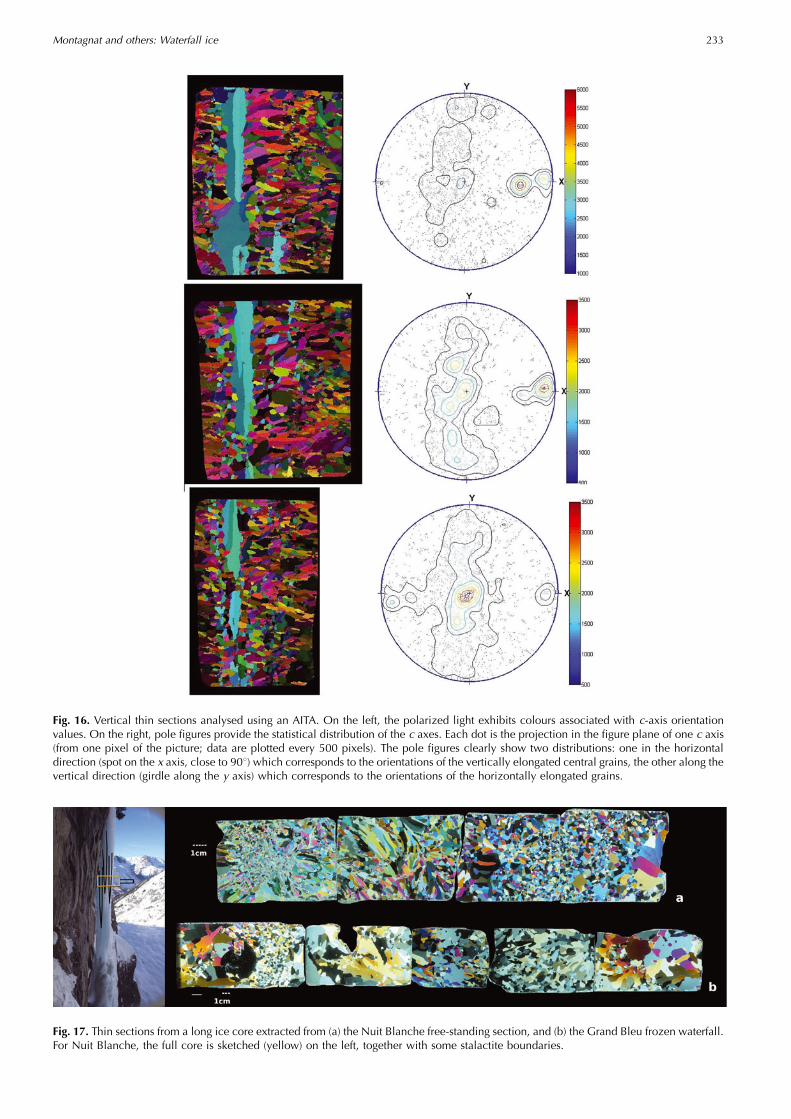
Fig. 16. Vertical thin sections analysed using an AITA. On the left, the polarized light exhibits colours associated with c-axis orientationvalues. On the right, pole figures provide the statistical distribution of the c axes. Each dot is the projection in the figure plane of one c axis(from one pixel of the picture; data are plotted every 500 pixels). The pole figures clearly show two distributions: one in the horizontaldirection (spot on the x axis, close to 908) which corresponds to the orientations of the vertically elongated central grains, the other along thevertical direction (girdle along the y axis) which corresponds to the orientations of the horizontally elongated grains.
Fig. 17. Thin sections from a long ice core extracted from (a) the Nuit Blanche free-standing section, and (b) the Grand Bleu frozen waterfall.For Nuit Blanche, the full core is sketched (yellow) on the left, together with some stalactite boundaries.
Montagnat and others: Waterfall ice 233
propagation can trigger immediate collapse of the entirefree-standing structure. In 2008 this was observed forShiva Lingam. A more detailed analysis of the mechan-ical stability of waterfall ice structures, based on internalpressure measurements, will be presented elsewhere.
Observations on less steep structures (e.g. Le Grand Bleu)are more scarce. They suggest, however, that the ice wall,anchored to the rock face for most of the winter, iscomposed of successive ice layers that can form either fromthe freezing of seeping water at the surface, associated withlarge elongated grains, or from snow layers sticking to theice surface.
ACKNOWLEDGEMENTSThis work was funded by the Petzl Foundation. Meteoro-logical data were provided by Argentiere meteorologicalstation which is part of the French observatory GLACIOCLIMsupported by Centre National de la Recherche Scientifique–Institut National des Sciences de l’Univers, France, and theFrench Ministry of Research. Precipitation data wereprovided by MeteoFrance. We thank M. Dalmasso for someof the pictures presented here. We also thank the Petzlresearch department for their support in the design of theportable drilling system. We thank E. Pettit and M. Funk forconstructive comments on the manuscript.
REFERENCESAncey, C., ed. 1996. Guide neige et avalanches: connaissances,
pratiques, securite. Aix-en-Provence, Edisud.
Bianchi, A. 2004. Frozen waterfalls: how they develop, how theycollapse. Milan, International Federation of Mountain GuidesAssociation. (Internal Report.)
Damilano, F. and G. Perroux. 1998. Cascades autour du Mont-Blanc, tome 1: Vallee de Chamonix, Vallee de l’Eau Noir, Valleede Trient. Chamonix, J.M. Editions.
De la Chapelle, S., O. Castelnau, V. Lipenkov and P. Duval. 1998.Dynamic recrystallization and texture development in ice asrevealed by the study of deep ice cores in Antarctica andGreenland. J. Geophys. Res., 103(B3), 5091–5105.
De Saussure, H.-B. 1779–96. Voyages dans les Alpes, precedesd’un essai sur l’histoire naturelle des environs de Geneve. 4 vols.Neuchatel, L. Fauche-Borel.
Duval, P. 1979. Creep and recrystallisation of polycrystalline ice.Bull. Mineral, 102, 80–85.
Frisia, S., A. Borsato, I.J. Fairchild and F. McDermott. 2000. Calcitefabrics, growth mechanisms, and environments of formation inspeleothems from the Italian Alps and southwestern Ireland.J. Sediment. Res., 70(5), 1183–1196.
Jacka, T.H. and J. Li. 1994. The steady-state crystal size ofdeforming ice. Ann. Glaciol., 20, 13–18.
Lliboutry, L. 1964. Traite de glaciologie. Tome 1: Glace, neige,hydrologie nivale. Paris, Masson et Cie.
Maykut, G.A. 1986. The surface heat and mass balance. InUntersteiner, N., ed. Geophysics of sea ice. London, etc.,Plenum Press, 395–463. (NATO ASI Series B: Physics 146.)
Michel, B. and R.O. Ramseier. 1971. Classification of river and lakeice. Can. Geotech. J., 8(1), 36–45.
Owston, P.G. and K. Lonsdale. 1948. The crystalline structure ofice. J. Glaciol., 1(3), 118–123.
Petrenko, V.F. and R.W. Whitworth. 1999. Physics of ice. Oxford,etc., Oxford University Press.
Russell-Head, D.S. and C.J.L. Wilson. 2001. Automated fabricanalyser system for quartz and ice. Geol. Soc. Austral. Abstr., 64,159.
Fig. 18. Orientation data from parts of deep ice cores extracted along the Nuit Blanche free-standing section. (a) Four contiguous thinsections showing large elongated grains with c axes oriented in planes perpendicular to the column directions (alignment of spots). The maincolumn direction is indicated by the green lines. The plane where c axes are aligned is represented by the red lines. (b) Part of a long corewith a recognizable section of a stalactite microstructure. The small grains induce a random orientation while a few horizontal elongatedgrain orientations dominate (red spot). The upper sketches represent the orientation of the cores within the vertical waterfall structure.
MS received 15 October 2009 and accepted in revised form 24 February 2010
Montagnat and others: Waterfall ice234