Embed Size (px)
Citation preview
ORIGINAL RESEARCHpublished: 29 February 2016
doi: 10.3389/fchem.2016.00010
Frontiers in Chemistry | www.frontiersin.org 1 February 2016 | Volume 4 | Article 10
Edited by:
Giuseppe Mensitieri,
University of Naples Federico II, Italy
Reviewed by:
Luigi Grassia,
Second University of Naples, Italy
Marianna Pannico,
Institute of Chemistry and Technology
of Polymers, Italy
*Correspondence:
Notburga Gierlinger
Specialty section:
This article was submitted to
Polymer Chemistry,
a section of the journal
Frontiers in Chemistry
Received: 30 September 2015
Accepted: 11 February 2016
Published: 29 February 2016
Citation:
Prats Mateu B, Hauser MT, Heredia A
and Gierlinger N (2016) Waterproofing
in Arabidopsis: Following Phenolics
and Lipids In situ by Confocal Raman
Microscopy. Front. Chem. 4:10.
doi: 10.3389/fchem.2016.00010
Waterproofing in Arabidopsis:Following Phenolics and Lipids Insitu by Confocal Raman MicroscopyBatirtze Prats Mateu 1, Marie Theres Hauser 2, Antonio Heredia 3 and
Notburga Gierlinger 1, 4, 5*
1Department of Material Sciences and Process Engineering, University of Natural Resources and Life Sciences, Vienna,
Austria, 2Department of Applied Genetics and Cell Biology, University of Natural Resources and Life Sciences, Vienna,
Austria, 3Department of Molecular Biology and Biochemistry, University of Malaga, Malaga, Spain, 4 Institute for Building
Materials, Eidgenössische Technische Hochschule Zurich, Zurich, Switzerland, 5 Applied Wood Research Laboratory,
Empa-Swiss Federal Laboratories for Material Testing and Research, Dübendorf, Switzerland
Waterproofing of the aerial organs of plants imposed a big evolutionary step during the
colonization of the terrestrial environment. The main plant polymers responsible of water
repelling are lipids and lignin, which play also important roles in the protection against
biotic/abiotic stresses, regulation of flux of gases and solutes, and mechanical stability
against negative pressure, among others. While the lipids, non-polymerized cuticular
waxes together with the polymerized cutin, protect the outer surface, lignin is confined
to the secondary cell wall within mechanical important tissues. In the present work a
micro cross-section of the stem of Arabidopsis thaliana was used to track in situ the
distribution of these non-carbohydrate polymers by Confocal RamanMicroscopy. Raman
hyperspectral imaging gives a molecular fingerprint of the native waterproofing tissues
and cells with diffraction limited spatial resolution (∼300 nm) at relatively high speed and
without any tedious sample preparation. Lipids and lignified tissues as well as their effect
on water content was directly visualized by integrating the 1299, 1600, and 3400 cm−1
band, respectively. For detailed insights into compositional changes of these polymers
vertex component analysis was performed on selected sample positions. Changes have
been elucidated in the composition of lignin within the lignified tissues and between
interfascicular fibers and xylem vessels. Hydrophobizing changes were revealed from
the epidermal layer to the cuticle as well as a change in the aromatic composition
within the cuticle of trichomes. To verify Raman signatures of different waterproofing
polymers additionally Raman spectra of the cuticle and cutin monomer from tomato
(Solanum lycopersicum) as well as aromatic model polymers (milled wood lignin and
dehydrogenation polymer of coniferyl alcohol) and phenolic acids were acquired.
Keywords: lignin, cutin, wax, Raman, cuticle, secondary cell wall, trichomes
INTRODUCTION
Arabidopsis thaliana is the model organism for plant genetics and biology due to, among otherreasons, the small genome size, its short generation time, the knowledge of its whole genomicsequence, the large amount of genetic resources (i.e., mutants), and simple genetic transformationand cultivation protocols (Kaul et al., 2000). Arabidopsis has been extensively used to reveal the
Prats Mateu et al. Raman Imaging of Waterproofing Polymers
genetic basis and study the different plant polymers e.g., cellulose,hemicellulose, pectin, lignin, cutin, wax, and suberin (Beissonet al., 2012; Atmodjo et al., 2013; Pauly et al., 2013; McFarlaneet al., 2014; Barros et al., 2015). The non-polysaccharidepolymers, lignin, cutin, and suberin played an evolutionaryimportant role during the transition from water to land byconferring waterproofing properties and mechanical strength.The need for mechanical support and the intensified waterdemand due to plant architectural changes such as branching andincreasing height triggered the occurrence of the aforementionedpolymers (Langdale and Harrison, 2008).
Lignin is a branched heterogeneous phenolic polymeroriginating from the oxidation of precursors called monolignols(p-coumaryl, coniferyl, and sinapyl alcohols) and subsequentradical coupling (Boerjan et al., 2003). It is known to actas an embedding media (together with the hemicelluloses)for the cellulose fibrils during secondary cell wall formation(Carpita et al., 1993). The hierarchical nature of biomaterials—the optimization at different length scales (levels of hierarchy)—isresponsible for the achieved macroscopic properties (Berganderand Salmen, 2000). The reinforced bio-composite (Fratzl et al.,2004) has elevated resistance to compression failure and superiorhardness (Gindl et al., 2004; de Borst et al., 2012; Burgertand Keplinger, 2013). Lignin stiffens the cell wall (Jones et al.,2001) and confers waterproofness and resistance to the negativepressure generated during water transport in the xylem aswell as to biotic and abiotic stresses (Sarkanen and Ludwig,1971). Arabidopsis has been used to study the secondary xylemdevelopment as model for wood formation (Chaffey et al., 2002)and lignification (Dima et al., 2015).
Cutin and wax form a lipid barrier called cuticle, which coversall aerial parts of land plants. The cuticle appeared in earlyplants around 450 million years ago and has been preservedbecause of its essential role during the colonization of land(Edwards, 1993) challenging gravity, desiccation, and brusquechanges in temperature (Waters, 2003). The cuticle has furtherfunctions including abiotic and biotic stress protection (e.g.,against pathogens or insects), the regulation of the flux of water,gases, and solutes and the sealing of aerial organs of leaves,fruits, petals, and non-lignified stems of the outer plant cell wall(Kerstiens, 1996; Pollard et al., 2008). It offers also mechanicalrigidity to the plant (Dominguez et al., 2011). It consists ofintracuticular waxes embedded in cutin and an epicuticular layerof crystalline wax at the outer part. In minor amounts it alsoincludes triterpenoids, phenolic compounds including cinnamicacid, flavonoids, and secondary metabolites (Hunt and Baker,1980). This wax is composed mainly of long chain aliphaticmolecules (alkanes) derived from long chain fatty acids, andalcohols. Cutin can be described as a polyester matrix (mainlyprimary ester bonds) of hydroxy fatty acids and hydroxy-epoxyfatty acids C16 and C18 (Heredia, 2003; Pollard et al., 2008). Thecuticle is a variable membrane depending on the function andnecessity and environmental conditions (Macherius et al., 2011;Domínguez et al., 2015).
Confocal Raman Microscopy (CRM) has shown a highpotential for in situ chemical characterization of plants dueto its non-destructive nature (Agarwal, 2006; Gierlinger and
Schwanninger, 2006, 2007; Gierlinger et al., 2012). The inelasticRaman scattering, recorded as an energy shift by the CCDcamera, reflects the molecular vibrations (e.g., bond stretching,rotation, torsion) of the sample and thus the nature of itscomponents (Mueller et al., 2003). The advantage of CRM is thatposition-resolved molecular fingerprints can be generated witha lateral resolution of 300 nm and a z resolution of ∼700 nm(532 nm, NA 1.4). A Raman image is composed of thousandsof spectra in which each local position carries its own chemicalinformation and each spectral position has its own molecularidentity (Smith and Dent, 2005). The large amount of datagenerated by Raman imaging can be overcome with the useof multivariate methods that help in the management andinterpretation of the data. A blind source of unmixing is helpfulsince a spectrum can be comprised of many overlapping bandsin which the human-eye assignment can be tedious and in manycases impossible. Several multivariate methods have been appliedin Chemometrics (Geladi et al., 2010) and also on Raman imagesof plant cell walls (Gierlinger, 2014). Vertex Component Analysis(VCA) is an iterative method that finds the most pure spectra onthe sample by projecting the endmembers in an orthogonal space(the endmembers are independent of each other; Nascimento andDias, 2005). VCA is a fast, powerful, and reliable algorithm thatis able to detect and extrapolate the hypothetical end membersusing the raw data without any need of dimensionality reduction.
In this work, CRM was used to generate Raman imageson a stem microsection of Arabidopsis. The hyperspectral datawere analyzed by a univariate method (band integration) andVCA to reveal new insights into the topochemistry of theplant polymers. The correspondent average and endmembersspectra were extracted for a detailed analysis and compared withreference spectra of non-polysaccharide plant polymers.
MATERIALS AND METHODS
Plant Material and Micro-SectioningThe stem of a 3 week old Arabidopsis (accession Columbia)was transversally cut above ground/the rosette leaves forembedding in polyethylenglycol (PEG) 2000 (Sigma, Austria)following the protocol described in Gierlinger et al. (2012). Theembedded blocks were cut in 2 µm thick cross sections using arotary microtome (RM2235, Leica Biosystems Nussloch GmbH,Germany). The sections were washed with distilled water toremove the PEG. For Raman imaging single sections were puton a glass slide with a drop of water, covered with a coverslip(0.17mm thick) and sealed with nail polish to avoid waterevaporation.
Cuticles from green tomato (Solanum lycopersicum L., var.Casacada) fruits were isolated by incubation for 5 days ina 2% pectinase/0.2% cellulose solution at pH = 3.6 andtreated with chloroform:methanol (3/1, v/v) for 3 h to removewaxes. Dewaxed cuticles were depolymerized by saponificationin 1% KOH/methanol for 6 h under refluxing conditions.The filtrate was neutralized with HCl 1N and extracted withdiethyl ether. The solid contains about 82% (w/w) of 10(9),16-dihydroxyhexadecanoic acids and minor amounts of other
Frontiers in Chemistry | www.frontiersin.org 2 February 2016 | Volume 4 | Article 10
Prats Mateu et al. Raman Imaging of Waterproofing Polymers
hydroxyacids and phenolics as p-coumaric acid (Heredia-Guerrero et al., 2014). This mixture will be considered as cutinmonomer sample in the present work.
To help in band assignment of lignin structures Ramanspectra were acquired from milled wood lignin (MWL) of spruceand beech. MWL is a preparation procedure (extraction witha dioxane–water mixture) widely used for structure studies oflignin and was compared to an artificial lignin dehydrogenationpolymer (DHP) preparation based on coniferyl alcohol treatedwith H2O2 in the presence of the enzyme peroxidase. All ligninpreparations have been provided by the group of Antje Potthast(University of Natural Resources and Life Sciences, BOKU,Vienna).
Confocal Raman Microscopy and DataAnalysisRaman spectra from the native Arabidopsis cross sections wereacquired using a confocal Raman microscope (alpha300RA,WITec GmbH, Germany) with a 100x oil immersion objective(NA 1.4, 0.17mm coverslip correction; Carl Zeiss, Germany).The sample was excited with a linear polarized (0◦) coherentcompass sapphire green laser λex = 532 nm (WITec, Germany).The scattered Raman signal was detected with an optic multifiber(50µm diameter) directed to a spectrometer UHTS 300 (WITec,Germany; 600 g mm−1 grating) and finally to the CCD cameraDU401A BV (Andor, Belfast, North Ireland). The Control Four(WITec) acquisition software was used for the Raman imagingset up. The laser power was set at 30mW and a short integrationtime between 0.1 and 0.5 s was chosen in order to ensure fastmapping and avoid changes in the components structure. Onespectrum was taken every 0.3µm to reach the maximum possiblediffraction limited spatial resolution (r = 0.6× λ/NA).
Single Raman spectra of the cutin monomer and the milledwood reference samples were performed with a 100x objective(NA 0.9) and the λex = 785 nm laser (optic multifiber witha 100µm diameter) using an integration time of 1 s and 20accumulations. The grating used was the same (600 gmm−1) andthe CCD camera corresponded to the model DU401A BR DD(Andor, Belfast, North Ireland). For the isolated tomato fruitcuticle the same instrument configuration was used and stackscans (x–y–z) performed with a z step size of 1z = 0.350 nm.Average spectra of the total scanned area were extracted andaveraged for the first 2µm from the outer cuticle surface(including the very thick epicuticular wax layer).
Cosmic ray removal was carried out before any furtheranalysis in all cases using the WITec Project Plus 4.0 software(WITec, Germany). Raman images of the cross-sections ofArabidopsis were generated with the same software by using asum spectral filter which allows specific band integration. Thisprovides chemical images based on the specific bands attributedto different plant components e.g., lignin, water, and cutin pluswaxes. Furthermore, based on the integration images, averagespectra were extracted by setting an intensity threshold in orderto obtain the characteristic Raman signature of the cuticle and thelignified tissues, separately.
Detailed analysis on lignified tissues and cuticles ofArabidopsis were done by Vertex Component Analysis (VCA)
in Cytospec (v.2.00.01) using different number of endmembersand areas within the spectral region of 300–3050 cm−1. Allcalculated endmember spectra were exported into OPUS 7.0(Bruker, Germany) for direct comparison. All the referencespectra (including milled wood lignins, cutin monomer,tomato cuticle, ferulic, and coumaric acid) were min–maxnormalized on the aromatic band at 1600 cm−1 for bettercomparison.
RESULTS
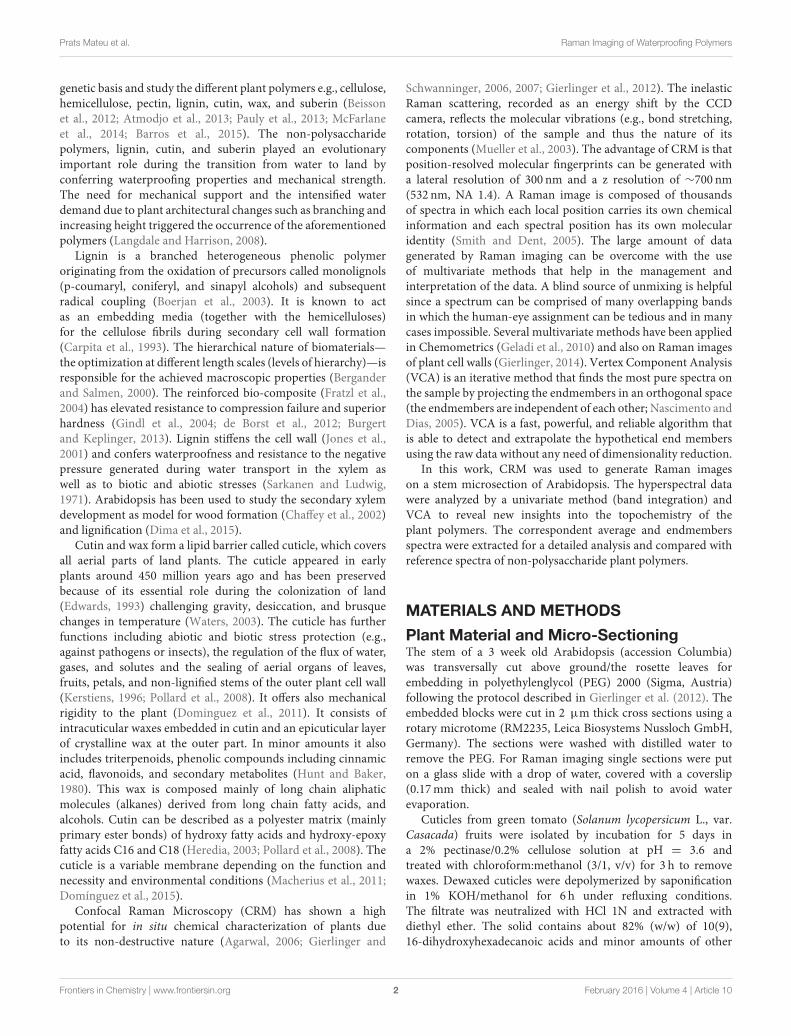
Waterproofing Polymers at theMicron-LevelTo present an overview of the distribution of waterproofingpolymers in the Arabidopsis stem Raman images were firstcalculated through integration over specific marker bands(Figures 1A,B). Integration over the broad water band around3400 cm−1 visualizes directly the distribution of water withinthe investigated microsection (Figure 1A). High water contentis represented by the white areas, whereas the dark areas pointto low water content and thus impregnation of waterproofingpolymers. The lumina of the cells appear white as they are almostcompletely water filled, except a few dark deposits are found.The parenchyma cell walls are colored in gray representing ahigh water content within the thin cell walls. On the contrarythe thick walled sclerenchyma and xylem cells are almost blackand thus represent low water content. Furthermore, a very thinblack layer, the cuticle, is visualized at the outer waterproofsurface (Figure 1A). The visualized hydrophobicity is due tothe impregnation of non-polysaccharide polymers as proofedby integrating the marker bands of lignin (1550–1700 cm−1)and cuticular lipids (1297 cm−1, green), respectively. The redcoloration represents impregnation with lignin and is restrictedto the xylem and sclerenchyma cells, whereas cuticular lipids(waxes and cutin; green color) are confined to the epidermalouter cell wall surface, the cuticle (Figure 1B).
By setting an intensity threshold on the two differentintegration images, average spectra of the cuticle and the lignifiedtissues were extracted individually and compared (Figure 1C).The average spectrum of the lignified tissues (Figure 1Ca) is acombination of cellulose (bands at 380 and 1096 cm−1, (Wileyand Atalla, 1987a,b), probably hemicelluloses (although thebands are not distinguishable at first sight) and lignin withtypical bands at 1602 and 1658 cm−1 (see assignments in Table 1;Agarwal, 1999). The average spectrum of the outer cuticle(Figure 1Cb) has also a high intensity in the CH stretching region(∼2800 cm−1) due to the abundance of methylene CH2 in bothaliphatic waxes and cutin, almost no carbohydrate contribution,but a small characteristic band of pectin at (855 cm−1). Thecuticle spectrum is characterized by clear bands at 1439, 1297,and 1602 cm−1.
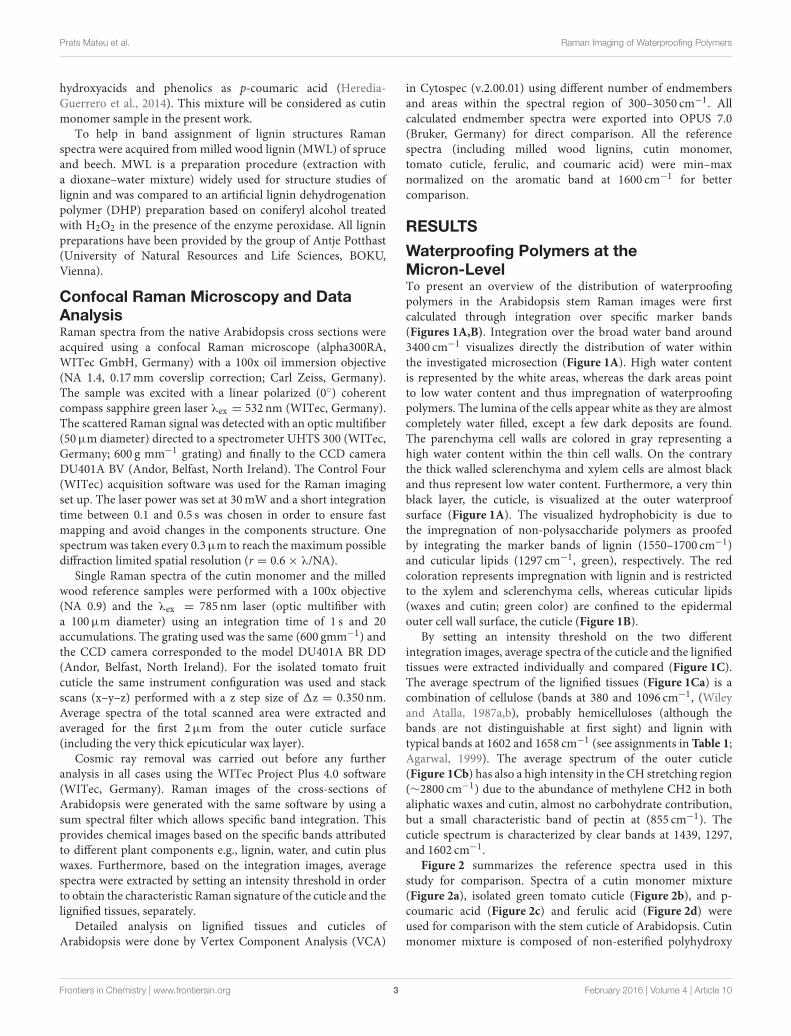
Figure 2 summarizes the reference spectra used in thisstudy for comparison. Spectra of a cutin monomer mixture(Figure 2a), isolated green tomato cuticle (Figure 2b), and p-coumaric acid (Figure 2c) and ferulic acid (Figure 2d) wereused for comparison with the stem cuticle of Arabidopsis. Cutinmonomer mixture is composed of non-esterified polyhydroxy
Frontiers in Chemistry | www.frontiersin.org 3 February 2016 | Volume 4 | Article 10
Prats Mateu et al. Raman Imaging of Waterproofing Polymers
FIGURE 1 | Raman images of a cross section of an Arabidopsis stem by univariate data analysis. Figure captions correspond to images generated by
integrating over the (A) water main band at around 3400 cm−1 and (B) lignin around the spectral area 1550–1700 cm−1 (in red) together with lipids (in green) at
1299 cm−1. (C) Average spectra of calculated by setting an intensity thresold over the image (B) for lignin and cuticle in the stem, separetely. Note that the minimal
water content in the section matches the areas covered by lignin and cuticle.
FIGURE 2 | Reference Raman spectra of lipids and phenolics. The spectra were cut (300–1800 cm−1 ), base line corrected and normalized over the main
aromatic stretching band at 1600 cm−1. (a) Cutin monomer, (b) average spectra of the outer part of the tomato cuticle, (c) p-coumaric acid, (d) ferulic acid, (e) milled
wood lignin from Spruce (Picea abies), (f) milled wood lignin of Beech (Fagus sylvatica), and (g) synthethized dehydrogenation polymer of lignin (DHP). The spectra are
base line corrected and normalized over the 1600 cm−1 band.
fatty acids and low amount of phenolics, whereas the outer partof the native tomato cuticle used for the reference measurementsis mainly constituted of waxes. If the two spectra are comparedthe two sharp bands at 1063 and 1121 cm−1 are only foundin the cutin monomer, whereas bands around 1170, 1299, and1440 cm−1 are found in both samples. The bands characteristicfor p-coumaric acid at 1605, 1636, and 1171 cm−1 are foundin the cutin monomer mixture as well as in the tomato cuticle.Additionally, spectra of milled wood lignin (MWL) of softwood(spruce, Figure 2e) and hardwood (beech, Figure 2f) and of thedehydrogenation polymer of coniferyl alcohol (DHP; Figure 2g)are shown: having all together the typical strong aromatic ringstretching band around 1600 cm−1. The band typical for guaicylunits at 1272 cm−1 is seen more pronounced in MWL of spruce,whereas the typical syringyl unit bands at 370, 1036 and 1330,and 1453 cm−1 are only clearly seen in MWL of beech. In DHP
the bands at 1134 and 1652 cm−1 are more pronounced than inMWL. All characteristic band positions and possible assignmentsare resumed in Table 1.
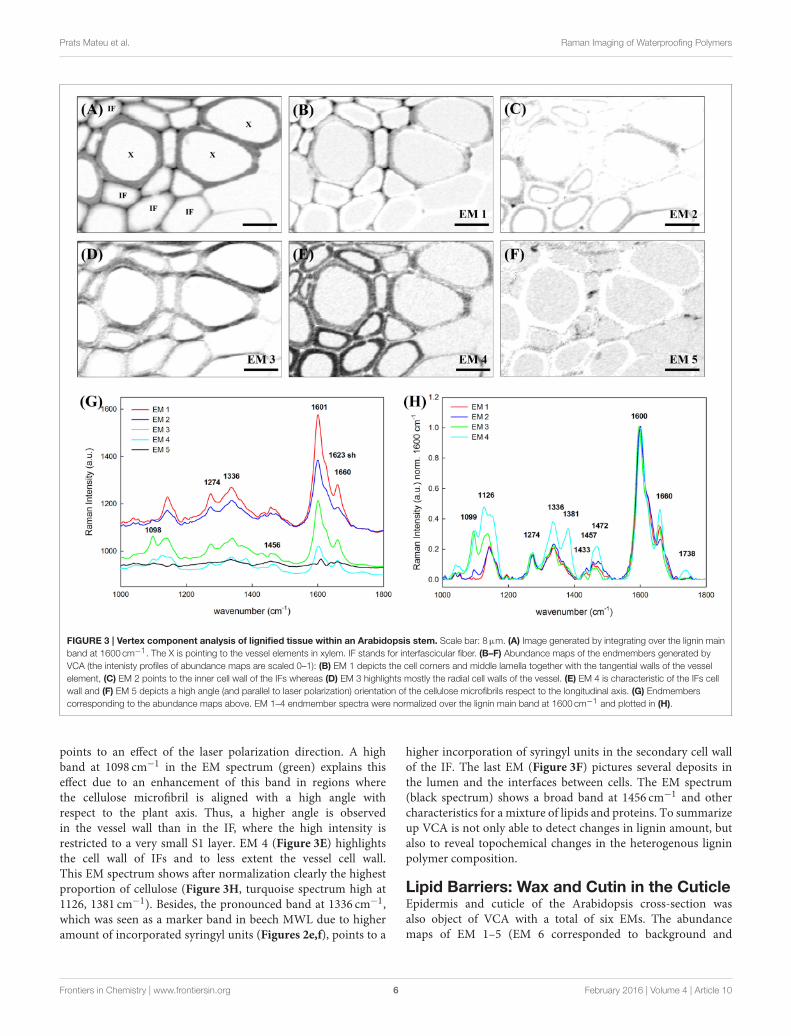
Phenolic Barriers: Lignin in Cell Wall, CellCorners, and Compound Middle LamellaA selected area of the Arabidopsis scan comprising sclerenchymafibers and xylem elements was analyzed in detail, using vertexcomponent analysis (VCA) with a total of six endmembersand the spectral region 1000–1800 cm−1. In order to compareunivariate vs. multivariate statistical approaches, Figure 3A
shows first the false color image generated by integration overthe main lignin band at 1600 cm−1 (univariate approach). Thelignin amount is higher in cell corner and compound middlelamella indicated by the darker color. Furthermore, it can beseen that the cell walls of xylem vessels (X) contain more
Frontiers in Chemistry | www.frontiersin.org 4 February 2016 | Volume 4 | Article 10
Prats Mateu et al. Raman Imaging of Waterproofing Polymers
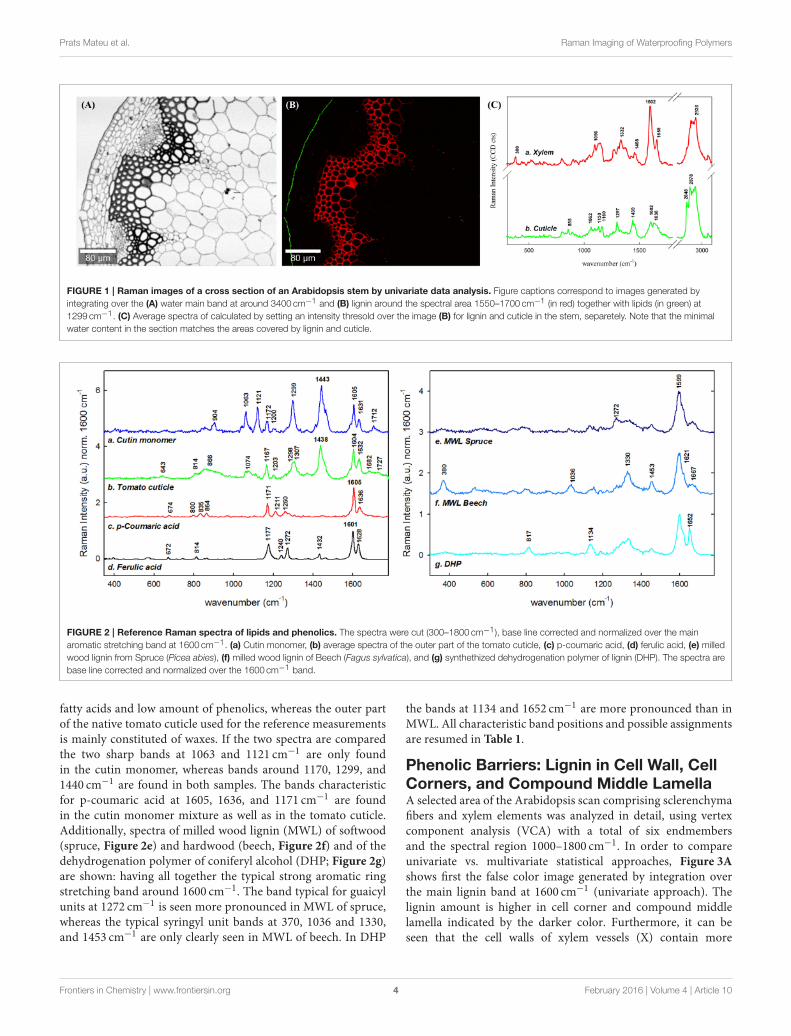
TABLE 1 | Assignments of the reference spectra summarized in Figure 2.
Wavenumber Assignment (Literature) Lignin and phenolic acids Cuticle
DHP MWL Spruce MWL Beech p-Coumaric acid Ferulic acid Cutin monomer Tomato cuticle
370 Lignin of sugarcane pith (Agarwal
unpublished cited in [1]). Syringyl unit in
hardwoods [18]
370 370 371
531 Skeletal deformation [1] 531
Lignin of sugarcane pith (Agarwal
unpublished cited in [1])
815 Out of plane bending C–OH [16] 817 814 814
833 835
850–862 α-Glycosidic bond in pectin [16] 856 866
Skeletal vibration pyranoid ring 864
1033 C–O of aryl-O–CH3 and aryl-OH [2] 1039
1037 Heavy atom (CC and CO) stretching [11]
1061 ν C–C in cuticular wax [3, 4, 6, 15] 1063
1136 Coniferyl/Sinapilaldehyde [1] 1134
1170–1178 Ring δ ip (CH), ν(C–O–C) ester [3, 17] 1177 1177 1172 1167
ν (C–O) [10]
1266 δ ip (=C-H) cis of lipids [7, 8] 1272 1260 1272
1272 Aryl-O stretching of aryl-OH and aryl-O–CH3
(G unit) [1]
1274 ν(C–C) [10]
1295 δ (CH2) twisting saturated wax [9] 1299 1298
1303 τ (CH2) lipids [4] 1307
1331–1334 Aliphatic O–H bend [1] 1331 1330
Syringyl lignin [5]
1434 δ CH3 asym. sym. [10] 1432
1441 δ (CH2) Lipids [7] 1443 1438
1453 CH3 bending in OCH3 [1, 2] 1453 1453 1463
1588 Aromatic ν (C–C) phenolic compound [4] 1590 sh
1607 Aromatic ν (C=C) Phenolic compound [3]
e.g., Lignin [2]
1602 1599 1601 1605 1601 1605 1604
1621 ν C=C of coniferylaldehyde/sinapaldehyde [1] 1621
1632 Unsaturated ν C=C of phenolic compound
[3]
1636 1628 1631 1632
ν C=C of coniferyl aldehyde [1, 12, 13, 14]
1657–1660 C=O coniferyl aldehyde [1], C=C coniferyl
alcohol [12]
1652 1667 1667 1662
1640–1680 Sym. ν C=O of carboxylic acid dimer 1682
1720 ν (C=O) cuticular wax [4] 1727
All values are given in wavenumbers (cm−1 ). ip, in plane; δ, deformation; τ, torsion; ν, stretching; sh, shoulder; sym, symmetric; asym, asymmetric.
[1], (Agarwal et al., 2011); [2], (Agarwal and Ralph, 1997); [3], (Prinsloo et al., 2004); [4], (Trebolazabala et al., 2013); [5], (Sun et al., 2012); [6], (Yu et al., 2008); [7], (Schulz and Baranska,
2007); [8], (Da Silva et al., 2008); [9], (Edwards and Falk, 1997); [10], (Ram et al., 2003); [11], (Wiley and Atalla, 1987a); [12], (Agarwal and Ralph, 2008); [13], (Stewart et al., 1997); [14],
(Hanninen et al., 2011); [15], (Wu et al., 2011); [16], (Synytsya et al., 2003); [17], (Heredia-Guerrero et al., 2014); [18], (Agarwal et al., 2015).
lignin (darker gray) than the cell walls of the interfascicularfibers (IF). Figures 3B–F display the abundance maps of theendmembers (EM) spectra shown in Figure 3G and after baselinecorrection and min–max normalization over the 1600 cm−1
band in Figure 3H (fifth EM not shown as no contribution at1600 cm−1). The sixth EM corresponding to the lumen (water)is not shown. The EM 1 differentiates the upper cell cornersnear the vessel elements (X), middle lamella, and the tangentialcell wall of the vessels. The correspondent EM 1 (red spectrum
Figures 3G,H) shows the highest lignin band (1600 cm−1) andalmost no carbohydrate contribution. The EM 2 depicts aninner layer toward the lumen and the cell corners betweenthe IF (Figure 3C). The spectrum (in blue) shows lower lignincontribution at 1600 cm−1, a shoulder at 1623 cm−1 and thelowest intensity of the 1660 cm−1 peak relatively to the otherEMs (Figure 3H), pointing to a change in lignin composition.The next abundance map in Figure 3D (EM 3) accentuatescell wall regions along the horizontal axis of the image, which
Frontiers in Chemistry | www.frontiersin.org 5 February 2016 | Volume 4 | Article 10
Prats Mateu et al. Raman Imaging of Waterproofing Polymers
FIGURE 3 | Vertex component analysis of lignified tissue within an Arabidopsis stem. Scale bar: 8µm. (A) Image generated by integrating over the lignin main
band at 1600 cm−1. The X is pointing to the vessel elements in xylem. IF stands for interfascicular fiber. (B–F) Abundance maps of the endmembers generated by
VCA (the intenisty profiles of abundance maps are scaled 0–1): (B) EM 1 depicts the cell corners and middle lamella together with the tangential walls of the vessel
element, (C) EM 2 points to the inner cell wall of the IFs whereas (D) EM 3 highlights mostly the radial cell walls of the vessel. (E) EM 4 is characteristic of the IFs cell
wall and (F) EM 5 depicts a high angle (and parallel to laser polarization) orientation of the cellulose microfibrils respect to the longitudinal axis. (G) Endmembers
corresponding to the abundance maps above. EM 1–4 endmember spectra were normalized over the lignin main band at 1600 cm−1 and plotted in (H).
points to an effect of the laser polarization direction. A highband at 1098 cm−1 in the EM spectrum (green) explains thiseffect due to an enhancement of this band in regions wherethe cellulose microfibril is aligned with a high angle withrespect to the plant axis. Thus, a higher angle is observedin the vessel wall than in the IF, where the high intensity isrestricted to a very small S1 layer. EM 4 (Figure 3E) highlightsthe cell wall of IFs and to less extent the vessel cell wall.This EM spectrum shows after normalization clearly the highestproportion of cellulose (Figure 3H, turquoise spectrum high at1126, 1381 cm−1). Besides, the pronounced band at 1336 cm−1,which was seen as a marker band in beech MWL due to higheramount of incorporated syringyl units (Figures 2e,f), points to a
higher incorporation of syringyl units in the secondary cell wallof the IF. The last EM (Figure 3F) pictures several deposits inthe lumen and the interfaces between cells. The EM spectrum(black spectrum) shows a broad band at 1456 cm−1 and othercharacteristics for a mixture of lipids and proteins. To summarizeup VCA is not only able to detect changes in lignin amount, butalso to reveal topochemical changes in the heterogenous ligninpolymer composition.
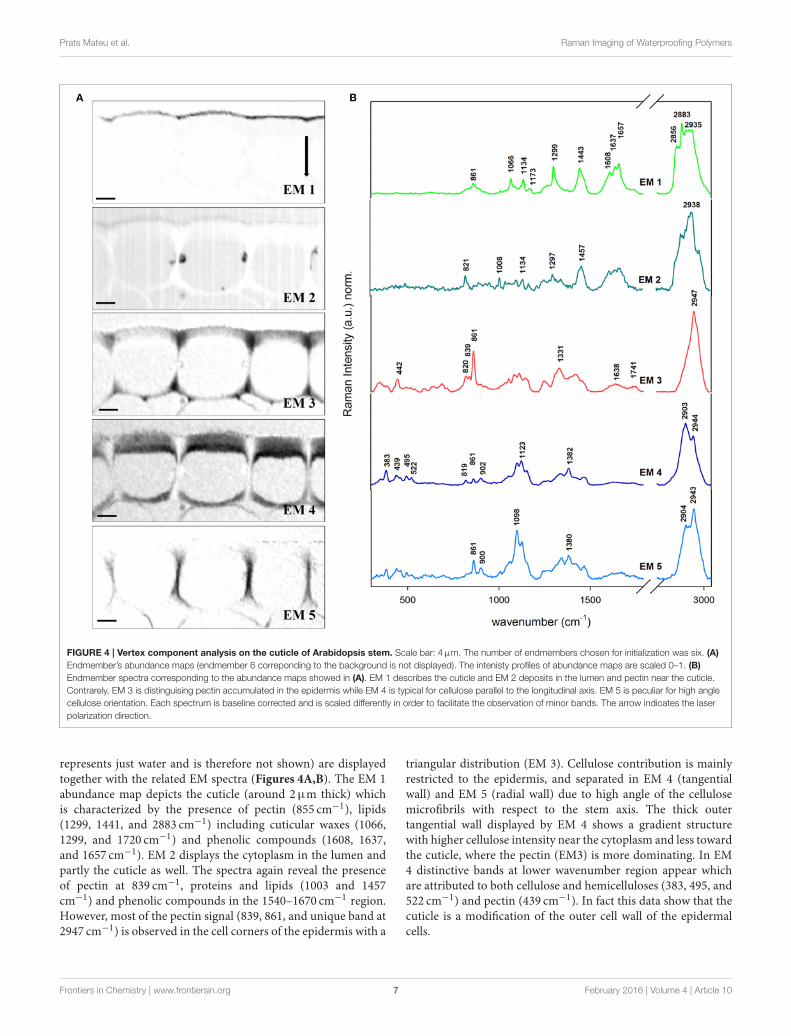
Lipid Barriers: Wax and Cutin in the CuticleEpidermis and cuticle of the Arabidopsis cross-section wasalso object of VCA with a total of six EMs. The abundancemaps of EM 1–5 (EM 6 corresponded to background and
Frontiers in Chemistry | www.frontiersin.org 6 February 2016 | Volume 4 | Article 10
Prats Mateu et al. Raman Imaging of Waterproofing Polymers
FIGURE 4 | Vertex component analysis on the cuticle of Arabidopsis stem. Scale bar: 4µm. The number of endmembers chosen for initialization was six. (A)
Endmember’s abundance maps (endmember 6 correponding to the background is not displayed). The intenisty profiles of abundance maps are scaled 0–1. (B)
Endmember spectra corresponding to the abundance maps showed in (A). EM 1 describes the cuticle and EM 2 deposits in the lumen and pectin near the cuticle.
Contrarely, EM 3 is distinguising pectin accumulated in the epidermis while EM 4 is typical for cellulose parallel to the longitudinal axis. EM 5 is peculiar for high angle
cellulose orientation. Each spectrum is baseline corrected and is scaled differently in order to facilitate the observation of minor bands. The arrow indicates the laser
polarization direction.
represents just water and is therefore not shown) are displayedtogether with the related EM spectra (Figures 4A,B). The EM 1abundance map depicts the cuticle (around 2µm thick) whichis characterized by the presence of pectin (855 cm−1), lipids(1299, 1441, and 2883 cm−1) including cuticular waxes (1066,1299, and 1720 cm−1) and phenolic compounds (1608, 1637,and 1657 cm−1). EM 2 displays the cytoplasm in the lumen andpartly the cuticle as well. The spectra again reveal the presenceof pectin at 839 cm−1, proteins and lipids (1003 and 1457cm−1) and phenolic compounds in the 1540–1670 cm−1 region.However, most of the pectin signal (839, 861, and unique band at2947 cm−1) is observed in the cell corners of the epidermis with a
triangular distribution (EM 3). Cellulose contribution is mainlyrestricted to the epidermis, and separated in EM 4 (tangentialwall) and EM 5 (radial wall) due to high angle of the cellulosemicrofibrils with respect to the stem axis. The thick outertangential wall displayed by EM 4 shows a gradient structurewith higher cellulose intensity near the cytoplasm and less towardthe cuticle, where the pectin (EM3) is more dominating. In EM4 distinctive bands at lower wavenumber region appear whichare attributed to both cellulose and hemicelluloses (383, 495, and522 cm−1) and pectin (439 cm−1). In fact this data show that thecuticle is a modification of the outer cell wall of the epidermalcells.
Frontiers in Chemistry | www.frontiersin.org 7 February 2016 | Volume 4 | Article 10
Prats Mateu et al. Raman Imaging of Waterproofing Polymers
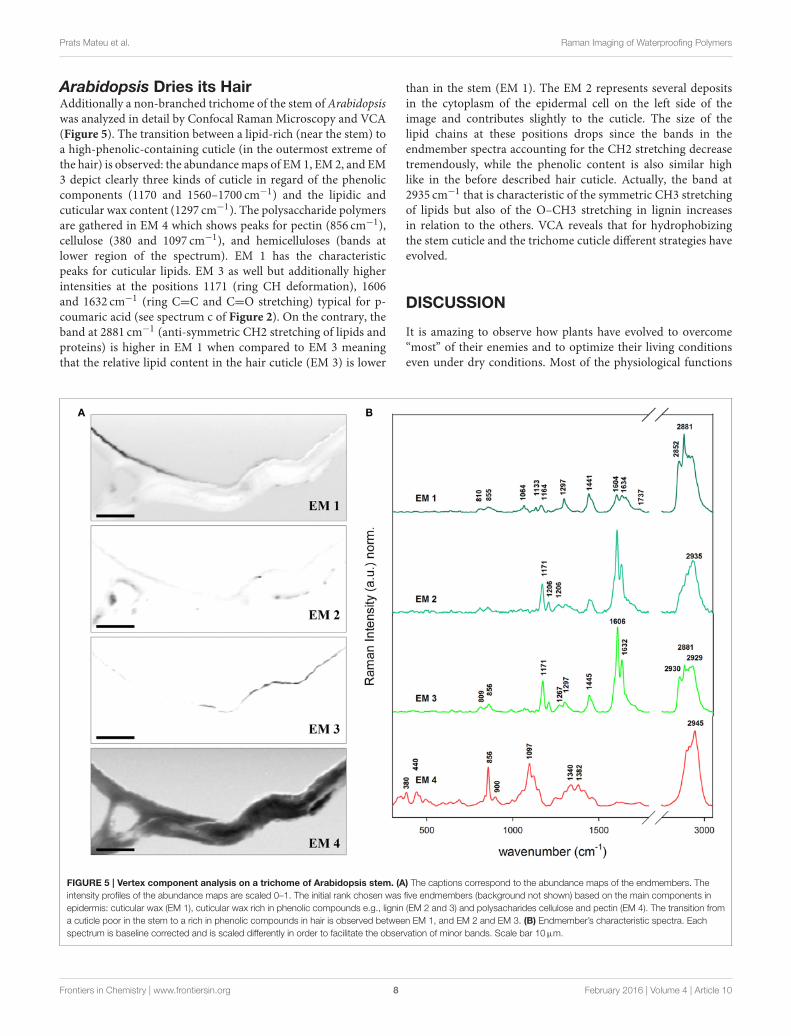
Arabidopsis Dries its HairAdditionally a non-branched trichome of the stem of Arabidopsiswas analyzed in detail by Confocal Raman Microscopy and VCA(Figure 5). The transition between a lipid-rich (near the stem) toa high-phenolic-containing cuticle (in the outermost extreme ofthe hair) is observed: the abundancemaps of EM 1, EM 2, and EM3 depict clearly three kinds of cuticle in regard of the phenoliccomponents (1170 and 1560–1700 cm−1) and the lipidic andcuticular wax content (1297 cm−1). The polysaccharide polymersare gathered in EM 4 which shows peaks for pectin (856 cm−1),cellulose (380 and 1097 cm−1), and hemicelluloses (bands atlower region of the spectrum). EM 1 has the characteristicpeaks for cuticular lipids. EM 3 as well but additionally higherintensities at the positions 1171 (ring CH deformation), 1606and 1632 cm−1 (ring C=C and C=O stretching) typical for p-coumaric acid (see spectrum c of Figure 2). On the contrary, theband at 2881 cm−1 (anti-symmetric CH2 stretching of lipids andproteins) is higher in EM 1 when compared to EM 3 meaningthat the relative lipid content in the hair cuticle (EM 3) is lower
than in the stem (EM 1). The EM 2 represents several depositsin the cytoplasm of the epidermal cell on the left side of theimage and contributes slightly to the cuticle. The size of thelipid chains at these positions drops since the bands in theendmember spectra accounting for the CH2 stretching decreasetremendously, while the phenolic content is also similar highlike in the before described hair cuticle. Actually, the band at2935 cm−1 that is characteristic of the symmetric CH3 stretchingof lipids but also of the O–CH3 stretching in lignin increasesin relation to the others. VCA reveals that for hydrophobizingthe stem cuticle and the trichome cuticle different strategies haveevolved.
DISCUSSION
It is amazing to observe how plants have evolved to overcome“most” of their enemies and to optimize their living conditionseven under dry conditions. Most of the physiological functions
FIGURE 5 | Vertex component analysis on a trichome of Arabidopsis stem. (A) The captions correspond to the abundance maps of the endmembers. The
intensity profiles of the abundance maps are scaled 0–1. The initial rank chosen was five endmembers (background not shown) based on the main components in
epidermis: cuticular wax (EM 1), cuticular wax rich in phenolic compounds e.g., lignin (EM 2 and 3) and polysacharides cellulose and pectin (EM 4). The transition from
a cuticle poor in the stem to a rich in phenolic compounds in hair is observed between EM 1, and EM 2 and EM 3. (B) Endmember’s characteristic spectra. Each
spectrum is baseline corrected and is scaled differently in order to facilitate the observation of minor bands. Scale bar 10µm.
Frontiers in Chemistry | www.frontiersin.org 8 February 2016 | Volume 4 | Article 10
Prats Mateu et al. Raman Imaging of Waterproofing Polymers
of the cuticle are a consequence of the physical and chemicalproperties of cutin, its interaction with the cell wall componentsand the subtle regulation of other minor compounds. Thesekey physical properties, belonging to three basic areas ofphysics—thermodynamics, hydrodynamics, and mechanics—arenot isolated but they largely influence each other’s performance.The design requirements of each property can be incompatiblewith the properties needed for the others to maximize theirfunctions, leading to a necessary compromise (Dominguez et al.,2011). Thus, the biological role of waterproofing polymersis clear since plants have to keep their feet wet and avoidsimultaneously plasmolysis due to out-of-equilibrium mediumas well as to keep clean and be protected against new enemies.The characterization of waterproofing lipid and phenolic barriersis of great interest in plant science due to the mentionedbiological relevance but also for their use as feedstock forlong chain components and biodiesel production (Tsubaki andAzuma, 2013). Lately, different approaches in genetic engineeringhave been proposed to increase the yield of wax esters intobacco plants (Aslan et al., 2015). In the same way, lignin hasbeen recognized for its potential as renewable raw material forproducing alkylated phenolic compounds, fuels and renewablechemicals (Kleinert and Barth, 2008; Bugg and Rahmanpour,2015).
Imaging Waterproofing Polymers and alsoTheir Effect on Water ContentThe ability of in situ clustering and detecting polymers involvedin a process such as waterproofing of the plant is essential to knowmore about the responsible mechanisms behind (Altartouri andGeitmann, 2015). In this study the topochemical distributions ofnon-polysaccharide polymers and water content were elucidatedwith a resolution of about 300 nm based on Raman imagingusing univariate as well as advanced multivariate data analysis.The univariate analysis of the 2D Raman hyperspectral datarevealed an immediate overview about changes in chemicalcomposition between the main structural parts of the plantstem (Agarwal and Atalla, 1986; Agarwal, 2006; Gierlinger andSchwanninger, 2006, 2007) (Figure 1B): the cuticle was separatedby integrating over the main lipid band around 1300 cm−1 (Wuet al., 2011), and the xylem was highlighted by integrating overthe aromatic lignin band from 1540 to 1700 cm−1 (Agarwaland Ralph, 1997; Prats-Mateu et al., 2014). The water image(Figure 1A) showed directly the effect of the waterproofingpolymers by an opposite hand picture with low water contentin the regions where the non-polysaccharide polymers have beendetected.
Representative average spectra of the lignified tissues andcuticle could be extracted through integration images and setintensity thresholds (Figure 1C). The spectrum of the lignifiedtissue (a) is a combination of cellulose (bands at 380 and1096, Wiley and Atalla, 1987a,b, 2936 cm−1), hemicelluloses (notdistinguishable from the first), and lignin with bands at 1270,1332, 1602, 1658 (see assignments in Table 1), and 2936 cm−1
due to the antisymmetric C–H stretching in O–CH3 (Agarwal,
1999). The absence of pectin at position 855 cm−1 (α-1,4-glycosidic bond; Synytsya et al., 2003) and the presence of lignintogether with a thickening of the cell wall in these lignifiedtissues is an indication of a mature developmental stage ofthe tracheary elements (vessels and fibers) and their (ongoing)dead stage (Bollhöner et al., 2012). The cuticle by contrary wasstrongly defined by the presence of lipid components and slightlypectin (855 cm−1) due to the close vicinity of the pectin richepidermis. The lipidic part is defined mainly by an increasein the C–H and C–C groups due the large aliphatic chainscharacteristics of waxes and hydroxy fatty acids from cutin. Thisis visible in the spectrum at the positions 1062, 1297, 1441, and2848 (symmetric) and 2878 cm−1 (asymmetric CH2 stretchingvibration) (Weissflog et al., 2010; Littlejohn et al., 2015). Thelast two bands can be used to determine the crystallinity ofthe cuticle (Ho and Pemberton, 1998; Greene and Bain, 2005;Littlejohn et al., 2015) which differs in its inner (intracuticularwax) and outer parts (epicuticular wax; Heredia-Guerrero et al.,2014).
The univariate methods i.e., band integration is very suitablefor bands, which are not (or only slightly overlapping) withothers, to give a fast overview. Nevertheless, this approachis powerless regarding the splitting of the pure componentsor to separate changes in polymer amount from changes inpolymer composition (side chains, crystallinity), which mightgo hand in hand. Furthermore, due to the multicomponentnature of biological materials we almost always have to deal withoverlapping bands, which can lead to misleading conclusions orhide important changes.
Necessity of Multivariate Methods to TrackSubtle Changes in Lignin CompositionLignin is a heterogeneous phenolic compound which complexityis still puzzling scientist around the world (Voxeur et al.,2015). The diversity of the monomer (oligomer) coupling andpolymerization mechanisms makes the study of this polymera difficult task (Boerjan et al., 2003). The breaking pathwaysof lignin (Mar et al., 2015) are of great interest since it hasbeen found as one of the principal responsible for biomassrecalcitrance in biofuel production (Batalha et al., 2015). Ligninvaries between species and also between cellular types inside thesame tree/plant (Campbell and Sederoff, 1996; Neutelings, 2011).
The potential of Raman imaging combined with multivariatemethods (e.g., VCA) to differentiate also subtle changes inlignin composition was shown in spruce wood (Gierlinger, 2014)and in this study on a Raman map of Arabidopsis includingxylem vessels and sclerenchyma fibers (Figure 3). The calculatedendmember spectra proofed that the lignin in the cell cornersgluing together the sclerenchyma fibers has more similarity tothe lignin in the xylem vessel than in the fibers itself (EM1). Besides also changes in the matrix have been observeddepending if cells are connected in the vascular tissue (EM 1)or in the mechanical stabilizing sclerenchymatic tissue (EM 2).Especially the band at 1660 cm−1 changes between secondarycell walls of fibers and xylem and cell corners (Figure 3H).
Frontiers in Chemistry | www.frontiersin.org 9 February 2016 | Volume 4 | Article 10
Prats Mateu et al. Raman Imaging of Waterproofing Polymers
In comparison to the reference spectra of milled wood lignin(MWL) in Figure 2, also a higher band at 1660 cm−1 assignedto the aromatic ring conjugated C=C bonds and to the C=Ogroup (of coniferaldehyde and/or sinapaldehyde units in lignin;Agarwal and Ralph, 2008; Agarwal et al., 2011) was observedin Arabidopsis compared to MWL. Here more similarity wasfound with the artificial polymerized DHP, which showedalso a higher band at 1652 cm−1 band and also the band at1132 cm−1, assigned to coniferaldehyde/sinapaldehyde (Agarwaland Ralph, 2008; Agarwal et al., 2011), similarly pronounced likein EM spectra of Arabidopsis. The lignin most typical for thesclerenchyma fibers (Figure 3, EM 4), showed a higher band at1336 and 1457 cm−1, which were also clearly seen in MWL ofbeech (Figure 2, spectrum f) and are reported to be typicallyfor syringyl units in lignin (Agarwal and Terashima, 2003; Sunet al., 2012). The presence of higher amounts of guaicyl ligninin vessel elements and higher proportion of syringyl in fibershas been reported for wood samples (Saito et al., 2012) and isnow proofed for Arabidopsis. Syringyl and guaiacyl units differ intheir degree of methylation of the phenylpropane units havingthe first one methyl group more. During evolution syringyllignin appear first in angiosperms involving two more steps inthe metabolic grid whereas guiacyl lignin is typical for conifersand derives directly from coniferyl alcohol (Eckardt, 2002).CRM gives the value of S/G ratios non-destructively (Sun et al.,2012) and assesses locally differences in xylem maturation anddevelopment.
Revealing In situ Changes in CuticleComposition on the Micron-LevelThe cuticle covers all aerial organs in the plant and its majorcharacteristic, hydrophobicity, is given by the nature of itscomposition. Poly-hydroxy and epoxy fatty acids are crosslinkedby ester bonds to cutin, which is combined with a variable,generally low amount, of waxes. The disposition of the mainpolymers in the epidermal cells matches the one suggested inliterature (Dominguez et al., 2011) with a triangular area rich inpectin (EM 3) below the cuticle (EM 1) and a half moon formedcellulose layer (EM 4). The cellulose part was divided in two partsbeing the upper part a mixture of pectin and cellulose (as givenby the endmembers 3 and 4) whereas the inner part toward thelumen was richer in cellulose. The presence of hemicelluloses isdepicted by the low frequency band at 495 cm−1 (Agarwal andRalph, 1997). Comparing the cuticle EM spectrum (Figure 4, EM1) of Arabidopsis with the acquired reference spectra of cutinmonomer and tomato cuticle showed that the main lipid bands at1443 and within 1299–1307 cm−1 were present in all three. Thepeaks at 1063 cm−1 (cuticular wax) and 1712 cm−1 (ester bond)observed in EM 1 were only in common with the insoluble cutinreference monomer (Figure 2a; for assignments see Table 1)which indicated an esterification of the latter. Tomato cuticleand cutin had the band 1172 cm−1 in common (characteristicfor cuticular wax and/or p-coumaric acid (see Discussion below),which was not strongly visible in Arabidopsis (low intensity).This could mean that the cuticle of Arabidopsis consists mainlyof cutin and only small amounts of cuticular waxes. The typical
phenolic bands (1540–1680 cm−1 region) showed less intensityin the cuticle of the Arabidopsis stem, whereas it was clearly seenin the spectra of both isolated cutin and native tomato cuticle.In fact, the main waxes and polyesters found in Arabidopsis arealkanes (and ketones) and dicarboxylic acids, respectively (Suhet al., 2005).
The amount and nature of the lipids and phenolics can alsovary due to biotic/abiotic stresses and or tissue specializationi.e., trichomes. It has been found that the fraction of phenolicsin the cutin/cuticle matrix is high in gymnosperms and appearsin the form of lignin (up to ∼26% of the isolated cuticle;Reina et al., 2001). However, the investigation of this feature inangiosperms remains to be done. Marks et al. (2008) found thatisolated leaf trichomes of Arabidopsis had a fraction of ligninwhich they addressed to be in the cell wall after performing theMäule reaction on detached trichomes. In Figure 5 the VCAof a stem trichome of Arabidopsis shows the transition from acuticle rich in lipids near the stem (EM 1) to a cuticle rich inphenolics (EM 3) since the bands at 1600 and 1630 cm−1, similarto the ones in coumaric acid (Figure 2, spectrum c in red), areprominent in the more distant part of the trichome. Ferulic acidand p-coumaric acid have been also found covalently attachedto cutin and suberin in apples, peach, pear, and tomato by massspectrometry and gas chromatography (Riley and Kolattukudy,1975). Furthermore, ferulic acid has been found not only infruits but also in primary cell walls of gymnosperms by UVfluorescence microscopy and treatment with NaOH (Carnachanand Harris, 2000) and ferulate makes up to 1% of the cutinpolymer (Pollard et al., 2008).
It seems then that phenolic compounds are common for bothcell walls and cuticles. They are precursors of lignin and canalso be incorporated in lignin of angiosperms (Ralph et al., 2008)and grasses (Lam et al., 2001). In Brachypodium contributions offerulic acid have been found not only in the cell wall but also incell corners (Gierlinger et al., 2013). We found that p-coumaricand/or ferulic acid were part of the cuticle at the hair but notof the epidermal cell wall by the presence of the peaks at 1171,1266, and the doublet at 1606 and 1632 cm−1 (Piot et al., 2001;Ram et al., 2003). The extracted cutin monomer and the nativetomato cuticle (Figures 2a,b spectra, respectively) were alsocharacterized by the doublet and the band at 1171–1177 cm−1
indicating p-coumaric acid in these reference samples. Thepresence of phenolic compounds is related to an increase in therigidity of the cutin matrix (López-Casado et al., 2007). The cutinmonomer spectrum (mainly non-esterified hydroxy fatty acids)was more similar to the EM 1 in Figure 5B due to the presence ofthe peaks at 1064 and 1133 cm−1 attributed to the C–C stretchingof wax and cutin matrix (Prinsloo et al., 2004; Yu et al., 2007,2008; Trebolazabala et al., 2013).
The potential of the Raman imaging approach in studyingnon-polysaccharide components is clearly seen in this study byrevealing a molecular fingerprint on the micro-level. By thisdetailed information is gained on: (1) where are the componentswithin the plant cells and (2) what is the chemical nature ofthe components. If combined with VCA even subtle changes inchemical compositions can be tracked. The advantage of VCAfalls on the fact that it extracts the most pure components in
Frontiers in Chemistry | www.frontiersin.org 10 February 2016 | Volume 4 | Article 10
Prats Mateu et al. Raman Imaging of Waterproofing Polymers
the pixel matrix and reveals the correspondent abundance ordistribution maps.
AUTHOR CONTRIBUTIONS
NG: research idea and experiment design, data analysis, andwriting of the manuscript; BP: Raman experiments, dataanalysis, and writing of the manuscript; AH: preparation ofcutin monomer, and tomato cuticle, scientific input regardingall aspects of cuticles in the manuscript; MH: providing theArabidopsis sample and English corrections.
FUNDING
Austrian Science Fund (FWF): START Project [Y-728-B16].
ACKNOWLEDGMENTS
We thank Antje Potthast and Ivan Sumerskii (University ofNatural Resources and Life Sciences (BOKU), Departmentof Chemistry, Division of Chemistry of Renewables) forthe gift of the milled wood lignin and dehydrogenationpolymer.
REFERENCES
Agarwal, U. P. (1999). “An overview of Raman spectroscopy as applied tolignocellulosic materials,” in Advances in Lignocellulosics Characterization, edD. S. Argyropoulos (Atlanta, GA: TAPPI Press), 201–225.
Agarwal, U. P. (2006). Raman imaging to investigate ultrastructure andcomposition of plant cell walls: distribution of lignin and cellulose in blackspruce wood (Piceamariana). Planta 224, 1141–1153. doi: 10.1007/s00425-006-0295-z
Agarwal, U. P., and Atalla, R. H. (1986). In situ Raman microprobe studies ofplant-cell walls – macromolecular organization and compositional variabilityin the secondary wall of Picea-mariana (mill) bsp. Planta 169, 325–332. doi:10.1007/BF00392127
Agarwal, U. P., McSweeny, J. D., and Ralph, S. A. (2011). FT-Ramaninvestigation of milled-wood lignins: softwood, hardwood, and chemicallymodified black spruce lignins. J. Wood Chem. Technol. 31, 324–344. doi:10.1080/02773813.2011.562338
Agarwal, U. P., and Ralph, S. A. (1997). FT-Raman spectroscopy of wood:identifying contributions of lignin and carbohydrate polymers in the spectrumof black spruce (Picea mariana). Appl. Spectrosc. 51, 1648–1655. doi:10.1366/0003702971939316
Agarwal, U. P., and Ralph, S. A. (2008). Determination of ethylenic residuesin wood and TMP of spruce by FT-Raman spectroscopy. Holzforschung 62,667–675. doi: 10.1515/HF.2008.112
Agarwal, U. P., Ralph, S. A., Padmakshan, D., Liu, S., Karlen, S. D., Foster, C.,et al. (2015). “Estimation of S/G ratio in woods using 1064 nm FT-Ramanspectroscopy,” in Proceedings of the 18th ISWFPC (Vienna), 333–336.
Agarwal, U. P., and Terashima, N. (2003). “FT-Raman study of dehydrogenationpolymer (DHP) lignins,” in Proceedings of the 12th International Symposium on
Wood, Fiber and Pulping Chemistry,Vol. 3 (Madison,WI: Department of ForestEcology and Management; University of Wisconsin), 123–126.
Altartouri, B., and Geitmann, A. (2015). Understanding plant cell morphogenesisrequires real-time monitoring of cell wall polymers. Curr. Opin. Plant Biol. 23,76–82. doi: 10.1016/j.pbi.2014.11.007
Aslan, S., Hofvander, P., Dutta, P., Sun, C., and Sitbon, F. (2015). Increasedproduction of wax esters in transgenic tobacco plants by expression of a fattyacid reductase: wax synthase gene fusion. Transgenic Res. 24, 945–953. doi:10.1007/s11248-015-9893-5
Atmodjo, M. A., Hao, Z. Y., and Mohnen, D. (2013). Evolving views of pectinbiosynthesis. Ann. Rev. Plant Biol. 64, 747–779. doi: 10.1146/annurev-arplant-042811-105534
Barros, J., Serk, H., Granlund, I., and Pesquet, E. (2015). The cell biologyof lignification in higher plants. Ann. Bot. 115, 1053–1074. doi:10.1093/aob/mcv046
Batalha, L. A. R., Han, Q., Jameel, H., Chang, H. M., Colodette, J. L., and Gomes,F. J. B. (2015). Production of fermentable sugars from sugarcane bagasse byenzymatic hydrolysis after autohydrolysis and mechanical refining. Bioresour.Technol. 180, 97–105. doi: 10.1016/j.biortech.2014.12.060
Beisson, F., Li-Beisson, Y., and Pollard, M. (2012). Solving the puzzles of cutinand suberin polymer biosynthesis. Curr. Opin. Plant Biol. 15, 329–337. doi:10.1016/j.pbi.2012.03.003
Bergander, A., and Salmen, L. (2000). Variations in transverse fibre wall properties:relations between elastic properties and structure. Holzforschung 54, 654–660.doi: 10.1515/HF.2000.110
Boerjan, W., Ralph, J., and Baucher, M. (2003). Lignin biosynthesis. Annu. Rev.Plant Biol. 54, 519–546. doi: 10.1146/annurev.arplant.54.031902.134938
Bollhöner, B., Prestele, J., and Tuominen, H. (2012). Xylem cell death: emergingunderstanding of regulation and function. J. Exp. Bot. 63, 1081–1094. doi:10.1093/jxb/err438
Bugg, T. D. H., and Rahmanpour, R. (2015). Enzymatic conversion oflignin into renewable chemicals. Curr. Opin. Chem. Biol. 29, 10–17. doi:10.1016/j.cbpa.2015.06.009
Burgert, I., and Keplinger, T. (2013). Plant micro- and nanomechanics:experimental techniques for plant cell-wall analysis. J. Exp. Bot. 64, 4635–4649.doi: 10.1093/jxb/ert255
Campbell, M. M., and Sederoff, R. R. (1996). Variation in lignin contentand composition – mechanism of control and implications for the geneticimprovement of plants. Plant Physiol. 110, 3–13.
Carnachan, S. M., and Harris, P. J. (2000). Ferulic acid is bound to the primarycell walls of all gymnosperm families. Biochem. Syst. Ecol. 28, 865–879. doi:10.1016/S0305-1978(00)00009-0
Carpita, N. C., Gibeaut, D. M., and Kim, J. B. (1993). Structural dynamics of thecell-wall during development. J. Cell. Biochem. 5, 5.
Chaffey, N., Cholewa, E., Regan, S., and Sundberg, B. (2002). Secondary xylemdevelopment in Arabidopsis: a model for wood formation. Physiol. Plant. 114,594–600. doi: 10.1034/j.1399-3054.2002.1140413.x
Da Silva, C. E., Vandenabeele, P., Edwards, H. G. M., and De Oliveira, L. F. C.(2008). NIR-FT-Raman spectroscopic analytical characterization of the fruits,seeds, and phytotherapeutic oils from rosehips. Anal. Bioanal. Chem. 392,1489–1496. doi: 10.1007/s00216-008-2459-0
de Borst, K., Bader, T. K., and Wikete, C. (2012). Microstructure-stiffnessrelationships of ten European and tropical hardwood species. J. Struct. Biol. 177,532–542. doi: 10.1016/j.jsb.2011.10.010
Dima, O., Morreel, K., Vanholme, B., Kim, H., Ralph, J., and Boerjan, W. (2015).Small glycosylated lignin oligomers are stored in Arabidopsis leaf vacuoles.Plant Cell 27, 695–710. doi: 10.1105/tpc.114.134643
Dominguez, E., Cuartero, J., and Heredia, A. (2011). An overview on plant cuticlebiomechanics. Plant Sci. 181, 77–84. doi: 10.1016/j.plantsci.2011.04.016
Domínguez, E., Heredia-Guerrero, J. A., and Heredia, A. (2015). Plantcutin genesis: unanswered questions. Trends Plant Sci. 20, 551–558. doi:10.1016/j.tplants.2015.05.009
Eckardt, N. A. (2002). Probing the mysteries of lignin biosynthesis: thecrystal structure of caffeic acid/5-hydroxyferulic acid 3/5-O-methyltransferaseprovides new insights. Plant Cell 14, 1185–1189. doi: 10.1105/tpc.140610
Edwards, D. (1993). Cells and tissues in the vegetative sporophytes of early landplants. New Phytol. 125, 225–247. doi: 10.1111/j.1469-8137.1993.tb03879.x
Edwards, H. G. M., and Falk, M. J. P. (1997). Fourier-transform Ramanspectroscopic study of unsaturated and saturated waxes. Spectrochim. Acta A
Mol. Biomol. Spectrosc. 53, 2685–2694. doi: 10.1016/S1386-1425(97)00161-3Fratzl, P., Burgert, I., and Gupta, H. S. (2004). On the role of interface polymers
for the mechanics of natural polymeric composites. Phys. Chem. Chem. Phys. 6,5575–5579. doi: 10.1039/b411986j
Frontiers in Chemistry | www.frontiersin.org 11 February 2016 | Volume 4 | Article 10
Prats Mateu et al. Raman Imaging of Waterproofing Polymers
Geladi, P., Grahn, H., and Manley, M. (2010). “Data analysis and chemometricsfor hyperspectral imaging,” in Raman, Infrared, and Near-Infrared Chemical
Imaging, eds S. Šašic and Y. Ozaki (Hoboken, NJ: John Wiley & Sons, Inc.),93–107. doi: 10.1002/9780470768150.ch5
Gierlinger, N. (2014). Revealing changes in molecular composition of plant cellwalls on the micron-level by Raman mapping and vertex component analysis(VCA). Front. Plant Sci. 5:306. doi: 10.3389/fpls.2014.00306
Gierlinger, N., Keplinger, T., and Harrington, M. (2012). Imaging of plantcell walls by confocal Raman microscopy. Nat. Protoc. 7, 1694–1708. doi:10.1038/nprot.2012.092
Gierlinger, N., Keplinger, T., Harrington, M., and Schwanninger, M. (2013).“Raman imaging of lignocellulosic feedstock,” in Cellulose – Biomass
Conversion, ed P. J. Kadla (InTech), 159–192.Gierlinger, N., and Schwanninger, M. (2006). Chemical imaging of poplar wood
cell walls by confocal Raman microscopy. Plant Physiol. 140, 1246–1254. doi:10.1104/pp.105.066993
Gierlinger, N., and Schwanninger, M. (2007). The potential of Raman microscopyand Raman imaging in plant research. Spectrosc. Int. J. 21, 69–89. doi:10.1155/2007/498206
Gindl, W., Gupta, H. S., Schoberl, T., Lichtenegger, H. C., and Fratzl, P. (2004).Mechanical properties of spruce wood cell walls by nanoindentation. Appl.Phys. Mater. Sci. Process. 79, 2069–2073. doi: 10.1007/s00339-004-2864-y
Greene, P. R., and Bain, C. D. (2005). Total internal reflection Raman spectroscopyof barley leaf epicuticular waxes in vivo. Colloid. Surf. B Biointerfaces 45,174–180. doi: 10.1016/j.colsurfb.2005.08.010
Hanninen, T., Kontturi, E., and Vuorinen, T. (2011). Distribution of lignin andits coniferyl alcohol and coniferyl aldehyde groups in Picea abies and Pinus
sylvestris as observed by Raman imaging. Phytochemistry 72, 1889–1895. doi:10.1016/j.phytochem.2011.05.005
Heredia, A. (2003). Biophysical and biochemical characteristics of cutin, aplant barrier biopolymer. Biochim. Biophys. Acta Gen. Subj. 1620, 1–7. doi:10.1016/S0304-4165(02)00510-X
Heredia-Guerrero, J. A., Benitez, J. J., Dominguez, E., Bayer, I. S., Cingolani, R.,Athanassiou, A., et al. (2014). Infrared and Raman spectroscopic features ofplant cuticles: a review. Front. Plant Sci. 5:305. doi: 10.3389/fpls.2014.00305
Ho, M., and Pemberton, J. E. (1998). Alkyl chain conformation of octadecylsilanestationary phases by Raman spectroscopy. 1. Temperature dependence. Anal.Chem. 70, 4915–4920. doi: 10.1021/ac980471s
Hunt, G. M., and Baker, E. A. (1980). Phenolic constituents of tomato fruit cuticles.Phytochemistry 19, 1415–1419. doi: 10.1016/0031-9422(80)80185-3
Jones, L., Ennos, A. R., and Turner, S. R. (2001). Cloning and characterization ofirregular xylem4 (irx4): a severely lignin-deficient mutant of Arabidopsis. PlantJ. 26, 205–216. doi: 10.1046/j.1365-313x.2001.01021.x
Kaul, S., Koo, H. L., Jenkins, J., Rizzo, M., Rooney, T., Tallon, L. J., et al. (2000).Analysis of the genome sequence of the flowering plant Arabidopsis thaliana.Nature 408, 796–815. doi: 10.1038/35048692
Kerstiens, G. (1996). Signalling across the divide: a wider perspective ofcuticular structure-function relationships. Trends Plant Sci. 1, 125–129. doi:10.1016/S1360-1385(96)90007-2
Kleinert, M., and Barth, T. (2008). Phenols from Lignin. Chem. Eng. Technol. 31,736–745. doi: 10.1002/ceat.200800073
Lam, T. B. T., Kadoya, K., and Iiyama, K. (2001). Bonding of hydroxycinnamicacids to lignin: ferulic and p-coumaric acids are predominantly linked at thebenzyl position of lignin, not the β-position, in grass cell walls. Phytochemistry
57, 987–992. doi: 10.1016/S0031-9422(01)00052-8Langdale, J. A., and Harrison, C. J. (2008). “Developmental transitions during the
evolution of plant form,” in Evolving Pathways Key Themes in Evolutionary
Developmental Biology ed A. Minelli (Cambridge, MA: Cambridge UniversityPress), 299–316. doi: 10.1017/CBO9780511541582.021
Littlejohn, G. R., Mansfield, J. C., Parker, D., Lind, R., Perfect, S., Seymour, M., et al.(2015). In vivo chemical and structural analysis of plant cuticular waxes usingstimulated raman scattering (srs) microscopy. Plant Physiol. 168, 18–28. doi:10.1104/pp.15.00119
López-Casado, G., Matas, A. J., Domínguez, E., Cuartero, J., and Heredia, A.(2007). Biomechanics of isolated tomato (Solanum lycopersicum L.) fruitcuticles: the role of the cutin matrix and polysaccharides. J. Exp. Bot. 58,3875–3883. doi: 10.1093/jxb/erm233
Macherius, A., Kuschk, P., Haertig, C., Moeder, M., Shtemenko, N. I., Bayona,A. H., et al. (2011). Composition changes in the cuticular surface lipids ofthe helophytes Phragmites australis and Juncus effusus as result of pollutantexposure. Environ. Sci. Pollut. Res. 18, 727–733. doi: 10.1007/s11356-010-0416-x
Mar, B. D., Qi, H. W., Liu, F., and Kulik, H. J. (2015). Ab Initio screening approachfor the discovery of lignin polymer breaking pathways. J. Phys. Chem. A 119,6551–6562. doi: 10.1021/acs.jpca.5b03503
Marks, M. D., Betancur, L., Gilding, E., Chen, F., Bauer, S., Wenger, J. P., et al.(2008). A newmethod for isolating large quantities of Arabidopsis trichomes fortranscriptome, cell wall and other types of analyses. Plant J. 56, 483–492. doi:10.1111/j.1365-313X.2008.03611.x
McFarlane, H. E., Döring, A., and Persson, S. (2014). The cell biology of cellulosesynthesis. Ann. Rev. Plant Biol. 65, 69–94. doi: 10.1146/annurev-arplant-050213-040240
Mueller, J., Ibach, W., Weishaupt, K., and Hollricher, O. (2003). Confocal RamanMicroscopy.Microsc. Microanal. 9, 1084–1085.
Nascimento, J. M., and Dias, J. M. B. (2005). Vertex component analysis: a fastalgorithm to unmix hyperspectral data. IEEE Trans. Geosci. Remote Sens. 43,898–910. doi: 10.1109/TGRS.2005.844293
Neutelings, G. (2011). Lignin variability in plant cell walls: contributionof new models. Plant Sci. 181, 379–386. doi: 10.1016/j.plantsci.2011.06.012
Pauly, M., Gille, S., Liu, L. F., Mansoori, N., De Souza, A., Schultink, A., et al.(2013). Hemicellulose biosynthesis. Planta 238, 627–642. doi: 10.1007/s00425-013-1921-1
Piot, O., Autran, J. C., and Manfait, M. (2001). Investigation by confocalRaman microspectroscopy of the molecular factors responsible for graincohesion in thetriticum aestivum bread wheat. Role of the cell wallsin the starchy endosperm. J. Cereal Sci. 34, 191–205. doi: 10.1006/jcrs.2001.0391
Pollard, M., Beisson, F., Li, Y. H., and Ohlrogge, J. B. (2008). Building lipidbarriers: biosynthesis of cutin and suberin. Trends Plant Sci. 13, 236–246. doi:10.1016/j.tplants.2008.03.003
Prats-Mateu, B., Stefke, B., Hauser, M. T., and Gierlinger, N. (2014). Elucidatingstructural and compositional changes in plant tissues and single cells by Ramanspectroscopic imaging. Spectrosc. Eur. 26, 11–14.
Prinsloo, L. C., Du Plooy,W., and VanDerMerwe, C. (2004). Raman spectroscopicstudy of the epicuticular wax layer of mature mango (Mangifera indica) fruit.J. Raman Spectrosc. 35, 561–567. doi: 10.1002/jrs.1185
Ralph, J., Kim, H., Lu, F., Grabber, J. H., Leple, J. C., Berrio-Sierra, J., et al.(2008). Identification of the structure and origin of a thioacidolysis markercompound for ferulic acid incorporation into angiosperm lignins (and anindicator for cinnamoyl CoA reductase deficiency). Plant J. 53, 368–379. doi:10.1111/j.1365-313X.2007.03345.x
Ram, M. S., Dowell, F. E., and Seitz, L. M. (2003). FT-Raman spectra of unsoakedand NaOH-soaked wheat kernels, bran, and ferulic acid. Cereal Chem. 80,188–192. doi: 10.1094/CCHEM.2003.80.2.188
Reina, J. J., Dominguez, E., and Heredia, A. (2001). Water sorption-desorptionin conifer cuticles: the role of lignin. Physiol. Plant. 112, 372–378. doi:10.1034/j.1399-3054.2001.1120310.x
Riley, R. G., and Kolattukudy, P. E. (1975). Evidence for covalently attachedpara-coumaric acid and ferulic acid in cutins and suberins. Plant Physiol. 56,650–654. doi: 10.1104/pp.56.5.650
Saito, K., Watanabe, Y., Shirakawa, M., Matsushita, Y., Imai, T., Koike, T., et al.(2012). Direct mapping of morphological distribution of syringyl and guaiacyllignin in the xylem ofmaple by time-of-flight secondary ionmass spectrometry.Plant J. 69, 542–552. doi: 10.1111/j.1365-313X.2011.04811.x
Sarkanen, K. V., and Ludwig, C. H. (1971). Lignins: Occurrence, Foramtion,
Structure, and Reactions. New York, NY: Wiley-Intersciences.Schulz, H., and Baranska, M. (2007). Identification and quantification of valuable
plant substances by IR and Raman spectroscopy. Vibrational Spectrosc. 43,13–25. doi: 10.1016/j.vibspec.2006.06.001
Smith, E., and Dent, G. (2005). “The Raman experiment-Raman instrumentation,sample preparation, data handling and practical aspects of interpretation,” inModern Raman Spectroscopy-A Practical Approach (Chichester: John Wiley &Sons Ltd.), 21–67.
Frontiers in Chemistry | www.frontiersin.org 12 February 2016 | Volume 4 | Article 10
Prats Mateu et al. Raman Imaging of Waterproofing Polymers
Stewart, D., Yahiaoui, N., McDougall, G. J., Myton, K., Marque, C., Boudet,A. M., et al. (1997). Fourier-transform infrared and Raman spectroscopicevidence for the incorporation of cinnamaldehydes into the lignin oftransgenic tobacco (Nicotiana tabacum L.) plants with reduced expression ofcinnamyl alcohol dehydrogenase. Planta 201, 311–318. doi: 10.1007/s004250050072
Suh, M. C., Samuels, A. L., Jetter, R., Kunst, L., Pollard, M., Ohlrogge,J., et al. (2005). Cuticular lipid composition, surface structure, and geneexpression in Arabidopsis stem epidermis. Plant Physiol. 139, 1649–1665. doi:10.1104/pp.105.070805
Sun, L., Varanasi, P., Yang, F., Loque, D., Simmons, B. A., and Singh, S. (2012).Rapid determination of syringyl: guaiacyl ratios using FT-Raman spectroscopy.Biotechnol. Bioeng. 109, 647–656. doi: 10.1002/bit.24348
Synytsya, A., Copikova, J., Matejka, P., andMachovic, V. (2003). Fourier transformRaman and infrared spectroscopy of pectins. Carbohydr. Polym. 54, 97–106.doi: 10.1016/S0144-8617(03)00158-9
Trebolazabala, J., Maguregui, M., Morillas, H., De Diego, A., and Madariaga, J. M.(2013). Use of portable devices and confocal Raman spectrometers at differentwavelength to obtain the spectral information of the main organic componentsin tomato.(Solanum lycopersicum) fruits. Spectrochim. Acta A Mol. Biomol.
Spectrosc. 105, 391–399. doi: 10.1016/j.saa.2012.12.047Tsubaki, S., and Azuma, J. (2013). Total fractionation of green tea residue by
microwave-assisted alkaline pretreatment and enzymatic hydrolysis. Bioresour.Technol. 131, 485–491. doi: 10.1016/j.biortech.2013.01.001
Voxeur, A., Wang, Y., and Sibout, R. (2015). Lignification: differentmechanisms for a versatile polymer. Curr. Opin. Plant Biol. 23, 83–90.doi: 10.1016/j.pbi.2014.11.006
Waters, E. R. (2003). Molecular adaptation and the origin of landplants. Mol. Phylogenet. Evol. 29, 456–463. doi: 10.1016/j.ympev.2003.07.018
Weissflog, I., Vogler, N., Akimov, D., Dellith, A., Schachtschabel, D., Svatos, A.,et al. (2010). Toward in vivo chemical imaging of epicuticular waxes. PlantPhysiol. 154, 604–610. doi: 10.1104/pp.110.161786
Wiley, J. H., and Atalla, R. H. (1987a). Band assignments in the Raman-spectra ofcelluloses. Carbohydr. Res. 160, 113–129. doi: 10.1016/0008-6215(87)80306-3
Wiley, J. H., and Atalla, R. H. (1987b). “Raman-spectra of celluloses,” in The
Structure of Cellulose, Vol. 340, ed R. H. Atalla (Washington, DC: ACSSymposium Series, American Chemical Society), 151–168.
Wu, H. W., Volponi, J. V., Oliver, A. E., Parikh, A. N., Simmons, B. A., and Singh,S. (2011). In vivo lipidomics using single-cell Raman spectroscopy. Proc. Natl.Acad. Sci. U.S.A. 108, 3809–3814. doi: 10.1073/pnas.1009043108
Yu, M. M. L., Konorov, S. O., Schulze, H. G., Blades, M. W., Turner, R. F. B.,and Jetter, R. (2008). In situ analysis by microspectroscopy reveals triterpenoidcompositional patterns within leaf cuticles of Prunus laurocerasus. Planta 227,823–834. doi: 10.1007/s00425-007-0659-z
Yu, M. M. L., Schulze, H. G., Jetter, R., Blades, M. W., and Turner, R. F. B. (2007).Raman microspectroscopic analysis of triterpenoids found in plant cuticles.Appl. Spectrosc. 61, 32–37. doi: 10.1366/000370207779701352
Conflict of Interest Statement: The authors declare that the research wasconducted in the absence of any commercial or financial relationships that couldbe construed as a potential conflict of interest.
Copyright © 2016 Prats Mateu, Hauser, Heredia and Gierlinger. This is an open-
access article distributed under the terms of the Creative Commons Attribution
License (CC BY). The use, distribution or reproduction in other forums is permitted,
provided the original author(s) or licensor are credited and that the original
publication in this journal is cited, in accordance with accepted academic practice.
No use, distribution or reproduction is permitted which does not comply with these
terms.
Frontiers in Chemistry | www.frontiersin.org 13 February 2016 | Volume 4 | Article 10