Embed Size (px)
Citation preview

Watershed Characteristics and Polycyclic Aromatic Hydrocarbons in Urban Lake SedimentsEVAN DART

Polycyclic Aromatic Hydrocarbons (PAHs)• Compounds produced during carbon combustion processes• Several classified as suspected or probable human carcinogens by the U.S. EPA
Van Metre et al. 2000

Coal-tar Sealant PAH Contribution to Urban Lake Sediment
Van Metre and Mahler, 2010

Coal-Tar Based Sealant Liquid sealant used to protect and beautify pavement
Highly concentrated in PAHs (10% by weight)
USGS; Van Metre, 2010

Study Determine if certain watershed characteristics affect coal-tar sealant contribution of PAHs in urban lake sediments
◦ Twenty lakes selected from study by Mahler and Van Metre, 2010

Analysis Geospatial Data
◦ Average Annual Precipitation◦ Average Slope◦ Impervious Fraction◦ Average Slope of Stream Network
Statistical Analysis: Spearman’s Rank Correlation◦ Between PAH concentration data from the study and the watershed geospatial data
◦ Coal-Tar Sealant PAH Mass Contribution
Data Sources National Elevation Dataset (NED30m)
◦ Watershed Delineation◦ Average Hydrologic Slope◦ Stream Network Average Slope
USA Mean Rainfall◦ Average Annual Rainfall
National Land Cover Dataset (NLCD Impervious)◦ Impervious Fraction
Sediment PAH Data (Van Metre and Mahler, 2010)

Geospatial Data Example

Geospatial Data Example

Spearman’s Rank Correlation Analysis
Measures the association between two variables
Does not assume a linear relationship
Spearman’s Rank Correlation Coefficient, ρ
◦ Strong Negative Correlation = -1◦ Strong Positive Correlation = 1

Average Annual Precipitation
15 20 25 30 35 40 45 50 55 600
10
20
30
40
50
60Rainfall – Sealant PAH Mass Contribution
Average Annual Rainfall (Inches)
Seal
ant P
AH M
ass L
oadi
ng (m
g/kg
)
Spearman’s Rank Correlation Coefficient, ρ = 0.041
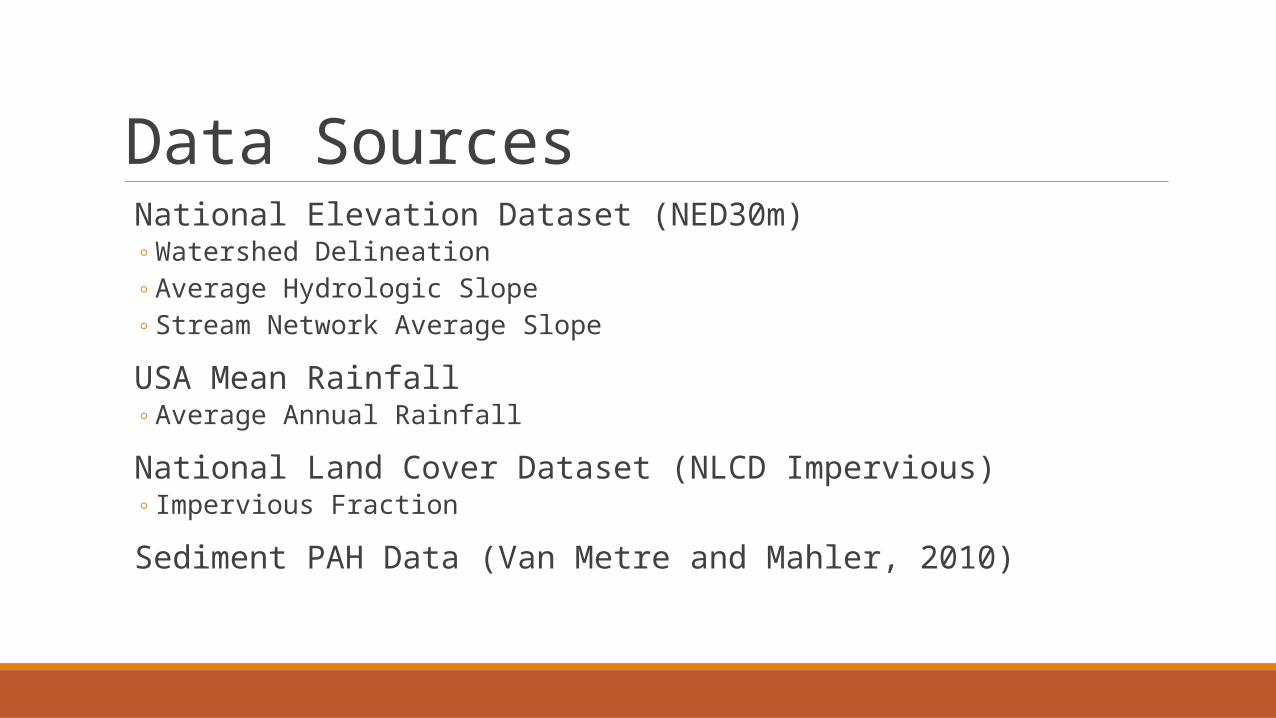
Average Slope
0 1 2 3 4 5 6 70
10
20
30
40
50
60
Slope - Sealant PAH Mass Contribution
Average Hydrologic Slope
Seal
ant P
AH M
ass L
oadi
ng (m
g/kg
)
Spearman’s Rank Correlation Coefficient, ρ = -0.418
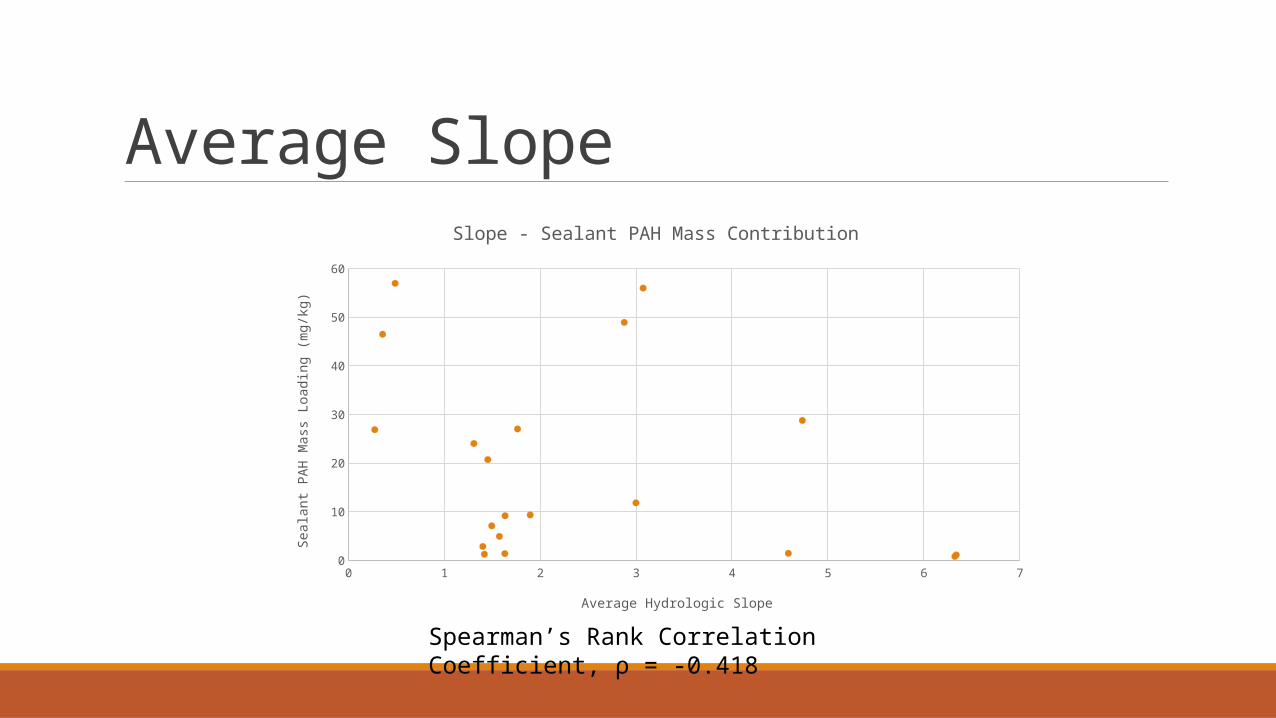
Impervious Fraction
0.00 0.10 0.20 0.30 0.40 0.50 0.600
10
20
30
40
50
60
Impervious Fraction – Sealant PAH Mass Contribution
Impervious Area Fraction
Seal
ant P
AH M
ass L
oadi
ng (m
g/kg
)
Spearman’s Rank Correlation Coefficient, ρ = 0.277

Average Stream Network Slope
0 0.5 1 1.5 2 2.5 3 3.5 4 4.5 50
10
20
30
40
50
60
Stream Network Slope – Sealant PAH Mass Contribution
Stream Network Slope
Seal
ant P
AH M
ass L
oadi
ng (m
g/kg
)
Spearman’s Rank Correlation Coefficient, ρ = -0.599

ConclusionsNo strong correlations between geospatial data categories and sediment PAH dataUnexpected trendsPossible Improvements
◦ Larger sample size◦ Other geospatial data categories to consider◦ Coal-Tar Sealant Geospatial Data

References Van Metre P, and Mahler B. Contribution of PAHs from coal-tar pavement sealcoat and other sources to 40 U.S. Lakes. Science of the Total Environment 2010; 409: 334-344.
Van Metre P, Mahler B, Furlong, E. Urban Sprawl Leaves Its PAH Signature. Environmental Science and Technology 2000; 34: 4064-4070.