Embed Size (px)
Citation preview

Portable Wireless
Waterway Expert Traffic System
Final Report: Development of a Portable Tool for Coastal
Zone Management June 17, 2002
Submitted To
Sara Shapiro Florida Marine Research Institute
100 eighth Avenue SE St. Petersburg, Florida 33701-5095
Submitted by:
Kenneth W. Holappa, Ph. D. and William A. Venezia, Ph. D.
Ocean Sensor Systems, Inc.
Richard E. Dodge Ph. D., Dean
Nova Southeastern University Oceanographic Center
NSU Oceanographic Center Nova Southeastern University
8000 North Ocean Drive Dania, FL 33004
http://www.nova.edu/ocean/
Ocean Sensor Systems, Inc.
Ocean Sensor Systems, Inc. 3561 NW 97th Terrace
Coral Springs, FL 33065 http://www.oceansensorsystems.com/

Table of Contents
Section Page I INTRODUCTION 1
A. Purpose and Scope 2 B. Technical Implementation 3
1. System Components and Major Subsystems 4 2. Principle of Operation Embedded system 4 3. Operational Guidelines 5 4. Mechanical and electrical subsystems 6
II SYSTEM DEVELOPMENT A. Rational And Background 9 B. Waterway Hardware development 9 C. Internet Based Software System 10 D. System Demonstration 13 E. Database Development 15
III SUMMARY AND FUTURE DIRECTIONS 19
Section
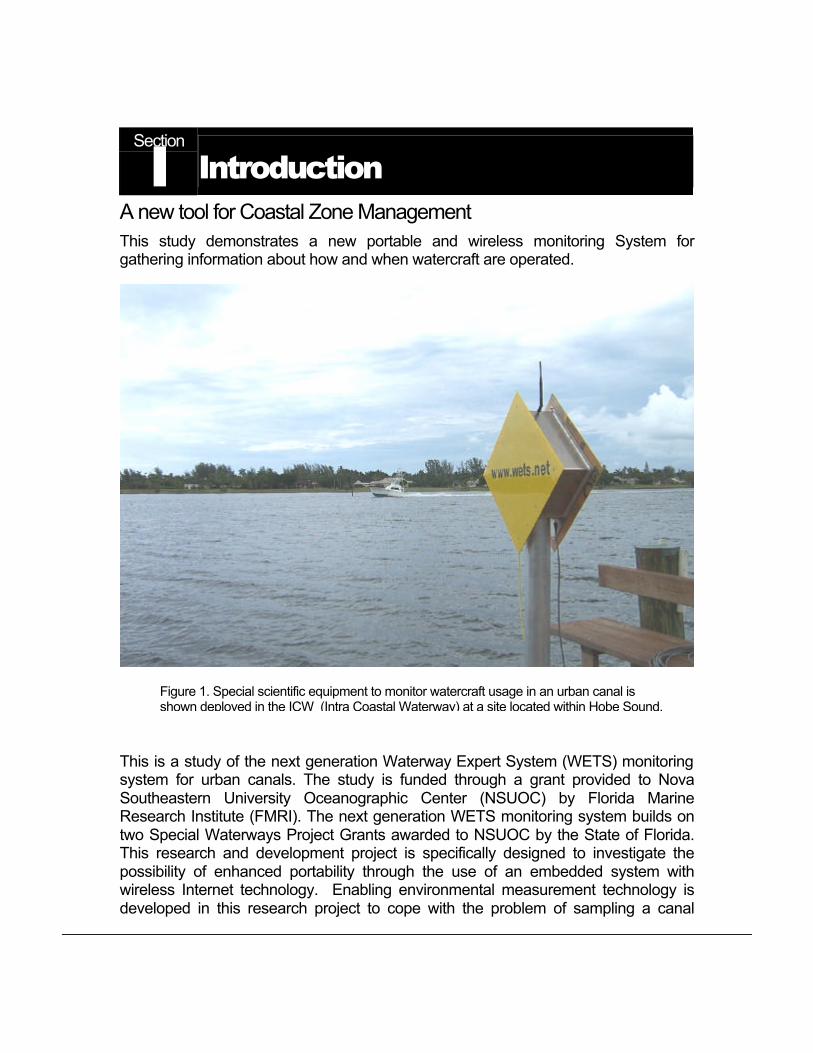
I Introduction A new tool for Coastal Zone Management This study demonstrates a new portable and wireless monitoring System for gathering information about how and when watercraft are operated.
This is a study of the next generation Waterway Expert System (WETS) monitoring system for urban canals. The study is funded through a grant provided to Nova Southeastern University Oceanographic Center (NSUOC) by Florida Marine Research Institute (FMRI). The next generation WETS monitoring system builds on two Special Waterways Project Grants awarded to NSUOC by the State of Florida. This research and development project is specifically designed to investigate the possibility of enhanced portability through the use of an embedded system with wireless Internet technology. Enabling environmental measurement technology is developed in this research project to cope with the problem of sampling a canal
Figure 1. Special scientific equipment to monitor watercraft usage in an urban canal is shown deployed in the ICW (Intra Coastal Waterway) at a site located within Hobe Sound,

2
sufficiently to draw quantifiable, sustainable conclusions about sea state and vessel traffic in various waterway locations.
The WETS portable and wireless monitoring project has application to monitoring and enforcement of existing state and federal regulations across waterways for marine mammal protection. The state of the waterways and their usage is highly variable throughout Florida. A low cost, portable, and effective method of monitoring inland waterway and canal systems will benefit the state government agencies tasked with regulation, monitoring, and enforcement. By implementing the features created in the earlier WETS system on a portable platform, information may be gathered throughout a waterfront area. The data collected may be used to develop a comprehensive understanding of the state of a canal system and how it is being used. Such data also enables those responsible for managing these resources to draw justifiable conclusions.
Our urban canals are a limited resource facing increasing pressure for, often, conflicting uses. Proper management can only be the result of an informed administration derived through research and knowledge base development. This report discusses the scope and results of the research and development work done to date on the Portable Wireless Waterway Expert Traffic System (PWWETS).
As part of the deliverable for this research grant, we have created a master CDROM intended for unlimited public distribution by Nova Southeastern University. This final report is included with backup information related to the research grant.
A. Purpose and Scope Detailed information about waterway use is necessary for planning, education, regulation, maintenance, and enforcement. Knowledge of how many, what kinds, how and when watercraft are being operated is essential information for management that is not readily available. The two previous WETS research projects were to design, build, deploy, and test special equipment to monitor watercraft usage in an urban canal and to compare the method of automated measurement with human data collection. The research was conducted under a Florida Department of Environmental Protection special waterways project grant. This grant funded Nova Southeastern University who in turn funded Ocean System Development Corporation. These ambitious projects started in mid July 1998 and concluded in December 2000. The sponsored research was documented in the NSUOC WETS 1998 and 1999 final reports and at the www.wets.net Internet site. This present research and development grant fulfills the purpose of developing an advanced PWWETS prototype. The proposal continues the focus of the work done to date towards developing the tools necessary for making intelligent decisions about water use and state but adds practical considerations. Attention is given to deployment, ease of use, and overall system cost. Since the original WETS

3
development, the principal investigator (Dr. William Venezia) with Oceans Systems Development Corporation (OSDC) has joined with new partners to form a new corporation, known as Ocean Sensors Systems Incorporated (OSSI), specifically for sensor development. The PWWETS is configured for use as an event driven environmental measurement system for measurement of watercraft behavior and waterway conditions. The system utilizes portable wireless Internet reporting with entirely new and different hardware and software in an original research and development effort. The following table outlines the past and present project goals.
PROJECT GOALS
WETS WETS_PWIR (Current Project)
o Fixed System Hard Wired to Shore
o Portable System Wireless Telemetry
o Shore Power over submarine cable
o Solar Power or Long duration Battery
o Telephone wire in ground burial cable to ISDN Modem and NT Server on Beach
o Wireless Cellular 28k Modem and Micro PC Server on Sensor Pole
o Internet Sever Windows NT4 o Internet Server Apache 2.0 o More Computing Power on
Shore o Single Laser Vessel
Detection o Speed Estimated by
Processing Wake Data o Wave Staff Wake Height
Measure o Off Line or Shore Side Signal
Processing o Shore Side Data Base o Analog based sensors
o More Computing Power on Sensor Pole
o Zero, One, or two LASER Vessel
o Detection o LASER or Camera Speed
Measurement o Wave Staff Wake Height
Measure o More Onsite Signal
Processing o Shore Side Data Base o Retrievable Data Base on
Sensor pole o Fully digital sensor systems
o Higher Bandwidth Telemetry o Lower Bandwidth Telemetry o GUI From Shore at Water
Site Server Only o FMRI Private Network GUI
Over Internet o First Generation Wave Staff
Designs o OSSI 2nd Generation Wave
Staff Designs o Maintain/Upgrade the WETS
Internet Site o Maintain/Upgrade the WETS
Internet Site

4
B. Technical Implementation: 1. System Components and Major Subsystems:
The technical implementation utilized the latest hardware and design architecture to create a flexible and scalable system. The four major peripheral devices, i.e. the modem, camera, laser and wave staff, are fully intelligent digital devices communicating over serial and Ethernet links. A complete listing of the various components in the system is given below:
q High-resolution digital camera
q High Speed Laser range finder
q Pentium class embedded computer
q Digital Cellular modem
q Wave staff with digital output
q Batteries and high efficiency power supply circuitry
q Portable stand
q Embedded system software
q User interface software
q Technical documentation
2. Principle of operation of the embedded system:
The embedded processing on the PWWETS can be considered a state machine with the process passing through a series of states where certain conditions are met before going on to the next state. Below is an outline of the operation of the system and the required processes.
q The embedded software will monitor the output of the laser range finder.
q When a boat interrupts the beam, the distance to the boat will be recorded and the camera and wave-staff triggered.
q The camera and the wave staff will then collect high-resolution images/data.

5
q The boat speed and size will be estimated from the image information by the embedded software.
q The images together with the time, date, wave-staff data, laser data and calculated boat speed will be recorded to the embedded hard drive.
q In addition, a log file will be updated to register the event.
q The embedded system will then begin the cycle again.
3. Operation Guidelines
User control of the PWWETS over a GUI Internet connection will provide enhanced functionality. There will be the opportunity for power savings because the system may be remotely turned on and off as well as reprogrammed and adjusted to fit the need of the time and location of deployment.
Multiple boats in the center of the image at the same time may result in the calculated speed having some error. Tuning the software may minimize this effect. Additionally, the images may be analyzed manually to precisely extract the boat speed of all boats in the images. The software will be able to flag images where confidence level is reduced due to multiple boat events or other events that compromise the calculations.
Operation will typically begin with the system automatically powering up and booting at a set time of day; when there is enough light to produce meaningful images or shortly after dawn. The embedded system will run a health check and log the information to a status file. The embedded system will then open an event log file and begin to log any boat events. A new log file will be opened each day with the date of the file in the name and the first line of the log containing the location, start time, date and any other site specific information entered during the setup procedure above.
4. Principal of operation of the wireless Internet system:
In a fashion similar to the embedded system processing, the internet processing can also be considered a state machine that steps through the higher level process of handling information requests.
q The process begins operation when a request is initiated.
q The request can be for all or any subset of information gathered by the embedded system and is classified as either urgent or not.
q The request then initiates communications to the embedded system by dialing it up.
q The embedded system interrupts traffic monitoring if the information is classified as urgent to send the requested information. If the information

6
request is not urgent, the embedded system sends the information during idle time only.
q The embedded system then updates a login file and resumes monitoring.
q The requested information is packaged into a data product and posts it to the project web site.
q A new information request may then be initiated.
q The embedded system may also be programmed to send an email warning of irregular operation of the system or of some other event.
q An internet interface will also allow reconfiguration of certain settings in the embedded system such as turn-on and turn-off times
5. Mechanical and Electrical Support systems:
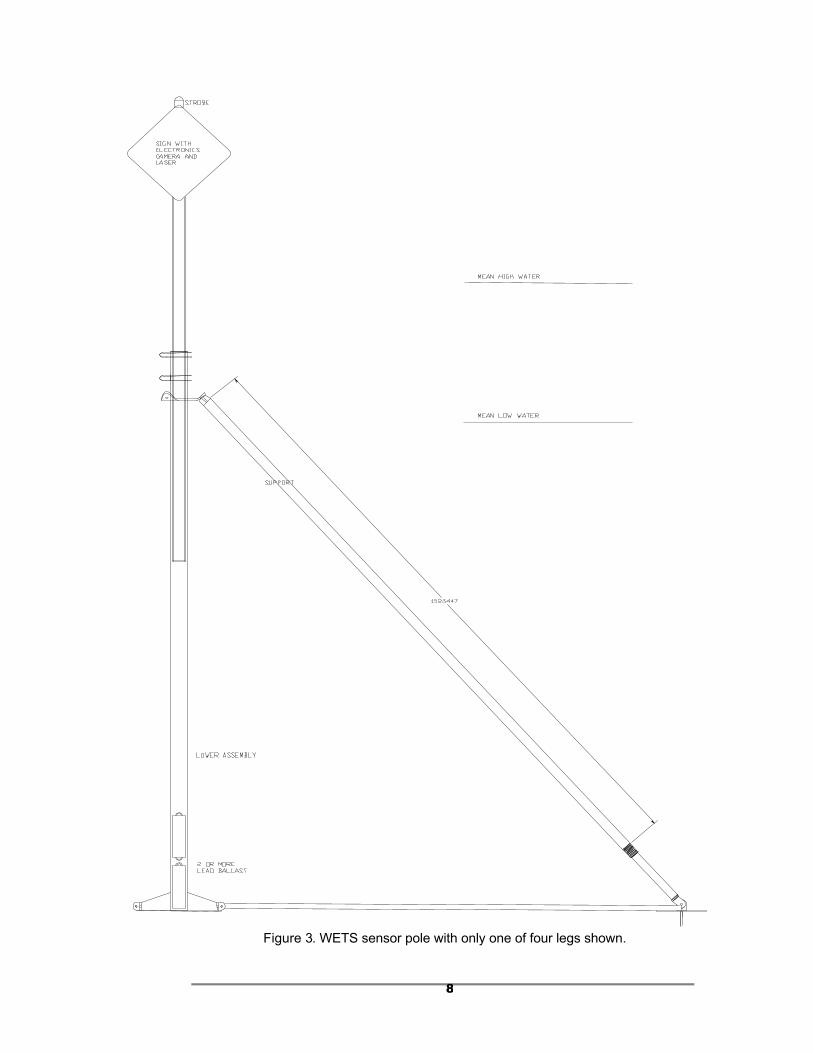
12volt SLA batteries power the embedded system. The battery system provides for a total run time of about 500 hours or 30 days (power consumption is ~10 watts). This will provide sufficient power for the system to operate during all hours that there is sufficient light for the camera to operate (nominally dawn to dusk). The system will power up and down at specific times of the day. The electronics housing is sandwiched between two signs at the top of the pole. The electronics housing will house the electronics, camera, and laser (Figure 2). The stand must also support the wave staff and allow access to reboot and connect to the computer system. The stand is designed to remain upright in up to 60mph winds and is shown in Figure 3. The stand is designed for installation at the waterway site by only two people with a small boat. The deployment procedure is designed so that no single piece is over 70 pounds dry. The stand is in two parts: A top assembly containing the solar panel, electronics, camera, laser and top tube and a bottom assembly containing the legs, bottom tube, wave staff, batteries and ballast weight. Each of the four legs can be adjusted to accommodate slope and unevenness in the underlying bathymetry.

7
Figure 2. WETS hardware cover removed showing camera, computer and wireless telemetry system.
8
Figure 3. WETS sensor pole with only one of four legs shown.

9
Section
2 System Development A new tool for Coastal Zone Management
A. Rational and Background The development of this system under this contract was, due to a number of factors, compressed into an extremely short time schedule. Nevertheless, project deliverables have been essentially accomplished according to specifications. The following sections present the system development.
B. Hardware Deployed in Waterway: The hardware necessary for deployment and testing was completed with the exception of the LASER rangefinder system which, at the time of this writing, had not yet been received from Sweden. This hardware was deployed on June 14, 2002 as part of demonstration for FMRI. Although further system testing is needed with the aid of the LASER rangefinder, a successful demonstration of the system was conducted.
C. Internet Based Software System: At the time of the system demonstration the Internet based software was also demonstrated. This software page is found at the following internet address: http://166.133.120.246 and is reproduced on the following page. This is a secure Internet site that may be viewed by authorized FMRI, NSUOC, and OSSI staff only. The image displayed on the Internet site is low resolution (8k) to allow for faster downloading through the Internet. The system supports very high-resolution 600K image files available for qualified users to download via ftp. Though the system is designed to operate within a range of 100meters, a typical canal width, the image of a vessel in Figure 4 was taken during the demonstration at a range of approximately 500meters. The boat remains quite clear at this increased distance and is indicative of the cameras capabilities. There are links given within the web site to directories containing all of the raw data including wave staff data, laser data and derived quantities in addition to the high resolution images. These directory structures are shown on the following pages as they appear when viewed on the Internet with a web browser.

10
You have reached a Secure Internet Site
Ocean Sensor Systems Waterway Expert Traffic System
This site is being developed under Contract to
NOVA SOUTHEASTERN UNIVERSITY OCEANOGRAPHIC
CENTER In response to a research grant from the
Florida Marine Research Institute
This site is designed to provide detailed information about waterway use.
Additional Information is available at the following locations:
High resolution images can be found in the /images directory
The following information is in folders arranged by the day.
A list of all events for the day can be found in the file event.log
The tide and wake information can be found in the file wake.log
High resolution wave information can be found in the file wave.log
Return to our Public Access Online Control Panel at www.wets.net To visit Ocean Sensor Systems corporate website go to www.oceansensorsystems.com

11
This site was last updated June 7, 2002 All Rights Reserved Ocean Sensor Systems Inc., and Nova Southeastern University
Following is the directory structure of the high-resolution image files. Opening Fri_Jun_14_2002/ produces the list of files shown on the following page. This link is reached from the secure Internet website shown on the previous page.
Index of /images
Name Last modified Size Description
Parent Directory 06-Jun-2002 10:28 -
Fri_Jun_14_2002/ 14-Jun-2002 13:48 -
Thu_Jun_13_2002/ 13-Jun-2002 20:18 -
Apache/1.3.20 Server at 10.0.0.10 Port 80
Figure 4. Sample Image taken during system demonstration on June 14, 2002

12
Index of /images/Fri_Jun_14_2002
Name Last modified Size Description
Parent Directory 14-Jun-2002 09:29 -
00000000000000000001/ 14-Jun-2002 09:29 -
09_32_50.trig+0.jpg 14-Jun-2002 09:32 174k
09_32_50.trig+1.jpg 14-Jun-2002 09:32 178k
09_32_50.trig-1.jpg 14-Jun-2002 09:32 176k
09_33_50.trig+0.jpg 14-Jun-2002 09:33 194k
09_33_50.trig+1.jpg 14-Jun-2002 09:33 193k
09_33_50.trig-1.jpg 14-Jun-2002 09:33 198k
10_01_04.trig+0.jpg 14-Jun-2002 10:00 134k
10_01_04.trig+1.jpg 14-Jun-2002 10:00 147k
10_01_04.trig-1.jpg 14-Jun-2002 10:00 158k
10_16_05.trig+0.jpg 14-Jun-2002 10:15 100k
10_16_05.trig+1.jpg 14-Jun-2002 10:15 186k
10_16_05.trig-1.jpg 14-Jun-2002 10:15 113k
11_02_41.trig+0.jpg 14-Jun-2002 11:02 96k
11_02_41.trig+1.jpg 14-Jun-2002 11:02 96k
11_02_41.trig-1.jpg 14-Jun-2002 11:02 97k
11_03_34.trig+0.jpg 14-Jun-2002 11:03 97k
11_03_34.trig+1.jpg 14-Jun-2002 11:03 97k
11_03_34.trig-1.jpg 14-Jun-2002 11:03 98k
11_03_46.trig+0.jpg 14-Jun-2002 11:03 98k
11_03_46.trig+1.jpg 14-Jun-2002 11:03 98k
11_03_46.trig-1.jpg 14-Jun-2002 11:03 98k
11_03_56.trig+0.jpg 14-Jun-2002 11:03 100k
11_03_56.trig+1.jpg 14-Jun-2002 11:03 100k
13
D. System Demonstration: On June 14, 2002 the system was demonstrated at Hobe Sound Florida at a city park located ½ mile south of Bridge Road on the west bank of the Intra Coastal Waterway. The top of the stand containing the electronics was placed on a dock extending out about 30meters out over the water. The wave staff projected below the dock and into the approximately 2meters of water at the end of the dock. The system was self-powered and fully autonomous. The demonstration showcased the systems technical achievements and provided verification of the status of the system. It is unfortunate that the laser was not available for the demonstration though it is scheduled for delivery by the last week of June. The manufacturer of the laser, Laseroptronix of Sweden, was having trouble with a supplier of a component meeting specifications and production has been delayed. This impacted the demonstration by only allowing the system software to estimate the boat speed in relative units of pixels/second and not in meters/second though the software is written to accomplish this task. The demonstration began with a viewing of the real time data on the Internet at the Hobe Sound office of Ocean Sensor Systems and concluded with a visit to the installation on the Intra Coastal Waterway. The demonstration was able to show the real time wireless access to the data collected on the Internet and resulted in the collecting and analysis of quality data taken by the camera and wave staff in the urban canal environment the system was designed for. Shown in Figure 4 is an example of just one of many high-resolution images collected during the demonstration. In addition to the high-resolution images, low-resolution images were also collected along with wave, wake and tide information. During the demonstration, high accuracy water level measurements were made and processed in real time to provide information on the ambient background tide and wave conditions as well as the boat induced wake conditions. The measurements were made using the Water Level Sensor sold by Ocean Sensor Systems, Inc. This instrument yields 1mm resolution data at 30Hz of the instantaneous water level. In Figure 5 below, the raw data is shown in the top panel with a segment expanded in the second panel. The derived tide and wave heights are shown in the third and fourth panels respectively. The horizontal axis in the graphs represents time measured in seconds from the beginning of the deployment at 11:04 am. The vertical axis is in meters relative to an arbitrary water level. In the raw data, several observations are possible. The ambient waves were very small given that the measurements were on the west side of a north-south orientated canal and the 5 to 10mph winds out of the west. The slow

14
rise in the level corresponds to the incoming tide as shown in the third graph. A 300 point averaging filter is applied to the raw data yielding the water level without the waves at 10 second intervals or a sample rate of 0.10Hz. Note that a phenomena called seiching is visible in the tide data with a period of about 400 seconds. Seiching is the movement of a large semi-enclosed body of water similar to the movement of water in a bathtub where it sloshes from one side of the bathtub to the other as one mass. The derived peak wave data in the bottom graph is found with a peak detect function operating on the raw data in 300 point segments resulting in a time sample of 10 seconds per sample or 0.10Hz. The first peak at about 1300 seconds is due to the system operator adjusting the wave staff. The second peak is at 1550 seconds is due to a slow moving monohull sailboat and the peak at 1780 seconds is due to the catamaran sailboat shown in the captured image in the previous section. The wake from the catamaran is expanded in the second graph. The wakes are quite small due to the slow speed of the boats and the great distance the measurements were made from the source (~500m).
0 200 400 600 800 1000 1200 1400 1600 1800 20000.66
0.68
0.7
1705 1710 1715 1720 1725 1730 17350.67
0.68
0.69
0.7
0 200 400 600 800 1000 1200 1400 1600 1800 2000
0.66
0.68
0 200 400 600 800 1000 1200 1400 1600 1800 20000
0.01
0.02
0.03
Figure 5. Wave data collected during the system demonstration on June 14, 2002; a) raw wave staff data collected at 30Hz., b) detail segment showing wake of a catamaran sailboat, c) Tide data found by averaging the data in 300 point segments and d) Peak wave height data found by calculating an envelope function for the data in 300 point segments.

15
E. Data Base Development: As part of the system a database is automatically generated. This database may be queried form the server. A sample of what is possible in terms of data base automated quires may be seen by going to a public internet site http://www.wets.net/ A sample of this site is given below. The following quire is for wave height but it could just as well be for any parameter of interest.
Which events exceed a wave height limit?
Online Database Query for Wave Height (RETURNS A LIST)
Enter the start date?
12/20/99--
mm/dd/yy
Enter the stop date?
12/22/99--
mm/dd/yy
Enter start time?
09:00:00--
hh:mm:ss
Enter the stop time?
00:00:00--
hh:mm:ss
Above what limit (inches crest to trough) do you query for events?
8- Enter a
integer between 0 and 40
Select Location:
Ft. Lauderdale
Submit Form Reset Form
Note: This database is a sample from the WETS 99 Special Waterways Project Grant and is only valid between 12/20/99 and 12/27/99

16
Fort Lauderdale Test Site Stored Event:
Date: 12/20/1999 Time: 09:42:52
Hit Back to return to list. Note: This database is being updated in real time using the WETS Expert System Kernel.

17
Section
3 Summary and Future Directions A new tool for Coastal Zone Management The system development is essentially complete and it is anticipated that within the near future the system will be mature enough to be considered a commercial product. The technology implemented focuses on integrated intelligent systems to allow a flexible architecture. This extensible architecture facilitates future development and enhancement through software rather than hardware changes. The portable configuration of the system will also facilitate flexible deployment strategies for optimization by the final user. The research and development to date has uncovered no obstacles that cannot be overcome by implantation of existing commercial technology.
Any technologically based system is never truly “finished” due to the rapid pace of advancement of technology itself. Recommendations and observations from the demonstration include adding a scale bar to the images in order to allow sizing the boat and implementation of a background process to upload data to a land based server. These will be implemented as part of a planned semi-permanent installation at the Nova Southeastern University Oceanographic Center facility located in Dania Beach Florida along the shore of the Intra Coastal Waterway at Port Everglades. This installation will allow further development of the system as well as providing a ground-truthing data set. As system requirements are changed and new hardware becomes available, the installation will provide a location for testing and evaluation before integration into the commercially available product. It is also hoped that the technology developed here can be adapted to other similar purposes where information about our nations waterways and those who use them is valuable. The tool under development herein has clear applications to research, monitoring, enforcement and public education. The authors wish to acknowledge the continued support of the Florida Marine Institute in the development of this work.