Embed Size (px)
Citation preview

AD-AB.a 317 ARMY ENGINEER WATERWAYS EXPERIMENT STATION VICKSBURG--ETC F/S 8/7GEOTECHNICAL PROPERTIES OF OIL SHALE RETORTED BY THE PARAHO AND-ETC(U)NOV 79 F C TOWNSEND, R W PETERSON H0262064
UNCLASSIFIED WES/TR/L-79-22 NL
.uuuuuuuilIumI fnnlflnnnnnnnnnunnnnumfEEE-E--EEElIIIIIIIEIIIIIIlEEllllElhllIE
MEJ
I .LEVEL.TECHNICAL REPORT 66-79-22
GEOTECHNICAL PROPERTIES OF OILasSHALE RETORTED BY THE PARAHO AND
C TOSCO PROCESSESby
( Frank C. Townsend, Richard W. Paterson
Geotechnicul LaboratoryU. S. Army Engineer Waterways Expovnmen Station
P.O0. Box 631, Vicksburg, Mis 98
November 1979SFinal Report 2 6198
Approved far Pubc Manhs; M~distmut Un".Mu
CA.
Spokane Mining Research CenterSpokane, Washington 99207
under Contract No. H026206M
CM2 803 241 u7
Destroy this report when no longer needed. Do not returnit to the originator.
The findings in this report are not to be construed as an officialDeportment of the Army position unless so designated.
by other authorized documents.
The contents of this report are not to be used foradvertising, publication, or promotional purposes.Citation of trade names does not constitute anofficial endorsement or approval of the use of
such commercial products.
I
....... , z J.

UnQJ&Mnsf iedSECURITY CLASSIFICATION OF THIS PAGE (39m, Von. Xntere*
READ INSRUCTIONfSREPORT DOCUMENTATION PAGE BEFORE COMPLEMG4 FOR1. REPOR NU0192. GOVT ACCESSION NO. 3. RECIPIENT'S CATALOG NUMBER
Technical Report GL-79-22 V
* ,.'~ T S.TYPE OF REPORT & PERIOD COVERED
_QI SHL ETRE Final repot /4 /THE PABAHO AND TOSCOPROCESSES. ~
7.__________________8. COMTRAC Tk RANT NUM111E41e)
Frank C. Townsend Contra H226Richard .Peterson
0.-PERUNES RGANIZATIONU1AME AND ADDRESS IC. PROGRAM ELEMENT. PROJECT. TASK
11. CONTROLLING OFFICE NAME AND ADDRESS
Spokne. ah 99207 272_____________
4.MNToOINGAGENCY NANE 0 AODRESS~it 0dilfenm from Contfrolling Office) IS. SECURITY CLASS. (of this report)
UnclassifiedIS.DECL ASS4 FICATION7 DOWNGRADING7 SCHEDULE
16. DISTRIBUTION STATEMENT (.t Ali e)
Approved for public release; distribution unlimited.
III. SUPPLEMENTARY NOTES
III. KEY WORDS (Coneinui* on reverse side If necessary mnd idenlity by block rnmibr)
Compaction Oil shalesCompositions Shear strengthConsolidation
\ Gotechnical engineering
211 _TRACT icemisma si reerse sdiv w '.eeum dui bry block umber)
Waste disposal schemes using spent shale in embankments require athorough knowledge of its geotechnical engineering properties for environ-mentally safe disposal. In this context, the objective of this laboratoryinvestigation was to determine the physical properties, geotechnical proper-ties, and composition of spent oil shale retorted by the PARAHO and TOSCOprocesses. Physical properties consisted of mechanical analyses, Atterberg
(Continue
DD r', 3 103 tWfono r 'Nov s is OnsoLaTe UnclassifiedSECURSTY CLASSIFICATION OF THIS PAGE (amn Dees Eant eyd)
L~L~/~ ~W
711

UnclassifiedSECURTY CLASSIFICATION OP THIS PAGE(Whan Doae Rterf
0. ABSTRACT (Continued)
limits, and specific gravity determinations. Geotechnical engineering prop-erties were determined by compaction, maximum-minimum density, unconfined com-pression, triaxial compression, permeability, direct shear, Ko , cyclic tri-axial, resonant column, and Los Angeles Abrasion tests. Petrographic, chem-ical, and scanning electron microscopy analyses were used to determine compo-sitional features ' Unprocessed shale is hard and durable and more properlydescribed as a carbnate rock instead of shale. PARAHO is classified as aGP, while TOSCO classifies as an SM. PARAHO requires no moisture for compac-tion to maximum densities; however, TOSCO does. Retorting causes a loss indurability but creates self-cementing characteristics, which for PARAHO a 3-to 8-fold strength increase was observed, while for TOSCO the increase was1.5 to 3 folds. The shear strength, compressibility, and dynamic propertiesof compacted PARAHO are comparable to those for sandy gravels. CompactedPARAHO is semipervious, while compacted TOSCO can be semipervious toimpermeable.
UnclassifiedSECUNITY CLASSIFICATION OF THIS PAGE('Wh Data Entered)
VX
FOREWORD
This report was prepared by the U. S. Army Engineer Waterways ExperimentStation (WES), VicksbUrg, Mississippi, under U. S. Bureau of Hines ContractNo. H0262064. The contract was initiated under the Advancing Oil Shale MiningTechnology program. It was administered under the technical direction of theSpokane Mining Research Center; Mr. Roger A. Bloomfield was the TechnicalProject Officer. Mr. David J. Askins was the contract administrator forthe Bureau of Hines. This report is a summary of the work recently completedas a part of this contract during the period October 1976 to April 1979.This report was submitted by the authors on' 1-% y---97g7
Dr. F. C. Townsend, Research Group, Soil Mechanics Division (SMD), Geo-technical Laboratory (GL), was project leader during the study and preparedthis report. Mr. R. W. Peterson, Soils Research Center, SMD, supervised andperformed the majority of the strength testing program, while Mr. G. P. Hale,
SMD, supervised other aspects. The assistance of Messrs. Paul Register, JacobMajor, and Patrick McCaffrey, GL, WES, and Mr. Mel Cohen of the Corps ofEngineers South Pacific Division Laboratories are recognized. Mr. Alan Buck,Structures Laboratory, and Dr. D. M. Patrick, GL, performed and supervised,respectively, the chemical and compositional testing. The study was con-ducted under the general supervision of Mr. C. L. McAnear, Chief, SMD, andMessrs. J. P. Sale and R. G. Ahlvin, Chief and Assistant Chief, respectively,GL.
COL John L. Cannon, CE, and COL Nelson P. Conover, CE, were Directors ofWES during the investigation and preparation of this report. Mr. F. R. Brownwas Technical Director.
Accession For
KTIS GLa&I
DDC TABUnannounced
JustificAtion
._-ic ""'._odes
A.al and/or
Dist special
o1

CONTENTSPage
LIST OF FIGURES ............. ..................
LIST OF TABLES .. ............................. 10
CHAPTER 1: SUMMARY. ............................ 11
Problem Statement. .......................... 11Scope of Work. ........................... 11Pertinent Results and Conclusions ................... 11Recommendations. .......................... 13
CHAPTER 2: INTRODUCTION .. ........................ 14
Objectives .. ............................. 14Scope. ............................... 15
Material processing. ...................... 15Physical properties ............. .......... 15Engineering properties .. .................... 15Composition and durability characteristics. ............ 18
CHAPTER 3: MATERIALS AND TESTING PROGRAM. ................ 19
Materials. .............................. 19PARAHO .. ............................ 19TOSCO. ............................. 19Raw shale. ........................... 19
Specimen Preparation .. ....................... 19Tests and Test Methods .. ...................... 22
Physical properties. ...................... 22Engineering properties .. .................... 22Compositional and durability characteristics. .......... 33
CHAPTER 4: PRESENTATION AND DISCUSSION OF RESULTS. .............34
Physical Properties. ........................ 34Gradation. ........................... 34Material processing. ...................... 34Atterberg limits and specific gravity ...... ...........36
Engineering Properties .. ...................... 38Compaction characteristics and maximum-minimum density ... 38Consolidation. ......................... 51Unconfined compression .. .................... 60Triaxial compression test. ................... 69Permeability .. ......................... 82Direct shear tests .. ...................... 86Repeated direct shear tests. .................. 93K tests. ........................... 930
Cyclic triaxial tests ............ ......... 122Dynamic properties tests. ........... ........ 122Drop height tests ............ ........... 134Los Angeles Abrasion tests. .............. .... 134
3

CONTENTS (Concluded)
Page
Composition and Durability Properties ... ............. ... 134Petrographic analyses ...... ................... ... 134Chemical analyses ....... ..................... ... 138Test results of petrographic and chemical analyses ..... .. 138
CHAPTER 5: CONCLUSIONS AND RECOMMENDATIONS ... ............. ... 152
Conclusions ......... .......................... ... 152Physical properties ...... .................... ... 152Engineering properties ...... ................... ... 152Compositional properties ...... .................. ... 154
Recommendations ........ ........................ ... 154
REFERENCES ............ .............................. ... 155
APPENDIX A: A REVIEW OF THE PHYSICAL AND ENGINEERING PROPERTIESOF RAW AND RETORTED OIL SHALES FROM THE GREENRIVER FORMATION ....... ..................... ... 159
APPENDIX B: RESULTS OF BIN AND HOPPER TESTS AND RECOMMENDATIONSFOR RAW OIL SHALE STORAGE BIN .... .............. ... 221
APPENDIX C: SETTLEMENT-LOG TIME CONSOLIDATION-REBOUND CURVESFOR PARAHO AND TOSCO ...... .................. . 259
APPENDIX D: CONVERSION FACTORS, U. S. CUSTOMARY TO METRIC (SI)UNITS OF MEASUREMENT ...... .................. . 267
APPENDIX E: NOTATION ......... ........................... 269
4

LIST OF FIGURES
Figure Page
1 Flow diagram of testing program ... ............... ... 16
2 The PARAHO vertical retort ...... .................. ... 20
3 TOSCO process ........ ........................ ... 21
4 Howard mechanical compactor with 12-in.- (30.5-cm-) diam moldand load cell harness for weighing .... .............. ... 24
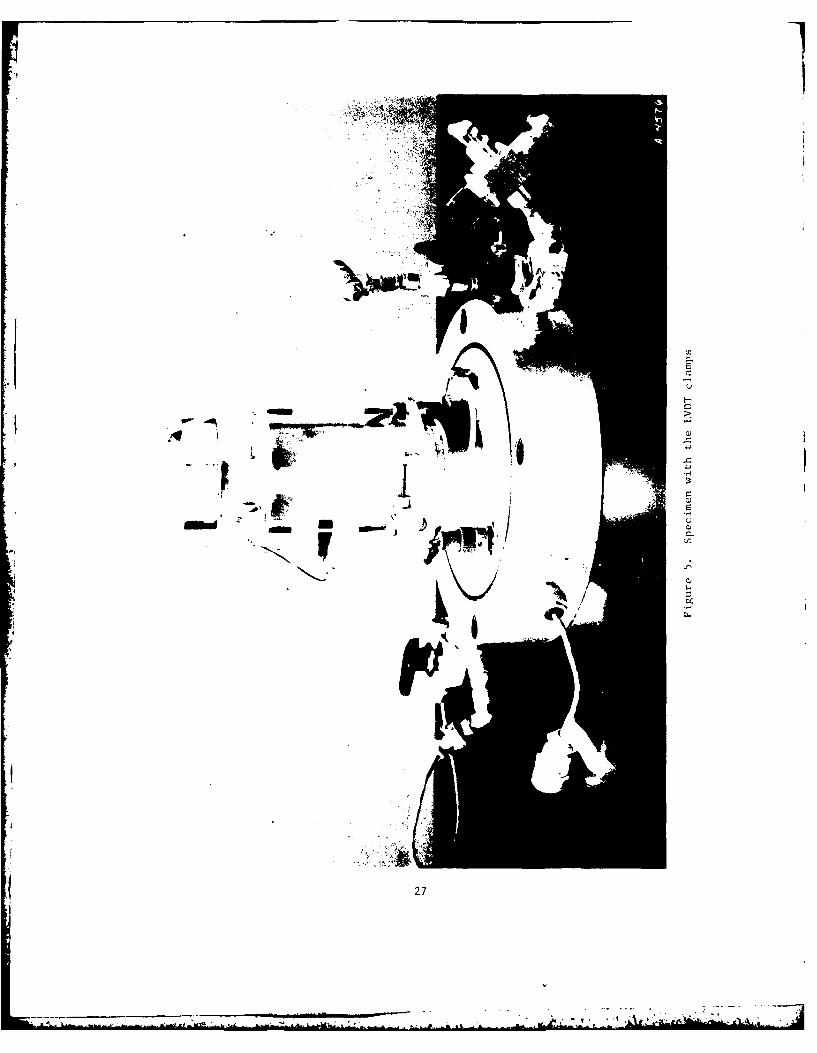
5 Specimen with the LVDT clamps .... ................. .... 27
6 Schematic drawing of the WES 2- by 2- by 1-ft (0.6- by 0.6- by0.3-m) direct shear apparatus .... ................ . 28
7 WES automated direct shear machine ... .............. ... 30
8 Drnevich LONG-TOR resonant column apparatus ......... ... 32
9 Comparison of gradation analyses for PARAHO retorted oilshale .......... ............................ ... 35
10 Summary of gradation analyses for TOSCO . ........... ... 36
11 Water content-density relationship for 12-in.- (30.5-cm-) diamcompaction tests on PARAHO retorted oil shale ........ . 39
12 Water content-density relationship for 6-in.- (15.2-cm-) diamcompaction tests on modeled PARAHO retorted oil shale . . . . 40
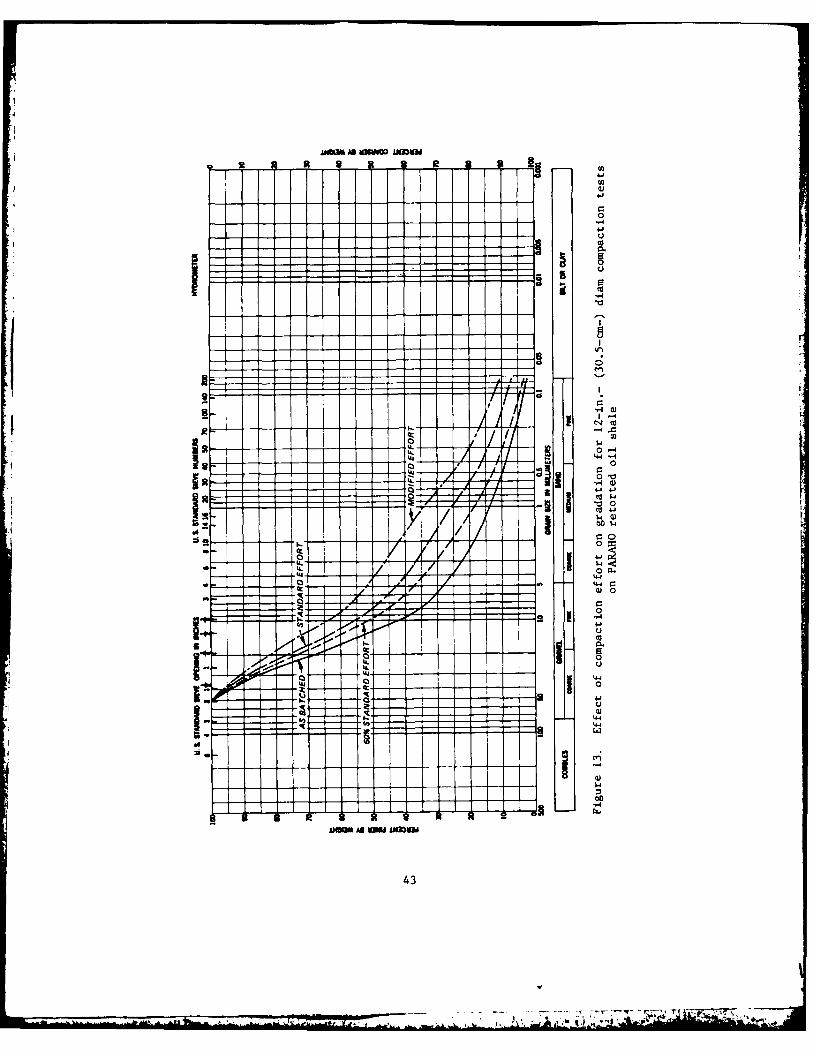
13 Effect of compaction effort on gradation for 12-in.-(30.5-cm-) diam compaction tests on PARAHO retortedoil shale ......... .......................... ... 43
14 Effect of compaction effort on gradation for 6-in.-(15.2-cm-) diam compaction tests on PARAHO retortedoil shale ......... .......................... ... 44
15 Effects of compaction effort on gradation for compactiontests by WCC (1976) on minus 1-1/2-in. (38.1-mm)PARAHO retorted oil shale ..... .................. ... 47
16 Effects of compaction effort on gradation for compactiontests by WCC (1976) on minus 3/4-in. (19-mm)PARAHO retorted oil shale ..... .................. ... 48
17 Compaction characteristics of TOSCO for 60 percentof standard, standard, and modified efforts ......... ... 52
18 Effects of compaction efforts on gradation for compactiontests on TOSCO retorted oil shale ... .............. ... 53
19 Consolidation characteristics of 12-in.- (30.5-cm-) diamconsolidation tests on PARAHO retorted oil shale ....... .. 54
5

LIST OF FIGURES (Continued)
Figure Page
20 Consolidation characteristics of 12-in.- (30.5-cm-) diamconsolidation tests and 6-in.- (15-cm-) diam triaxialspecimens compacted to 60 percent of standard, standard,and modified compaction efforts on TOSCO retorted oilshale .......... ............................ ... 55
21 Comparison of the compressibility of compacted PARAHOand TOSCO with rockfill ...... ................... ... 58
22 Effect of consolidation pressure to 800 psi (5.52 MPa)on gradation of PARAHO retorted oil shale .. .......... .. 59
23 Effect of consolidation pressure to 800 psi (5.52 MPa)on gradation of TOSCO retorted oil shale . .......... .. 60
24 Effect of curing time on th, unconfined compressivestrength for compacted PARAHO ..... ................ .. 62
25 Effect of curing time on the unconfined compressivestrength for compacted TOSCO ..... ................. ... 64
26 Comparison of unconfined compressive strengths forPARAHO and TOSCO retorted oil shales ... ............. ... 66
27 Effective stress envelope for PARAHO compacted to60 percent of standard effort density ... ............ .. 73
28 Total and effective stress envelopes for PARAHOcompacted to standard effort density ... ............. ... 74
29 Effective stress envelope for PARAHO compactedto modified effort density ...... .................. ... 75
30 Total and effective stress envelopes for modeled PARAHOcompacted to standard effort density ... ............. ... 76
31 Total and effective stress envelopes for PARAHO finescompacted to standard effort density ... ............. ... 77
32 Total and effective stress envelopes for TOSCO compacted
to 60 percent of standard effort density .. ........... ... 78
33 Total and effective stress envelopes for TOSCO compacted
to standard effort density ...... .................. ... 79
34 Total and effective stress envelopes for TOSCO compactedto modified effort density ...... .................. ... 80
35 Normal stress-volumetric strain relationships for S tri-axial compression tests on 9-in.- (22.9-cm-) diam specimensof PARAHO ......... .......................... ... 83
36 Permeability-void ratio relationships for compacted PARAHOretorted oil shale .......... ........................ .84
6
- t
LIST OF FIGURES (Continued)
Figure Page
37 Permeability-void ratio relationships for compacted TOSCO
retorted oil shale ....... ..................... .. 85
38 Failure envelopes for direct shear tests on PARAHO retortedoil shale .......... .......................... .. 87
39 Comparison of friction angles for coarse and fine fractionsof PARAHO retorted oil shale ..... ................. ... 89
40 Failure envelopes for direct shear tests on TOSCO retortedoil shale .......... .......................... .. 90
41 Friction envelopes for interface direct shear tests on rawoil shale ... ....... .......................... .. 92
42 Friction envelopes for interface direct shear tests onPARAHO retorted oil shale ...... .................. .. 92
43 Residual strength envelopes for repeated direct shear tests
on modeled PARAHO and TOSCO retorted oil shales ....... .. 94
44 Stress-strain relationships for 9-in.- (22.9-cm-) diam K
tests on PARAHO compacted to standard effort density, 0
0-month cure, test specimen K-P-9-S-0-1. ..... ........... 99
45 Stress-strain relationships for 9-in.- (22.9-cm-) diam Ktests on PARAHO compacted to standard effort density, 0
0-month cure, test specimen K-P-9-S-0-2 .. ........... .. 100
46 Stress-strain relationships for 9-in.- (22.9-cm-) diam Ktests on PARAHO compacted to standard effort density, 0
13-month cure, test specimen K-P-9-S-12-2 .. .......... .. 101
47 Stress-strain relationships for 9-in.- (22.9-cm-) diam Ktests on PARAHO compacted to standard effort density, 0
13-month cure, test specimen K-P-9-S-12-3 .. .......... .. 102
48 Stress-strain relationships for 6-in.- (15.2-cm-) diam Ktests on modeled PARAHO compacted to 60 percent of standardeffort density, test specimen PR-P-6-L-14.5-2 . ........ .. 103
49 Stress-strain relationships for 6-in.- (15.2-cm-) diam Ktests on modeled PARAHO compacted to modified effort 0
density, test specimen PR-P-6-M-14.5-1 ... ............ .. 104
50 Stress-strain relationships for 6-in.- (15.2-cm-) diam Ktests on TOSCO compacted to standard effort density, 0
0-month cure, test specimen K-T-6-S-0-3 .. ........... .. 105
51 Stress-strain relationships for 6-in.- (15.2-cm-) diam Ktest; on TOSCO compacted to standard effort density,0-month cure, test specimen K-T-6-S-0-4 .. ........... .. 106
52 Stress-strain relationships for 6-in.- (15.2-cm-) diam Ktests on TOSCO compacted to standard effort density, 0
11-month cure, test specimen K-T-6-S-9-1 .. ........... ... 107
7
* .-- ---~.--~- -- 4

LIST OF FIGURES (Continued)
Figure L53 Stress-strain relationships for 6-in.- (15.2-cm-) diam K 0
tests on TOSCO compacted to standard effort density,11-month cure, test specimen K-T-6-S-9-2 .. ........... ... 108
54 Stress-strain relationships for 6-in.- (15.2-cm-) diam Ktests on TOSCO compacted to standard effort density, 0
19-month cure, test specimen K-T-6-S-18-1 .. .......... .. 109
55 Stress-strain relationships for 6-in.- (15.2-cm-) diam Ktests on TOSCO compacted to standard effort density,19-month cure, test specimen K-T-6-S-18-2 .. .......... .. 110
56 Relationship between axial stress and overconsolidationratio on K values for PARAHO compacted to standard effort
0density, 0-month cure, test specimen K-P-9-S-0-1 . ....... . 112
57 Relationship between axial stress and overconsolidationratio on K values for PARAHO compacted to standard effort0
density, 0-month cure, test specimen K-P-9-S-0-2 ....... ... 113
58 Relationship between axial stress and overconsolidation
ratio on K values for PARAHO compacted to standard effortdensity, 13-month cure, test specimen K-P-9-S-12-2 ..... 114
59 Relationship between axial stress and overconsolidationratio on K values for PARAHO compacted to standard effort
0density, 13-month cure, test specimen K-P-9-S-12-3 115
60 Relationship between axial stress and overconsolidationratio on K values for TOSCO compacted to standard effort
0density, 0-month cure, test specimen K-T-6-S-0-3 ....... ... 116
61 Relationship between axial stress and overconsolidation
ratio on K values for TOSCO compacted to standard
effort density, 0-month cure, test specimen K-T-6-S-0-4 117
62 Relationship between axial stress and overconsolidationratio on K values for TOSCO compacted to standard effort0
density, 11-month cure, test specimen K-T-6-S-9-1 ...... .. 118
63 Relationship between axial stress and overconsolidationratio on K values for TOSCO compacted to standard effort
density, 11-month cure, test specimen K-T-6-S-9-2 ...... .. 119
64 Relationship between axial stress and overconsolidationratio on K values for TOSCO compacted to standard effort
density, 19-month cure, test specimen K-T-6-S-18-1 ...... .. 120
65 Relationship between axial stress and overconsolidationratio on K values for TOSCO compacted to standard effort
density, 19-month cure, test specimen K-T-6-S-18-2 ...... .. 121
8

LIST OF FIGURES (Concluded)
Figure Pa"e
66 Cyclic triaxial response of compacted PARAHO retortedoil shale ......... .......................... ... 123
67 Dynamic Young's moduli values for PARAHO compacted to60 percent of standard effort density ... ............ .. 128
68 Dynamic Young's moduli values for PARAHO compacted tomodified effort density ...... ................... ... 129
69 Dynamic shear moduli values for PARAHO compacted to60 percent of standard effort density ... ............ .. 130
70 Dynamic shear moduli values for PARAHO compacted tomodified effort density ...... ................... .. 131
71 Comparison of dynamic shear moduli from cyclic triaxialtests for PARAHO and gravels ..... ................. ... 132
72 Damping ratio values for PARAHO compacted to 60 percent ofstandard and modified effort densities ... ............ .. 133
73 Effect of drop height on dry density for PARAHO and TOSCOretorted oil shales .......... ..................... 135
74 Scanning electron micrographs of a dense particle of PARAHOretorted oil shale from a sample of 3/4-in. (19-mm)fragments ......... .......................... ... 141
75 Scanning electron micrographs of a vesicular particleof PARAHO retorted shale from a sample of 3/4-in. (19-mm)
fragments ......... .......................... ... 143
76 Scanning electron micrographs of unconfined compressiontest specimen UC-M-28-18B of PARAHO retorted oil shale . . . . 145
77 Scanning electron micrograph of analcime crystalsfrom a dense particle of PARAHO retorted shale from asample of 3/4-in. (19-mm) fragments at 770X . ......... .. 147
LIST OF TABLES
Table Page
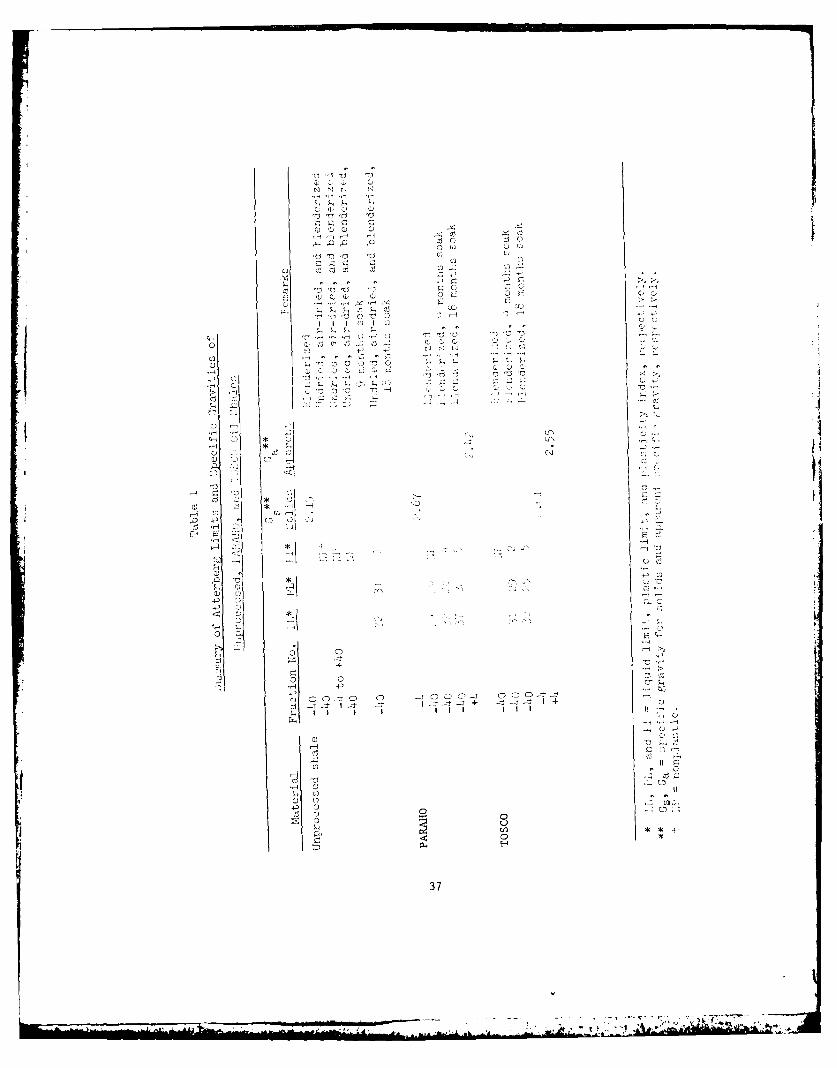
1 Summary of Atterberg Limits and Specific Gravities ofUnprocessed, PARAHO, and TOSCO Oil Shales .... .......... 37
2 Summary of Compaction Test Results on PARAHO Oil Shale . . .. 41
3 Breakage Factors Due to Compaction of PARAHO Material . . .. 45
4 Breakage Factors Due to Compaction of PARAHO MaterialProcessed by Direct Heating ..... ................. ... 49
5 Comparison of Compaction Results on PARAHO ............ ... 50
6 Consolidation Parameters for PARAHO and TOSCO Retorted OilShales at Maximum Applied Stress (800 psi) ............ ... 56
7 Breakage Factors Due to Compaction and Consolidation ofPARAHO and TOSCO Materials ..... .................. ... 61
8 Summary of Unconfined Test Results on PARAHO Oil Shale . . . . 63
9 Summary of Unconfined Test Results on TOSCO Oil Shale . . . . 65
10 Summary of Consolidated-Drained (S) and -Undrained (R)Triaxial Compression Tests on PARAHO Material . ........ . 70
11 Summary of Consolidated-Undrained Triaxial CompressionTests with Pore Pressure Measurements on Modeled PARAHOand PARAHO Fines ....... ....................... ... 71
12 Summary of Consolidated-Undrained Triaxial CompressionTests with Pore Pressure Measurements on TOSCO ........ ... 72
13 Summary of Direct Shear Tests on PARAHO at Standard EffortDensity ............. ........................... 88
14 Summary of K Tests on PARAHO and TOSCO Retorted OilO
Shales ........... ............................ ... 95
15 Summary of Cyclic Triaxial Tests on 6-in.-diam Specimens ofModeled PARAHO ......... ........................ ... 124
16 Summary of Resonant Column Tests on PARAHO . ......... . 126
17 Summary of Cyclic Triaxial Properties Tests on PARAHO . . .. 127
18 Summary of Drop Height Tests on PARAHO and TOSCOOil Shales .......... .......................... ... 136
19 Summary of Los Angeles Abrasion Test Results on PARAHO andRaw Oil Shales ......... ........................ ... 137
20 Chemical Composition of Unprocessed and PARAHO Oil ShaleDried to Constant Weight at 105*C Before Analysis ...... . 149
21 Summary of Franklin Slake Durability Tests on Raw and PARAHOOil Shales .......... .......................... ... 150
10
* 4 -
CHAPTER 1: SUMMARY
Problem Statement
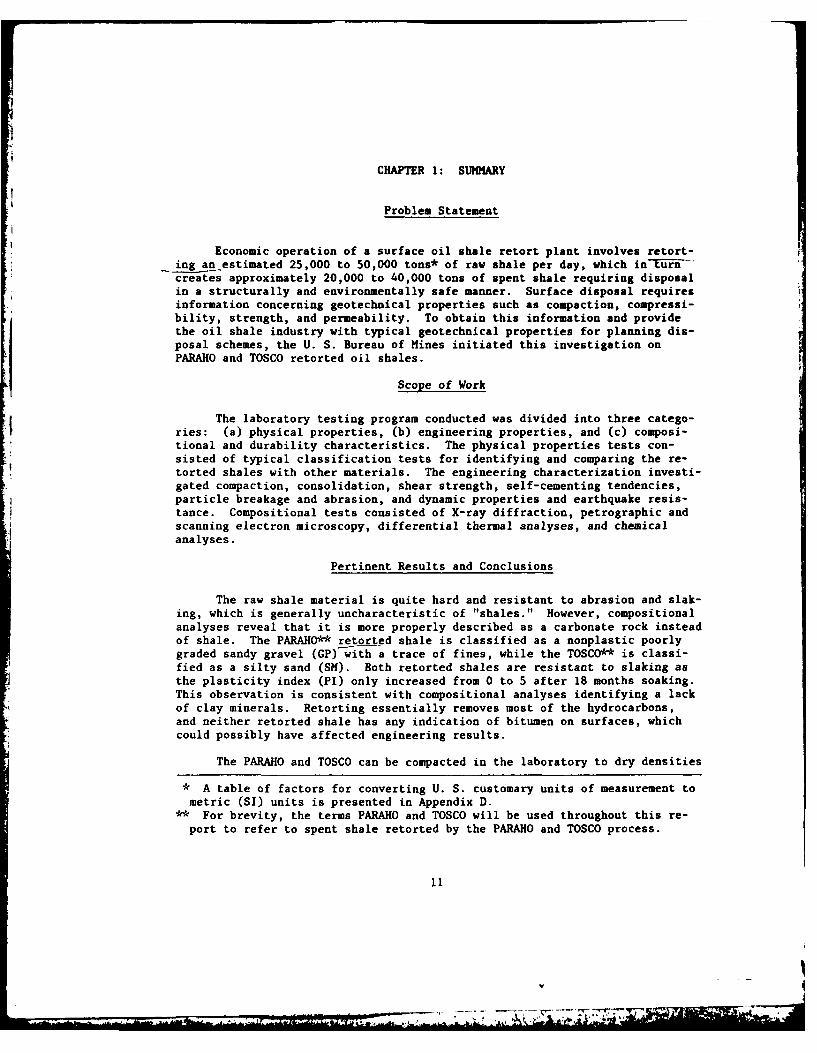
Economic operation of a surface oil shale retort plant involves retort-ing an estimated 25,000 to 50,000 tons* of raw shale per day, which inVu--rcreates approximately 20,000 to 40,000 tons of spent shale requiring disposalin a structurally and environmentally safe manner. Surface disposal requiresinformation concerning geotechnical properties such as compaction, compressi-bility, strength, and permeability. To obtain this information and providethe oil shale industry with typical geotechnical properties for planning dis-posal schemes, the U. S. Bureau of Mines initiated this investigation onPARAHO and TOSCO retorted oil shales.
Scope of Work
The laboratory testing program conducted was divided into three catego-ries: (a) physical properties, (b) engineering properties, and (c) composi-tional and durability characteristics. The physical properties tests con-sisted of typical classification tests for identifying and comparing the re-torted shales with other materials. The engineering characterization investi-gated compaction, consolidation, shear strength, self-cementing tendencies,particle breakage and abrasion, and dynamic properties and earthquake resis-tance. Compositional tests consisted of X-ray diffraction, petrographic andscanning electron microscopy, differential thermal analyses, and chemicalanalyses.
Pertinent Results and Conclusions
The raw shale material is quite hard and resistant to abrasion and slak-ing, which is generally uncharacteristic of "shales." However, compositionalanalyses reveal that it is more properly described as a carbonate rock insteadof shale. The PARAHO** retorted shale is classified as a nonplastic poorlygraded sandy gravel (GP)-with a trace of fines, while the TOSCO** is classi-fied as a silty sand (SM). Both retorted shales are resistant to slaking asthe plasticity index (PI) only increased from 0 to 5 after 18 months soaking.This observation is consistent with compositional analyses identifying a lackof clay minerals. Retorting essentially removes most of the hydrocarbons,and neither retorted shale has any indication of bitumen on surfaces, whichcould possibly have affected engineering results.
The PARAHO and TOSCO can be compacted in the laboratory to dry densities
* A table of factors for converting U. S. customary units of measurement tometric (SI) units is presented in Appendix D.
* For brevity, the terms PARAHO and TOSCO will be used throughout this re-port to refer to spent shale retorted by the PARAHO and TOSCO process.
11
La
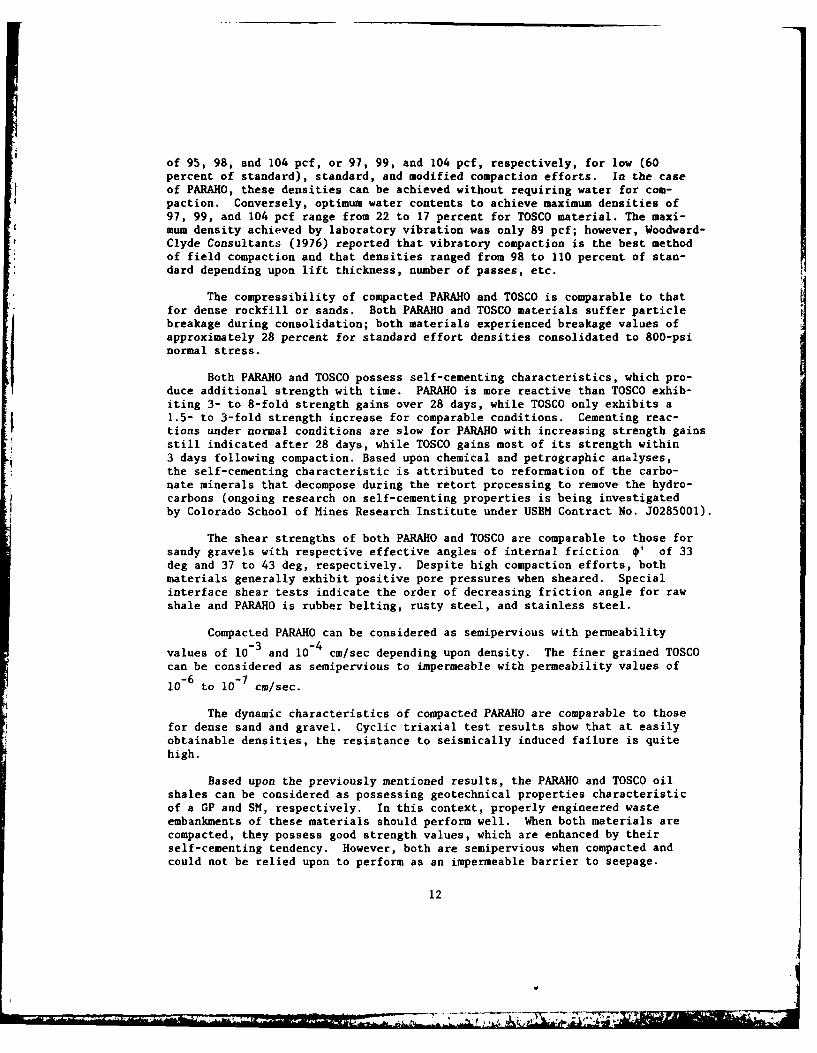
of 95, 98, and 104 pcf, or 97, 99, and 104 pcf, respectively, for low (60percent of standard), standard, and modified compaction efforts. In the caseof PARAHO, these densities can be achieved without requiring water for com-paction. Conversely, optimum water contents to achieve maximum densities of97, 99, and 104 pcf range from 22 to 17 percent for TOSCO material. The maxi-mum density achieved by laboratory vibration was only 89 pcf; however, Woodward-Clyde Consultants (1976) reported that vibratory compaction is the best methodof field compaction and that densities ranged from 98 to 110 percent of stan-dard depending upon lift thickness, number of passes, etc.
The compressibility of compacted PARAHO and TOSCO is comparable to thatfor dense rockfill or sands. Both PARAHO and TOSCO materials suffer particlebreakage during consolidation; both materials experienced breakage values ofapproximately 28 percent for standard effort densities consolidated to 800-psinormal stress.
Both PARAHO and TOSCO possess self-cementing characteristics, which pro-duce additional strength with time. PARAHO is more reactive than TOSCO exhib-iting 3- to 8-fold strength gains over 28 days, while TOSCO only exhibits a1.5- to 3-fold strength increase for comparable conditions. Cementing reac-tions under normal conditions are slow for PARAHO with increasing strength gainsstill indicated after 28 days, while TOSCO gains most of its strength within3 days following compaction. Based upon chemical and petrographic analyses,the self-cementing characteristic is attributed to reformation of the carbo-nate minerals that decompose during the retort processing to remove the hydro-carbons (ongoing research on self-cementing properties is being investigatedby Colorado School of Mines Research Institute under USBM Contract No. J0285001).
The shear strengths of both PARAHO and TOSCO are comparable to those forsandy gravels with respective effective angles of internal friction 0' of 33deg and 37 to 43 deg, respectively. Despite high compaction efforts, bothmaterials generally exhibit positive pore pressures when sheared. Specialinterface shear tests indicate the order of decreasing friction angle for rawshale and PARAHO is rubber belting, rusty steel, and stainless steel.
Compacted PARAHO can be considered as semipervious with permeability
values of 10-3 and 10-4 cm/sec depending upon density. The finer grained TOSCOcan be considered as semipervious to impermeable with permeability values of
10-6 to 10-7 cm/sec.
The dynamic characteristics of compacted PARAHO are comparable to thosefor dense sand and gravel. Cyclic triaxial test results show that at easilyobtainable densities, the resistance to seismically induced failure is quitehigh.
Based upon the previously mentioned results, the PARAHO and TOSCO oilshales can be considered as possessing geotechnical properties characteristicof a GP and SM, respectively. In this context, properly engineered wasteembankments of these materials should perform well. When both materials arecompacted, they possess good strength values, which are enhanced by theirself-cementing tendency. However, both are semipervious when compacted andcould not be relied upon to perform as an impermeable barrier to seepage.
12
LV

Recommendations
Analytical studies investigating typical embankment geometriesfor disposing spent shale should be conducted utilizing the propertiesof PARAHO and TOSCO determined in this investigation. Effects of inter-nal drainage, seepage forces, and seismic resistance should be included.Performance and design predictions could subsequently be verified bygeotechnical centrifugal models.
13
' 'I

CHAPTER 2: INTRODUCTION.4
The current energy shortage and rapidly diminishing supply of petroleumhave created an expanding search for alternative energy sources. These factorshave spurred interests in developing oil shale as an energy source. Specif-ically, oil shale is a fine-grained, usually dark-colored sedimentary rockcontaining kerogen, a complex organic matter that decomposes upon heating toyield oil. Processing raw shale by heating involves use of surface retorts,in situ retorting, or combinations of both. However, to be commerciallyfeasible and to operate economically, a surface operated oil shale retortplant should process an estimated 25,000 to 50,000 tons of raw shale per day.Most of the currently used surface retort processes produce retorted shale(spent shale, ash, etc.) for disposal at about 80 to 85 percent of total rawweight, which corresponds to approximately 40,000 tons of spent shale per day
for a 50,000-ton per day plant or about 30,000 yd 3/day. As an alternative tosurface retorting, in situ retorting would obviously reduce the volume ofshale requiring surface disposal. However, since 20 percent by volume of theraw shale would be removed during in situ rubblization and subsequentlyprocessed in surface retorts, a sizeable volume of retorted shale still wouldrequire surface disposal.
Hence, one of the major problem areas of a commercial oil shale opera-tion is the efficient disposal of the spent shale in a structurally and en-vironmentally safe manner. Principal options available for the disposal ofretorted oil shale from surface retorts are: (a) filling deep narrow canyonsof the mine area with the spent shale, or (b) backfilling the mine cavitieswith spent shale as the raw shale is removed. Nevertheless, since the shaleoccupies about 20 percent greater volume after retorting, some of the mate-rial will have to be disposed in surface impoundments even if the main sch2emeis (b). In this context and in view of increasingly more rigid environmentalrestrictions, a thorough working knowledge of the geotechnical properties isessential. One of the first major studies in this area was "Disposal ofRetorted Oil Shale--PARAHO Oil Shale Project" by Woodward-Clyde Consultants(WCC) (1976), which was sponsored by the U. S. Bureau of Mines.
Objectives
The objectives of this study were divided into two tasks: (a) a lit-erature search and (b) material testing. The literature search was restrictedto the Green River formation of oil shale in the tri-state area of Colorado(Piceance Basin), Utah (Uinta Basin), and Wyoming (Washakic and Green RiverBasins) and limited to physical and geotechnical properties. The purpose ofthe literature review was to provide a data base for comparisons with resultsobtained in task (b) and is documented by Snethen, et al. (1978) as U. S. ArmyEngineer Waterways Experiment Station (WES) Miscellaneous Paper S-78-3, "AReview of the Physical and Engineering Properties of Raw and Retorted OilShales from the Green River Formation" (Appendix A). The material testing wasdesigned to furnish a complete characterization of the physical, geotechnical,and compositional properties of two retorted oil shales, PARAHO and TOSCO, foruse in developing disposal schemes.
14
.~3 i.3',.

Scope
The testing program schematically diagrammed in Figure 1 is dividedinto four categories: (a) material processing, (b) physical properties, (c)engineering properties, and (d) composition and durability characteristics.The testing program was as follows:
Material processingThe PARAHO, TOSCO, and raw shale were received at the WES in 55-gal
drums, from which subsamples were taken from randomly selected drums. Grada-tion analyses were performed on these subsamples to determine representativegradations and variability of the materials. Processing consisted of separat-ing the material into various sieve fractions to facilitate reconstitution ofuniform test specimens.
Physical propertiesPhysical property tests consisted of gradation analyses, Atterberg
limits, and specific gravity.
a. Gradation analyses were performed to ascertain representa-tive gradation and variability of the materials.
b. Atterberg limits were used to evaluate plasticity of PARAHOand TOSCO materials following three disaggregation procedures:(1) standard test on minus No. 40 material, (2) blenderizedminus No. 40 material, and (3) material crushed to minus No. 40sieve and subsequently blenderized. Plasticity of the raw shalewas evaluated by the Corps of Engineers (CE) undried, air-dried,and blenderized methods used for shales. Plasticity changes dueto inundation were evaluated after 9 and 18 months of inundation.
c. Specific gravity tests were performed on plus No. 4 and minus No. 4fractions of retorted shale and the plus No. 4 fraction of raw shale.
Engineering propertiesEngineering properties testing formed the bulk of the material testing
program and was designed to determine the compaction, consolidation, shearstrength, and permeability characteristics of compacted retorted shale undera variety of conditions.
a. Compaction tests were performed on PARAHO, TOSCO, and modeled PARAHOusing three compaction efforts: (1) 60 percent of standard, (2)standard, and (3) modified. The PARAHO material was compacted in a12-in.- (30.5-cm-) diam mold, while modeled PARAHO and TOSCO materialswere compacted in a conventional 6-in.- (15.2-cm-) diam mold. Post-compaction gradation tests were performed to determine the extentof particle breakage during compaction.
b. Maximum-minimum density determinations were made on PARAHOand modeled PARAHO materials using an 11.0-in.- (28.2-cm-) diammold and vibrating table.
15

-= 0
400Z[ Z
SM -d
a. 0.= 00fMa
0 v:- -CU ~ 0 0u
0 4
00R 0050
U~~~C w _ _ __ _ _ _
M.0~
~SM 0
.C a w100
05 L
-g y
1; 16

c. Consolidation tests were conducted using 12-in.- (30.5-cm-) diamfloating ring consolidometer specimens of PARAHO and TOSCO materialscompacted to densities comparable to 60 percent of standard, standard,and modified compaction efforts. Maximum vertical stress appliedwas 800 psi (5.5 MPa), and postconsolidation gradations were deter-mined to evaluate the effects of particle breakage duringconsolidation.
d. Unconfined compression tests were conducted on 6-in.- (15.2-cm-) diamspecimens of modeled PARAHO and TOSCO materials compacted to densi-ties comparable to 60 percent of standard, standard, and modifiedcompaction efforts. Specimens were cured 0, 3, 7, 14, and 28 daysto evaluate self-cementing tendencies. In addition, a mixture of75 percent PARAHO plus 25 percent TOSCO compacted to a density cor-responding to standard effort was tested after curing times of 0and 28 days.
e. Consolidated-undrained R* triaxial compression tests (with porepressure measurements) or consolidated-drained S triaxial com-pression tests were performed on 9- and 6-in.- (22.9- and 15.2-cm-)diam specimens of PARAHO, modeled PARAHO, and TOSCO materials com-pacted to densities equivalent to 60 percent of standard, standard,and modified efforts. R tests were also performed on specimens ofPARAHO fines, compacted to a density comparable to standard effort.
f. Permeability determinations were made on triaxial specimens (see e)after back-pressure saturation and consolidation, but prior toshearing.
&. Direct shear tests composed of two series of large-scale tests (2by 2 by 1 ft (0.6 by 0.6 by 0.3 m)) performed on PARAHO compacted toa density equivalent to standard effort. One series was inundated,while the other was dry. Three interface shear tests were performedusing raw shale on stainless steel, rusted steel, and conveyor-beltrubber using the large shear box (2 by 2 by 1 ft (0.6 by 0.6 by0.3 m)). A series of conventional direct shear tests (3 by 3 in.(7.6 by 7.6 cm)) were performed on TOSCO, both inundated and dry,and on modeled PARAHO, inundated. A series of repeated direct sheartests to determine residual shear strength were also performed on3- by 3-in. (7.6- by 7.6-cm) specimens of modeled PARAHO and TOSCO.
h. K tests were performed on 9-in.- (22.9-cm-) diam and 6-in.-
(15.2-cm-) diam specimens of PARAHO and TOSCO, respectively, com-pacted to a density comparable to standard effort. PARAHO specimenswere allowed to cure for 0 and 13 months, while TOSCO specimenscured for 0, 11, and 19 months prior to testing.
i. Cyclic triaxial tests were performed on 6-in.- (15.2-cm-) diamspecimens of modeled PARAHO material compacted to densities corre-sponding to 60 percent relative density (D ) at effective confining
For convenience, symbols and unusual abbreviations are listed and definedin the Notation (Appendix E).
17
VI
'T....
Vi

pressures of 14.5 and 29.0 psi (100 and 200 kPa) and to 60 percentof standard compaction effort at an effective confining pressure of14.5 psi (100 kPa).
j. Dynamic properties tests that evaluate shear modulus G , Young'smodulus E , and damping ratio A were performed on 6-in.- (15.2-cm-)diam specimens of modeled PARAHO material using cyclic triaxial equip-ment. Complementary values of these parameters, but at lower strainlevels, were determined on 4-in.- (10.2-cm-) diam specimens using theresonant column apparatus. All test specimens were compacted to den-sities equivalent to 60 percent of standard or modified compactioneffort.
k. Drop height density determinations were made on PARAHO andTOSCO materials dropped from various heights up to 20 ft (6.1 m)to determine densities achieved from a free-fall condition.
1. Los Angeles abrasion tests were performed on various gradations ofPARAHO, TOSCO, and raw shale to evaluate the abrasion resistance ofthese materials.
m. Bin and hopper analysis involved determining the flow rate for rawshale by Jenike and Johanson, Inc., to evaluate possible bin andhopper designs for handling raw shale materials.
Composition and durability characteristicsA series of petrographic and chemical tests were conducted to investi-
gate possible physical and/or chemical changes that occur during curing andcould account for the observed self-cementing tendencies. Accordingly,samples of raw shale and 28-day cured and uncured PARAHO were analyzed bythe following tests.
a. X-ray diffraction (XRD).
b. Petrographic microscope of thin sections.
c. Scanning electron microscope (SEM).
Differential thermal analyses (DTA) and chemical analyses were performed onraw shale. The durability to alternate cycles of drying and slaking wereevaluated on specimens of raw shale and cured and uncured PARAHO by Franklinslake durability tests.
18
CHAPTER 3: MATERIALS AND TESTING PROGRAM
Materials
The retorted oil shales tested in this program were retorted by thePARAHO and TOSCO processes and are designated as such in this report. In someinstances, tests were performed on the raw shale and on mixtures of PARAHOand TOSCO.
PARAHOThe PARAHO retort is located at the Anvil Points Facility located near
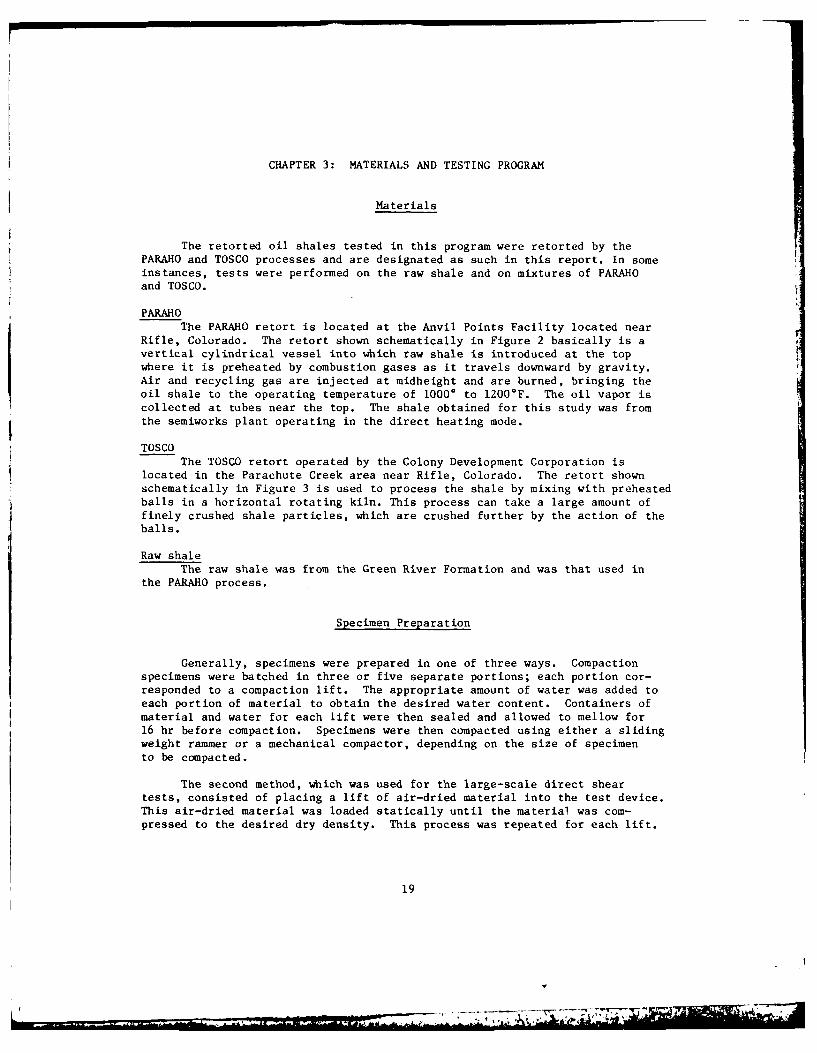
Rifle, Colorado. The retort shown schematically in Figure 2 basically is avertical cylindrical vessel into which raw shale is introduced at the topwhere it is preheated by combustion gases as it travels downward by gravity.Air and recycling gas are injected at midheight and are burned, bringing theoil shale to the operating temperature of 10000 to 1200*F. The oil vapor iscollected at tubes near the top. The shale obtained for this study was fromthe semiworks plant operating in the direct heating mode.
TOSCO
The TOSCO retort operated by the Colony Development Corporation islocated in the Parachute Creek area near Rifle, Colorado. The retort shownschematically in Figure 3 is used to process the shale by mixing with preheatedballs in a horizontal rotating kiln. This process can take a large amount of
finely crushed shale particles, which are crushed further by the action of theballs.
Raw shaleThe raw shale was from the Green River Formation and was that used in
the PARAHO process.
Specimen Preparation
Generally, specimens were prepared in one of three ways. Compactionspecimens were batched in three or five separate portions; each portion cor-responded to a compaction lift. The appropriate amount of water was added toeach portion of material to obtain the desired water content. Containers ofmaterial and water for each lift were then sealed and allowed to mellow for16 hr before compaction. Specimens were then compacted using either a slidingweight rammer or a mechanical compactor, depending on the size of specimen
to be compacted.
The second method, which was used for the large-scale direct sheartests, consisted of placing a lift of air-dried material into the test device.This air-dried material was loaded statically until the material was com-pressed to the desired dry density. This process was repeated for each lift.
19
FEED SHALE
FEED HOPPER
ROTATING SOLIDS
DISTRIBUTOR
7!
l FO F F - G A S
COLLECTORS
GASDISTRIBUTORS '- REFRACTOR Y
BOTTOM
HYDRAULICALLY
OPERA TED GRA TECONTROLS RETORTED
PRESSURE SHALE DISCHARGESEALS
RE TOR TED SHA L EDISCHARGE
Figure 2. The PARAHO vertical retort (from WCC (1976),
USBM Contract No. J0255004)
20
- --- - =.. .- .!..',, - : I ..... i ' .- .... .. ... "¢T -- r " F " = " '"' .7

FLUE GAS I FLUE GAS
SHLEBI CYCLON BALL HEATER
SH ALE BIN
HORIZONTALROTATINGRETORT
CONDENSER
SHALE COKE BALLS
Figure 3. TOSCO process
Although static compaction produced a different structure from the impact com-paction used for other strength tests, static compaction was the only practicalmethod of preparing specimens for this device; since the materials were co-hesionless, it was believed the effects of compaction method on strength wouldbe small.
For all cylindrical-shaped strength specimens, i.e., unconfined com-
pression, triaxial, resonant column, etc., the specimen preparation was asfollows: each lift was batched separately to the appropriate gradation tominimize segregation and variation in gradation between lifts, and the appro-priate amount of water added to achieve the desired water content. A pro-cedure of undercompaction, in which each lower lift was compacted less densethan the succeeding lift, was used in an effort to achieve a more uniformdensity through the specimen. Approximately six to eight equal height liftswere used for each specimen.
The specimens were compacted inside a cardboard tube to the desireddensity using a sliding weight or a mechanical compactor. If the specimen wasto be saturated, the top was sealed with wax; while specimens to be testedunsaturated were sealed with hydrostone. The sealed specimen was then put ina lard can with a small open jar of water and placed inside a 720 F envi-ronmental room until tested. Unless otherwise specified, the test specimenswere usually cured 3 days prior to testing. This brief curing period was totake advantage of any self-cementing properties that would make the specimensless friable and easier to handle. Prior to testing, the cardboard tubes werecut and peeled away from the specimen.
Since size of laboratory equipment physically limits the maximum par-ticle size of the material to be tested, often it is necessary to model thefull-scale gradation. When modeled gradations were required, a scalping andreplacing modeling technique was usually employed. This technique consisted
21
-
lilt - Al

of removing the oversized particles (+3/4 in.(19 mm)) and replacing them withan equal weight of smaller fractions (3/4 in. (19 mm) to No. 4). The other two
techniques, which were not used extensively, consisted of constructing a gra-dation parallel to the full-scale gradation, or merely scalping the oversizedparticles.
Tests and Test Methods
Material properties tests were performed in accordance to current CEprocedures outlined in EM 1110-2-1906, "Laboratory Soil Testing" (Departmentof Army, 1970), which in most cases is compatible with American Society forTesting and Materials (ASTM) standards (ASTM, 1979). In cases where no stan-
dards were available, current research practice at the WES was followed, withnecessary modifications to accommodate specific material property require-ments.
Tests were conducted primarily on PARAHO and TOSCO retorted oil shale,with nominal testing conducted on mixtures of PARAHO and TOSCO, and on rawshale. Te testing program has been presented in Figure 1 and is discussed
below:
Physical properties
Gradation. Upon receipt of the PARAHO and TOSCO materials, particle-size distribution tests were conducted on representative samples to establishrepresentative gradation of the materials. These tests were performed accord-ing to Appendix V of EM 1110-2-1906, which is compatible with ASTM D422. Wetsieving was performed on one sample each of PARAHO and TOSCO to disaggregateany possible clay lumps.
Specific gravity. Specific gravity analyses were performed on plus No.
4 and minus No. 4 fractions of PARAHO and TOSCO and plus No. 4 fraction ofthe raw shale. These tests were conducted in accordance with Appendix IV of
EM 1110-2-1906.
Atterberg limits. Three procedures were followed to determine plas-
ticity characteristics of the PA{HO, TOSCO, and raw shale; specifically, (a)standard test on minus No. 40 material, (b) blenderized minus No. 40 material,and (c) material crushed to minus No. 40 and then blenderized. These pro-cedures were repeated after inundation for 9 and 18 months. Testing was in
accordance with Appendix III of EM 1110-2-1906. Blenderization is a proceduredescribed in this appendix and used for clay shale materials. It consists ofone cycle of air-drying and slaking followed by disaggregation in a high-speedblender for 10 min.
Engineering propertiesCompaction. Compaction tests were performed using three compaction
efforts: (a) 60 percent of standard (7,425 ft-lb/ft 3), standard (12,375
ft-lb/ft 3), and modified (56,250 ft-lb/ft 3). Full-scale tests using a 12-in.-
(30.5-cm-) diam mold were performed on PARAHO, while a conventional 6-in.-(15.2-cm-) diam mold was used for modeled PARAHO and TOSCO materials.
22
V -A6 1'
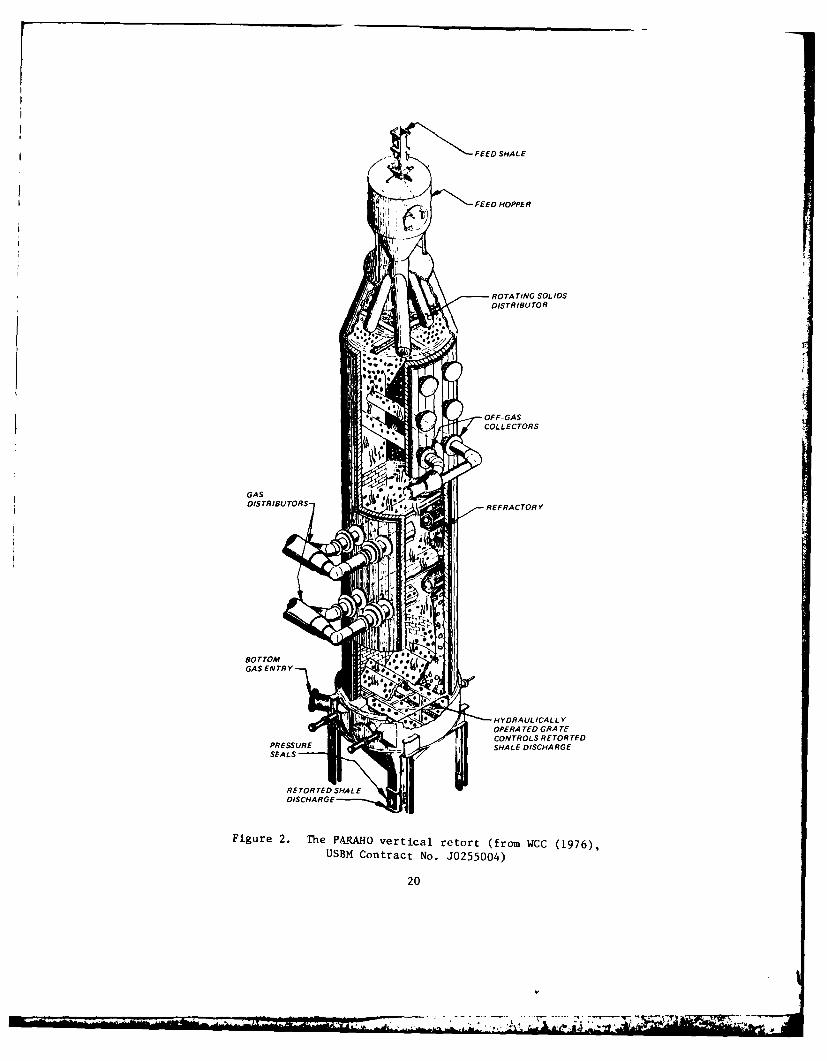
These compaction efforts are summarized as follows:
MoldDiam- Hammer Drop No.
eter Weight Height Blows/ No.Compaction Effort in. lb in. Layer Layers
60% Standard (7,425 ft-lb/ft ) 6 5.5 12 34 3
(0.36 MJ/m 3) 12 24.7 24 39 3
Standard (12,375 ft-lb/ft 3) 6 5.5 12 56 3
(0.59 MJ/m ) 12 24.7 24 65 3
Modified (56,250 ft-lb/ft ) 6 10.0 18 56 5
(2.69 MJ/m 3 ) 12 24.7 24 179 5
The procedures for performing conventional 6-in.- (15.2-cm-) diam tests wereaccording to Appendix VI of EM 1110-2-1906, which is similar to ASTM D698for standard effort and D1557 for modified effort, with the exception that asliding weight rammer instead of a sleeve rammer was used. The 60 percentof standard effort procedure used was merely the standard effort procedure,scaled to the appropriate number of blows. For modeling of the full-sizedPARAHO material, a procedure of scalping the plus No. 3/4-in. (19.0-mm) mate-rial and replacing that percentage with an equal percentage of 3/4-in. (19.0-mm)to No. 4 sized material as described in Appendix VIA of EM 1110-2-1906 wasgenerally used.
The large diameter (12-in.(30.5-cm)) compaction tests were performedusing a Howard mechanical compactor (Figure 4). This equipment and proceduresused for compacting large-diameter specimens are described by Donaghe andTownsend (1973 and 1975). The compactor is equipped with a 24.7-lb (11.2-kg)rammer having a face diameter of 6 in. (15.2 cm); the 12-in.- (30.5-cm-) diammold is 12 in. (30.5 cm) high. A special harness for suspending the mold andspecimen from a forklift was rigged with an electronic load cell sensitiveto within 0.1 lb (0.5 kg) to obtain specimen-plus-mold weights. Batches fortest specimens were prepared by thoroughly mixing by hand the appropriateair-dried portion (by weight) of material required from each sieve fractionwith a measured quantity of water. Each layer was batched separately to min-imize any variations in grading between layers. Each batch was stored in anairtight container after mixing and allowed to mellow for a period of atleast 16 hr prior to compaction. Since compacted specimens could not betrimmed flush with the top of the mold without substantial disturbance, thespecimen volume was determined by measuring from the top of the mold collarto specimen surface. The mold collar volume not occupied by the specimenwas determined; hence, the specimen volume was then determined. The specimenwas removed from the mold and oven-dried for water content determinations;selected samples were taken to determine particle breakdown during compaction.
Maximum-minimum density determinations. These were performed on PARAHOand modeled PARAHO in an 11.1-in.- (28.2-cm-) diam mold in accordance withAppendix XII of EM 1110-2-1906, which corresponds to ASTM D2049.
23
-S

v1~U jBAP E-Lr RYFrQK iISiJS;'FN,-; jC -rt, A 4
S P E C
244
Consolidation. Large diameter (12-in. (30.5-cm)) consolidationtests to 800-psi (5.5-MPa) vertical stress were performed on full-scale speci-mens of PARAHO and TOSCO materials compacted to densities corresponding to 60percent of standard, standard, and modified efforts. These tests were per-formed at the South Pacific Division Laboratory (SPDL), CE, using a 12-in.-(30.5-cm-) diam floating ring consolidometer, which accommodates an 8.25-in.-(21.0-cm-) high specimen. Stresses were applied using a hydraulic ram, whiledeflections were monitored using four potentiometers located at quarter points.Consolidation stresses of 12.5, 25, 50, 100, 200, 400, 600, and 800 psi (86.2,172.5, 345, 690, 1380, 2760, 4140, and 5520 kPa) with rebound stresses of 600,200, 50, 12.5, and 0 (4140, 1380, 345, and 86.2 kPa) were each applied for aminimum of 24 hr. After rebounding, the specimen was oven-dried and a sieveanalyses performed to determine particle breakage. Specimens were prepared bybatching sufficient material with the appropriate gradation for 2- to 4-in.- (5-to 10-cm-) high lifts and compacting to the desired density with a 10-lb(4.5-kg) rammer.
Unconfined compression tests. Unconfined compression tests were per-formed on 6-in.- (15.2-cm-) diam specimens of modeled PARAHO and TOSCO materialscompacted to densities corresponding to 60 percent of standard, standard, andmodified compaction efforts. The specimens were then cured for 0, 3, 7, 14,and 28 days to evaluate their self-cementing properties. Unconfined compres-sion tests were also performed on a mixture of 75 percent PARAHO and 25 percentTOSCO compacted to standard effort density and cured 0 and 28 days. Specimenpreparation consisted of: (a) batching each appropriately graded layer tominimize segregation and variation in lift gradation, and (b) adding the re-quired quantity of water and allowing the layer to mellow 1 hr prior to compac-tion. The specimens were compacted in six layers inside a 6-in.- (15.2-cm-)diam cardboard tube; the surface was leveled and sealed with hydrostone; andthen the sealed specimen was placed inside a lard can containing a small jar ofwater and allowed to cure inside an environmental room at 72*F. Testing wasaccording to Appendix XI of EM 1110-2-1906, which is compatible with ASTM D2166.
Triaxial compression tests. Consolidated-undrained (with pore pressure
measurements) (R) and/or consolidated drained (S) triaxial compression testswere performed on 9-in.- (22.9-cm-) and 6-in.- (15.2-cm-) diam specimens (de-pending upon maximum particle size) of PARAHO and TOSCO materials compacted todensities equivalent to 60 percent of standard, standard, and modified com-paction efforts. R tests were also performed on 6-in.- (15.2-cm-) diam speci-mens of modeled PARAHO and on 1.4-in.- (3.6-cm-) diam specimens of PARAHO fines,all compacted to equivalent standard effort density. Effective confiningpressures of 20, 40, 80, and 160 psi (138, 276, 552, and 1104 kPa) were used toisotropically consolidate the specimens. After back-pressure saturation,permeability determinations were made using falling head methods.
The axial load, chamber and pore pressures, and axial deformations weremonitored electronically via a load cell, pressure transducers, and a linearvariable differential transformer (LVDT), respectively, and recorded digitallyon a multichannel recorder and/or an x-y-y' recorder. Testing proceduresconformed to Appendix X of EM 1110-2-1906.
25

K triaxial tests. K tests were performed on 9-in.- (22.9-cm-) and0 0
6-in.- (15.2-cm-) diam PARAHO and TOSCO specimens, respectively, compacted toequivalent standard effort density. In the case of PARAHO specimens, curingtimes were 0 or 13 months, while curing times for TOSCO were 0, 11, and 19months. The principal of K testing is to determine the axial stress-deformation properties under conditions of zero lateral (horizontal) defor-mation. For PARAHO tests, the specimens were back-pressure saturated, and thenull condition for no horizontal deformation was calculated from the axialdeformation and volume of water expelled into a burette based upon theassumption that the specimen deformed as a right circular cylinder. For TOSCOtests, the horizontal and vertical deformations were monitored by a pair ofLVDT clamps positioned at one-third points (Figure 5). The LVDT clamps elimi-nate the problem of membrane penetration affecting volume change measurements Fby directly monitoring the specimen diameter. (It is believed that errors dueto membrane penetration on the volume of water measured by the burette in thetests on PARAHO were minimized due to the size of the specimens tested.) Theaxial load, deformation, and confining pressure were monitored electronicallyby a load cell, LVDT(s), and pressure transducer and recorded on an x-y-y'recorder.
Testing consisted of applying a small seating load, obtaining the nullhorizontal deformation, and then gradually increasing the axial stress. Thechamber pressure was subsequently increased manually to maintain a null hori-zontal deformation value. Loading the specimen consisted of a series ofload-rebound cycles to characterize the plastic and elastic components ofdeformation. Additional details concerning K testing and procedures used
are described by Al-Hussaini and Townsend (1975 and 1975a).
Direct shear tests. Two series, inundated and dry, of large-scale (2-by 2- by 1-ft (0.6- by 0.6- by 0.3-m)) direct shear tests were performed onPARAHO material. The material was compacted in 3-in. (7.6-cm) lifts by placingthe loading plate on the loose material and statically applying a load untilthe desired density (equivalent to standard effort) was achieved. Figure 6shows a schematic drawing of the equipment. The normal stress is applied tothe specimen by three hydraulic jacks and monitored by three load cells, allof which are mounted in the loading head. The shearing force is applied to thelower half of the specimen by three hydraulic jacks, which produce shear at thespecimen midheight. This shearing force is determined from two load cells.Dial gages measure the normal and shear deformation of the box. Additionalinformation on the apparatus is presented by Nicholson (1979). The tests weremultistaged using ascending normal stresses of 2.5, 5.0, 10.0, and 20.0 tsf(239, 479, 958, and 1917 kPa) and allowing the specimen to reconsolidate undereach normal stress.
Interface shear tests to determine material handling characteristics ofPARAHO and raw shale were also performed using this equipment. For thesetests, a plate to which either smooth stainless steel, rusty steel, or con-veyor belt rubber was attached formed the top half of the specimen, thusproviding an interface shear surface. Each material was loosely dumped in3-in (7.6-cm) lifts into the lower half of the box as material handling wouldbe for a loose state, and the only densification was due an applied normal
26
-* 7 ~ ~ '-77T:-YY
ri~
Uz
27

UAJ
.0:I.-1
oc
Q.
us0 )
.0 c
00
I 4Ix.4-
IL w
0 x0ui 0- 0- I
4i 4434l In t1LYJ
A 0 I x I
4 m 0 -
I-0 co
28
1A

stress of 0.25 tsf (24 kPa). The tests were multistaged using ascendingnormal stresses of 0.25, 0.50, 1.0, and 2.0 tsf (24, 48, 96, and 192 kPa).
Conventional direct shear tests were also performed on 3- by 3-in.(7.6- by 7.6-cm) specimens of inundated modeled PARAHO and inundated and dryTOSCO. Specimens were trimmed from samples compacted in a 6-in.- (15.2-cm-)diam compaction mold using standard compaction effort. Testing was in ac-cordance with Appendix IX of EM 1110-2-1906.
Repeated direct shear tests to establish residual shear strength wereperformed on 3- by 3-in. (7.6- by 7.6-cm) specimens of modeled PARAHO andTOSCO material trimmed from samples compacted in a 6-in.- (15.2-cm-) diammold under standard compaction effort. The WES automated repeated directshear machine (Figure 7) consists of a shear box, the top half of which isheld stationary while the lower half is moved back and forth accumulating de-formation until minimum resistance to shear is offered. The shear force andshear deformation are monitored electronically by a load cell and LVDT, re-spectively, and recorded on a strip chart recorder. The normal load is ap-plied by an air cylinder. The tests were multistaged with increasing normalstresses applied after residual is achieved under a given normal stress.Testing was in accordance with Appendix IXA of EM 1110-2-1906.
Dynamic properties test. The dynamic properties of modeled PARAHO wereevaluated by cyclic triaxial and resonant column equipment. Since resonant
column equipment only applies small shear strains, i.e., 10-5 to 10-3 percent,
and cyclic triaxial equipment is limited to 10- to 1 percent strain, bothtests are required to completely characterize the dynamic properties.
a. Cyclic triaxial tests were performed on 6-in.- (15.2-cm-) diamspecimens of modeled PARAHO compacted to equivalent 60 percent stan-dard and modified effort density. An MTS closed-loop electrohydraulicsystem was used to apply a sinusoidal compression-extension wave form.The load-deformation hysteretic loop was monitored using a loadcell and LVDT clamps positioned at one-third points on the speci-men, respectively, and recorded using an x-y recorder. To ensurethat the load and deformation responses did not exceed the recorderspeed, testing was conducted at 0.5 Hz instead of 1.0 Hz as wasused for the cyclic triaxial tests to evaluate earthquake response.To calculate the shear modulus G , using cyclic triaxial equipment,the equation, G = E/2(1 + v) , is used, which requires calculatingYoung's modulus E and either estimating or measuring deforma-tions to obtain Poisson's ratio V . For these tests, Poisson'sratio values were determined from axial and radial deformationsusing the LVDT clamps, which were recorded on a strip chart recorder.The tests were multistaged by applying 25 cycles of loading at eachincreasing strain level for each confining pressure. Each specimenwas multistaged with respect to strains but not with respect toconfining pressure.
b. Resonant column tests were performed on 4-in.- (10.2-cm-) diam speci-mens of modeled PARAHO with the same modeled gradation as used for
29
• • . . .... --- . . . T7. - - -. ' a

.1l
WES REPEATED DINRECT SHEAR . .'ln
11) SHEAR BOX
(2) NORMAL LOAD AIR PISTONI3) LOAD CELL MEASURING SHEAR FORCE14) GEAR BOX & DRIVE MOTOR
Figure 7. WES automated repeated direct shear machine
30
I -- A'

cyclic triaxial tests and compacted to equivalent 60 percent stan-dard and modified effort density. Testing was with a Drnevich appa-ratus (Figure 8), which is a fixed-free type with torsional orlongitudinal shearing stress applied to the specimen at the top usingelectrical coils or an electromagnet, respectively. The resultingLissajous figure is monitored on an oscilloscope when resonance isestablished, and the shear modulus G and damping ratio A are cal-culated from the resonant frequency, coil-power relationship, andaccelerometer output. These tests were multistaged with respect toboth strain level and confining pressure. Testing sequence was toincrease strain level at a given confining pressure under thetorsional mode, then return to a low strain value, and increase thestrain level under the longitudinal mode. After specimen responsewas determined under both torsional and longitudinal excitations,the confining pressure was increased and the testing sequencerepeated. Additional details concerning resonant column testingare described by Drnevich (1977 and 1978).
Cyclic triaxial tests. The earthquake resistance of modeled PARAHO
material was evaluated by isotropically consolidated undrained cyclic tri-axial tests on 6-in.- (15.2-cm-) diam specimens compacted to densities
comparable to 60 percent of standard compaction effort and 60 percent rela-tive density D . Testing was conducted using an MTS closed-loop electro-r
hydraulic loading system, which applied a sinusoidal compression-extensionwave at 1 Hz. The axial load, deformation, and confining and pore pressureswere monitored electronically using a load cell, LVDT, and pressure trans-ducers, respectively; their outputs were recorded on a six-channel stripchart recorder. Specimens at 60 percent Dr were prepared by moist
tamping. Confining pressures used were 14.5 psi (100 kPa) for specimenscompacted to 60 percent of standard effort, while confining pressures of14.5 and 29.0 psi (100 and 200 kPa) were used for 60 percent D specimens.Testing procedures conformed to Appendix XA of EM 1110-2-1906. r
Los Angeles Abrasion tests. These tests were performed in accordancewith ASTM C131-76 and C535 on PARAHO and raw shale. ASTM gradings A, C, and1 were used for the raw shale, while gradings A, C, and 2 were used forPARAHO.
Drop height density tests. These tests were performed on PARAHO andTOSCO materials to determine densities achieved from a free-fall condition.Testing was performed by placing the 11.1-in.- (28.2-cm-) diam D moldr
beneath a scaffold, dumping material from a known height into the mold,screeding, then weighing the mold plus material, and calculating the corre-sponding density. Drop heights of 0.7, 1.5, 4.5, 10.5, and 16.5 ft (0.2,
0.4, 1.4, 3.2, and 4.9 m) were used.
Bin and hopper tests. Flow tests were performed on samples of crushedraw shale (minus No. 8 sieve) by Jenike and Johanson, Inc. Tests were for con-tinuous flow and for flow after 3 days storage at rest for three moisture con-tents: as received (1), 5.9, and 10.7 percent. In addition, compressibility,wall friction, and flow rate tests were also performed. Appendix B contains
31
... -. - -7

*1 1
Z << M z
32 U0
0 mm) Z

details of the tests and data results furnished the WES.
Compositional anddurability characteristics
Compositional characteristics. Various analyses were performed onsamples of raw shale, PARAHO material, fragments of unconfined compression
specimens of modeled PARAHO (28-day cure), and portions of retorted shale fromFranklin slake durability tests. These analyses were performed to deter-mine the mechanisms responsible for the observed self-cementing propertyof retorted oil shale and also included petrographic X-ray diffraction,scanning electron and steroscopic microscope examinations, differentialthermal analyses, and chemical analyses.
Franklin slake durability tests. These tests were performed on frag-ments of raw shale, 1-1/2-in, and 3/4-ti. PARAHO retorted shale, and the un-confined compression specimens. Testing consisted of duplicate specimenstumbled for 10 min inside a No. 10 sieve squirrel cage partially submergedin water, as described by Franklin and Chandra (1972).
33

I
CHAPTER 4: PRESENTATION AND DISCUSSION OF RESULTS
Physical Properties
GradationUpon receipt of the PARAHO material in 55-gal drums, 10 drums were
randomly selected and subsectioned by quartering. Gradations were determinedfor five subsamples using the Gilson shaker, while one subsample was wetsieved and one dry sieved by hand. Figure 9 presents the results of thesegradation analyses, plus those determined by WCC (1976). The results of testson the five subsamples processed on the Gilson showed that the gradation ofthe PARAHO material was remarkably consistent; hence, Figure 9 shows only onecurve representing a composite of these subsamples. A comparison between thehand-sieved and Gilson-sieved gradation results in Figure 9 also show that thePARAHO material is friable and experiences some breakdown by the Gilson shaker.The Gilson action produced approximately 10 percent more fines (minus No. 200sieve) at the expense of coarser particles than the relatively less abrasivehand sieving. A comparison between the wet and dry hand-sieving gradationcurves reveals that dry hand sieving better represents the gradation andprobably more nearly represents the gradation of PARAHO material as it leavesthe retort. This latter gradation was used as a basis for reconstitutingPARAHO specimens.
A comparison of the gradations determined on the Gilson shaker withthose of WCC (1976) reveals fairly close agreement in one case and a finergradation obtained by WCC for another. Considering the variability of oilshale and gradations entering the retort, the agreement shown in Figure 9 ismost likely a good representation of the gradation of PARAHO retorted shale.
Upon receipt of the TOSCO material in 55-gal drums, two drums wererandomly selected and subsectioned by quartering. Gradations for these twosubsections were determined using a Rotap shaker. The results of these gra-dation analyses presented in Figure 10 show excellent agreement between thetwo subsamples. Based upon this agreement, the drums of TOSCO material werecombined. Figure 10 also shows the representative gradation of this combinedmaterial. Obviously, PARAHO processing produces a much coarser wasteshale than TOSCO because of the large difference in raw shale particle sizesentering the retorts. The PARAHO material is classified as a poorly gradedsandy gravel (GP), while TOSCO is classified as a silty sand (SM). Thesedifferences are reflected in the observed engineering properties.
Material processingFor the PARAHO material, processing consisted of dividing the material
into various sieve sizes by passing the material through a Trommel rotatingdrum screen. The various sized fractions were then stored for reconstitutingtest specimens. The gradation determined by the hand sieving was selectedas representing the PARAHO material.
For the TOSCO material, processing consisted of quartering the combinedmaterial into appropriate subsamples for preparing specimens. Based upon
34
"-- . .. . . ' . . ... . . . . . .

0_ [
0 co
LU-
C7 0- ;
Ln f
- a a 1 1ti0
UW3
35 ~~

U.S. STANDARD SIEVEOPENING IN INCHES U.S. STANDARD SIEVE NUMBERS
4 3 212 1 3.' 2 ' 3 4 6 10 14 20 30 40 50 70 100 2001001 17 7 T
f'~T -, 0
90 10I
80 t -t . . . 20
70 30 . ......... .... "
..... BARREL NO. 1"' so -5-- WZ BARREL NO. 2 L IMITS.BL..ER0ZE<
40 A COMPOSITE SAMPLE u
z + (7 BARRELS)U Zi
W U
a_ ATTERBERG LIMITS (BLENDERIZED) ..
20 - LL PL PI .. . .. . .80"
NO SOAKING -- NP --
10 9 MONTHS SOAKING 31 29 2
0 ilk 1_,, 100
100 50 10 5 1 0.5 0.1 0.05
GRAIN SIZE IN MILLIMETERS
Figure 10. Summary of gradation analyses for TOSCO
gradations of Figure 10, the representative gradation of TOSCO material wouldbe that corresponding to the composite material. 1.Atterberg limits and specific gravity
Table I presents a summary of the results of Atterberg limits tests andspecific gravity analyses. These results show that the unprocessed shale isnonplastic even after inundation for 18 months. During initial undried, air-dried, and blenderized preparation procedures, the material proved to be ex-tremely hard and difficult to process. Since blenderization produces thegreatest amount of disaggregation and thus the highest plasticity, undried orair-dried processing would be fruitless on a material determined nonplastic(NP) by blenderized procedures. Both the PARAHO and TOSCO retorted oil shalesinitially were NP by blenderized procedures. However, after 18 months of in-nundation, both exhibited a PI of 5. While this is a low PI value, the in-crease indicates that some breakdown and softening of retorted shale can occur
36
WOW- - -
LIM.', Mi ,d
02 U)
to C
0~ C- U
(.2 -- c 0 C) C
UQ
d- 7-H V14
2 U4)to~...2 .. A
'2'2'2 '2 2 37
I I Ig2

with weathering. Dames and Moore (1974) reported PI values of 6 percent forTOSCO material, while WCC (197b) listed PI values of 3 percent for PARAHO;both of which agree well with values obtained in this investigation.
Specific gravity may be expressed in three forms: (a) the specificgravity of solids, which is applied to soils finer than a No. 4 sieve; (b) theapparent specific gravity; and (c) the bulk or mass specific gravity. Boththe apparent and mass specific gravities are applied to soils coarser than theNo. 4 sieve, with the apparent specific gravity being routinely used whendealing with coarse aggregate. Apparent specific gravity for raw shale wasdetermined as 2.19. Average values of apparent specific gravity reported bySnethen et al. (1978) varied from 2.02 to 2.36.
The majority of apparent specific gravities, as reported by Snethen et
al. (1978), for PARAHO material varied from 2.52 to 2.59. The value deter-mined in this investigation was 2.42. Dames and Moore (1974) reported anapparent specific gravity value of 2.53 for TOSCO, as compared with 2.55determined in this investigation. These values reported in the literature are
comparable to those determined in this study, with values obtained for PARAHObeing slightly lower and those for TOSCO being slightly higher.
Specific gravity of solids for PARAHO and TOSCO materials were deter-mined as 2.67 and 2.61, respectively.
Engineering Properties
Compaction characteristicsand maximum-minimum density
Figures II and 12, respectively, show the results of large-scale (12-in.-(30.5-cm-) diam) compaction tests using 60 percent of standard, standard, andmodified compactive efforts performed on minus 2-in.- (50.8-mm-) diam PARAHOmaterial, and companion tests performed on scalped and replaced minus 3/4-in.(19-mm) materials using a 6-in.- (15.2-cm-) diam mold. Vibrating table methodmaximum-minimum density tests were also performed on minus 2-in.- (50-mm-)and minus 3/4-in.- (19-mm-) diam PARAHO material using an 11.0-in.- (28.2-cm-)diam mold. Table 2 presents the the results of these tests plus a summary ofthe compaction test data.
The shapes of the water content-dry density curves in Figures 11 and 12
for both the full-scale and scalped and replaced PARAHO materials show thecommon condition that to achieve maximum dry density sufficient water topractically saturate the material is required. However, the effect of watercontents less than optimum is markedly different between the full-scale andscalped and replaced materials. For the former, the addition of small quan-tities of water causes bulking of the material and corresponding low densi-ties, which is common for these gradations. Conversely, for the scalped andreplaced gradation, increasing water contents produced no bulking, but in-creasing densities. Nevertheless, despite this difference in water contenteffects and based upon the considerations that the full-scale tests are morereoresentative of field conditions and that high water contents only produce a
38
mad".
-gTj~r3L.i7.,..-
.

A,0AIiNSFO - - -
105 - - -
G: .4 T
100- - -- 3
Water~~ ~~ 'otet peIn 1\ Nr ih
________________________________________________________________ __________X_
bape ie o Cas~f~ai0 0 LLFAN
0 STND5 EFO 0 2.s 2_ _ P_50 25 53
Figure 11. Watercontent-densit reaetosip for we in-i305-m-hda
cape lrompcto tfeton GAH reore oiL shale
NO. Clas No 4 34 in
.A BACHD 248* NP 72, 33560% ~ ~ ~ ~ ~ 1 STNDR EFOT25 N 1
ANAR EFOT25 N 5

110 --- 1 F 1-- -- -ZERO AIR VOIDS
- - -- - - -- RELA TIONS-- ~= -- G 49
G- -. 257
105 K x
- -- '-SATURATION 90%
-Ai - T
Mater ~ ~ ~ ~ N cotn, ecnto5r7Wih
bapi 11v OrC~sfi~t~ G LL F ~QIa. spt~ No.k 3/. i
AS ~ ~ ~ ~ ~ k BACED249 _4__ N 7.
Figure 12. Water content-densi t rercatosip for 6-n.e(52-mhtda
compaction tests on oee GAH reore oLshl
NO.~~ .@t No 4 3/4 in

I
Table 2
Summary of Compaction Test Results on PARAHO Oil Shale
Maximum MinimumDry Dry
Density Density Relative
Cd dWater DensityCompaction max min Content Di
Gradation Size Effort pcf pcf r % r
Original Vibration 89.2 66.o .. ..(-2 in. fraction) 60% of 94.6 -- 23.3 116.2
standardStandard 97.5 -- 22.2 124.2Modified 104.4 -- 18.4 141.4
Scalped and re- Vibration 81.8 62.9 .. ..placed (-3/4 in. 60% of 91.9 -- 27.2 136.6fraction) standard
Standard 95.7 -- 25.3 148.3Modified 103.1 -- 17.7 168.8
Parallel (-3/4 in. Standard 88.9 0.2fraction) 88.0 22.8
Scalped (-3/4 in. Standard 88.7 0.2
fraction) 92.5 23.1
41

density slightly higher than that for dry material, compaction of PARAHOmaterial in the as-retorted condition is feasible. This is particularlysignificant in that surface water is scarce in western Colorado and would haveto be obtained at additional cost. Another obvious alternative to using waterto increase density is to increase the compaction effort. The results pre-sented in Figures 11 and 12 indicate that both full-scale and scalped andreplaced materials produce significantly higher densities with increasedcompaction effort.
Since the zero air voids curve is a function of specific gravity, andthe apparent specific gravity is lower than the specific gravity of the solids,the zero air voids curves presented in Figures 11 and 12 reflect the compositespecific gravity values for the material. This composite was obtained byconsidering the percentage of a specific fraction and corresponding specificgravity.
Laboratory compaction test specifications limit the maximum allowable
particle diameter to one fourth to one sixth of the corresponding mold diam-eter. Hence to test materials, such as PARAHO, which contain large particles,a modeling procedure that eliminates the oversized particles and allows testingwith smaller more conventional size molds is required. Scalping and replace-ment was the primary modeling procedure used with some tests performed onparallel or scalped gradations. A comparison of the "as batched" gradationsin Figures 13 and 14 shows the effect of modeling on gradation. A comparisonof the results presented in Table 2 shows that the scalping and replacementprocedure underestimates the maximum dry density and overestimates the optimum
water content. These results are consistent with those of others who haveobserved that scalping and replacement modeling fails to achieve resultscomparable to full scale (Donaghe and Townsend, 1973 and 1975). Also pre-sented in Table 2 are the results of compaction tests on parallel and onscalped (without replacement) gradations at zero and a water content assumed tobe near optimum. These model gradations also underestimate the maximum drydensity of the full-scale material. However, of the three model gradationstested, the scalped and replaced procedure more nearly approached the maximumdensity of the full-size material.
T1e gradation curves in Figures 13 and 14 demonstrate the extent ofparticle breakage during compaction for tests on full-scale and scalped andreplaced gradations of PARAHO material, respectively. As shown in these
figures, little difference in the magnitude of particle breakage exists for 60percent of standard and standard compaction efforts. However, considerablebreakage occurs when modified effort is applied, i.e., 4 to 5 times as manyfines are produced by modified compaction effort than 60 percent of standardeffort. This is logical considering that modified compaction effort repre-sents 7.6 times more compaction effort than does 60 percent of standard.Marsal (1967) proposed a method for quantitatively describing the amount ofparticle breakage. In this method, the difference in the percent retained oneach sieve before and after a test is obtained, and the sum of differenceshaving the same sign is designated the breakage factor B. Table 3 summarizesthe B values for the full-scale (12-in.- (30.5-cm-) diam) and scalped and re-placed (6-in.- (15.2-cm-) diam) compaction tests on PARAHO material. A com-parison of these B values shows a progressive increase with compaction effort.
42
--
-I -"~ft) _--Top "
04.,
0
0
4J4
ca 4-t- o
V. 164
w- 0
4.,
-M All 13MD a
43

'4
4J
0 U
t~~zizL -- 9 z
00w- 0
IXJ4.40
'42 ~ ~u
444
mo-.

I
VI ,2- - , + + ; . :
I 2.. .. . .. . . .
45

The results also show that particles of the finer scalped and replaced grada-tion (6-in.- (15.2-cm-) diam mold) experienced greater breakage than did thoseof the coarser gradation, which is contrary to general trends that coarserparticles generally experience a greater amount of particle breakage. Onepossible explanation for this anomaly is that the impact energy delivered bythe hand-held rammer used with the 6-in.- (15.2-cm-) diam compaction tests is
688 ft-lb/ft2 (10.0 kJ/m2 ), while that for the full-scale mechanical compactor
is only 252 ft-lb/ft2 (3.8 kJ/m
2).
Due to the importance of compaction in disposing of spent shale, numer-ous laboratory compaction tests have been performed to evaluate the compactioncharacteristics of PARAHO material. The following tabulation from Snethen etal. (1978) summarizes the variability in compaction characteristics reportedfor this material.
Maximum DryOptimum Water Density
Compaction Energy ASTM Content Yd
ft-lb/ft3 Standard w % max , pcf
6200 50% D698 18.5-23.7 77.0-99.212,375 D698 15.5-22.0 80.2-103.2
(Standard)56,250 D1557 14.4-22.0 88.8-108.4
(Modified)
This variation is largely due to differences in gradation, particularlythe amount of fines, and variability of the unprocessed shale and retortingmode (direct or indirect heat). A more valid comparison of previous data withdata from this report would be for tests performed on PARAHO processed bydirect heating in the semiworks retort as was the material used in this study.Accordingly, Figures 15 and 16 and Table 4 present the results of WCC (1976)for the pre- and post-compaction gradation analyses of minus 1-1/2-in. (38-mm)and minus 3/4-in. (19-mm) materials, while Table 5 compares results betweenthis study and WCC (1976).
These comparisions show that the PARAHO material tested at the WES withits greater amount of coarse particles produced greater densities for both theminus 2-in. (50.8-mm) and minus 3/4-in. (19-mm) gradations than did the finer-grained WCC minus 1-1/2-in, and minus 3/4-in. gradations.
Both ASTM and CE criteria recommend using a vibratory table method toobtain the maximum dry density for materials containing less than 12 percentfines. Hence considering that the WES "as batched" gradations contained only3 percent fines, densification by vibration should be more appropriate forachieving maximum density than impact compaction (Department of the Army, 1970;Townsend, 1972). Nevertheless, the maximum dry density achieved by vibration
was only 89.2 and 81.8 pcf (1429 and 1210 kg/m3 ) for full-scale (minus 2-in.-(minus 50.8-mm-) diam) and scalped and replaced (minus 3/4-in.- (minus 19-mm)diam) gradations, respectively, which is considerably lower than the maximumdry density achieved by 60 percent of standard compaction effort (Table 2).Similarly, WCC (1976) whose minus 1-1/2-in. (38.1-mm) and minus 3/4-in. (19-mm)gradations had 11 and 14 percent fines, respectively, presented resultsshowing that vibratory densification produced lower densities than those
46

MO AS MM LHO~
TZI
-0
i - _
44U .,
i -) ca
_ 444~
0CC)
-4 00
2 ~~ 1 -*-
.4.4-4
44-
*10
47-

I MM AS NNW Umuw
4 4u . 0
-D CD' c,-W 4
Qwo 0
-4- U- IL 0
- -I- -1
0.
a - 4j4
0 .1
484
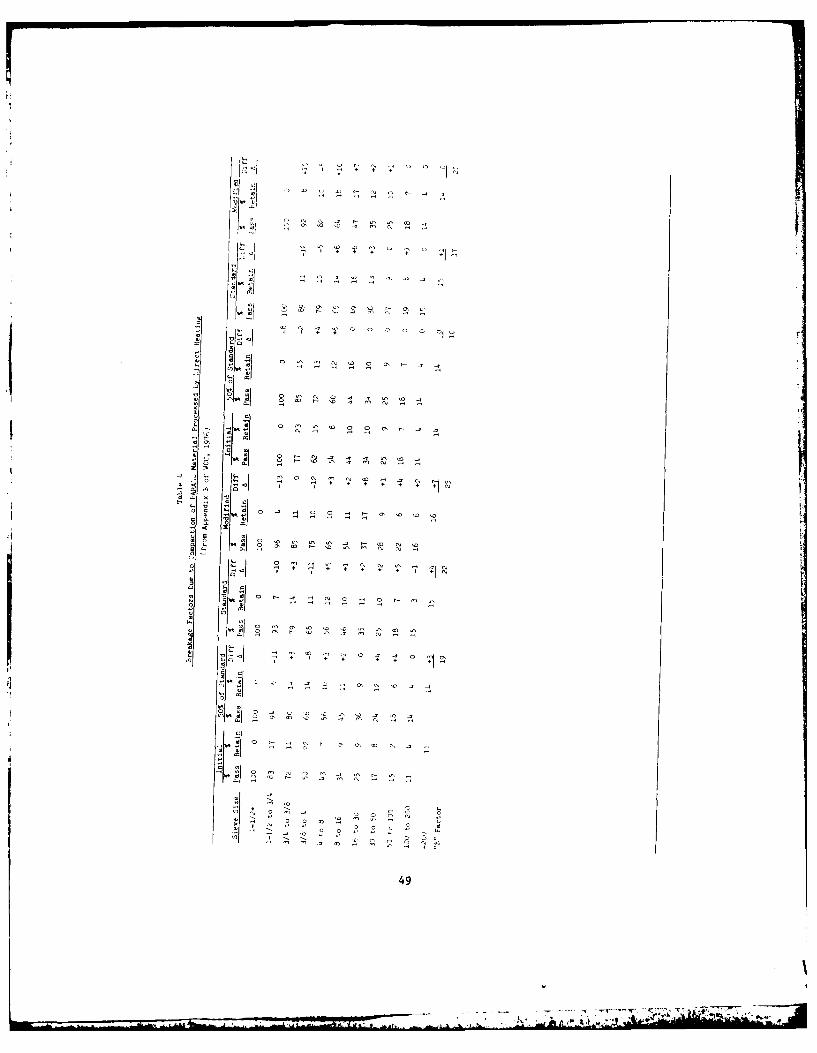
-~ C- ~. JCC
-, C 4) C~ CC C'- Cr CD t~ ~4CC 0
5 C.CC;
CCC 'CC 4 C'- fCC CC. Cr -C0. 4. Cr '4 -4 Cr CC.
C * * + C~C CC ~CCC-
Cr '~ ~
-, CrO-4CCCC- 'CCC '4-4
~ 0 CC '4 C'- CC. .0C.. -4 Cr CC. - -~
4 Cr .3 C~C CD C)
'CC CC 0 12 V
~ Cr ~ CC -4
- a Cr
OCr C-
0 Cr a Cr 0 0 CC C"' '4 4CrCr 00
0 CC C]
C CC~I OCCO.4.43CrCr.4
-4 ) C. j4.~ Cr 0 Cr Cr Cr Cr Cr~4'Q Cr CrCC CC C-CaCC ~ C C C+++tjCr
.) 'C4. ~C-. "-C CCI
ICo
CC
CC.
0?
CC Cr 4' 2 2 0 - C' CCCr-Cr '4CCC'4
OS CC
C'
'Cau-Ca.4
C-.
Cr
Cr
C. CA0 0 CC Cr C"' '.0 a Cr Cr CrSC-C CC. Cr
ICC.I 2 ~ + + + a04 , 2 a Cr C. Cr
tC
o C'~ -4 - Cr OC'COC--Cr'4H o
Cr CC
CC '4
'4
a a
Cr
CC 0 Cr C- '4 a -C Cr Cr '-C CrCC 2Cr Cr Cr:.o ~~'0
.IC C~Q + C + 1CC
C4CC01
CC .' -C .4 CC a CC Cr CC.C -4
C-C Cr Cr-4 Cr
I CCI 0 ~C CC .4 '4 a '5 .4 Cra1 4. Cr '4 a ~Ct Cr Cr Cr Cr
C- CC CC Cr C'. 4 Cr
t~I2 m ~ Ca~ar
CC ~ ~
CC Cr Cr 'CC C.
tO 0 Cr '4 ~ o CC CCC 0'4 Cr 0 C. 4
-- .~ - - ~ ~'-5'ZCT~ CC'- ~ 1C~ ** ' C

50
OA--~--- - -

achieved by impact compaction. From these observations, it might be concludedthat PARAHO does not respond favorably to vibratory compaction. However, thisconclusion s contrary to field compaction tests (WCC, 1976; Snethen, et al.1978), which showed that the most economical compaction of PARAHO could beobtained using a vibrating drum roller. The results presented in Table 2also show that modeling full-scale gradations by scalping and replacementwill not duplicate corresponding estimates of maximum or minimum densities.
The results of 6-in.- (15.2-cm-) diam compaction tests using three com-pactive efforts on TOSCO material are presented and summarized in Figure 17,which shows the optimum water contents and densities obtained as 21 percent,
97 pcf (1554 kg/m3 ), 19 percent, 99 pcf (1586 kg/m3 ), and 18 percent, 104 pcf
(1666 kg/m3 ), respectively, for 60 percent of standard, standard, and modifiedcompaction efforts. The shapes of the compaction curves show a marked effectof water content on density, quite unlike the PARA}{O material, and waterfacilitates compaction. Hence, for this material, the economics of addingwater versus increasing the compaction effort and compacting dry to achieve aspecific density is much more critical than for the PARAHO. By comparison,compaction tests on TOSCO material by Dames and Moore (1974) show a range in
3maximum dry densities from 88 pcf (1410 kg/m ) at 22 percent water content to
100 pcf (1602 kg/m 3 ) at 16 percent water content for standard compactionefforts; and for modified compaction efforts, densities ranged from 101 to
109 pcf (1618 to 1746 kg/m 2 ), while the corresponding optimum water contentsvaried from 19 to 15 percent, respectively.
Figure 18 demonstrates the extent of particle breakage during compac-tion. These results show the unusual event that during compaction the mate-rial became coarser or agglomerated. Although efforts were made to break downthe test specimens into their appropriate fractions, the effort employedobviously was insufficient. This agglomeration is suggestive of some self-cementing as the TOSCO fines are noncohesive and ordinarily would readilydisaggregate. Additional study of this is indicated.
The range of standard densities reported for TOSCO is slightly lowerthan typical results observed for a sandy soil, as TOSCO is classified.
Consolidation.Figures 19 and 20 show the results of 12-in.- (30.5-cm-) diam consoli-
dation tests to a maximum vertical stress of 800 psi (5.52 MPa) for each ofthe three compaction efforts for PARAHO and TOSCO, respectively. Appendix Cpresents the corresponding settlement-log time curves for the various appliedvertical stresses. Table 6 summarizes the engineering consolidation parameters.
The total vertical strains, Ae/(l + e ), when the vertical stress was
800 psi (5.52 MPa) varied from 4.7 to 10.0 percent for the PARAHO and 4.7 to8.4 percent for TOSCO, with the higher compaction efforts exhibiting thesmaller strains. By comparison, WCC (1975) obtained settlement values rangingfrom 2.2 to 11.3 percent for PARAHO for three comparable compaction effortswith a vertical stress of 1000 psi (6.9 MPa), which agrees quite well with thedata presented. However, consolidation test results on TOSCO presented by
51

WATER DRY DENSITYCOMPACTION CONTENTEFFORT V" pcf (kg m3 )
* 60% STANDARD 20-22 96-98 (1537.92- 1569.96)0 STANDARD 18-20 98- 100 (1569.96-1602.00)
A MODIFIED 17-18 103-104 (1650.06-1666.08)110--A \ "
SATURATION - 90' ZERO AIR VOIDS
G 2.60 -- RELATION FOR1 5• 2.60
100
I-
>- 95
NOTE. TO CONVERT pcf TO kg m3
MULTIPLY BY 16.02
85 I I I I0 5 10 15 20 25 30
WATER CONTENT, PERCENT OF DRY WEIGHT
Figure 17. Compaction characteristics of TOSCO for 60 percent of standard,standard, and modified efforts
52
I. .I. . .- ' .. ,-,'T -

"Imm An O3IWm "Ma~u
0 3
I--
s t T
12.
-* - --- - i-- -0 c
1 4~
300
coi
'.44
JJ4~rM Al VINU LM3d
53
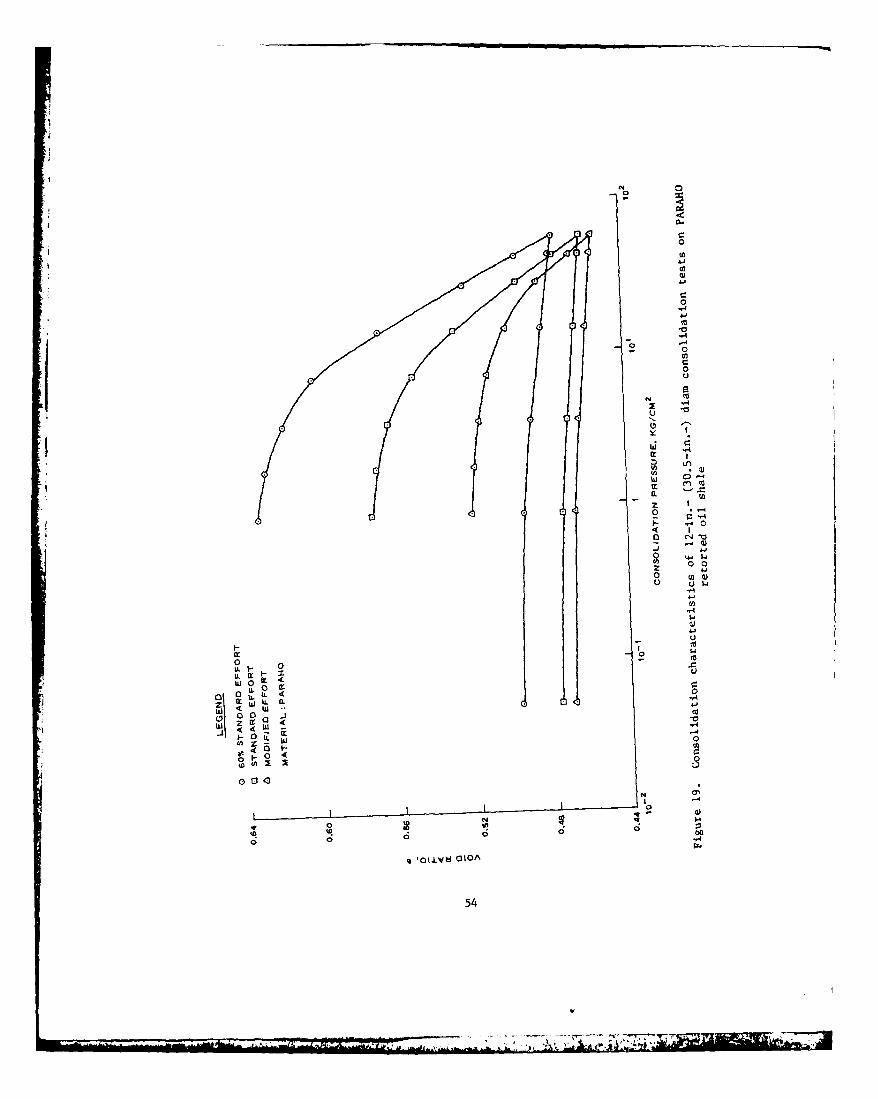
N 0
0
0
0
th 0
a..
00
C14
0 CJ
4-
0 0
, 4-,
14
4
i1-
0 00
0 0 to0
11. 0 0a
0q 011,.~k a-4
~4054

TRIAXIAL CONSOLIDATIONTEST TEST
SPECIMENS SPECIMENS
* 0 60% STANDARD EFFORT1 - STANDARD EFFORT
0.72 - MODIFIED EFFORT
NOTE: TO CONVERT kg/cm2 TO psiMULTIPLY BY 14.22.
0.68
0.64-
S0.600 .
-iI-
0.05 0.1 0.5 1 5 10 50 100
CONSOLIDATION PRESSURE p, k g/,cm2
Figure 20. Consolidation characteristics of 12-in.- (30.5-cm-) diamconsolidation tests and 6-in.- (15-cm-) diam triaxial specimens
compacted to 60 percent of standard, standard,and modified compaction efforts on TOSCO
retorted oil shale
55
* '
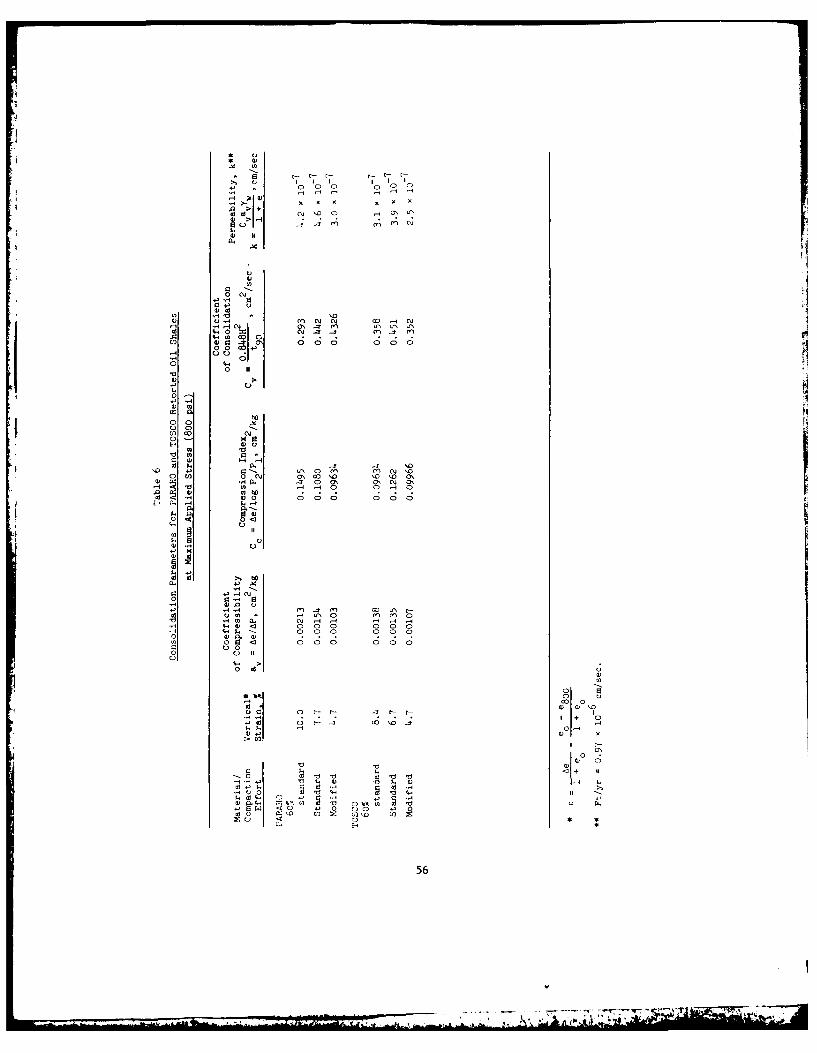
* to
4 10 10 0 0 10 0
H 4J
ldl(\J 14) 0 H O C
0 C41
0
0 Cu0+ (
. -w0 104) 4 0 0 0
U C )U 0:
0 0
4S 00C)~~~~~~t toI 0 '03 0 o 1 o
- 0 0 0 0 '0 to
0 0 0
to 0
r I0 o+
.HU to 0-. In 0
4) . - 0 0- 0 U 0 C- 0
t0 O .1 0 0) 0 U- U) 0
0 *g*
0 0
56
0) 0)

Dames and Moore (1974), where the applied vertical stress was 700 psi (4.8MPa), had vertical strains varying from 16 to 25 percent. The apparent reasonfor the difference in results is that initial void ratios of the tests con-ducted at the WES ranged from 0.55 to 0.69, while those reported by Dames andMoore (1974) were much higher (lower dry density), 0.87 to 1.29. Figure 21compares the compressibility of PARAHO and TOSCO with the data on dense rock-fill materials summarized by Parkin (1977) and shows that both retorted oilshales are comparable to rockfill.
The permeability values presented in Table 6 generally exhibit theanticipated trend of decreasing with increasing compaction efforts and verti-
cal stresses. The value obtained, 10- 7 cm/sec, for both PARAHO and TOSCOindicate that these materials will be impermeable when compacted and subjectedto sufficient vertical stress. By comparison, WCC (1975) reported permea-
bilities for PARAHO ranging from 1.7 x 10 to 8 x 10 cm/sec for threecompaction efforts and a vertical stress of 200 psi (1.4 MPa). These lowvalues of permeability for PARAHO are quite unexpected considering that thismaterial generally contains less than 15 percent fines, and materials con-taining less than 12 percent fines are expected to be pervious.
Figures 22 and 23 present postconsolidation test gradation determina-
tions for comparison with pretest batched gradations for PARAHO and TOSCO com-pacted to densities equivalent to 60 percent of standard and standard, respec-tively. Table 7 summarizes the corresponding breakage B values for thesetests. These figures and table show that the PARAHO fines content increasedfrom 3 to 12 percent during specimen compaction and subsequent consolidationtesting, with no significant difference in particle breakage observed for thetwo densities; the corresponding breakage B value was 27 percent. For theTOSCO material, the fines content increased from 32 percent to 61 and 76 per-cent for standard and 60 percent of standard compaction efforts, respectively.The corresponding breakage B values were 29 and 44 percent, respectively.
These particle breakage results are a composite of breakage sufferedduring specimen compaction and application of the vertical stresses appliedduring consolidation. Breakage B values discussed previously in the compac-tion section indicate that breakage values of 11 and 16 percent occurredduring compaction of the PARAHO specimens. This suggests that breakage in themagnitude of 16 percent for 60 percent of standard effort and 11 percent forstandard compaction effort occurred during consolidation, although it must benoted that compaction equipment for the compaction tests was different fromthat used for preparing consolidation specimens. For comparison, isotropicconsolidation of basalt to 650 psi (4.5 MPa) exhibited practically no particlebreakage, i.e., B < 5 percent.
Postcompaction gradation determinations on TOSCO indicated that anagglomeration effect had occurred (i.e., the post-compaction gradations werecoarser than the precompaction gradations). This unusual event precludesreasonable estimates of particle breakage during consolidation tests. Never-theless, breakage B values of 29 and 44 percent for standard and 60 percent ofstandard compaction efforts, respectively, suggest considerable breakageoccurred during compaction and/or consolidation for this material. It is mostsurprising that more particle breakage was observed for 60 percent of standard
57
"A.

P RE SSU RE, PSI
to 20 40 60 s0 100 200 400 600 Soo
AFTER PA RKIN (1977)1.5q
2 --
P ARAHO3 0 60% STANDARD
o STANDARD
4 -
&MODIFIED
6
00
85
000
0
AFTER PARKIN (1977<~
3 TOSCO
o 60-. STANDARDoSTANDARD<
4 - 4MODIFIED
to[
Figure 21. Comparison of the compressibility of compacted PARAHO and TOSCOwith rockfill (after Parkin, 1977)
58

INDO As U3IjvwX IMDNo
UA 0
'woo
U) Z
C0
Q) 0
- C
595
-59-

U.S. STANDARD SIEVEOPENING IN INCHES U.S. STANDARD SIEVE NUMBERS
4 3 21 2 1 34 12 Is 3 4 6 10 14 20 30 40 50 70100 200
80 .. 4 N.. .20 U
F-20......A STNAD FOT.................8
60 -__,- 400
105 01 1 50. 0
LL 40 .. . . .. . .. . . . .. 60 U
, 30 . INITIAL GRADATION 70 uIJ/ ... I 60"0 STANDARD EFFORT .... . ... W
20 ... • STANDARD EFFORT ... . ... 80
10 .. . . . i . . . .. . .90
100 50 10 5 1 0.5 0.1 0.05
GRAIN SIZE IN MILLIMETERS
Figure 23. Effect of consolidation pressure to 800 psi (5.52 MPa) ongradation of TOSCO retorted oil shale
compaction effort than for standard compaction effort. Generally, it wouldbe anticipated that more particle breakage would occur for the higher compac-tion effort. Perhaps the higher compaction effort contributed to bettercementation due to closer association of the particles and, in turn, is ex-pressed by less particle breakage. This explanation is more plausible con-sidering Marachi's et al. (1969) triaxial test results in Pyramid Dam mate-rial, which indicated that density had little effect on breakage B value.
Unconfined compressionTo investigate self-cementing characteristics, which had been reported
by Snethen et al. (1978), Peterson et al. (1978), and WCC (1976) for spent oilshale, 6-in.- (15.2-cm-) diam unconfined compression tests were performed onspecimens compacted using three compaction efforts and allowed to cure insidewaxed cardboard tubes at ambient temperatures (approximately 72*F) for periodsof 0 to 28 days. Figure 24 presents and Table 8 summarizes the unconfinedcompression results for PARAHO, and Figure 25 and Table 9 for TOSCO. Figure 26compares the results for both PARAHO and TOSCO, i.e., a combination of bothFigures 24 and 25. The following is a summary of the unconfined compressive
strengths for PARAHO and TOSCO obtained in this study plus previous tests onPARAHO (WCC, 1976).
60
-..

0) 0) 0 0 (NJ 0D '4 ) CM \ '4 C- N oN
C)A I- I H H I. 00 00 -- L\ 1) M
Cd 4 '
-H
C)G (YI C\ _-- C- 4 C -Hi --Pl C\ O m ON 7O ON 00 a:) t- ' 4
CdM
0 o 0 C)0 H (n H- o-, t-- '4D O C) o -T _3
E' COH H rdY C 4 C M C -
CO r
0
0
IA ~ HC H- Hl tM4 -~ H1 0N Ho 0\D
0
H 1 0- ON ONI ON ON4 ONI ( \O - '4i LC\ H CM
Q) U) CO C-) 0 C o\. -- 1 ) C Q uN " '4 C HW CI 1Y ONO F\ 0 Z) t-j. C- z 1
Cpc' H f C) 0)\ M C) C )) U-- CM0 (Y CMCd t t + + + + + +
4-) C r
C) -H '0 r 0 0 o () Cj 0 - y
U ~ ~' cd Hiri ri r4 -Cd U)
0 0 I C
o -: C) c m C) C'\ C)\ 0 L-- C) o C) N C - r mO CM j ON U-
4C d -
Cd
C)
CM NC H NM co)C
I -' -. C) (Y) H NC + H (y) 0 0 0 H- 0 C
> MCM 4H 4- 4-) 0 0 C) 4-) .C)0 -. 0 0 4- 4)' 4-
4- -) -:T CMj co -. CDCDI-- -- -- C) C) C)0
CMj H Y) V 0 H CMi H:
61
O d a--
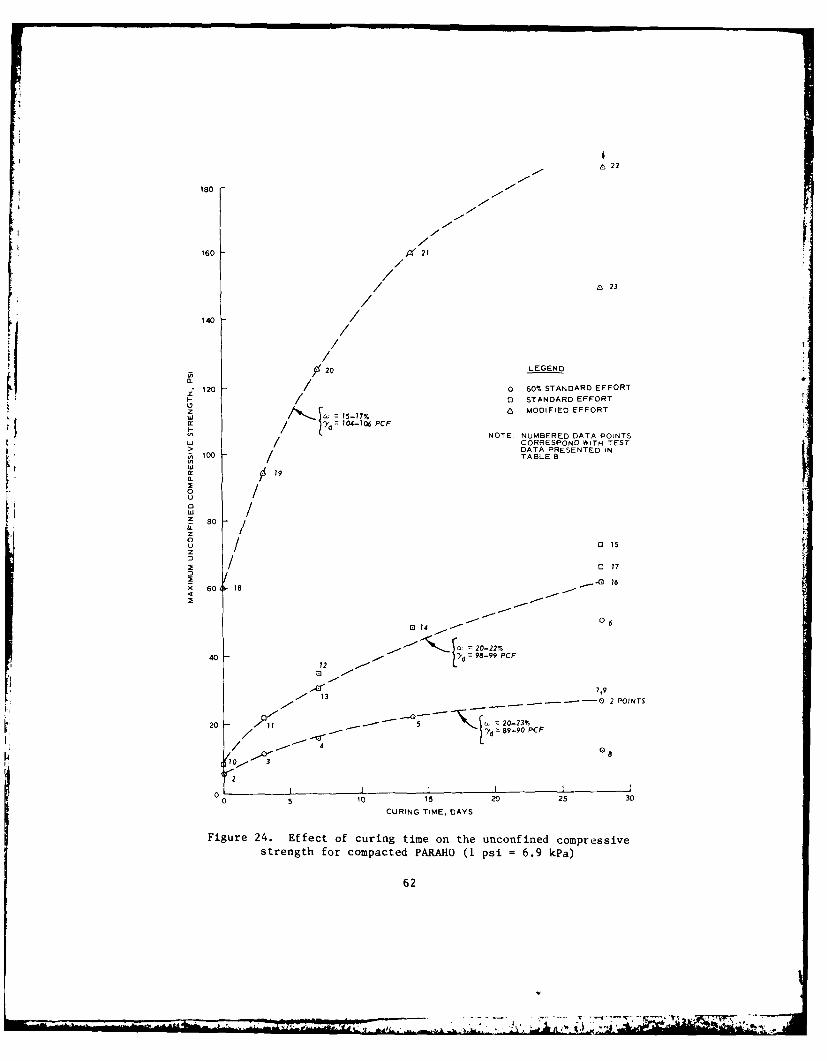
n 22
180
////
//
140
///
Q) 20 LEGEND
120 /-0 60% STANDARD EFFORTk-/ 0 STANDARD EFFORT
.z 8 MODIFIED EFFORTIl 1 5-17%
S yd= 04-106 PCFNOTE. NUMBERED DATA POINTS
CORRESPOND WITH TESTDATA PRESENTED INn100 / TABLE 8
n,- 79(.I0uj° /
0 0 7
Z- 80 /
uz / 015 tz
- 16x 60 18
- 060 14 6
, 20-22%40 98-99 PCF
0 T3.~13
13 --- 0 2 POINTS
20 A, 1 "' 20-23%/ / ./-d =
8 9-
90 PCF
0 I1
0 5 10 15 20 25 30
CURING TIME. DAYS
Figure 24. Effect of curing time on the unconfined compressivestrength for compacted PAttO (1 psi ;6.9 kPa)
62
77.77

*~ ' ) ' C. )
a) r- 0 0 .
, Q, a, 2-)
>2 ~ ~ 1 C, C 2 22 ,
co-, f m 2, 2, .2 .0 0\ X10
a) : -1 4) > 2 QC,-,C, 0 0 C ,, C,,)
2, C (7\ H \,D c,,I
c ~ >2 .0 C, C4 ,2,)f
N 2, C0 ,
22 , 00 >2) 2-t-m y , o ,2
X 42 ~ C ~C . 0 D.0'>
oo 2, (\j 2 , C , "I? %2 N,~
O) 0 2 mj- t0>x2)
>2 IN I' 'I -A- -2-
C- u 0 2, ) 2,2, u U U
0 N
IC >2 I m-Q N, r22> CO I N200 0>'2, CNQD 0 N CONC,00C-D.D C> 2 C0
NA, H -C ,-63,
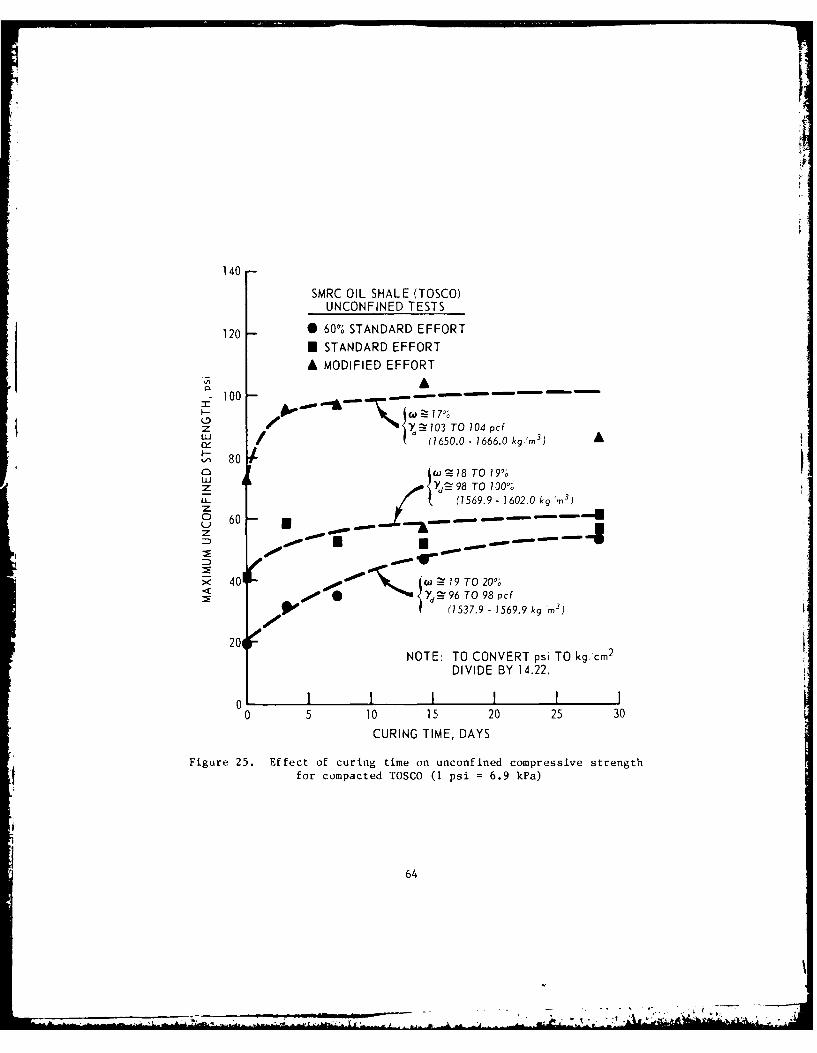
140
SMRC OIL SHALE (TOSCO)UNCONFINED TESTS
120 0 60% STANDARD EFFORT
U STANDARD EFFORT
A MODIFIED EFFORT
100 -
z 10%= I 3 TO 104 pcZLU / (1650.0 - 1666.0 k'3
r0 (a)S-518 TO W9;"' ' /,ld' 9 8 TO 10 0%z
Yd 96 T 700%Pc
(1569.9 - 1602.0 kg "m)
-- mwlU -~~m -mmm - --
. 401 =79 TO 20%;
20 19
TO8,
NOTE: TO CONVERT psi TO kg cm2
DIVIDE BY 14.22.
0 5 10 15 20 25 30
CURING TIME, DAYS
Figure 25. Effect of curing time on unconfined compressive strengthfor compacted TOSCO (I psi = 6.9 kPa)
64
: . --:~~~ ~~~~~~~ ww__ ., .. .. .. . .. ..- -r a, :: ,; 5.: - -. _ , ,
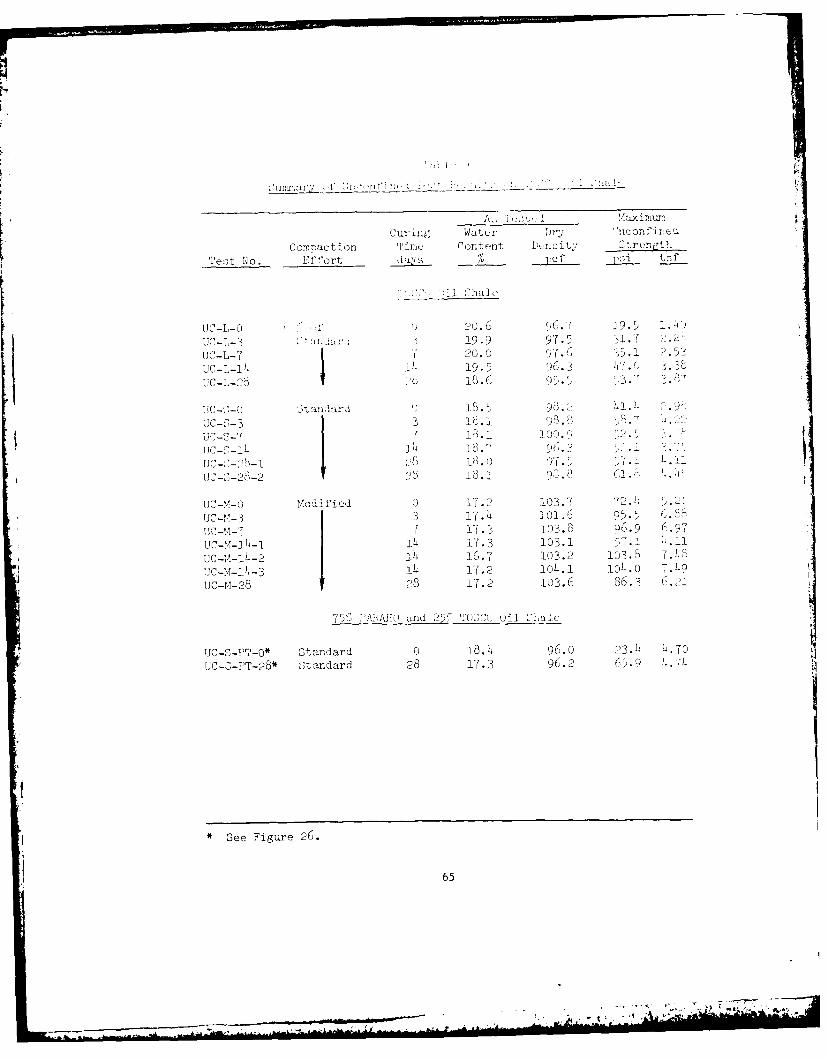
curliitg watcer Dry noiic
Com~rpaction Timul( Content t~ntt ~ r c-n l
TestA No. EISort days ____ Ve s tzf
1i r-ha I
U-- 9 20.6 96.7 19. 1.
UJC-L-3 A rss ~ - 19.9 97 5 3
UC-L-Y i 20.0O , 1.
UC-L-14 1 _ 19.5 96~ - '7 -') - . c
Dcs- saia1 8. P70
UC -3 1F.1 59 .0~-2-77 18.1 1
UC-2-?28-i 2 1.
lOC-,M-0 Modif ied 0 17. 2 103.7 7T2. 1
IJC-M-3 3 17.4 101 .6 95.5I'-(- 7 13 103. 8 Q6. 9 e(7
UCM-4- 4 17.3 103.1 5,7.1 11
055-4- i 16.7 103.2 103.8 7.4wJ-m-14-3 14 17. 2 104.1 10L.0 ,. )9,
05-M-28 28 1T. 2 103.6 86.3 6o
757' PAEAiP and- 257 T O (9il 'i
T0C-S-PT-O* Standard 0 18.4 96.0 23.4 L.70
UC-S-PT-28* Standard 28 17.3 96.2 6 5.-9 4'
*See Figure 26.
3 65
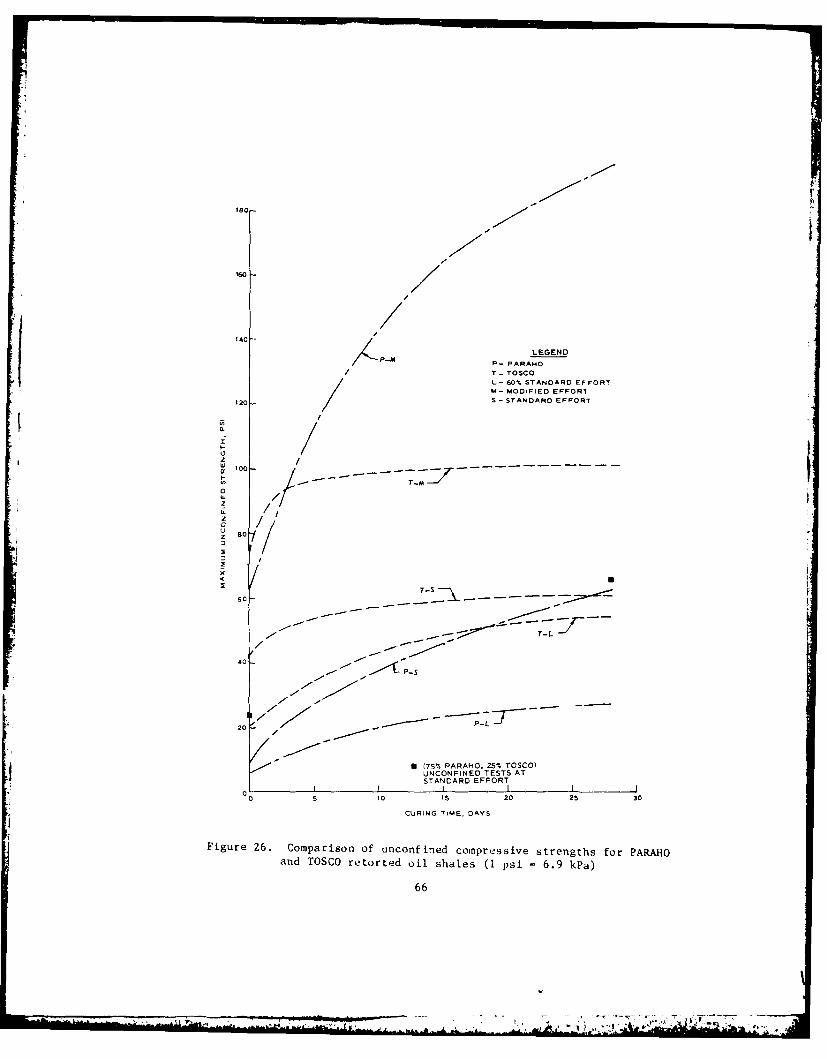
160
ISO
/.
140 -
LEGEND
P-M P- PARAHO
/ T- TOSCOL- 60% STANDARD EFFORTM- MODIFIED EFFORT
120 S - STANDARD EFFORT
/0.
I
I--zw 100-
I-
0
U 0z0. / "
4O / "
x
i~t
I ii
-S
z 80
7i7 /
--
' /- - -- ;: --
40 P
8 (75% PARAHO, 251 TOSCO)UNCONFINED TESTS ATSTANDARD EFFORTI I I I I I •
0 5 10 15 20 25 30
CURING TIME, DAYS
Figure 26. Comparison of unconfined compressive strengths for PARAHOand TOSCO retorted oil shales (I psi = 6.9 kPa)
66
! -* " -- , 1 .1 - , .i.-- - -'. -l -_i l i , ' - . ~ -
ii- .fi

Unconfined Compressive Strength, psi
PARAHO TOSCO PARAHO (WCC, 1976)Copctod d od ddEffort 0 28 0 28 28 at 123 0 F
60% of Standard 5.7 27.4 19.5 53.7 150-175Standard 8.2 66.8 41.4 61.8 150-175Modified 61.3 194.8 72.4 104 175-200
The unconfined compressive strength of a standard effort equivalent densityspecimen composed of 75 percent PARAHO plus 25 percent TOSCO mixture ex-hibited a strength increase from 23.6 psi for zero-day curing to 65.9 psi for28-day curing (162.8 to 454.7 kPa) (Figure 26 and Table 9).
These results indicate self-cementing characteristics* since the uncon-fined compressive strength of retorted oil shale increases with curing time.The magnitude of cementation is dependent upon curing time and density andincreases proportionally with these variables. The durability of the cement-ing action was verified for several 28-day cured PARAHO specimens by soaking
them overnight (Table 8). These results also show that overnight soakingcaused no strength loss; in fact, a slight strength gain was observed in twoof the three specimens (low and modified compaction efforts). Hence, theobserved self-cementing phenomenon is not due to capillary moisture tension,i.e., effective cohesion.
PARAHO specimens continued to gain strength throughout the 28-day curingtime, and the shape of the curves in Figures 24 and 26 suggest that they arestill gaining strength beyond these 28 days. Although higher densitiesproduced greater strengths, percentagewise standard effort density specimensproduced the greatest strength gains. For the TOSCO specimens, the major
portion of the total strength gain occurred within three days after compac-tion. Perhaps the finer nature of the TOSCO material permits cementationreactions to be completed more rapidly than the coarser PARAHO material.
An examination of Figure 26 reveals PARAHO to be more reactive thanTOSCO, for while TOSCO initial strengths are higher than corresponding PARAHOinitial strengths, yet after 28 days, except for 60 percent of standard dens-ity specimens, the PARAHO specimens exhibit higher strengths. Also, thepercent strength gains for PARAHO specimens are three to eight fold, whileTOSCO specimens only register a 1.5- to 3-fold increase. The 75 percentPARAHO plus 25 percent TOSCO mixture at standard effort density performedpractically the same as the comparable 100 percent PARAHO specimens. Whereasit would be anticipated that the finer nature TOSCO would be more reactivethan coarser PARAHO, this is not the case. Perhaps the finer material deteri-orates upon exposure to air more rapidly, thereby losing much of itsself-cementing potential. If this is true, then the delay between retortingand fill placement becomes an important variable.
Previous unconfined compression tests by WCC (1976) on specimens ofPARAHO processed at the semiworks plant by direct heating and cured 28 daysat 125"F indicate strengths of 175-200 psi (1.2 to 1.4 MPa) and 150-175 psi
* Additional studies concerning self-cementing characteristics are beinginvestigated by the Colorado School of Mines Research Institute under USBMContract No. J0285001.
67
-j6
4 - -

(1.0 to 1.2 MPa) .or modified and standard effort density specimens, respec-tively. By comparison, strengths of 194.8 psi and 66.8 psi (1.3 MPa and 47kPa) were obtained in this investigation for the same compacted efforts.Considering the differences in several key variables affecting cementingreactions, i.e., curing temperatures (125*F versus 72*F), percent fines andgradation differences (14-24 percent versus 3 percent), and the amount of timebetween retorting and compaction (approximately one week versus approximatelysix months) between WCC (1976) and this investigation, the agreement for themodified effort strengths is fortuitous. The differences between WCC (1976)and this investigation favor higher strengths for WCC specimens as observed.
Criteria for assessing stabilization response of soils treated with lime
recommend an unconfined compressive strength increase of 50 psi (345 kPa)after 28-day curing at 72*F between standard effort density untreated andlime-treated specimens (Thompson, 1970). Durability criteria for nonfrostconditions recommend an unconfined compressive strength of 30 psi (207 kPa)after 28-day curing at 72*F followed by 24-hr immersion (Dunlap et al., 1975).Soil-lime specimens satisfying these two criteria are considered sufficientlystrong and durable for use as base course material in pavements. Based uponthese criteria, PARAHO would be judged as a suitable stabilized material,while TOSCO fails to satisfy these criteria. Perhaps the fine-grained natureof TOSCO makes self-cementing components susceptible to deterioration uponprolonged exposure to air, while PARAHO breaks down during compaction andexposes fresh surfaces for reaction.
An important construction consideration for stabilized soils is time be-tween mixing and compaction, termed "mellowing time." The results presentedin Table 8 show that mellowing times up to 16 hr had no effect on resultingunconfined compressive strengths. Based upon these considerations severalimportant design and construction guidelines are evident if self-cementing is
desired:
a. PARAHO and TOSCO both possess seIf-cementing properties producingadditional strength with time. However, PARAHO satisfies recom-mended criteria for lime-stabilize soils, but TOSCO does not.
b. Increased density produces higher strengths. Hence, areas whereadditional strength is required, i.e., adjacent to structures,surfaces exposed to erosion, etc., can be accommodated by pro-viding additional compaction.
C. Mellowing times up to 16 hr have little effect on self-cementingof PARAHO. Nevertheless, experience dictates this time shouldbe kept to a minimum. However, if this is not possible, increasedcompaction effort can be substituted to obtain greater strengthsif the expense of increased compaction effort is justified.
d. For PARAHO, the self-cementing components do not deteriorate
significantly due to exposure to air after retorting. However,for TOSCO this apparently is not the case, as it is less reactive,although finer grained. Nevertheless, logic suggests that exposuretime between retorting and placement should be minimized to maxi-mize self-cementation.
68
. ...
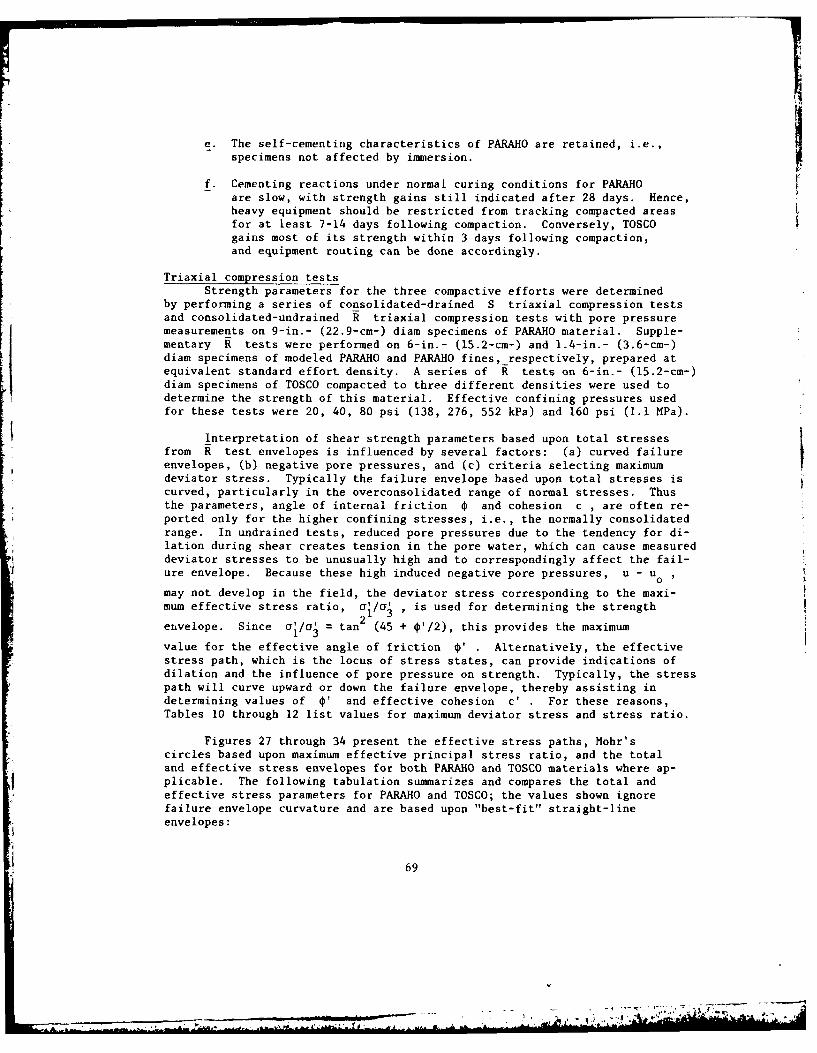
e. The self-cementing characteristics of PARAHO are retained, i.e.,specimens not affected by immersion.
f. Cementing reactions under normal curing conditions for PARAHOare slow, with strength gains still indicated after 28 days. Hence,heavy equipment should be restricted from tracking compacted areasfor at least 7-14 days following compaction. Conversely, TOSCOgains most of its strength within 3 days following compaction,and equipment routing can be done accordingly.
Triaxial compression testsStrength parameters for the three compactive efforts were determined
by performing a series of consolidated-drained S triaxial compression testsand consolidated-undrained R triaxial compression tests with pore pressuremeasurements on 9-in.- (22.9-cm-) diam specimens of PARAHO material. Supple-mentary R tests were performed on 6-in.- (15.2-cm-) and 1.4-in.- (3.6-cm-)diam specimens of modeled PARAHO and PARAHO fines, _respectively, prepared atequivalent standard effort density. A series of R tests on 6-in.- (15.2-cm-)diam specimens of TOSCO compacted to three different densities were used todetermine the strength of this material. Effective confining pressures usedfor these tests were 20, 40, 80 psi (138, 276, 552 kPa) and 160 psi (1.1 MPa).
Interpretation of shear strength parameters based upon total stressesfrom R test envelopes is influenced by several factors: (a) curved failureenvelopes, (b) negative pore pressures, and (c) criteria selecting maximumdeviator stress. Typically the failure envelope based upon total stresses iscurved, particularly in the overconsolidated range of normal stresses. Thusthe parameters, angle of internal friction 0 and cohesion c , are often re-ported only for the higher confining stresses, i.e., the normally consolidatedrange. In undrained tests, reduced pore pressures due to the tendency for di-lation during shear creates tension in the pore water, which can cause measureddeviator stresses to be unusually high and to correspondingly affect the fail-ure envelope. Because these high induced negative pore pressures, u - umay not develop in the field, the deviator stress corresponding to the maxi-mum effective stress ratio, a'/Io , is used for determining the strength, , 2envelope. Since i/ = tan (45 + 0'/2), this provides the maximum
value for the effective angle of friction 4' Alternatively, the effectivestress path, which is the locus of stress states, can provide indications ofdilation and the influence of pore pressure on strength. Typically, the stresspath will curve upward or down the failure envelope, thereby assisting indetermining values of 0' and effective cohesion c' . For these reasons,Tables 10 through 12 list values for maximum deviator stress and stress ratio.
Figures 27 through 34 present the effective stress paths, Mohr'scircles based upon maximum effective principal stress ratio, and the totaland effective stress envelopes for both PARAHO and TOSCO materials where ap-plicable. The following tabulation summarizes and compares the total andeffective stress parameters for PARAHO and TOSCO; the values shown ignorefailure envelope curvature and are based upon "best-fit" straight-lineenvelopes:
69

.i/Material and Maximum
Paarice Total Stress Effective StressCompaction Particle2 2
Effort Size, in. deg c, kg/cm 0', deg c', kg/cm
PARAHO9-in.-diam, 60% of Standard 1-1/2 33.0 0.9Standard 1-1/2 14.5 1.3 32.7 0.8Modified 1-1/2 31.0* 0 32.3 1.9
Modeled PARAHO
9-in.-diam, Standard* 3/4 38.0 06-in.-diam, Standard 3/4 17.1 1.7 37.9 1.1
PARAHO Fines1.4-in.-diam, Standard 23.2 1.7 33.6 2.3
TOSCO6-in.-diam, 60% of Standard 3/4 20.2 0.3 36.7 0.1Standard 3/4 18.4 0.3 35.0 0.1Modified 3/4 24.5 1.4 43.0 0
* Based upon single test.
Typically well-graded compacted gravels have effective angles of internalfriction ranging from 40 to 45 deg for these confining stresses (Donaghe andCohen, 1978; Becker et al., 1972); hence, while PARAHO possesses adequatestrength, it is slightly weaker than similarly graded gravels. These resultsshow that except for a higher cohesion intercept for specimens compacted using
modified effort, increased compaction effort does not noticeably improvePARAHO's shear strength parameters.
These results also show that modeling by scalping and replacement tech-niques (compare 6-in.- (15.2-cm-) diam with 9-in.- (22.9-cm-) diam, standardeffort density) overestimate the effective angle of internal friction by
5.2 deg and cohesion intercept by 0.3 kg/cm 2 . The tests on the PARAHO finesprovide conflicting conclusions, as the 1.4-in.- (3.6-cm-) diam tests show
higher strengths (0' = 33.6 deg) than the full-scale 9-in.- (22.9-cm-) diamspecimens (0' = 32.3 to 33.0 deg), yet lower strengths than the 6-in.-(15.2-cm-) diam modeled specimens (4' = 37.9 deg). Nevertheless, due to the
small quantity of fines in the large specimens, it is doubtful that the finescontrol the strength of this material. Concerning effects of modeling tech-nique, Donaghe and Cohen (1978) have shown that model gradations having aconstant uniformity coefficient Cu (parallel gradation) or variable C,u u
(scalped only) provide the same estimates of the angle of internal frictionfor clean gravels at single confining stresses. Marachi et al. (1969) alsohas shown that for constant C modeling (parallel), reasonable estimatesU
of friction angle can be obtained using smaller specimens. Hence, fromthese considerations, use of scalping and replacement as a modeling tech-
nique is not recommended for PARAHO material.
The S triaxial compression tests on 6-in.- (15.2-cm-) diam specimensof 1-1/2-in. (38-mm) maximum particle-sized PARAHO material at standard
70
Avg

o , o - o
. . .~ .4 . . . . .40
V o4- o~a .44 a c; 'a .o n a
I, I Io
a 4, . 1 'c; c; 04 40. 0. ';-a 0 ' c
44 0.44.4 'a a' 00- 'a 'a ca'' a 44 a
I 0.44,
I n il ii
J 00 00 000 4 -
71

-j S-A A -, 5-04.1 'A -1 -, 0' 0' 0 - o - .-,a '00' 04-1 --4 ~1A.A I' I .. . -
LAG4 I . . A-, .-- ~ CD C: CD 04 0 0 SO A 0. A CD . J
AD 0 CDO CD
0 co A-~42.4' 0' Sn S Sn 10 0 '000!-. Sn.) 1 -1
CD "4-4 CD CD 0. Sn CD' 000 55 05. -~. A,
-2 0551 AD CD AD CD 0 A 0 A C ~7 0 0 04
A -CAl
Di .7 ---. 5 CDA- 5. CD-C-C 00,4 ,.- 0 :1CD CD '0 '.5 AD Sn, 0- Sn 0' 00-1 .-. 'C
ADDS- 0- CD A CD CD AC -4 CD 4 <1 A 04 0-A CD0 A 0-4 A 0
0' Sn Sn, '4 0-- 0 CD .0 DS. 0' 0' ~' o 04Sn 044
A AD AS. 0' 01-14- C A 00
o CD Sn Sn Sn --A .-. "4 -. - .-ACACD '0000.4 0-00
~D04j
A. 4 A I00. A CD 0' o .4 Sn 044 CD
A. 4AAAAGAO Si AC CD 0, CD C -A Sn 40
4 OA.AA--.0 A CD-~ CD 000' Sn A A-" C ADGA 0 CD .0 CD
0 ~ GA CD4) 0040 450040
.40.0.11 ADO CD .14 CD A I A A A A A A00001 A A A A
44 .A-~ AD ADO AD AD
A. 0,00 .140 AC AC0 GA~.-0CD. S - CD C CD Sn CD Sn Sn ~CD CD 04 A-
"A ~.40AD AD 04 CD 0 A 40 0 Sn 04 40 0 04 CD Sn 0 0- .1" A C DO "A A..0 CD 04 '4 - CD -'A -4 CD
A. .4 00 4 l.A
0) 0 wA-. 0'
0 A 0 IA..-40< '0004- 0C'A CD 0404 AC 0000 00.7 CAS, --o ---. ADA
400CC 0 0' CAD 00 40 ADDS 00 0' 000020.40<........................'00
0 4000 00000 00000 000000 000.-. 04-~ ~<00AAA-' Z 44
4 AD A
0 0 A, 04 AC OAr, A- OAO Sn (CD 04 0'AC 0' 0. 0 '00.17 -0'04 40040-4 .0 14 0404 Sn 0 4040-404 CD 40 AC 40400 .44
O .400 CD AC CD AC AC A- 0000 CD CD 000 AC 040400'0 00A-A >01 0000= 00000 00000 0 oCADAD
CD 0 0 -440 0 01 0 '0504 4 IOG&I 04004.-. AC -r A 4000 0' CA A-AC 04 040040 4
041 ...................... 0
"I 00'j 0CC A A 4 0000 ~ A 0.04.4 -4 A"- 0.00 0'0 OOA-A 40 40 C 40 Sn A" A AC AC A 0 0 0 0 0 Sn 0 0 0 0
0 5701 CD 0000 CD ,-.oo 40 - C AC
0 '~'L S IA A.A. 0 -~ .40'!-." -0 -4 .700 04 AC-I ACt- -4 05 A-CD> 0 CD
A !CA
0 E~j~.Zj A-~Sn Sn -054 0 004 A', Sn~> 5400400 0000-C
Sn~ 0'0'0' G. 20' 222 0' 4040 Sn Sn I
00041 0 IA-!-- 4000-400 0000 CD-COO A GA.4.1]........................44
004 00-4"0Sn '40400 0 40400-CD
"A-Al .0,040.04 04 040.0404 0404040404 00~1~0
0 000 -o 0
-A 0 0 A-.00 -o 0'.A 0 4000 0 0 0 0 ~ .
20 0 A-CO 00'. - oct 0LA.. 0 0 00 I0 GA-ADO 0
0 0 4104A-' 0 0 A CD 0-C A-S 000
CD 01051 0400 4 040.4 4
0 A A I 0 0 o 000* 0 00 A 0 COCA 0 OA 00 0 000-C 0 CD
A A I A 0 A 040400 A 4 A A C A 04-410.4 4"0 0000 A 0 A A A A COCOA C A A A A 400Z 04 CA 000 .4 ADA-S AS AD 04040400 0 AS CISC 000
A A A A 4 A A A A A A A A A A A A 4 A A 0 0 0.4 AS 040,0104 .1 000 .1 .40.4-1
-4 A-~ A-?
0 A-S A? A.
..
..
4
AC-CA AC A A-AD 000.-A ACAC AC AC AC AC .40.40A -. A A 4 A A A A 4 A A A 4 A A A A A A A A
00000 0 00.00 00000 0 000.0.1 04A 4 9 A 4 A A A I A A A A A 4 A A 4 A A
140101144I01IA2 .01 lOA-104l0110A- 124101101101104 InS 104101I04I44 *
72
-CD--- -~ -~r:v~ i~A-~
- CD .~ - - - . - - - - -, -- .4 * - - A A A 50-040

- . . . . . ..
I0' .-0.' n .r .44 . . -. . . .
I t
" , I 0.: I Z. - 4.I 00 '. -
4.5 .4 4 14 ; .4 0 0 0 0; .- I c c -' Z D' 2' 0' -. , . ; / . : " '
.I . ' : I 4 . ] ' '. . 4.4,: , Zr,] . .. . . .. .0
. . . .. . . . ..
0 '. I 4 1.O_ -o5 ,- O Sc Zo or :: . . . . . . . . . . .;
I.. :I. .w0.
.. 4 '.. - :.-,
o,5 1 0 "Z. -I0 4., .. " 0 0. 0.- 0.o 1 0.1 .4..4" .- , o 4 0 , . ..
73
-. , , _S- .~~~I lu-4 -- p *5

041
u 0.
41
Lu (rw M I
t 0.4-40
U)
U0 00L CCz t0 -U LO Nz V
u C 0 r_
> Q)0
oJ0 I- 0 ~ J > U Z(rL
u- > 4-U--J LL LL
LL LL L) LiV
0 cr0 I>
z 0 -00 < CO C) >N 0
w-< u

c1
-u R
ca
0~
+I W
Il Z Z z < < 0 I0 Z L J zA LA4
00
2 2
0.. 0 0 U)
0>>
Z-1
1L I I I I I oa 0 00 0)
x KM x x 1 0 (n'a1 a0 N 0 N < oLL. Ifl
>*
Z o
le 0N
0.* 000 0 0 2
LL0- 0 01- a L(n l') 0 0 0 i. (
U)zU < 0
0?7 W 0)
0 z I
1 N 0 Q <
75
F- to C

(n ry a
0 U cy1LL uL
0 0
o zi u
LL w; ccL w
m 2,n-4
(( no
'n

c14
-U 0
0
,
(3)
0
00
w 4.4
o a
of)
W~L cZ1 0
I OC < L44,< U-l- W(r
a w 0
0 L
0 0-0 S 0
(I w 0
V4) N'S3U.LS kiY3HS
77

-0
0m
X 0Iuo
Lu
LuA
0-oc<
(nEn< U) 4-
Ln -
(r Iw 0)
Ld LL
z z
00
- -Y
1
78
AAL

"4414 0
N
o C)
00 0
cr UU U
o 0 )0
Mr >
II U-
z U
<( W
-z LL
Icr
W LL X1
WW
-4F
cu 0
>11-/D- '%ZLLL H1'
I-79
I~ 1 - ~JA
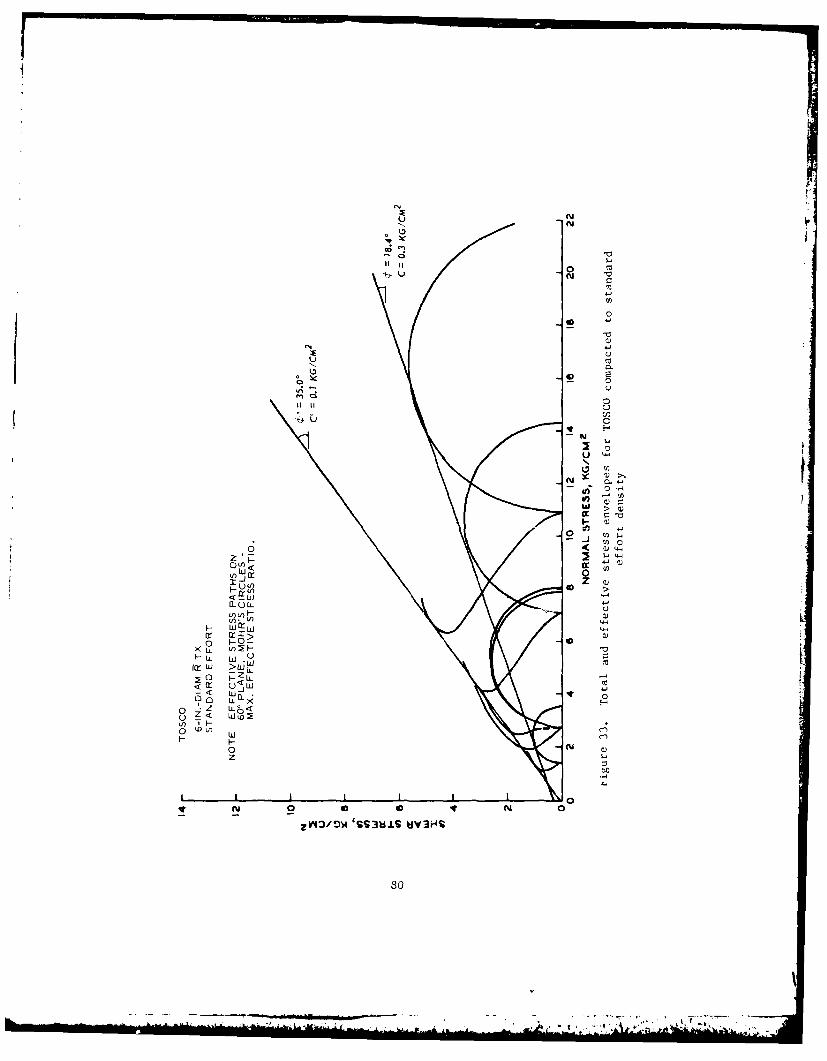
U AAN
CL
U
44
o-2 Lo0n
* C)< ~
u') LJ cr01: -. 1
4-'U.LLI LLI U,
I- -
0 z L
00zz
0r 0
08
Xt. )L -UL.
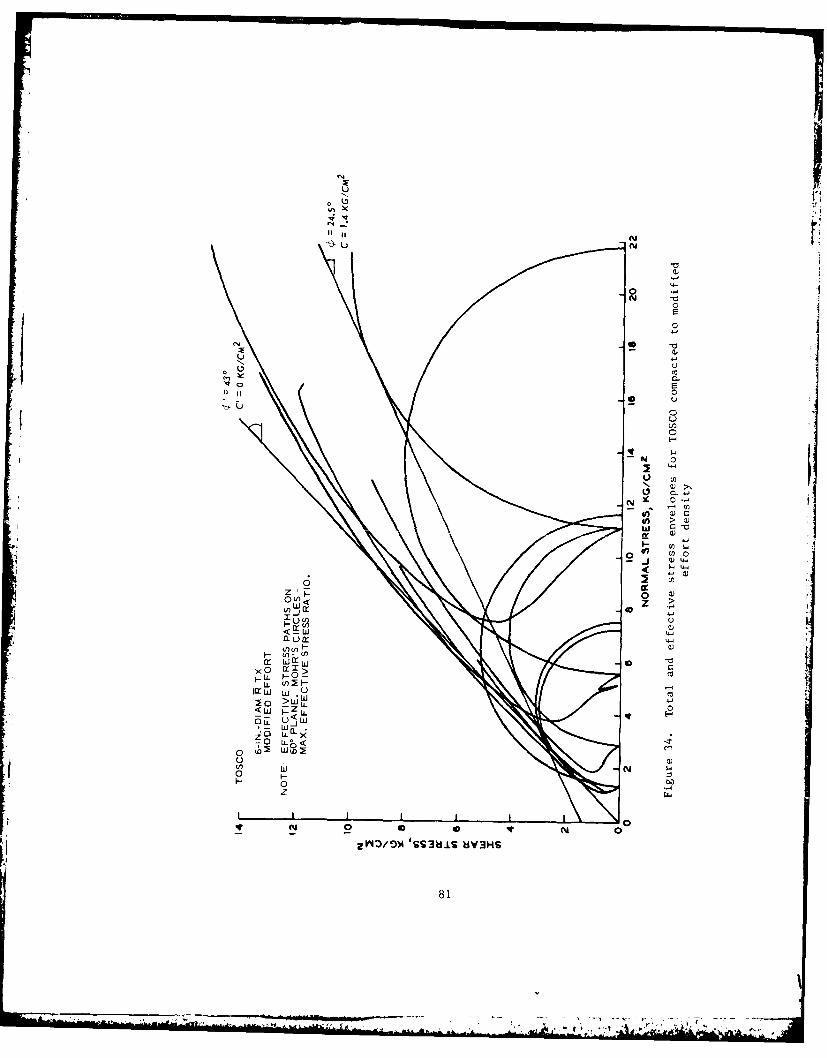
u
~Yu N
00
NN
UU
erj
0w
14
Lo
o~n 0
U
X0 O >ro L - -
0 0 LiL<- 0lZ
< L
0. n
-.,...1. *

density conducted by WCC (1976) provided strength parameters of c' 1.95 kg/ R
cm2 and ¢' = 34.2 deg. These values agree quite well with those obtained
in this investigation.
The TOSCO strength parameters summarized in the preceding tabulationshow that modified compaction effort is required to significantly increase thestrength, and little improvement will occur using only standard effort.Nevertheless, these results show TOSCO is amenable to increased strength withincreased compaction effort, while PARAHO is not.
The strength parameters listed for TOSCO are quite reasonable when com-pared with those for a dense sand, i.e., 0' = 40 deg. The R triaxialcompression tests reported by Dames and Moore (1974) for specimens with drydensities of 85 to 90 pcf gave total stress parameters of c = 0 and$ = 20 deg. These values agree quite well with the total stress data ob-
tained in this investigation ($ = 18.4 to 24.5 deg).
Figure 35 presents the volumetric strain versus normal stress on 60-degplane for the 9-in.- (22.9-cm-) diam S triaxial compression tests on PARAHOmaterial. These results show that only at modified compaction equivalentdensities and low confining pressures is the material dilative (i.e., curves2 and 4), and that the materials are contractive for all other conditions.Hence, positive pore pressures could be anticipated for undrained conditions.
PermeabilityFigures 36 and 37 presented the results of permeability measurements
preceding shear of triaxial compression tests on specimens of PARAHO andTOSCO materials compacted to densities comparable to 60 percent of standard,standard, and modified compaction efforts. For comparison, pcrmcabilityvalues based upon calculations using consolidation data presented previouslyare also shown in these figures. Both sets of data are consistent and showdecreasing permeabilities with decreasing void ratios (higher densities).
-3Generally, the permeabilities for PARAHO decreased from 10 cm/sec for
-460 percent of standard effort densities to 10 cm/sec for modified effort
densities. In the case of TOSCO material, the coefficient of permeability
decreased from 10- 6 cm/sec to 10- 7 cm/sec as the compaction effort increasedfrom 60 percent of standard to modified effort. The lower permeabilityvalues for TOSCO as compared with PARAHO reflect its finer gradation.
The permeabilities determined from consolidation tests reflect lowervalues due to lower void ratios achieved from higher consolidation stresses.By comparison, permeability values determined by WCC (1975) on 8-in.- (20-cm-)diam specimens of 1-1/2-in. (38-mm) PARAHO material are also presented inFigure 36. These results also show decreasing permeabilities with increasedcompaction effort. However, for comparable void ratios, they obtained con-siderably lower permeabilities. This is due to the greater amount of fines(approximately 30-35 percent after compaction) for the WCC material than theWES material (approximately 8-15 percent fines after compaction).
Generally, materials are classified as impervious if they exhibit
82
*. .*- ...~ .. ~, * - . ....*

22
20
Is
U
W 14z8
S12z0
0 IrI.................. 2
7 8----8 S -
85----6-9 -- 9M16-
V0UERCSRAN ECN
Fiue3. Nra tesvluercsri eainhpfo6 railcmrsintst n9i. 2.-m)da
spcmn4fPRH
83EN
CURVE------------------- TESTrr4 3 N. NO
2I 1 S P 9 2 -1

00
Q)
40w
*0
4
0ccCL
*0
(n
-4
I 0.41
S. a .
en U
5I~4M * 84

-4
4-,
00
0
0 (
Lu~ 0
)0 0
o z4
0~ cc
cc cw IVe
44
0 0 0
ow
a'OIIVU~ OIOA
85
-77-

permeability values less than 10-6 cm/sec and as pervious if they exhibit
permeability values greater than 10-4 cm/sec. Hence, depending upon compac-tion effort, PARAHO and modeled PARAHO can be considered as semipervious topervious, while in the case of TOSCO only modified compaction effort willproduce an impermeable material. For construction of impermeable barriersusing retorted oil shale, material selection would be more critical thancompaction effort. That is to say, materials with sufficient fines can bejust as impervious as modified effort compacted PARAHO. However, based uponthese tests, neither PARAHO or TOSCO materials would perform well as imper-meable materials.
Direct shear testsFigure 38 presents the results of multistaged S direct shear tests
on dry and inundated 2- by 2- by 1-ft (0.6- by 0.6- by 0.3-m) specimensof full-sized PARAHO material statically compacted to equivalent standardeffort density. Comparison S direct shear tests were performed on 3-by 3-in. (7.6- by 7.6-cm) specimens of modeled PARAHO compacted to equiv-alent standard effort density with the results also shown in Figure 38.Table 13 summarizes and compares these results.
The shear stress Tff envelope for the 2- by 2-ft (0.6- by 0.6-m)full-scale PARAHO specimens is shown markedly curved in Figure 38, andthe selection of the cohesion intercept and angle of internal frictionis quite dependent upon normal stress n . In Figure 39, the friction
angle 0' decreases from 57 to 32 deg and 45 to 28 deg as the normal stressincreases from 2.5 to 15 tsf (0.2 to 1.4 MPa) for dry and inundated specimens, Irespectively. Both Figures 38 and 39 show that inundation causes a re-duction in strength, which is most pronounced at the lower normal stresses.Also presented in these figures are the results of 3- by 3-in. (7.6- by7.6-cm) S direct shear tests on modeled PARAHO. For this material,normal stress has very little effect on the friction angle. A comparisonof shear strengths shows that the strength of the modeled material isconsiderably lower than that of the full-sized material except at thehighest normal stress (14 tsf).
Also presented in Figures 38 and 39 are the shear stress, Tff , andfriction angle 0' , respectively, versus normal stress a ff for triaxial
compression tests on PARAHO and modeled PARAHO. These results show thatfor the coarse fraction reasonable agreement is obtained between the 9-in.-(22.9-cm-) diam triaxial and 2- by 2-ft (0.6- by 0.6-m) inundated directshear results, which are the gradations most alike. Conversely, in thecase of the modeled PARAHO, considerable divergence in results was obtained.
The results of S direct shear tests on 3- by 3-in. (7.6- by 7.6-cm) dryand inundated specimens of TOSCO material compacted to standard effort den-i-
2ties and tested under a maximum normal stress of 14 kg/cm2 , as presented inFigure 40, are summarized in the following table:
86
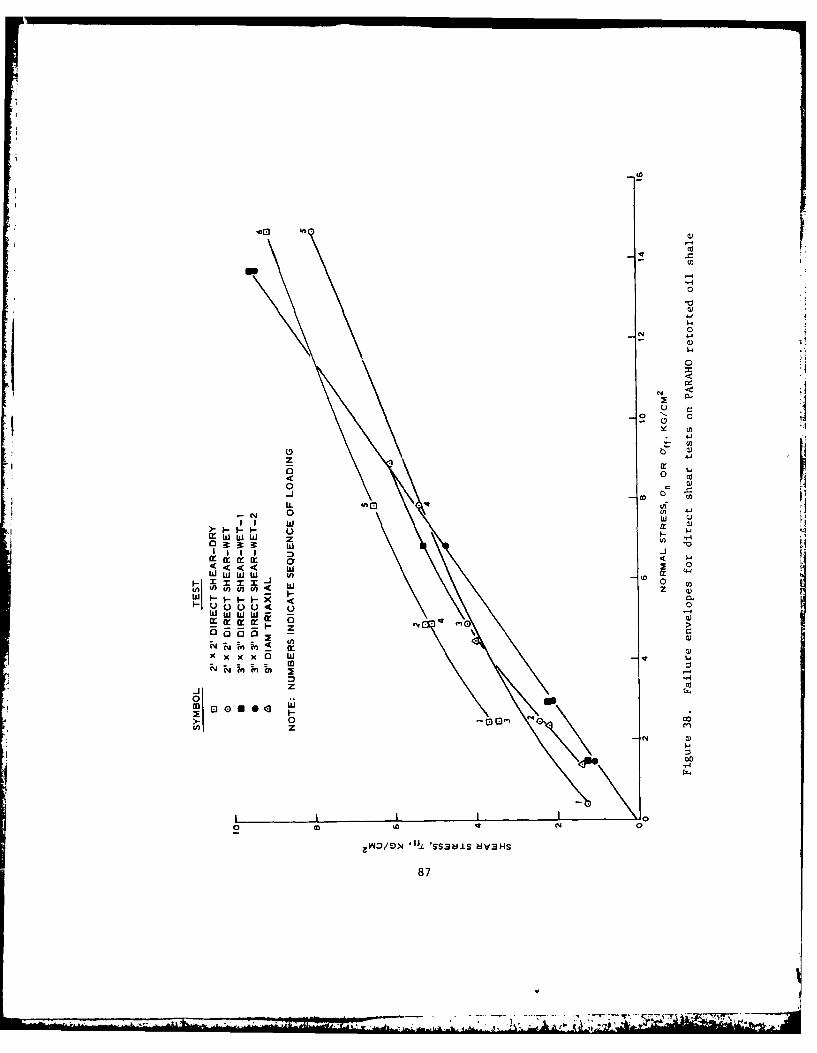
0~
4
0 w0o
0*
0 WN
z U)
wbD
x 0U
- ' T w zAw U)
L3 0
UJWIUJ w (.f x
0 t,
z-j-00
00
ZWOO 'SS3MIS NV:3HS
87

0 0
0 )r )
w~ 0
000
0 D
0<
4-)
00
0d 0 *cc CC) 0- U C)
0 0 0N al
0 U
(C 0
O H H
cN rUN4 0 (y -q
cic 0 ,ON (,
C) c r.ON 7\ oN
a) (0 H4- 4-0 ON
0 0 I Ia) 03 0 0
ON NON
U))
C)(Y ;> HC
Q))
cC 0
0 00(
88

"-4
z z
zz U~ -i
0
C I (r -O
In 0
0 C 0I- ~ F0(-) - I
0o~ * * owi
LI U) U0
0 0
0 0
IuiL
0 0ow -1
w wmI u)z Z6 '-4
U) )X Id I 0
LL. z F--I
< 0
IL. LNI)LZ
00 ~ + + U
4~~ ~ 0Q-m
I. C):3i
0 0 00 00
'NO1101kizi~~ IQE3 N O3 !N
* 0
.g89

0
abc-u-
0
0
E,-4
0
- 0
4-.
4-.
0 m
-. 1 to a)
4.- (0
I- Q4
*0-4
00
C
14
90
til -Air.
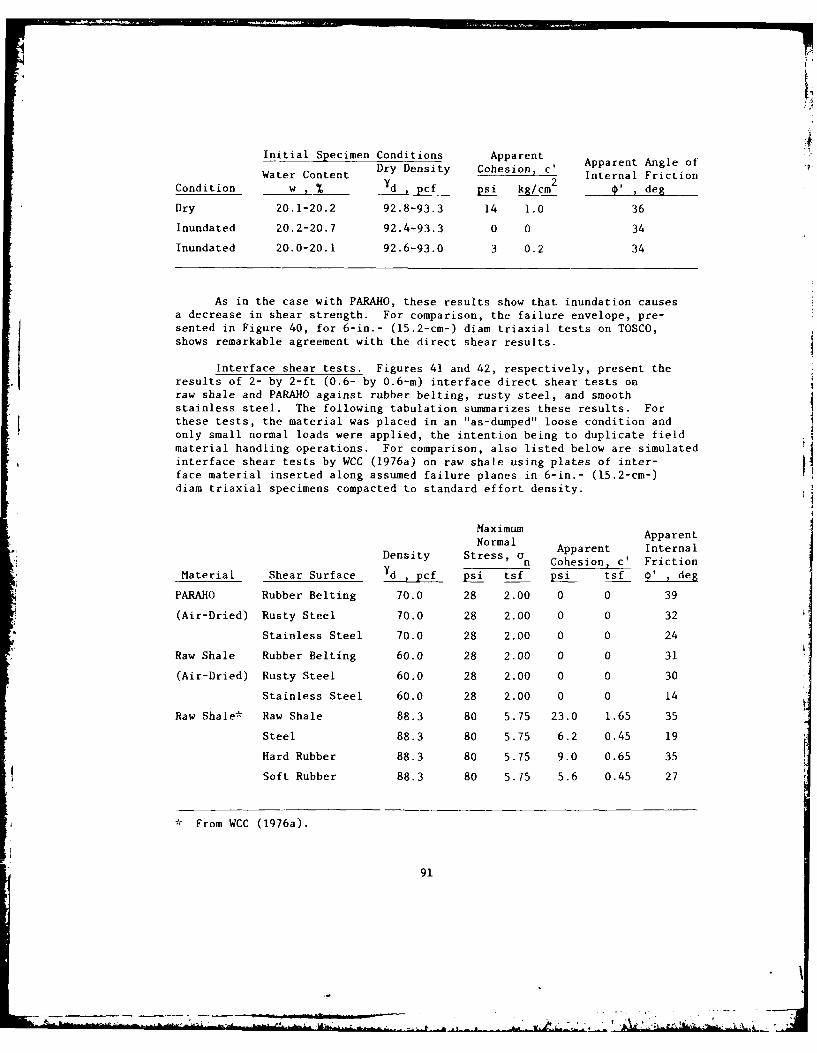
Initial Specimen Conditions Apparent
Water Content Dry Density Cohesion, c' Apparent Angle of2 Internal FrictionCondition w , %d , pcf psi k/cm ' , deg
Dry 20.1-20.2 92.8-93.3 14 1.0 36
Inundated 20.2-20.7 92.4-93.3 0 0 34
Inundated 20.0-20.1 92.6-93.0 3 0.2 34
As in the case with PARAHO, these results show that inundation causesa decrease in shear strength. For comparison, the failure envelope, pre-sented in Figure 40, for 6-in.- (15.2-cm-) diam triaxial tests on TOSCO,shows remarkable agreement with the direct shear results.
Interface shear tests. Figures 41 and 42, respectively, present theresults of 2- by 2-ft (0.6- by 0. 6 -m) interface direct shear tests onraw shale and PARAHO against rubber belting, rusty steel, and smoothstainless steel. The following tabulation summarizes these results. Forthese tests, the material was placed in an "as-dumped" loose condition andonly small normal loads were applied, the intention being to duplicate fieldmaterial handling operations. For comparison, also listed below are simulated
interface shear tests by WCC (1976a) on raw shale using plates of inter-face material inserted along assumed failure planes in 6-in.- (15.2-cm-)diam triaxial specimens compacted to standard effort density.
Maximum ApparentNormal Aprniyrs Apparent Internal
Density Stress, Gn Cohesion, c' FrictionMaterial Shear Surface Yd , pcf psi tsf psi tsf ¢' , deg
PARAHO Rubber Belting 70.0 28 2.00 0 0 39
(Air-Dried) Rusty Steel 70.0 28 2.00 0 0 32
Stainless Steel 70.0 28 2.00 0 0 24
Raw Shale Rubber Belting 60.0 28 2.00 0 0 31
(Air-Dried) Rusty Steel 60.0 28 2.00 0 0 30
Stainless Steel 60.0 28 2.00 0 0 14
Raw Shale* Raw Shale 88.3 80 5.75 23.0 1.65 35
Steel 88.3 80 5.75 6.2 0.45 19
Hard Rubber 88.3 80 5.75 9.0 0.65 35
Soft Rubber 88.3 80 5.75 5.6 0.45 27
* From WCC (1976a).
91

SYMIBOL. SHEAR SURFACE
o RUBBER BELTINGRUSTY STEEL
o STAINLESS STEEL
1.2
U
.4
0
0 0. 2162. .
NORMAL STRESS, an, KG/CM 2
Figure 41. Friction envelopes for interface direct shear testson raw oil shale
4" 39-
PARAHO SHEAR SURFACE
U
0.
ILI
v~0.8
0
00 0.4 0.8 1.2 1.6 2.0 2.4
NORMAL STRESS, an ",G/CM 2
Figure 42. Friction envelopes for interface direct shear tests on PARAHO
retorted oil shale
92

These results show the decreasing order of friction angles to be rubberbelting, rusty steel, and stainless steel for both the PARAHO and raw shale.Despite testing differences, WCC (1976a) results also indicate that higherfriction angles exist with rubber than with steel and the values of frictionangles are somewhat similar.
Repeated direct shear testsThe results of 3- by 3-in. (7.6- by 7.6-cm) repeated direct she .r tests
on modeled PARAHO and TOSCO compacted to equivalent standard effort densities
and sheared under a maximum normal stress of 14 kg/cm 2 are presented in Figure43 and summarized in the following tablulation:
Initial Conditions Apparent Apparent Angle of
Water Content Dry Density Cohesion, c' Internal Friction
Material w % 'Yd , pcf psi tsf 4' , deg
PARAHO 19.8 91.1-94.4 0 0 35.5
TOSCO 20.0 95.9-96.1 0 0 34.5
These values of residual strength are practically identical to those for
conventional direct shear tests: 35.5 versus 34.6 deg for modeled PARAHO and34.5 versus 34.0 deg for TOSCO. Thus, these materials do not develop sig-nificant losses in frictional strength with large displacements as overcon-solidated clays do, because cohesionless granular materials lack platey parti-cles that become oriented with displacement resulting in lower shear strengths.
K tests0
Table 14 and Figures 44 through 55 present the results of K tests oi
9-in.- (22.9-cm-) diam triaxial specimens of PARAHO and 6 -in.- (15.2-cm-) diamspecimens of TOSCO compacted to equivalent standard effort densities andallowed to cure 0 and 13, and 0, 11, and 19 months, respectively. Also in-cluded are the results of two tests on 6-in.-diam specimens of modeled PARAHO
compacted to 60 percent of standard and modified equivalent densities. Theselatter two tests were performed on specimens used for dynamic propertiestests.
For full-scale PARAHO, the normally consolidated values of K rangeo
from 0.19 to 0.38, which correspond to Poisson's ratio values of 0.16 to 0.28,for specimens with only 3-day curing. For comparable specimens cured 13 months,the values of K (loading) range from 0.20 to 0.40, which correspond to
0
Poisson's ratio values of 0.17 to 0.29. The normally consolidated constrained
moduli ranged from 553 to 1358 kg/cm 2 for specimens cured 3 days and from 318
to 1141 kg/cm 2 for specimens cured 13 months. From these comparisons, no
improvement in stiffness was observed with increased curing times. Jaky(1948) experimentally derived the relationship, K = 1-sin 0' for estimat-ing values of K Utilizing ¢' = 32.7 deg (see Triaxial compression tests
0
section), the corresponding value of K would be 0.46, which overestimatesthe experimentally obtained results. o
93
;ADAOB2317 ARMY ENGINEER WATERWAYS EXPERIMENT STATION VICKSBURG--ETC F/G 8/7BEOTECHNICAL PROPERTIES OF OIL SHALE RETORTED BY THE PARAHO AND--ETC(U)NOV 79 F C TOWNSEND, R W PETERSON H0262064
UNCLASSIFIED WES/TR/GL-79-22 NL
moEEEEEEEEEEEE/l///l/ommmmllllllllllIl
IIIIIIIIIImomhEuEEE-EEE-

12 "
TOSCO * PcIMU 4* a SPECIMEN I
SPECIMEN a
IN
's I Uso 4 S 12 16 20
NORMAL STRESS. O.,. KG/CM2
12
PARAHO 0 SPECIMEN ISPECIMEN 2
'VI
0 4 6 12 is 2NORMAL. STRESS, a, , KG/CM
2
Figure 43. Residual strength envelopes for repeated direct sheartests on modeled PARAMO and TOSCO retorted oil shales
94
U =

*0 0
,T OW l -4 0 1c nt-%D. ~ 1e~1- UN OUN rits 0%' fn co 'O o .a
01 "1 _zr04 W 0fI ND 4 ON ' 0.40'-4%0 141- Et
o .w.4'4C ) .4
41 0 vC 4 U +4o'10\ m- 0 3 LC D&
d ~ ~ ~ ~ ~ ~ ~ ~ ~ ~ ' 14- u5 V VN( l " H.iciNcu zI4, >Z:! 8 8 8 8 86 6 8 8 664'.
0 *~ o~u'cosou 0..1 0
41j No H 0.Ch 0 t-- 'A-, 000 .' j - U1; 10 .
41~V +1 00 0 00 00 0 0
4) Cl
10 ~ ..0g \DUU\U oe \ 0U1r0 0 4- J Go11t v'
CJ 0 0 000000000 000000000 4141 4
0 411.2
U)U
S..~~~~S C;U'CJ.CJ*-to 0 11
4- 0 +)A 000000000 000000000 4,44
0O 0.
0c
0 .4 0~ 411a '0 00 0 0 0 00000000 Hl HCh0 H .. o Haar4U 4c
ul~~ 0 1 o- . 4U)) Il41 d0~ ~ 0 t t
coc a\ O l-lHOm'00 0M0O0%O0-4 w..4 0 4t
E. 0 $Uw41 -0$2 0 1
0 ) E-l. Zb& Q r. c4 '000.4
0e 0- N 'AH'C J-. 0H -$1t~'f 0M .~
C\, Cl.441o ID 0 4c oNi- -Hr4Cjt nMc , - '
U)' W 4 Ul 01- 0.0 O
1 0 0H1 C I 4~ ..
414 411 c.H CJJ ,' ~ '5CJ.d I0- ~ 0. 110 n-I O O 'H. 1(' OHOC'JH- 0N -4 f'014 Cj 4 U.. 0 k W
414.4.'0 '45. 414 40
414 0 0 0 .. )0 40 4'V.
0 4Cj4 41 4'041 1 0
w 0 I 01.. 4141,0 H0E.-4 4 J)4 S. .O 4 4-
J\ 0\ w 0 4141n
a) 0 0(U~
S4
95

N
4) a n 7 C~jCm( 0 t- (n n - 4Nu 7O .'Ci,-4 -a 0 0
ffl CI CiG ) % l\ 0 4G 0- o.* 0 t^ 14 ('U
t. t 1-l- .41 U\ US..I t- t.- its (vjC44>~ - CUj 41
0
Ot 4 (it o V - \D2 co\ 0N - - - n.* 4 srt-s- t-u
00000000 00000000 0000 00
Ea
00 \-as t 0 O 0 1 -0 0 0 4 t- %A N2 W - 0 H -4 1-.-
04 0000000000000 0000 0
t,
c - 0\ -,&N " NN.ti (:Y\ NN N .4 g-*\ A - -*\ 0 m 11t- ('I0 Ss4I1mC -C .C C
(n, 05~ 000000000 000000000 00000 000 .
H _:r t- +0 : - -,o - ~ ,r-U
En 0 41r
~0414I
0 N -4 en N 1 -- D 0 N ~ ( n' ~ O- Z00 -sr-Im 0~ 0
0HCJ 41
-4 H D - \N C) 0 t- -H'- 4-O5.'M 0 5.('I (n -1 O (r\t to4 H4 N~ H4 1 N H- -4
En1
41
Hd 41 -4 0
41 Q20 I . .
4)+ 19 H H
10/ 0\.
44
96*
I H

0.4
0o '- 10t D4~ -cOH ~ c t0.- WWDCJ-C'
co 4- co U\ 4~ u~ \U'D 043* Lr\0c 'Dm m~~()o o 0\ o0 140% , o~
041
Id,C.) 00 C)00
; H 00 00000000 000O000000
A1 00 000000000 0000000000
A9
U) 0 0r-IO H0 0 U 0- f3 V cto - ) (\ 'j G - \ 0 \~*~ H \ 1)t\ T rC ODcA C4 cu
,a WHO C'J C * s\ H C Jdo010J 0 C 4C U\4) 0 .?\ rf D e-q t-.~. - t- f
CJ2
0 (\ O Cj 0 0 H 4H4H. OH C y)(n 00 -H-4 A - M M
14 011 - 4t CjL\_I 0 N 0-T l - - 1
H ) IgE- ~ In~0 O0-~**4- mtOc3so'
M-4 EmcEl
~s~ - 0uC~ 0H('HC-1i%~ ~014O-Hti97~

L..
qj 0
C: OXCJ' 0 1 0 CC '0 Ci v-i- 1. Uil O' CU Ci v-S. .-4C1 101C 000'. 000 0 0'.'. 0 O'(D~ s 4C 0 0000
Q))
OJ 0
C m oooooo 0000000 oC )C 000000060
4d 000000000 000000000o 00 0 a00>000,
0 t' 0 ,-,1.
.'~0 0000 0000 000 0000 000 0000
0 0C 4I v- " l -~- 1 0 Q 40 0H iCQ0 00 0-4 04-4 C\v-i(
-4 -4 -
': cjo
40, -I I I Io -H0.0C 0C.0".- 04 9 0-i- C E.O04 'C.4
C. C~ v-I Ci98
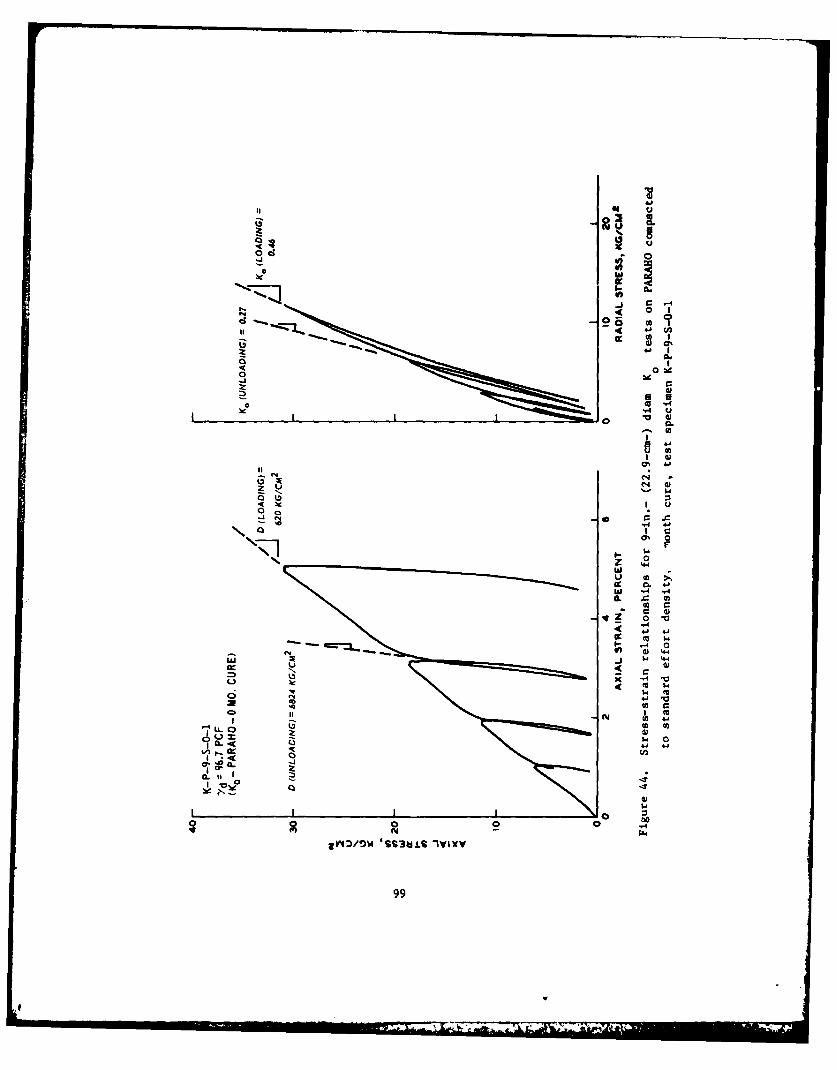
414
0 w d
g 41
00
-J 4 1
w 41
0.V
C44
I 41
,4 L*4 4-
41
ILU
0%0
XV4 1'31 'S U S .W
99

0
9. 0
0
o 0 ,
ow
00
4-4U
Ul,
"1 0'
00
-4 0
o co 5.,- U
0' '
o- 11.-
0 00 0 0NI 0
1000

0
44
U aN 0.
(03
0w 0
00 U)
Q) CL,'
4o u
4 Cl
44- 0
w -40 .44
W 41I a 0 )
to -0.
-4
* 0
L-- 0
LAa W
C0 11 I0
-J-Ao - S3W-Lg IVWX0
101- 4

41I
00
0 0
in U
0 -
4 1 1
4 N
4. j I
00
"a
O 4
o o4 (M 4J a
U -L to
r- CL
CL 0
o I- ~*'-J -31 zS~lL IIV-
o - 102

0
*0 'D
It
t 0 rN E CLU
to
o I
S4 C
4 N o )
*0
II w
z 4 4
c 0 4-4
0 Ill .,4
u}u 4I
1 I
100
* 41
-n u
0.]
It
S 0 '0
103
---- -----
... ~~~~N ........ .......

0
'II
-,Ia
41 ((1)
Z C-
4 4
N 4 4
0 Ir c .I~ Il 0 -0
01 U 0 N 0
-4J >
0 LO
0~~ ~ ~ ~ + o"-4aHL -v
CIO 4-
104.

sU 0
0 te
'N4
I)CC
Cj I-
o 0~
co ao
I I 1
05

0
d4
4.0
ad o
0 *1 064
4 C C
C44
z v
w 00-IL _j
100.

UOU
C gl
*~ 0I-
0 Ca;
4 I1
.4.4 j.4
aa
Uh )-'I I N
I~~ 4p.L )is(
4 Z z 4
1070

4-,
0
cc u
u
-4 4
to
d ""4
0 'Cg
L) 144
114
L -
| 0
.4-
clC. a: C)
*00
10804L,"
L, I - Iu
100

00
E.l
0m
0 aoj 0
41
1 0
o 0 4
w 4
4
IL
40 -4 50 )
L))a a4to "0aLL
uL o
'Sc wfl
QI Li
0 bo
109
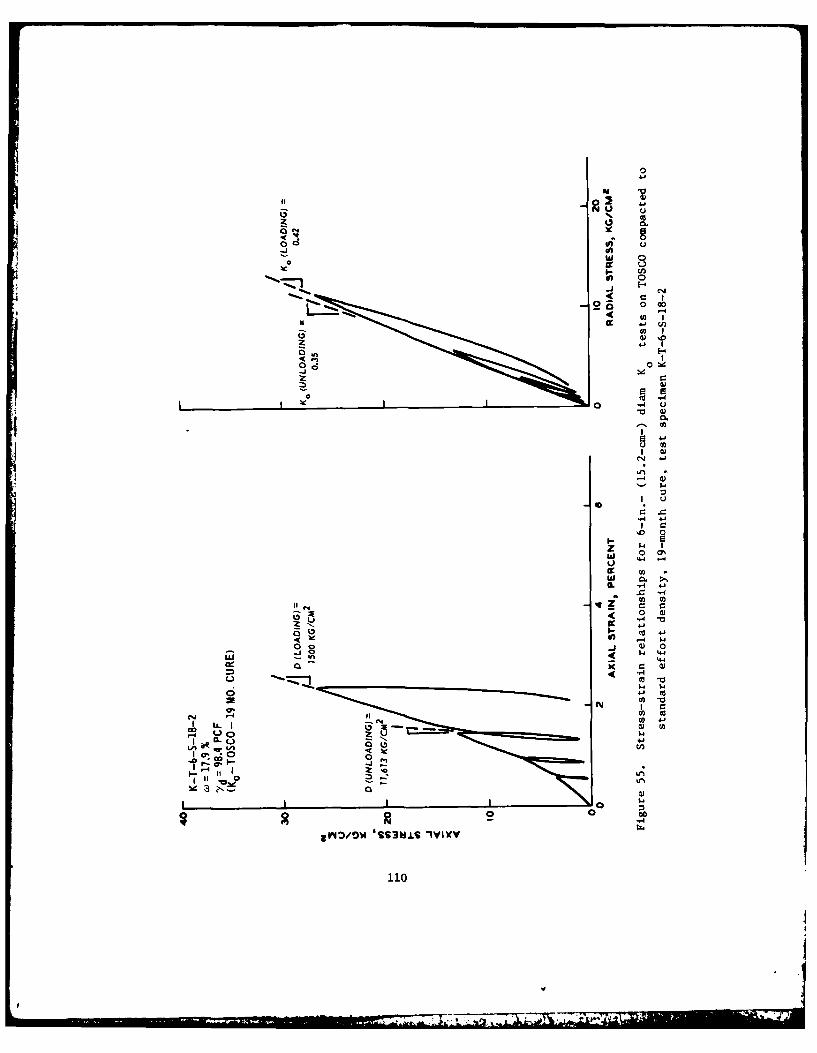
0
00 err
00 0
-1 10
0 C:; 0 1.jJ
4 4 u
4
0. u= C,4
w Cu 44cc 0 ;4o m ,
00a
1~4
an -4 w
J )W4 4.4
0
CL. 41 4.
I Go
110~
A i_ . -4
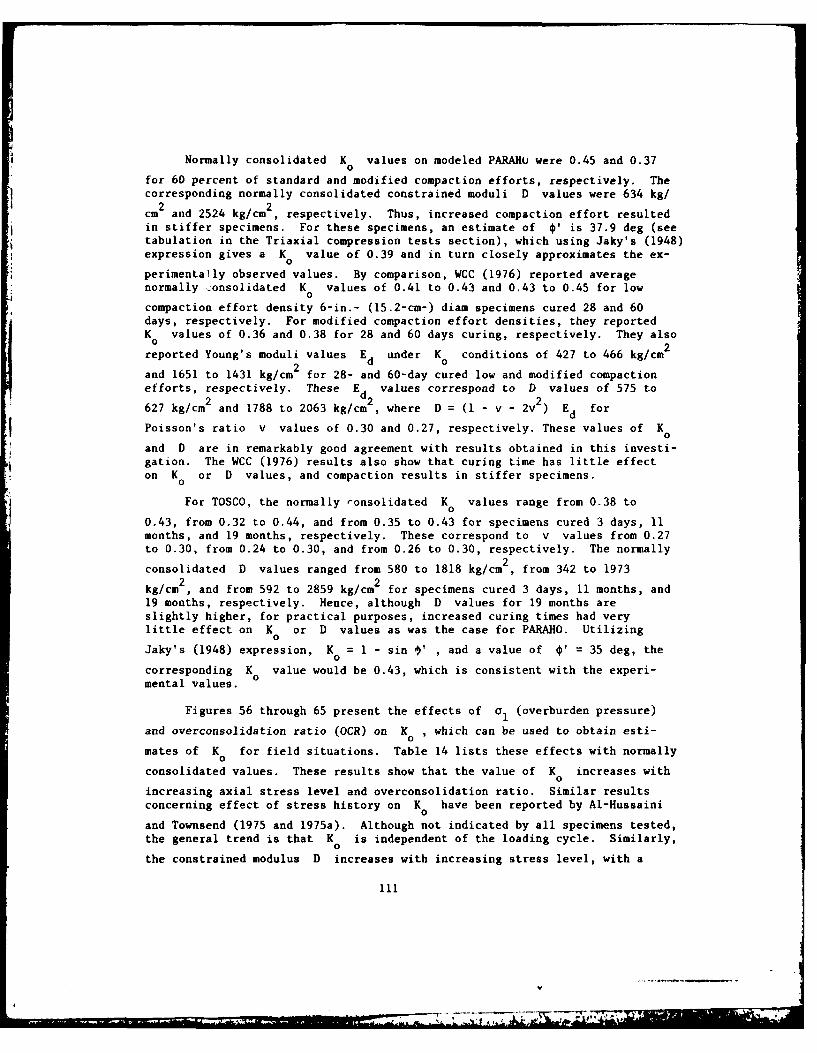
Normally consolidated K values on modeled PARAHU were 0.45 and 0.370
for 60 percent of standard and modified compaction efforts, respectively. Thecorresponding normally consolidated constrained moduli D values were 634 kg/2 kgc 2
cm and 2524 kg/cm , respectively. Thus, increased compaction effort resulted
in stiffer specimens. For these specimens, an estimate of *' is 37.9 deg (seetabulation in the Triaxial compression tests section), which using Jaky's (1948)expression gives a K value of 0.39 and in turn closely approximates the ex-
perimenta!ly observed values. By comparison, WCC (1976) reported averagenormally -onsolidated K values of 0.41 to 0.43 and 0.43 to 0.45 for low
0compaction effort density 6-in.- (15.2-cm-) diam specimens cured 28 and 60days, respectively. For modified compaction effort densities, they reportedK values of 0.36 and 0.38 for 28 and 60 days curing, respectively. They also0
reported Young's moduli values Ed under K conditions of 427 to 466 kg/cm2
and 1651 to 1431 kg/cm2 for 28- and 60-day cured low and modified compactionefforts, respectively. These Ed values correspond to D values of 575 to
627 kg/cm2 and 1788 to 2063 kg/cm 2 , where D = (1 - v - 2v 2 ) Ed for
Poisson's ratio V values of 0.30 and 0.27, respectively. These values of K0and D are in remarkably good agreement with results obtained in this investi-gation. The WCC (1976) results also show that curing time has little effecton K or D values, and compaction results in stiffer specimens.
For TOSCO, the normally consolidated K values range from 0.38 to
0.43, from 0.32 to 0.44, and from 0.35 to 0.43 for specimens cured 3 days, 11months, and 19 months, respectively. These correspond to v values from 0.27to 0.30, from 0.24 to 0.30, and from 0.26 to 0.30, respectively. The normally
2consolidated D values ranged from 580 to 1818 kg/cm , from 342 to 1973
2 2kg/cm , and from 592 to 2859 kg/cm for specimens cured 3 days, 11 months, and19 months, respectively. Hence, although D values for 19 months areslightly higher, for practical purposes, increased curing times had verylittle effect on K or D values as was the case for PARAHO. Utilizing0
Jaky's (1948) expression, K = - sin ' , and a value of 0' = 35 deg, the0
corresponding K value would be 0.43, which is consistent with the experi-mental values.
Figures 56 through 65 present the effects of 01 (overburden pressure)
and overconsolidation ratio (OCR) on K , which can be used to obtain esti-o
mates of K for field situations. Table 14 lists these effects with normally0
consolidated values. These results show that the value of K increases with0
increasing axial stress level and overconsolidation ratio. Similar resultsconcerning effect of stress history on K have been reported by AI-Hussaini
0
and Townsend (1975 and 1975a). Although not indicated by all specimens tested,the general trend is that K is independent of the loading cycle. Similarly,
0the constrained modulus D increases with increasing stress level, with a
111
-F --- w---I *. - *t

40-
TEST NO.: K-P-9--0-iIt IST LOAD-UNLOAD CYCLE6 2ND LOAD-UNLOAD CYCLE
30 0 3RD LOAD-UNLOAD CYCLE& 4TH LOAD-UNLOAD CYCLE
20
NORMALLY CONSOL OA TED
00,2 0.4 o,4 0.6
COE'.FFICIEFNT OF EARTH PRESSURE"
AT REST, K.
It
<V
WA,
00 0.2 0.4 ., 08
COEFFICIENT OF EARTH PRESSURE AT REST, K.
Figure 56. Relationship between axial stress and overconsolidation ratioon g° values for PARAHO compacted to standard eff~ort density, O-month
cure test specimen X-P-9-S-0-1
112
I-I
4l
0q

40-
TEST NO. K-P-9-S-O-2V IST LOAD-UNLOAD CYCLE* 2ND LOAD-UNLOAD CYCLE3I 3RD LOAD-UNLOAD CYCLEa 4TH LOAD-UNLOAD CYCLE
NJ0 NORMALL Y CONSOL IDA TED
20-.4
10
00
0 0-2 04 0.6 0.8
COEFFICIENT OF EARTH PRESSURE AT REST, K.
12 -
I
0
4:
0
0.2 04 06 06
COEFFICIENT Of EARTH PRESSURE AT REST, K.
Figure 57. Relationship between axial stress and overconsolidation ratioon K values for PARAHO compacted to standard effort density, 0-month
O cure, test specimen K-P-9-S-0-2
113
5 '1 .~ *

40
TEST NO.: K-P-9-S-12-2V 1ST LOAD-UNLOAD CYCLE* 2NO LOAD-UNLOAD CYCLE30 3RD LOAD-UNLOAD CYCLEA 4TH LOAD-UNLOAD CYCLE
_j NORMAL L Y CONSOL IDATrED
0
Oo 0 .2 0 4 06 O~e
COE FFICIFENT OF EARTH PRESSURE AT RESTt 611
12
4 4
O
0Oz 04 06 08C.oEFrFrCIENT OF ErARTH PRIIIII.1 A7 RrI,' K.
Figure 58. Relationship between axial stress and overconsolidation ratioon K 0values for PARAHO compacted to standard effort density, 13-month
cure, test specimen K-P-9-S-12-2
114

TETN.40P9S1-
V ST LOAD-UN LOAD CYCLE
TES ND LO-UNLOADCYCL30-* 2N3D LOAD-UNLOAD CYCLE
A 4TH LOAD-UNLOAD CYCLE
2
0
4
0 0.2 0.4 0.6 0.8COEFFICIENT OF EARTH PRESSURE AT REST, K'.
Fiue5.Rltosi ewe xilsrs n vrosldto
rai0nX0vle o AAOcmatdt tnadefr
dest,1 etsecmnKP9S14
~115
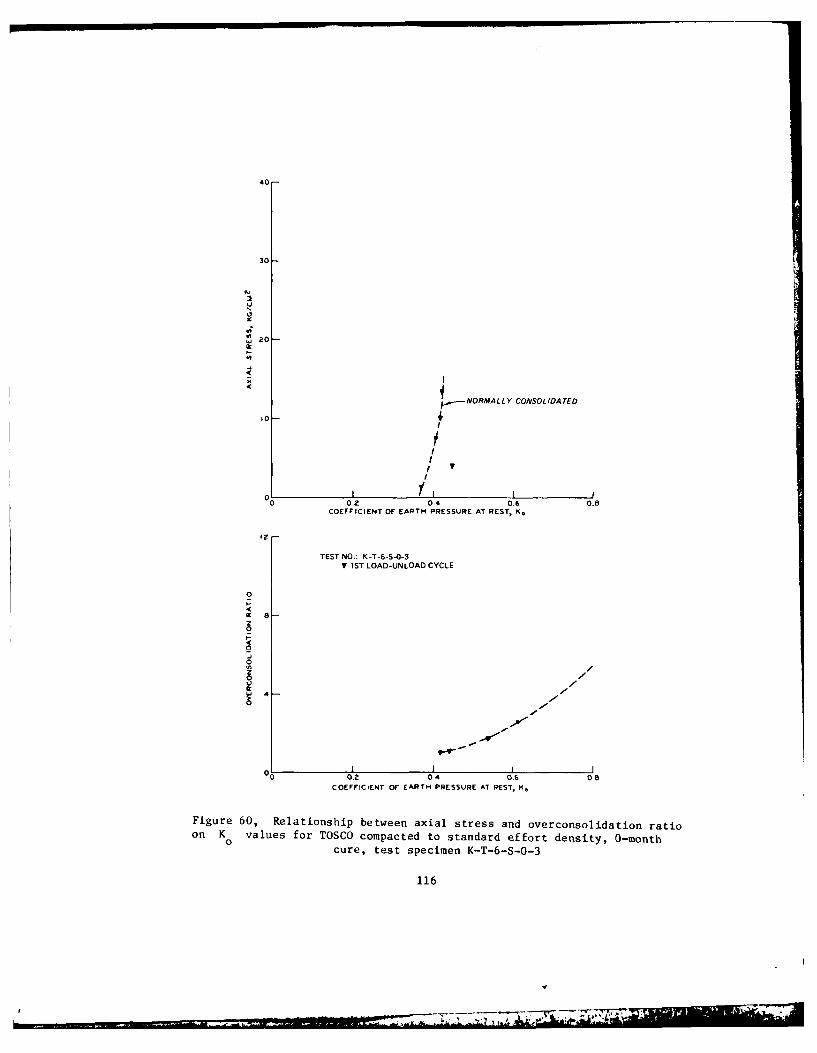
40-
30
U
20
NORMALLY CONSOLIDATED
i0
,o V
0000.2 0.4 0.6 0.8
COEFFICIENT OF EARTH PRESSURE AT REST, IK.
I2
TEST NO.: K-T-6-S-0-3T 1ST LOAD-UN LOAD CYCLE
0I4I
z0
4I
0
-J -
0,o /
4/0
'
o -
0-.1 I I0 0.2 04 0.6 08
COEFFICIENT OF EARTH PRESSURE AT REST, K.
Figure 60, Relationship between axial stress and overconsolidation ratioon K values for TOSCO compacted to standard effort density, 0-month0
cure, test specimen K-T-6-S-0-3
116
V

40
30 2I
I
.4- NORMALLYV CONSOLIDATED
0.2 04 06 0.8COEfFICIENT OF EARTH PRESSURE AT REST, K*
12
TEST NO.: K-T-6-S-0-4I 1ST LOAD-UNLOAD CYCLE* 2ND LOAD-UNLOAD CYCLE* 3RD LOAD-UNLOAD CYCLE
o 4 4TH LOAD-UNLOAD CYCLE
0
4
; ,a
0'WJ 4 .
O.Z 04 o.6 08COEFFICIENT 0F EARTH PRESSURE: AT REST, K.
Figure 61. Relationship between axial stress and overconsolidation ratioon K values for TOSCO compacted to standard effort density, 0-month
cure, test specimen K-T-6-S-0-4
117

40-II
S/NORMALLY CONSOLIDATED
:101
00.2 04 06 0.8COEFFICIENT OF EARTH PRESSLRE AT[ REST, Ko
TEST NO.: K-T-6-S-9-1V 1ST LOAD-UNLOAD CYCLET N LOAD-UNLOAD CYCLE3TD LOAD-UNLOAD CYCLE
OA 4TH LOAD-UNLOAD CYCLE
4
0
4 t
202 04 06 08
COEFFICIENI" OF" EARTH PRESSURE AT REST, K.
Figure 62. Relationship between axial stress and overconsolidation ratioon K 0values for TOSCO compacted to standard effort density, 11-month
0 cure, test specimen K-T-6-S-9-1
118
/
j . . . "U0- " .. . '
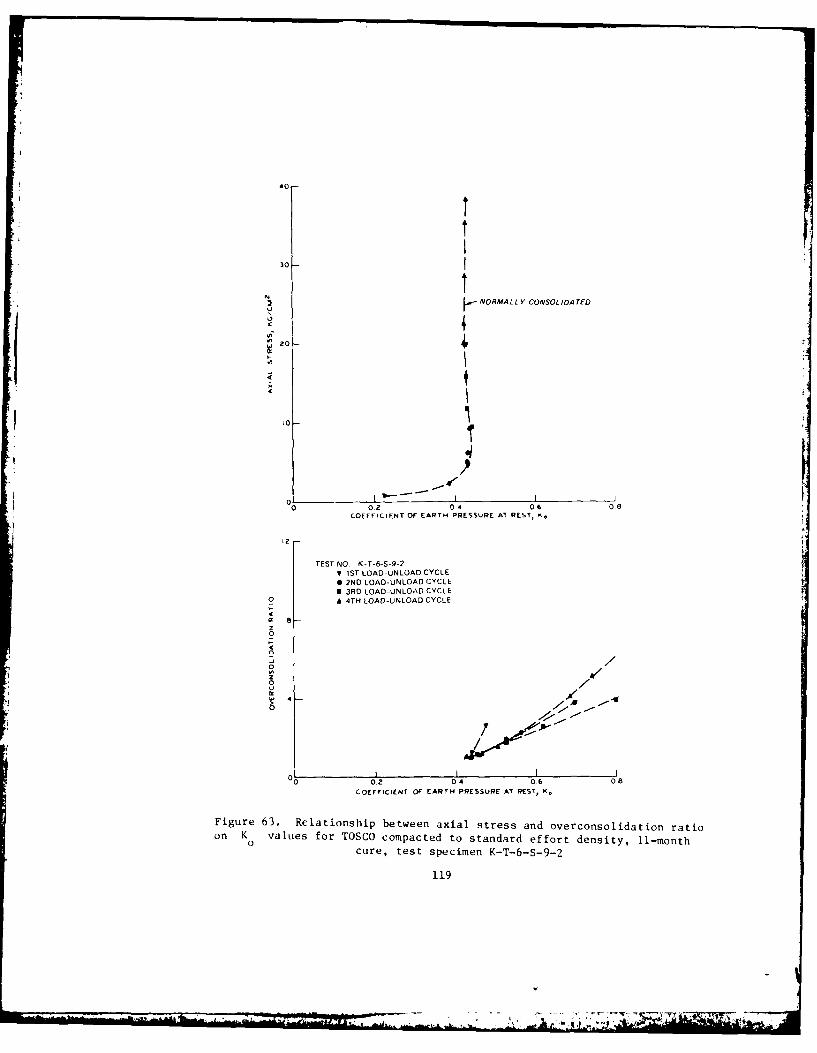
40
Tt30
2 ~NORMA tLY CONSOL IDA rED
0 4
4
4 I
'0 2
0 0.2 04 06 0,8COEFFICIENT OF EARTH PRESSURE AT REST, K.
TEST NO K-T-6-S-9-2
Y 1ST LOAD-UNLOAD CYCLE
* 2ND LOAD-UNLOAD CYCLE
* 3RD LOAD-UNLOAD CYCLEo A 4TH LOAD-UNLOAD CYCLE
0
0
4 V
0//
0 0.2 04 06 08
COEFFICIENT OF EARTH PRESSURE AT REST, K.
Figure 63. Relationship between axial stress and overconsolidation ratioon K values for TOSCO compacted to standard effort density, 11-month0
cure, test specimen K-T-6-S-9-2
119
2:! n
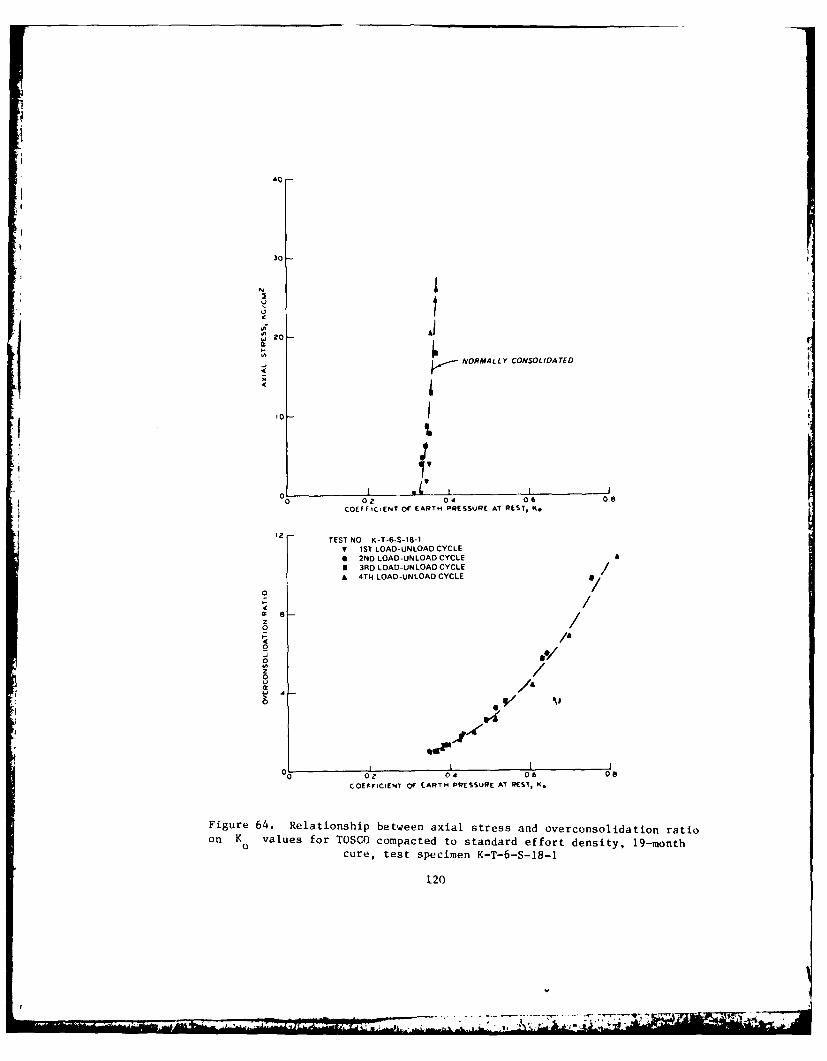
40
30
N
NORMALLYV CONSOLIDATED
.Kf
01
0 0.2 04 06 0.8COEFFICiENT Or EARTH PRESSURE AT REST, K..
12 TEST NO K-T-6-S-18-1
V 1ST LOAD-UNLOAD CYCLE*2ND LOAD-UNLOAD CYCLE*3RD LOAD-UN LOAD CYCLE/
A4TH LOAD-UNLOAD CYCLE 1
0z0
0-02z 0 4 0 6 08aCOEPFICIENT Of EARTH PRESSURE AT REST, K.
Figure 64. Relationship between axial stress and overconsolidation ratioon K 0values for TOSCO) compacted to standard effort density, 19-month
cure, test specimen K-T-6-S-18-l
120
Am.~

40-
30
2z01
NORMAL LY CONSOL IDA TED
10.
'Al
0IFIOEAT 0.!Z'040. 0.8
12TEST NO. K-T-6-S-18-2
Y 1ST LOAn-UNLOAD CYCLE02ND LOAD-UN LOAD CYCLEI3R D LOAD-UNLOAD CYCLE
A 4TH LOAD-UNLOAD CYCLE
0
ES0
0U
q 2
12
tendency to become constant at higher stress levels. The D value is muchhigher upon unloading, and exhibits an increase with increasing OCR.
Cyclic triaxial testsFigure 66 and Table 15 show the results of cyclic triaxial tests to
assess the resistance of compacted modeled PARAHO to seismically inducedground failure. The first test series, performed on specimens compacted to 60percent of standard density, shows that even at this low compaction effort,the material is quite resistant to cyclic loading as high stress ratios andlarge numbers of cycles were required to produce 100 percent pore pressureresponse (PPR). Hence, succeeding tests, performed on moist tamped specimenscompacted to 60 percent Dr to evaluate PARAHO with other materials, show
that at this abnormally low density for field conditions, cyclic loadingcould be a problem. For example, a stress ratio of 0.39 causes 100 percentPPR in 10 cycles for Monterey No. 0 sand moist tamped compacted to 60 per-cent D (Silver et al., 1976), while only a stress ratio of 0.21 is re-
quired to cause 100 percent PPR for modeled PARAHO. These results also showthat the cyclic stress ratio required to cause 100 percent PPR decreaseswith increasing confining pressure, but the practical effect is small. Simi-lar results have been reported by Townsend (1977).
For comparison, Wong et al. (1975) has shown that a cyclic stress ratioof 0.29 was required to cause 5.0 percent double amplitude strain in 30 cyclesfor various soils with a mean grain size D similar to modeled PARAHO at 60
50percent D * The results in Figure 66 indicate that a cyclic stress ratio of
r0.16 would be required for comparable conditions. From this standpoint, themodeled PARAHO at 60 percent D appears to be weaker than similarly gradedr
materials. Nevertheless, seismically induced ground failure of a waste embank-ment is deemed an unlikely event as 100 percent saturation will probably neveroccur, nor will the materials be deposited in such a loose condition.
Dynamic properties testsSince the dynamic properties, E , G , and X , of soils are strongly
dependent upon shear strain amplitude y , characterization requires testing
at various strain amplitudes, i.e., 10-4 to I percent strains. Since, cur-rently no single apparatus is capable of applying strains over this range,typically resonant column methods are used for applying small strain ampli-tudes and cyclic triaxial tests for applying larger strain amplitudes. Thisapproach implies that the small strain theory is applicable and the materialsare linearly elastic. Hence, shear moduli G and torsional strain, y2r6/3L , values based upon resonant column excitation are presumed compatibleand are combined with longitudinal triaxial tests via the relationship G =E/2(1 + v) , and y = eI(I + v) with Poisson's ratio either determined or as-sumed. For these tests, Poisson's ratio was dynamically determined from lat-eral and axial strain measurements using LVDT clamps on triaxial specimens.
Both resonant column and cyclic triaxial tests were performed on modeledPARAHO specimens compacted to densities equivalent to 60 percent of standardand modified efforts. Confining pressures of 14.5, 43.5, and 72.5 psi (100,
122
- - ~v,--

0.5PARAHO6-IN.-DIAMMOIST TAM PED
607. STD
0.4
b6 01 3 ~4.5 PSIb 0
bf+4 0.3
60%Dr
U,
a3 14.5 PSIUn 0.2 :3
20l -
-JU, 29.0 PSIU
0.1
0 1 10 100
NUMBER OF CYCLES TO 100 PERCENT PORE PRESSURE RESPONSE
Figure 66. Cyclic triaxial response of compacted PARAHOretorted oil shale
123

0)4-) 1r-4 U 'l ClC U- \ Lr\H ONir-UM Lr\L1\ +i HL\ C')C C+I H H +-
H O'd
-'
0 O
V 0 $- 0)0 ~0 0O LN01O
(1) En0 ,1 CM -r0 (Y Hi -
Q) 0 () w 0 W'd 0 ) 0.
11 C)ul
00
0i *toO C') -kOLC \ \ rH OOC\ -o 0'a) H -, - - tm .4C )1(' i HCJC C 'JH N U,
Y) $ +,4- 4--C-) U) 0o
0) ±
5-. 00 mrl H ( C) N H C -- t ~H U00H U1 0J N 4
I H F cc Q FO . 0 - z ir- o0 rIurHr u0) -HH HH o- -5.C l U Q0 C)- - - -
Cd z~ U9 0
E-l 0 0
C7 0\ ON C\\C\ a,\O\O a,\
--I .Cj 0E-0
C a)D ho 0
Q- 00 (1
EX --4.U -4 ..-4 H N4-'i 4
*H UH ) c . ).0 C
cj 0o 0] -C'
U U0 Ui
0) *.-4. N 00. )u
NU t---- 6 t 0 C"
C\ \0 - t-- t-C-- t-- to C) C1)
d- ) V HI C) .' ,\ .cd 4-
0. .>", 0
0 0 ]4 -IH N' mC H- C'i) (C H Id OH
* II I Lr\LIf\ 0 00 A . 4
0 Lf\Lf\LCN\\+lC~C) ~ ~ ~ ~ ~ ~ -* C4dGOON'-4.
0l cl HHH C\C'C' 01 *HdnU,.H HHH II I I ii 1 ±'
124
300, and 500 kPa) were used. In the case of resonant column tests, bothlongitudinal and torsional excitation modes were possible; therefore, bothE and G values were determined on single specimens subjected to multistageconfining pressures and multistage strain levels. In the case of cyclictriaxial specimens, only multistage strain levels were varied for a givenconfining pressure.
Table 16 summarizes the resonant column test data for the maximum andminimum dynamic strain conditions. Also listed for comparison are estimatedvalues of G calculated from the equation for sands (Hardin and Black,max
1969) Gmax = 1230(2.973-e)2 3/(I + e) , where oy and Gmax are in pounds
per square inch. An examination of these estimations reveals that experi-mental G values for tests RC-P-4-L-2 and RC-P-4-M-1 are as much as three
maxtimes greater than predicted values. Thus, it appears that this equation is
not appropriate for this gradation of material.
Table 17 summarizes the cyclic triaxial test data. The values of Pois-son's ratio listed range from 0.1 to 0.3, which are slightly lower than theaverage value of 0.25 obtained from static K tests. However, the strain
0
levels for the cyclic tests are substantially lower than those for K tests.
Figures 67 and 68 present the Young's moduli values, while Figures 69and 70 present the shear moduli values for the respective two densities. Onetesting difficulty is readily apparent: the specimen stiffness exceededtolerable limits of the resonant column apparatus for both the longitudinaland torsional modes, which is especially evident for modified compaction effortdensity and high confining pressures for both densities. As a result, theresonant column derived moduli values are too low and damping ratios too high.
For the low compaction effort, reasonable compatibility was obtainedbetween the resonant column and cyclic triaxial tests (Figures 67 and 69).The strong dependence of modulus on confining pressure, strain amplitude, anddensity is readily evident in these figures. This dependence is more clearlysummarized in Figure 71, in which values from cyclic triaxial tests for k
from the expression, G = 1000 k(o3 )2 , where 03 is in pounds per square
foot, are presented versus single amplitude shear strain y . For compari-
son, values for k reported by Seed and Idriss (1970) are also shown. Thesecomparisons suggest that well-compacted modeled PARAHO exhibits propertiessimilar to those for dense sand and gravel.
Figure 72 presents damping ratio A values versus single amplitudeshear strain. A somewhat reasonable data band is apparent if the resonantcolumn data for modified compaction efforts are disregarded because of exceed-ing the apparatus capabilities and thereby experiencing damping contributed bythe device. This band suggests that A increases with strain amplitude, butis independent of density and confining pressure. For comparison, the range ofdamping ratio values for sands summarized by Seed and Idress (1970), are alsoshown in Figure 72.
125

4 -
E" 0.'4
-4 4 V
* . 0
p 0r V H 4 l C a\ coG\I' -2 . 0. . . 4 . . . . . . .
40 En I 0.0H 0 0
~~~ 0~ C-.4' I.40 HH
'40 0 _H 0 04 H - H NN~~4 m CU04
IO,' 4. . . . . . . . . .. .H.
4, 01 5 O O OH OO O
I 4 4JI. H 00 00 0 00000000 oA 2: V 0 -
0C 0
4j
0- \0 _zHU'0 N a ,0\i) 04 N ,tV
r- 0V 4-40 H~ OH -HU4 0 jH-4H
0 0
S V0 r -O~0 0-4 HHH HH OJ HHH4HH00000000 000000
1.4 04 000000090 00099.H0000660000 00000000 r +
I 0
0H H H H H --11 S3. 00 4 4 4 ,4, 4 ~ 40 4'1
0 0 z 0 0 C 0 0 z 0 4-T 1 -4 14 -H--. -4, 1 .
0 OE
11 H
A4 0 0- ' 4 H H I 4 ~
~ 0 0 0 0 0
to wN ul U) UN ) U ) 0 44
'd C-.. H, H! .4C\ H( 4)
4 ~ ~ I all U) U ) U) U ) U)4
(z W. m W. m I r m
126

A 3.qri CyclicAxia l De v i ator
0.t i .:r. S Hatio Moduixi -1.Aulu.
d~q', .,3 '3..>, 5.9 . ,.' .
,?., 1 0,i 3..'3 *.5 i: 7 . J9.1
0. N 1.3
37 10.30. .11 0 17 1 ...
0..9 1.1 3- 31.1 1.
0. 1 1. 0 . ,.c . . 13."3.1 ,' .15 7.3 25 1.' K. 2 . ..
03.53 '.2'l u,17 y.i 11.! '. 7 P
0.1,-...' 0. i0.o 15.. ,211. f.
0.15 .0 0.11 12.0 12.1 .9
0.1 0 211 0.1 13.5 1, .,
L-43.-1 43. U. 0.007 0.37 3.6 C> .'11.
0.,1 0.025 0.10 7.34..u 0.05 0.15 14.4 47.
0. () 0.10 3.1 . 1.4 0k.'- 1
.0O 0.23 3... 28.t <.. t1. .
.2'5 0.31 O. 35.4 2 . -
L-7-. -1 72.5 0.003 0.003 0.1" 3.5 i,7.0
.'31 0.01 0. 10.5 1 . ..
t'.03 1.03 0.15 17.70.3 0 .07 0.16 27.0
0.lIu .. 11 .2 3.5 21
0.19 .2 .19 46.6 3 7 -
!4-.. -1 14.5 0.005 o.oo6 0.i17 3.5 100.9 43. . .
0.01 0.01 0.0 5.3 1 76.5 1 ..
0.02 0.02 0.10 9.0
0.05 0.05 O.1- 12.3 3 7 - 7
D.05 o.o6 0.1, 13.4 3' 10.05 0.0. 0.i5 14.9 17,
0.08 0.09 0.1 17.6 31.1 13. 29' l.
0.13 o.16 Q.21 25.5 .1 i , 24, 'n.
0.18 1.23 0.26 32.5 1O.C 1
0.22 0.29 0.29 41.7
M- 3..,-1 43.5 0.002 .003 0.35 5.2 31'. 11. 147. 4 .1.
0.002 >.003 0. 35 5.2 319 . i , 1 . .
0.00) I..lI
0.3q i3.b 171 1. .'
0.03 . 0.11 .1 Q. 53.3 1.
0.07 .. ,,9 0.15 33L. 9,., 31 1-.'
0.00 -. 13 315 3,C 13.
M-,2.3-1 72.5 0.001 0.002 0. 13 3.5 '7
0.003 0.004 ). .3 7.0 1. .i. • i7.1
.C. 3.2 . 7 1.5 0. 0. ).V.4 ().0 0t. 13 8 9 i,. & t5 2
0.,f t0.0 3 0.13 43.3 1,1.. . .,
0.11 iI 0.15 57.6 7;. 31.' 30.7. ,-
.. 20 .. 2 0.'5 69.9 ,. 2,.,. 21.5 12.7
S : a(lv).
127

10
II00
w 0 L
a.z
a ~ 0
V) 0
5 mai w
10.0
.5 c-4.
u~ rz
128

RESONANT COLUMN aCYCLIC TRIAXIAL
450 1 1 111 Ij I
SYMBOL IT
400 'N0 14 .5psi r- - - 43.5 psi
V 72.5 psiNOTE: RESONANT COLUMN MODULI TOO LOW DUE
350 TO EXCESSIVE SPECIMEN STIFFNESS.
300
. 250 -1
0
z
0
100
SINGLE AMPLITUDE AXIAL STRAIN, %
Figure 68. Dynamic Young's moduli values for PARA3O compactedto modified effort density
129

0
-4
w
i4- 42 44'.
J 01
0.
1
4 - I
S0
ft
_4 0
U uJ0.u
~0
001 0
-4 4
w U.
-,
0
20
- w 0
a Q
01
6~ .,-0
03

zzzL u
0wJzjw 114
wA
Ir 0
0 4 u 4u 0 w
(0 0> z
I '-
0 w C)
wu *
w
0 0 NI
C- 0
0 0IC'r
C 1
0 .E
<4 0
4~ ~ 00< (
0< 00 C z
131
w
C' 4~* ;r *,' ~ i.

0(
CCC
0 10
04
(-00 x
a .- 4
00
00
0 U 44
U 0
'0
4-o z
00
132-
-~ 0444ILI

zzI c cc
0 2i0 0 0 I
0 0
F 0
4 T ( 0 1
W I 0
0. z uW 4
I*z20 13
02 4 rL
I- 0 w
uj 0 a
0~ u ~
(j w 0z0 0
44 .0 0
r4
0
'cliVI V C6 M
4 133

Dro hei ht testsThe objective of these tests was to determine densities achieved whenprocessed oil shale is dropped from various conveyor heights. Figure 73 andTable 18 present the results of these tests. For PARAHO, major increase indensity occurs within the initial 5 ft of drop, where a relative density of 67percent was achieved. Increasing the drop height to 16.5 ft produced only asmall amount of densification, i.e., Dr increased to 79 percent. In the
case of TOSCO, the drop height has only a slight effect on the density; thereason for the gradual increase with drop height shown is probably due tosegregation of the fines.
Los Angeles Abrasion testsThe results of Los Angles Abrasion tests (LAA) on various gradations of
PARAHO retorted oil shale and raw shale summarized in Table 19 show thatretorting greatly decreases the abrasion resistance of oil shale. The PARAHOretorted shale is quite susceptible to abrasion with LAA values of 79.7, 80.1,and 66.7 percent for various gradations listed in Table 19, all of which exceedthe maximum acceptable value of 50 percent for base course materials. Con-versely, the unprocessed shale is quite resistant to abrasion with LAA valuesof only 13.2, 12.2, and 18.4 percent for the various gradations shown.
Composition and Durability Properties
Petrographic analysesThe tests performed on specimens of raw shale and PARAHO retorted shale
for petrographic analyses are described in the following paragraphs. Theseanalyses consisted of stereoscopic petrography, X-ray diffraction, differentialthermal analyses (DTA), and scanning electron microscopy.
Raw shale. Six pieces of randomly selected samples of raw shale were ex-amined. Each piece was ground to pass a 45-pm (No. 325) sieve, and the powderswere examined by X-ray diffraction separately to determine if composition wasconstant from piece to piece. In an attempt to recreate and follow the changesthat led to the cementation phenomenon observed by the unconfined compressiontests, portions of several of the six pieces were heated in a furnace at 540*C(1000-F) for 45 min. This temperature was selected as it approximates thePARAHO retort temperature. These samples were observed to burn and produceflames during this period. Portions of these burned samples were then placedin storage at 100 percent relative humidity and 73.4 + 3*F for 3 days or wereplaced in distilled water and evaporated to dryness; different portions ofsome samples were wetted each way. The samples were examined by X-ray dif-fraction after each of the burning and wetting treatments.
The presence of hydrocarbons in the raw shale prevented the prepara-tion of sedimented clay slides. Therefore, portions of some of the burnedpowders were slurried with water onto glass slides to enhance clay mineral
orientation and then examined by X-ray diffraction when dry.
Portions of several pieces of raw shale were ground to pass the 300-pm(No. 50) and be retained on the 75-pm (No. 200) sieves. These powders weresubjected to DTA in an inert nitrogen atmosphere at a heating rate of 10C
134
..............................
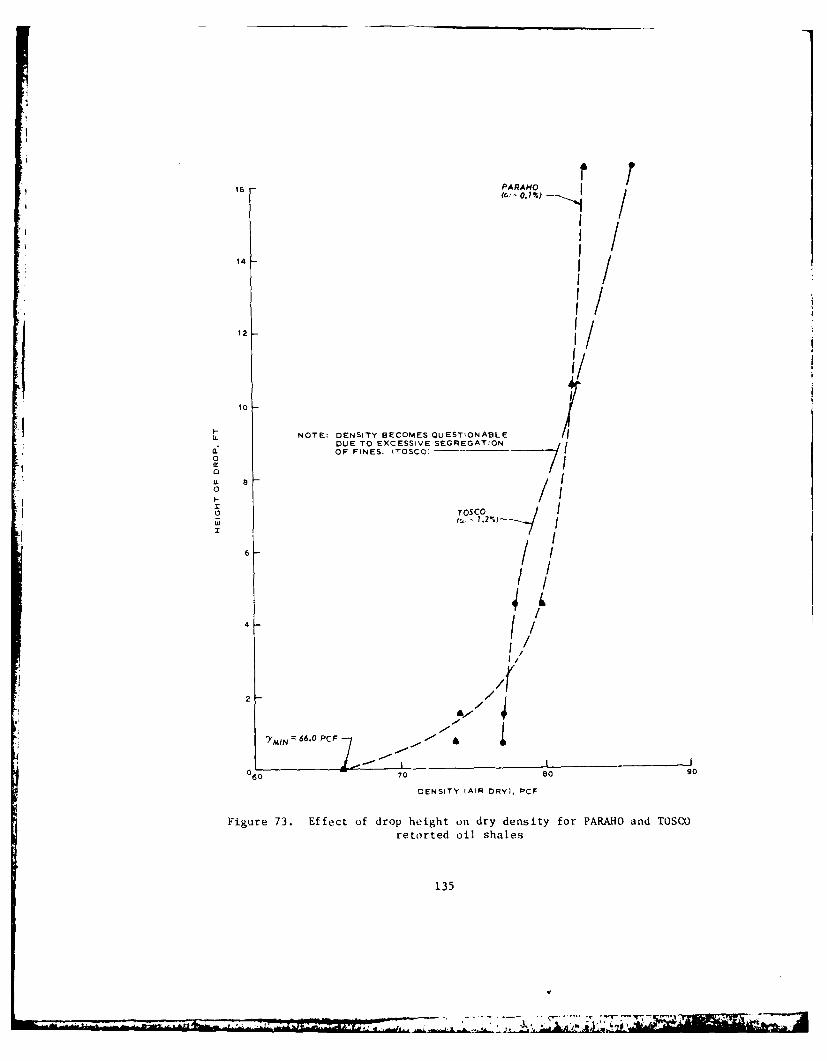
16 PARAHO r
14 1
12
107
NOTE: DENSITY BECOMES QUESTIONABLE 'LL DUE TO EXCESSIVE SEGREGATION
a: OF FINES. (TOSCO) I0
I0 /TOSCO2w 1.%
6/ I
4
2
YMIN 66.0 PCF
0 60 70 so 90
DENSITY (AIR DRY). PCF
Figure 73. Effect of drop height on dry density for PARAHO and TOSCOretorted oil shales
135
-~ ________

"'able 1
Summnary of Drop Hiight Te. ; on I ARAH(J
andir TXUCu il Sh£ales'
Height of Drop Density*Material ft pef
I ARAHOG(-in. fraction) 0.7( 73.8
'.5 74.14.5 79.8
10.5 82.016.5 83.0
TO2CO 0.7 77.01.5 77. 14.5 78.0
10.5 82.1416.5 86.3
*Air-dry material. (The water contents of the PAHAHO and TOSCOfractions are about 0.1 and 1.2 percent, respectively.)
136

Table 19
Sunmary of Los Anvules Abrasion Test He.sults
on PARAHO and Raw Oil Shales
ASTM Percentage
Material Designation Grading Sieve Size, in. Wear
PARAIHO C131-76 A - 1-1/2 to + 1 79.7
- 1 to + 3/4
- 3/4 to + 1/2
- 1/2 to + 3/8
PARAHO C131-76 C - 3/8 to + No. 3 80.1
- No. 3 to + No. 4
PARAHO C535-69 2 - 2 to + 1-1/2 66.7
- 1-1/2 to + I
Raw shale C131-76 A - 1-1/2 to + 1 13.2
- 1 to + 3/4
- 3/4 to + 1/2- 1/2 to + 3/8
Raw shale C131-76 C - 3/4 to + No. 3 12.2
- No. 3 to + No. 4
Raw shale C535-69 1 - 3 to + 2-1/2 18.4
- 2-1/2 to + 2
- 2 to + 1-1/2
137

per minute; one burned portion that had been in moist storage for 3 days wasalso ground and examined by DTA. A thin section of one raw shale fragment wasmade and examined with a polarizing microscope.
PARAHO retorted shale. Samples of 1-1/2-in. (38-mm) and 3/4-in. (19-mm)fragments were selected for analyses and examined with a stereoscopic microscope.A piece from each sample was ground to pass the 45-pm (No. 325) sieve and sub-sequently examined by X-ray diffracton. A 1-1/2-in. (38-mm) fragment of shalewas used to make a thin section and then examined with a polarizing microscope.A freshly cut interior of this piece was also examined by X-ray diffraction asa slab in an inert atmosphere containing hot barium hydroxide to preventcarbonation. This slab was again X-rayed after soaking in water for severaldays to determine if any detectable changes had occurred.
The dense and the vesicular 3/4-in (19-mm) fragments were examined by ascanning electron microscope (SEM) after coating with a layer of carbon and alayer of gold palladium. Crystals from a dense 3/4-in. (19-mm) fragment wereconcentrated by gently crushing and grinding of the pieces, coated as above,and examined by SEM.
Unconfined compressive strength samples of PARAHO retorted shale.Portions of samples UC-L-28-13C (oven-dried), UC-S-28-8, and UC-M-28-18B(Table 8), all of which had been cured 28 days prior to shearing, were allowedto dry in air, ground, and examined by X-ray diffraction. It was observedthat small white crystals formed on the surface of sample UC-M-28-18B, afterthe wax coating was removed. A sample of these white crystals was obtained byhand picking and examined by X-ray diffration, A piece of UC-M-28-18B wascoated, as described earlier, and examined by SEM.
Disaggregated PARAHO retorted shale from Franklin slake test. A portionof l-l/2-iii (38-mm) fragment from UC-M-28-18B that had been subjected to theFranklin slake test was ground and examined by X-ray diffraction in the mannerdescribed earlier. Some of the fine material also from this sample and notoven-dried was sedimented on a glass slide and examined by X-ray diffrac-tion when dried.
Chemical analysesPortions of the six pieces of raw shale examined by X-ray diffraction
were composited to provide a sample for chemical analysis. A portion of thePARAHO retorted fragment from UC-S-28-8, which had been examined by X-raydiffraction, was also selected for chemical analysis. Each sample was anal-yzed after drying to 1051C. Companion portions were burned until a constantweight was achieved at 5000 and 9000 C. The original analysis was recalculatedto take account of the weight loss at 900 0C.
Tests results of petro-graphic and chemical analyses
Raw shale. The raw shale consists of fragments tabular to blocky inshape. It has a yellowish-gray (color 5Y 7/2 based upon National ResearchCouncil, 1963) dusty surface. Fresh surfaces are alternating thin layers ofblack (NI) to brownish-black (color 5YR 2/1) material. When a fresh surfaceis scratched, the scratch is light colored like older surfaces; the same is
138
true when the rock is ground to a powder. The X-ray examination showed thatthe light-colored surface coating had the same composition as the bulk of therock and that the six pieces were not uniform in composition. While all sixpieces examined contained dolomite, quartz, plagioclase feldspar, and claymica, only four of the six pieces were found to contain calcite. Four of thesix pieces were found to contain analcime (NaAlSi2 06 .H 20), which is usually
described with zeolite minerals because it behaves as such, but strictlyspeaking it is not actually a zeolite (Hay, 1966). Obviously, the noncrystal-line hydrocarbons were not detected by X-ray diffraction. Clay-mica, a minorconstituent, was the only clay mineral that was detected by the X-ray exami-nations. In this content, a rock having this composition is not properlydescribed as a shale. Heady (1952), during a study of Colorado oil shale byDTA and X-ray diffraction, found the same minerals observed in this study,namely, analcime, quartz, feldspar, clay-mica, dolomite, calcite, and ironsulfide. Petrographic analyses performed by the Department of Interior'sBureau of Reclamation and presented by WCC (1976) list dolomite, calcite,feldspar, and quartz as the major constituents of raw shale, with traceamounts of siderite (iron carbonate), analcite, and clay-mica.
The thin section of raw shale showed that the carbonates (dolomite andcalcite) were present as fine-grained matrix material. Quartz, feldspar,and analcime were all present as larger grains scattered through the matrix.These grains were generally anhedral in shape with the analcime containingcracks. Rare grains of clay-mica or mica were recognizable. Considerableamounts of opaque material were also evident; these grains appeared to be aniron sulfide when examined in reflected light. Examination of the thin sec-
tion from the 1-1/2-in. (38-mm) fragment of dense PARAHO rock showed a sig-nificant difference from the thin section of raw shale. For the retorted oilshale, the carbonite grains are larger and many of the rhombs contain over-growths of carbonate. However, the X-ray diffraction examination of a freshsurface of this same retorted fragment before and after storage in water didnot show any detectable changes.
The experiments to simulate the retorting process by heating unprocessedshale at 540°C and then hydrating it by moist storage showed the developmentof anhydrous calcium sulfate, which hydrated to gypsum (CaSO4 .2H2 0) in the
presence of water. It is not clear whether gypsum was already present butwidely scattered in the shale; thus it was not present in the pieces of rawshale examined by X-ray diffraction, but possibly was present in the piecesheated at 540*C, where it would have been dehydrated to anhydrite and thenrehydrated in water. This seems to be the most likely hypothesis. It is alsopossible that during the heating and burning, pyrite (iron sulfide, FeS 2 ) re-
leased SO2 which combined with CaO from calcite that had lost CO2 and with
oxygen to make CaSO 4 that hydrated to gypsum in water. Since gypsum was not
found in the retorted and the compressive strength samples, the laboratorysimulation was regarded as unsuccessful, and so no further description of itwill be given.
The DTA patterns of four of the raw shale fragments showed endothermicpeaks at 46U0 C and one to two endothermic peaks in regions from 7000 to 760°C
139
7 . . * ~ A
and from 8000 to 810*C. The lack of a 460*C peak in material from a piecethat had been burned 45 min at 5400 C and then placed in moist storage showedthat the 460@C peak was due to distillation of the hydrocarbons in the inertatmosphere in this temperature range. The wide range of magnitude of the460*C peak between four of the pieces indicated a similar range in hydrocarboncontent. The peak or peaks in the 7000 to 810 0 C range were due to breakdownof the carbonate mineral or minerals. The fine-grain size probably accountsfor the lower than usual temperature of these reactions. Since X-ray dif-fraction showed that there was dolomite in each of these four pieces, thereshould have been two peaks for the decomposition of dolomite. The lack of twopeaks in some cases may have been due to lack of sensitivity of the DTA unitat the settings used.
PARAHO retorted shale. Examination of the PARAHO retorted fragmentsshowed that most were dense rock while a few pieces had become vesicular during rthe retorting. All of the pieces were black and dirtied the hands duringhandling. The changes that were apparent were: (a) all surfaces were nowblackish, (b) some of the rock had been heated enough to become vesicular,
and (c) the dense particles showed slight development of parting planes. Themineralogical composition was similar to what it had been before the rock was
14retorted. The dense pieces sometimes contained more calcite than dolomite.This reversal did not occur in the six pieces of unprocessed shale that wereexamined by X-ray diffraction to represent unprocessed rock. The l-i/2-in.(38-mm) fragments contained detectable analcime, while the samples of 3/4-in.(19-mm) fragments usually did not contain detectable analcime. The complexmineral assemblage of quartz, feldspar, dolomite, clay-mica, and usually anal-cime and calcite tended to mask peaks of possible reaction products, such asCaO, MgO, Ca(OH)2, or Mg(OH)2 , that would be possible constituents if re-
torting had broken down the carbonate phase or phases. MgO and calcium sul-fate were probably present in some X-ray diffraction patterns of the denseretorted material. X-ray diffraction examination of a vesicular piece of re-torted shale from the 3/4-in. (19-mm) fragments showed no detectable dolomite,probably MgO, and considerable calcite in addition to quartz, feldspar, andprobably siderite (FeCO3 ). A piece of vesicular shale from the 3/4-in. (19-mm)
fragments showed no detectable dolomite. X-ray diffraction analyses of PARAHO
retorted shale by the Bureau of Reclamation (WCC, 1976) lists dolomite, cal-cite, feldspar, and quartz as the major constituents with siderite, analcite,iron oxide, and mica-illite (clay-mica) as minor constituents. These analysesalso identified the presence of analcime, a type of zeolite, which was alsodetected in this present investigation.
Figures 74 through 77 illustrate the use of scanning electron micro-graphs in petrographic analyses. In Figure 74, the micrographs show threeviews of a piece of dense retorted rock from a sample of 3/4-in. (19-mm) re-torted shale. In Figure 75, the micrographs present three views of a pieceof vesicular retorted rock from the same sample. In Figure 76, the micro-graphs present four views of two portions of the compressive strength speci-men UC-M-28-18B. In Figure 77, the micrograph shows some crystals concen-trated from a dense retorted particle of the 3/4-in. (19-mm) sample.
When the waxed sample of the compressive strength specimen UC-M-28-18B
140
4 _ 7. ~

a. Micrograph at 18X
b. Portion of micrograph a at 1800X
Figure 74. Scanning electron micrographs of a denseparticle of PARAHO retorted oil shale from a sample
of 3/4-in. (19-mm) fragments (Sheet I of 2)
141

c. Central portion of micrograph c at 9000X. (Notesharp edges and lack of vermic-ular material)
Figure 74. (Sheet 2 of 2)
142

frir
A741
a. Pr ion oicrograph a at 12
Figure 75. Scanning electron micrographs of a vesicular particleof PARAHO retorted shale from a sample of 3/4-in. (19-mm) frag-
ments (Sheet 1 of 2)
143

c. Central portion of micrograph b at lO,600X. (Notebridging between grains in left central area and smaller
grains on surface in left part of picture)
Figure 75. (Sheet 2 of 2)
144
---- ---- --- --- ~ ____ ___ ____ ____ ___- ,z .

3or
a. Micrograph at 19X
~FhW.Ow
b. Portion of micrograph a at 1920X
Figure 76. Scanning electron micrographs of unconfined com-pression test specimen UC-M-28-18B of PARAHO retorted oil
shale (Sheet I of 2)
145
Now

Cnti II poirt ion o f mi c rographt b at 9(uOOX. (Note
abuniidance of vercmnicuIilar materi al)
14L4

Note-: The crystals in the center are morphologically likeanalcime. There is some feldspar at the lower right andnext to the tipper left and quartz grains may be present.The grains at the left edge, the center, and the bttomnext to the grain at the lower right all appear to be
similar in crystal habit and like analcime.
Figure 77. Scanning electron micrograph of analcimecrystals from a dense particle of PARAHO retortedshale from a sample of 3/4-in. (19-mm) fragments
at 770X
147
4

was opened, tiny white crystals of thenardite (Na2 So4 ) formed on the exposed
surface overnight. X-ray diffraction examination of the three compressivestrength samples (UC-L-28-13C (01), UC-M-28-18B, and UC-S-28-8) showed pat-terns that were generally similar to those of unprocessed and of retortedshale. However, the general difference was that calcite was much more abun-dant than had been in the unprocessed shale. There were weak peaks in theX-ray diffraction pattern of the UC-L-28-13C (OD) sample at 7.9 and 7.6 Aunits (0.79 and 0.76 nanometres), respectively, that were not present in theraw shale. The 7.9 A peak was not identified; the 7.6 A peak was possiblygypsum.
The X-ray diffraction patterns of PARAHO retorted shale from tile
Franklin slake tests were not appreciably different from the other X-raydiffraction patterns of this material.
The chemical compositions of a sample of unprocessed shale and of aretorted compressive strength specimen are shown in Table 20. The losses inweight at 900 0C for unprocessed and retortel shale, 34.45 and 17.20 percent,respectively, should include both hydrocarbons and carbon dioxide from thecarbonate minerals, since 900*C is about 810C above the decomposition tempera-tures, as shown by DTA, due to hydrocarbons and carbonates. Ignition at anintermediate temperature of 500 0 C for two hours gave losses of 17.23 and3.35 percent by weight for the unprocessed and retorted samples, respectively.
These values should essentially represent the amounts of oil or hydrocarbonsthat were present in each sample.
Discussion of cementation. The strength gain observed in compactedspecimens of retorted shale is attributed to recementation by carbonates thatwere at least partially decomposed during the retorting process to remove hydro-carbons. This breakdown of the carbonates occurred from 7000 to 810*C in thepresent DTA work. The lower than usual temperatures are probably due to thefine-grain size of these minerals in this rock. Decomposition of calcite anddolomite by removal of carbon dioxide results in the formation of calcium oxidefrom calcite and calcium and magnesium oxide from dolomite. These oxides canthen alter to hydroxides or to calcite and magnesite (MgCO3 ) or dolomite in
the presence of moisture and carbon dioxide. Calcium oxide is much more activethan magnesium oxide of the same crystallite size. Efforts to idenLify theseoxides or their hydroxides in the present retorted samples were generally un-successful although MgO was tentatively identified. This failure could be dueto the general masking effect of the original constituents on the reactionproducts in X-ray diffraction patterns or to the fact that the retorted mate-
rial had had adequate time for the oxides to carbonate before this study wasmade, or to a combination of these factors.
The evidence to support the hypothesis that destruction and reformationof the carbonates has occurred includes the following:
a. Examination of thin sections of unprocessed and PARAHO retortedshale showed a larger grain size for the carbonate minerals inthe retorted rock.
148
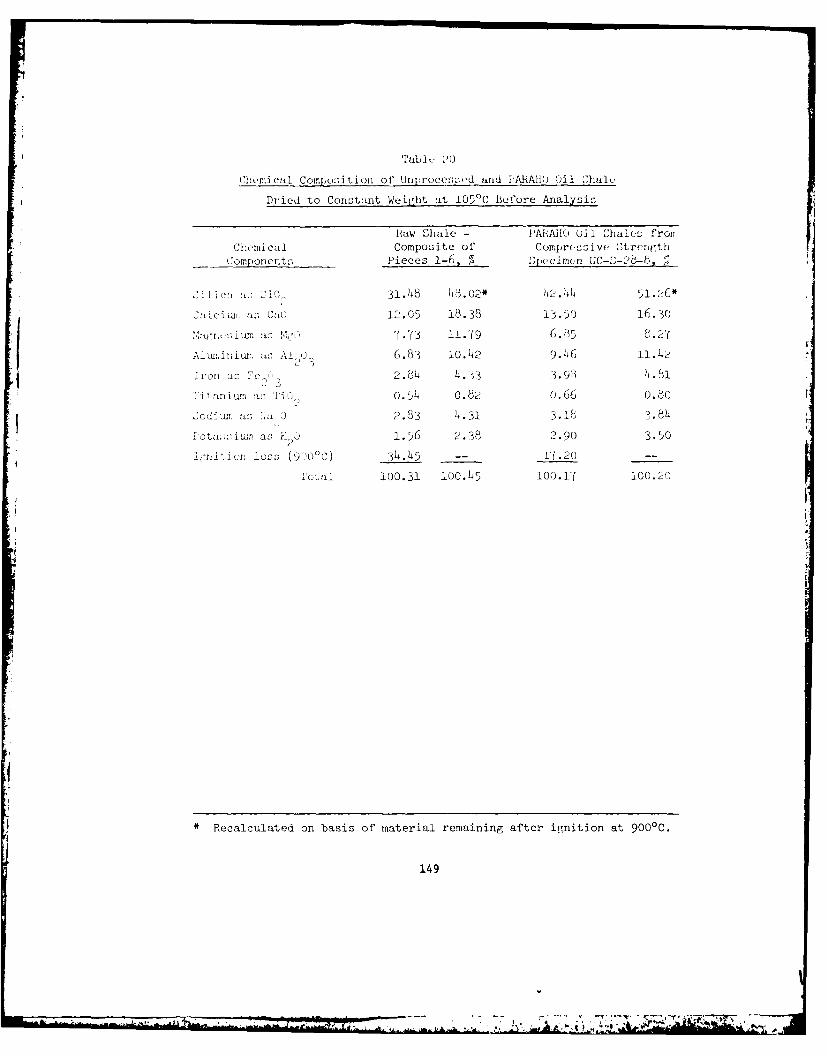
Tuible "0
Clp mical Como,;i tion of Unproces -,ed _ard 'ARAli) Oil ,ha.
Dried to Constant Weight at 1050 C Before Analysis
;.1
haw Shale - PARdiO Oil -hales fro.
Chemical Composite of Compressive StrengthComponents Pieces 1-6, % Specimen UC-2-28-8, ;
CilIc>; a.; 2i0 31.48 18.02* 42.44 51.26*
C'iciw. a.- CaO 12.05 18.38 13.50 16.30
,agre , asum a s,, 40 '.73 11.79 6.05 8.2'
Alusi!ius, zu; Al,,20 6.83 10.42 9.146 11. 42
iron as z 2.814 L4.33 3.91 8 .17itanium as T'T' o.5-4 0.8, o.66 0.80
SodiwuT: as.; : a C 2.83 4.31 3.18 3.84
Lotao;;iwn as K,' 1.56 2.38 2.90 3.50
:i- r tisril loss (950°C) 34.145 -- 1' .20 --
Total 100.31 100.45 100.1( 100.20
Recalculated on basis of material remaining after ignition at 9000C.
149
*1I

b. Calcite was often more abundant than dolomite in the retortedrock, whereas it was missing or less abundant than dolomite inthe six pieces of unprocessed rock that were examined by X-raydiffraction.
C. Study of the scanning electron micrographs of dense and vesicularPARAHO retorted rock and of the retorted rock after compaction sug-gests a fusing and rounding of grains in the vesicular rock anda secondary growth of vermicular material in the compacted rock.
The DTA patterns indicated that the hydrocarbons present in the rockcan be removed at a temperature of about 460'C.
Franklin slake durability tests (Franklin and Chandra, 1972). Table 21 r
summarizes the results of Franklin slake durability tests on raw and PARAHOretorted oil shale. These results show that the raw shale is extremely resis-tant to slaking with practically no weight loss observed. The 1-1/2-in.(38-mm) and 3/4-in. (19-mm) fragments of PARAHO retorted shale are also quitedurable and resistant to slaking in water, but the smaller fragments areslightly less durable. However, the unconfined compression specimen ex-hibited a marked decrease in slaking durability. This dramatic reduction indurability suggests that the cementitious products formed by curing are weakcements when exposed to wetting and drying.
150
_TT

Table 21
Summary of Franklin Slake Durability Tests on
Raw and PARAO Oil Shales
Slake
Swnple DurabilityMaterial/Description No. Index, %* Classification
Raw shale 1 99.0 Extremely high2 99.5 Extremely high
PARAHO 1-1/2 in. 1 92.5 Very high
2 91.5 Very high3 82.5 High
4 90.0 Very high
PARAH0 3/4 in. 1 94.02 94.0
3 93.54 9L.0
Unconfined compression 1 57.0 MediumUC-M-28-18B (PARAH0) 2 55.5 Medium
* Average of two tests.
151
-M L-
CHAPTER 5: CONCLUSIONS AND RECOMMENDATIONS
Conclusions
Based upon the materials tested, the laboratory equipment and test pro-cedures used, and other results reported in the literature, the following
conclusions are made:
Physical propertiesa. The raw shale from which the PARAHO material was retorted is very
hard and durable. After 18 months of soaking it still remained
nonplastic. The durability of this material is further attestedto by LAA and Franklin slake durability tests, which provided LAAvalues of 12-18 percent and a slake durability index value of 99.
b. The retorted shale from the PARAHO retort is classified as a
nonplastic poorly graded sandy gravel, GP, with a trace of
fines, by the Unified Soil Classification System. Retortingcauses a loss in abrasion resistance as evidenced by LAA values
of 67-80 percent and increased fines due to mechanical agita-tion by the sieve shakers. However, the material is resistantto water as the PI only increased from 0 to 5 after 18 monthsof soaking, and slake durability index values were 90-95 percent.
c. The retorted shale from the TOSCO retort is classified by the
Unified Soil Classification System as silty sand (SM). LikePARAHO, TOSCO is resistant to water with the PI only increasingfrom 0 to 5 after 18 months of soaking.
Engineering propertiesa. PARAHO can be compacted in the laboratory to dry densities of 95,
98, and 104 pcf under low, standard, and modified compaction efforts.Whether compacted in an air-dried or wetted condition, dry densitiesare essentially equal, hence water is not essential to achieving adesired density. The maximum density achieved by the laboratoryvibratory table method was significantly less, only 89 pcf; however,WCC (1976) reports that field vibratory compaction is the bestmethod of compaction, and vibratory densities ranging from 98 to110 percent of standard were achieved depending upon lift thickness,number of passes, etc. Particle breakage increases with compactedeffort and breakage values of 11, 16, and 25 percent resulted underlow, standard, and modified compaction efforts, respectively. Model-ing the full-scale gradations by scalping and replacement, parallel,or scalping techniques underestimates laboratory compacted densities
of full-scale material.
b. TOSCO can be compacted in the laboratory to dry densities of 97,99, and 104 pcf under low, standard, and modified compactionefforts, respectively. In the case of this material, optimum
152
--A
water contents range from 22 to 17 percent, and water is requiredto achieve maximum dry density.
c. The compressibility of compacted PARAHO and TOSCO is comparableto that for dense rockfill or sands. The percent compressionfor a vertical stress of 800 psi (5.5 MPa) was 5-10 percent forPARAHO and 5-8 percent for TOSCO with lower compression observedfor higher densities. Compression index values C ranged from
c
0.10 to 0.15 and 0.10 to 0.12 for PARAHO and TOSCO, respectively.
Both PARAHO and TOSCO suffer particle breakage during consolida-tion, with both experiencing breakage values of approximately28 percent for standard effort densities.
d. Both PARAHO and TOSCO possess self-cementing characteristicsproducing additional strength with time. However, PARAHO sat-isfies recommended criteria (Thompson, 1970) for assessing sta-
bilization reactivity, while TOSCO does not. Increasing densityproduces higher strength gains, hence in critical areas requiringincreased strength, additional compaction may be warranted. PARAHOis more reactive than TOSCO, exhibiting 3- to 8-fold strength gainsover 28-day curing, while TOSCO only exhibits a 1.5- to 3-fold
strength increase for comparable conditions. Cementing reactionsunder normal conditions are slow for PARAHO, with strength gainsstill indicated after 28 days, while TOSCO gains most of itsstrength within 3 days following compaction.
e. The shear strengths of both PARAHO and TOSCO are comparable tothose for gravelly sands with respective effective internalfriction angles of 33 and 37-43 deg. Corresponding cohesion
2values are less than 2.0 kg/cm for both materials. Attemptsto model gradations of PARAHO by scalping and replacementtechniques resulted in unconservative overestimates of internalfriction angles. Despite high densities, both materials gen-erally exhibit positive pore pressure generation when sheared.
f. Compacted PARAHO can be considered as semipervious with perme-
ability values of 10- 3 and 10- 4 cm/sec depending upon compac-
tion effort. On the other hand, the finer grained TOSCO can beconsidered as semipervious to impervious with permeability
values of 10- 6 to 10- 7 cm/sec depending upon compaction effort.
&- Despite significant strength gains with curing time for compactedPARAHO and TOSCO, K test results on specimens cured 13 and 190
months, respectively, showed no appreciable increase in stiffness.Poisson's ratio values for PARAHO ranged from 0.16 to 0.29, whilethose for TOSCO ranged from 0.24 to 0.30. The results alsoshowed that K values increased with axial stress level (over-
0
burden pressure) and overconsolidation ratio.
153
- -v
k. Special interface shear tests investigating the angle of internalfriction of raw shale and PARAHO against different surfacesshowed the order of decreasing friction was rubber belting, rustysteel, and stainless steel. For unprocessed shale these valuesranged from 31 to 14 deg, while for PARAHO the values ranged from39 to 24 deg.
i. The dynamic characteristics of compacted PARAHO are good and com-parable to those for dense sand and gravel.
£. Based upon the tests mentioned previously, these materials ex-hibited geotechnical properties characteristic of a GP and SM.They behaved as a moderately dense gravel or sand depending uponthe applied compaction effort and exhibited adequate strength.In addition, their self-cementing characteristic enhances strength.The materials are pervious to semipervious and as such will notperform as an impermeable barrier. In this context, properlyengineered waste embankments of these materials should performsatisfactorily.
Compositional propertiesa. The unprocessed rock is yellowish-gray colored and composed of
quartz, feldspar, clay-mica, dolomite, iron sulfide, calcite,analcime, and hydrocarbons. The only clay mineral, clay-mica, is avery minor constituent, hence the rock is not properly described as
shale, but rather a carbonate rock.
b. Retorting by the PARAHO process to remove the hydrocarbons alsocauses decomposition of the carbonate minerals. Subsequent re-formation of carbonates involves cementation which is responsiblefor the time-dependent strength gain observed in unconfined com-pression tests.
Recommendations
Although the unprocessed shale may vary from deposit to deposit andthe method of operation may vary daily for the PARAHO or TOSCO processes,both of which will cause a variety of properties for spent shale, this re-port and that of WCC (1976) provide considerable information concerning thegeotechnical properties of spent shale. In this context, unless a differentretort process is used, additional laboratory research to identify typicalgeotechnical properties is unwarranted. This does not mean, however, forsite-specific cases, that laboratory characterization is not necessary.
It is recommended that analytical studies of various disposal schemesbe initiated. Specifically, typical embankment geometries for disposing ofspent shale should be designed and analyzed using the properties of bothPARAHO and TOSCO. Effects of internal drainage on seepage forces and seismicassessment should be included. Performance and design predictions couldsubsequently be verified by geotechnical centrifuge models.
154

REFERENCES
Al-Hussaini, M. M, and Townsend, F. C. 1975. "Investigation of K Testing0
in Cohesionless Soils," Technical Report S-75-16, U. S. Army Engineer Water-ways Experiment Station, CE, Vicksburg, Miss.
• 1975a. "Stress-Deformation of Sand Under K Conditions," Fifth0
Panamerican Conference on Soil Mechanics and Foundation Engineering, Buenos
Aires, Argentina.
American Society for Testing and Materials, (ASTM) Annual Book of Standards.1979. "Soil and Rock, Building Stones, and Peats," Part 19, Philadelphia, Pa.
Becker, E., Chan, C. K., Seed, H. B. 1972. "Strength and Deformation Char-acteristics of Rockfill Materials in Plane Strain and Triaxial CompressionTests," Report No. TE 72-3, Department of Civil Engineering, University ofCalifornia, Berkeley, Calif.
Dames and Moore. 1974. "Processed Shale Studies; Environmental ImpactAnalysis, Appendix 5, Colony Development Operation, Rifle, Colo."
Department of the Army, Office, Chief of Engineers. 1970. "Laboratory SoilsTesting," Engineering Manual 1110-2-1906, Washington, D. C.
Donaghe, R. T, and Cohen, M. W. 1978. "Strength and Deformation Propertiesof Rockfill," Technical Report S-78-1, U. S. Army Engineer Waterways Experi-ment Station, CE, Vicksburg, Miss.
Donaghe, R. T., and Townsend, F. C. 1973. "Compaction Characteristics of
Earth-Rock Mixtures, Report 1, Vicksburg Silty Clay and DeGray Dam ClayeySandy Gravel," Miscellaneous Paper S-73-25, U. S. Army Engineer WaterwaysExperiment Station, CE, Vicksburg, Miss.
. 1975. "Scalping and Replacement Effects on the Compaction
Characteristics of Earth-Rock Mixtures," American Society for Testing andMaterials, Special Technical Fublication 599, Soil Specimen Preparation forLaboratory Testing.
Drnevich, V. P. 1977. "Resonant Column Testing-Problem and Solutions,"American Society for Testing and Materials, Special Technical Publication654, Dynamic Geotechnical Testing.
1 1978. "Resonant Column Test, Miscellaneous Paper S-78-6, U. S.
Army Engineer Waterways Experiment Station, CE, Vicksburg, Miss.
Dunlap, W. A. et al. 1975. "United States Air Force Soil StabilizationIndex System-A Validation," Technical Report 73-150, Air Force WeaponsLaboratory, Kirtland AFB, N. Mex.
155

Franklin, J. A. and Chandra, R. 1972. "The Slake-Durability Test," Inter-
national Journal of Rock Mechanics and Mining Science, Vol 9, pp 325-341.
Hardin, B. 0. and Black, W. L. 1969. Closure to "Vibration Modulus ofNormally Consolidated Clay," Journal of the Soil Mechanics and FoundationDivision, American Society of Civil Engineers, Vol 95, No. SM6, pp 1531-1537.
Hay, R. L. 1966. "Zeolites and Zeolitic Reactions in Sedimentary Rocks,"Geologic Society of America, Special Paper No. 85, New York.
Heady, H. H. 1952. "Differential Thermal Study of Colorado Oil Shale,"The American Mineralogist, Vol 37, pp 804-811.
Jaky, J. 1948. "State of Stress at Great Depth," Proceedings, Second Inter-national Conference on Soil Mechanics and Foundation Engineering, Rotterdam,Holland, Vol 1, pp 103-107.
Marachi, D. N. et al. 1969. "Strength and Deformation Characteristics of
Rockfill Materials," Report No. TE-69-5, Department of Civil Engineering,University of California, Berkeley, Calit.
Marsal, R. J. 1967. "Large Scale Testing of Rockfill Materials," Proceed-ings of Journal of Soil Mechanics and Foundation Engineering Division,American Society of Civil Engineers, Vol 93, No. 2, pp 27-43.
National Research Council. 1963. "Rock-Color Chart," The Rock-Color ChartCommittee, Washington, D. C.
Nicholson, G. A. 1979. "Determination of Shear Strength Parameters ofRock Masses" (in preparation), U. S. Army Engineer Waterways ExperimentStation, CE, Vicksburg, Miss.
Parkin, A. K. 1977. "The Compression of Rockfill," Australian GeomechanicsJournal, Vol G7.
Peterson, R. W., Townsend, F. C., and Bloomfield, R. A. 1978. "Geotech-nical Properties of a Fine-Grained Spent Shale Waste," Proceedings, EleventhAnnual Oil Shale Symposium, Colorado School of Mines, Denver, Colo.
Seed, H. B. and Idriss, I. M. 1970. "Soil Moduli and Damping Factors forDynamic Response Analyses," Report No. EERC 70-10, College of Engineering,University of California, Berkeley, Calif.
Silver, M. L. et al. 1976. "Cyclic Triaxial Strength of Standard Test
Sand," Journal of Geotechnical Engineering Division, American Society ofCivil Engineers, Vol 102, No. GT5.
Snethen, D. R., Farrell, W. J., and Townsend, F. C. 1978. "A Review ofthe Physical and Engineering Properties of Raw and Retorted Oil Shales fromthe Green River Formation," Miscellaneous Paper S-78-3, U. S. Army EngineerWaterways Experiment Station, CE, Vicksburg, Miss.
156
MENE..M -.: -. .. . ..- . . : --- -
Thompson, M. R. 1970. "Suggested Method for Mixture Design Procedure forLime Treated Soils," American Society for Testing and Materials, SpecialTechnical Publication 479, Special Procedures for Testing Soils and Rockfor Engineering Purposes.
Townsend, F. C. 1972. "Comparisons of Vibrated Density and Standard Com-paction Tests on Sands with Fines," Miscellaneous Paper S-72-29, U. S. ArmyEngineer Waterways Experiment Station, CE, Vicksburg, Miss.
1 1977. "A Review of Factors Affecting Cyclic Triaxial Tests,"American Society for Testing and Materials, Special Technical Publication 654,Dynamic Geotechnical Testing.
Woodward-Clyde Consultants. 1975. "Research and Development Program on theDisposal of Retorted Oil Shale-PARAHO Oil Shale Project; Phase IV, InterimReport No. 1 on Shale Retorted in Semi-Works Plant by Direct Heating Method,"Prepared for Development Engineering, Inc.
1976. "Research and Development Program on the Disposal ofRetorted Oil Shale-PARAHO Oil Shale Project," Final Report; Piepared for U. S.Department of Interior, Bureau of Mines, Contract No. J0255004.
_ 1976a. "Raw Shale Tests, Research and Development Program on theDisposal of Retorted Oil Shale, PARAHO Oil Shale Project; Phase VII, InterimReport"; Prepared for U. S. Department of Interior, Bureau of Mines.
Wong, R. T., Seed, H. B., and Chan, C. K. 1975. "Cyclic Loading Lique-faction of Gravelly Soils," Journal, Geotechnical Engineering Division,American Society of Civil Engineers, Vol 101, No. GT6.
157
) .v~
APPENDIX A: A REVIEW OF THE PHYSICAL AND ENGINEERING PROPERTIES OF RAWAND RETORTED OIL SHALES FROM THE GREEN RIVER FORMATION
(Published in March 1978 as Miscellaneous Paper S-78-3, U. S. Army Eng-
ineer Waterways Experiment Station, CE)
--------------- -..- r------t~'i
* I - .

THE CONTENTS OF THIS REPORT ARE NOT TO BE
USED FOR ADVERTISING, PUBLICATION, OR
PROMOTIONAL PURPOSES. CITATION OF TRADE
NAMES DOES NOT CONSTITUTE AN OFFICIAL EN-
DORSEMENT OR APPROVAL OF THE USE OF SUCH
COMMERCIAL PRODUCTS.
161
* *.*S

PREFACE
This study of the physical and engineering properties of retorted
oil shales is a 2-year investigation funded by the Bureau of Mines, U. S.
Department of the Interior, under Interagency Agreement H0262064.
Mr. Roger A. Bloomfield, Spokane Mining Research Center, Bureau of Mines,
was the Technical Project Officer.
The investigation was initiated during October 1976 by the Soils
and Pavements Laboratory (S&PL) of the U. S. Army Engineer Waterways
Experiment Station (WES). Dr. Frank C. Townsend, Research Group, Soil
Mechanics Division (SMD), S&PL, was principal investigator during this
phase of the study. The work reported herein was performed by
Dr. Donald R. Snethen, Research Group, SMD, and Mr. Warren J. Farrell,
Geology Branch, Engineering Geology and Rock Mechanics Division, S&PL.
The report was prepared by Dr. Snethen. The investigation was accom-
plished under the general supervision of Mr. Clifford L. McAnear, Chief, ISMDI and Mr. James P. Sale, Chief, S&PL.
Director of WES during the conduct of this portion of the study and
preparation and publication of this report was COL J. L. Cannon, CE.
Technical Director was Mr. F. R. Brown.
16
162

CONTENTS
PaePREFACE.......................................
CONVERSION FACTORS, U. S. CUSTOMARY TO METRIC (SI)UNITS OF MEASUREMENT............................3
PART I: INTRODUCTION......................... ..
PART II: PHYSICAL AND ENGINEERING PROPERTIESOF OIL SHALES..............................7
Physical Properties...........................7Engineering Properties..........................11
PART III: CONCLUSIONS............................35
REFERENCES..................................38
TABLES 1-5
APPENDIX A: OIL SHALE RETORTING PROCESSES................Al
Tosco ProcessGas Combustion ProcessPetrosix Process
ij
163

CONVERSION FACTORS, U. S. CUSTOMARY TO METRIC (SI)UNITS OF MEASUREMENT
U. S. customary units of measurement used in this report can be con-
verted to metric (SI) units as follows:
Multiply BY To Obtain
inches 25.4 millimetres
feet 0.3048 metres
square miles 2.589988 square kilometres
acres 4046.856 square metres
pounds (mass) 0.4535924 kilograms
tons (short) 907.1847 kilograms
pounds (mass) per 16.01846 kilograms per cubiccubic foot metre
pounds (force) per 6.894757 kilopascalssquare inch
gallons per ton 0.0000041 cubic metres perkilogram
foot-pounds per 47.88017 joules per cubiccubic foot metre
degrees (angle) 0.01745329 radians
Fahrenheit 5/9 Celsius degrees ordegrees Kelvins*
To obtain Celsius (C) temperature readings from Fnhren'hit (F) rpqd-
ings, use the following formula: C = (5/9)(F - 32). To obtain Kelvin
(K readingrs, use: K (5/9)(F - 32) + 273.15.
164
k 4'\

A REVIEW OF THE PHYSICAL AND ENGINEERING PROPERTIES
OF RAW AND RETORTED OIL SHALES FROM THE
GREEN RIVER FORMATION
PART I: INTRODUCTION
1. Oil shale is a fine-grained, usually dark-colored (brown, gray,
or black) sedimentary rock containing kerogen, a complex organic matter
that decomposes on heating to yield oil. In the United States, the prin-
cipal concentration of oil shale is in the Green River Formation in the
three-state region of Colorado, Utah, and Wyoming. The Green River
Formation shows the greatest promise for commercial shale oil production
in the immediate future. The oil shale of the Green River Formation
occurs beneath 25,000 square miles* (16 million acres) of land in the
tristate area. Of the total amount, some 17,000 square miles (11 mil-
lion acres) are estimated to contain oil shale suitable for commercial
development (i.e., deposits at least 10 ft thick and averaging yields of
25 or more gallons of oil per ton). To be commercially feasible and
operate economically an oil shale retort plant should process an esti-
mated 25,000 to 50,000 tons of raw shale per day. Most of the currently
used surface retort processes and materials produce retorted shale
(spent shale, ash, etc.) at about 80 to 85 percent of total raw weight.
In other words, for each ton of raw shale entering the retort plant,
approximately 1600-1700 lb of retorted shale exists.
2. A major problem arises involving the efficient and safe dis-
posal of extremely large amounts of the retorted or spent shale (over
40,000 tons per day for 50,000-ton plant). Several options are avail-
able for the disposal of retorted oil shales: (a) filling the deep,
narrow canyons of the oil shale mine area with the spent shale; (b) back-
filling the mine with spent shale as the raw shale is removed; and
* A table of factors for converting U. S. customary units to metric
(SI) units of measurement is presented on page 4.
165
(c) using the spent shale for such productive uses as aggregate in as-
phalt or concrete mixtures, roadway base and subbase material, drilling
mud, cement production, building bricks, and mineral filler. All of
these options involve a determination and working knowledge of the geo-
technical properties of the retorted oil shale.
3. The purpose of this report is to summarize the published geo-
technical properties of raw and retorted oil shales from the Green River
Formation. The data summary provides a basis for comparison with adddi-
tional laboratory and field determination of geotechnical properties.
The data are limited to that published on the Green River Formation of
Colorado, Utah and Wyoming.
4. Possible sources of published geotechnical data were obtained
through personal contacts with Federal and state agencies involved in
oil shale development and through two computer based information re-
trieval systems: the National Technical Information Service, McLean,
Virginia, and the Smithsonian Science Information Exchange, Washington,
D. C.
166

PART II: PHYSICAL AND ENGINEERINGPROPERTIES OF OIL SHALES
5. Se ious interest in the production of shale oil dates back to
1920, with the interest fluctuating with the economy of the time and
variations in and concern over the estimates of the domestic petroleum
resources. During this period, several pilot studies and semiworks
plants produced varying amounts of retorted shale; however, concern
over the disposal of retorted shales and the corresponding need for
quantifying the geotechnical properties did not arise until the middle
1960's. This roughly corresponds to the time frame for the major en-
vironmental protection legislation. Prior to about 1967, few, if any,
geotechnical properties were determined for the retorted shale and only
limited data were measured on the raw shales. Since the published data
prior to this date was for raw shales only, the summary tables presented
in this report were divided between raw and retorted shales with thedata presented in chronological order. A survey of the information from
personal contacts and computer information services resulted in 27 ref-1-27
erences containing data pertinent to geotechnical properties of raw
and retorted shales. Table 1 summarizes general information pertinent
to the entries in the tables of properties for specific references.
Tables 2 and 3 summarize the physical and engineering properties of raw
oil shales. Table 4 summarizes physical and engineering properties of
retorted oil shales. In subsequent paragraphs, data for both raw and
retorted shales will be discussed in detail with emphasis on retorted
shale properties.
Physical Properties
6. The physical properties of interest to geotechnical engineers
are specific gravity, gradation, and Atterberg limits. Of equal impor-
tance but not considered to be a physical property is the classification
of the material using eiLher the Unified Soil Classification System
(USCS) or the American Association of State Highway and Transportation
Officials (AASHTO) system.
167
Z .-- . . . ..-- r

Specific gravity
7. The specific gravity may be expressed in three forms: (a) the
specific gravity of solids, which is applied to soils finer than those
passing a No. 4 sieve; (b) the apparent specific gravity; and (c) the
bulk or mass specific gravity. Both the apparent and mass specific grav-
ities are applied to soils coarser than the No. 4 sieve with the appar-
ent specific gravity routinely used when dealing with coarser materials.
The average value of the apparent specific gravity of raw oil shale
(Tables 2 and 3) varied from 2.02 to 2.36. The apparent specific grav-
ity was generally greater for the low-kerogen content shales and de-
creased with increasing kerogen content. No significant difference was
noted between the samples taken parallel and perpendicular to the shale
bedding planes. Mass specific gravity, available from only one refer-26
ence, and ranged between 1.99 and 2.20. For the retorted shales, the
apparent specific gravity ranged between 2.11 and 2.59 with the majority
of the values between 2.52 and 2.59. Mass specific gravity available Ffrom two references ranged between 1.80 and 1.85. These specific grav-
ity values are quite low in comparison with sandstone, limestone, basalt
and granite rockfill materials with values reported ranging from 2.29
to 2.84 for mass specific gravity and 2.65 to 2.87 for apparent specific
gravity.
Gradation
8. The gradation of raw shale provides very little useful informa-
tion since the gradation is dependent on mining operations and the type
of crusher and amount of crushing the material undergoes prior to re-
torting. Of greater significance is the gradation of retorted shales,
since it is helpful in classifying the material and thus qualitatively
indicating the suitability of the material for engineering purposes.
The influence of the retorting process on gradation is evident in Fig-
ure 1, which shows the gradation of a raw and retorted shale. As would
be expected, the retorting process breaks down the raw shale. For ex-
ample, the < No. 40 fractions for the raw and retorted shales are 43 and
62 percent, respectively. The'< No. 200 fractions for the raw and re-
torted shales are 11 and 37 percent, respectively. Appendix A gives a
168
. .I. aLi

6X 4 1 14l f 3 4 i L ID M1 01 ll01 4 11L+ -i- mt t u t- t i ,L-H i tim m_ u
-ll~l~tall
IS H.__
mp m -,- , - - 0-1 [
1Vl~K IML anort-
Figure 1. Comparison of raw arnd retorted oil shalegradations (from Reference 10)
detailed description of several different retorting processes. A funda-
mental difference in the raw shale gradations of the gas-combustion pro-
cess (Paraho process) and the Tosco process exists. Specifically, the
Paraho process uses the material between the 3- and 3/8-in. particle
sizes while the Tosco process operates on <3/8-in. particle sizes. Inthe Paraho Study2 6 the raw shale retort feed, raw shale reject, and
three combinations of the two raw shale gradations were tested to obtain
geotechnial properties of the raw materials. Figure 2 shows the two
basic gradations (A and C) and the combinations (gradations B, D, and E).
The raw shale feed, as screened, was 00 percent gravel-size particles.
The raw shale reject contained 45 percent gravel-size, 8 percent sand-
size, and 7 percent silt- and clay-size particles. The variability of
the gradation for various retorted shales is evident in Table 4. The
gravel-size particles ranged from zero to 79 percent and the silt and
clay size from zero to 63 percent. Samples in which the percent <0.005
mm (clay) was determined ranged from zero to 12 percent. The uniformity
coefficients for nearly all of the retorted samples were high with val-
ues beginning at 4.7 and going up to as high as 1822. The higher
169
I -

U I p -AIM11 a memo U. IN I f axom w .mmIt 3 1 J i| 4 4 410 1410 A 3o 40 to 10 to 10
- 1% CURV C
Figure 2. Gradations of raw shale samples used on Phase VII ofParaho Oil Shale Project (from Reference 26)
uniformity coefficients indicate a well-graded (or nonuniform for the
geologist) sample, which is generally more desirable when compaction and
strength properties are important. F.
Atterberg limits
9. Atterberg limits represent the end points and range of water
contents over which the consistency of the material varies. No Atter-
berc limit data are available on the raw shales, and only a very limited
amnount is available for the retorted shales. Generally, the retorted
materials are nonplastic. The two reported values of Atterberg limits
showed liquid limits of 30 and 33 and plasticity indexes of 6 and 3,
respectively.
10. Under the USCS, the retorted shales would be classified as GM,
SM, or MLff depending on the amount of gravel present in a specific sample
and the plasticity of the fines. Under the AASHTG system, the retorted
shales would be classified as A-l or A-3 materials. In general, the
classifications indicate good compaction characteristics, slight to me-
diurn compressibility, good to excellent strength values, and overall, a
170
T
. . .. . ..T - . . . . . .. ,
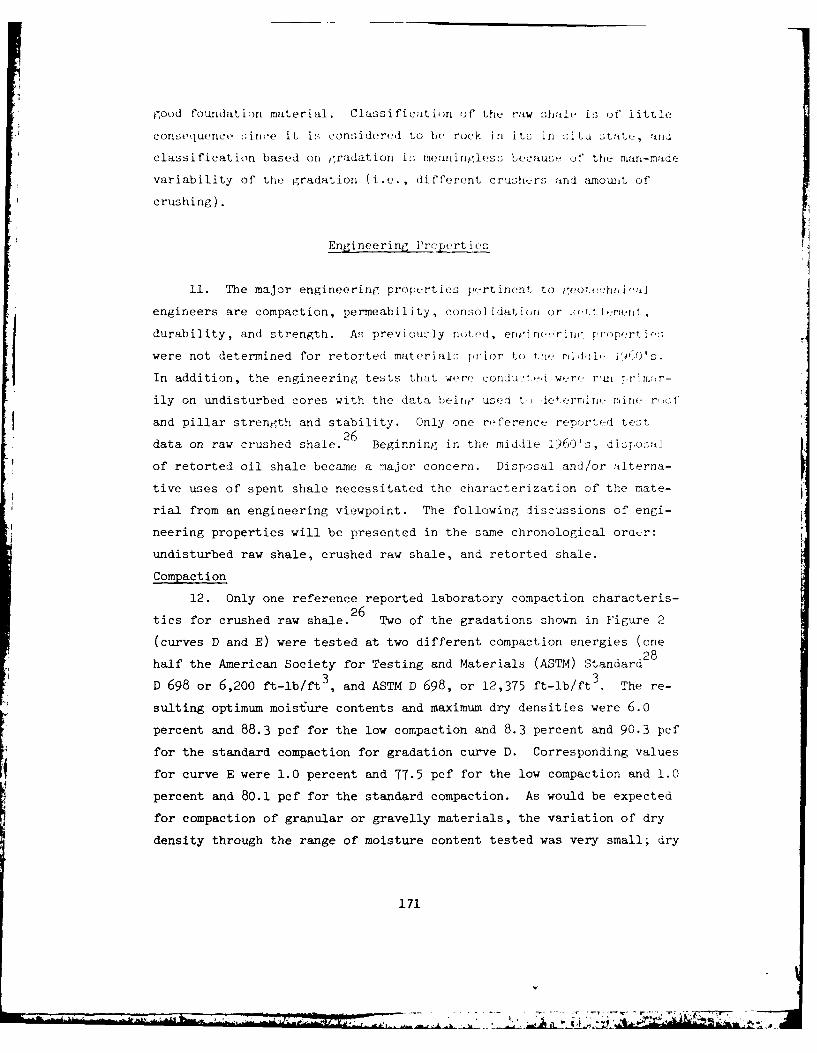
good foundation material. Classification of the raw shale is of little
consequence .irioe it is considered to be rock in its in s-itu state, rid
classification based on gradation is meanintgless because 0t' the man-madde
variability of the gradation (i.e., different crushers and amouit of
crushing).
Engineering Properties
11. The major engineering proPnerties pertinent to geoteehnijal
engineers are compaction, permeability, consolidation or settleneemt,
durability, and strength. As previously noted, eneerir troperti.
were not determined for retorted materials prior to tli, iPlf- IPi)'s.
In addition, the engineering tests that we*re conduu.i wr( r'ei tn nr-
ily on undisturbed cores with the data beirit used t 1eoerlin,- mine ret f
and pillar strength and stability. Only one reference reported test26
data on raw crushed shale. Beginning in the middle 1960's, disposal
of retorted oil shale became a major concern. Disposal and/or alterna-
tive uses of spent shale necessitated the characterization of the mate-
rial from an engineering viewpoint. The following discussions of engi-
neering properties will be presented in the same chronological oruer:
undisturbed raw shale, crushed raw shale, and retorted shale.
Compaction
12. Only one reference reported laboratory compaction characteris-
tics for crushed raw shale. 2 6 Two of the gradations shown in Figure 2
(curves D and E) were tested at two different compaction energies (one
half the American Society for Testing and Materials (ASTM) Standard28
3 3D 698 or 6,200 ft-lb/ft , and ASTM D 698, or 12,375 ft-lb/ft . The re-
sulting optimum moisture contents and maximum dry densities were 6.0
percent and 88.3 pcf for the low compaction and 8.3 percent and 90.3 pcf
for the standard compaction for gradation curve D. Corresponding values
for curve E were 1.0 percent and 77.5 pcf for the low compaction and 1.0
percent and 80.1 pcf for the standard compaction. As would be expected
for compaction of granular or gravelly materials, the variation of dry
density through the range of moisture content tested was very small; dry
171
-At

density varied from 89 to 91 pcf for a 10 percent change (0 to 10 per-
cent) in moisture content.
13. Considerable effort has been expended in developing the labor-
atory compaction characteristics of retorted oil shales since the im-
portance of compaction on the evaluation of disposal alternatives has
been determined. In addition, compaction of the retorted shales influ-
ences the other engineering properties. The major variable in estab-
lishing the compaction characteristics was compaction energy, with five
levels of compaction energy reported. The five levels and their cor-
responding ranges of optimum moisture content and maximum dry density
are presented in the following tabulation:
Compaction Energy ASTM Optimum Moisture Maximum Dry
ft-lb/ft3 Standard Content,percent Density, pcf
6,200 D 698 18.5-27.2 77.0-99.2
(50 percent)
12,375 D 698 15.5-31.0 78.6-103.2
19,700 D 1557 22.0 93.2-94.0(35 percent)
33,750 D 1557 17.4 106.7(60 percent)
56,250 D 1557 14.2-22.0 88.8-109.2
Other trends not obvious in this tabulation but apparent in Table 4 in-
clude (a) the obvious trend of lower optimum moisture content and higher
maximum dry density with increasing compaction energy and (b) the ac-
cepted trend of higher optimum moisture contents and lower maximum dry
densities with decreasing maximum particle size (i.e., more sands, silts,
and clays). The characteristic of small dry density changes over the
molding moisture content range exhibited by the crushed raw shale is
also predominant for the retorted materials. The range of maximum dry
densities of the compacted retorted shales under standard compaction
energy is somewhat less than would normally be anticipated for a GW
soil, which would normally range from 120 to 135 pcf.
14. Laboratory compaction data provide extensive insight into the
172
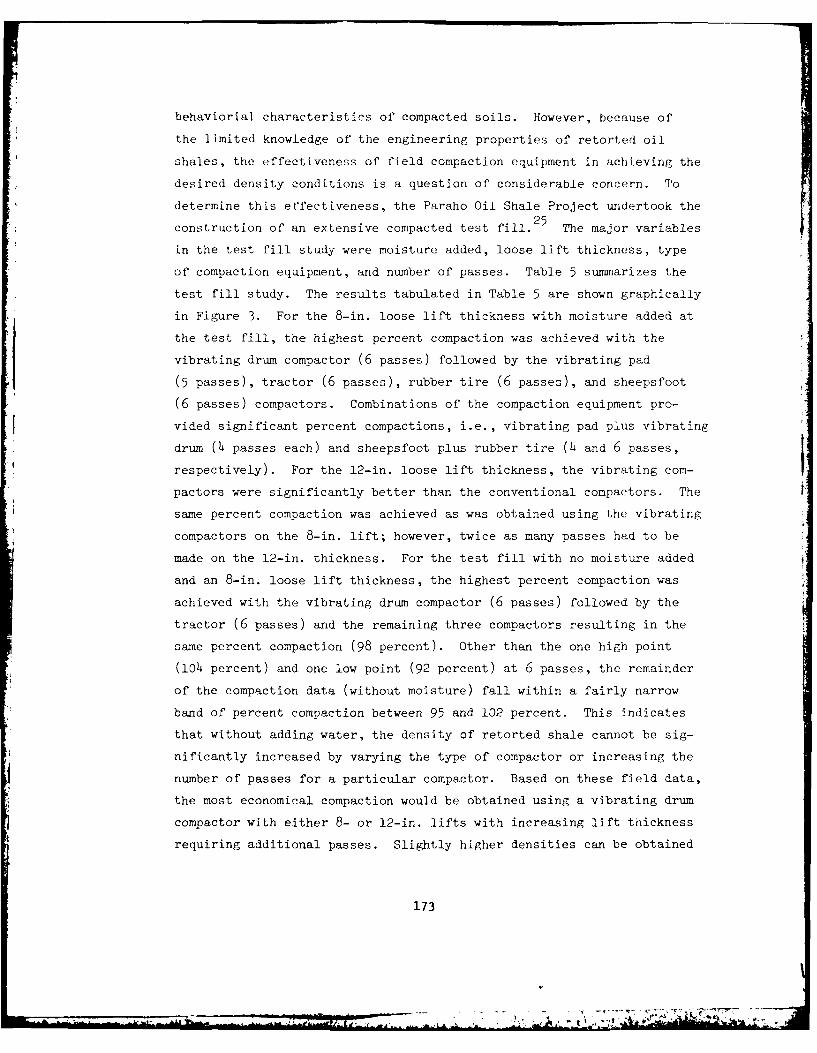
behaviorial characteristics of compacted soils. However, because of
the limited knowledge of the engineering properties of retorted oil
shales, the effectiveness of field compaction equipment in achieving the
desired density conditions is a question of considerable concern. To
determine this effectiveness, the Paraho Oil Shale Project undertook the25
construction of an extensive compacted test fill. The major variables
in the test fill study were moisture added, loose lift thickness, type
of compaction equipment, and number of passes. Table 5 summarizes the
test fill study. The results tabulated in Table 5 are shown graphically
in Figure 3. For the 8-in. loose lift thickness with moisture added at
the test fill, the highest percent compaction was achieved with the
vibrating drum compactor (6 passes) followed by the vibrating pad
(5 passes), tractor (6 passes), rubber tire (6 passes), and sheepsfoot
(6 passes) compactors. Combinations of the compaction equipment pro-
vided significant percent compactions, i.e., vibrating pad plus vibrating
drum (4 passes each) and sheepsfoot plus rubber tire (4 and 6 passes,
respectively). For the 12-in. loose lift thickness, the vibrating com-
pactors were significantly better than the conventional compactors. The
same percent compaction was achieved as was obtained using the vibrating
compactors on the 8-in. lift; however, twice as many passes had to be
made on the 12-in. thickness. For the test fill with no moisture added
and an 8-in. loose lift thickness, the highest percent compaction was
achieved with the vibrating drum compactor (6 passes) followed by the
tractor (6 passes) and the remaining three compactors resulting in the
same percent compaction (98 percent). Other than the one high point
(i04 percent) and one low point (92 percent) at 6 passes, the remainder
of the compaction data (without moisture) fall within a fairly narrow
band of percent compaction between 95 and 102 percent. This indicates
that without adding water, the density of retorted shale cannot be sig-
nificantly increased by varying the type of compactor or increasing the
number of passes for a particular compactor. Based on these field data,
the most economical compaction would be obtained using a vibrating drum
compactor with either 8- or 12-in. lifts with increasing lift thickness
requiring additional passes. Slightly higher densities can be obtained
173
vA
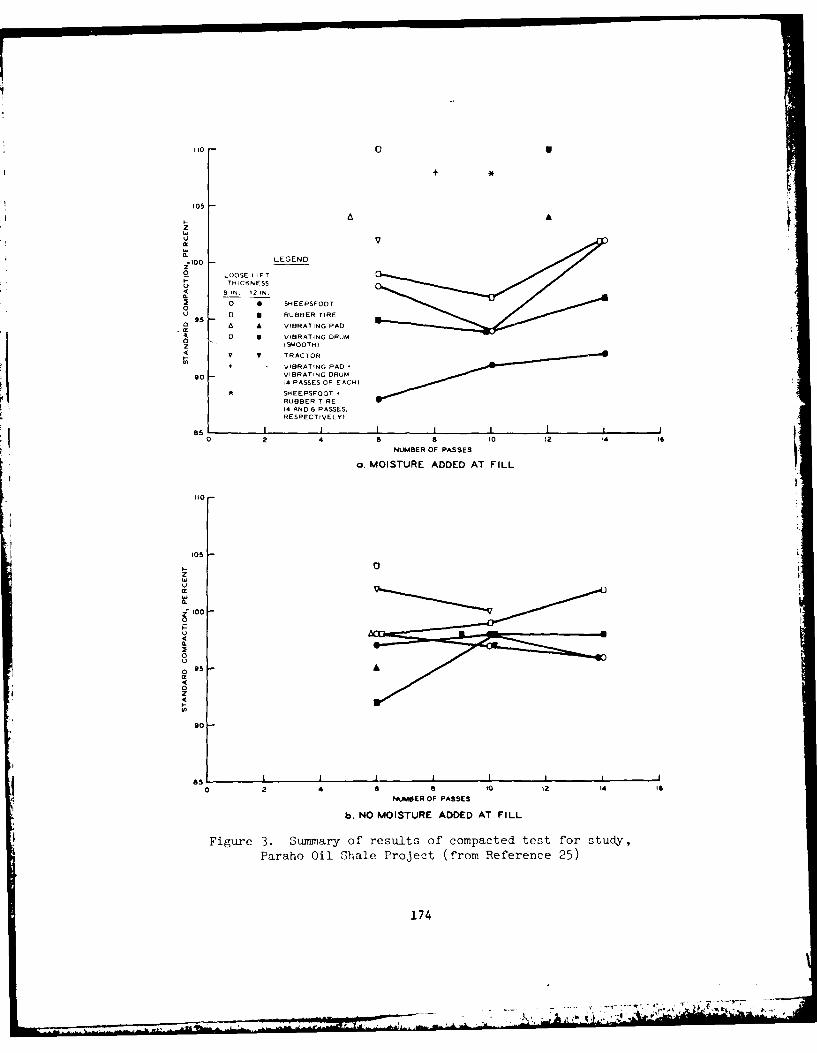
110 0
+ *
105
A
z
LOOSE LIFTTHICKNESSU
4 BIN. 121N.
0 0 SHEEPSFOOT0
95 0 U RUBBER TIRE
a A VIBRATING PAD)
a 0 VIBRATING DRUM
z (SMOOTH)
V I TRACTOR
+ VIBRATING PAD90 VIBRATING DRUM
14 PASSES OF EACH)
SM EE PSF0 OTRUBBER TIRE14 AND 6 PASSES.
850NUMBER OF PASSES
MOISTURE ADDED AT FILL
0.z 10U
~ 100
0U
95A
z
90
0 2 4 a a to 1 14I
NMB4ER OF PASSES
b. NO MOISTURE ADDED AT FILL
Figure 3. Summary of results of compacted test for study,
Paraho Oil Shale Project (from Reference 25)
174

by adding water; however, the cost of hauling and distributing water may
be prohibitive.
15. Table 5 shows the breakdown of the retorted shale by the vari-
ous compactors. Based on an average of all tests conducted, 10 percent
of the gravel-sized particles were broken down into the sand-, silt-,
and clay-size fractions. Particle breakdown was less for the wet fill
than for the dry fill construction.
16. Based on results of the test fill study, the filtration test
pond lining (Pond No. 1) was compacted using a vibrating drum compactcr.
An average percent compaction of 98 percent was achieved. A discussion
of the filtration test ponds will be presented in subsequent sections.
Permeability
17. The permeability of raw oil shale is an important property
when considering in situ retorting of the shale. Permeability durintr
in situ retorting is dependent on the temperature and pressure applied
during the process. 1 3 ,20 Permeability values for compacted raw shales,
reported in one reference,26 ranged from 10,500 to 14,500 ft ocr year
(uniaxial loading = 4 psi) for 3/8- and 1-1/2-in, maximum particle cizes,
respectively. For retorted shales, the permeability is important when
considering the stability of embankments constructed of the material an]
the pollution potential of rainwater leaching chemicals out of the dis-
posed shale. Under various loadings, the permeability varied as indi-
cated in the following tabulation. No definite trends were obvious from
these data, which show that considerable variation exists in permeabil-
ity values. However, accepted trends such as decreasing permeability
with increasing density and increased percent of fines were vuiified.
The amount of carbonate decomposition during retorting appeared to have
a significant influence on permeability: the higher the decomposition,
the greater the permeability. Since engineers are more familiar with
permeability presented in units of centimetres per second, the values i2
the following tabulation and Tables 3 and 4 can be converted by multi-
plying feet per year by 0.97 x 10- 6 to obtain centimetres per second.
175

Load (uniaxial) Permeability Dry Densitypsi ft per year pef 1
50 0.3-71 98.9-93.9100 0.25-52 98.9-93.9200 o.08-30 98.7-93.9
70 1.5-2088 96.7-77.0145 1.19-1016 96.7-77.0300 O. 3-480 96.7-77.01000 4.72-14.5 96.6-80.2
18. Field studies of the permeability of retorted oil shales were
conducted during the Paraho Oil Shale Project2 7 (Phase VII). In two
filtration ponds, one with a compacted lining and the other with an un-
compacted lining, the seepage and evaporation were monitored. The un-
compacted lining was found to have an average permeability of 2039 ft
per yesir while the compacted lining was found to have an average permea-
bility of only 4.24 ft per year. For comparison, laboratory permeabil-
ities on 6-in.-diam cores from the compacted lining ranged from 0.16
to 1.16 ft per year.
Settlement (consolidation)
1). Settlement (consolidation) properties are of minor consequence
for raw oil shales, but are very important in assessing the stability
of an embankment constructed of retorted shales since excessive settle-
ment could cause such an embankment to become unstable. In addition,
consolidation of retorted shale influences its permeability and strength
characteristics as well as the total volume required in a disposal site.
20. One reference reported settlement properties on compacted raw26 1,22shales with several references reporting on retorted shale.l 8 '222 4
The percent settlement for the various applied loads (ASTM D 698 energy)
is summarized in the folluwine tabulation:
Applied Load Settlement Dry Density
Material psi percent pcf
Paraho 50 0.7-2. o 95.5-88.0100 0.8-3.4 95.5-98.3200 . 8-4. 8 95.5-98.3
(1Cntiuei)
176

Applied L d Settlement Dry Density
Material psi percent pcf
Paraho ;.4-3.4 8.8-102.515 0. 7-14. 8 85.0-97.4300 0.8-5.6 85.0-97.4
1000 5.3-10.7 80.2-96.6
Tosc>, 1.00 0-15.5 86.6-56.5200 0.5-18.0 86.6-56.5
1000 1.0-23.0 86.6-56.5
!'ne common trend of decreasing settlement with increasing density was
not apparent for the ranges of settlements obtained for the Paraho ma-
terial; however, the trend was obvious for the Tosc, material. This is
probably a result of the limited range of densities tested for Paraho
samples compared with that of the Tosco samples. Quantitatively, the
minimuum percent settlements are well within tolerable limits for nearly
any application. In general, the maximum percent settlements up to
about 5 percent are tolerable if an adequate design is prepared to ac-
commodate the settlements. In other words, for both materials, settle-
ment can be effectively minimized by adequate compaction. So -etectable
difference was noted between the materials retorted by the direct or in-
direct heating modes. In the Paraho Oil Shale Study, the low carbonate
decomposition retorted shales settled roughly 1-1/2 to 2 times as muc-
23as the high carbonate decomposition shales. Adding raw shale reJect
material (<3/8 in.) to different carbonate decomposition samples re-
duced overall magnitude of settlement; however, the same trtsO of in-
creasine settlement with Jecreas;ine carbonate decomposition was ev ,:nt.
Soundness
21. The soundness of an atgrregate material is a measure of its
ability to resist degradation frm an applied force. Generally, sound-
ness is quantified using the Los Angeles Abrasion (LAA) test. For the
raw shale feel, the LA value was 10i percent (material loss), which ini-
iicate_ a high degree of soundness. Many State Highway Agencies require
maxim-um ILss values for concrete and base course aggregate -,. 40 per-
cent. The LAA values for retorted shales varied from 21.5 tc TO ier-
ceot loss. The sample with the 21.5 percent loss was taken frm the
177

Bureau of Mines (WUSBM) Demoni;tration Plant Stockpile and had beon
exposed lo thet climate for several years. 'The suggjes;ted reason for the
low LAA vatlue was that the .;ofter particles deposited in the stockpile
had probably broken down, leaviig only the hard, sound rocks that were
eventually tested. The more recent samples probably still include the;se
softer materials within the gradation normally tested in the LAA device;
hence, the high values of degradation.
Strength
22. The strength characteristics are most important in deternining
the stability or load-carrying capacity of the raw or retorted oil shale.
Strength has been quantified using several parameters and tests: modu-
lus values, unconfined compressive strength qu ' and triaxial shear
strength , C . Prior to the mid-1960's, no strength tests were con-
ducted on retorted shale. The only strength determinations made were on
undisturbed cores of raw shale to determine the size and stability of
underground mine openings.
23. Intact raw shale. The average o of undisturbed raw shale
cores varied between 9,660 and 25,700 psi. The major variables investi-
gated in the strength determinations were kerogen content and core sam-
ple orientation (parallel or perpendicular to bedding). Compressive
strength war greater for the low-kerogen-content shales, 7ith the ratio
of low- to high-kcrogen-content compressive strengths in excess of two.
Different Lation on the basis of core sample orientation was not as evi-
dent, however, in mos' cases the horizontally oriented (parallel to
beddlng) cores yielded slightly higher strengths. During the Paraho Oil
Shale Project, vu values were determined on core samples taken from
laref mine-run blocks. Values o' qu varied from 7,540 to 10,027 psi.
24. Leps 30 classified rockfill on the basis of unconfined compres-
sive strent of rocK cores in the following manner:
D ,trength
psi Classification
500-2,500 Weak rock particles
2,500-10,000 Average rock particles
10,000-30,000 Strong rock particles
178

Based on this clu ;sification, most of th(! raw shale would be considered
strong rock particles. Thu raw 'araho mat, orial exhibits the strength of
average rock particles.
25. Modulus values were determined for use in the roof and pillar
designs; however, the modulus of elasticity was the one most used and
most easily identifiable. The average modulus of elasticity for undis-
turbed core samples varied from 0.83 x 10⁶ to 6.025 x 10⁶ psi. As ex-
pected, trends identical to those set for the compressive strength were
obtained for the modulus of elasticity, namely, increasing modulus val-
ues with lower kerogen contents and horizontally oriented samples. The
other modulus values, rupture and rigidity, along with Poisson's ratio
v for raw shale are summarized in Tables 2 and 3. Modulus of elastic-
ity values ranged from 0.56 x 10⁶ to 0.82 x 10⁶ psi, and v varied from
0.28 to 0.36 (values determined using shear wave tests).
26. Compacted raw shale. For crushed raw shale, in particular the
<1-1/2-in. shale feed reject compacted at ASTM D 698 and one half AST4M
D 698 compactive efforts, the friction angle 0 values were 39 and
35 deg, respectively. Cohesion c values for the ASTM D 698 and one
half ASTM D 698 efforts were 19.4 psi (13.9 psi for saturated specimens)
and 22.9 psi (15.3 psi for saturated specimens), respectively.
27. Compacted retorted shale. Strength characteristics are most
significant from an engineering viewpoint when considering the disposal
of retorted shales. The parameters used to quantify the strength char-
acteristics in the reported data were ¢ , c , and qu
28. Retorted materials compacted at 10 percent ASTM D 698 compac-
tion energy were tested in unconsolidated, undrained (Q) triaxial and
15unconfined compression tests by the University of Denver. The results
of the unconfined compressive testing program are shown in Figure 4 and
the triaxial testing program in Figure 5. The qu increased with stor-
age or curing time, increasing storage or preconsolidation pressure for
constant curing time, and increasing molding water content. This latter
trend is contrary to accepted trends for this general type of material
(i.e., GW, ML); however, it may be explained on the basis of one of two
arguments. The first argument involves the more extensive development
179
-t

w w
1 0
0o oz
0I U 0 zL
aI 0
cd
N0 0
LiU -
0
o t
10-
0 0)
o0 N OD
IS~t Ob

40 40
a 30 20 I
01
20110
a. MOLDING W =5 PERCENT; -/ 66.4 -69.5 PCIF
40 40
30
W 30 201
U
10
20 - 1 1 0
b. MOLDING W 10 PERCENT; ^/ 61.1 67.4 PCF
40 40
30
W 30 20 a
10
20 I 00 10 20 30 40 so 60
STORAGE (CURING) TIME, DAYS
C. MOLDING W = 20 PERCENT; -d= 58.7 - 62.4 PCF
Figure 5. Influence of water content, storage time, and storage
pressure on shear strength parameters (from Reference 15)
181
-jWA

of cementitious reaction products as a result of the extra water made
available to the material. The second argument involves apparent cohe-
sion resulting from the surface tension effects of the increased water
content. A simple way to determine which argument is valid is to inun-
date the qu specimens prior to testing. If the soaked specimens main-
tain their strength, then the cementing reaction products argument is
valid; if the specimens crumble during soaking, then the apparent cohe-
sion argument is valid. During the laboratory testing program, none of
the specimens were soaked prior to testing; however, some of the addi-
tional chemical tests indicated that cementing reaction products did
develop in a somewhat similar process to lime stabilization. A second
and less obvious possible indication of the cementing reaction product
is shown in Figure 5. With increasing curing time, particularly at the
higher molding water contents, the role of cohesion in determining the
shear strength increases (i.e., the curves cross).
29. In a series of Q triaxial tests to develop strength parameters
for a stability analysis,18 4 and c were measured on compacted sam-
ples from the Tosco process with varying moisture contents and dry den-
sities. The results showed that 4 35 deg for all tests and that c
varied between 6.3 and 19.h psi, with c increasing with increasing
density. In a series of consolidated undrained (R) triaxial tests,
back-pressure saturated, the results were 4 = 20 deg and c = 0 .22
30. In Phase II of the Paraho Oil Shale Project, retorted shale
that had been stockpiled for several years was tested. R triaxial test
results on two different gradations compacted at optimum water content
and maximum dry density were 4 = 32.h deg and c = 17.4 psi for the
3/16 -in. maximum size and 4 = 34.2 deg and c = 2.2 psi for the
1-1/2-in, maximum size. In an attempt to determine the stabilization
potential of retorted shales and the influence of rapid curing at 125 0 F,
5 percent hydrated calcium lime was added to the material and qu val-
ues measured versus curing time. The results are shown in Figure 6. A
small increase in q was rioted for the 28-day cure at 125°F for speci-
mens containing no lime. Addition of the lime resulted in extremely
large strength gains, which is most unusual because soils with
182
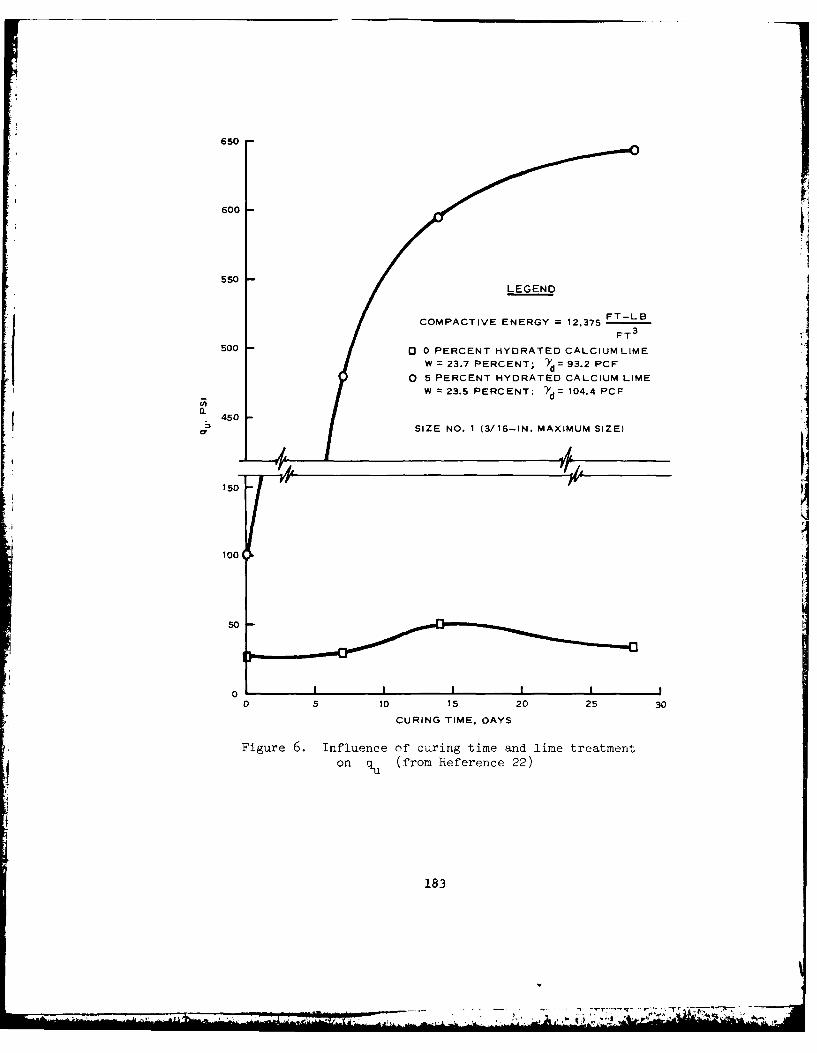
650
600
550LEGEND
COMPACTIVE ENERGY = 12.375 FT-LB
FT 3
500 /0 0 PERCENT HYDRATED CALCIUM LIME
W = 23.7 PERCENT; d = 93.2 PCF
0 5 PERCENT HYDRATED CALCIUM LIME/ W = 235 PERCENT; YXd= 1044 PCF
450C7 SIZE NO. I (3/16-1N. MAXIMUM SIZE)
IOq
oigur 6.InfuneofIRET Id 10.IC
0 5 1 15 20 25 30
CURING TIME, DAYS
Figure 6. Influence of curing time and lime treatmenton qu (from Reference 22)
183
plasticity indexes less than 10 do not respond to lime treatment. The
strength gains obtained would far exceed any of the generally accepted
criteria for quantifying stabilization potential; however, the results
should be viewed with some reservation. Rapid-cure procedures generally
consist of curing specimens at elevated temperatures for shorter time
periods (i.e., 30-90 hours) to simulate multiple-day curing (i.e., 7,
14, 21 days). It would appear that the procedure was incorrectly ap-
plied in this reference since apparently the samples were cured at 1250 F
for periods up to 28 days; therefore, it is not actually a true rapid-
cure procedure. In addition, the 125°F temperature is generally consid-
ered to be too high since the type and amount of reaction products are
dependent on the curing temperature. A more realistic temperature would
be in the range of 100-1050 F.
31. In Phase III of the Paraho Oil Shale Project, consolidated,
drained (S) triaxial and unconfined compression tests were run on three
gradations at different compaction energies for shales having two dif-
ferent amounts of carbonate decomposition. Values of 0 and c ranged
between 35.0 and 37.6 deg and 12.5 and 13.9 psi, respectively, for the
high carbonate decomposition without curing. For the low carbonate de-
composition without curing, and c ranged between 34.2 and 42.9 deg
and 9.7 and 13.2 psi, respectively. Comparable and c values were
obtained for both materials with the low carbonate decomposition shale
showing slightly higher 0 values. Curing comparable specimens at
ASTM D 698 compaction energy resulted in a decrease in 0 and a consid-
erable increase in c , which supports the cementing reaction product
argument. The q values likewise support this argument, as shown in
Figure 7. A significant increase in qu with time is evident for the
high carbonate decomposition shale, while the qu increase is much less
dramatic for the low carbonate decomposition shale.
32. In Phase IV of the Paraho Oil Shale Project, S and K
triaxial and unconfined compression tests, where K is the ratio of0
lateral stress developed to vertical stress applied, were run on re-
torted shales produced by direct and indirect heating modes of the re-
tort plant. The variables studied during tl"- testing program were
184
I 4 ~ -A ,~ -, -

160
140
120
80
60
40
LEGEND
20 0 HIGH CARBONATE DECOMPOSITION RETORTED MATERIAL, SIZE NO. 2(SAMPLE 1, LIGHT-COLORED RETORTED SHALEW = 19.8 PERCENT, Y ; 78.6 PCF)
dn LOW CARBONATE DECOMPOSITION RETORTED MATERIAL. SIZE NO. 2
(SAMPLE 2, DARK-COLORED RETORTED SHALE, W = 24.2 PERCENT, d; 95.2 PCF)
0 I I I I I I0 10 20 30 40 50 60
CURING TIME, DAYS
Figure 7. Influence of curing time on qu for high and low carbon-ate decomposition materials (from Reference 23)
185

molding water content, curing time, compaction energy, and seasoning
(mellowing) time. For the direct-heat retorted shale at optimum water
content and maximum dry density for each of three compaction energies,
0 and c ranged between 34.2 and 34.6 deg and 19.4 and 36.1 psi, re-
spectively. For the indirect-heat retorted shale at ASTM D 698 optimum
water content and maximum dry density, ¢ and c values were 29.2 deg
and 3.0 psi, respectively. The qu results corresponding to the pre-
viously described variables of water content, curing time, and seasoning
time are shown in Figures 8, 9, and 10, respectively. The previously
220
200
f 180
160
140
120
100
NOTE: SAMPLE IV-tB21-HR SEASONING TIME
80 60- DAY CURING TIME
'd 96.4 PCF
60
40 -
20
0II I I I
0 5 10 15 20 25 30
MOLDING W, PERCENT
Figure 8. Effect of molding water content on qu
(from Reference 24)
186

200
180
160
140
120
-~100
80
60LEGEND
COMPACTION ENERGY.SAMPLE W, PERCENT -yd PCF FT-LB/FT
3
o E-IA 20.7 91.2 12,375OZ I-lB 25.5 89.0 12.375
0 1O 20 3040 so 60CURING TIME, DAYS
Figure 9. influence of curing time on q(from Reference 2)4)
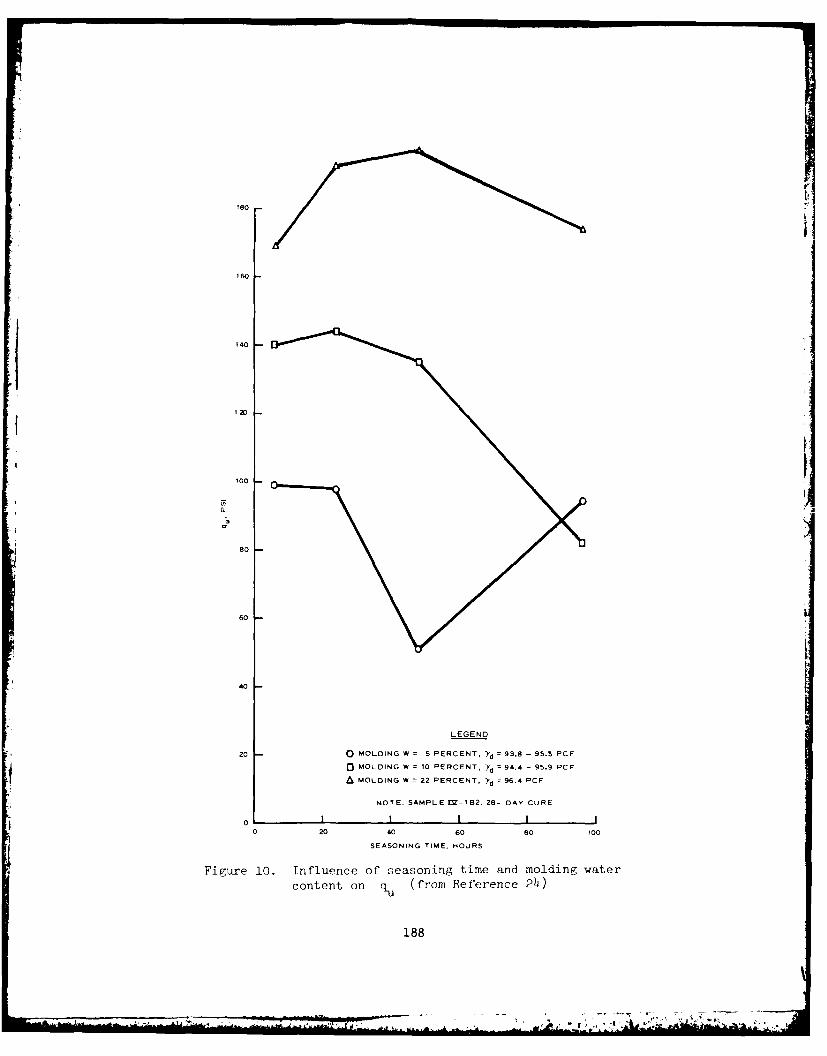
60
140
1 20
100
80
60
40
LEGEND
20 0 MOLDING W S PERCENT, -Yd =93.8 - 95.5 PCF
03 MOLDING W = 10 PERCENT, Yd = 44- 95.9 PC F
AMOLDING W 22 PERCENT. }Yd 96.4 PCF
NOTE. SAMPLE I- 1 2, 28- DAY CURE
0 I I0 20 40 60 s0 100
SEASONING TIME, HOURS
Figure 10. Influence of seasoning time and molding water
content on qu (from Reference 24)
188
- -- -.- ~- t

des cri bo.1 trerid for re t, rttti !hales of increa, ing q with increasing,
water content w:as vin Vident up to a moldin, water content of 15 per-
cent. Above 1,5 percent, the strengtth began to decrease, probably due
to the fact that excess water was available in the specimen. The ce-
menting reaction product effect is again evident in Figure 9 as the
strength increased with time.
Influence of mellowing time
33. In lime stabilization, the development of pozzolanic (cenm
ing) reaction products occurs at the contact points between particles
when the lime reacts with surfaces of the individual particles and forms;
the cementing agent. This reaction and the corresponding cementing ac-
tion occurs relatively fast, requiring that the particles be in close
proximity (i.e., compacted) within a reasonably short time (i.e., 24 to
48 hours) after the lime is introduced into the soil. The influence of
seasoning or mellowing+ time for retorted oil shales is comparable to that
of lime-stabilized soils (Figure 10). At the lower molding water con-
tents, the strength drops off rapidly after approximately 24 hours if
the specimens art not compacted by that time. With increasing molding
water content, qu increases and the seasoning time before strength
begins to decrease is extended. This is the result of the additional
water being available to enhance the amount of the reaction and extend
the reaction time. In other words, at the lower water contents the
amount of development of reaction products and length of time for de-
velopment is less because sufficient water is not available.
K. tests
24311. During the K triaxial testing program, duplicate speci-
0
mens were prepared and tested in unconfined compression. The major
variables investirted in the testing prog-ram were gradation, compaction
energy, and addition of additives (1 and 3 percent lime and cement).
The purpose of the testing program was to compare modulus of deforma-
tion Ed values with such properties as qu , K° , and v . The re-
sults of the K and tests are summarized in Table 4 and shown
graphically versus the previously mentioned properties in Figures 11,
12, and 13. Although the qu values for the 60-day cure specimens did
189
,~. C. ... . •..- ... S, :- [ ' . .. ii l

HIVALUE CONSIDERE0 EXCESSIVELY HIGH
40,000
.1 30,000 76-IN. OIAM 8Y 15-IN SEIMN
AND I -IN. MAXIMUM SIZE MATERIAL
20,000
3-IN. MAXIMUM SIZE MATERIAL
0 0 100 ISO 200 250
PSIq
LEGEND
10 28-DAY 1COMPACTED SPECIMENS -) IN. MAXIMUMo 60-DAY £HIGH, STANDARD, AND LOW COMPACTION
U28-DAY 1.LIME-TREATED --. IN. MAXIMUM
O60-DAY
A 20-DAY CEMENT-TREATED -. 2 IN. MAXIMUM
S28-DAY COMPACTED SPECIMEN - 11 IN. MAXIMUM
10 60+-DAY .4 HIGH, STANDARD, AND LOW COMPACTION
Firure 11. Trends of comparisons between F and u(from Reference 24) U
190

I
30,000
25,000
20,0000 X
\ \\
o x
15,000
5.0 ___ _
_oooo___ x x____
\0
00
0 0.1 0.2 0.3 0.4 0.5
K 0
LEGEND
o MINIMUM KoVALUES AND RESPECTIVE MODULUS
X AVERAGE Ko VALUES AND RESPECTIVE MOCULUS
0 MAXIMUM K 0 VALUES AND RESPECTIVE MODULUS
THE ABOVE ARE FOR 4-BY 10-IN. SPECIMENS
* AVERAGE Ko VALUES AND RFSPECTIVE MODULUS
FOR 6-BY 15-IN. SPECIMENS
i.isoo 12. .UJ!ry nf rl resulto lrom Ref.rence 0
191
1 6

AAGG317 ARM ENGINEER WATERWAYS EXPERIMENT STATION VICKSBURG--ETC F/G 8/7
AEOTECINICA PRPRTIES OF OIL SAERTTDSTTHE PARANO AND--ETC(U)
NOV III F C TPONSEND , R W PETERSON MOZAGRAN
UNCLASSIFIED WES/TR/L-79-22 N
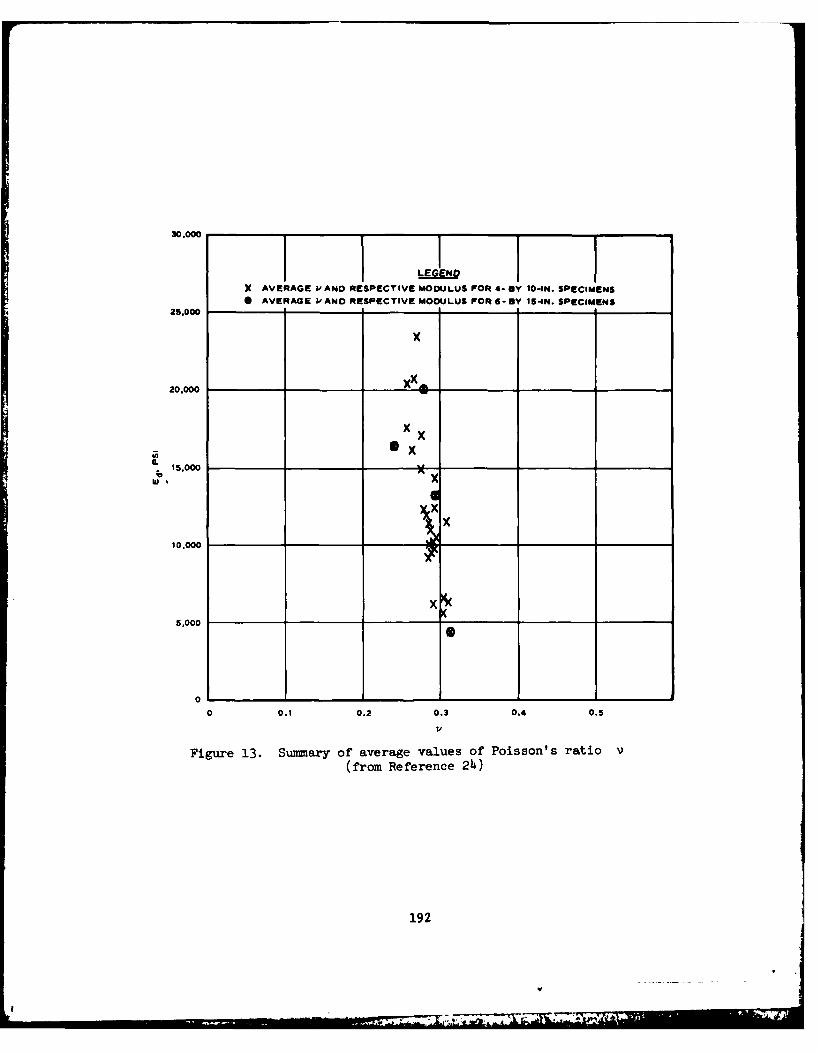
30.000
X AVERAGE 1/ AND RESPECTIVE MODULUS FOR 4-my I-IN. SPECIMENS
S AVERAGE ,dAND RESPECTIVE MODULUS FOR 6-8Y 15-4N. SPECIMENS
2S.000
x
20.000 X 0.
x xX
a 15.000 X
WU x
x10.000
x5,000
0
0 0.1 0.2 0.3 0.4 0.5
Figure 13. Summary of average values of Poisson's ratio(from Reference 24)
192
V

show some slight increase over the 28-day cure specimens, on the whole
there was very little discernible difference. This would indicate that
the cementing action that develops with time is essentially developed
prior to the 28-day cure limit. This finding is consistent with all of
the previous testing results. As expected, increased compaction energy
resulted in higher qu values. Addition of 1 percent hydrated lime re-
sulted in a distinct improvement in qu , i.e., 159.2 psi and 136.2 psi
for 28- and 60-day cures, respectively, as compared with 88.2 psi and
103.1 psi for the 30- and 60-day cures, respectively, without lime. Ad-
dition of 3 percent lime actually resulted in a decrease in values,
i.e., 117.9 psi and 122.3 psi for 28- and 60-day cures, respectively.
The probable explanation for this decrease is the hydration of the ex-
cess lime, which reduces the water available to the retorted material
for its own cementing reaction and reaction with the usable lime. Ad-
dition of 1 percent cement significantly increased qu , i.e., 183.6
psi and 154.3 psi at 28- and 60-day cures, respectively. Further in-
creases were obtained by adding 3 percent cement, i.e., 203.0 psi and
234.8 psi for 28- and 60-day cures, respectively. Although the qu
testing program on 1-1/2-in, maximum size particles was limited compared
with the 3/4-in. maximum size previously described, the qu values were
higher for the larger particle sizes.
35. The basic parameters obtained from the K testing were Ed
v , and K . The Ed values are indicators of strength and compres-
sion property variations. Values of Ed , v , and K0 from the test-
ing program are summarized in Table 4 and shown graphically as a func-
tion of one another and of qu in Figures 11, 12, and 13. Modulus
values, as expected, increased with increasing compaction effort; how-
ever, no distinct differences were noted between the 28- and 60-day cure
specimens. Adding lime increased the modulus values, but consistent
with the qu test results, the higher percentage of lime resulted in a
lower strength as compared with the lower lime percentage. Adding ce-
ment significantly increased the modulus values, following the same
trends set by the qu tests. Higher modulus values were obtained for
specimens molded from 1-1/2-in. maximum size particles. Average K0
193

values varied from 0.35 to 0.45 over the range of modulus values ob-
tained. Average v values ranged between 0.25 and 0.31 over the range
of modulus values obtained.
36. A total of four specimens, two K and two qu , were satu-
rated prior to testing. In both qu tests the strengths were higher
for the saturated specimens compared with those of specimens molded at
the same conditions and not saturated. Higher modulus and lower K0values were obtained for the saturated specimens versus their unsatu-
rated counterparts.
194
V

PART III: CONCLUSIONS
37. Whether disposal of retorted oil shales involves filling the
surface canyons in the oil shale mine area, backfilling oil shale mines,
or a productive use such as aggregates, the geotechnical properties of
the shales will determine the performance of the disposal structure
(i.e., embankment) or product (i.e., aggregates). During previous dis-
cussions, the important physical and engineering properties of raw and
retorted oil shales from available sources have been defined and briefly
discussed via available published information. Although the properties
exhibited considerable variability, the data did provide insight into
the behaviorial characteristics from a geotechnical point of view. Per-
tinent conclusions regarding the geotechnical properties are discussed
in the following paragraphs with emphasis on the properties of retorted
oil shale.
38. Published physical property data show that the apparent spe-
cific gravity of retorted oil shales generally range between 2.5 and 2.6.
Retorted oil shales are generally well-graded materials regardless of
the particle size (i.e., gravel, sand, silt, and clay) predominant in
the gradation. Retorted oil shales are classified as GM, SM, or ML mate-
rials by the USCS depending on the amount of gravel present and plastic-
ity of the fines. In the AASHTO System, retorted shales are classified
as A-1 or A-3 materials. Retorted oil shales are generally nonplastic;
however, measured plasticity indexes are less than 10 percent.
39. Compaction characteristics of crushed raw shale indicated op-
timum moisture contents between 1 and 8 percent and maximum dry den-
sities between 77 and 90, pcf depending on the gradation ard compaction
energy. For retorted shales over the same compaction energy range, the
optimum moisture content ranged between 18 and 31 percent and maximum
dry density ranged between 77 and 103 pcf. The crushed raw shale and
most of the retorted shales tested exhibited a generally flat S-shaped
compaction curve in which the density decreased in the lower end of the
moisture content range and then increased to the maximum value and be-
gan decreasing again.
195

40. Field compaction can be effectively achieved using routine
compaction procedures and equipment. Vibrating compactors, either pad
or drum, obtain maximum percent compaction with fewer passes than do
conventional compaction equipment. Water added at the compaction site
increases the efficiency of most compaction equipment. Adding water
also reduces particle breakdown compared with compaction of dry material.
41. Permeability of retorted oil shales is variable and, like most
material, is dependent on gradation, amount of compaction, and applied
load. Field studies show that compaction significantly reduces the per-
meability when leaching of chemicals by rainwater is considered a poten-
tial environmental hazard.
42. As with permeability, the settlement or consolidation prop-
erties are variable. The material follows the accepted trends of lower
densities resulting in larger settlements. Settlement properties were
distinctly affected by the amount of carbonate decomposition of the
retorted shales with low-carbonate decomposition shales settling 1-1/2
to 2 times as much as high-carbonate decomposition shales.
43. Retorted oil shales are not relatively hard materials since
their resistance to degradation by external force, i.e., soundness, is
generally less than minimum accepted values for concrete or base course
aggregates.
44. Reported compressive strength of undisturbed raw shales ranged
between 9,000 and 25,000 psi, with the lower strengths corresponding to
low-kerogen content shales and increasing as the kerogen content in-
creased. Sample orientation (i.e., parallel or perpendicular to bedding)
had a slight effect on strength with the parallel to bedding samples
yielding slightly higher strength. Reported modulus of elasticity
values ranged between 0.83 x 10⁶ and 6.025 x 10 6 psi and exhibited
trends similar to those for compressive strength, kerogen content,
and sample orientation.
45. Reported data on strength of compacted retorted shales showed
that strength increases with (a) increasing molding water content, (b)
increasing storage or curing time, and (c) decreasing seasoning or mel-
lowing time. The combination of these factors and their variations
196
indicates that the strength of retorted shales is analogous to that de-
veloped in lime-stabilized soils: the strength is dependent on the
development of pozzolanic reaction products or cementing agents between
individual particles. Increasing strength with increasing water content
indicates that the water is being used by the material to form the ce-24menting agents; however, one data source did show that strength
decreases after reaching a molding water content (Figure 8) of approxi-
mately 15 percent. The rapid increase in strength with time is typical
of strength that is dependent on cementing agents. in nearly all re-
ported cases, the major portion of the strength was developed by or
prior to the 14-day curing time.
46. Additives such as lime and cement showed distinct effects on
strength characteristics. One percent hydrated lime increased the
strength compared with that of the untreated material, but addition of
3 percent lime resulted in a decrease compared with the 1 percent
strengths. This would indicate an excess of lime, which would have a
tendency to reduce the water available to the shale to develop its own
cementing agent or to react with the usable lime. Addition of cement
at the 1 and 3 percent level resulted in continued strength gain with
increasing percent cement.
47. K testing of retorted oil shales indicated that E ialueso
varied between 5,000 and 24,000 psi, depending on the gradation and
compaction energy. Average K values ranged between 0.35 and 0.45
over the range of modulus values obtained. Average V values ranged
between 0.25 and 0.31 over the same range.
197
V

REFERENCES
1. Windes, S. L., "Physical Properties of Mine Rock," Report RI 4727,Part II, Sep 1950, U. S. Bureau of Mines, Washington, D. C.
2. Stanfield, K. E. et al., "Properties of Colorado Oil Shale," ReportRI 4825, Nov 1951, U. S. Bureau of Mines, Washington, D. C.
3. Wells, W. E. and Ruark, J. R., "Pilot-Plant Batch Retorting ofColorado Oil Shale," Report RI 4874, May 1952, U. S. Bureau of Mines,Washington, D. C.
4. U. S. Bureau of Mines, "Synthetic Liquid Fuels, Part II--Oil fromOil Shale," Report RI 4866 (Annual Report of the Secretary of theInterior), Jul 1952, Washington, D. C.
5. _ _ , "Synthetic Liquid Fuels, Part II--Oil from Oil Shale,"Report RI 4943 (Annual Report of the Secretary of the Interior),Jan 1953, Washington, D. C.
6. _ _ , "Synthetic Liquid Fuels, Part II--Oil from Oil Shale,"
Report RI 5044 (Annual Report of the Secretary of the Interior),Apr 1954, Washington, D. C.
7. Merrill, R. H., "Design of Underground Mine Openings, Oil-ShaleMine, Rifle, Colorado," Report RI 5089, Dec 1954, U. S. Bureau ofMines, Washington, D. C.
8. Blair, B. E., "Physical Properties of the Mine Rock," Report RI5130, Part III, Jun 1955, U. S. Bureau of Mines, Washington, D. C.
9. U. S. Bureau of Mines, "Synthetic Liquid Fuels, Part Il-Oil fromOil Shale," Report RI 5237 (Annual Report of the Secretary of theInterior), Jul 1956, Washington, D. C.
10. Sohns, W. W., Jukkola, E. E., and Murphy, W. I. R., "Developmentand Operation of an Experimental, Entrained-Solids, Oil-Shale Retort,"Report RI 5522, 1959, Washington, D. C.
11. Matzick, A., Danneberg, R. 0., and Guthrie, B., "Experiments inCrushing Green River Oil Shale," U. S. Bureau of Mines Report RI5563, 1960, Washington, D. C.
12. Tisot, P. R. and Murphy, W. I. R., "Physical Structure of Green RiverOil Shale from Colorado," U. S. Bureau of Mines Report RI 6184, 1963,Washington, D. C.
13. East, J. H., Jr., and Gardner, E. D., "Oil-Shale Mining, Rifle,Colorado, 1944-56," U. S. Bureau of Mines Bulletin 611, 1964,Washington, D. C.
14. Haugan, S. E., "Initial Evaluation of the Physical Properties of OilShale Ash," Master of Science Thesis, Aug 1967, University of Denver,Denver, Colo.
15. Straek, J. M., "An Investigation of the Shear Strength Characteris-tics of Oil Shale Ash," Master of Science Thesis, Jun 1969, Universityof Denver, Denver, Colo.
198
V

16. Nevens, T. D., Culbertson, W. J., Jr., and Hollingshead, R., "Dispo-sal and Uses of Oil Shale Ash," Final Report, U. S. Bureau of MinesProject No. SWD-8, Apr 1970, Denver Research Institute, Universityof Denver, Denver, Colo.
17. Tisot, P. R. and Sohns, H. W., "Structural Deformation of GreenRiver Oil Shale as It Relates to In Situ Retorting," U. S. Bureauof Mines Report RI 7576, 1971, Washington, D. C.
18. Atlantic Richfield Company, "Processed Shale Studies," EnvironmentalImpact Analysis, Appendix 5, Colony Development Operation, Feb 1974.
19. Schmidt, R. A. and Schuler, K. W., "Mechanical Properties of OilShale from Anvil Point Under Conditions of Uniaxial Compression,"Report SAND-74-0035, Sandia Laboratories, Aug 1974, Albuquerque,N. Mex.
20. Burwell, E. L., Tihen, S. S., and Sohns, H. W., "Permeability Changesand Compaction of Broken Oil Shale During Retorting," U. S. Bureau ofMines Report RI 7860, 1974, Washington, D. C.
21. Gromko, G. J., "A Preliminary Investigation of the Feasibility ofSpent Oil Shale as Road Construction Material," paper presented at54th Annual Meeting of the Transportation Research Board, Jan 1975,Washington, D. C.
22. Holtz, W. G., "Research and Development Program on the Disposal ofRetorted Oil Shale - Paraho Oil Shale Project," Phase II, InterimReport, U. S. Bureau of Mines, Feb 1975, Washington, D. C.
23. , "Research and Development Program on the Disposal ofRetorted Oil Shale - Paraho Oil Shale Project," Phase III, InterimReport on Oil Shale Retorted in Pilot Plant, Apr 1975, Woodward-Thorfinnson & Associates, Inc., Denver, Colo.
2h. , "Research and Development Program on the Disposal ofRetorted Oil Shale - Paraho Oil Shale Project, " Phase IV, InterimReport No. 1 on Shale Retorted in Semi-Works Plant by Direct HeatingMethod, Aug 1975, Woodward-Thorfinnson & Associates, Inc., Denver,Colo.
25. Retorted "Research and Development Program on the Disposal ofRetorted Oil Shale - Paraho Oil Shale Project," Phase V, InterimReport on Field Compaction Studies on Shale Retorted in Semi-WorksPlant by Direct Heating Method, Feb 1976, Woodward-Clyde Consultants,Rocky Mountain Region, Denver, Colo.
26. , "Research and Development Program on the Disposal ofRetorted Oil Shale - Paraho Oil Shale Project," Phase VII, InterimReport on Raw Shale Tests, Jul 1976, Woodward-Clyde Consultants,Rocky Mountain Region, Denver, Colo.
27. , "Research and Development Program on the Disposal ofRetorted Oil Shale - Paraho Oil Shale Project," Final Report, Dec1976, Woodward-Clyde Consultants, Rocky Mountain Region, Denver,Colo.
199
W
28. American Society for Testing and Materials, Standard Test Methods
for Moisture-Density Relations of Soils, Using 5.5-lb (2.5-kg)
Rammer and 12-in. (304.8-mm) Drops, Designation D698-70, 1977 AnnualBook of ASTM Standards, Part 19, 1977, Philadelphia, Pa.
29. American Society for Testing and Materials, Standard Test Methods
for Moisture-Density Relations of Soils, Using 10-lb (4.5-kg)
Rammer and 18-in. (457-mm) Drop, Designation D1557-70, 1977 AnnualBook of ASTM Standards, Part 19, 1977, Philadelphia, Pa.
30. Leps, T. M., "Review of Shearing Strength of Rockfill," Journal of
the Soil Mechanics and Foundations Division, Vol 96, No. SM 4, ASCE,1970, New York, N. Y.
2
200

Table 1
Summary of Material and Sample Description and Location Information
ReferenceNo. Date Material Location Sample Description/Desixnation Remarks
1 1950 Green River Rifle Oil Shale Mine, Raw shale, Designated Group Tests run on cores frow ver-Formation Rifle, Colo. No. 29 in Reference tical and horizontal core
holes for high- and low-kerogen materials
2 1951 Green River USBM Oil Shale Demon- Raw shale, 16 samples desig- Tests run on core samplesFormation, stration Plant, nated in two groups - "Six (3/4-in.)Mahogany Rifle, Colo. Celected Colorado Oil Shales"Ledge (6) and "Mineable Bed
Samples" (10)
3 1952 Green River USBM Oil Shale Demon- Raw shale, retort feed Gradation of crushed raw shaleFormation, stration Plant, only data presentedMahogany Rifle, Colo.Ledge
1952 Green River USBM Oil Shale Demon- Raw shale, retort feed Gradation of crushed raw shaleFormation stration Plant, only data presented
Rifle, Colo.
5 1953 Green River USBM Oil Shale Demon- Raw shale, retort feed Gradation of crushed raw shaleFormation stration Plant, only data presented
Rifle, Colo.
6 1954 Green River USBN Oil Shale Demon- Raw shale, retort feed Gradations of raw shale forFormation, stration Plant, different crushers and mineMahogany Rifle, Colo. runLedge
7 1954 Green River USBM Oil Shale Demon- Raw shale Tests run on core parallel andFormation, stration Plant, perpendicular to bedding cnMahogany Rifle, Colo. roof and pillars by 3 dif-Ledge ferent laboratories
B 1955 Green River USBM Oil Shale Mine, Raw shale, Designated Group Tests run on cores from ver-Formation, Rifle, Colo. No. 41 in Reference tical and horizontal coreMahogany (near Book Cliffs) holes for high- and low-Ledge kerogen materials
9 1956 Green River USBM Oil Shale Demon- Raw shale, retort feed Gradation of mine run shaleFormation, stration Plant, only data presentedMahogany Rifle, Colo.Ledge
10 1959 Green River USBM Anvil Points Raw and retorted shale Gradation of shale fee6 andFormation, Mine, Rifle, Colo. retorted shale only dataMahagony presentedLedge
11 1960 Green River USBM Oil Shale Mine, Raw shale Tests run on cores from ver-Formation, Rifle, Colo. tical and horizontal coreMahogany holes. Most information onLedge crushers and corresponding
gradaton
12 1963 Green River USBM Oil Shale Mine, Raw shale Tests run on shales followingFormation, Rifle, Colo. removal of organic constit-Mahogany uents. Data include par-Ledge ticle size distribution,
specific surface area and,pore sizes
13 1964 Data same as presented in Reference 7 with some additional discussion
14 1967 Green River Not specified in Retorted shale Tests run on reheated retortedFormation, Reference shales using 1-in.-dam. xMahogany 2-in.-high remolded speci-Ledge mens. Data not included in
summary table because too
many variables and too fewsamples were used.
15 1969 Green River Not specified in Retorted shale Tests run on reheated retortedFormation, Reference shales using l-in.-dism.Mahogany 2-1n.-high remolded specimensLedge
(Continued)
201

Table I (Concluded)
No. Date Material Location Sample Description/Desgigntion Remrks
16 1970 Green River Below Mahogany Marker) Retorted shale Majority of data is taken fromFormation, Colony Mine J Designated BM References l4 and 15. Re-Mahogany Above Mahogany Marker) Raw and retorted shale maining data include numer-Ledge USBD Mine Designated AN ous variables. Data not
included in summary tables17 1971 Green River USE4 Experimental Raw shale Tests run on 3/4-in.-diam. .
Formation, Mine, Rifle, Colo. 1-1/2-in.-high cores of high
Mahogany pressures and temperaturesLedge to simulate insitu retorting.
Data not included in sumarytables
18 1974 Green River Parachute Creek Oil Retorted shale Test data on parts 2, 4, and 5Formation Shale Plant, Colony
DevelopmentOperation
19 1974 Green River USBM Anvil Points Raw shale Tests run on low-, moderate-,Formation Mine, Rifle, and high-Kerogen shales
Colo.
20 1974 Green River Various locations Ray shale Tests run at high temperaturesFormation and pressures to simulate
insitu retorting. Data notincluded in summry tables
21 1975 Green River USEN Laramie Energy Retorted shale Test run to evaluate use ofFormation Research Center. retort shale as highway con-
Larame, Wyo. struction material
22 1975 Green River USB4 Demonstration Retorted shale Tests run on remolded specimens(Feb) Formation Plant Stockpile, (Phase II of Paraho Oil Shale blended to reproduce the orig-
Anvil Point, Colo. Study). Designated: inal gradation of stockpiledSize 1. < No. h materialSize 2. < 3/4 in.Size 3. < 1-1/2 in.
23 1975 Green River USBM Experimental Retorted shale from pilot Tests run on remolded specimens(Apr) Formation, and Demonstration plant. Designated: for high and low degrees of
Mahogany Facility, Paraho Size 1. < 1-1/2 in. carbonate decompositionMember Oil Shale Project Size 2. < 3/4 in.
(Phase III), Anvil Size 3. < No. 4Points, Colo. Samples taken from exit
conveyor belt
24 1975 Green River USBM Experimental Retorted shale from semi-works Tests run on remolded specimens(Oct) Formation, and Demonstration plant. Designated: representing direct and in-
Mahogany Facility, Paraho IV-lA direct heating modes of the
Member Oil Shale Project IVB-lB Dire reoreyor
(Phase IV) IV-IB2 (Direct)
IV-Sl Stockpile (Direct)IV-SCl Stocking Conveyor
(Direct)IV-IIH Discharge Conveyor
(Indirect)
Raw shale Tests run on cores cut fromblock samples
25 1976 Green River USEM Experimental Compacted test fill using Percent compaction determined(Feb) Formation and Demonstration retorted shale from Semi- for various equipment and
Mahogany Facility, Paraho Works Plant coverage combinationsMember Oil Shale Project See sample IV-IB for lab
(Phase V) properties
26 1976 Green River USBM Experimental Ray shale Tests run on different grada-(Jul) Formation and Demonstration Sample designations tions blended to meet desired
Mahogany Facility, Paraho VII-l. Raw shale feed conditions. Tests run onMember Oil Shale Project VII-2. Block samples cores cut from block samples
(Phase VII) (Feb 75)VII-3. Block samples
(Dec 75)
27 1976 Green River USBN Experimental Retorted shale. Infiltra- Infiltration tests run to deter-(Dec) Formation and Demonstration tion ponds constructed of mine permeabilities
Mahogany Facility, Paraho discharge conveyor materialMember Oil Shale Project
(Phase VI)
(Note: Separate report not prepared. Data appear in Chapter 10 of Reference 27.)
202
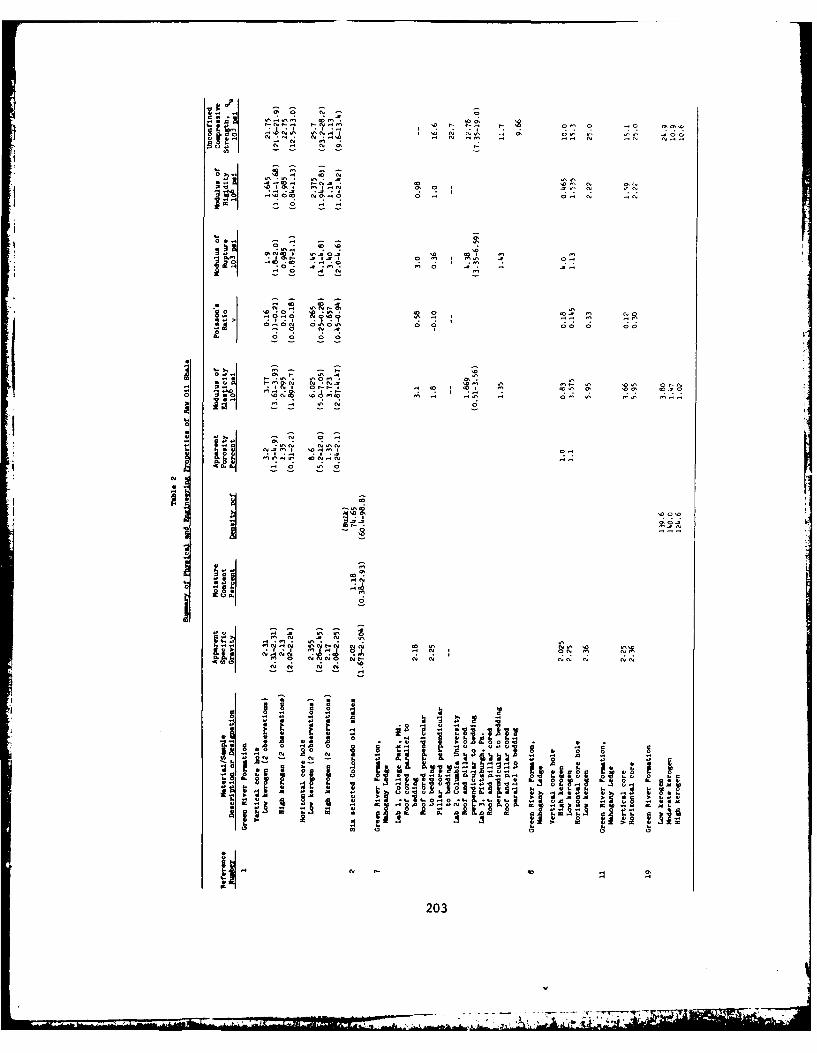
0 N
t.0~~~~~. t.N- -' - - 0 .- 0
4.1 0
.4 c4 4 N
'al A. .
o N
v. !0 I .7' 1 0 . 23 k!'-
* H C CZ
N 81, O 0'0C SN
- Fe Nar0.47 . .4 .. u
CHON C AO4 ~030 C 0

2 Gradation Co compaction
V $.,
0 (n 1-Sp c me 1 6
4) C~ =
Bloc 3 Seimn34
im I c
24 Green River Formation,
Paraho Oil Shale Project
Block 1 (Specimen 1-6)Block 2 (Specimen 2-2)Block 3 (Specimen 3-14)
26 Green River Formation,Paraho Oil Shale Project
Sample VII-11-1/2 - 3 in. (shale 2.11 1.99 3 100 0 0 0 .. . ..
feed)3/8 - 3 in. (shale 3 100 0 0 0 55 22 2.5
feed), Curve A3/4 - 1-1/2 in. (shale 2.20 1-1/2 100 0 0 0 -- .. .
feed)
-3/4 in. (shale feed 3/4 50 43 7 -- ..+10% of -3/8 in.)
-3/8 in. (shale feed 2.12 3/8 45 48 7 2 5.2 0.2 26reject), Curve C
-1-1/2 in. (shale 1-1/2 84 14 2 0 23.0 1.5 15 6,200 6.0 88.3feed +10% of -3/8 12,375 8.3 90.3in.), Curve D
3/8 - 1-1/2 in. (shale 2.15 1-1/2 100 0 o o 28 14 2 6,200 1.0 77.5
feed), Curve E 12,375 1.0 80.1
Sample VII-3Raw snale cores fromblock sample (Avg.of 9 samples)
Note: D60 z Grain-size diameter at 60 percent passing.D6 0 Grain-size diameter at 60 percent passing.
Cu = Coefficient of uniformity, D 6/D10.6d 79 p f; Loading = 6 psi.6d 80.7 pcf; Loading = 4 psi.
~ d 07 cf oain 1 pi
' . . -- ---': -7-- , -- . ."

Table 3
3Sinary of Ph~ysical and Engineering Properties of Raw Paraho Study Oil Shale
Permeability, ft/yr Settlement, % (Cossolidation) Triaxial Shear tunca
4j At Loading, psi At Loading, psi Friction Cohesion ut0. psi
a~ 0 0a4
L. 0 0S Cu0 0 0~ 0 43
4j 14 N 4CU 04Cdo
8.3
10 ,50O*
3 4. 7.6 l450~35 0.70 22.9 15.33 84 8 7 . 4 5 0 *39 0.81 19.4 13.9
80.5 62.4 1.0 2.0 1..5 20.02.0 3.0 6.0 17.5
1.3(o.8-
2.5)
2
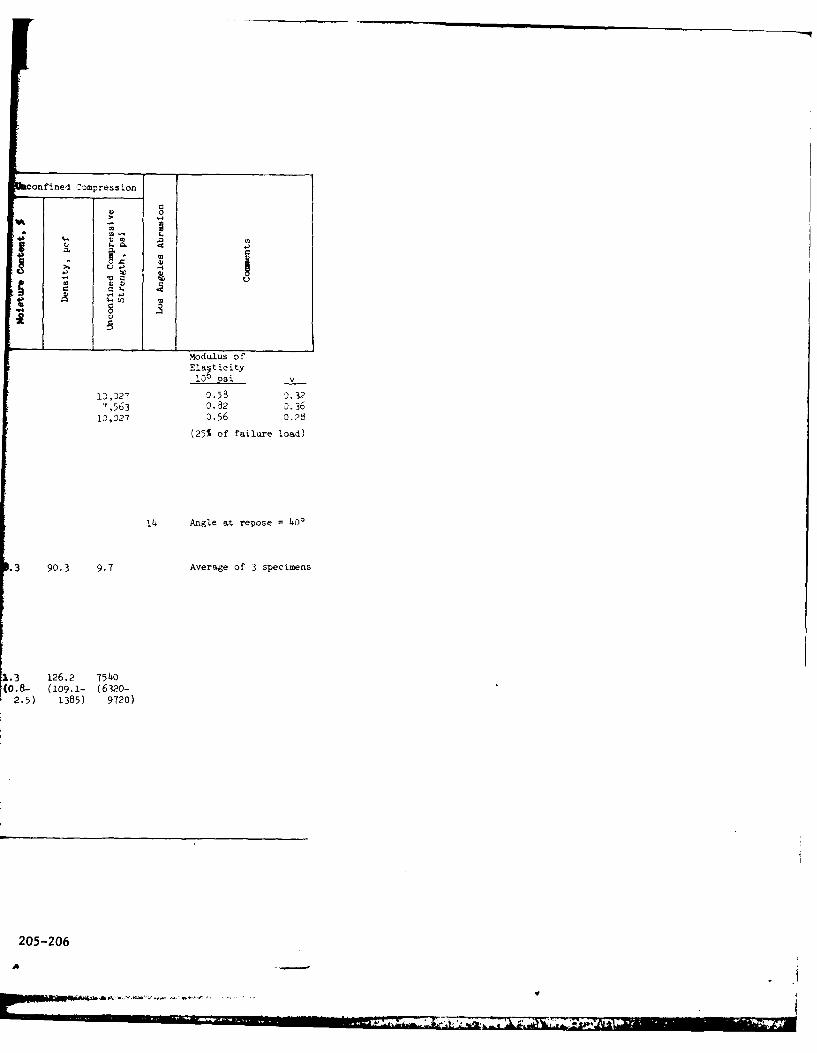
confined Compression
4) 0
Vi
A V4- Z. t
Moduus of
Elaqticity.00 psi V
10,027 0.55 0.327,563 0.82 0.36
10,027 0.56 0.28
(25% of failure load)
14 Angle at repose = 400
.3 90.3 9.7 Average of 3 specimens
1.3 126.2 7540(0.8- (io9.1- (6320-
2.5) 1385) 9720)
205-206
A -
WE -

1% ';ten RierSFavetto
AA I c.
Rte.ele retorted shale
18 Green River Formation 3/8 8.2 59.9 3 1.1 0.71 0.032 29 1i,' 19.4 5
(Part ) Cotony (e/o15nt 4 - 2.- (17.1 (0.2- (.014- (4.7Operatior ;-mi-works 1/2) 19. 0) 76.2) 4 . 2.11) 0.05) 111) P .4)
Plant (Avg of 14 1,750 17.4 106.7
otperration unless ( 16.6- (o6.5-oterwi sr noted)
18.1) 105.h8)
56,250 15.1 138.5
(14.2- (1-7.3-17.2) 109.2)
19 Green Rioer Pormtatio.g 2.525 3/06 0 47 53 -- 0.095 0.0065 15 30 6 56,257 (7.0 10§.2 32.0
(Part 4) Colony Oeveiopement 52.5
Operation Semil-works 86.5
Pflsnt 69
19 jreeo hiner Formatin(Part 5) Colony SroelopBnst
Ope rat ion Semi-works
21 Green River Formation 1.85 3/4 53 47 0 0 7 0.074 95 -- NP
isrssle E'ne~ ResearchCotter
22 Green River Fornatn. 3 48 20 32 12 8.2 0.0045 1822 33 3SBm Expe rintal and
O-ent ratioa Tanit-
ity. Paraho Oil ShaleProjectAn rerelewed
Sine 1 2.53 3/16 0 37 63 -- 0.060 0.0024 25 .... 6,2O 21.7 11.3 64.9 85.9
12.375 3?.7 43.2 90.) 91.1 1.5756,,250 19.9 "9.5 06.; 9 5.0
Si2e 2 2.13 3/4 26 30 4 -- 0.50 .0034 147 . . 6,200 10.9 95.8 92.5 92.8
12.375 20.2 40.3 35.3 94.2 0.5656 '250 15. 3 13 .6 102.5 99.:;
Size 3 2.11 1-1/2 42 22 36 -- 5.8 .003L
1705 . : 6270 19.5 99.3 34.4 93.8
12,375 15.5 13.2 1 3 '
5.8 1.32
2 Green River o tlon4 .0 104.2
SBN Exprrnisetal adDemonstration FNcil-
ity. Paraho 011 ShaleProject
High Carbonate Deccaousition
r reei'ed 2.56 3 76 17 7 2 13 0.21 62 -- NPLos, Caronate lecomp-sitlon
A -reied 2.58 3 73 20 7 5 12 0.033 364 -- NP
High Crotate b evo- (70 ps) (,ition 82.3 S9-2
Sloe 1 2.56 1-1/2 79 14 7 -- 0
1-1/2 54 28 18 -- 6,202 22.0 77.0 76.5 03.6 2088
1-1/2 50 00 19 -- 12,375 19.8 60.2 82.O 79.8 1571-1/2 48 32 20 -- 56,250 22.0 88.8 97.0 88.1 51.01-152 6 12 12.75 21.8 8. -- 828
Low Carbonate ecoqlpO-son L5.a76.
Si-e 1 2.58 1-1/2 72 16 12 .0 . '6.71
1-1/2 49 25 26 -n,0 0
22.0 93.0 0.7 91,i 199.0
1-1/2 45 19 36 -- 12,375 22.0 96.6 3 0.6 96.1 167.6
1-112 35 27 38 -- 56,250 2 2
"r 10.5 36.9 102.4 2.10
1-1/2 52 24 24 -- 12,375 24.0 36.6 -- 2.3
HIfn -Carbonste DeCOMP-sltin,
Sine 2 3/4 70 20 40 - 12,375 10.8 78.6 --
Note: D60 eGrIn-siz di aater at 60 prcent passing.
0 C Orain-size dalseter at 10 percent passing.
C, Coefficlent of uniformity, D60/DlO.
1oading rodltlons for Referenoe 23 only.
/
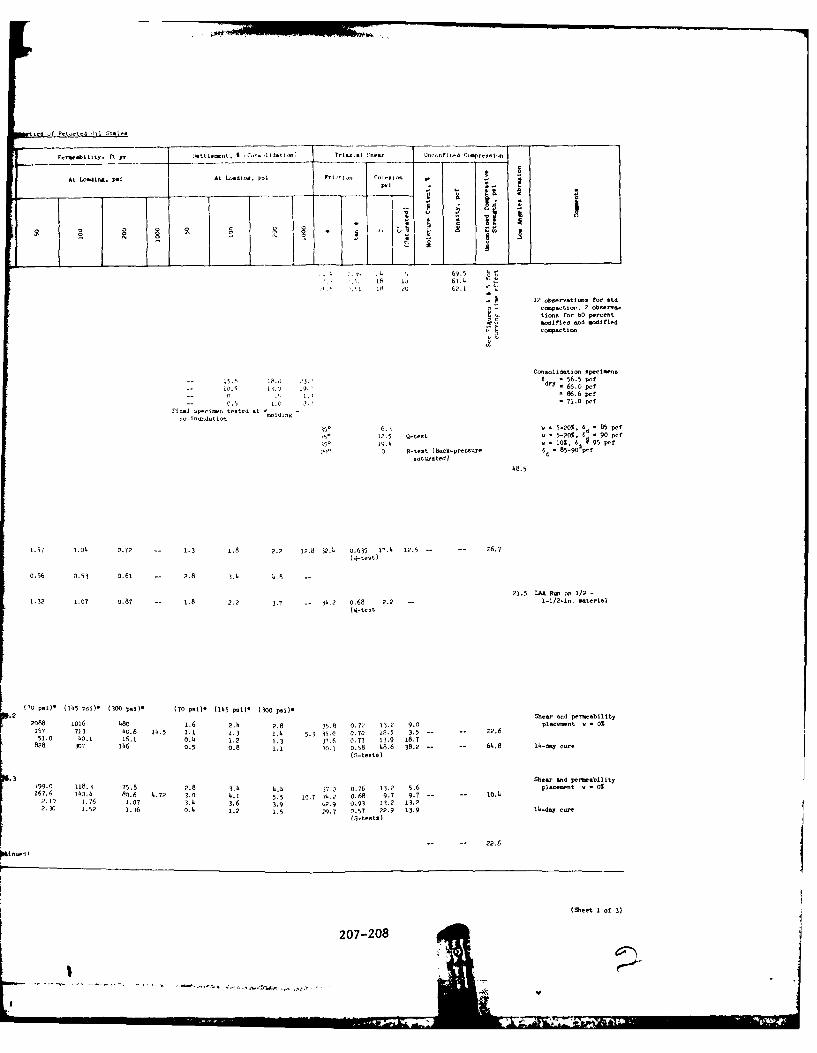
p., ..atlls, MO Y'- It~ t -111-n. q 7i.i. t0nont ratl *r u-Loo Co-pr.. i3.
At Wading. Psi At Lo i n. psi Pi,tl.,n Co...son -
'., ,. 11 12 614h
11
k 12 obseetnatimes for stdScipsctior, 2 ob.e.--
I tios for bO perent
aoitld and .odifiedIoI sotion
Consolidation SpeCiens-15.3 1&.d) '3. 56.5 pef
-- 10.3 L.U 709. At? 65.0 pWt-- . 1. * 86.6 pot
0 .5 1 . 2 2 .' 7 1 .0 p t "
Final sp e ien tente d a 1 n -
no inundation350 6.3 5-20%. 6 - 85 pof
'5 12.5 0-toot a * 5-20, Z' - 90 pof°
19.4 1 i0%. 6d 95 pot
21°
0 R-test (Back-pressUeC 6d . 85-90 pot
sat urated)
48.5
1.57 1.04 0.72 -- 1.3 1.8 2.2 12.8 32.1 0.635 17.4 12.5 .. .. 26.7
(q-test)
0.56 0.53 0.61 -- 2.8 3.4 4.8 --
21.5 AA Rue on 1/2 -
1.32 1.07 0.87 -- 1.8 2.2 3.7 -- 34.2 0.68 2.2 - 1-1/2_in. mterial
(Q-tent
(70 psi)- (145 psi)- (300 psi)- (70 psi)- (145 psi)* (300 psi). pleoornt a il0t
2000 1016 480 1.6 2.4 2.8 35.8 0.7' 13.2 9.0 plS e no v - 0%
157 713 40.6 16.5 .1. 1.3 1.4 5.3 35-0 0.70 12.5 3.5 .. .. 22.6
51.0 10 .1 16.1 0.4 1.2 1.3 37.6 0.77 13.9 18.7
828 307 1146 0.5 0.8 1.1 '0.3 0.58 48.6 38.2 .. . 6.6 14.-dy oeat'
(S-tets)
.3Sher and perebility199.0 118.1 75.8 2.8 3.4 4.4 31.P 0.76 13.2 5.6 placement v O%
167.6 3hO.76 80.6 4.72 3.0 4.1 5.5 17.7 3. 3 0.68 9,7 9.7 .. .. 1O.42.1) 1.76 1.07 3.1 3.6 3.9 12.9 0.93 13.2 13.2
2.32 1.52 1.36 0.4 1.2 1.5 29.7 0.57 22.9 13.9 140-d.7 o.
(0-tents)
2-- 2.6
(Sheet I of 3)
207-208
i n red

1 Ic 3.
II*
if,
31'
" / ...... o.*..8-
'1.' '..3
1 7.0
.....I"
.. -.. .l-'l . :--@ ', .:*,,- e,,* . ,. Ii, , . ... 3.. 3 5 33.. 31.3 -, -- 110.
5,3 , I, Fe
33 3.31 . 3' 33~~16 I. i. - - L.
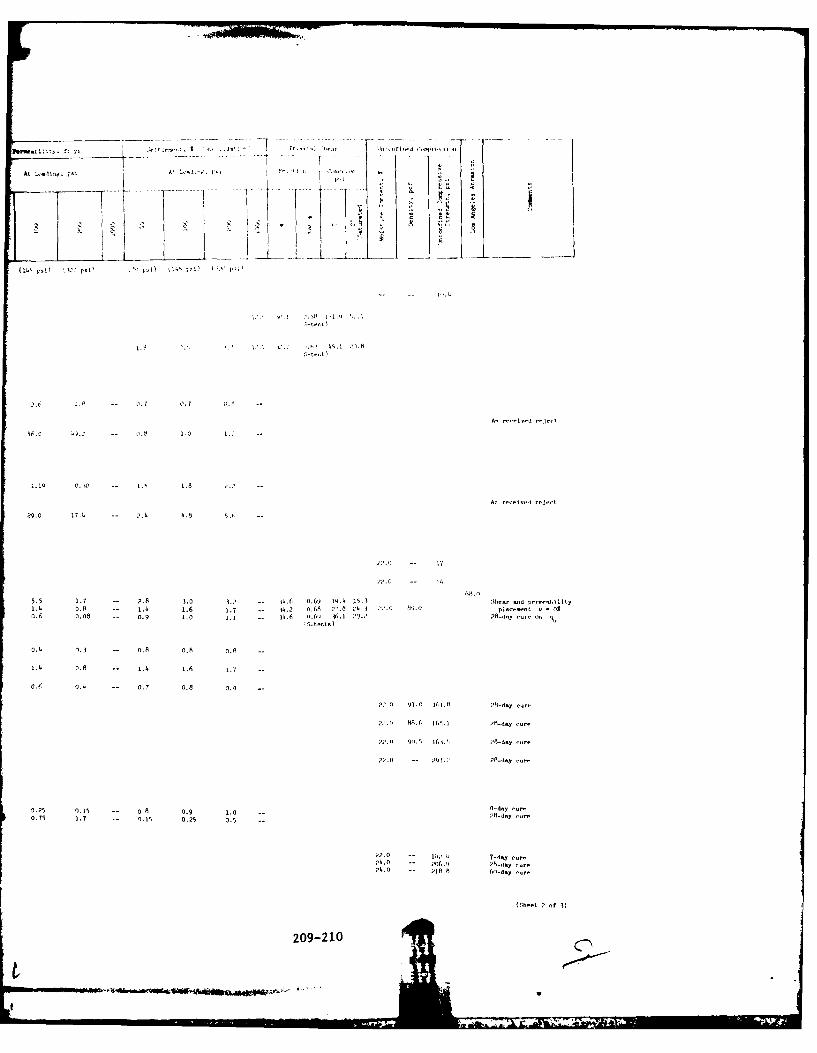
-At ... ,.rs' " at .'..'r:'+
,- Y, t
....... ----------
1 -. 142 C S. ' , 15 .1 .'o .8
2.6 1.' -- o.) 0.0 T .'
A-, r--lv-d r-J-1'
06.2 '. -- .8 1.0 1.2
9. 1 o.o -- 2.1 1.8 2., --
29.0 17.4 -- 4 4--8 5. -
,.0 -- q
5.5 1.0 -- 2.8 3.0 1.. -. J4.6 0.69 1.. 4 15. 3 tar ah d pe-n*-tlty1.14 0.8 -- 1.L 1.6 1.7 .- 04.2 0.68 27.8 :4. . I. pI.cement * . 0%0.6 0.08 -- 0.9 1.0 1.1 -- 3L.6 0.(,o .I 9.. OR-lay cure
2:-tents)
0.1 9.3 -- 0.8 0.8 0.8 --
1.4 0.8 -- 1.1 1.6 1.1 --
0.6 0.1 -- 0.7 0.8 0.9 --
P:,.0 91.0 1(1. R "fi-day er-
.8.6 18(. . I PR-da.Y
P.0 90.', 16t.;, 28-day cure
* .'.0 -- 211.2 • 8 fday eon-
0 25 0.15 -- 0.8 0.9 1.0 2. -dsy I .rc0.05 1.0 .- 0.15 0.25 0.5 -- P-~ cr
;,.o - 14..4 -d fy cure24.0 2" 206. PR-dt,.ur..24.0) 213n.h 01yc
209-210 -
_~~1 - -C
W -"; ....

'1. (continuedt)
'arsho 11eai-vorks Plant-
Inire "t ModeSlaple IV-I-IH 05 I
88-/2 68 ,l ll P{
11 1938 1.3 193 -- 5 , I> 101.3 .. 2.0
3/. 55 -9 1619 36 15 3 .3, ,..O 3..
ralh, Semi-works Plant-irot Heting Mode19-71 3/1 1'. 37,
3/4 '.3,23/1.3/4 56.,'S'3/4 "( ,22"
IV-SCI 3/143/1. 4'33/1. 5, *;'
IV-1I2
:3 percent cement 3/h (,+'3 percent lie 3/1. 56.,SC5
IV-iP "
(K, tests) 3/4 32 53 15 . 21.74 0.,43 61.
3/4.3*'2 ..
3/1. ',3!5 2', .'
3/1 (plus 1 percent liew) 142, '.'.. N.2
3/4 (pl.. 3 percent lie) 1,.3' .. .5
3/4 (pls i percent cement) I,, V3' . ..3/4 (pl., 3 percent cement) . ".
1-1/2 16 12 1? 1 6.66 2.055 I'll
1-112 3'-''.
1-1/2 ,,.S, .2 .
/
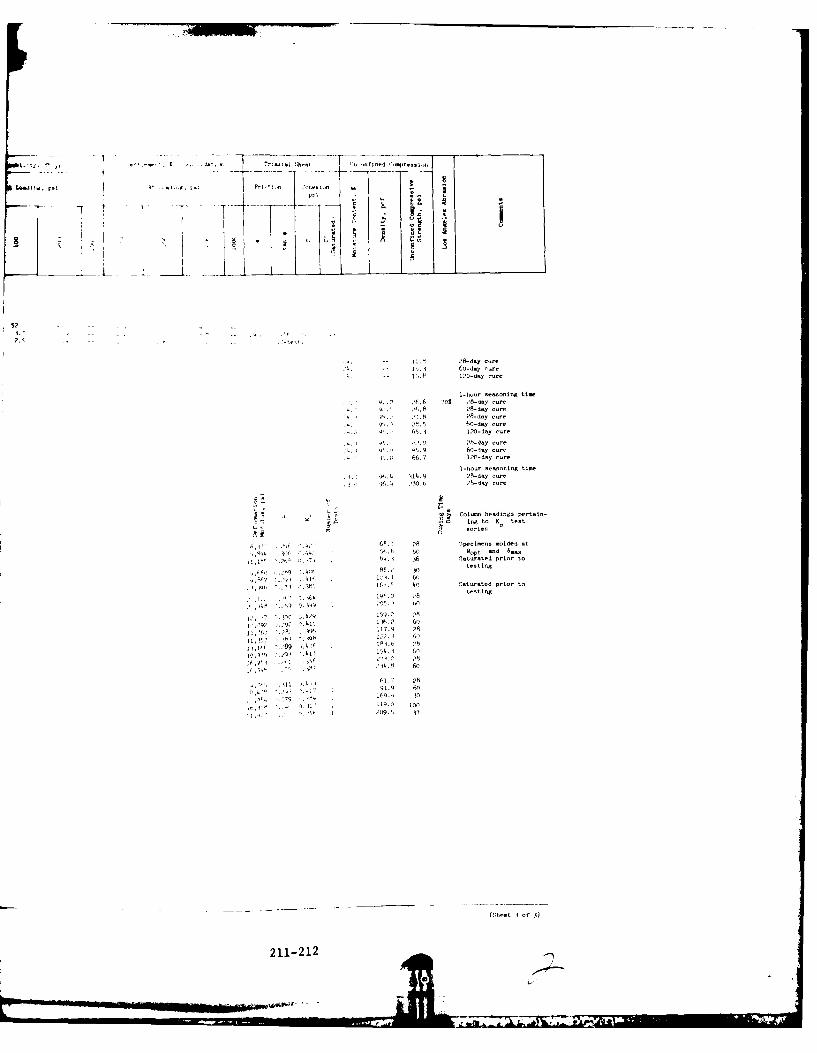
. . .. I.
. --- -1-0-dy cure
1-hour seasoning time• .v1. ,'.6 O 8-day cure
i.'.' .'(8 2-d core
3.'. .- 5.60d-ycur
.. .' 65. 1 2-day cure
• ,. q ,., &,. o 2-day cure.r, .": g.
60-day cure
0/ 66.7 120-d y cure
I-hour seasoning tie
.6 1. 28-dy rr
, . ,4 28 -
day cure
Colo headings por.lo-ti ngto K- test
6 m Spei- s curded t
,. 0 .t 0 d cuR4 i o .,turated prior to
in testing
9 21 1.4 60.2 206hn odda
. . l. t>€ 50.0.60 0
opt1asd.o 28
06,,, ".c.t) op .h< 1.1 t Oit(. 40 gaturted prior to
7 0 .'9 159.2 28
S1 6.2 toj 1 ,,, , L t910l.9 28
, . 12 . 4 t,
19,., ., *, ".1 t'
.0 ;, ,', : ]1; ',. 8 60
61.2 28
91.9 60
169.4 i0
it. ,~ .o 1o
(:;,-t 3 of 3)
211-212 '2
... ,. ,~li.,,UAR., [itl- -. , - ,aS

Adl
*~ Q l ,-
4141 C
cl..
r Iv,41
H aj H c'C 04 m
Ho 41
0~ Uoc\,0~ C.0 ' H(CCC . C 1 1
C 0~
4aw~1 \0'~
-4 ouH ~ do o a . l 4- 4140 41 u m4 N. H. Nfl gi l cj I
$. 01 It'.osd o: 0 HI I I IID r '10 1 8 z + + N H + \ + + H
dlj 41j H 1c
(1E2
I
41
1. r Co
a.Cja.41 4
cdls-(*'C 'f 0 rC C l4
H41
El c. C.) HO m
00 00 0000000o m m~ 0 r- a ~ c.1
to t.
N~ N 0 u-j ~ ~ ~ cjr i 41C C
'0~Mo coS~ .lco0 -.O4C-1' '0 . 4 ' 0 C2
>1 .1H41 r
C dlJlo o9"o 4 k U0U 4 U. 0 M1 41 4
41~~~ ~ r' H H -
CC'-dl) xalv 14 IH IO.Od I41d44 C I414cc H1 C. 4 14 1 1 A cc C ~ 1
CP C
40 v 41
v m 0 w 0.41 41 0
0~~~ c.Z ~ ~ .l.
4104141
0o no .1 m. o)
H ~ ~ P u)0O U4'
H dl~1 ~Cd41241
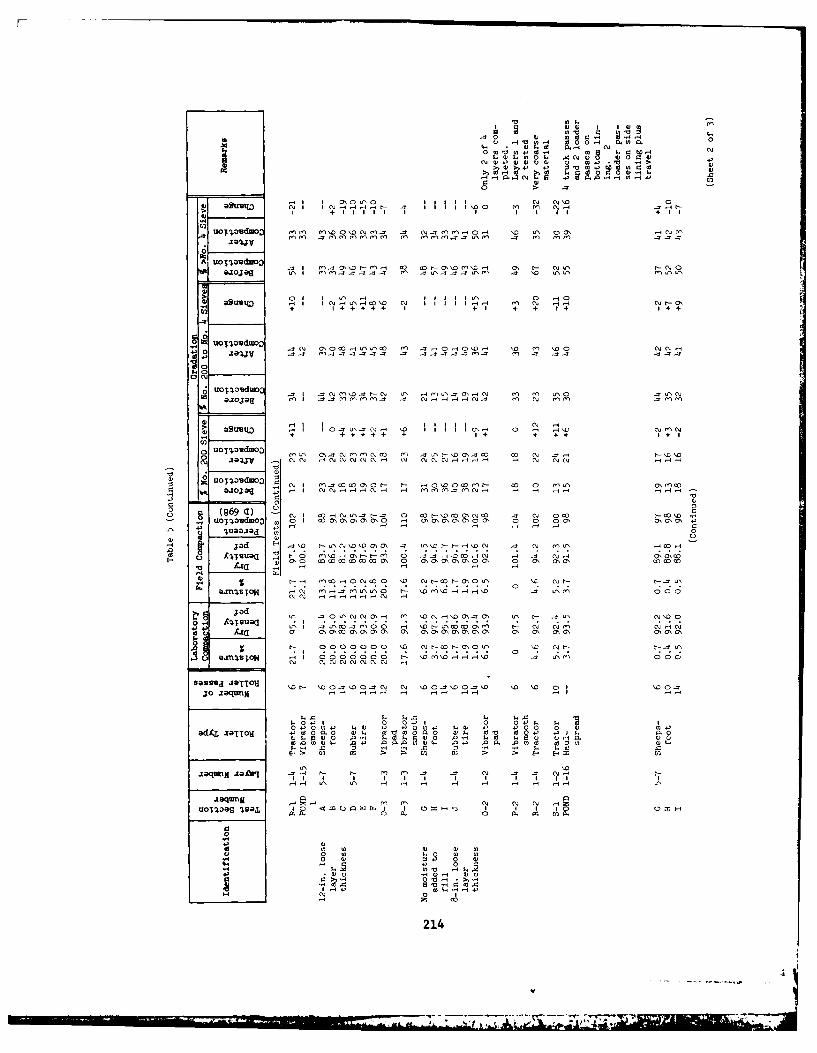
0 4)100 1 CC0 -4 C\)0 1 4) .I
0 C., WO 41 4
P.u 4) C)04 4 4)L. 4)
asQ~uvt) C IN Pc)H H-l c-l II I \D o '00 1-4 14 )
to + +4 41 1 I + I + +1
uo(4vd o N4 a\1. o ' C) CI cc m . o4 IA - OH '0 \D 0m H\x) cN crl
aq~
0\1 NN I N N N Ol -1 A 1 HO N N
.r +o -S4+ I I + +N+ +
I oodo ~ 0OALLL 4 0 0O . .0CCL
Hd EI 1 -q1 C)
~ 4)~UU~f N N I P .L . ' I I I I 0. 0 In .g0C nC
+ 4444 + -! + 4+ '. 1+1 111 \ oC Ot- ~ l
Az~ a\;~d O a\0 C) a, a\1 C) LA, L7\ .\ La\ a,' 00 c\ a, C) c7 m C- c\ a\,a~~~~~~~~9 9 9 .1B14 OC) :CCC))) C) :)))H H H ) C))H
O o Hamt I I)) H CJ I I AAA4A) HI H- -I
oIow pw10 0 4) 4 4 cv v- o0 d a s
,-4 H -1 4 -
o0 o
421

-4 0H 0 I d
C, .0 g 0
w4-,4O V 41
4-. o 4 4 C 0 W- . 4-..-
>O 44H I. +0
aO>..jHaq 4
U . .~ . + ++
r~B
.0 uot rHHCM ' \DB
Auol-pidwoo Co CCOC NO 4 O
0
OBC U atzYo W0 MH0'0 - C M
uo,0B ~ wo c-' 0IJ ac) - C M . - 4BCca lol C l o o
j. C
~ ICo) c) ,
o ~ JC o
o0 0 41
~~~ 0~i; COo I~C.C rC r C
4-.~~~~ ~~ C OSS'os '0 ~BH~ J@TI . a p H oO
aqu n N N4 AB'
UOZloq Isa
U00 S .
21

APPENDIX A: OIL SHALE RETORTING PROCESSES
1. Three retorting processes are used to extract oil from oil
shale:
a. Solid to solid heat transfer (Tosco process).
b. U. S. Bureau of Mines gas combustion method.
c. Gas to solid heat transfer (Petrosix process).
Tosco Process
2. Figure Al shows a flow diagram of the Tosco process. In this
process the shale is mixed with preheated balls in a horizontal rotating
kiln. The gas produced is of high quality and can be refined for its
valuable components. The process can take a large amount of finely
crushed shale particles. The process efficiency is further increased
by the reduction of particle size by the crushing action of the balls.
One disadvantage of this process is that it produces a large amount of
fine waste material which may increase disposal problems.
FLUE GAS FLUE GAS
CE BALL HEATER
SHALE COKE BALLS
Figure Al. Tosco process
217
IOIL

Gas Combustion Process (Paraho)
3. Figure A2 shows a flow diagram of the U. S. Bureau of Mines gas
combustion process. A stream of crushed shale enters at the top and is
preheated by the combustion gases. Air and recycling gas are injected
at the midpoint and are burned, bringing the oil shale above this point
to retorting temperature. Some of the spent shale is consumed as fuel
in the burning process. The gas entering at the bottom is heated by the
burnt shale before it is ignited.
4. Major disadvantages of this process are that it produces a low
Btu gas product and it is not able to process the fines that result from
crushing the shale. It has the advantage of producing a waste material
in the form of a soft friable rock containing approximately 2 to 3 per-
cent carbon.
Petrosix Process
5. Figure A3 shows a flow diagram of the gas to solid heat trans-
fer system for extraction of oil from oil shale. This process has many
of the same features as the gas combustion process except that no actual
burning takes place inside the kiln. The oil shale is fed in at the top
and cold gas at the bottom. The temperature increases toward the middle
of the kiln where a preheated gas is injected. This process produces a
gas that is not contaminated with combustion products. It is possible
to recover sulfur, ammonia, and other valuable components from the high-
Btu gas product.
6. A major disadvantage of this process is that the facility can-
not process the fines that result from crushing the shale because the
gas pressure drop across the kiln would increase excessively. The waste
products contain enough carbon so that they can be burned and used for
heating of the recycling gas.
218
-A ia''

OIL SHALE OIL AND GAS
OIL AND GAS PRODUCT
PREHEATING AAZONE
AIzt ~HEATED |"
Z RECYCLING|UGAS
4 BURNING OF M4 RETORTING RETORTEDU ZONE S$ALE AND
/ HEATING OF| 0,IL RECYCLING E
: Figure A2. Gas combustion process
OIL SHALE .A.A.. OIL AND GAS
OIL ND GS PRODUCTS
COOLING
Z RHEONGEON
ZO RETRRETINGGZON
SHL I SHALE ASH
Figure A. Gastcobsion processAIR
4 BURNING ZONE
GAS - AIR MIXTURE
w
COOL INGZONE R15CYCLING GAS_
SHALE ASH
Figure A3. Fetros'ix process
219

APPENDIX B: RESULTS OF BIN AND HOPPER TESTS AND RECOMMENDATIONSFOR RAW OIL SHALE STORAGE BINS
(Prpard UderWESPurchase Order No. DACW 39-77-14-2633 (4/5/77))
Jenike and Johanson, Inc.,No. BilrcMass.
-201

-- 1
SELECTION OF BIN TYPE AND FEEDER SIZE
Types of bins
In the process of selection of a bin [L,2J*, the first step is
to decide on the type of bin. From the standpoint of flow, there are
three types of bins: mass-flow, funnel-flow and expanded-flow.
Mass-flow bins are particularly suitable for powders, cohecive
solids, solids which degrade with time, and when segregation needs to
be minimized. Mass-flow bins give a uniform feed density often per-
mitting the use of volumetric feed control in place of gravimetric
control. Low level indicators work reliably in mass-flow bins.
Examples of mass-flow bins are shown in Figures la and lb. In
mass-flow bins, the hopper, i.e. the converging part of a bin, is
sufficiently steep and smooth to cause flow of all the solid without
stagnant regions whenever any solid is withdrawn. This produces
uniform flow and a feed density which is practically independent of
the head of solid in the bin. Segregation is minimized because,
while a solid may segregate at the point of charge into the bin, con-
tinuity of flow enforces remixing of the fractions within the hopper
[1,31. Mass-flow bins have a first-in first-out flow sequence. This
is useful in the storage of solids which degrade with time and of
powders which thus deaerate with a minimum of residence time. Powders
do not flush as long as a sufficient head of solid is maintained and
the gravity flow rate is not exceeded; air locks are not needed [4,5,61.
Fig. la defines the outlet width for oval outlets and the hopper
slope angles for transition hoppers.
Fig. lb defines the outlet diameter and th;' hopper slope angle
for circular, conical hoppers.
The minimum outlet dimensions are given in "Results of Flow Tests,"
Sections I-A and I-B. The length of an oval outlet should be at least
* Numbers in brackets designate references listed on page 5.
223
V
. . .. .. . . ... . . . . .
-2-
three times its width. The maximum slope angles (measured from the
vertical) are given in Section III for the specified wall materials
and conditions of storage. For some solids and wall materials, the
slope angles vary with the size of the outlet.
Valleys are not permitted. Ledges and protrusions into a mass-
flow channel are not allowed. If a hopper is equipped with a shut-off
gate, the gate must be fully open for mass flow to be possible.
Mass-flow bins of special design can be used for in-bin blending
by circulation of solid [7].
Funnel-flow bins are suitable for coarse, free-flowing or slightly
cohesive, non-degrading solids when segregation is unimportant.
Examples of funnel-flow bins are shown in Figures 2a, 2b and 2c.
Funnel flow occurs when the hopper is not sufficiently steep and smooth
to allow material to slide along the walls or when the outlet of a mass-
flow bin is not fully effective (see "Feeders" below). In these bins,
solid flows toward the outlet through a channel that forms within stag-
nant solid. The diameter of that channel approximates the largest
dimension of the effective outlet. When the outlet is fully effective,
this dimension is the diameter of a circular outlet, or the diagonal
of a square or rectangular outlet. As the solid within the channel
flows out, layers slough off the top of the stagnant mass into the
channel. This spasmodic behavior is particularly pronounced with
cohesive solids and with powders. A powder, sloughing off the top,
aerates as it falls into the channel and may flush out if the level of
solid in the bin is low. With a cohesive solid, a channel may empty
out completely (rathole) and powder charged into the bin then flushes
through. A rotary valve is often used under these conditions to
contain the material, but a uniform flow rate cannot be ensured with
this arrangement because flow into the valve is erratic. These bins
are more prone to cause arching of cohesive solids than are mass-flow
bins and, hence, frequently require larger outlets for dependable flow.
224
A

3-
Such a large outlet may preclude the use of a rotary valve. These bins
also cause segregation of solids [1,3] and are unsuitable for solids
which degrade with time because of the stagnant regions.
Figures Za and 2b define the outlet dimensions for rectangular
outlets. Fig. 2c defines the outlet dimension for circular outlets.
The minimum dimensions are listed in Sections I-A and I-B. The
length of a slot should be either not less than Dr, Fig. 2a, or equal
to the full diameter of the bin, Fig. 2b. Usually Df is much larger
than Bf and a long rectangular (slot) outlet is more advantageous than
a circular or square one.
Clean out of a funnel-flow bin is often uncertain because solid
in the stagnant regions may pack hard and cake. Mass-flow bins should
be specified when clean out is mandatory.
Expanded-flow bins are recommended for the storage of large
quantities of non-degrading solids. This design is also useful as a
modification of existing funnel-flow bins to correct erratic flow
caused by arching, rat-holing or flushing. The concept can be used
with single or multiple outlets.
Examples of expanded-flow bins are shown in Figures 3a and 3b.
The lower part of such a bin is designed for mass-flow. The mass-flow
outlet usually requires a smaller feeder than would be the case for a
funnel-flow bin. The mass-flow hopper expands the flow channel to a
diagonal or diameter equal to or greater than Dr, thus eliminating the
likelihood of rat-holing. In the case of powders, the volume of the
mass-flow hopper should ensure sufficient residence time for deaeration.
Feeders
The specified outlet must be fully effective. If flow from the
bin is controlled by means of a feeder, the feeder must be so designed
as to draw uniformly through the entire cross-section of the outlet [1,2].
Vibrating equipment
Vibration has two effects: on the one hand it tends to break up
the arches that obstruct flow, on the other it packs so stagnant solid
225

-4-
gains greater strength. In order to allow for this packing, the outlet
dimensions for flow with vibration are often larger than those for
gravity flow without vibration.
Many fine and wet materials tend to pack severely when vibrated,
and vibrating equipment is not recommended for them. The applicability
of vibrating equipment can be judged from Section I-B of the "Results
of Flow Tests" which lists the minimum outlet dimensions required for
flow with vibrating equipment. These dimensions refer to the outlet
dimensions of a static bin that discharges into vibrating equipment.
External vibrators are particularly suitable for materials which
are free-flowing under conditions of continuous flow, but set up and
gain strength when stored at rest for hours or days. Hoppers for
these materials should always be equipped with pads for the mounting of
external vibrators.
Flow rate of powders
The rate at which a coarse solid discharges through an outlet [81
is usually sufficient to satisfy the requirements of the process. The
situation is different with powders. Density changes which occur with-
in a flowing mass, combined with the low permeability of a powder,
cause air pressure gradients within the mass and these gradients
critically affect the rate of powder discharge from a bin. Depending
on the fineness of the powder, its volumetric rate of gravity discharge
may be one hundredth or one thousandth that of a coarse solid.
If the flow rate tests have been run, conservative estimates of
the maximum rate for mass-flow hoppers are shown in Section IV of the
"Results of Flow Tests." They are based on material discharging onto a
belt feeder.
These flow rates can be increased significantly using an air
permeation technique (patent pending). Examples of the application
of air permeation are given in references [4,5,6 .
226
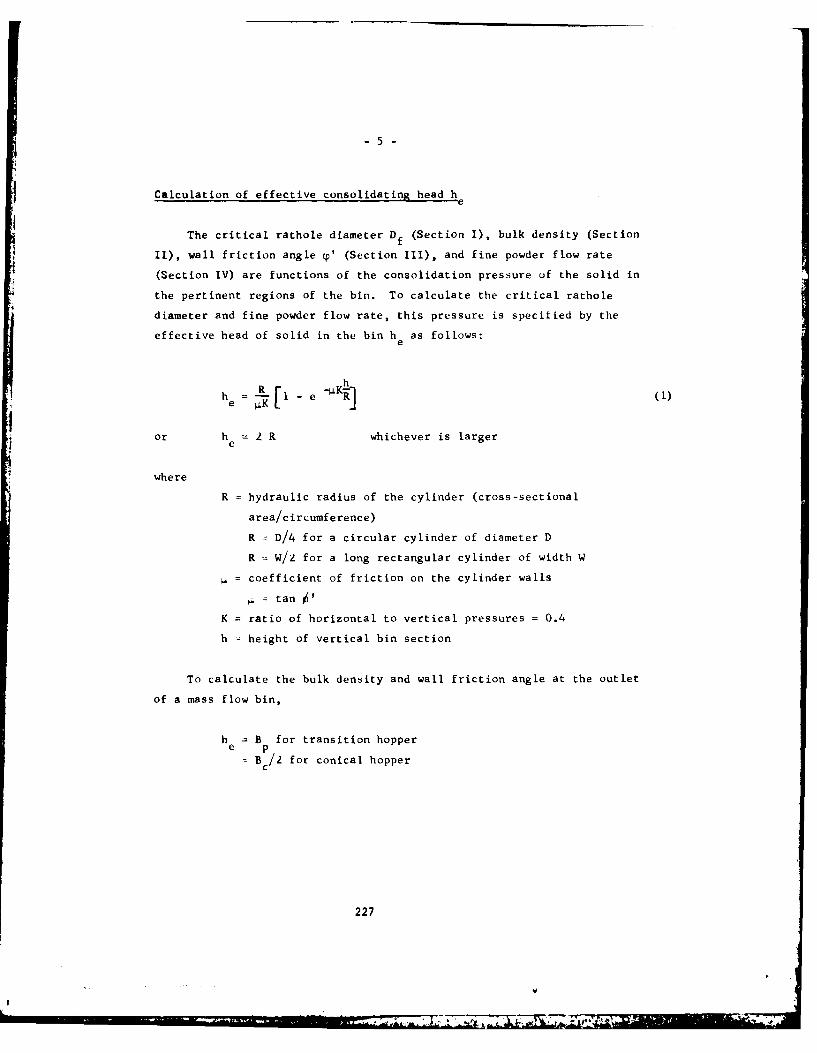
-5-
Calculation of effective consolidating head h
The critical rathole diameter Df (Section 1), bulk density (Section
II), wall friction angle cp' (Section III), and fine powder flow rate
(Section IV) are functions of the consolidation pressure of the solid in
the pertinent regions of the bin. To calculate the critical rathole
diameter and fine powder flow rate, this pressure is specified by the
effective head of solid in the bin h as follows:
h e -L I -e _4K
ee
or h e 2 R whichever is larger
where
R = hydraulic radius of the cylinder (cross-sectional
area/circumference)
R D/4 for a circular cylinder of diameter D
R W/2 for a long rectangular cylinder of width W
= coefficient of friction on the cylinder walls
= tan I
K = ratio of horizontal to vertical pressures = 0.4
h = height of vertical bin section
To calculate the bulk density and wall friction angle at the outlet
of a mass flow bin,
h = B for transition hoppere p
B/ 2 for conical hopper
227
..... , ... .. ,.j, ._. , ,h,. -, . .L, , -V

. 6 -
References
1. Jenike, A. W., "Storage and Flow of Solids," Engineering Experiment
Station, University of Utah, Salt Lake City, Utah, Bulletin No. 123,
Nov 1964.
2. Johanson, J. R., "Feeding," CHEMICAL ENGINEERING, Deskbook Issue,
Oct 13, 1969, pp 75-83.
3. Jenike, A. W., "Why Bins Don't Flow," MECHANICAL ENGINEERING, Vol 86,
No 5, May 1964, pp 40-43.
4. Bruff, W. and Jenike, A. W., "A Silo for Ground Anthracite,"
POWDER TECHNOLOGY, Vol 1, 1967/68, pp 252-256.
5. Reed, G. B. and Johanson, J. R., "Feeding Calcine Dust with a Belt
Feeder at Falconbridge," ASME, JOURNAL OF ENGINEERING FOR INDUSTRY,
Vol 95, Ser B, No 1, Feb 1973, pp 72-74.
6. Valji, S. E., Wilkinson, C. L., and Jenike, A. W., "Georgia Kaolin
Company Solves Calciner Feed Problems," ASME Paper No 72-MH-26
presented at the Second Symposium on Storage and Flow of Solids,
Chicago, Illinois Sep 17-20, 1972.
7. Johanson, J. R., "In-Bin Blending," CHEMICAL ENGINEERING PROGRESS,
Vol 66, No 6, June 1970, pp 50-55.
8. Johanson, J. R., "Method of Calculating Rate of Discharge from
Hoppers and Bins," SME of AIME, TRANSACTIONS, Vol 232, Mar 1965,
pp 69-80.
228
V
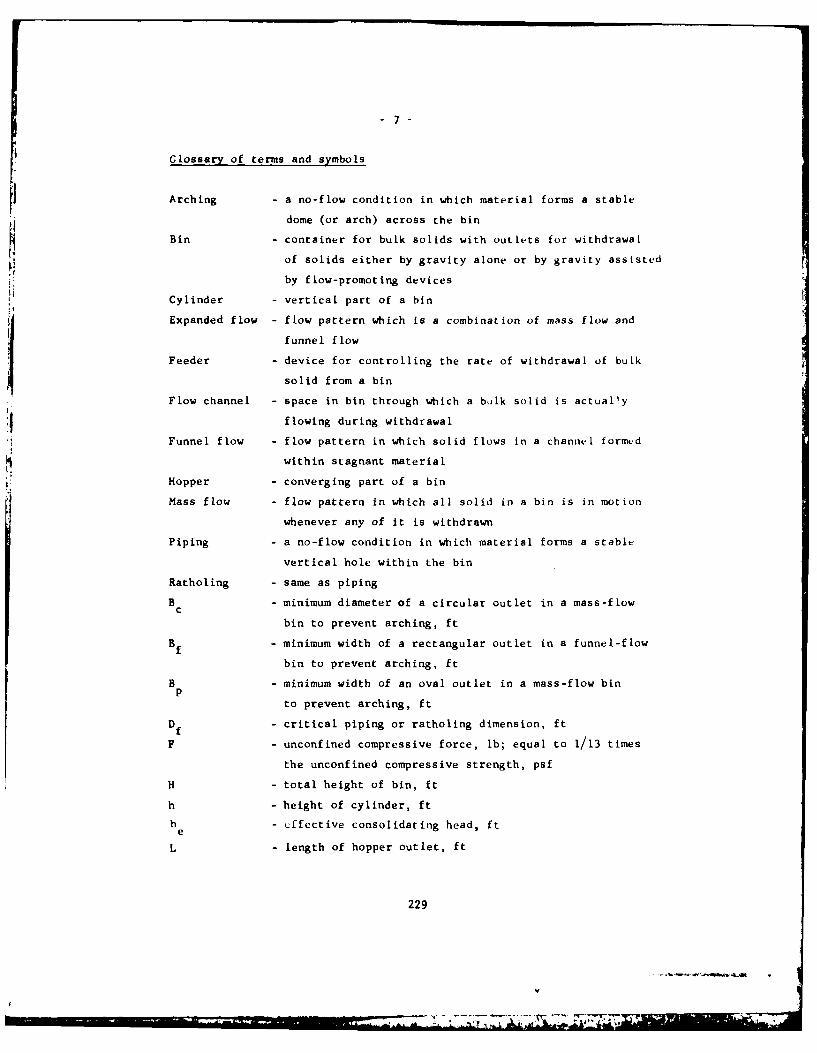
7-
Glossary of terms and symbols
Arching - a no-flow condition in which material forms a stable
dome (or arch) across the bin
Bin - container for bulk solids with outlets for withdrawal
of solids either by gravity alone or by gravity assisted
by flow-promoting devices
Cylinder - vertical part of a bin
Expanded flow - flow pattern which is a combination of mass flow and
funnel flow
Feeder - device for controlling the rate of withdrawal of bulk
solid from a bin
Flow channel - space in bin through which a balk solid is actually
flowing during withdrawal
Funnel flow - flow pattern in which solid flows in a channel formed
within stagnant material
Hopper - converging part of a bin
Mass flow - flow pattern in which all solid in a bin is in motion
whenever any of it is withdrawn
Piping - a no-flow condition in which material forms a stable
vertical hole within the bin
Ratholing - same as piping
B - minimum diameter of a circular outlet in a mass-flowc
bin to prevent arching, ft
Bf - minimum width of a rectangular outlet in a funnel-flow
bin to prevent arching, ft
B - minimum width of an oval outlet in a mass-flow binp
to prevent arching, ft
Df - critical piping or ratholing dimension, ft
F - unconfined compressive force, lb; equal to 1/13 times
the unconfined compressive strength, psf
H - total height of bin, ft
h - height of cylinder, ft
h - effective consolidating head, fte
L - length of hopper outlet, ft
229
A IL- 1- -- -. -1
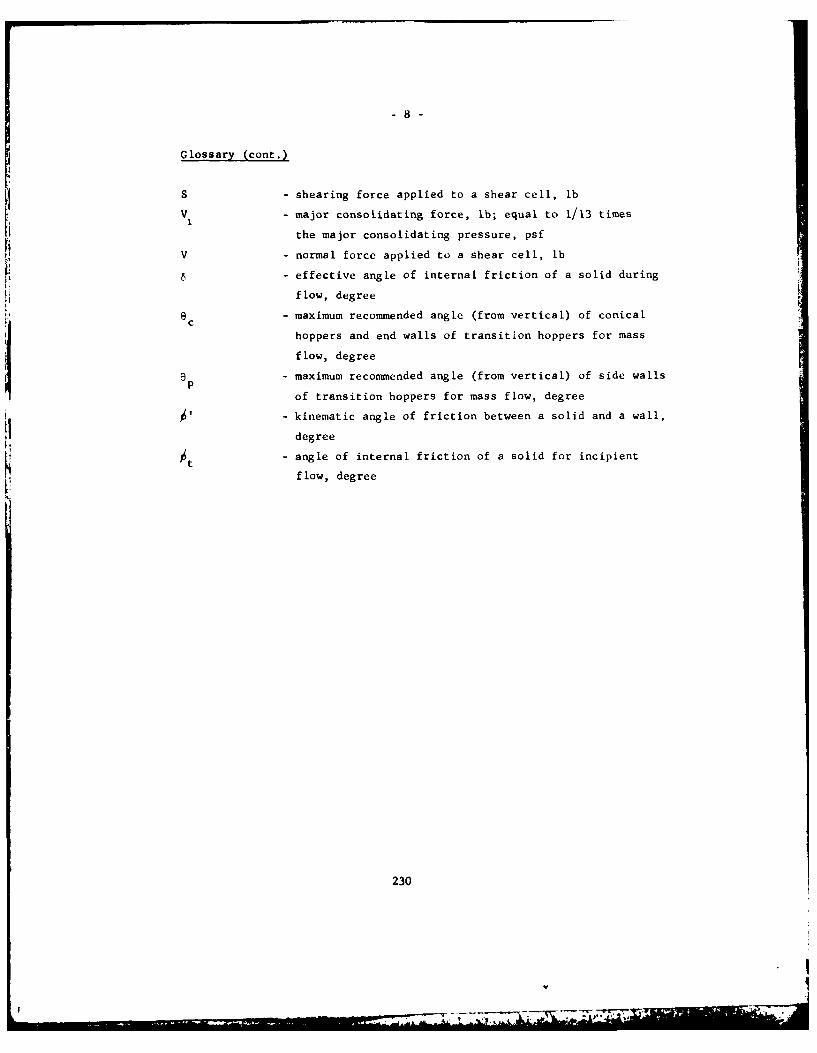
-8-
Glossary (cont.)
S - shearing force applied to a shear cell, lb
V - major consolidating force, lb; equal to 1/13 times
the major consolidating pressure, psf
V - normal force applied to a shear cell, lb
6 - effective angle of internal friction of a solid during
flow, degree
6 c - maximum recommended angle (from vertical) of conical
hoppers and end walls of transition hoppers for mass
flow, degree
ap - maximum recommended angle (from vertical) of side walls
of transition hoppers for mass flow, degree
- kinematic angle of friction between a solid and a wall,
degree
- angle of internal friction of a solid for incipient
flow, degree
230
r -- --

-9-
TT
Hh
HH
L
(a)
(b)
MASS-FLOW BINS
FIG. 1
231

1--
H H
f7 (a)
(b)
(C)
H
FUNNEL-FLOW BINS
FIG. 2
232

a(a
pr
(b)
EXPANDED -FLOW BINS
FIG. 3
233

- 2 -
RESULTS OF FLOW TLSTS
Material(s) tested: Oil shale
For each material, results are presented in the following ordur:
Section I Minimum outlet dimensions for dupchiJabit flow
A. Gravity flow
B. With vibrating quipmcnt
Section i1 Bulk density as a function of huad of solid
Section III Maximum allowable hopper slope angles
Section IV Maximum solids flow r:ite (if testcd)
234
;-i- -L-t

4
Material Oil shale
Section 1. Minimum outlet dimensions for dependable fluwA. Gravity flow
Mass-fluw Funn. I-f Il,w
Storage Water Temper- Circular Oval Rectangular Criticaltime content, ature, outlet uutlet outlet rathole Ret.
at rest % wet * diameter width width diameter Fig.weight Bc ft Bp. ft Bf, it h f
Continuous 5' 4flow to 7
Z( 15As4U
29
Received Amb. 4 6
3 Days *4
li 7.10 1540 29
Continuous 1,3 0.7 0.8 5 7flow 10 10
2O 175.9 8 - 10
3 Days 13 0.7 0.8 5 710 1020 17
Continuous 1.6 0.8 0.9 5 7flow 10 12
20 2210.7 12 - 14
3 Days 1.6 0.8 0.9 5 710 1220 22
No minimum dimensions given from tests. Minimum outlet size set byconsideration of particle interlucking, flow rate, etc.
235
.,"

Material Oil shale
B. With vibrating equipment
] Material not suited to vibration
Mass-f low Funnel-flow
Water Temperature, Circular Oval Rectangular Criticalcontent, outlet outlet outlet rathole Ref.% wet " diameter width width diameter Fig.
weight Bc) ft B p fL Bf, ft hi If
As Received Arab. 5' 5 4 - 6
(1.0) 10 ti20 2240 44
5.9 1.7 0.8 1.1 5 7 8 - 1010 1020 17
10.7 2.2 1.1 1.9 5 7 12 - 14
10 I20 Z2
No minimum dimensions gi en from te ts. Min mum outlet siz set by
consideration of particle interlocking, flow rate, etc.
Section II. Bulk density as a function of effective consolidating head (if solid
70
0 10 20 30Effective consolidating head of solid, ft
236
-' --7
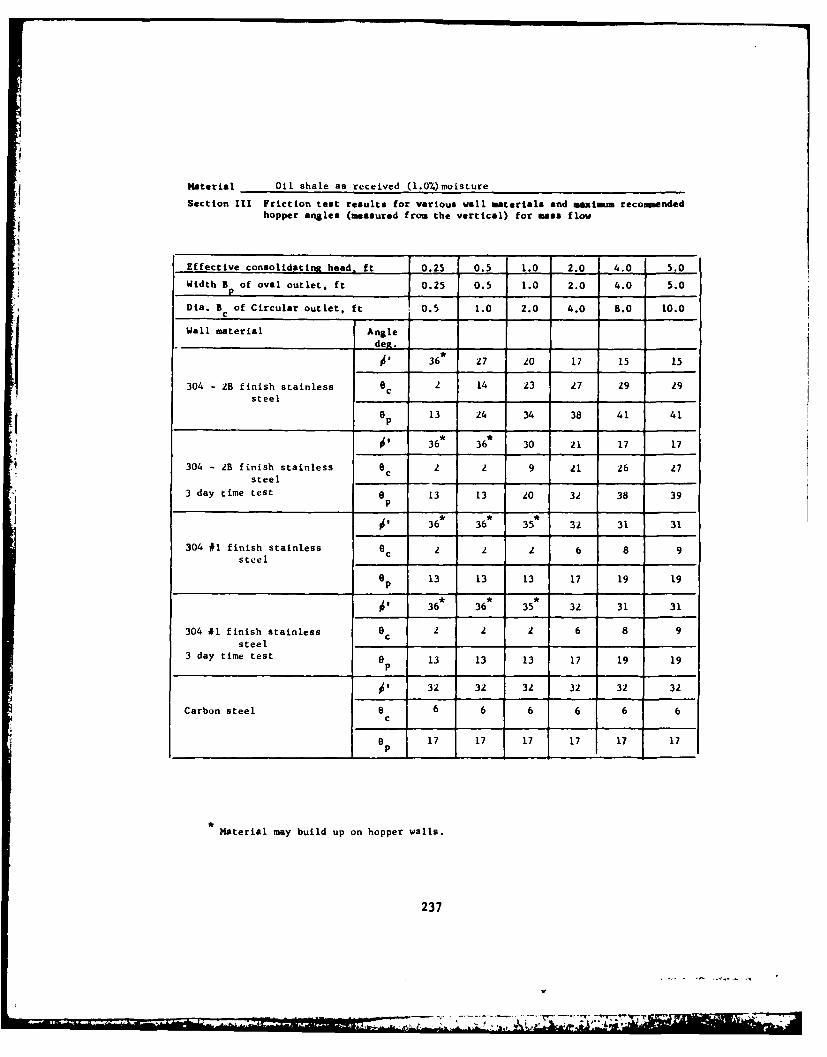
Material Oil shale as received (l.0Z)moisture
Section 111 Friction test results for various wall materials and maxmum recomended
hopper angles (measured from the vertical) for mass flow
Effective consolidatina head, ft 0.25 0.5 1.0 2.0 4.0 5.0
Width B of oval outlet, ft 0.25 0.5 1.0 2.0 4.0 5.0P
Dia. B of Circular outlet, ft 0.5 1.0 2.0 4.0 8.0 10.0CI
Wall material Angledeit.I
0 36* 27 20 17 15 15
304 - 2B finish stainless 0c 2 14 23 27 29 29steel
ap 13 24 34 38 41 41
36* 36 30 21 17 17
304 - 2B finish stainless e 2 2 9 21 26 27steel
c
3 day time test 8 13 13 20 32 38 39P
36* 36* 35 32 31 31
304 #1 finish stainless c 2 2 2 6 8 9steel I
ep 13 13 13 17 19 19
36 36 35 32 31 31
304 41 finish stainless a 2 2 2 6 8 9c
steel3 day time test 9 13 13 13 17 19 19
p
32 32 32 32 32 32
Carbon steel a 6 6 6 6 6 6c
8p 17 17 17 17 17 17
Material may build up on hopper walls.
237

I
Material Oil shale 5.9% moisture
Section III Friction test results for various wall materials and maximum recommended
hopper angles (measured from the vertical) for mass flow
Effective consolidating head, ft 0.25 0.5 1.0 2.0 4.0 5.0
Width B of oval outlet, ft 0.25 0.5 1.0 2.0 4.0 5.0p ,__ _
Dia. B of Circular outlet, ft 0.5 1.0 2.0 4.0 8.0 10.0c
Wall material Angle
deR. I
P 21 21 21 21 21 21
304 - 2B finish stainless 8c 21 21 21 21 21 21steel.,
sp 32 32 32 32 32 32
pP 24 24 24 24 24 24
304 - 2B finish stainless a 18 18 18 18 18 18C
steel _
3 day time test 8 29 29 29 29 29 29P
pP 36* 34 32 31 31 31
304* 1 finish stainless ec 2 4 7 8 8 8
steel
6 13 15 17 18 19 19p
p' 36 34 32 31 31 31
304 Al finish stainless 8 2 4 7 8 8 8steel
3 day time test 6 13 15 17 18 19 19p
pP 33 33 33 33 33 33
Carbon steel 8 5 5 5 5 5 5C
ap 16 16 16 16 16 16
Material may build up on hopper walls.
238

Material Oil shale 10.7% moisture
Section II Friction test results for various wall materials and maximum recommendedhopper angles (measured from the vertical) for mass flow
Effective consolidating head, ft 0.25 0.5 1.0 2.0 4.0 5.0
Width B of oval outlet, ft 0.25 0.5 1.0 2.0 4.0 5.0p
Dia. B of Circular outlet, ft 0.5 1.0 2.0 4.0 8.0 10.0
Wall material AngledeR. I
28 24 22 22 21 21
304 - 2B finish stainless ec 13 17 19 20 21 21steel _________ ____________ ___ ____
8 26 30 31 31 32 32P
28 24 23 23 23 23
304 - 2B finish stainless 8c 13 17 19 19 19 19
steel
3 day time test e 26 30 30 30 30 30P
38 38 35 32 31 30
304 #1 finish stainless 91 1 4 8 9 10steel
e 12 12 16 18 19 20p
P 38 38* 35 32 31 30
304 Al finish stainless 8 1 1 4 8 9 10csteel
3 day time test 8 12 12 16 18 19 20p
p1 33 33 33 33 33 33
Carbon steel 8 5 5 5 5 5 5c
8 16 16 16 16 16 16p
Material may build up on hopper walls.
239

Material Oil shale as rece.ived (1.07%) moisture
Section 1V. Maximum solids flow rate onto a belt feeder without air permeation
A. From a conical mass-flow hopper with an effectivv consolidating head h=5 f te
01
20,000 . -
0
Diameter of circular outlet, ft
B. From a transition mass-flow hopper with an effective consolidating head h e
6000 :i 1- 5 ft_ _
. . . .. . . 1
0 4000
go
440
0
Width Of Oval Outlet, ft
240

RECORD OF TESTS
241
.7

i7
_ I _: , I , - . ,.. ................... . . .. ......
1. . ... . .... ..7 .. I- .. .- .. 1, .- 1 . . . .I
• + .k .. ..I .. .. . . .. .. . . .+ i . . ... . ... . :. . . . . . . .. . .
C-4
, , , : . .. .I ..., : .: b.: " i " " " "l'
. t, -
LJ\ .0
.. .. .. . . . . t+-4 1 V-
!.: ' : !t,. ., -1 i T i
.... .... . ... . ... ...7 ..... . .. ..L F- r.- -
+ - . , k .. .. . "t , , .+t,, t .4,t' +t .'. 't... .. .l. . . . t '"
,.R . . . . .',. , ... .i , i -- L7.+ .. . . . '.. + + -
., . , .I. 1D
.4...4 ;;;;-,* --;;'.- .' . .... 4"4 -2- . -":. . .. . . , I . . . . . . : , 11 . i .. . . . . . -Zr,
- . .-. .- - 1 - - - - -.. . . .. . . .- f - . - - -
24,2
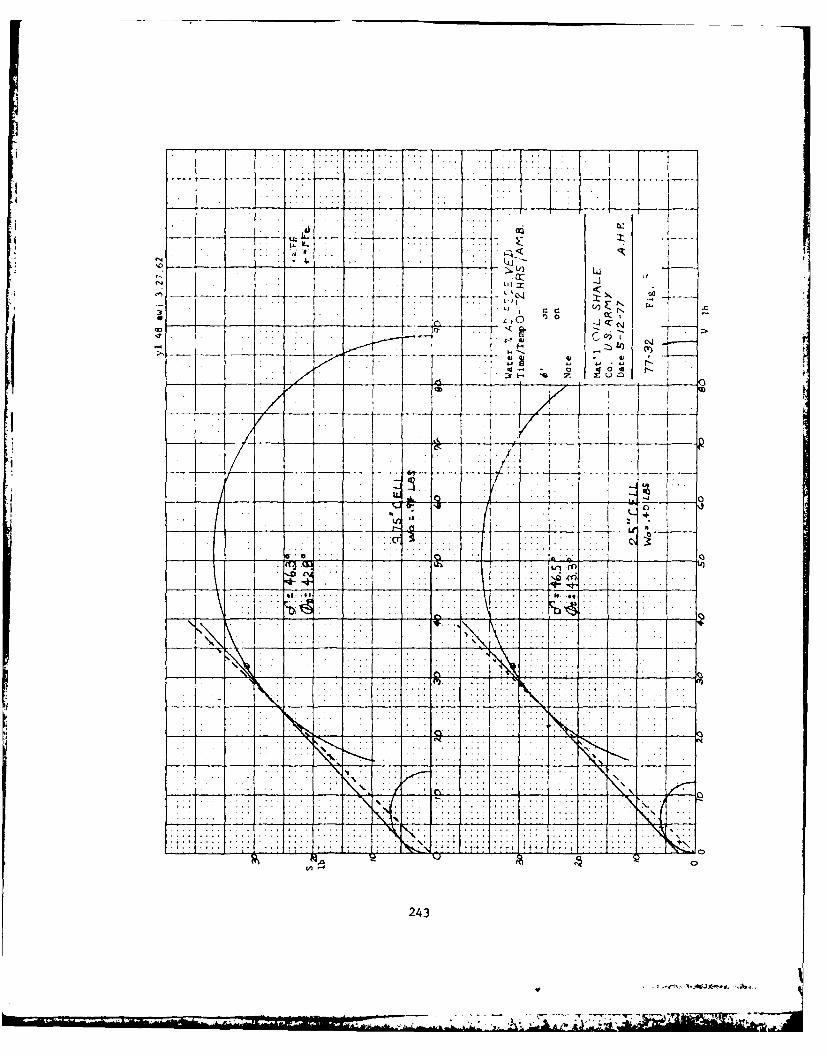
CAD'{ i -T - >
• . , .r " '
71--, .- . , -, , . 4 ---- :
0 13
CM
. . ... ." . .. . . . . . . . . . . . . . .. . . . .. .. .... N:1' :
; - ,* . i . -t
4N ... ... .
.,. ... . .
243
A. . .L]

.. ..... .. .....
r
.. . . .. . . vi.
m H -0 z
- - - f- q
.In
.01
244

• .I , '-V.L0U
( N. . . .. .,
\ o...
(IIT
ILL--
... . . ,
-(-4:
. .. 1 •
!2 . .45
245-

... .... ... ..... . . . . . . . ..o
I- . . . . . . .- . . - -
-~. - .. . .... . ...- ....4
a ... ........
...................
141
0 40 . .
* . . ~ .:
246 ~ -** ~ * .
C . . j4-

r 7
LLd
. .'t' &15 0' . ., " A , -, ' .
- o 0 r... .. ... c" CN
' '. *.;1 -1 -L~iLo
. . .. . i . . . . . . . . . . .
. . . . .... . . ._ _ . ... . .. ....- - ....
.......... ...
... .7 "
. . . . .. . . .2 4 7
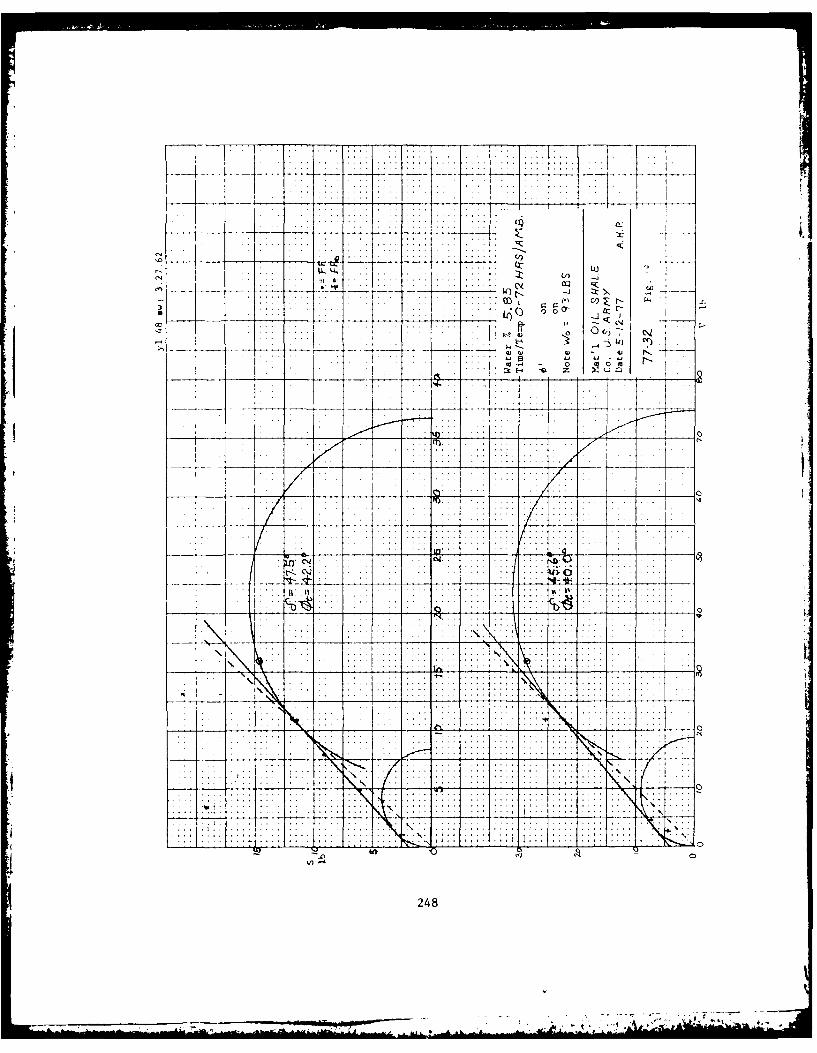
-~77-
7::rx
E - -I -
C 1 q_
.f - -- . . .. ..
248 1-4-
~XE -K'
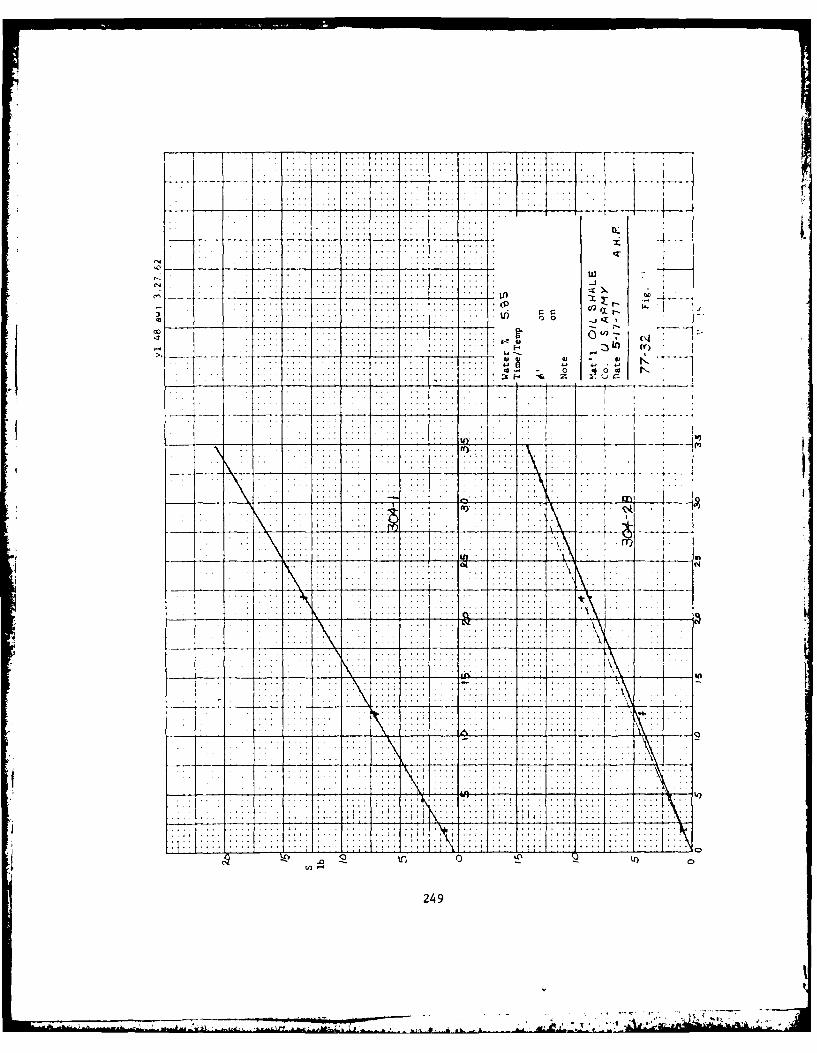
,ii
. . . . . . . . . .
' ) 0~ ,t
. .. . .
. . . . . . .. .. . . . . . a , -
. .. ... .. . ...-
... ....................... .. .... . . . _:
. . . . . . . . . .. . . . . . . . . . . . . . . . . . ..: .. , . -, . .
. ~ ~~ ~~~ ... .. .... .:: : , : : : , : : ....
.. .
249

IC
::: . .. 4:.............
25OO
.. ... ... ..
* 4-
. . . ". . ....
:. .. .. ..2 ... 2 . .. .
. . . . .. .: . . . . . . ..
I - .. . . . . . . . .
.... ......
..2 2 . .. . .. ... ._._..I___: T
. . . . ..
fill I .. ....
~. ..~ ... . ..
7-,
........... ............ .. . . . ......... .
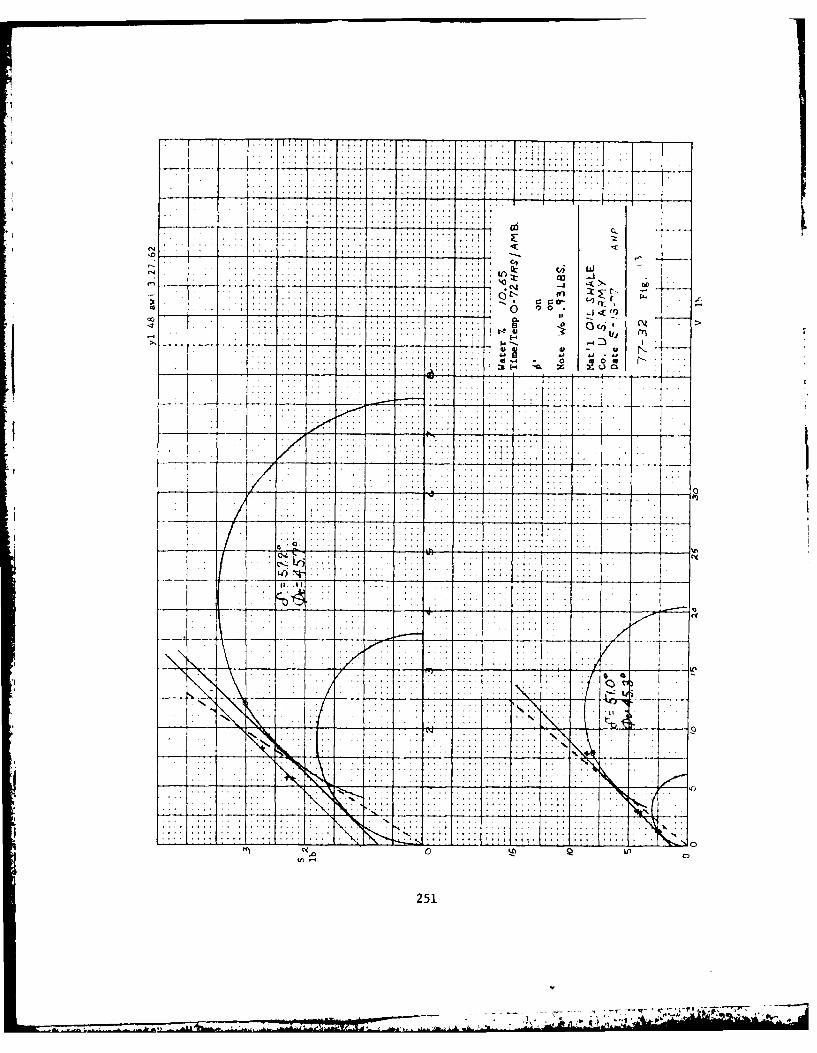
.I. . . ... .......... . . ..
,i~ l it::t~~ iii *:ii! ,!~ i~ i I l: w
C14 - -k>1 0
* W
- i
. ; . ; . . : : . . ; ; . : i . O-t
- . , - m '
"6 - o . _I,
. ... . . . . . . .. . . . . . .. 4J *>
-0.
. , - -.- - " - -- -
L6)
.. ... .,. : ~ .. . . ,.-
~... 4 0: ; " I
251
___________ ... .. "
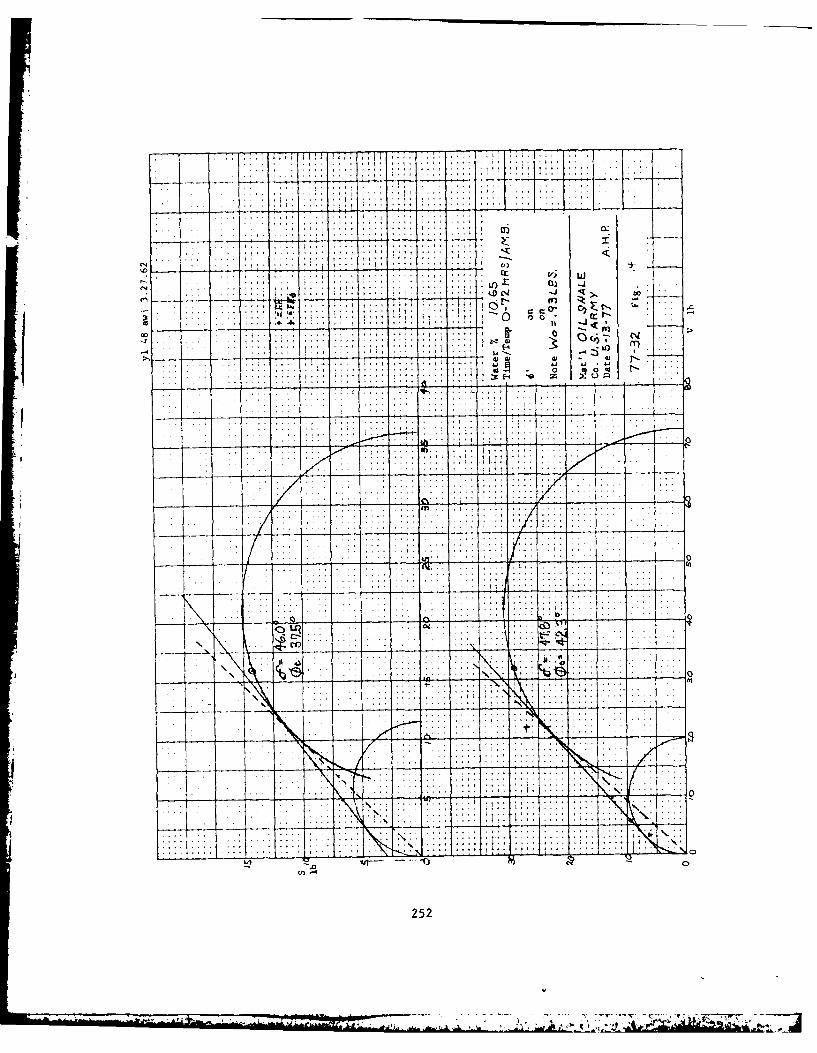
....r~ m ... lt
T- 7- Y- -- -- -
crC7c9: r. Cy,
0~ 0 0
*.............
- - -"6d-- A

. . . . .- . .. L
. . . . ... .. .
. .. .. .. . .~ .. 7 . .H
0 10
ID:
.1Q
ii kc4
253

12 August 1977
RECOMMENDATIONS FOR
RAW OIL SHALE STORAGE BINS
U. S. ARMY
Introduction
The U. S. Army Waterways Experiment Station has been working with the Bureau
of Mines in developing design data for an oil shale processing facility. One
aspect of the problem is to design bins and feeders to store up to 25,000 tons of
raw shale and feed it reliably to a retort at a rate up to 700 tons/hr.
Jenike & Johanson, Inc. has been asked to test a sample of raw shale at
several moisture contents and to recommend bins and feeders for reliable flow.
Material properties
A sample of - 8 mesh shale was tested at ambient temperature for continuous
flow and for flow after three days storage at rest at three moisture contents:
"as received" (1%), 5.9%, and 10.7%. In addition, compressibility, wall friction,
and flow rate tests were also run. Results are shown in Jenike & Johanson, Inc.
Standard Test Report #77 - 32.
Up to 10.7% moisture, the material has a maximum critical outlet width in a
mass flow bin of 0.8'. Funnel flow bins are not recommended because of the large
stable ratholes which shale is capable of forming. Stainless steel is recommended
for hopper walls in order to be assured of developing mass flow and to have a
surface which will not deteriorate with time.
Recommendat ions
Bin and feeder design
Because of the volume of material which is to be stored, two bin designs
are considered. One, shown in Fig. 1, has a capacity of approximately 26,000 cu.ft.
Three such units are required for the storage of the total required volume. The
other, shown in Fig. 2, is capable of storing the entire 25,000 tons in one bin.
254

Whichever bin is used, the design of the belt feeder and interface between the
feeder and the bin will be the same. Details of these items are shown in Fig. 3.
Feeder loads
The force on that portion of the belt feeder which is under the bin can be
resolved into a normal (vertical) and shear (horizontal) component:
normal load 650 F + 800 lb
shear load 500 F lb
where F is a dimensionless multiplier depending on flow conditions in the hopper.
When the feeder is running, F = 1.0. These loads will not change significantl
if the feeder is restarted after it has been running or if the bin is refilled
provided at least a 5 ft head of material is left in the bin before refilling.
Considerably larger loads may occur when the feeder is started after the bin
has been filled from empty with the feeder stopped. These larger loads are due to
the difference in deflection between the feeder and hopper outlet, the initial
stress field in the solid, and the expansion of material which accompanies the
initiation of a shear plane.
There are several ways to minimize these overloads. Running the feeder -
even at a slow rate - while the bin is being filled is the most effective. For this
condition we recommend F = 1.3 for initial starting loads. If the feeder is
suspended from the lower portion of the hopper so that the two deflect in unison
and the feeder is stopped during filling, use F = 2.5 for initial starting loads.
And, finally, providing elastic supports under the feeder will reduce F to
approximately 1.5 for initial starting loads, provided these supports maintain the
feeder in its proper position when running (F = 1) but deflect 1 " when an
additional load of 900 lb is applied. This can also be accomplished by mounting
the feeder on hydraulic or pneumatic cylinders which are designed to hold the
feeder in its normal vertical position. If starting problems occur, the pressure
in the cylinders is reduced and the feeder is lowered 1 ". As soon as the feeder
is running, the feeder is raised to its usual normal position.
255
V -~ . is

- 00
20'-0" dia.
304 SS41 f inish,
201-91 I.S.2 -0" 1.S.
I NOTE: All hopper welds to be
ground smooth and powerbrushed
Fig. I Bin Dtvslgn for 26,000 cu.ft Capacity
256

20 -0 00N/ 1a. 14C \ 4
00
40'2-0" dia
I { [ INote: All hopper welds to beground srmoth and power
brushed
Fig. 2 Bin Design for 78,000 cu.ft capacity
257
-I ___________________________________ _________
L . . . .- 4

-4
0
3 -5
bo
00
SC
140a -X
4to edge
1--00 l'-
of rubber skirt
Fig. 3 Recommended Interface, with Belt Feeder
258
.0i

h
APPENDIX C: SETTLEMENT-LOG TIME CONSOLIDATION-REBOUND CURVESFOR
PARAHO AND TOSCO
K
- "1'q
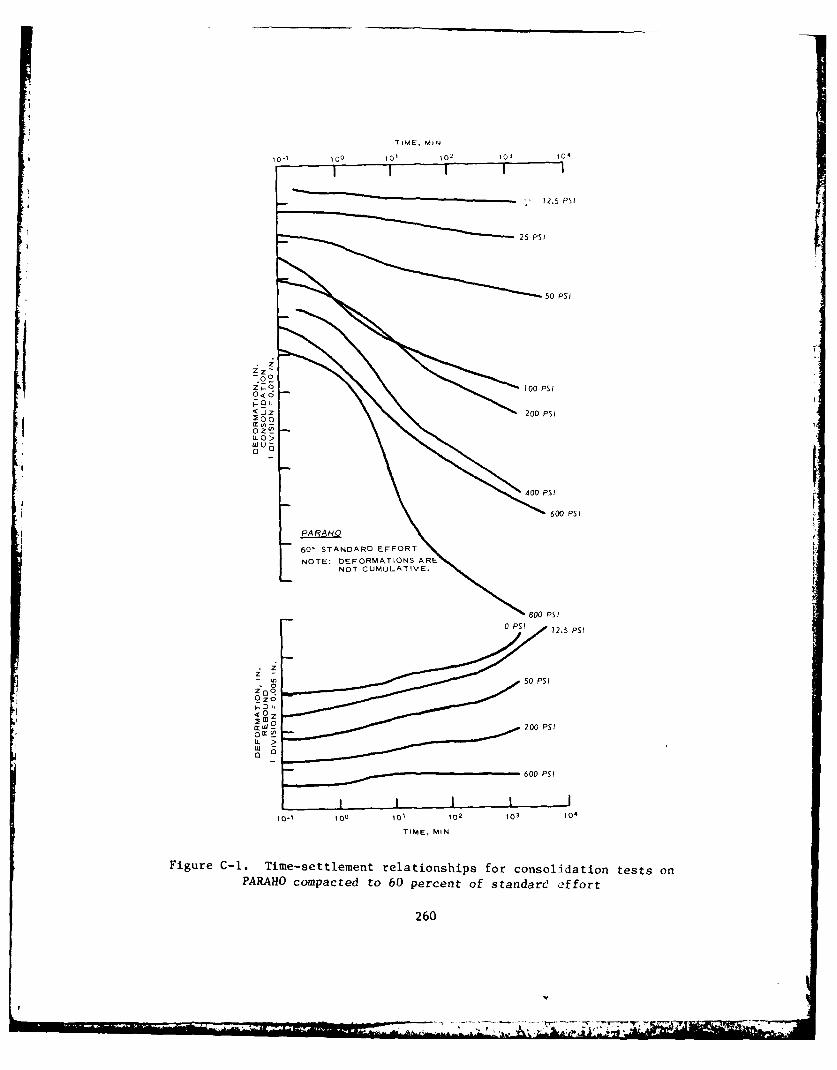
TIME, MIN
10.1 100 101 10' 103 104
12.5 PSI
25 PSI
50 PSI
0
200 PSI
D DM U-
LL 0>zoo
400PS
600 PSI
0 PS 72. PS
26
z*.,'

TIME, MIN
to , tot , 0 0 0
4J Z
OZS
400 PSI
STANDARD EFFORT60PS
NOTE: DEFORMATIONS
0 PS
010
OIDO
103
(y I IT0E MIN-
to- to to 10 1030
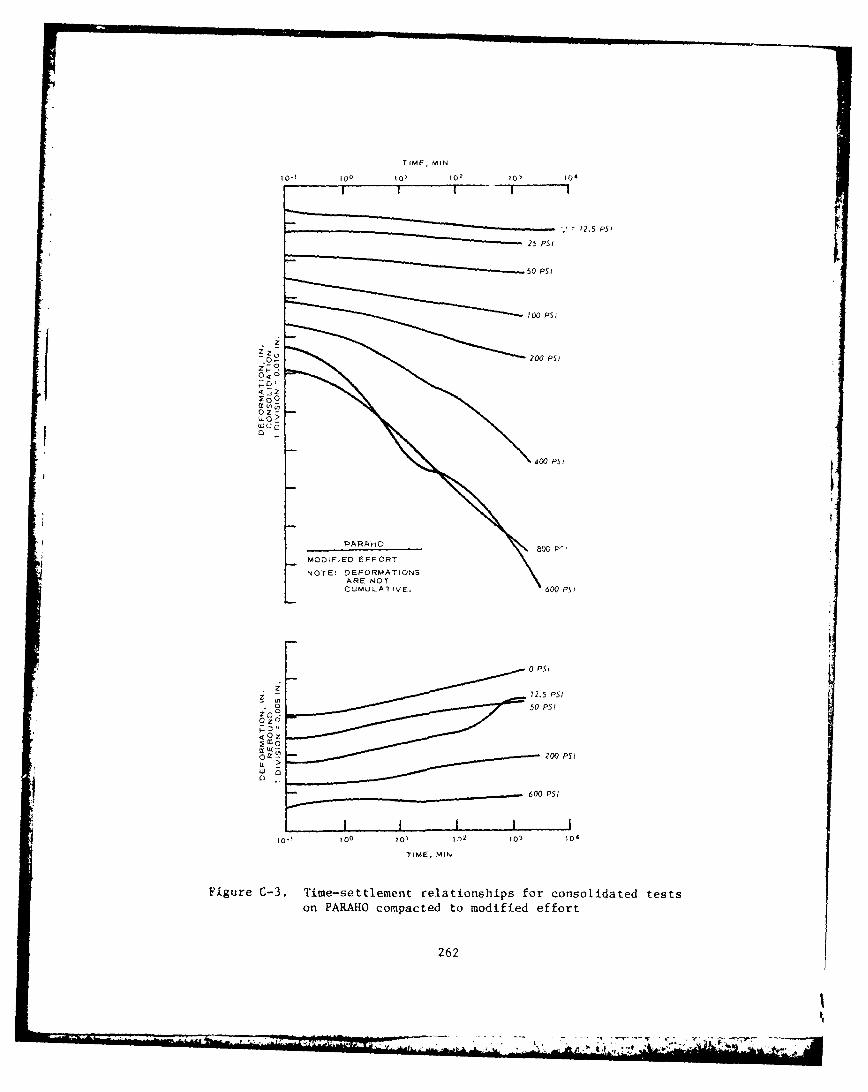
TIME, MIN
10-1 100 101 102 010
?2.5 PSIr25 PSIj
5 0 PSI
~2o 200 PSI
oi~0
WI)U
400 PSI
PA RAI-I £
MOOIFIED EFFORT
NOTE: DEFORMATIONS
0 PSI
z
5005
OZ
200 PSI
LW >
TIME, MIN
Figure C-3. Time-settlement relationships for consolidated testson PARAHO compacted to modified effort
262

TIME, MIN10.1 too 10' 102 to) 104
zz 50 PSI
.02
20
,20o 100 PSI
CUMULATIVE. 00PSPSI
Oz
r ~Z 0 2.0 PSI
-TOSCO
z
0 zC; 600 PSI
TIE MM
Figure ~ L >-. Tm-eteetrltosisfrCnoiaintssoTOC opce o6 ereto tnadefr
263PS
3 ~ ~ ~ ~ ~ ~ ~ 0 PSI -.- -~-.-..
- ~ ~ ~ 0 PS I.. 3. 7

TIME, MIN
t0' 10 o, 102 10310
72.5 PSI
50 PS
~O9 200 PSI
0?
L 0 25 S
800 ~ ~ 5 PSP60 IS
200 PSI
00S
600p0
2264
-, ' 1150PS

TIME. MIN
2SPS
zo
zC
2? 200 PSI
z
-L 0>
-L 0
600 PSI
100~60 PSI0? 13 0
CUMME.TMVE
2265
I_~~ D 11125 S

APPENDIX D: CONVERSION FACTORS, U. S. CUSTOMARY TO METRIC(SI) UNITS OF MEASUREMENT
Iv

U. S. customary units of measurement used in this report can be convertedto metric (SI) units as follows:
Multiply By To Obtain
cubic feet 0.02831685 cubic metres
cubic yards 0.7645549 cubic metres
Fahrenheit degrees 5/9 Celsius degrees or Kelvins*
feet 0.3048 metres
foot-pounds (force) 1.355818 joules
gallons (U. S. liquid) 3.785412 cubic decimetres
inches 25.4 millimetres
pounds (force) per square
foot 47.88026 pascals
pounds (force) per squareinch 6894.757 pascals
pounds (mass) 0.4535924 kilograms
pounds (mass) per cubicfoot 16.01846 kilograms per cubic metre
square feet 0.09290304 square metres
tons (2000 lb, mass) 907.1847 kilograms
tons (force) per square
foot 95.76052 kilopascals
* To obtain Celsius (C) temperature readings from Fahrenheit (F) readings,
use the following formula: C = (5/9)(F - 32). To obtain Kelvin (K)readings, use: K (5/9)(F - 32) + 273.15.
268
-r

Ti
.1
.1
I APPENDIX E: NOTATION
............................................................................................................~ -

a Coefficient of compressibility
B Breakage factor; pore pressure parameter, Au/Ao3
c, c' Cohesion and effective cohesion, respectively
C Compression indexc
C Uniformity coefficientu
C Coefficient of consolidationvD Constrained modulus
D Relative densityre Void ratio
E Young's modulus
Ed Young's modulus under K conditions
G Shear modulus
G Apparent specific gravity plus No. 4 fractiona
G Specific gravity of solidss
k Coefficient of permeability
K Coefficient of earth pressure at rest, under0 conditions of lateral restraint, 03/01
NP Nonplastic
P Pressure
PI Plasticity index
R Consolidated-undrained tests with pore pressure measurements
S Consolidated-drained tests
u-u0 Induced pore pressure
w Water content
w opt Optimum water content
y Shear strain
Yd Dry density
& Axial straina
&I$ & 3 Axial and radial strain, respectively
X Damping ratio
V Poisson's ratio
0rdc Cyclic deviator stress
o ff Normal stress on failure plane
0 Normal stressn
270
- .- *--------.--.~,- ,

all a 3 Major (overburden pressure) and minor principal %tress,
respect ively
T Shear stress
I f Shear stress on failure plane
~, *' Angle of internal friction and etfective angle of internal
friction, respectively
271
Z -4

In accordance with letter from DAEN-RDC, DAEN-ASI dated22 July 1977, Subject: Facsimile Catalog Cards for
Laboratory Technical Publications, a facsimile catalogcard in Library of Congress MARC format is reproducedbelow.
Townsend, Frank C
Geotechnical properties of oil shale retorted by thePARAHO and TOSCO processes / by Frank C. Townsend, Richard W.Peterson. Vicksburg, Miss. : U. S. Waterways Experiment Sta-tion ; Springfield, Va. : available from National TechnicalInformation Service, 1979.
271 p. : ill. ; 27 cm. (Technical report - U. S. Army Engi-neer Waterways Experiment Station; GL-79-22)
Prepared for U. S. Department of the Interior, Bureau ofMines, Spokane Mining Research Center, Spokane, Wash., underContract No. H0262064.
Includes bibliographies.
1. Compaction. 2. Compositions. 3. Consolidation. 4. Geo-
technical engineering. 5. Oil shales. 6. Shear strength.I. Peterson, Richard W., joint author. II. United States.Bureau of Mines. Spokane Mining Research Center. IIT. Series:United States. Waterways Experiment Station, Vicksburg, Miss.Technical report ; (L-79-22.TA.W34 no.iL-79-72
* --.-