Embed Size (px)
Citation preview

Wave Energy Resources Assessment for the China Sea Based on AVISO Altimeter and ERA Reanalysis Data
(ID:10412) Junmin Meng, Jie Zhang
First Institute of Oceanography, State Oceanic Administration, Qingdao, China
Yong Wan College of Information and Control Engineering, China University of Petroleum, Qingdao, China
Collard Fabrice CLS.FRANCE.

Research Progress
1. Mean wave period inversion based on AVISO altimeter data
2. Wave energy assessment for the China Sea based on AVISO
altimeter data
3. Wave power density calculation for shallow water
4. Wave energy assessment for nearshore areas of the China Sea
5. Planning research

1. Mean wave period inversion based on AVISO altimeter data
Data name AVISO multi-satellite merged altimeter data
Data sources CNES & CLS
Data Coverage 10ºN-41N, 105ºE-129ºE
Data Type gridded data Date-Time 2009.9-2014.6 Time resolution 24h Spatial resolution 1°*1°
Parameters significant wave height (Hs) wind speed (U10)
Data material and verification

RMSE of Hs is 0.36m and 0.30m.
0 20 40 60 80 100 120 1400
0.5
1
1.5
2
2.5
3
3.5
4
number of collocated data
Hs/m
AVISObuoy_006
0 20 40 60 80 100 1200
0.5
1
1.5
2
2.5
3
3.5
4
number of collocated data
Hs/m
AVISObuoy_PY30-1

Mean wave period inversion
Wave height and mean wave period are key parameters for wave energy assessment. Mean wave period can not provided directly by AVISO data. So we established 3 models to calculate mean wave period by wave height and wind speed.
z si 2=1
10 10
1.44 ( )2
n ii
gT gHa CU Uπ
= +∑
Polynomial model (QP_AVISO_model)
Input dataset:AVISO significant wave height and wind speed Output dataset:ERA-Interim mean wave period(true value)
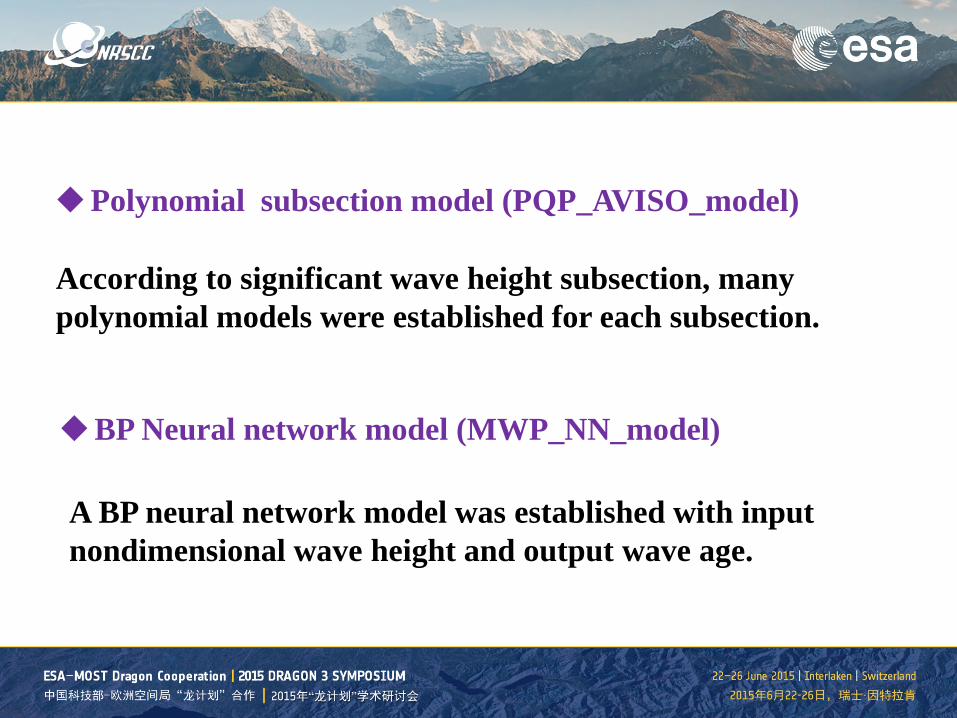
Polynomial subsection model (PQP_AVISO_model)
According to significant wave height subsection, many polynomial models were established for each subsection.
BP Neural network model (MWP_NN_model)
A BP neural network model was established with input nondimensional wave height and output wave age.

Model RMSE (s) QP_AVISO_model 1.07 PQP AVISO model 0.86 MWP_NN_model 1.05 H98_model 1.74 Miao_QP_model 1.56 Miao_PQP_model 1.95
Comparison for different models

2. Wave energy assessment for the China Sea based on AVISO altimeter data
Annual mean Pw Annual mean usable level frequency

Annual mean rich level frequency Coefficient of variation

Interannual variation for total wave energy
105 106 107 108 109 110 111 112 113 114 115 116 117 118 119 120 121 122 123 124 125 126 127 128 1290
0.5
1
1.5
2
2.5
3
3.5
4x 10⁸
Longitude(°)
Tota
l wav
e en
ergy
(MW
h/a)
Distribution of total wave energy according to longitude
10 11 12 13 14 15 16 17 18 19 20 21 22 23 24 25 26 27 28 29 30 31 32 33 34 35 36 37 38 39 40 410
0.5
1
1.5
2
2.5
3
3.5x 10⁸
Latitude(°)
Tota
l wav
e en
ergy
(MW
h/a)
Distribution of total wave energy according to latitude

Safety index Distribution of total wave energy according to wave condition

Theoretical annual mean Pw Exploitable annual mean Pw Wave energy exploitable ratio

Theoretical wave energy COV Exploitable wave energy COV
Comparison of total wave energy
annual winter spring summer autumn0
1
2
3
4
5
6
7
8
9
10x 10
15
Period
Tota
l wav
e en
ergy
/J
Theorectial total wave energyExploitable total wave energy
5.9176
4.3939
8.2697
9.2446
3.9001
2.7550
3.5969
2.0189
7.7912
5.7928

3. Wave power density calculation for shallow water
In shallow water, when calculating Pw we must consider water depth and some coastal influence to improve the accuracy of Pw. A novel high order parametric model was established to calculate Pw in shallow water based on MASNUM wave model.
𝑃𝑃𝑤𝑤 = −8.6661 × 10⁻⁹ 𝐻𝐻𝑠𝑠2𝑇𝑇𝑒𝑒 4 + 2.1510× 10⁻⁶ 𝐻𝐻𝑠𝑠2𝑇𝑇𝑒𝑒 3 + 1.1215 × 10⁻⁴ 𝐻𝐻𝑠𝑠2𝑇𝑇𝑒𝑒 2
+ 0.5361 𝐻𝐻𝑠𝑠2𝑇𝑇𝑒𝑒 + 0.0073
Model Bias/kw/m RMSE/kw/m CC
Empirical Model 0.13 0.43 0.99
High Order
Parametric Model -0.02 0.18 0.99

4. Wave energy assessment for nearshore areas of the China Sea
Key areas and stations
106°E 109°E 112°E 115°E 118°E 121°E 124°E 127°E16°N
19°N
22°N
25°N
28°N
31°N
34°N
37°N
40°N897
12
345 6
10
111213
141516
1718
1920
2122
2324
2526
272829303132
33
3435
3637
3839
40
N01
N02
N03
N04
N05N06N07
N08
N09
N10
N11
N12
N13
N14
N15N16
N17
N18

Data material
Data name ERA-Interim data
Data sources ECMWF
Data Coverage 10ºN-41N, 105ºE-129ºE
Data Type gridded data Date-Time 1993.1-2013.12 Time resolution 6h Spatial resolution 0.125°*0.125°
Parameters significant wave height (Hs) mean wave period (Te)

NNNNENNE
NENE
ENEENE
EE
ESEESE
SESE
SSESSESS
SSWSSW
SWSW
WSWWSW
WW
WNWWNW
NWNW
NNWNNW
方向
0% 10% 20% 30%
NNNNENNE
NENE
ENEENE
EE
ESEESE
SESE
SSESSESS
SSWSSW
SWSW
WSWWSW
WW
WNWWNW
NWNW
NNWNNW
方向
0% 10% 20% 30%
NNNNENNE
NENE
ENEENE
EE
ESEESE
SESE
SSESSESS
SSWSSW
SWSW
WSWWSW
WW
WNWWNW
NWNW
NNWNNW
方向
0% 5% 10% 15% 20% 25%
NNNNENNE
NENE
ENEENE
EE
ESEESE
SESE
SSESSESS
SSWSSW
SWSW
WSWWSW
WW
WNWWNW
NWNW
NNWNNW
方向
0% 5% 10% 15% 20% 25%
NNNNENNE
NENE
ENEENE
EE
ESEESE
SESE
SSESSESS
SSWSSW
SWSW
WSWWSW
WW
WNWWNW
NWNW
NNWNNW
方向
0% 10% 20% 30%
NNNNENNE
NENE
ENEENE
EE
ESEESE
SESE
SSESSESS
SSWSSW
SWSW
WSWWSW
WW
WNWWNW
NWNW
NNWNNW
方向
0% 20% 40% 60%
NNNNENNE
NENE
ENEENE
EE
ESEESE
SESE
SSESSESS
SSWSSW
SWSW
WSWWSW
WW
WNWWNW
NWNW
NNWNNW
方向
0% 20% 40% 60%
N03 N04 N07 N08
N11 N12 N17 N18
NNNNENNE
NENE
ENEENE
EE
ESEESE
SESE
SSESSESS
SSWSSW
SWSW
WSWWSW
WW
WNWWNW
NWNW
NNWNNW
方向
0% 10% 20% 30%
Wave power rose

0 1 2 3 4 5 6 7 8 90
0.51
1.52
2.53
3.54
4.55
5.56
Te/s
Hs/
m
0
5
10
15
20
25(%)
0.02
0.041.220.35
0.010.423.042.510.33
0.131.894.501.830.450.09
0.020.752.132.130.180.060.060.02
0.030.090.270.450.040.01
0.010.01
0.05
0 1 2 3 4 5 6 7 8 9 100
0.51
1.52
2.53
3.54
4.55
5.56
Te/s
Hs/
m
0
5
10
15
20
25(%)
0.50
0.540.080.020.01
0.010.05
0.440.06
0.010.33
0.33
0.04
0.390.03
0.030.05
0.010.170.960.65
0.040.030.08
0.05
1.232.562.22
1.333.972.08
2.492.77
0 1 2 3 4 5 6 7 8 9 100
0.5
1
1.5
2
2.5
3
3.5
4
4.5
Te/s
Hs/
m
0
5
10
15
20
25(%)
0.030.850.19
0.22
0.33
0.030.98
0.12
0.010.30
0.670.350.02
0.44
0.880.160.110.080.04
0.020.100.030.010.010.020.020.02
0.01
0.012.072.82
3.453.081.65
2.263.311.64
1.13
0 1 2 3 4 5 6 7 8 90
0.5
1
1.5
2
2.5
3
3.5
4
4.5
Te/s
Hs/
m
0
5
10
15
20
25(%)
0.020.320.210.010.910.03
0.010.32
0.300.61
0.040.96
0.070.100.140.78
0.410.02
0.03
0.020.06
0.010.010.020.010.012.73
2.110.210.01
3.383.041.620.12
2.183.261.56
1.09
0 1 2 3 4 5 6 7 8 9 10 11 120
0.51
1.52
2.53
3.54
4.55
5.56
6.5
Te/s
Hs/m
0
5
10
15
20
25(%)
0.01
0.09
0.01
0.05
0.04
0.020.42
0.04
0.050.56
0.90
0.520.01
0.120.240.570.970.660.560.270.350.450.14
0.090.53
0.490.84
0.130.120.18
0.170.15
0.200.03
0.050.150.280.160.040.050.02
0.010.070.070.030.02
0.010.031.30
1.37
1.215.916.263.24
3.527.054.382.331.86
1.351.851.35
1.07
0 1 2 3 4 5 6 7 8 9 10 11 12 130
0.51
1.52
2.53
3.54
4.55
5.56
6.57
Te/s
Hs/m
0
5
10
15
20
25(%)
0.060.860.82
0.030.69
0.110.010.36
0.95
0.020.65
0.200.370.90
0.990.750.380.470.630.18
0.140.050.380.740.62
0.240.29
0.20
0.260.20
0.290.04
0.080.260.540.280.240.060.050.030.130.080.120.100.01
0.05
0.010.01
0.040.03
0.010.025.97
2.820.02
4.97
3.989.586.733.552.17
3.214.972.161.401.34
0.01
1.11
0 1 2 3 4 5 6 7 8 9 10 11 12 130
0.51
1.52
2.53
3.54
4.55
5.56
Te/s
Hs/m
0
5
10
15
20
25(%)
0.300.57
0.050.75
0.02 0.010.01
0.270.020.54
0.050.420.040.500.23
0.500.02
0.330.28
0.130.30
0.800.52
0.040.100.070.10
0.060.08
0.210.150.05
0.040.05
0.05
0.010.08
0.01 0.010.033.21
2.21
3.145.394.572.44
2.087.009.736.413.611.06
3.117.157.374.142.121.16
1.081.621.21
0 1 2 3 4 5 6 7 8 9 10 11 12 130
0.51
1.52
2.53
3.54
4.55
5.56
6.5
Te/s
Hs/m
0
5
10
15
20
25(%)
0.150.720.01
0.010.45
0.03
0.020.33
0.03
0.06
0.010.98
0.030.54
0.290.01
0.05
0.090.55
0.550.390.240.10
0.05
0.120.090.030.120.080.120.140.04
0.030.030.020.050.020.080.040.01
0.010.01
2.622.75
2.274.704.492.40
1.285.359.096.453.34
6.122.32
7.524.311.901.13
1.242.021.731.14
N03 N04 N07
N08 N11 N12
N17 N18
Distribution of total wave energy according to wave condition

Maximum Pw
Station Maximum Pw /kw/m
N01 135.34 N02 112.48 N03 150.11 N04 158.52 N05 129.61 N06 82.49 N07 76.92 N08 75.25 N09 163.57 N10 163.60 N11 163.13 N12 163.88 N13 109.97 N14 143.90 N15 163.89 N16 163.94 N17 156.84 N18 162.94
Station Energy harvesting rate/%
N01 62.16 N02 62.39 N03 70.75 N04 69.00 N05 76.02 N06 72.98 N07 74.16 N08 74.35 N09 82.99 N10 82.90 N11 77.98 N12 79.96 N13 89.21 N14 89.37 N15 86.41 N16 85.16 N17 87.85 N18 86.60
Energy harvesting rate

5. Planning research
To establish atlas of wave energy in the China Sea based
on AVISO altimeter data.
To study regional division method for wave energy in the
China Sea.
To study wave energy assessment by SAR data.

Thanks for your attention!