Embed Size (px)
Citation preview

FEMA Open Pacific Coast Study Webinar
Wave Overtopping Technical Analysis and MappingMarch 29, 2017

1
Welcome and Introductions
California Coastal Analysis and Mapping Project Open Pacific Coast Study
Stakeholder Webinar
Federal Emergency Management Agency
Ed Curtis – Regional Engineer, Region IX
Production and Technical Services (PTS) contractor
Karin Ohman – Project Manager | Vince Geronimo – Project Manager
Jeremy Mull – Coastal Engineer
Laura Adleman and Lisa Messano – Outreach Specialists
2
Housekeeping and Reminders
The phone lines of webinar participants are automatically
muted.
To ask a question or comment during the webinar, please use
the chat box feature.
There will be Q&A at the end of the presentation.
A PDF of the presentation will be posted on the OPC Study
page on the www.r9coastal.org website.
For a recording of the presentation, contact

3
Dan Sheehan/Globe StaffBob Dean/Globe Photo
Scituate, Massachusetts -- Blizzard of ’78

4
OPC Study Webinar Agenda
CCAMP OPC Study – Brief Overview
Your Questions and Feedback
Wave Overtopping Technical Analysis
and Mapping

6
CCAMP OPC Study Overview

8
Re-study flood risk
along the open coast
and inland bays of all
California coastal
counties
Re-map the elevation
and inland extent of
wave-induced coastal
flooding
www.r9coastal.org
California Coastal Analysis and Mapping Project(CCAMP) Overview
Two Companion Large-Scale Efforts:
Open Pacific Coast (OPC) Study
San Francisco Bay Area Coastal (BAC) Study

9
Restudy all 15 California open Pacific
coast counties
Determine coastal Base Flood
Elevations (BFEs)
Update Coastal Flood Insurance Study
(FIS) and Flood Insurance Rate Map
(FIRM) Panels
Assist communities with incorporating
this information into risk assessment
and hazard mitigation planning
Del Norte
Humboldt
Mendocino
Sonoma
Marin
San Francisco
San Mateo
Santa Cruz
Monterey
San Luis Obispo
Santa Barbara
Ventura
Los Angeles
Orange
San Diego
Open Pacific Coast Study
As of February 2017:
All counties have preliminary flood
hazard data
1 county has effective flood hazard data
7 counties are in the 6-month
compliance period
www.fema.gov/preliminaryfloodhazarddata

10
Wave Overtopping Technical Analysis and Mapping

11
Wave Overtopping Technical Analysis and Mapping - Overview
During severe coastal storm events along the Pacific coast, high
waves and wave runup can overtop coastal barriers including bluffs,
dunes, seawalls, revetments, and beach berms.
https://www.youtube.com/watch?v=0SczjJCCpRI
Photo: Lesley Ewing (from FEMA
Coastal Construction Manual)
Photo: Justin Vandever, BakerAECOM
12
Wave Overtopping Technical Analysis and Mapping - Analysis
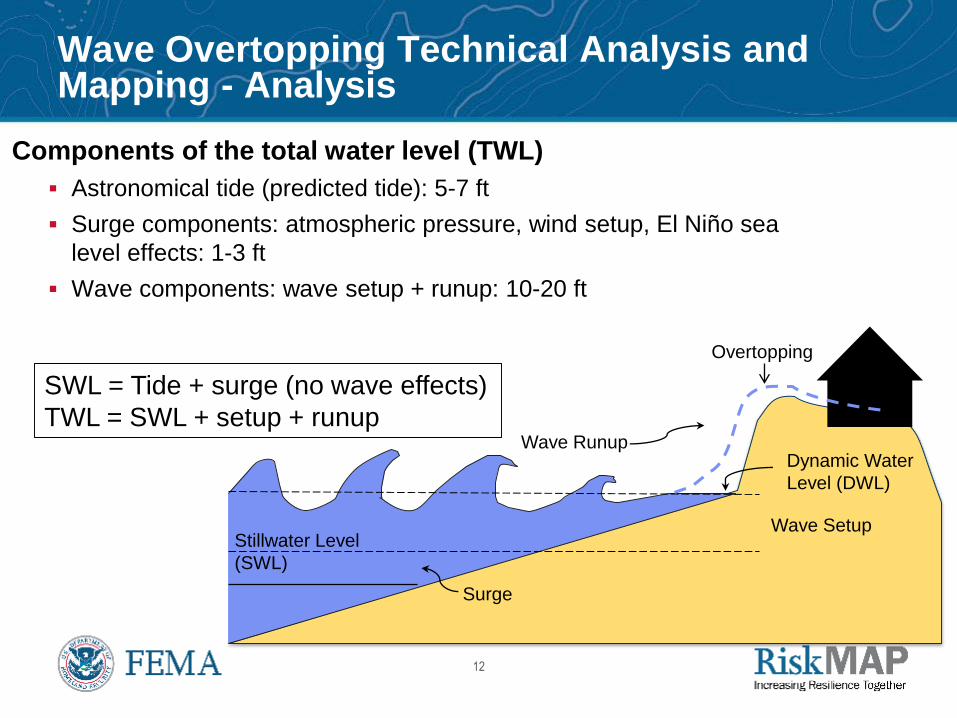
Components of the total water level (TWL)
Astronomical tide (predicted tide): 5-7 ft
Surge components: atmospheric pressure, wind setup, El Niño sea
level effects: 1-3 ft
Wave components: wave setup + runup: 10-20 ft
Wave RunupDynamic Water
Level (DWL)
Overtopping
Wave Setup
Surge
Stillwater Level
(SWL)
SWL = Tide + surge (no wave effects)
TWL = SWL + setup + runup

13
Wave Overtopping Technical Analysis and Mapping - Analysis
A set of engineering equations in the FEMA Pacific Guidelines were
used to calculate overtopping.
The calculations are dependent on the specific site characteristics
including the barrier elevation and slope, TWL, and wave period.
Barrier Crest ElevationBarrier Slope
TWL

14
Wave Overtopping Technical Analysis and Mapping - Analysis
Equations calculate the height, depth, velocity, trajectory, inland
distance, and hydraulic force.
Inland Distance
Depth,
Velocity,
Force
Height

15
Wave Overtopping Technical Analysis and Mapping - Analysis
Structures within overtopped areas can be damaged by the hydraulic force of the overtopping water.
The equations determine the specific zones where the overtopping water has enough hydraulic force to potentially damage buildings.
The equations also determine the specific zones where the overtopping water has low hydraulic forces and no damage is expected.

16
Wave Overtopping Technical Analysis and Mapping - Mapping
Special Flood Hazard Area (SFHA) Mapping
Zone VE: Inundated by 1-percent annual chance flood with additional wave-induced hazards (wave runup, wave overtopping splash, high velocity, or overland wave propagation); detailed BFE Overtopping Cases:
• Wave overtopping splash zone is the area landward of the crest of an overtopped barrier, in cases where the runup exceeds the barrier crest by 3.0 feet or more
• High velocity flow zone landward of the overtopping splash zone, where the product of the depth of flow times the flood velocity squared (hv2) is greater than 200 ft3/s

17
Wave Overtopping Technical Analysis and Mapping - Mapping
Special Flood Hazard Area (SFHA) Mapping
Zone AO: Areas subject to inundation by 1-percent-annual-chance shallow flooding Zone
AO designates areas of sheet flow shallow flooding landward of an overtopped barrier crest,
where the product of hv2 is less than 200ft3/sec or where the potential runup is less than 3.0
feet above an overtopped barrier crest. AO zones are designated with 1-, 2-, or 3-foot depths
of flooding.

18
Wave Overtopping Technical Analysis and Mapping - Mapping
• Translation of Cox-Machemehl results to mapping
• Landward extent of overtopping defines the SFHA
• Consolidation of overtopping zones• Individual overtopping zones often too narrow to map due to
map scale limitations. These zones are merged with seaward
adjacent zone.

19
Wave Overtopping Technical Analysis and Mapping - Mapping
Wave Runup and Overtopping on a Bluff with Structure

20
Wave Overtopping Technical Analysis and Mapping - Mapping
Overtopping on a Structure
Type: Splash
V Zone limit from crest: 46.2 ft.
A Zone limit from crest: 59.4 ft.
Crest Point
Overtopping Distance(59 ft. total, too narrow
to map separate AO zone)

21
Wave Overtopping Technical Analysis and Mapping - Mapping
Wave Runup and Overtopping on Beach
22
Wave Overtopping Technical Analysis and Mapping - Mapping
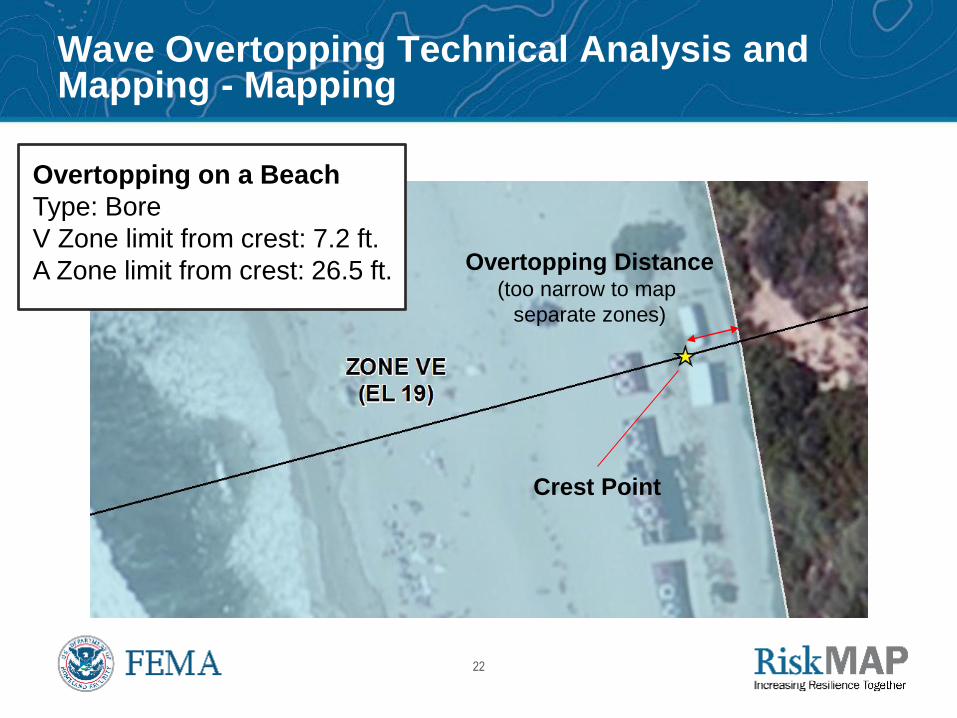
Crest Point
Overtopping Distance(too narrow to map
separate zones)
Overtopping on a Beach
Type: Bore
V Zone limit from crest: 7.2 ft.
A Zone limit from crest: 26.5 ft.

23
Wave Overtopping Technical Analysis and Mapping - Mapping
Overtopping
Crest Point
Overtopping Distance(too narrow to map
separate zones)
Overtopping on Beach Backshore
Type: Bore
V Zone limit from crest: 0 ft.
A Zone limit from crest: 17.8 ft.
Runup
Crest Point(inundated)

24
Q & A
Any questions for our presenters?

25
Additional Resources

26
Coastal Flood Risk Resources
Brochures/Fact Sheets:
https://www.fema.gov/coastal-flood-risk-resources
Coastal Flood Risk Analysis and Mapping Process
https://www.fema.gov/media-library/assets/documents/116160

27