Embed Size (px)
Citation preview

Waveform-Level Time-Domain Simulation Comparison Study of Three Shipboard Power System Architectures
J. Langston, M. Steurer
Center for Advanced Power Systems Florida State University
Tallahassee, FL [email protected] [email protected]
J. Crider, S. D. Sudhoff
School of Electrical and Computer Engineering
Purdue University West Lafayette, IN, USA
[email protected] [email protected]
Y. Lee, E. Zivi Weapons & Systems Engineering
Department United States Naval Academy
Annapolis, MD, USA [email protected] [email protected]
R. A. Dougal, Y. Zhang Department of Electrical Engineering
University of South Carolina Columbia, SC, USA
[email protected] [email protected]
R. Hebner, A. Ouroua Center for Electromechanics University of Texas at Austin
Austin, TX, USA [email protected]
Keywords: power system, detailed-waveform model, simulation, MVAC (Medium Voltage ac), HFAC (High-Frequency ac), MVDC (Medium Voltage dc) Abstract Detailed waveform-level modeling and simulation of three alternative shipboard power system architectures is presented herein. The three system architectures are based on conventional 60Hz medium-voltage ac (MVAC), higher-frequency 240Hz medium-voltage ac (HFAC) and medium-voltage dc (MVDC) technologies. To support the quantitative assessment and comparison of these three different power system architectures, each technology was modeled using a common representative, notional baseline ship. The baseline ship represents a multi-mission destroyer fitted with an 80MW next generation integrated power system (NGIPS). Modeling of each power system architecture is set forth along with simulation studies for three fault scenarios. Each of the three power system architectures was implemented within the MATLAB/ Simulink environment. Continuity of service was evaluated for each architecture along with a fault scenario using an operability metric. After a brief description of the three power system architectures and the operability metric, quantitative results are presented. 1. INTRODUCTION Electric warship systems are expected to carry out critical missions successfully even in hostile environments. There has been continued effort to perfect this goal with the advances in technology, high performance sensors and weapons that are available. However, accommodating these loads requires high demand for electrical power. Due to this high power demand from the non-propulsion loads, the role of Navy warships is shifting from efficient transport platform to mobile power station serving various mission
critical loads. This trend is clearly reflected in the U. S. Naval Research Advisory Committee’s Next Generation Integrated Power System: NGIPS Technology Development Roadmap (DoerryN., 2007) as long-term Navy objectives. Together with this main paradigm change, availability of cost-effective advanced technology leads the Navy interests toward more automated ships with reduced crew size. In order to support the NGIPS efficiently, alternate power system architectures are considered. The candidate power system architectures for the NGIPS are the MVAC architecture, the HFAC architecture, and the MVDC architecture. In order to access the dynamic performance of these architectures, three corresponding baseline models are developed and their time-domain simulation results for three scenarios are compared. A generic notional baseline model is developed to be used as a common foundation for building baseline models with specific power system structures.
Figure 1. Notional Baseline Power System Model and the fault locations for three simulation scenarios
2. GENERIC NOTIONAL ELECTRIC POWER SYSTEM
The generic notional electric power system of interest is depicted in Figure 1. The voltages and currents in the system are labeled and included in the same figure. This generic notional power system represents the baseline of Navy’s future warships, a multi-mission destroyer equipped with an 80MW NGIPS. Specifically, it is developed by the Electric Ship Research and Development Consortium (ESRDC) (Schulz, et al., 2008). The ESRDC consists of Florida State University, Mississippi State University, MIT, the Naval Postgraduate School, Purdue University, University of South Carolina, University of Texas-Austin and the U.S. Naval Academy. Sponsored by Office of Naval Research, ESRDC is involved in various aspects of Navy research. For more information, readers are referred to the ESRDC website (www.esrdc.com).
Table 1. Main components of Generic Notional Power System Component Feature Generation power 80MW
Distribution Ringbus Prime movers Gas turbine
Main: 2x36MW, 3600 rpm, Auxiliary: 2x4 MW, 14400 rpm
Generators Synchronous wound-field cylindrical rotor Main: 2 x 47 MVA Auxiliary: 2 x 5.25 MVA
Propulsion System
Permanent magnet synchronous propulsion motors: 36.5MW / 120 rpm Current-controlled hysteresis PWM inverter
Service loads 4 zonal loads and a radar (22 resistive loads) Pulse load Free Electron Laser (FEL) Energy Storage 100 MJ (4MW max) super-capacitor module Circuit breaker 3-phase ac breakers
and dc bus breakers for MVDC
There are four turbo-generators connected to the port and starboard bus that supply power to two propulsion systems, four zonal loads, a radar and a high power pulsed load. An energy storage system is also included to back up the power distribution in an event of failure. The main system components of the notional system are summarized in Table 1 with their major features. Each zone has one or two dc loads and four ac loads with varying power ratings. In this study, all loads are assumed to be resistive for simplicity. For each load component, two different power consumption levels are defined depending on the mode of operation: cruise mode and battle mode. Typical power consumption of one zone in cruise mode ranges from 800kW to 2200kW and in battle mode varies from 2800kW to 3900kW. The details of the notional system and its component models can be found in (Ali, et al., 2011).
3. SYSTEM ARCHITECTURES With the generic notional baseline power system defined, three baseline power system models were built to reflect different system architectures. The development, maintenance and simulation of the baseline systems for different architectures are shared among the ESRDC members. University of South Carolina is in charge of the MVAC model. The HFAC model is built and maintained by University of Texas-Austin. And Florida State University put the MVDC system model together. All the baseline models are constructed using Matlab/Simulink. For more information on each system architecture including component models and their parameters, refer to the Documentation for Notional Baseline System Models available at www.usna.edu/ESRDC. 3.1. Medium Voltage AC (MVAC) The MVAC system has a main distribution bus with a voltage of 4.16kV and the conventional frequency of 60Hz. The speed of turbine in the auxiliary generator is reduced from 14,400rpm to 3600 rpm. This is done by a gearbox between the turbine and the generator. In the model, it is included as a simple speed gain. Controlled diode rectifiers are employed for ac/dc conversion in four zonal loads. The zonal load layout of the MVAC system is shown in Figure 2.
Figure 2. MVAC Zonal Load Layout
3.2. High-Frequency AC (HFAC) The HFAC system adopts 4.16kV ac bus with the frequency of 240 Hz for its power distribution. The main advantage of using high-frequency is the size reduction of the generators and transformers. Figure 3 depicts the zonal load layout of HFAC. High frequency loads are supported directly from the main distribution bus. However, the power to the low frequency loads is supplied through inverter modules on the dc bus.

Figure 3. HFAC Zonal Load Layout
3.3. Medium-Voltage DC (MVDC) The MVDC system provides power via a 5000V dc distribution bus. There are ac circuit breaker between the generators and the rectifiers and disconnect switches are located on the dc bus. The zonal load layout for the MVDC system is shown in Figure 4. The dc loads receive power from the dc/dc converters, and ac loads are supported by inverter modules tapping power from the low voltage dc bus. More information on the MVDC system, including modeling, simulation and stability analysis is given in (Zivi, Bash, Chan, Cider, & Harianto, 2011). For hardware validation of research results, a low power MVDC Testbed (MVDCT) is located at Purdue University. The information regarding the MVDCT is available in (Bash, et al., 2009).
Figure 4. MVDC Zonal Load Layout 4. CONTROLS Throughout the simulation study, the system models are not equipped with supervisory control. Hence, control actions for breakers and command changes are manually coded to happen at desired time stamps. However, to add
some realism, circuit breakers and basic load controls are implemented in the following way. 4.1. Circuit Breaker An appropriate delay from mechanical and electrical components is reflected in the circuit breaker control model. The mechanical delay is assumed to be 50ms for all systems. The over current relay pick-up time is assumed to be 1 period of the ac signal. One cycle is approximately 17ms and 4.2ms for the 60 Hz and 240 Hz systems, respectively. Thus, the resultant time required for the circuit breaker to clear a fault is 67ms for the 60 Hz system and 54.2ms for the 240Hz system. MVDC has generators operating at 240 Hz. Hence, it also uses the circuit breaker delay of 54.2ms. 4.2. Load Control Simple load control is included for more realistic and consistent control operation. Each load senses the bus voltage. The MVDC system takes the higher of port and starboard bus voltages as its bus voltage. The ac systems use quadratic mean of the line-to-line voltages connected to the load, !!" = !!"! + !!"! + !!"! /3 , as their bus voltage. The bus voltage is then low-pass filtered. If the component is on and the filtered voltage deviates more than 10% from the set point, the component goes off-line. If the component needs to be turned on from off status, the filtered bus voltage should be within 5% of its nominal value.
5. SIMULATION STUDY In order to obtain meaningful insight from the comparison study based on the time domain simulation, three time-domain simulation scenarios are carefully chosen. They are a bus fault scenario, a propulsion loss scenario and a generation loss scenario. For all the simulation studies, a few assumptions are made for the initial condition of the system. All circuit breakers are assumed to be closed unless noted otherwise. All zonal loads are operating in battle mode. The propulsion loads are at their maximum power as long as the generation systems support them. In this work, the energy storage device and the high power pulsed load are off-line and not involved in the simulation. The system is operated in split plant so the starboard bus and the port bus are not connected initially. In the case of ac systems, Zone 1 and the radar are fed from port side and Zone 2, 3 and 4 are supported by the starboard bus. In the dc system, each zone is connected to the port and starboard bus simultaneously via auctioning diodes. 5.1. Scenario 1: Bolted Fault on Port Bus
In the first scenario, the system starts from the initial conditions mentioned above. A line-to-line fault occurs on the port bus at 1 second as shown in Figure 1. The fault

isolation and connection of the port and starboard bus follow.
5.1.1. MVAC In MVAC system, from the moment of fault, there is 67ms of circuit breaker delay. Hence, at 1.0667s, two breakers neighboring the fault location are opened to isolate the fault. At the same time, four breakers near bow and stern are closed to connect port bus and starboard bus. Simulation is terminated at 11s. Related plots are shown in Figure 5, Figure 6 and Figure 7. Figure 6 is a magnified version of Figure 5 in the time axis.
Figure 5. MVAC Scenario 1 plots
Figure 6. MVAC Scenario 1 plots
5.1.1. HFAC
Simulation sequences for HFAC system are almost identical to those for MVAC except that the fault isolation and the bus connection occur at 1.054 second. This is due to the different circuit breaker delay as described in the control
section 4.1. Some signals are plotted in Error! Reference source not found. and Error! Reference source not found.. The system did not go unstable after the bus fault. As the Figure 10 shows, the generator speeds are synchronized in about 1.5 second. Droop-control scheme in turbines’ governors, voltage regulation, and speed regulation all work together to maintain synchronism in the system and proportional load-sharing among the generators.
Figure 7. MVAC Scenario 1 generator speed
Figure 8. HFAC Scenario 1 plots

Figure 9. HFAC Scenario 1 plots
Figure 10. HFAC Scenario 1 Generator speed
5.1.2. MVDC
The basic idea of isolating a fault and connecting buses are identical. However, as it is required to de-energize the bus before disconnecting switches, more steps are required. The time stamps for the MVDC scenario 1 are listed in Table 2. Error! Reference source not found. and Error! Reference source not found. depict some of the resultant signals.
Table 2. MVDC Scenario 1 time stamps Time (second) Action 1 Fault applied 1.0042 dc/dc converter & propulsion on port side
disabled 1.0542 ac breakers for port generators opened 1.6542 After the port bus is de-energized, fault is
isolated. Port dc/dc converter & port generators are disconnected
1.8542 Insert charging resistors for the port dc/dc converters and the generator rectifier
2.0542 Starboard bus and port bus are connected 2.2542~3.0042 Port auxiliary generator, main generator &
propulsion drive are connected to the port bus sequentially to charge the filter capacitor
3.2542 Charging resistors for port generator and propulsion driver are bypassed
3.5042~3.7542 ac breakers for port generators closed 5.0042 Zonal dc/dc converters are connected to the
port bus and enabled sequentially 6.2542 Charging resistors for dc/dc converters are
bypassed 6.4542~7.2542 Port dc/dc converters are enabled
sequentially 7.6542 Port propulsion enabled
5.2. Scenario 2: loss of propulsion load The second scenario also starts from the same initial condition assumption. The propulsion load on the port bus is disconnected by opening the breaker between the propulsion load and the port bus at 1 second, see Figure 1. The simulation lasts for 10 more seconds after the loss of load.
5.2.1. MVAC
Bus voltages of zone 2 and the main generator currents are plotted in Figure 13. Due to the loss of the port side propulson load, the port bus current is decreased significantly and the port bus voltage increases a little. The starboard side is not affected by the propulsion loss on the port side. The speed of the generators are not plotted. However, the loss of propulsion load increases the generator speed as expected. The system remains stable and the speeds of the generators maintain synchronism.
Figure 11. MVDC Scenario 1 plots
Figure 12. MVDC Scenario 1: Generator speed

Figure 13. MVAC Scenario 2 plots
5.2.2. HFAC
The simulation result is plotted in Figure 14. As in the MVAC, the loss of port propulsion load reduces the current demand from the port generator but it does not affect the starboard side. Generator speeds show similar behavior to the MVAC case.
Figure 14. HFAC Scenario 2 plots
5.2.3. MVDC
After the port propulsion drive is disabled, the speed command for the starboard propulsion drive is stepped down from 109 rpm to 102 rpm to reduce the load on the starboard bus. The overvoltage on the port bus caused by the propulsion drive loss disconnects the port dc/dc converters
at 1.001 second. The zonal loads are then supported only by the starboard bus.
Figure 15. MVDC Scenario 2 plots
5.3. Scenario 3: Loss of Generation As with the previous scenarios, this scenario starts from the same initial conditions. The circuit breaker for the port side main generator is opened as a result of an internal fault resulting in the loss of the port side main generator. Then the port side propulsion drive goes off-line and the starboard side propulsion runs at a reduced level to allow enough power for other parts of the system.
5.3.1. MVAC The main generator is tripped at 1 second. At 1.0667 second, the port propulsion breaker opens, disconnecting the port propulsion drive. Then the power support for the radar is switched from the port bus to the starboard bus. The speed command to the starboard propulsion is reduced. Resulting plots in Figure 16 and Figure 17 clearly reflect these actions. It is observed that the speed of the tripped main generator on the port side increased significantly as it is feeding its parasitic load connected at its terminal.

Figure 16. MVAC Scenario 3 plots
Figure 17. MVAC Scenario 3: Generator speed plots
5.3.2. HFAC
The breaker for the port propulsion is opened at 1.0542 second. The starboard propulsion command is reduced and the radar power feed is switched from port to starboard right after the port propulsion loss. The simulation results closely resemble that of MVAC.
Figure 18. HFAC Scenario 3 plots
Figure 19. HFAC Scenario 3 plots
5.3.1. MVDC
Right after the loss of the main generator, the port propulsion load is disabled. The speed reference for the starboard propulsion drive is then reduced from 109 rpm to 100 rpm to be ready for the zonal load shifting from the port to the starboard bus. Finally, the port-side dc/dc converters for zones 1 through 4 are disabled and thus these zones are fed only by the starboard bus.
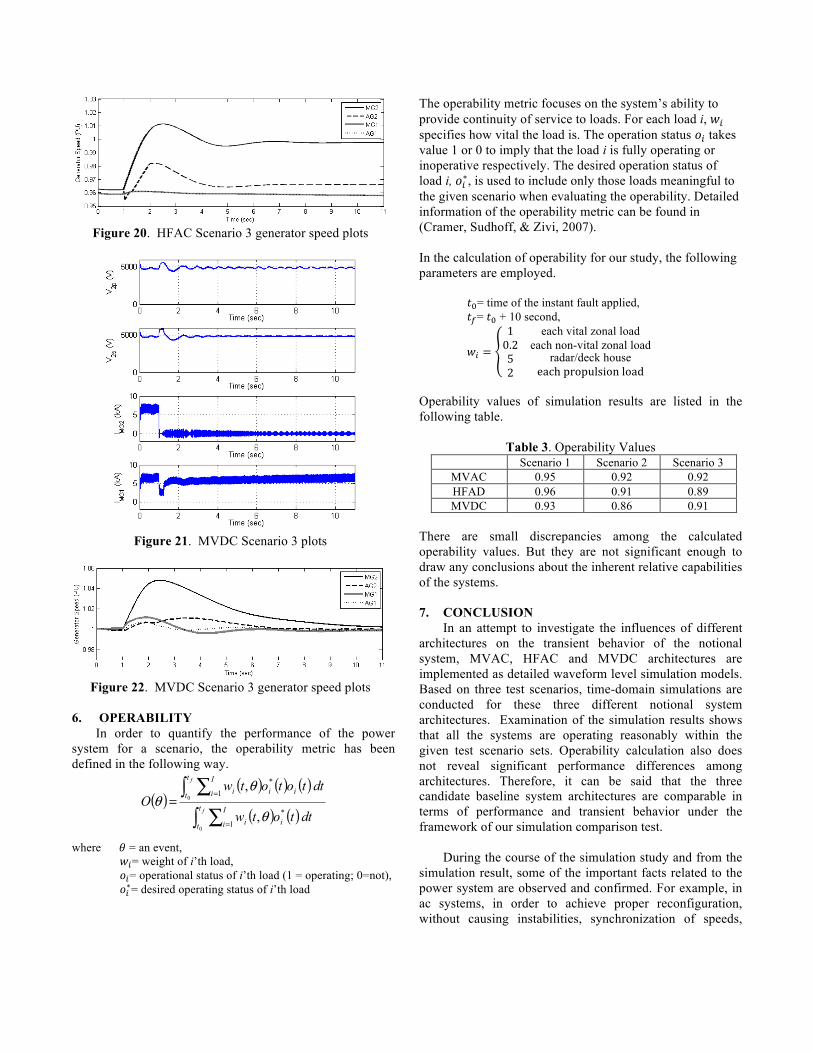
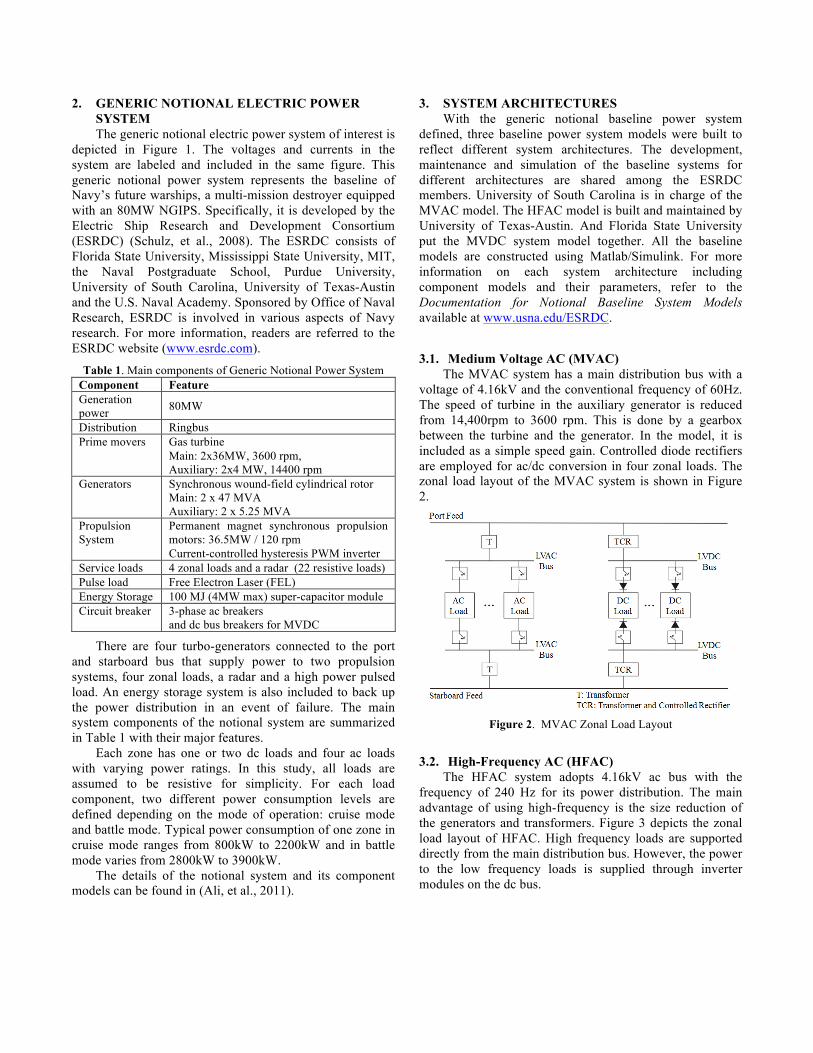
Figure 20. HFAC Scenario 3 generator speed plots
Figure 21. MVDC Scenario 3 plots
Figure 22. MVDC Scenario 3 generator speed plots
6. OPERABILITY In order to quantify the performance of the power system for a scenario, the operability metric has been defined in the following way.
( )( ) ( ) ( )
( ) ( )dttotw
dttototwO
f
f
t
t
I
i ii
t
t
I
i iii
∫ ∑∫ ∑
=
==
0
0
1*
1*
,
,
θ
θθ
where ! = an event, !!= weight of i’th load,
!!= operational status of i’th load (1 = operating; 0=not), !!∗= desired operating status of i’th load
The operability metric focuses on the system’s ability to provide continuity of service to loads. For each load i, !! specifies how vital the load is. The operation status !! takes value 1 or 0 to imply that the load i is fully operating or inoperative respectively. The desired operation status of load i, !!∗, is used to include only those loads meaningful to the given scenario when evaluating the operability. Detailed information of the operability metric can be found in (Cramer, Sudhoff, & Zivi, 2007). In the calculation of operability for our study, the following parameters are employed.
!!= time of the instant fault applied, !!= !! + 10 second,
!! =
1 each vital zonal load0.2 each non-vital zonal load52
radar/deck houseeach propulsion load
Operability values of simulation results are listed in the following table.
Table 3. Operability Values Scenario 1 Scenario 2 Scenario 3
MVAC 0.95 0.92 0.92 HFAD 0.96 0.91 0.89 MVDC 0.93 0.86 0.91
There are small discrepancies among the calculated operability values. But they are not significant enough to draw any conclusions about the inherent relative capabilities of the systems. 7. CONCLUSION In an attempt to investigate the influences of different architectures on the transient behavior of the notional system, MVAC, HFAC and MVDC architectures are implemented as detailed waveform level simulation models. Based on three test scenarios, time-domain simulations are conducted for these three different notional system architectures. Examination of the simulation results shows that all the systems are operating reasonably within the given test scenario sets. Operability calculation also does not reveal significant performance differences among architectures. Therefore, it can be said that the three candidate baseline system architectures are comparable in terms of performance and transient behavior under the framework of our simulation comparison test. During the course of the simulation study and from the simulation result, some of the important facts related to the power system are observed and confirmed. For example, in ac systems, in order to achieve proper reconfiguration, without causing instabilities, synchronization of speeds,

voltage amplitudes and phases among the generators must be maintained. The candidate load control strategy should be implemented such that the loads are disconnected and reconnected asynchronously to mitigate the system stress. 8. FUTURE WORK It is found that the waveform-level time domain simulation of the notional system requires tremendous amount of computing power. For these 11-second-long scenarios, the actual simulation times vary from about one to several hours on a Xeon quad-core workstation running at 3.0GHz with 20 GB RAM. This can be a hindrance in furthering the early stage system analysis and design. This motivates the need for more computationally efficient models. Currently, average value models are being developed with more realistic controls. REFERENCE Ali, M., Andrus, M., Dougal, R., Faruque, O., Hebner, B., Hovsapian, R., et al. (2011). Cross-Platform Validation of Notional Baseline Architecture Models of Naval Electric Ship Power Systems. Proceedings of the IEEE Electric Ship Technologies Symposium (ESTS) 2011, (pp. pp. 78-83). Alexandria, VA. Bash, M., Chan, R., Crider, J., Harianto, C., Lian, J., Neely, J., et al. (2009). A Medium Voltage DC Testbed for Ship Power System Research. IEEE Electric Ship Technologies Symposium, ESTS 2009, (pp. 560-567). Baltimore. Cramer, A., Sudhoff, S., & Zivi, E. (2007). Performance Metrics for Electric Warship Integrated Engineering Plant Battle Damage Response. Electric Ship Technologies Symposium, 2007. ESTS '07. IEEE, (pp. 22-29). Arlingon, VA. Doerry, N. (2007). Next generation integrated power system: NGIPS technology development roadmap. Washington, DC: Naval Sea Systems Command. Schulz, N., Hebner, R., Dale, S., Dougal, R., Sudhoff, S., Zivi, E., et al. (2008). The U.S. ESRDC advances power system research for shipboard systems. 43rd International Universities Power Engineering Conference, UPEC 2008, (pp. 1-4). Padov, Italty. Zivi, E., Bash, M., Chan, R., Cider, J., & Harianto, C. (2011). Modeling, Simulation and Experimental Validation of a DC Power System
Testbed. Summer Computer Simulation Conference. Hague, Netherlands.