Embed Size (px)
Citation preview

Wavelet based Brain Tumor Detection using
Mutual Information
Sushil D. Sirsat, Anaya Dange, Kunal Kamble, Narendra JadhavM-tech student M-tech student M-tech student Assit prof.
Department of Electronics & Telecommunication Engineering, Dr. B. A. T. U. Lonere, M.S., India
Abstract :Based on interpolation of low frequency sub band
images obtained by discrete wavelet transform (DWT) and the
input image, the brain tumor detection is obtained by using Haar
wavelet transform.Both input image and database image is
decomposed into different subbands by using DWT.
Interpolation of low frequency subbands as well as input image is
done. Database image is also decomposed by using Haar wavelet
transform by two level and this database image is compared with
the input image by using Mutual information principle. Same
information present in both of images is used for image
registration which is discarded and remaining information is
considered that is nothing but Brain tumor.
Keywords:Image registration, DWT, Mutual information, Brain
tumor.
I. INTRODUCTION
A brain tumor is abnormal growth of cells that are
spontaneously grows in uncontrolled manner. We can divide
tumorsin according to how exponentially they developed I.e
growth rate, with lower-grade tumors often being benign and
higher-grade tumors being malignant. When normal cells
grow old and they are damaged and can be repaired. As born
in new cell can occur in the cellular DNA and due to disrupt
of regulatory processes and the cells that may normally get
died and goes to survive and rapidly grows in multiple
number.due to which cells get multiply and due to which other
brain are get damaged and increase in numerous amount and
cells is contain the DNA which is abnormal and these
gathered cells form a mass is called as brain tumor.
Image registration is the process of overlaying two or more
images of the same image taken at random times and from
different viewpoints and/or by using different sensors. It
geometrically aligns two images the referenced and sensed
images. Image registration is a crucial step in all image
analysis tasks in which the final information is gained from
the combination of various data sources like in image fusion
of image and change detection in image and image restoration
by multi-channel. Image registration is required in remote
sensing Multi spectral classification, environmental
monitoring change detection also image mosaicing and
weather forecasting and creating super-resolution images. The
patients tumor growth and treatment verification
andcomparison of the patient‟s data with anatomical atlases),
and in computer vision (target localization, automatic quality
control)[1],Discrete Wavelet Transform (DWT) is one of the
recent wavelet transforms used in image processing.Low-
low(LL),Low-high(LH),High-low(HL), and High-high(HH)
are the different sub-band images obtained from the
decomposition of image using DWT. Haar Wavelet Transform
is another recent wavelet transform which has been used in
several image processing use down-sampling like DWT.
Therefore the sub-bands will have the same size as that of the
input image.At the end, by using inverse DWT (IDWT)
corrected interpolated low frequency sub bands and
interpolated input image are combined to achieve a high
resolution output image. The proposed technique that first one
is database image and another is the input image in which
both are decomposed into several bands by using wavelet
transform and their coefficients are stored into matrix form
with the help of MATLAB and these coefficients are
compared with the help of mutual information principle.
Corrected interpolated high frequency sub-bands and
interpolated input image are combined by using inverse DWT
(IDWT), finally. Hence, we get a brain tumor detected output
image.
II.STEPS INVOLVED IN BRAIN TUMOR DETECTION
Step 1. Input image of dimensions 320×320 is taken and read
by using MATLAB.
Step 2. Then that image is decomposed by DWT (Discrete
Wavelet Transform) into four sub bands namely Low-low
(LL), Low-high (LH), High-low (HL), and High-high (HH).
Step 3. For further processing lower sub band low-low(LL) is
for mutual information matrix. Lower band is taken because
of it contains the approximate information and lot of
information is contains in the LL band.
Step 4. Same steps are carried out on the database image onto
which decomposed image using DWT into four parts and LL
part is taken into consideration and further processing.
Step 5. The mutual information matrix is calculated by taking
the uncommon content in both mutual information matrix of
the input image and database image.
Step 6. From uncommon information the IDWT is calculated
and the resultant image is the detected tumor which is having
low sharpness and brightness.
Step 7. The brightness and sharpness and intensity is corrected
at the last to obtain the tumor.
Step 8: obtained resultant image is the detected tumor from
input image.
Vol. 3 Issue 6, June - 2014
International Journal of Engineering Research & Technology (IJERT)
IJERT
IJERT
ISSN: 2278-0181
www.ijert.orgIJERTV3IS060770
International Journal of Engineering Research & Technology (IJERT)
574

Fig 1.Block diagram of brain tumor detection algorithm
III. WAVELET DECOMPOSION OF IMAGE
The transform of a signal is just another form of representing
thesignal.It can not modify the information content available
in the signal so signal is as it is but only its form is get
changed due to its representation but not information.The
Wavelet transform gives a time–frequency and frequency –
time representation of signal. The wavelet transform is
developed to overcome the short coming of the Short Time
Fourier Transform (STFT) from which it can be also be used
to analyze non-stationary signals. The main difference
between STFT is STFT gives a constant resolution at all
frequencies and the Wavelet Transform is working on multi-
resolution technique by means of which different frequencies
are analyzed with different resolutions.A wave is nothing but
an oscillating function of time or space and it is periodic in
nature. While in contrastwavelets are localized waves.They
have their energy concentrated in time or space and are suited
to analysis of transient signals[3]. The Fourier Transform and
STFT both use waves to analyze signals on the other hand the
Wavelet Transform uses wavelets of finite energy.The wavelet
analysis and STFT analysisis similar function used to analysis
of different signals.The signal to be analyzed is multiplied
with a wavelet function just as it is multiplied with a window
function in STFTand then the transform is computed for each
segment generated. In the Wavelet Transformwidth of the
wavelet function changes with eachspectral component unlike
STFT. The Wavelet Transform gives good resolution at higher
frequencies and gives lower resolution at low frequencies and
lastly the Wavelet Transform gives good frequency resolution
and poor time resolution.
1. DESCRETE WAVELET TRANSFORM
The Wavelet Series is nothing but a sampled version of CWT
and its computation may consume significant amount of time
and resources which is depending on the resolution required
for the signal. The Discrete Wavelet Transform (DWT) is
based on sub-band coding is found to yield a fast computation
of Wavelet Transform due to which It is easy to implement
and reduces the computation time and resources required.
Short history about DWT,The foundations of DWT go back to
1976 when techniques to decompose discrete time signals
were devised which isSimilar as work was done in speech
signal coding which was named as sub-band coding. In 1983,
a technique similar to sub-band coding was developed which
was named pyramidal coding [4].Later many improvements
were made to these coding schemes which resulted in efficient
multi-resolution analysis schemes.On other hand In CWT, the
signals are analyzed using a set of basis functions which relate
simple scaling and translation contains only scaling function
and translation function. In such case of DWT we obtain a
time-scale representation of the digital signal is obtained using
digital filtering techniques. The DWT is applied on image is
very simple procedure as suppose ωɸ be the image is having
ωɸ(j+1,m,n) as j+1 is scaling function m is row vector and n is
the columns vector.is applied to the high pass filterhψ(-n) and
also to low pass filter hɸ(-n)the filter is applied across the
column as „n‟ indicates the columnand which divides the total
signal into two filters as low pass and high pass filter. Due to
which its halves due to use of two filters bandwidth gets half
as shown in fig 1. Then sub-sampling is carried out on image
by using down sampling by 2 due to which alternate samples
get removed from an image. First sub sampling is carried out
on image and then carried out on image as shown in fig.2
these sub samples are get forwarded to row filter. There are
two high pass filter and two low pass filter of scaling and
wavelet coefficient. Due to two times subsampling we get 1/4
times resolution and get 4 resultant image having diagonal,
vertical, horizontal and approximate components. The
equations (1) and (2) show the decomposition of image into
four sub bands.suppose s(n1,n2)is image where n1 is the row
indices and n2 is column indices. And N1,N2 is size of image.
The reconstruction of original image is obtain by equation (3)
as shown the inverse DWT operation performed on image.
𝜔ɸ 𝑗0,𝑚, 𝑛 = 1
𝑁1 𝑁2 𝑠(𝑛1, 𝑛2)ɸ
𝑗0,𝑘1,𝑘2 n1, n2
𝑁2−1
𝑛2=0
𝑁1−1
𝑛1=0
(1)
𝜔𝜓𝑖 𝑗0,𝑚, 𝑛
= 1
𝑁1 𝑁2 𝑠 𝑛1, 𝑛2 𝜓𝑗2,𝑘1,𝑘2
𝑖 𝑛1, 𝑛2
𝑁2−1
𝑛2=0
𝑁1−1
𝑛1=0
(2)
i= {H,V,D}
Vol. 3 Issue 6, June - 2014
International Journal of Engineering Research & Technology (IJERT)
IJERT
IJERT
ISSN: 2278-0181
www.ijert.orgIJERTV3IS060770
International Journal of Engineering Research & Technology (IJERT)
575
𝑠 𝑛1,𝑛2
= 1
𝑁1 𝑁2 𝜔ɸ(𝑗0,𝑘1,𝑘2)ɸ
𝑗0,𝑘1,𝑘2 𝑛1,𝑛2
𝑘2𝑘1
+ 1
𝑁1 𝑁2 𝜔𝜓 𝑖, 𝑘1, 𝑘2
𝑘2𝑘1
∞
𝑗=0𝑖=𝐻,𝑉,𝐷
(3)
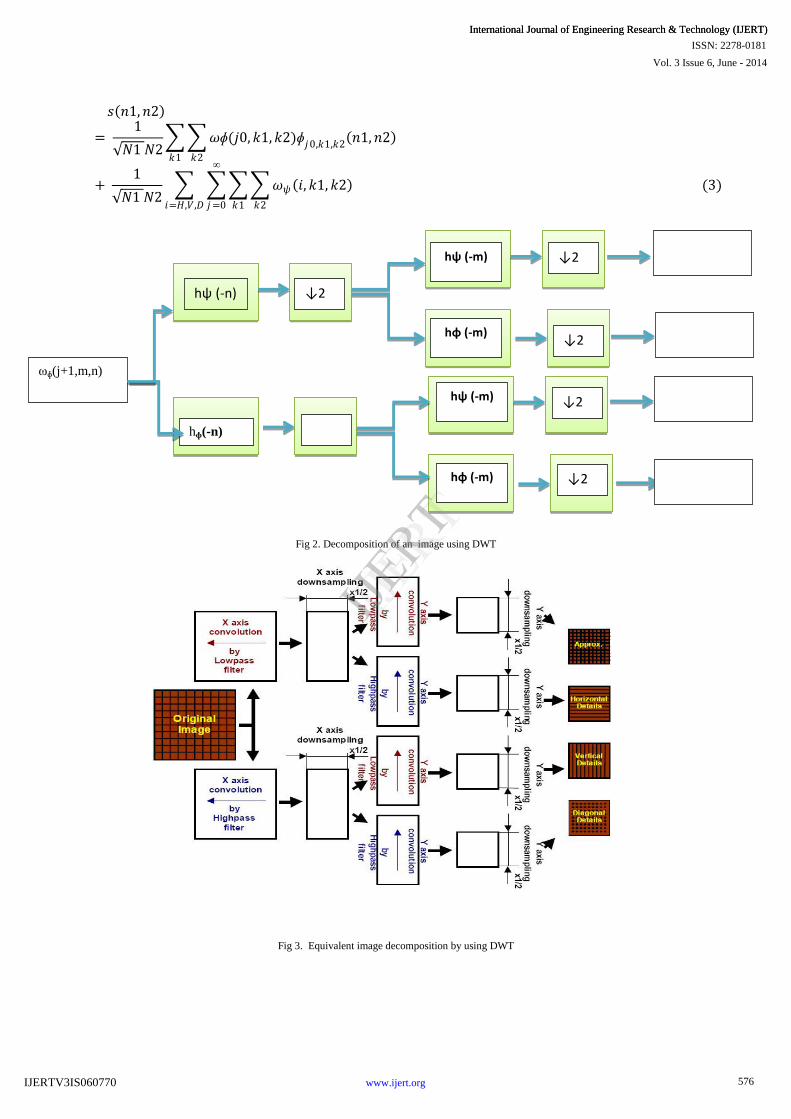
Fig 2. Decomposition of an image using DWT
Fig 3. Equivalent image decomposition by using DWT
hψ (-n)
hɸ(-n) ↓2
hψ (-m)
↓2
↓2
↓2
↓2
↓2
hψ (-m)
hɸ (-m)
hɸ (-m)
ωɸ(j+1,m,n)
ωψ(j,m,n)
ωψ(j,m,n)
ωψ(j,m,n)
ωɸ(j,m,n)
Vol. 3 Issue 6, June - 2014
International Journal of Engineering Research & Technology (IJERT)
IJERT
IJERT
ISSN: 2278-0181
www.ijert.orgIJERTV3IS060770
International Journal of Engineering Research & Technology (IJERT)
576

Fig.4Equivalent Scheme of Wavelet reconstruction Algorithm
The fig.3 shows the decomposition of image by using wavelet
transform. Image is decomposed into four different frequency
bands namely HH, HL, LH, LL which contains diagonal
contents, vertical contents, horizontal contents and
approximate contents. Fig 4. Shows reverse operation which is
taken placed in Fig. 3. In this figure original image is obtained
from combining four decomposed parts by using IDWT.
2. DWT AND FILTER BANK
2.1 MULTI-RESOLUTION ANALYSIS USING FILTER BANK
Filters are widely used signal processing functions to remove
noise in signals. By using iteration of filters with
rescaling,wavelets can be realized. The resolution of the signal
is considered by using two terms i.e. measure of the amount of
detail information in the signal is determined by the filtering
operations and the scaling is determined by up-sampling and
down-sampling.
Fig. 5 Three-level wavelet decomposition tree
The DWT is obtained by successive low pass and high pass
filtering of the discrete time-domain signal as shown in fig. 4.
This is called asMallat algorithm or Mallat-tree decomposition
of signal. Its significance is in the manner of which it connects
the continuous- time mutiresolution to discrete-time filters. In
the figure4. The sequence x[n] is applied to wavelet
decomposition tree where n is an integer.G0 is low pass filter
produces approximation a[n] and H0 is high pass filter
produces detailed information i.e. d[n]. At each decomposition
level, the half band filters produce signals spanning only half
the frequency band. This doubles the frequency resolution as
the uncertainty in frequency is reduced by half[3]. According
to Nyquist's criteria if the original signal hasa highest
frequency of ω and it needs a sampling frequency of 2ω
radians, then it produces highest frequency of ω/2 radians.
Now it can be sampled at a frequency of ωradians thus
discarding half the samples with no loss of information. The
down sampling by 2 halves the time resolution as the entire
signal is now represented by only half the number of samples.
Thus, while the half band low pass filtering removes half of
the frequencies and thus halves the resolution, the decimation
by 2 doubles the scale [3]. The time resolution becomes good
at high frequencies, while the frequency resolution becomes
good at low frequencies.Unless and until the desired level of
resolution is reachedthe filtering and decimation process is
carried out. The length of the signaldetermines maximum
number of levels. The DWT of the original signal is then
obtained by concatenating all the coefficients, a[n] and d[n],
starting from the last level of decomposition [3]
Fig. 6 Three-level wavelet reconstruction tree
Vol. 3 Issue 6, June - 2014
International Journal of Engineering Research & Technology (IJERT)
IJERT
IJERT
ISSN: 2278-0181
www.ijert.orgIJERTV3IS060770
International Journal of Engineering Research & Technology (IJERT)
577

Fig.6shows three-level wavelet reconstruction tree. The
reconstruction is the reverse process of decomposition. The
approximation and detail coefficients at every level are up
sampled by two, passed through the low pass and high pass
synthesis filters and then added. This process is continued
through the same number of levels as in the decomposition
process to obtainthe original signal. TheMallat algorithm
works equally well if the analysis filters, G0 and H0, are
exchanged with the synthesis filters, G1 and H1.[3]
2.2 CONDITIONS FOR PERFECT RECONSTRUCTION
In Wavelet Transform applications, it is need to be get the
original signal bysynthesizing of wavelet coefficients. Perfect
reconstruction is achieved by the analysis and synthesis filters
which satisfy following certain conditions aslet G0(z) and
G1(z) are low pass analysis and synthesis filters,and H0(z) and
H1(z) the high pass analysis and synthesis filters.Then the
filters have to satisfy the following two conditions as given in
equation 1 and 2
G0(-z) G1(z) + H0(-z ) . H1(z) = 0 (4)
G0(-z) G1(z) + H0 (z ) . H1(z) = 2z-d
(5)
The first equation implies that the reconstruction is aliasing-
free and the second equation shows that the amplitude
distortion has amplitude of one.The perfect reconstruction
condition does not change if we switch the analysis and
synthesis filters i.e. reversible.There are number of filters
which satisfy two conditions as above mentioned. But not all
of them give accurate Wavelet Transforms, especially when
the filter coefficients are quantized [3]. The accuracy of the
Wavelet Transform can be determined after reconstruction by
calculating the Signal to Noise Ratio (SNR) of the signal.
Some applications like pattern recognition do not need
reconstruction, and in such applications, the above conditions
need not apply [3].
IV. USE OF ENTROPY AND MUTUAL INFORMATION
1.ENTROPY
Measure of information of a message is termed as entropy. It
is actually concern with communication. How much amount
of information is transmitted and amount of information is
received. Hartley prosed theory of entropy. In which he
proposed measure of information of a message that formsthe
basis of many present-day measures. He consider message of
a string of symbol. Each symbol is represented as s different
possibilities if there are n number of symbols then total
amount of possible combinations are of message are sn. He
sought to define an information measure that increases with
message length. The measure sncomplies, but the amount of
information would increase exponentially with the length of
the message and that is not realistic. Hartley wanted a measure
H that increases linearly withn, i.e. H = Kn, where K is a
constant depending on the number of symbols s. then he also
consider message of n1 and n2 length from s1 and s2 number
of symbols. If possible messages are equal i.e s1n1
=s2n2
. Then
amount of information is also equal. Due to these restrictions
he proposed
H = n LOG s = logsn
(6)
Entropy measure depends on the number of possible
outcomes:as the largerthe number of possible messages, the
larger the amountof information message. If thereis only a
single message possible, there is no information (log 1 = 0)
obtained, because you already knew we wouldreceive that
message. Drawbacks of Hartley‟s entropy are overcome by
Shannon‟s entropy measure as he consider e1,e2,e3……….em
And having probabilities are p1,p2,p3…………pm.
Shannon‟s entropy is formulated as
𝐻 = pi log 1/pi𝑖 (7)
H= - 𝑝𝑖 log 𝑝𝑖𝑖 (8)
As we apply Shannon‟s entropy if event is more likely occurs
then equation becomes
H= - ∑ 1/snlog 1/s
n= ∑ 1/s
nlogs
n= log sn (9)
Which is same as Hartley entropy shown in (9)
Shannon‟s entropy is used on the image. In which
probabilities are not going to be taken into consideration but
the uses distribution of grey level of image is used.
Distribution of Probability of these grey level is is calculated
by counting total number of times each grey level is occurred
divided by total number of time it occurs. An image
consisting single intensity is having low less entropy and
having less information and the and high entropy is obtained
by the more number of times intensity occurs and gives more
amount of information.
2.MUTUAL INFORMATION
The research that eventually led to the introduction ofmutual
information as a registration measure dates back tothe early
1990‟s. Woods et al. [5, 6] first introduced a
registrationmeasure for multimodality images based on
theassumption that regions of similar tissue (and hence
similargrey values) in one image would correspond to
regionsin the other image that also consist of similar grey
values(though probably different values to those of the
firstimage). Ideally, the ratio of the grey values for all
correspondingpoints in a certain region in either image
varieslittle. Consequently, the average variance of this ratio
forall regions is minimized to achieve registration.
Basically mutual information of two images A and B is
expressed in terms of I, can be formulated as
I(A,B)=H(B) - H(B│A) (10)
Where H(B) is entropy calculated on the basis of distribution
of grey level of image. And H(B│A) is the conditional
entropy based on conditional probabilities p(a│b) which is the
chance of grey value b in image B given that the
corresponding voxel in A has grey value a.When interpreting
entropy as a measure of uncertainty, equation (5) translates to
“the amount of uncertainty about image B minus the
Vol. 3 Issue 6, June - 2014
International Journal of Engineering Research & Technology (IJERT)
IJERT
IJERT
ISSN: 2278-0181
www.ijert.orgIJERTV3IS060770
International Journal of Engineering Research & Technology (IJERT)
578

uncertainty about B when A is known”. Simply we can say
that mutual information is nothing but amount of uncertainty
about B decreases with A is known i.e amount of information
A contains about B as A and B can be interchanged so I(A,B)
is amount of information contained in B about A, so called
mutual information.
The second definition is closely related to joint entropy. It is
shown in equation (10)
I(A,B) = H(A)+H(B) - H(A,B) (11)
In this definition contains the term −H(A,B) is thatmaximizing
mutual information is related to minimizingjoint entropy. It is
fact that joint histogramof two images‟ grey values disperses
with misregistrationand that joint entropy is a measure of
dispersion.Mutual information and joint entropy are
computedfor the overlaying part of the many images and
resultsare obtained are sensitive to the size also contents of
overlap.A problem that can occur when using joint entropyon
its own, is that low values (normally associated with ahigh
degree of alignment) can be found for complete
misregistrations.
Mutual information has following properties:
1. Symmetry property
I(A,B) = I(B,A)
2. I(A,A) = H(A)
The informationin image A contains about itself is equal to
the information (entropy) of image A.
3. I(A,B) ≤ H(A),
I(A,B) ≤ H(B)
The information the images contain about each other
can never be greater than the information in the images
themselves.
4.I(A,B) ≥ 0
The uncertainty about A cannot be increased by
learning about B.
5.I(A,B) = 0 if and only if A and B are independent.
When A and B are not in any way related, no knowledgeis
gained about one image when the other is given.
V.RESULTS AND DISCUSSION
Basically in result part it consist of detection of tumor from an
defected image. Following are parts of detection of tumor
1.PREPROSING
In the preprocessing stagedefected input image(figure 8) and
database image(figure 7) are to be taken and on which resize
into 320×320pixels.and noise is also removed from both the
images. The images should be of same modalities i.e M.R
images. We can also go with various modalities such as PET
Figure.7 Database image Figure 8. defected image.
Vol. 3 Issue 6, June - 2014
International Journal of Engineering Research & Technology (IJERT)
IJERT
IJERT
ISSN: 2278-0181
www.ijert.orgIJERTV3IS060770
International Journal of Engineering Research & Technology (IJERT)
579

2. DECOMPOSTION USING HAAR WAVELET
figure.9 Wavelet decompostion using Haar wavelet
The inputimage of size 320×320 is decomposed by using the
Haar wavelet into four frequency bands an Low-Low, Low-
High, High-Low, High-High. Which is and operation is
carried out only on LL part as it contains the approximate
contents rather other part contains Vertical contents ,
horizontal contents and diagonal contents. As the
decomposition level goes on increasing the resolution of an
image get changed. The LL part contains most of information
and due to which we choose only LL part for further
processing.in which the low-low coefficients are processed
with sub band coding .Similarly the database image is also
decomposed by using Haar wavelet into four sub bands
namely LL, LH, HL, HH. The decomposition of database
image is shown in figure 9. These LL parts are contains most
of information and used for mains processing stage in which
filtering is carried out on the same and contrast enhancement
and brightness enhancement is carried out. This is carried out
with the help of MATLAB in which it shows the
decomposition of both images with precise value and due
which we get better results. The decomposition is carried out
in the pyramid structure, of size as follows:
Pyramid level 1 size of 320×320
Pyramid level 2 size 160×160
Pyramid level 3 size of 80×80
Pyramid level 4 size 40×40
The decomposition of an image is carried out at each level is
exactly 1/4 times the original image. Same decomposition is
carried put at each level with the 1/4 times resolution change
at each level so as we are having 320×320 as original image
after one level of decomposition it becomes 160×160.
Likewise after each level its resolution gets changes to 1/4
times and after 4 levels it becomes to 40×40 pixels.
Vol. 3 Issue 6, June - 2014
International Journal of Engineering Research & Technology (IJERT)
IJERT
IJERT
ISSN: 2278-0181
www.ijert.orgIJERTV3IS060770
International Journal of Engineering Research & Technology (IJERT)
580

3. DETECTION OF TUMOR:
Fig.10 detected tumor by using proposed method. Images from top left corner (a) database image (b) defected image (C) detected tumor using proposed method.
(d) Database image (e) defected image (f) detected tumor using proposed method
In the detection stage, it is last stage of the algorithm in which
input image and database image is decomposed using Haar
wavelet and these are form the mutual information matrix in
which the common data available in image is not consider and
uncommon data is the detected tumor. As discussed above
there are 4 levels of pyramid and which are as follows:
Pyramid level 1 size of 320×320
Pyramid level 2 size 160×160
Pyramid level 3 size of 80×80
Pyramid level 4 size 40×40
At each levels there are total 5 outer iterations are used to
detect the outer changes in an image and 40 inner iterations it
shows that there are 120 total iterations used for the outer and
inner smoothness and correction and detection of change in
each of pixel. The mean square error is also calculated from
each level of pyramid. The mean square error shows the error
from an image when it get reconstructed from taking inverse
transform. When MSE is greater then reconstruction is poor
and gets error in the resultant image. For this algorithm the
various values of MSE are calculated as shown in table 1. This
implies that the MSE is very low for this algorithm.
Pyramid level Size of image MSE
Level 1 320×320 0.0650
Level 2 160×160 0.0462
Level 3 80×80 0.04283
Level 4 40×40 0.0391
Table 1. MSE calculation
From this algorithm we can also find out the recovery tumor
after treatment by keeping the MR image of patient before
treatment as database image and by taking input image as
image taken after the treatment as we can easily find out the
difference between two images so one can check whether goes
in positive direction or to change the treatment and recovery
ratio of the patient.Thus we can go with detection of
mammograms and also detection of crack in bones, and many
more .due to this technique we can go with the smallest details
of image to b get detected as decomposing Image into several
parts and several levels and several iterations. The final output
is shown in figure 10.(c) and 10.(f), in which the detected
Vol. 3 Issue 6, June - 2014
International Journal of Engineering Research & Technology (IJERT)
IJERT
IJERT
ISSN: 2278-0181
www.ijert.orgIJERTV3IS060770
International Journal of Engineering Research & Technology (IJERT)
581

tumor is clearly shown. As this is carried out with the help of
this algorithm. In which to mutual information matrix are
calculated for input image and database image. And finally
the
uncommon part of both input image and database image are
taken into consideration and final output is shown in results
which is uncommon part from these input image and database
image.
VI. CONCLUSION
The wavelet based brain tumor detection is the technique in
which the tumor is detected by using the database and input
image which is infected by the tumor and which is
decomposed using Haar wavelet and then the uncommon part
is taken into consideration which is nothing but detected
tumor. This algorithm is also suitable for the detection of
mammograms from the breast cancer detection. As far as this
technique is concern is very helpful in brain tumor detection
and crack of bones and mammogramdetection in which
database image is get compared with the help of mutual
information matrix with the input image and resultant image is
nothing but the defected breast cancer image from which we
can further get treatment
REFERENCES
[1] Josien P. W. Pluim, J. B. Antoine Maintz and Max A.
Viergever,”Mutual information based registration of medical images: a
survey”Ieee Transactions On Medical Imaging, Vol. Xx, No. Y, Month 2003
[2] DarshanaMistry,Asim Banerjee “Descrete wavelet transform
ushingmatlab” IJCETVolume 4, Issue 2, March – April (2013), pp. 252-
259
[3] DeepikaSripath “Efficient Implementations of Discrete
WaveletTransforms Using FPGAs” Electronic Theses, Treatises andDissertations. Paper 1599.
[4] Tullimilli.ch.padminiM.V.Sudhkar”Image Resolution Enhancement
ByUsing Different Wavelet Decompositions”International Journal of Research in Advent Technology,Volume 1, Issue 4, November 2013
[5] G.Shruthi1 ,Radha Krishna A.N.”Image Reconstruction Using Discrete Wavelet Transform” IOSR Journal of VLSI and Signal Processing
(IOSR-JVSP)Volume2,Issue4(May.–Jun.2013),PP14-20
[6] Rajesh C. Patil, Dr. A. S. Bhalchandra, “Brain Tumour Extraction from MRI Images Using MATLAB”, International Journal of Electronics,
Communication & Soft Computing Science and Engineering, Volume
2, Issue 1
[7] Monica Subashini.M, Sarat Kumar Sahoo, “Brain MR Image Segmentation for Tumor Detection using Artificial Neural Networks”,
International Journal of Engineering and Technology, vol. 5, no. 2 Apr-
May 2013 [8] R. P. Woods, S. R. Cherry, and J. C. Mazziotta, “Rapid
automatedalgorithm for aligning and reslicing PET images,” Journal of
Computer Assisted Tomography, vol. 16, no. 4, pp. 620– 633, 1992.
[9] R. P. Woods, J. C. Mazziotta, and S. R. Cherry, “MRI-PETregistration
with automated algorithm,” Journal of ComputerAssisted Tomography,
vol. 17, no. 4, pp. 536–546, 1993.2010 [10] W. Gonzalez, “Digital Image Processing”, 2nd ed. Prentice Hall, Year
of Publication 2008, Page no 378
[11] Mohamed LamineToure, “Advanced Algorithm for Brain Segmentation using Fuzzy to Localize Cancer and Epilepsy Region”, International
Conference on Electronics and Information Engineering (ICEIE
2010),Vol. no 2 [12] SenthilPeriaswamyHanyFarid“Medical Image Registration with Partial
Data”Siemens Medical Solutions
USA,Inc.,Malvern,PA1935DartmouthCollege,Hanover,NH 03755,USA
Vol. 3 Issue 6, June - 2014
International Journal of Engineering Research & Technology (IJERT)
IJERT
IJERT
ISSN: 2278-0181
www.ijert.orgIJERTV3IS060770
International Journal of Engineering Research & Technology (IJERT)
582


![Analysis of Brain MRI for Tumor Detection & Segmentation · In early work Ahmed Kharrat et al [1] developed an algorithm for brain tumor detection using wavelet transform decomposition](https://img.pdfslide.net/doc/110x75/5b5c46d07f8b9a16498bc4b1/analysis-of-brain-mri-for-tumor-detection-in-early-work-ahmed-kharrat-et-al.jpg)