Embed Size (px)
Citation preview
Talanta 76 (2008) 373–381
Contents lists available at ScienceDirect
Talanta
journa l homepage: www.e lsev ier .com/ locate / ta lanta
Wavelet neural networks to resolve the overlapping signal in the voltammetricdetermination of phenolic compounds
espo DF, Melona,
ds, i.etectiverlaetric
bratiotomaod prcomp
Juan Manuel Gutierreza, Albert Gutesb, Francisco Ca Bioelectronics Section, Department of Electrical Engineering, CINVESTAV, 07360 Mexicb Sensors & Biosensors Group, Department of Chemistry, Universitat Autonoma de Barc
a r t i c l e i n f o
Article history:Received 13 November 2007Received in revised form 7 March 2008Accepted 12 March 2008Available online 21 March 2008
Keywords:VoltammetrySignal resolutionWavelet neural networkPhenols
a b s t r a c t
Three phenolic compounmined by voltammetric deBecause of strong signal oa combination of chemomconcept. To facilitate cali2.5 mM) was prepared aucould be resolved with gothe obtained values were
1. Introduction
Wavelet Transform (WT) proposed by Grossmann and Morlet [1]
has become a useful decomposition tool in a wide variety of appli-cations throughout mathematics, science and engineering; in thelast years, it has emerged as an interesting option in the chemistryfield [2,3] because of its ability to compress or denoise data. WT isused to represent a signal, f(x), using a linear combination of a setof basis functions which are the scaled and translated versions ofa main function named mother wavelet [4]. The fundamental ideaof the transform is to analyze data at different resolutions and toreveal aspects that other signal analysis techniques can overlook[1]. WT signal processing compresses the signal by removing use-less features; in this way, modeling becomes computationally lessdemanding.On the other hand, Artificial Neural Networks (ANNs) are power-ful modeling tools for deriving meaning from complex or imprecisedata; their superior performance makes them interesting in tasksof approximation, pattern recognition or multivariate calibrationmethods that are too complex to be attempted by either humansor other computer techniques [5–9]. An ANN is an information pro-cessing model that is inspired by the physiology of animal nervoussystems. It is composed of a large number of highly interconnected
∗ Corresponding author. Tel.: +34 93 5811017; fax: +34 93 5812379.E-mail address: [email protected] (M. del Valle).
0039-9140/$ – see front matter © 2008 Elsevier B.V. All rights reserved.doi:10.1016/j.talanta.2008.03.009
edesb, Manuel del Valleb,∗, Roberto Munoza
exicoEdifici Cn, 08193 Bellaterra, Spain
. phenol, catechol and 4-acetamidophenol, were simultaneously deter-on of its oxidation reaction at the surface of an epoxy-graphite transducer.pping, Wavelet Neural Networks (WNN) were used in data treatment, ins and electrochemical sensors, already known as the electronic tonguen, a set of samples (concentration of each phenol ranging from 0.25 totically by employing a Sequential Injection System. Phenolic compoundsediction ability, showing correlation coefficients greater than 0.929 whenared with those expected for a set of samples not employed for training.
© 2008 Elsevier B.V. All rights reserved.
processing elements (neurons) working in parallel to solve specificproblems [10–12].
The stepwise coupling of WT and ANN has been proposed as astrategy for the non-stationary signal processing, mainly when it isconformed by a great amount of input data [13,14]. The purpose ofWT is to compact the signal, representing it by means of a reduced
set of coefficients. On the other hand, the artificial neural networkis the one in charge to map the set of coefficients into the soughtinformation. Nevertheless, for the development of this strategy, alarge effort is required to obtain the optimal configurations of WTand ANN. First, it is necessary to determine which wavelet motherfunction to use plus the maximum level of compaction that betterpreserves the information; secondly, one needs to find the ANN typeand structure to properly interpret the compacted signal. Evidently,this implementation requires the setup and fine tuning of the twoprocesses separately.In order to solve this disadvantage, a novel processing strategythat combines wavelets with neural networks has been recentlyproposed. This successful synthesis of theories has generated a newclass of networks called Wavelet Neural Networks (WNNs) [15]. Thedistinct feature of these networks is that they use wavelet functionsas the activation functions of hidden layer neurons. Using theoret-ical features of wavelet transform, network construction methodscould be developed [16].
There are a few works related with the WNN and its applicationin chemistry; most of them make use of these networks in QSARpredictions such as: inclusion complexation constants of cyclodex-
Talant
�i(x) =P∏j=1
(aij) where aij = x − tijsij
(5)
where tij and sij are the translation and scaling vectors, respectively.
2.1. WNN algorithm
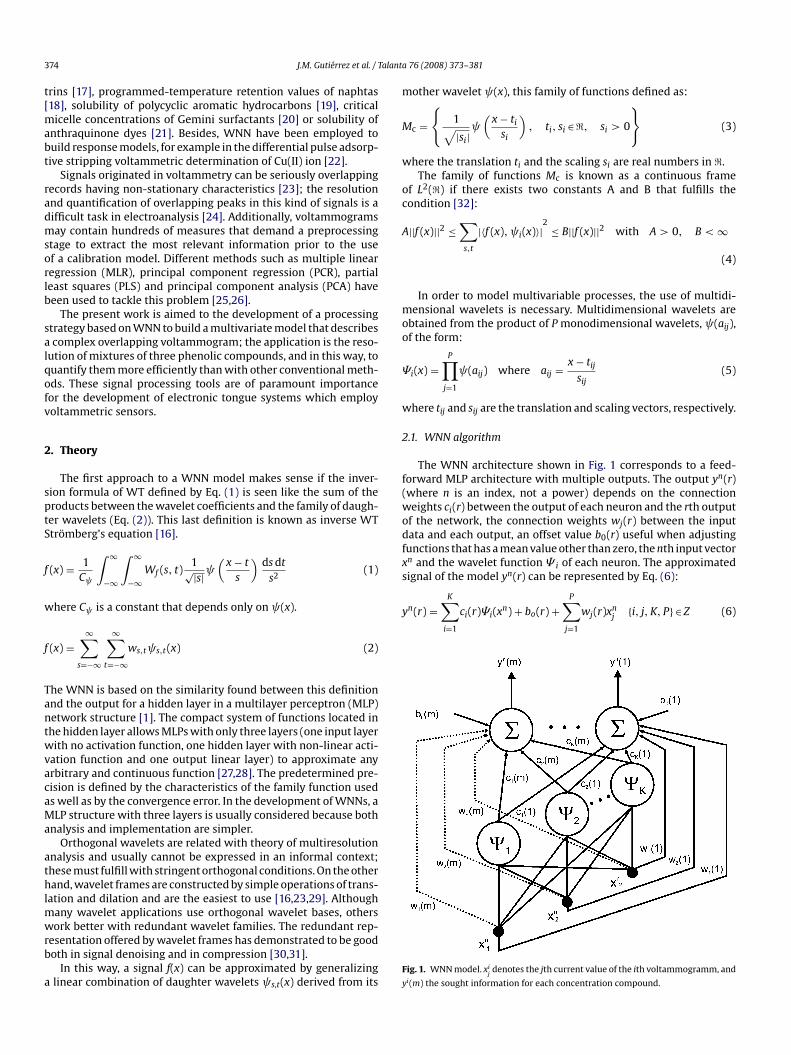
The WNN architecture shown in Fig. 1 corresponds to a feed-forward MLP architecture with multiple outputs. The output yn(r)(where n is an index, not a power) depends on the connectionweights ci(r) between the output of each neuron and the rth outputof the network, the connection weights wj(r) between the inputdata and each output, an offset value b0(r) useful when adjustingfunctions that has a mean value other than zero, the nth input vectorxn and the wavelet function � i of each neuron. The approximatedsignal of the model yn(r) can be represented by Eq. (6):
yn(r) =K∑i=1
ci(r)�i(xn) + bo(r) +
P∑j=1
wj(r)xnj {i, j, K, P} ∈ Z (6)
374 J.M. Gutierrez et al. /
trins [17], programmed-temperature retention values of naphtas[18], solubility of polycyclic aromatic hydrocarbons [19], criticalmicelle concentrations of Gemini surfactants [20] or solubility ofanthraquinone dyes [21]. Besides, WNN have been employed tobuild response models, for example in the differential pulse adsorp-tive stripping voltammetric determination of Cu(II) ion [22].
Signals originated in voltammetry can be seriously overlappingrecords having non-stationary characteristics [23]; the resolutionand quantification of overlapping peaks in this kind of signals is adifficult task in electroanalysis [24]. Additionally, voltammogramsmay contain hundreds of measures that demand a preprocessingstage to extract the most relevant information prior to the useof a calibration model. Different methods such as multiple linearregression (MLR), principal component regression (PCR), partialleast squares (PLS) and principal component analysis (PCA) havebeen used to tackle this problem [25,26].
The present work is aimed to the development of a processingstrategy based on WNN to build a multivariate model that describesa complex overlapping voltammogram; the application is the reso-lution of mixtures of three phenolic compounds, and in this way, toquantify them more efficiently than with other conventional meth-ods. These signal processing tools are of paramount importancefor the development of electronic tongue systems which employvoltammetric sensors.
2. Theory
The first approach to a WNN model makes sense if the inver-sion formula of WT defined by Eq. (1) is seen like the sum of theproducts between the wavelet coefficients and the family of daugh-ter wavelets (Eq. (2)). This last definition is known as inverse WTStromberg’s equation [16].
f (x) = 1C
∫ ∞
−∞
∫ ∞
−∞Wf (s, t)
1√|s| (x − ts
)dsdts2
(1)
where C is a constant that depends only on (x).
f (x) =∞∑
s=−∞
∞∑t=−∞
ws,t s,t(x) (2)
The WNN is based on the similarity found between this definition
and the output for a hidden layer in a multilayer perceptron (MLP)network structure [1]. The compact system of functions located inthe hidden layer allows MLPs with only three layers (one input layerwith no activation function, one hidden layer with non-linear acti-vation function and one output linear layer) to approximate anyarbitrary and continuous function [27,28]. The predetermined pre-cision is defined by the characteristics of the family function usedas well as by the convergence error. In the development of WNNs, aMLP structure with three layers is usually considered because bothanalysis and implementation are simpler.Orthogonal wavelets are related with theory of multiresolutionanalysis and usually cannot be expressed in an informal context;these must fulfill with stringent orthogonal conditions. On the otherhand, wavelet frames are constructed by simple operations of trans-lation and dilation and are the easiest to use [16,23,29]. Althoughmany wavelet applications use orthogonal wavelet bases, otherswork better with redundant wavelet families. The redundant rep-resentation offered by wavelet frames has demonstrated to be goodboth in signal denoising and in compression [30,31].
In this way, a signal f(x) can be approximated by generalizinga linear combination of daughter wavelets s,t(x) derived from its
a 76 (2008) 373–381
mother wavelet (x), this family of functions defined as:
Mc ={
1√|si|
(x − tisi
), ti, si ∈ �, si > 0
}(3)
where the translation ti and the scaling si are real numbers in �.The family of functions Mc is known as a continuous frame
of L2(�) if there exists two constants A and B that fulfills thecondition [32]:
A||f (x)||2 ≤∑s,t
|〈f (x), i(x)〉|2
≤ B||f (x)||2 with A > 0, B <∞
(4)
In order to model multivariable processes, the use of multidi-mensional wavelets is necessary. Multidimensional wavelets areobtained from the product of P monodimensional wavelets, (aij),of the form:
Fig. 1. WNN model. xijdenotes the jth current value of the ith voltammogramm, and
yi(m) the sought information for each concentration compound.
alant
J.M. Gutierrez et al. / Twhere r = 1,2,. . .,m, with m ∈ Z, represent the number of outputs, andsubindexes i and j stand for the ith neuron in the hidden layer andthe jth element in the input vector, xn, respectively, K is the numberof wavelet neurons and P is the length of input vector, xn. With thismodel, a P-dimensional space can be mapped to a m-dimensionalspace (RP → Rm), allowing the network to predict a value for eachoutput yn(m) when the nth voltammogram xn is input to the trainednetwork.
The basic neuron will be a multidimensional wavelet � i(xn)which is built using the definition (5), where scaling (sij) and trans-lation (tij) coefficients are the adjustable parameters of the ithwavelet neuron. With this mathematical model for the wavelet neu-ron, the network’s output becomes a linear combination of severalmultidimensional wavelets [15,33–35].
Some functions have been proposed in the implementation ofWNN [36–38]. In the present work, the mother wavelet used asactivation function corresponds to the first derivative of a Gaussianfunction defined by (x) = xe−0.5x2
. This function has demon-strated to be an effective function for the implementation of WNN[15].
The training procedure consists in the error backpropagation.This method, proposed by Rumelhart et al. [39], is an iterative algo-rithm that allows training of multilayer networks. The algorithmlooks for the minimum of the error function from the set of train-ing vectors. In our application, the weights change once when allthe vectors have been entered to the network (after one epoch).In this way, the training process tries to diminish the differencebetween the outputs of the network and the expected values. Thedifference is evaluated according to the Mean Squared Error (MSE)function defined by Eq. (7):
J(˝) = 12
N∑n=1
m∑r=1
(ynexp(r) − yn(r))2 = 12
N∑n=1
m∑r=1
(en(r))2 (7)
where yn(r) is the rth output of the network and ynexp(r) is the rthreal value related to the input vector xn.
Since the proposed model is of multivariable character, wedefine:
˝ = {b0(r),wj(r), ci(r), tij, sij} (8)
as the set of parameters that will be adjusted during training.
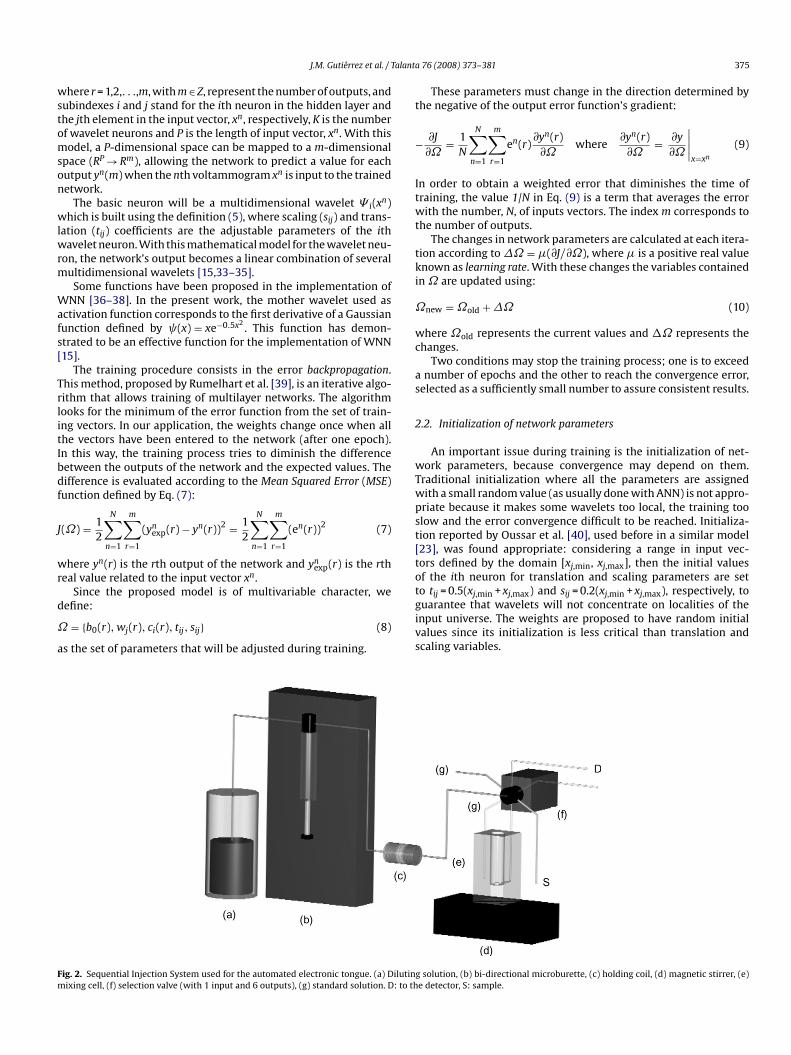
Fig. 2. Sequential Injection System used for the automated electronic tongue. (a) Dilutinmixing cell, (f) selection valve (with 1 input and 6 outputs), (g) standard solution. D: to th
a 76 (2008) 373–381 375
These parameters must change in the direction determined bythe negative of the output error function’s gradient:
− ∂J
∂˝= 1N
N∑n=1
m∑r=1
en(r)∂yn(r)∂˝
where∂yn(r)∂˝
= ∂y
∂˝
∣∣∣∣x=xn
(9)
In order to obtain a weighted error that diminishes the time oftraining, the value 1/N in Eq. (9) is a term that averages the errorwith the number, N, of inputs vectors. The index m corresponds tothe number of outputs.
The changes in network parameters are calculated at each itera-tion according to�˝ = �(∂J/∂˝), where � is a positive real valueknown as learning rate. With these changes the variables containedin˝ are updated using:
˝new =˝old +�˝ (10)
where ˝old represents the current values and �˝ represents thechanges.
Two conditions may stop the training process; one is to exceeda number of epochs and the other to reach the convergence error,selected as a sufficiently small number to assure consistent results.
2.2. Initialization of network parameters
An important issue during training is the initialization of net-work parameters, because convergence may depend on them.Traditional initialization where all the parameters are assignedwith a small random value (as usually done with ANN) is not appro-priate because it makes some wavelets too local, the training tooslow and the error convergence difficult to be reached. Initializa-tion reported by Oussar et al. [40], used before in a similar model[23], was found appropriate: considering a range in input vec-tors defined by the domain [xj,min, xj,max], then the initial valuesof the ith neuron for translation and scaling parameters are setto tij = 0.5(xj,min + xj,max) and sij = 0.2(xj,min + xj,max), respectively, toguarantee that wavelets will not concentrate on localities of theinput universe. The weights are proposed to have random initialvalues since its initialization is less critical than translation andscaling variables.
g solution, (b) bi-directional microburette, (c) holding coil, (d) magnetic stirrer, (e)e detector, S: sample.
Talanta 76 (2008) 373–381
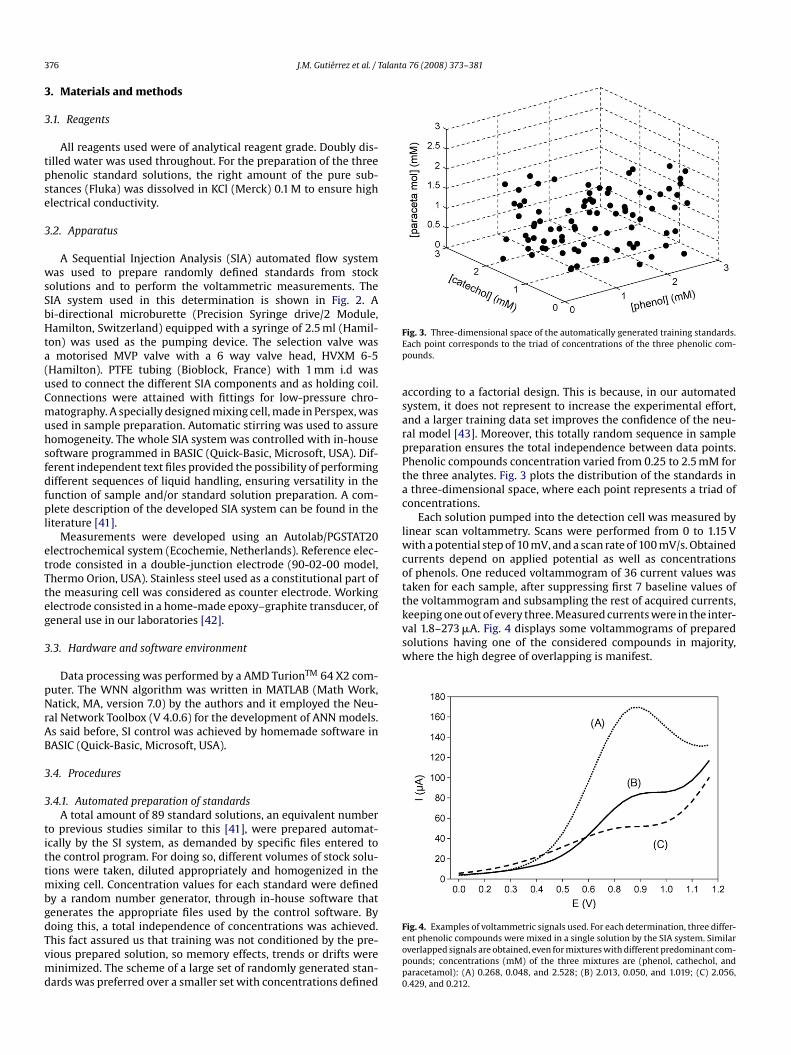
according to a factorial design. This is because, in our automatedsystem, it does not represent to increase the experimental effort,and a larger training data set improves the confidence of the neu-ral model [43]. Moreover, this totally random sequence in samplepreparation ensures the total independence between data points.Phenolic compounds concentration varied from 0.25 to 2.5 mM forthe three analytes. Fig. 3 plots the distribution of the standards ina three-dimensional space, where each point represents a triad ofconcentrations.
Each solution pumped into the detection cell was measured bylinear scan voltammetry. Scans were performed from 0 to 1.15 Vwith a potential step of 10 mV, and a scan rate of 100 mV/s. Obtainedcurrents depend on applied potential as well as concentrationsof phenols. One reduced voltammogram of 36 current values wastaken for each sample, after suppressing first 7 baseline values ofthe voltammogram and subsampling the rest of acquired currents,keeping one out of every three. Measured currents were in the inter-val 1.8–273 �A. Fig. 4 displays some voltammograms of preparedsolutions having one of the considered compounds in majority,where the high degree of overlapping is manifest.
376 J.M. Gutierrez et al. /
3. Materials and methods
3.1. Reagents
All reagents used were of analytical reagent grade. Doubly dis-tilled water was used throughout. For the preparation of the threephenolic standard solutions, the right amount of the pure sub-stances (Fluka) was dissolved in KCl (Merck) 0.1 M to ensure highelectrical conductivity.
3.2. Apparatus
A Sequential Injection Analysis (SIA) automated flow systemwas used to prepare randomly defined standards from stocksolutions and to perform the voltammetric measurements. TheSIA system used in this determination is shown in Fig. 2. Abi-directional microburette (Precision Syringe drive/2 Module,Hamilton, Switzerland) equipped with a syringe of 2.5 ml (Hamil-ton) was used as the pumping device. The selection valve wasa motorised MVP valve with a 6 way valve head, HVXM 6-5(Hamilton). PTFE tubing (Bioblock, France) with 1 mm i.d wasused to connect the different SIA components and as holding coil.Connections were attained with fittings for low-pressure chro-matography. A specially designed mixing cell, made in Perspex, wasused in sample preparation. Automatic stirring was used to assurehomogeneity. The whole SIA system was controlled with in-housesoftware programmed in BASIC (Quick-Basic, Microsoft, USA). Dif-ferent independent text files provided the possibility of performingdifferent sequences of liquid handling, ensuring versatility in thefunction of sample and/or standard solution preparation. A com-plete description of the developed SIA system can be found in theliterature [41].
Measurements were developed using an Autolab/PGSTAT20electrochemical system (Ecochemie, Netherlands). Reference elec-trode consisted in a double-junction electrode (90-02-00 model,Thermo Orion, USA). Stainless steel used as a constitutional part ofthe measuring cell was considered as counter electrode. Workingelectrode consisted in a home-made epoxy–graphite transducer, ofgeneral use in our laboratories [42].
3.3. Hardware and software environment
Data processing was performed by a AMD TurionTM 64 X2 com-puter. The WNN algorithm was written in MATLAB (Math Work,
Natick, MA, version 7.0) by the authors and it employed the Neu-ral Network Toolbox (V 4.0.6) for the development of ANN models.As said before, SI control was achieved by homemade software inBASIC (Quick-Basic, Microsoft, USA).3.4. Procedures
3.4.1. Automated preparation of standardsA total amount of 89 standard solutions, an equivalent number
to previous studies similar to this [41], were prepared automat-ically by the SI system, as demanded by specific files entered tothe control program. For doing so, different volumes of stock solu-tions were taken, diluted appropriately and homogenized in themixing cell. Concentration values for each standard were definedby a random number generator, through in-house software thatgenerates the appropriate files used by the control software. Bydoing this, a total independence of concentrations was achieved.This fact assured us that training was not conditioned by the pre-vious prepared solution, so memory effects, trends or drifts wereminimized. The scheme of a large set of randomly generated stan-dards was preferred over a smaller set with concentrations defined
Fig. 3. Three-dimensional space of the automatically generated training standards.Each point corresponds to the triad of concentrations of the three phenolic com-pounds.
Fig. 4. Examples of voltammetric signals used. For each determination, three differ-ent phenolic compounds were mixed in a single solution by the SIA system. Similaroverlapped signals are obtained, even for mixtures with different predominant com-pounds; concentrations (mM) of the three mixtures are (phenol, cathechol, andparacetamol): (A) 0.268, 0.048, and 2.528; (B) 2.013, 0.050, and 1.019; (C) 2.056,0.429, and 0.212.
alant
J.M. Gutierrez et al. / T3.4.2. ProgrammingThe information contained in the voltammetric signal is related
with the concentration of each component under study, so that, itconstitutes the input data for training and testing the WNN. On theother hand, the phenolic concentrations constitute the targets tobe modeled. The task of the WNN will be to map each voltammo-gram represented by xn to a point of the three-dimensional spaceof concentration identified by yn(r). In order to obtain this, WNNstructures with a single hidden layer having 1–3 neurons and threeoutputs were programmed and trained to obtain the concentra-tion of each compound. Other structures with more neurons in thehidden layer were not tested because the proposed architecturesallowed to obtain satisfactory results.
3.4.3. ProcessingFrom the 89 generated standard solutions, the input data is a
voltammetric matrix of dimension [36, 89], and the target is a [36,89] matrix (phenol, catechol and paracetamol concentrations). Theinput data and targets were normalized to an interval of [−1, 1] andrandomly separated in two sets; two thirds of the data were usedfor training and the remaining third for testing.
It is known that the prediction capability in a network dependson the samples chosen for the test space. To minimize this inconve-nient, the final trained model was evaluated using a cross validationmethod.
4. Results and discussion
4.1. WNN training
The expected output error was programmed to reach a value of0.025 mM, evaluated by 2/NJ(˝), where J(�) is the MSE definedin Eq. (7); we denote this error as Mean Squared Training Error.Network parameters were initialized as described previously. Thelearning rate and the maximum number of training epochs wereset to 0.005 and 10,000, respectively. In all cases, the trainingerror was reached within less iterations than the allowed maxi-mum. Larger values of the learning rate parameter were not used,because oscillations in the network output may impede conver-gence whereas smaller values may reduce speed in reaching it[23].
The selection of the number of neurons in the hidden layer wasmade according previous experience [23]; there, it was shown thatthe increase of the number of neurons in the hidden layer did notimprove performance and generalization of the WNN [23]. In thisway, only networks with three neurons or less in its hidden layerwere evaluated.
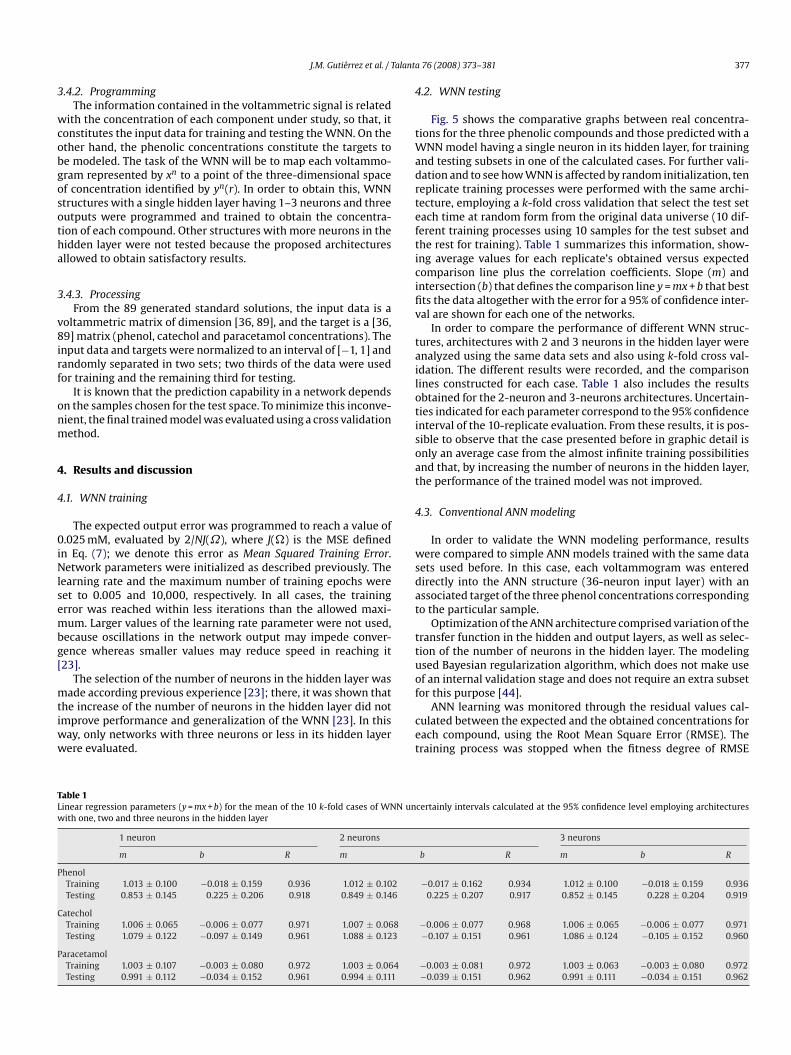
Table 1Linear regression parameters (y = mx + b) for the mean of the 10 k-fold cases of WNN unwith one, two and three neurons in the hidden layer
1 neuron 2 neurons
m b R m
PhenolTraining 1.013 ± 0.100 −0.018 ± 0.159 0.936 1.012 ± 0.102Testing 0.853 ± 0.145 0.225 ± 0.206 0.918 0.849 ± 0.146
CatecholTraining 1.006 ± 0.065 −0.006 ± 0.077 0.971 1.007 ± 0.068Testing 1.079 ± 0.122 −0.097 ± 0.149 0.961 1.088 ± 0.123
ParacetamolTraining 1.003 ± 0.107 −0.003 ± 0.080 0.972 1.003 ± 0.064Testing 0.991 ± 0.112 −0.034 ± 0.152 0.961 0.994 ± 0.111
a 76 (2008) 373–381 377
4.2. WNN testing
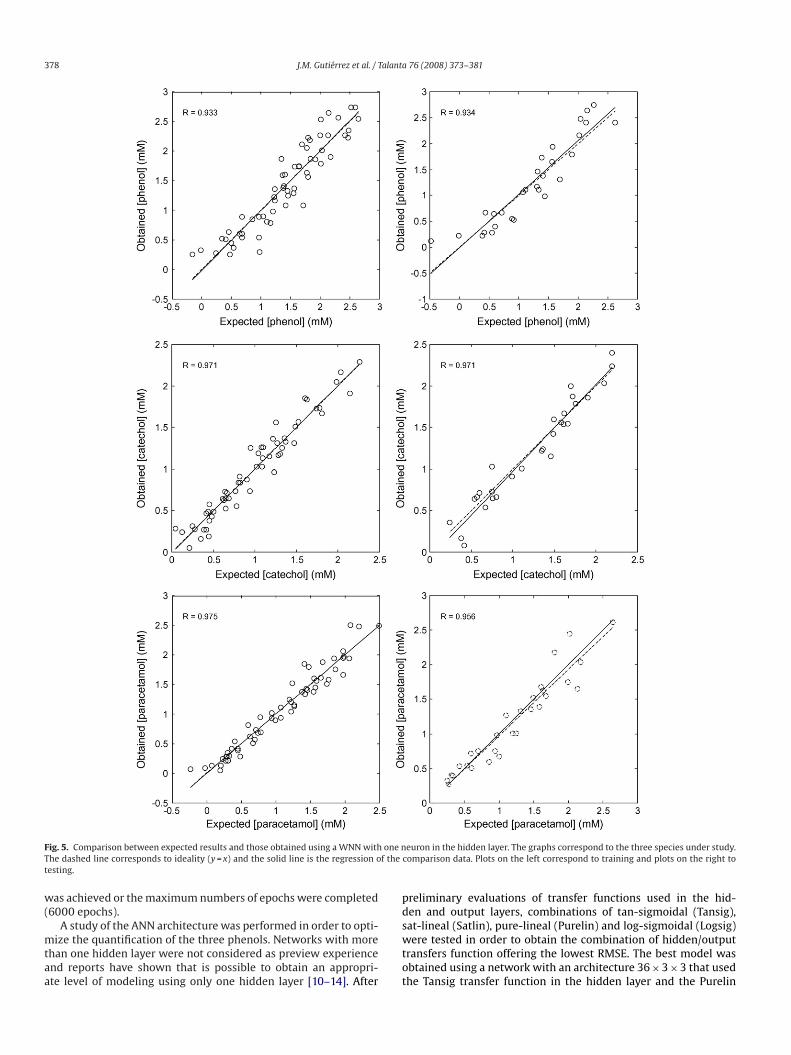
Fig. 5 shows the comparative graphs between real concentra-tions for the three phenolic compounds and those predicted with aWNN model having a single neuron in its hidden layer, for trainingand testing subsets in one of the calculated cases. For further vali-dation and to see how WNN is affected by random initialization, tenreplicate training processes were performed with the same archi-tecture, employing a k-fold cross validation that select the test seteach time at random form from the original data universe (10 dif-ferent training processes using 10 samples for the test subset andthe rest for training). Table 1 summarizes this information, show-ing average values for each replicate’s obtained versus expectedcomparison line plus the correlation coefficients. Slope (m) andintersection (b) that defines the comparison line y = mx + b that bestfits the data altogether with the error for a 95% of confidence inter-val are shown for each one of the networks.
In order to compare the performance of different WNN struc-tures, architectures with 2 and 3 neurons in the hidden layer wereanalyzed using the same data sets and also using k-fold cross val-idation. The different results were recorded, and the comparisonlines constructed for each case. Table 1 also includes the resultsobtained for the 2-neuron and 3-neurons architectures. Uncertain-ties indicated for each parameter correspond to the 95% confidenceinterval of the 10-replicate evaluation. From these results, it is pos-sible to observe that the case presented before in graphic detail isonly an average case from the almost infinite training possibilities
and that, by increasing the number of neurons in the hidden layer,the performance of the trained model was not improved.4.3. Conventional ANN modeling
In order to validate the WNN modeling performance, resultswere compared to simple ANN models trained with the same datasets used before. In this case, each voltammogram was entereddirectly into the ANN structure (36-neuron input layer) with anassociated target of the three phenol concentrations correspondingto the particular sample.
Optimization of the ANN architecture comprised variation of thetransfer function in the hidden and output layers, as well as selec-tion of the number of neurons in the hidden layer. The modelingused Bayesian regularization algorithm, which does not make useof an internal validation stage and does not require an extra subsetfor this purpose [44].
ANN learning was monitored through the residual values cal-culated between the expected and the obtained concentrations foreach compound, using the Root Mean Square Error (RMSE). Thetraining process was stopped when the fitness degree of RMSE
certainly intervals calculated at the 95% confidence level employing architectures
3 neurons
b R m b R
−0.017 ± 0.162 0.934 1.012 ± 0.100 −0.018 ± 0.159 0.9360.225 ± 0.207 0.917 0.852 ± 0.145 0.228 ± 0.204 0.919
−0.006 ± 0.077 0.968 1.006 ± 0.065 −0.006 ± 0.077 0.971−0.107 ± 0.151 0.961 1.086 ± 0.124 −0.105 ± 0.152 0.960
−0.003 ± 0.081 0.972 1.003 ± 0.063 −0.003 ± 0.080 0.972−0.039 ± 0.151 0.962 0.991 ± 0.111 −0.034 ± 0.151 0.962
378 J.M. Gutierrez et al. / Talanta 76 (2008) 373–381
Fig. 5. Comparison between expected results and those obtained using a WNN with one nThe dashed line corresponds to ideality (y = x) and the solid line is the regression of thetesting.
was achieved or the maximum numbers of epochs were completed(6000 epochs).
A study of the ANN architecture was performed in order to opti-mize the quantification of the three phenols. Networks with morethan one hidden layer were not considered as preview experienceand reports have shown that is possible to obtain an appropri-ate level of modeling using only one hidden layer [10–14]. After
euron in the hidden layer. The graphs correspond to the three species under study.comparison data. Plots on the left correspond to training and plots on the right to
preliminary evaluations of transfer functions used in the hid-den and output layers, combinations of tan-sigmoidal (Tansig),sat-lineal (Satlin), pure-lineal (Purelin) and log-sigmoidal (Logsig)were tested in order to obtain the combination of hidden/outputtransfers function offering the lowest RMSE. The best model wasobtained using a network with an architecture 36 × 3 × 3 that usedthe Tansig transfer function in the hidden layer and the Purelin
J.M. Gutierrez et al. / Talanta 76 (2008) 373–381 379
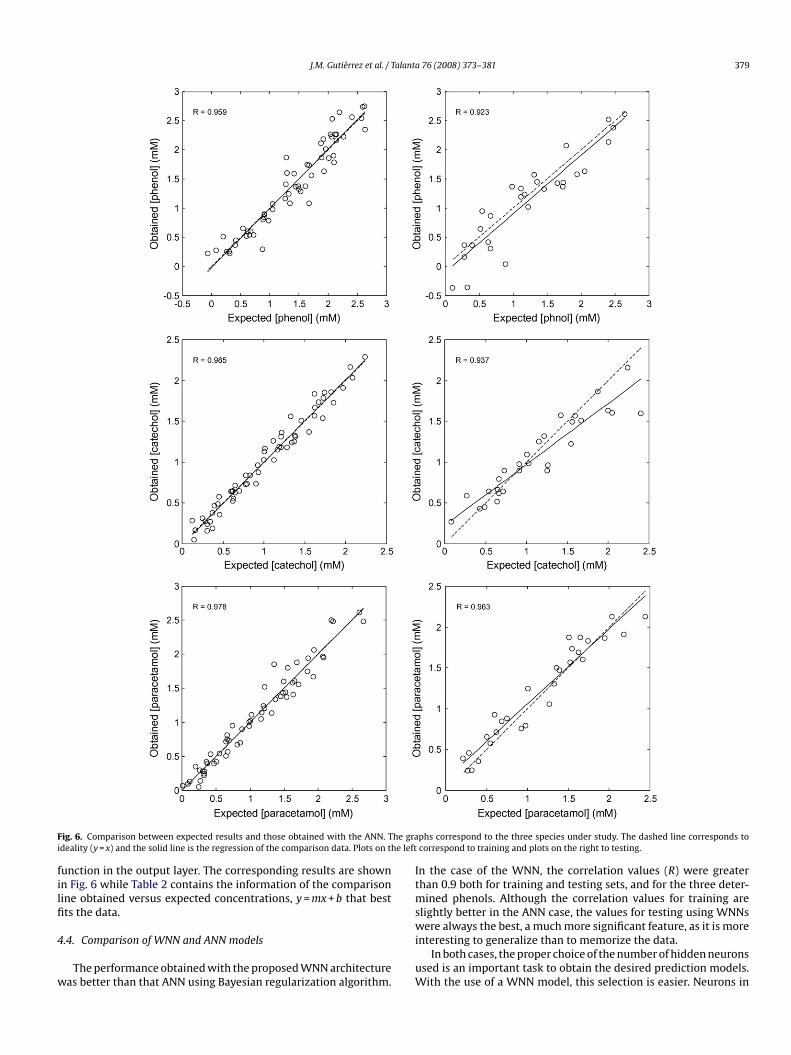
Fig. 6. Comparison between expected results and those obtained with the ANN. The graideality (y = x) and the solid line is the regression of the comparison data. Plots on the left
function in the output layer. The corresponding results are shownin Fig. 6 while Table 2 contains the information of the comparisonline obtained versus expected concentrations, y = mx + b that bestfits the data.
4.4. Comparison of WNN and ANN models
The performance obtained with the proposed WNN architecturewas better than that ANN using Bayesian regularization algorithm.
phs correspond to the three species under study. The dashed line corresponds tocorrespond to training and plots on the right to testing.
In the case of the WNN, the correlation values (R) were greaterthan 0.9 both for training and testing sets, and for the three deter-mined phenols. Although the correlation values for training areslightly better in the ANN case, the values for testing using WNNswere always the best, a much more significant feature, as it is moreinteresting to generalize than to memorize the data.
In both cases, the proper choice of the number of hidden neuronsused is an important task to obtain the desired prediction models.With the use of a WNN model, this selection is easier. Neurons in
380 J.M. Gutierrez et al. / Talant
Table 2Linear regression parameters (y = mx + b) obtained with training and testing data sets usin
Compound Training
m b R
Phenol 1.017 ± 0.079 −0.025 ± 0.125 0.95Catechol 1.011 ± 0.046 −0.012 ± 0.054 0.98Paracetamol 1.004 ± 0.056 −0.004 ± 0.072 0.97
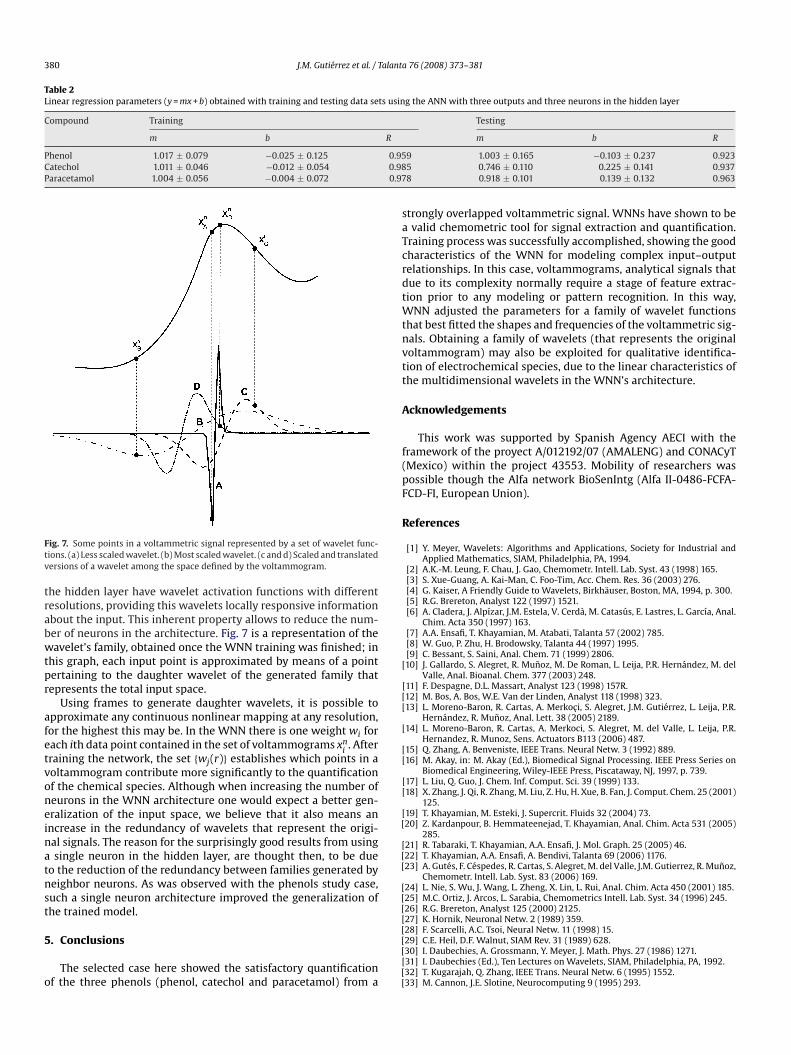
Fig. 7. Some points in a voltammetric signal represented by a set of wavelet func-tions. (a) Less scaled wavelet. (b) Most scaled wavelet. (c and d) Scaled and translatedversions of a wavelet among the space defined by the voltammogram.
the hidden layer have wavelet activation functions with differentresolutions, providing this wavelets locally responsive informationabout the input. This inherent property allows to reduce the num-ber of neurons in the architecture. Fig. 7 is a representation of thewavelet’s family, obtained once the WNN training was finished; inthis graph, each input point is approximated by means of a pointpertaining to the daughter wavelet of the generated family thatrepresents the total input space.
Using frames to generate daughter wavelets, it is possible toapproximate any continuous nonlinear mapping at any resolution,for the highest this may be. In the WNN there is one weight wi foreach ith data point contained in the set of voltammograms xn
i. After
training the network, the set {wj(r)} establishes which points in avoltammogram contribute more significantly to the quantificationof the chemical species. Although when increasing the number ofneurons in the WNN architecture one would expect a better gen-eralization of the input space, we believe that it also means anincrease in the redundancy of wavelets that represent the origi-nal signals. The reason for the surprisingly good results from usinga single neuron in the hidden layer, are thought then, to be dueto the reduction of the redundancy between families generated byneighbor neurons. As was observed with the phenols study case,such a single neuron architecture improved the generalization ofthe trained model.
5. Conclusions
The selected case here showed the satisfactory quantificationof the three phenols (phenol, catechol and paracetamol) from a
[
[[
[[[
[[[
[[
a 76 (2008) 373–381
g the ANN with three outputs and three neurons in the hidden layer
Testing
m b R
9 1.003 ± 0.165 −0.103 ± 0.237 0.9235 0.746 ± 0.110 0.225 ± 0.141 0.9378 0.918 ± 0.101 0.139 ± 0.132 0.963
strongly overlapped voltammetric signal. WNNs have shown to bea valid chemometric tool for signal extraction and quantification.Training process was successfully accomplished, showing the goodcharacteristics of the WNN for modeling complex input–outputrelationships. In this case, voltammograms, analytical signals thatdue to its complexity normally require a stage of feature extrac-tion prior to any modeling or pattern recognition. In this way,WNN adjusted the parameters for a family of wavelet functionsthat best fitted the shapes and frequencies of the voltammetric sig-nals. Obtaining a family of wavelets (that represents the originalvoltammogram) may also be exploited for qualitative identifica-tion of electrochemical species, due to the linear characteristics ofthe multidimensional wavelets in the WNN’s architecture.
Acknowledgements
This work was supported by Spanish Agency AECI with theframework of the proyect A/012192/07 (AMALENG) and CONACyT(Mexico) within the project 43553. Mobility of researchers waspossible though the Alfa network BioSenIntg (Alfa II-0486-FCFA-FCD-FI, European Union).
References
[1] Y. Meyer, Wavelets: Algorithms and Applications, Society for Industrial andApplied Mathematics, SIAM, Philadelphia, PA, 1994.
[2] A.K.-M. Leung, F. Chau, J. Gao, Chemometr. Intell. Lab. Syst. 43 (1998) 165.[3] S. Xue-Guang, A. Kai-Man, C. Foo-Tim, Acc. Chem. Res. 36 (2003) 276.[4] G. Kaiser, A Friendly Guide to Wavelets, Birkhauser, Boston, MA, 1994, p. 300.[5] R.G. Brereton, Analyst 122 (1997) 1521.[6] A. Cladera, J. Alpızar, J.M. Estela, V. Cerda, M. Catasus, E. Lastres, L. Garcıa, Anal.
Chim. Acta 350 (1997) 163.[7] A.A. Ensafi, T. Khayamian, M. Atabati, Talanta 57 (2002) 785.[8] W. Guo, P. Zhu, H. Brodowsky, Talanta 44 (1997) 1995.[9] C. Bessant, S. Saini, Anal. Chem. 71 (1999) 2806.
[10] J. Gallardo, S. Alegret, R. Munoz, M. De Roman, L. Leija, P.R. Hernandez, M. delValle, Anal. Bioanal. Chem. 377 (2003) 248.
[11] F. Despagne, D.L. Massart, Analyst 123 (1998) 157R.
[12] M. Bos, A. Bos, W.E. Van der Linden, Analyst 118 (1998) 323.[13] L. Moreno-Baron, R. Cartas, A. Merkoci, S. Alegret, J.M. Gutierrez, L. Leija, P.R.Hernandez, R. Munoz, Anal. Lett. 38 (2005) 2189.[14] L. Moreno-Baron, R. Cartas, A. Merkoci, S. Alegret, M. del Valle, L. Leija, P.R.
Hernandez, R. Munoz, Sens. Actuators B113 (2006) 487.[15] Q. Zhang, A. Benveniste, IEEE Trans. Neural Netw. 3 (1992) 889.[16] M. Akay, in: M. Akay (Ed.), Biomedical Signal Processing. IEEE Press Series on
Biomedical Engineering, Wiley-IEEE Press, Piscataway, NJ, 1997, p. 739.[17] L. Liu, Q. Guo, J. Chem. Inf. Comput. Sci. 39 (1999) 133.[18] X. Zhang, J. Qi, R. Zhang, M. Liu, Z. Hu, H. Xue, B. Fan, J. Comput. Chem. 25 (2001)
125.[19] T. Khayamian, M. Esteki, J. Supercrit. Fluids 32 (2004) 73.20] Z. Kardanpour, B. Hemmateenejad, T. Khayamian, Anal. Chim. Acta 531 (2005)
285.[21] R. Tabaraki, T. Khayamian, A.A. Ensafi, J. Mol. Graph. 25 (2005) 46.22] T. Khayamian, A.A. Ensafi, A. Bendivi, Talanta 69 (2006) 1176.23] A. Gutes, F. Cespedes, R. Cartas, S. Alegret, M. del Valle, J.M. Gutierrez, R. Munoz,
Chemometr. Intell. Lab. Syst. 83 (2006) 169.24] L. Nie, S. Wu, J. Wang, L. Zheng, X. Lin, L. Rui, Anal. Chim. Acta 450 (2001) 185.25] M.C. Ortiz, J. Arcos, L. Sarabia, Chemometrics Intell. Lab. Syst. 34 (1996) 245.26] R.G. Brereton, Analyst 125 (2000) 2125.
[27] K. Hornik, Neuronal Netw. 2 (1989) 359.28] F. Scarcelli, A.C. Tsoi, Neural Netw. 11 (1998) 15.29] C.E. Heil, D.F. Walnut, SIAM Rev. 31 (1989) 628.30] I. Daubechies, A. Grossmann, Y. Meyer, J. Math. Phys. 27 (1986) 1271.
[31] I. Daubechies (Ed.), Ten Lectures on Wavelets, SIAM, Philadelphia, PA, 1992.32] T. Kugarajah, Q. Zhang, IEEE Trans. Neural Netw. 6 (1995) 1552.33] M. Cannon, J.E. Slotine, Neurocomputing 9 (1995) 293.

[[
[
[
[
J.M. Gutierrez et al. / Talant
34] S.G. Mallat, IEEE Trans. Pattern Anal. Mach. Intell. 11 (1989) 674.35] J. Zhang, G.G. Walter, Y. Miao, W.N.W. Lee, IEEE Trans. Signal. Process. 43 (1995)
1485.36] Q.X. Guo, L. Liu, W.S. Cai, Y. Jiang, Y.C. Liu, Chem. Phys. Lett. 290 (1998)
514.37] X. Zhang, J. Qi, R. Zhang, M. Liu, Z. Hu, H. Xue, B. Fan, Comput. Chem. 25 (2001)
125.38] H. Zhong, J. Zhang, M. Gao, J. Zheng, G. Li, L. Chen, Chemometr. Intell. Lab. Syst.
59 (2001) 67.
[
[
[[[
a 76 (2008) 373–381 381
39] D.E. Rumelhart, G.E. Hilton, R.J. Williams, in: D.R. Rumelhart, J.L. McClelland(Eds.), Parallel Distributed Processing: Explorations in the Microstructures ofCognition, vol. 1, Foundations, MIT, Cambridge MA, 1986 (Chapter 8).
40] Y. Oussar, I. Rivals, L. Personnaz, G. Dreyfus, Neurocomputing 20 (1998) 173.[41] A. Gutes, F. Cespedes, S. Alegret, M. del Valle, Talanta 66 (2005) 1187.42] F. Cespedes, S. Alegret, Trends Anal. Chem. 19 (2000) 276.43] V. Pravdova, M. Pravda, G. G: Guilbault, Anal. Lett. 35 (2002) 2389.44] H. Demuth, M. Beale, Neural Network Toolbox, User’s guide. Version 4, The
Mathworks Inc., Natick, MA, 2005.