Embed Size (px)
Citation preview

Wavelet Synopses with Wavelet Synopses with Error GuaranteesError Guarantees
Minos GarofalakisMinos GarofalakisIntel Research BerkeleyIntel Research Berkeley
[email protected]@intel.com
http://www2.berkeley.intel-research.net/~minos/http://www2.berkeley.intel-research.net/~minos/
Joint work with Phil Gibbons [ACM SIGMOD’02, ACM TODS’04] and Amit Kumar [ACM PODS’04, ACM TODS’05]
OutlineOutline
• Preliminaries & Motivation– Approximate query processing
– Haar wavelet decomposition, conventional wavelet synopses
– The problem
• A First solution: Probabilistic Wavelet Synopses– The general approach: Randomized Selection and Rounding
– Optimization Algorithms for Tuning our Synopses
• More Direct Approach: Effective Deterministic Solution
• Extensions to Multi-dimensional Haar Wavelets
• Experimental Study– Results with synthetic & real-life data sets
• Conclusions
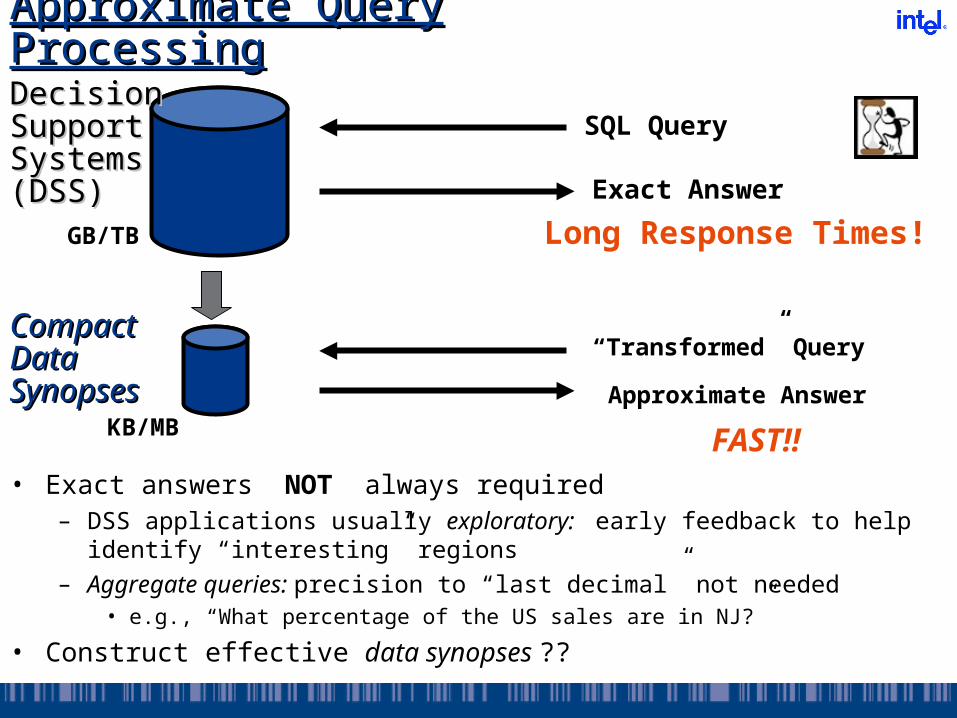
Approximate Query ProcessingApproximate Query Processing
• Exact answers NOT always required– DSS applications usually exploratory: early feedback to help identify
“interesting” regions– Aggregate queries: precision to “last decimal” not needed
• e.g., “What percentage of the US sales are in NJ?”
• Construct effective data synopses ??
SQL Query
Exact Answer
DecisionDecisionSupport Support SystemsSystems(DSS) (DSS)
Long Response Times!
GB/TB
Compact Compact Data Data SynopsesSynopses
“Transformed” Query
KB/MBApproximate Answer
FAST!!
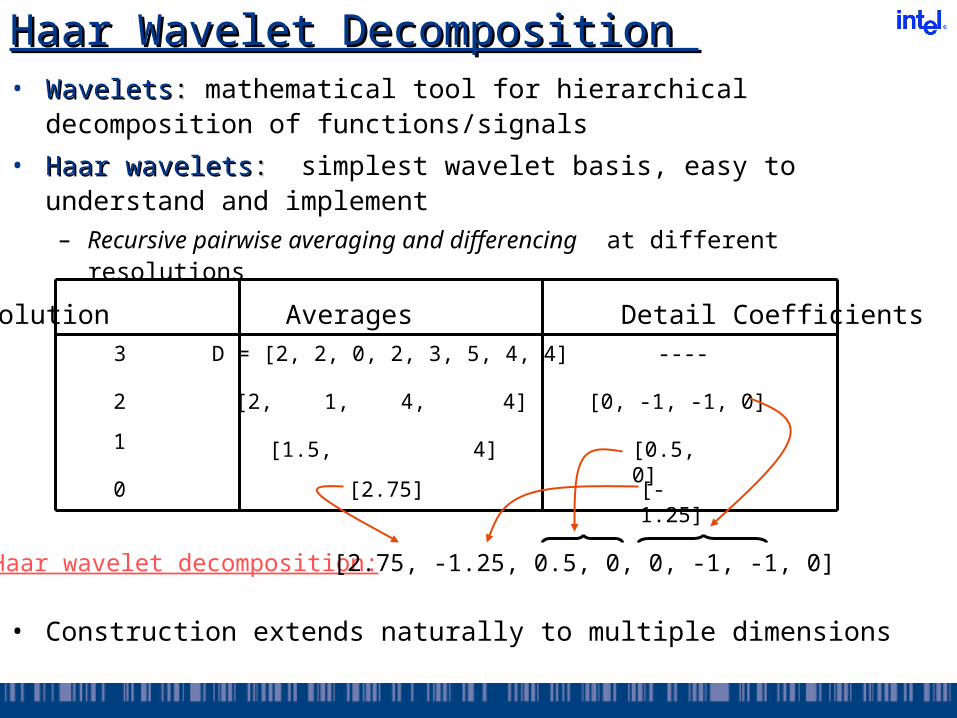
Haar Wavelet Decomposition Haar Wavelet Decomposition • WaveletsWavelets:: mathematical tool for hierarchical decomposition of
functions/signals
• Haar waveletsHaar wavelets:: simplest wavelet basis, easy to understand and implement – Recursive pairwise averaging and differencing at different resolutions
Resolution Averages Detail CoefficientsD = [2, 2, 0, 2, 3, 5, 4, 4]
[2, 1, 4, 4] [0, -1, -1, 0]
[1.5, 4] [0.5, 0]
[2.75] [-1.25]
----3
2
1
0
Haar wavelet decomposition: [2.75, -1.25, 0.5, 0, 0, -1, -1, 0]
• Construction extends naturally to multiple dimensions

Haar Wavelet Coefficients Haar Wavelet Coefficients • Hierarchical decomposition structure ( a.k.a. Error Tree )
– Conceptual tool to “visualize” coefficient supports & data reconstruction
• Reconstruct data values d(i)– d(i) = (+/-1) * (coefficient on path)
• Range sum calculation d(l:h) – d(l:h) = simple linear combination of
coefficients on paths to l, h
• Only O(logN) terms
2 2 0 2 3 5 4 4
-1.25
2.75
0.5 0
0 -1 0 -1
+
-+
+
+ + +
+
+
- -
- - - -
Original data
3 = 2.75 - (-1.25) + 0 + (-1)
6 = 4*2.75 + 4*(-1.25)
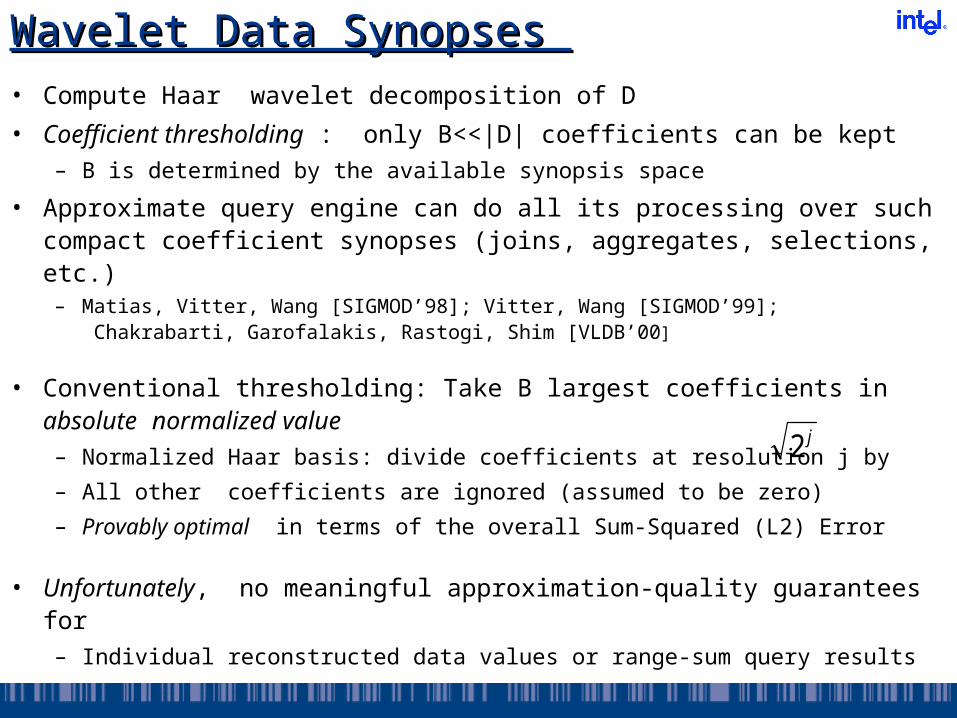
Wavelet Data Synopses Wavelet Data Synopses • Compute Haar wavelet decomposition of D
• Coefficient thresholding : only B<<|D| coefficients can be kept– B is determined by the available synopsis space
• Approximate query engine can do all its processing over such compact coefficient synopses (joins, aggregates, selections, etc.)– Matias, Vitter, Wang [SIGMOD’98]; Vitter, Wang [SIGMOD’99];
Chakrabarti, Garofalakis, Rastogi, Shim [VLDB’00]
• Conventional thresholding: Take B largest coefficients in absolute normalized value – Normalized Haar basis: divide coefficients at resolution j by
– All other coefficients are ignored (assumed to be zero)
– Provably optimal in terms of the overall Sum-Squared (L2) Error
• Unfortunately, no meaningful approximation-quality guarantees for– Individual reconstructed data values or range-sum query results
j2
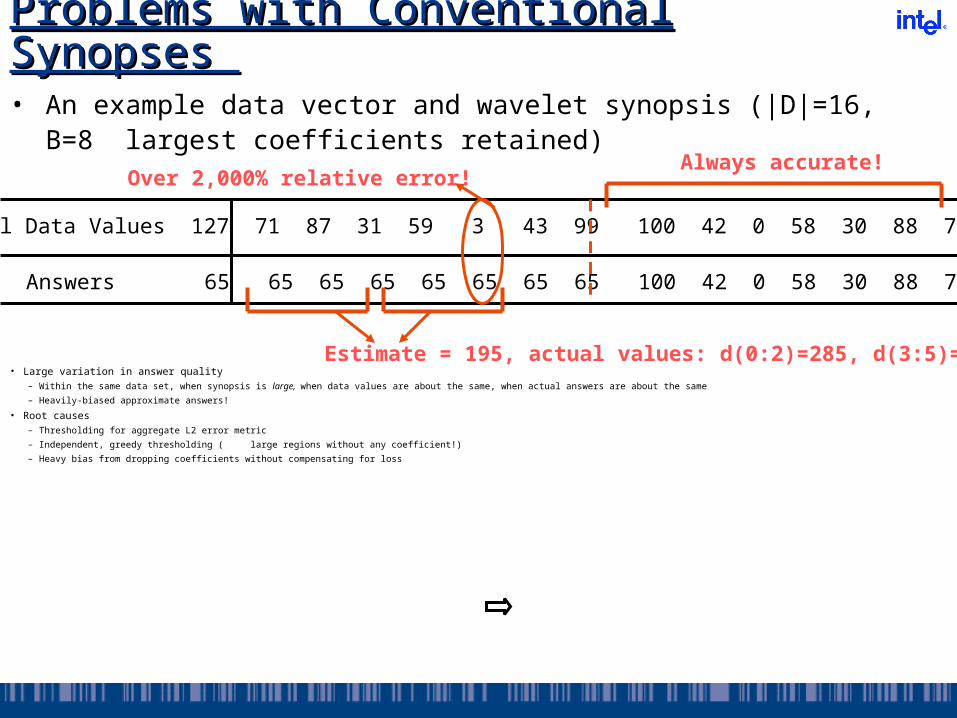
Problems with Conventional Problems with Conventional Synopses Synopses • An example data vector and wavelet synopsis (|D|=16, B=8
largest coefficients retained)
Original Data Values 127 71 87 31 59 3 43 99 100 42 0 58 30 88 72 130
Wavelet Answers 65 65 65 65 65 65 65 65 100 42 0 58 30 88 72 130
• Large variation in answer quality– Within the same data set, when synopsis is large, when data values are about the same, when actual answers are about the same
– Heavily-biased approximate answers!
• Root causes– Thresholding for aggregate L2 error metric
– Independent, greedy thresholding ( large regions without any coefficient!)
– Heavy bias from dropping coefficients without compensating for loss
Always accurate!Over 2,000% relative error!
Estimate = 195, actual values: d(0:2)=285, d(3:5)=93!

Approach: Optimize for Maximum-Error Approach: Optimize for Maximum-Error Metrics Metrics • Key metric for effective approximate answers: Relative error with
sanity bound
– Sanity bound “s” to avoid domination by small data values
• To provide tight error guarantees for all reconstructed data values
– Minimize maximum relative error in the data reconstruction
• Another option: Minimize maximum absolute error
• Algorithms can be extended to general “distributive” metrics (e.g., average relative error)
}|,max{|
|ˆ|
sd
dd
i
ii
Minimize }}|,max{|
|ˆ|{max
sd
dd
i
iii
|}ˆ{|max iii dd
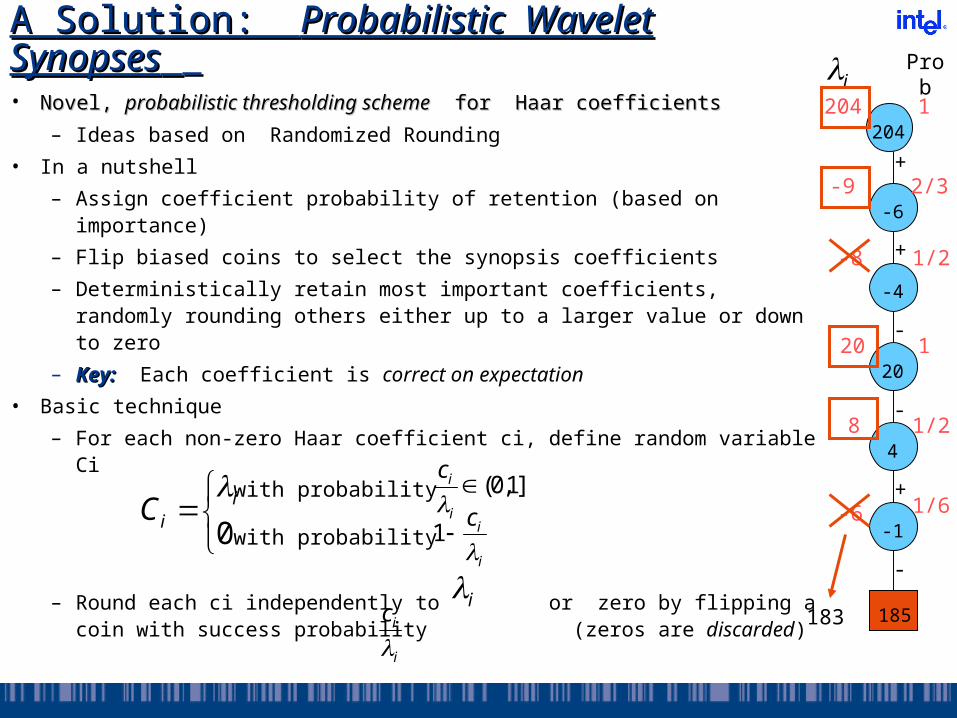
A Solution: A Solution: Probabilistic Wavelet Probabilistic Wavelet SynopsesSynopses • Novel, Novel, probabilistic thresholding schemeprobabilistic thresholding scheme for Haar coefficients for Haar coefficients
– Ideas based on Randomized Rounding
• In a nutshell
– Assign coefficient probability of retention (based on importance)
– Flip biased coins to select the synopsis coefficients
– Deterministically retain most important coefficients, randomly rounding others either up to a larger value or down to zero
– Key:Key: Each coefficient is correct on expectation
• Basic technique
– For each non-zero Haar coefficient ci, define random variable Ci
– Round each ci independently to or zero by flipping a coin with success probability (zeros are discarded)
0i
iC with probability ]1,0(
i
ic
with probability
i
ic
1
i
ic
i
204
-9
-8
20
8
-6
i
204
-6
20
-4
4
-1
185
-
+
-
-
+
+
1
2/3
1/2
1
1/2
1/6
Prob
183
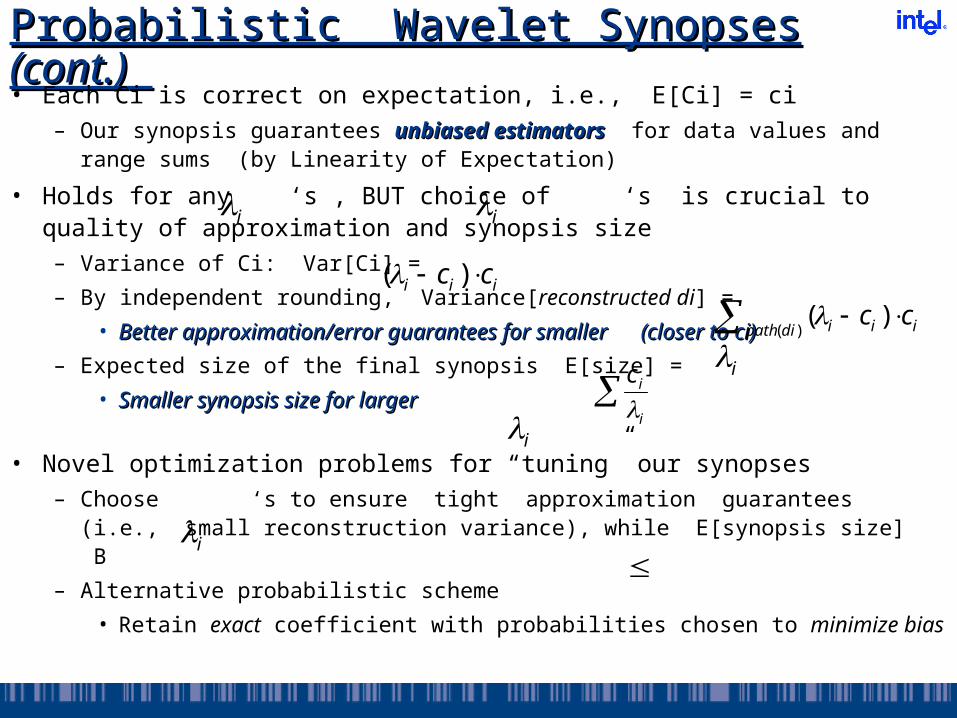
Probabilistic Wavelet Synopses Probabilistic Wavelet Synopses (cont.)(cont.) • Each Ci is correct on expectation, i.e., E[Ci] = ci
– Our synopsis guarantees unbiased estimatorsunbiased estimators for data values and range sums (by Linearity of Expectation)
• Holds for any ‘s , BUT choice of ‘s is crucial to quality of approximation and synopsis size– Variance of Ci: Var[Ci] =
– By independent rounding, Variance[reconstructed di] =
• Better approximation/error guarantees for smaller (closer to ci)Better approximation/error guarantees for smaller (closer to ci)
– Expected size of the final synopsis E[size] =
• Smaller synopsis size for larger Smaller synopsis size for larger
• Novel optimization problems for “tuning” our synopses– Choose ‘s to ensure tight approximation guarantees (i.e., small
reconstruction variance), while E[synopsis size] B
– Alternative probabilistic scheme
• Retain exact coefficient with probabilities chosen to minimize bias
i i
iii cc )(
)(
)(dipath iii cc
i
i
ic
i
i
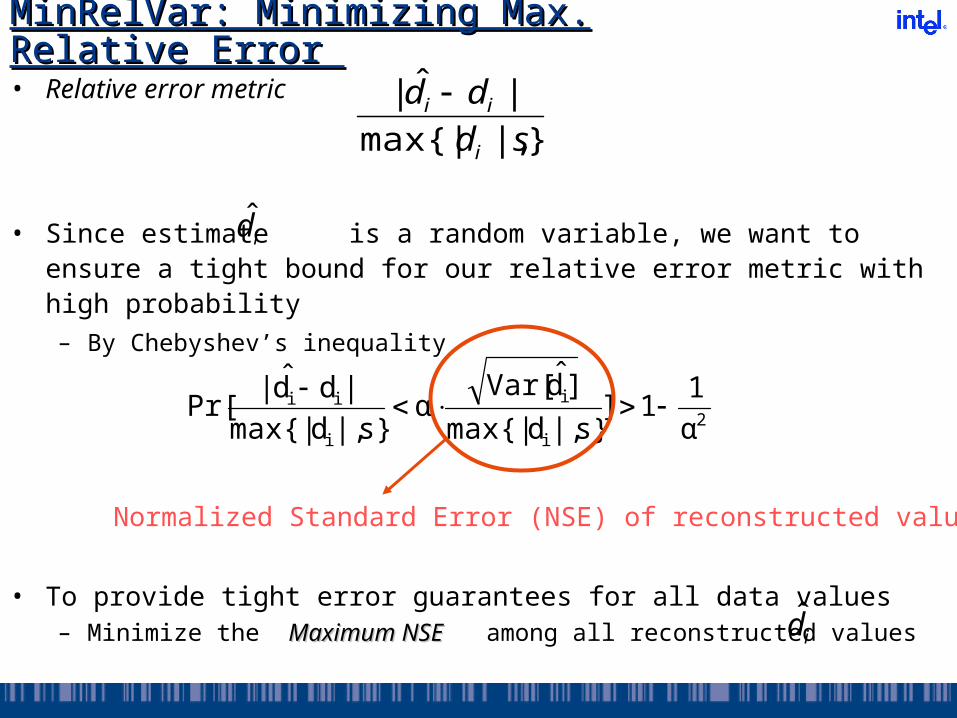
MinRelVar: Minimizing Max. Relative MinRelVar: Minimizing Max. Relative Error Error • Relative error metric
• Since estimate is a random variable, we want to ensure a tight bound for our relative error metric with high probability– By Chebyshev’s inequality
}|,max{|
|ˆ|
sd
dd
i
ii
2i
i
i
ii
α1
1]s}|,dmax{|
]dVar[α
s}|,dmax{||dd|
Pr[ ˆˆ
id̂
• To provide tight error guarantees for all data values– Minimize the Maximum NSEMaximum NSE among all reconstructed values id̂
Normalized Standard Error (NSE) of reconstructed value
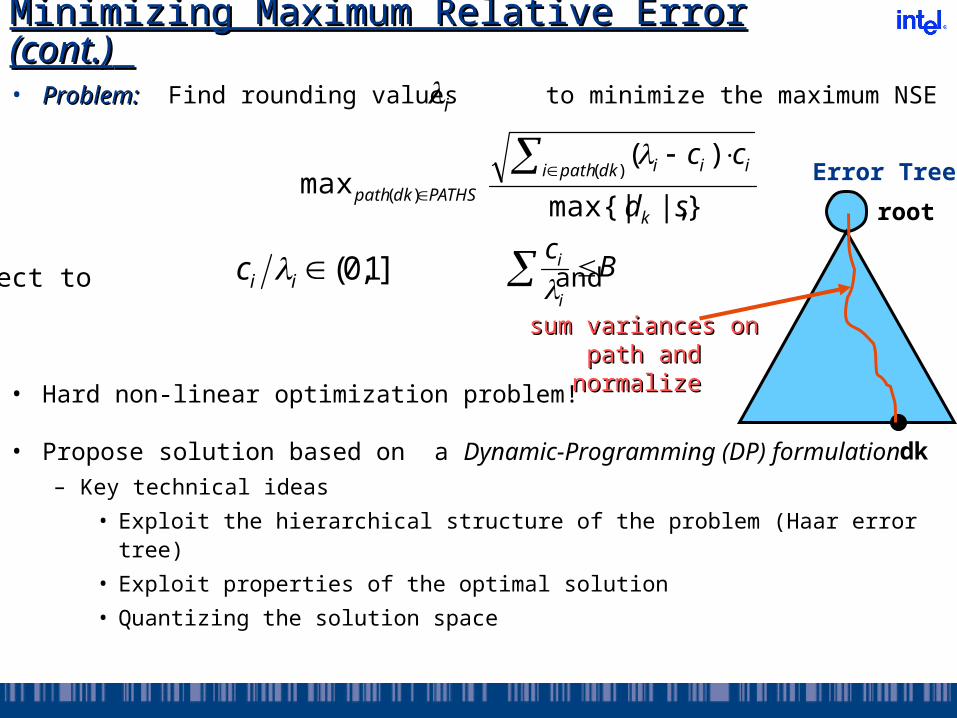
• Problem:Problem: Find rounding values to minimize the maximum NSE
• Hard non-linear optimization problem!
• Propose solution based on a Dynamic-Programming (DP) formulation– Key technical ideas
• Exploit the hierarchical structure of the problem (Haar error tree)
• Exploit properties of the optimal solution
• Quantizing the solution space
Minimizing Maximum Relative Error Minimizing Maximum Relative Error (cont.)(cont.)
}|,max{|
)(max
)(
)( sd
cc
k
dkpathi iii
PATHSdkpath
subject to and]1,0(iic Bc
i
i
i
Error Tree
dk
root
sum variances on sum variances on path and normalize path and normalize
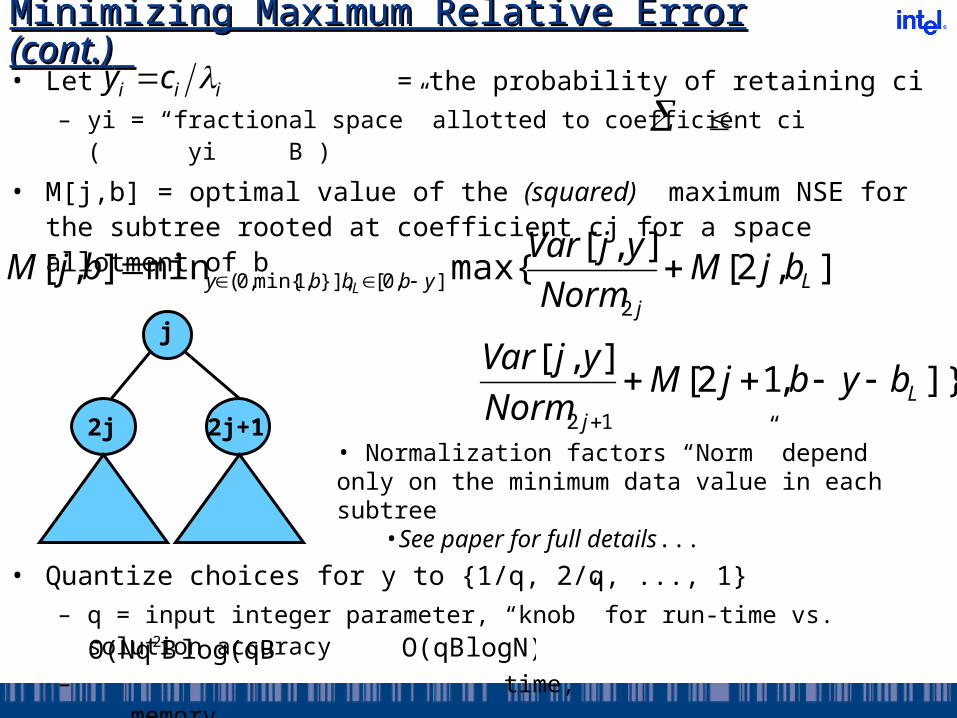
• Let = the probability of retaining ci– yi = “fractional space” allotted to coefficient ci ( yi B )
• M[j,b] = optimal value of the (squared) maximum NSE for the subtree rooted at coefficient cj for a space allotment of b
Minimizing Maximum Relative Error Minimizing Maximum Relative Error (cont.)(cont.)
iii cy
j
2j 2j+1
],,2[],[
max{min],[2
],0[}],,1min{,0( Lj
ybbby bjMNorm
yjVarbjM
L
]},12[],[
12L
j
bybjMNorm
yjVar
• Normalization factors “Norm” depend only on the minimum data value in each subtree
•See paper for full details...
• Quantize choices for y to {1/q, 2/q, ..., 1}– q = input integer parameter, “knob” for run-time vs. solution
accuracy
– time, memorylog(qB)) BO(Nq2 logN) O(qB
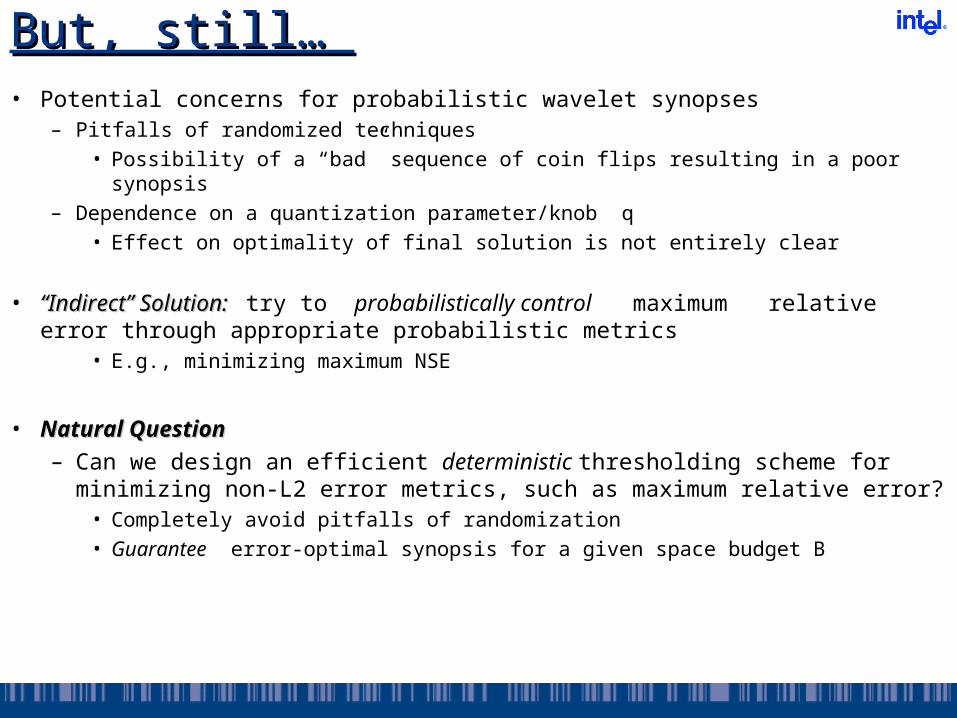
But, still… But, still… • Potential concerns for probabilistic wavelet synopses
– Pitfalls of randomized techniques• Possibility of a “bad” sequence of coin flips resulting in a poor synopsis
– Dependence on a quantization parameter/knob q • Effect on optimality of final solution is not entirely clear
• ““Indirect” Solution:Indirect” Solution: try to probabilistically control maximum relative error through appropriate probabilistic metrics
• E.g., minimizing maximum NSE
• Natural QuestionNatural Question– Can we design an efficient deterministic thresholding scheme for
minimizing non-L2 error metrics, such as maximum relative error?• Completely avoid pitfalls of randomization• Guarantee error-optimal synopsis for a given space budget B
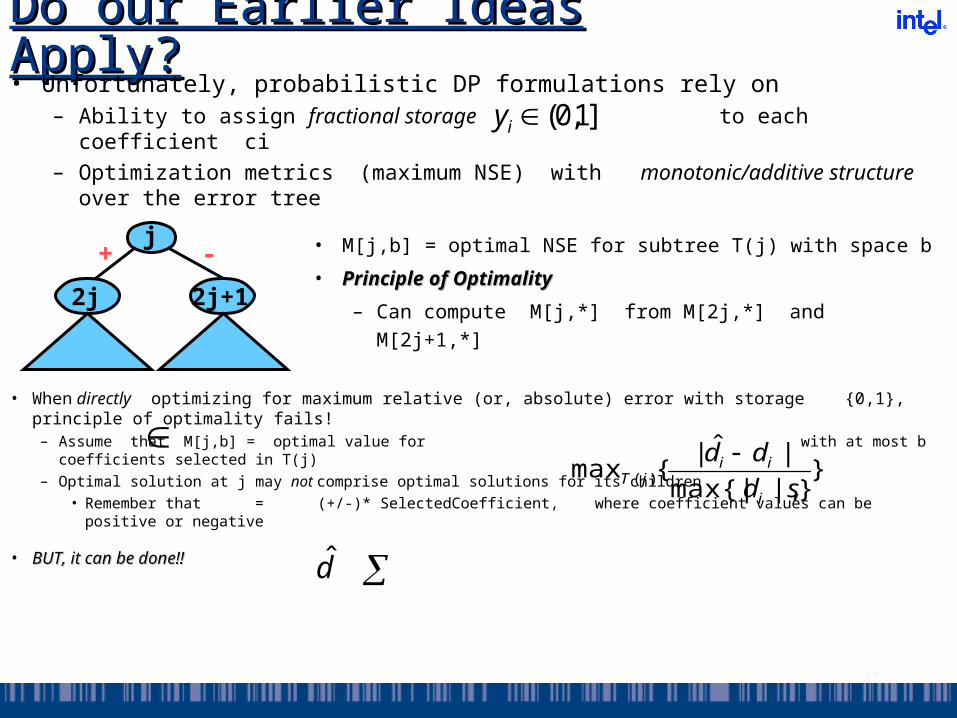
Do our Earlier Ideas Apply?Do our Earlier Ideas Apply?• Unfortunately, probabilistic DP formulations rely on
– Ability to assign fractional storage to each coefficient ci– Optimization metrics (maximum NSE) with monotonic/additive
structure over the error tree
]1,0(iy
• M[j,b] = optimal NSE for subtree T(j) with space b
• Principle of OptimalityPrinciple of Optimality
– Can compute M[j,*] from M[2j,*] and M[2j+1,*]
• When directly optimizing for maximum relative (or, absolute) error with storage {0,1}, principle of optimality fails!– Assume that M[j,b] = optimal value for with at most b coefficients selected in T(j)– Optimal solution at j may not comprise optimal solutions for its children
• Remember that = (+/-)* SelectedCoefficient, where coefficient values can be positive or negative
• BUT, it can be done!!BUT, it can be done!!
}}|,max{|
|ˆ|{max )( sd
dd
i
iijT
j
2j 2j+1
+ -
d̂
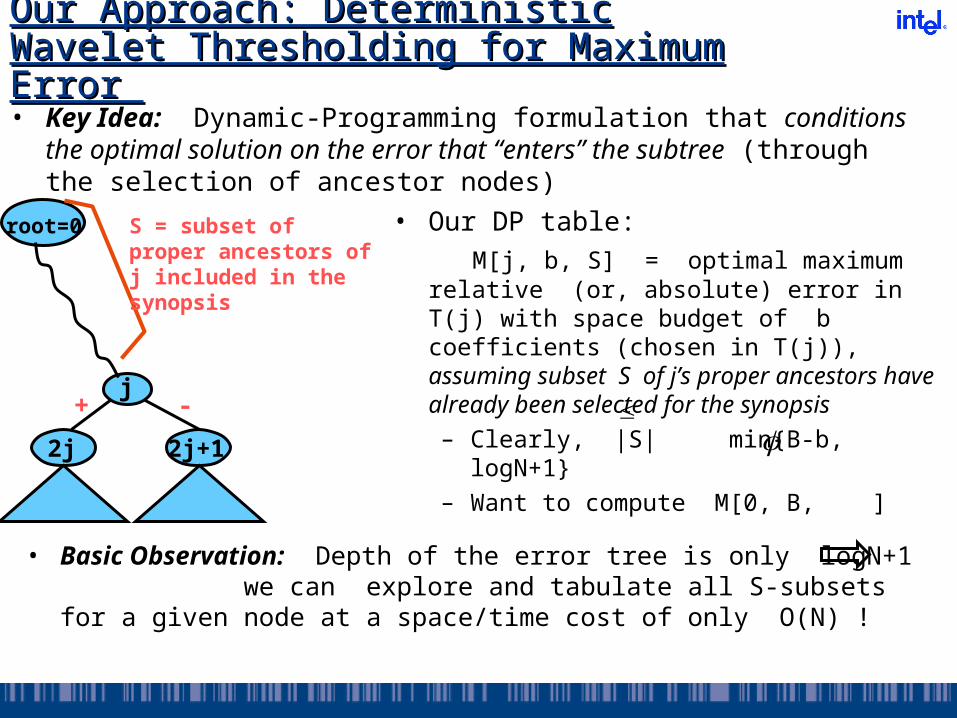
Our Approach: Deterministic Wavelet Our Approach: Deterministic Wavelet Thresholding for Maximum Error Thresholding for Maximum Error • Key Idea: Dynamic-Programming formulation that conditions
the optimal solution on the error that “enters” the subtree (through the selection of ancestor nodes)
j
2j 2j+1
+ -
root=0 S = subset of proper ancestors of j included in the synopsis
• Our DP table: M[j, b, S] = optimal maximum relative
(or, absolute) error in T(j) with space budget of b coefficients (chosen in T(j)), assuming subset S of j’s proper ancestors have already been selected for the synopsis – Clearly, |S| min{B-b, logN+1}– Want to compute M[0, B, ]
• Basic Observation: Depth of the error tree is only logN+1 we can explore and tabulate all S-subsets for a given node at a space/time cost of only O(N) !
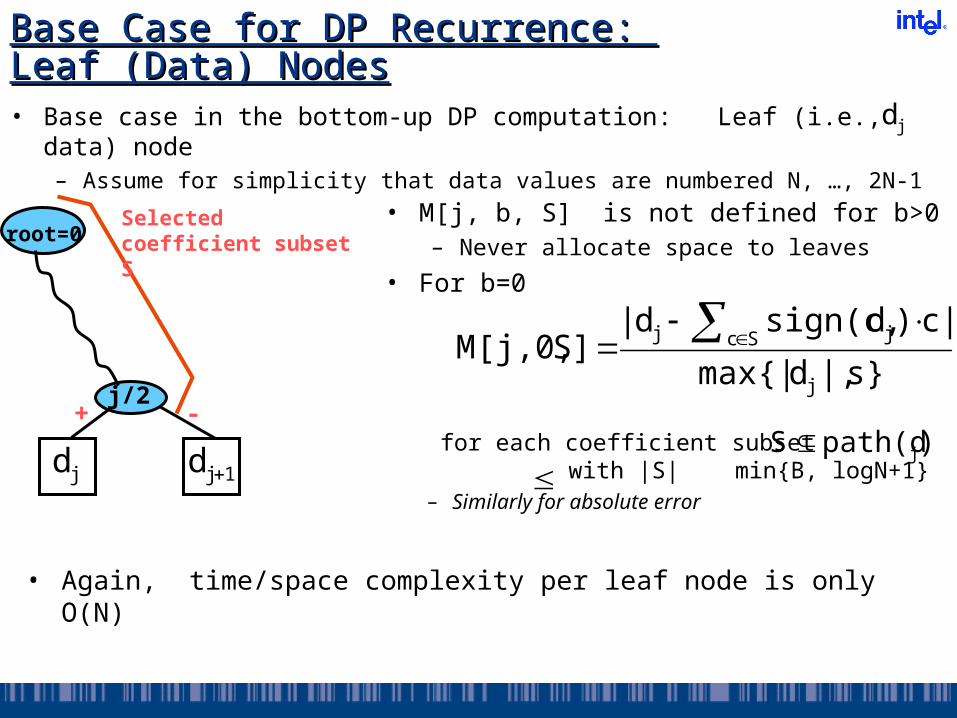
Base Case for DP Recurrence: Leaf Base Case for DP Recurrence: Leaf (Data) Nodes(Data) Nodes• Base case in the bottom-up DP computation: Leaf (i.e., data)
node– Assume for simplicity that data values are numbered N, …, 2N-1
• Again, time/space complexity per leaf node is only O(N)
j/2+ -
root=0Selected coefficient subset S
jd 1jd
jd
• M[j, b, S] is not defined for b>0– Never allocate space to leaves
• For b=0
s}|,dmax{|
|c)dsign(c,d|S]M[j,0,
j
Sc jj
for each coefficient subset with |S| min{B, logN+1}– Similarly for absolute error
)path(dS j
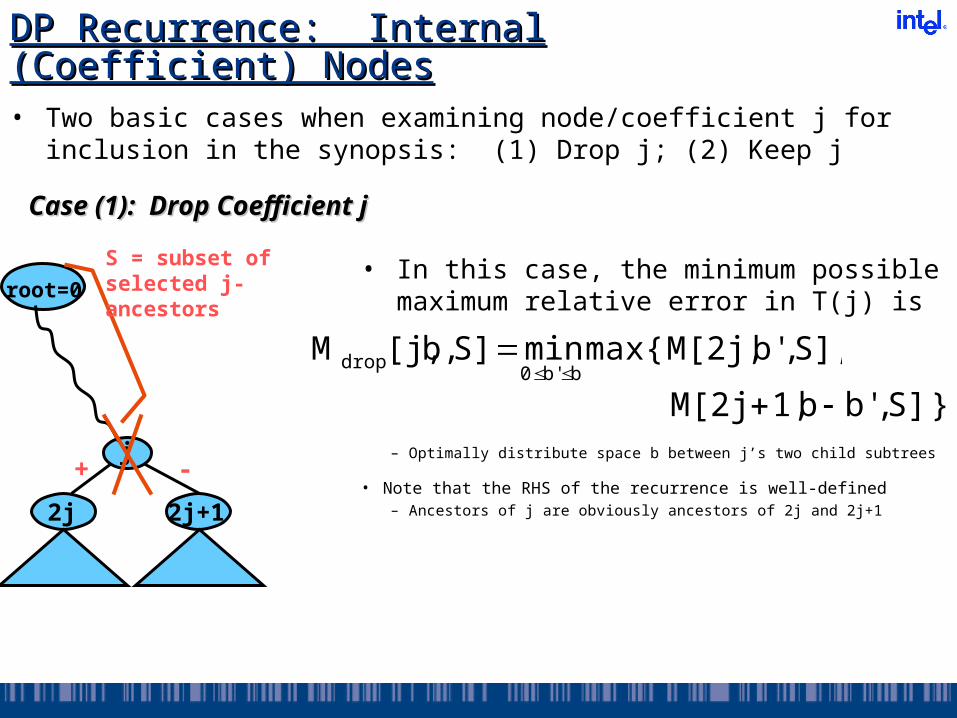
DP Recurrence: Internal (Coefficient) DP Recurrence: Internal (Coefficient) NodesNodes• Two basic cases when examining node/coefficient j for inclusion
in the synopsis: (1) Drop j; (2) Keep j
• In this case, the minimum possible maximum relative error in T(j) is
j
2j 2j+1
+ -
root=0
S = subset of selected j-ancestors
Case (1): Drop Coefficient jCase (1): Drop Coefficient j
S],,b'M[2j,max{ minS]b,[j,Mbb'0
drop
} S],b'b1,M[2j – Optimally distribute space b between j’s two child
subtrees
• Note that the RHS of the recurrence is well-defined– Ancestors of j are obviously ancestors of 2j and 2j+1

DP Recurrence: Internal (Coefficient) DP Recurrence: Internal (Coefficient) NodesNodes (cont.) (cont.)
• In this case, the minimum possible maximum relative error in T(j) is
Case (2): Keep Coefficient jCase (2): Keep Coefficient j
}],{cS,b'M[2j,max{ minS]b,[j,M j1-bb'0
keep
} }]{cSb'-1,b1,M[2j j– Take 1 unit of space for coefficient j, and optimally
distribute remaining space– Selected subsets in RHS change, since we choose to retain j
• Again, the recurrence RHS is well-defined
j
2j 2j+1
+ -
root=0
S = subset of selected j-ancestors
• Finally, define
• Overall complexity: time, space
} S]b,[j,M S],b,[j,Mmin{ S]b,M[j, keepdrop
)O(N2 logN})min{B, O(N
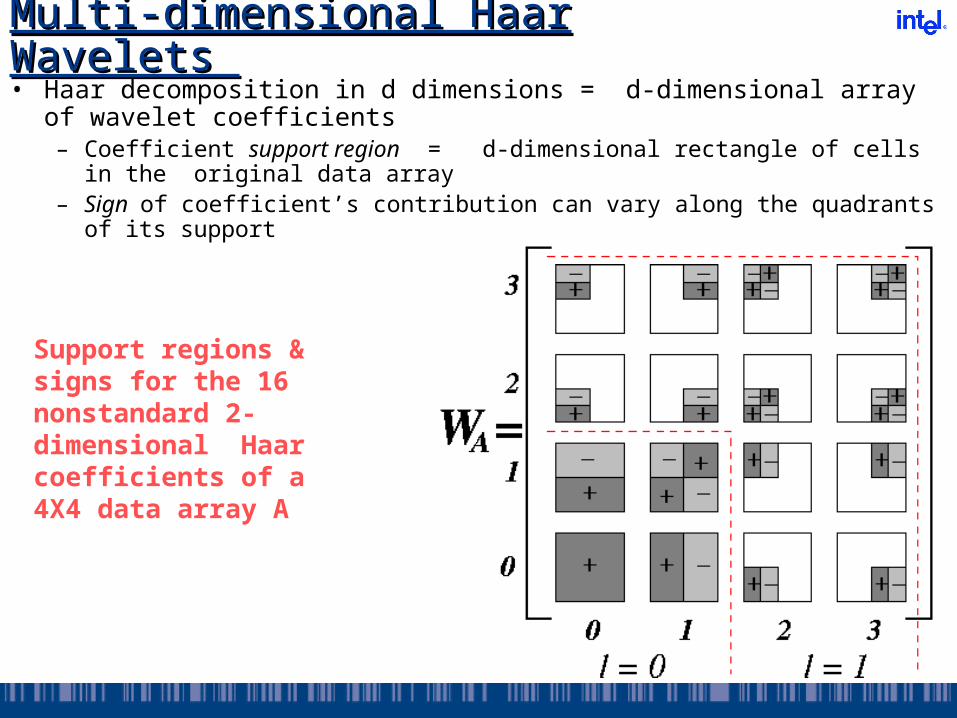
Multi-dimensional Haar Wavelets Multi-dimensional Haar Wavelets • Haar decomposition in d dimensions = d-dimensional array of
wavelet coefficients– Coefficient support region = d-dimensional rectangle of cells in the
original data array– Sign of coefficient’s contribution can vary along the quadrants of its
support
Support regions & signs for the 16 nonstandard 2-dimensional Haar coefficients of a 4X4 data array A
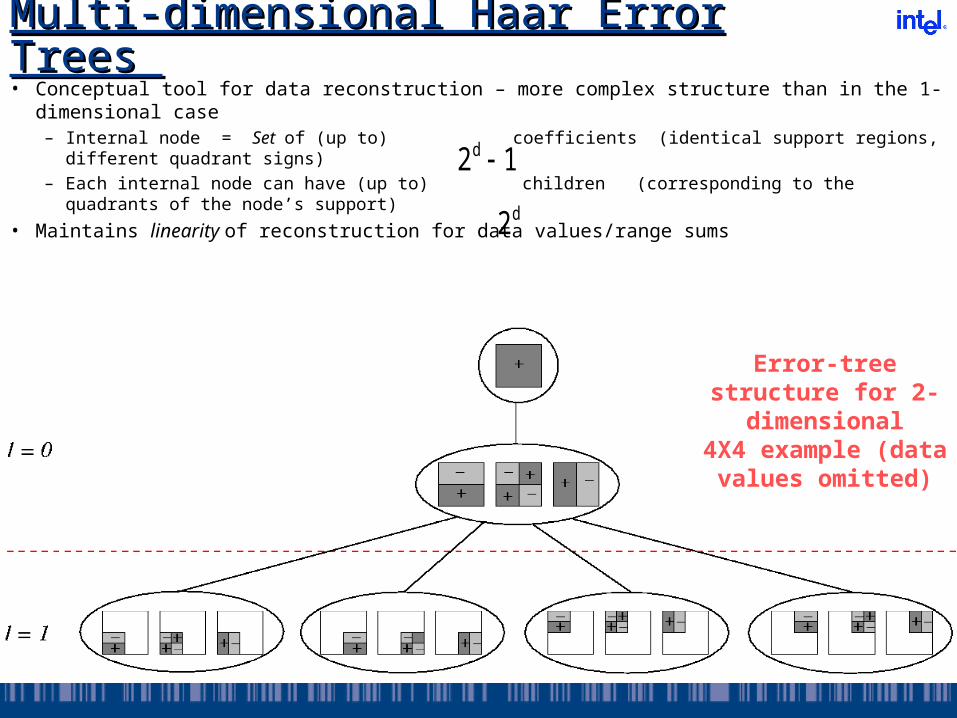
Multi-dimensional Haar Error Trees Multi-dimensional Haar Error Trees • Conceptual tool for data reconstruction – more complex structure than in the 1-
dimensional case– Internal node = Set of (up to) coefficients (identical support regions, different quadrant
signs)– Each internal node can have (up to) children (corresponding to the quadrants of the
node’s support)
• Maintains linearity of reconstruction for data values/range sums
Error-tree structure for 2-
dimensional4X4 example (data values
omitted)
12d d2
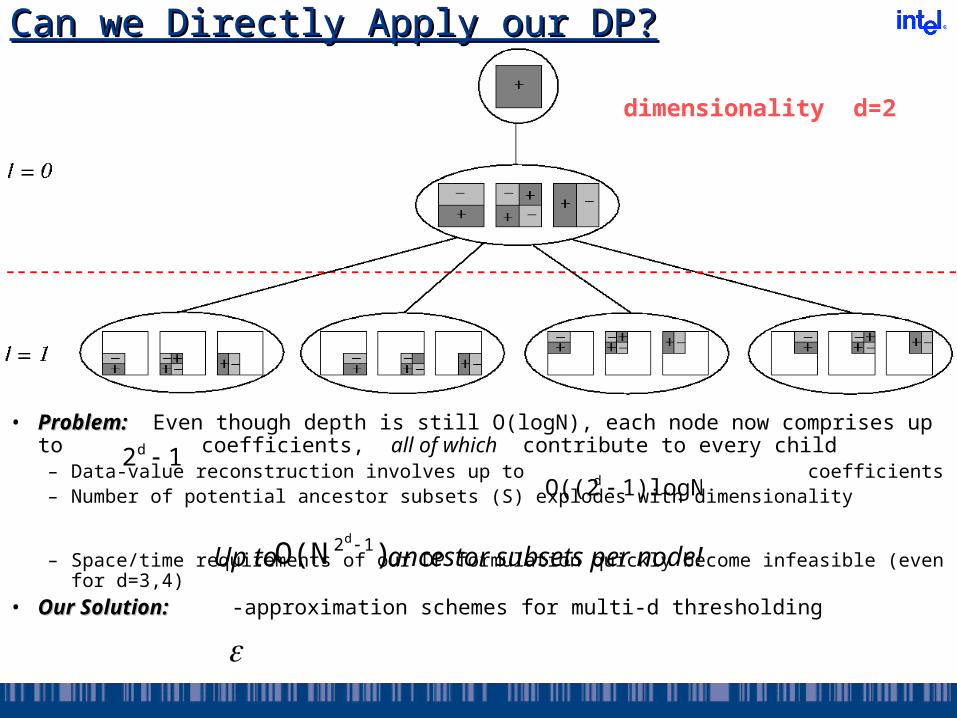
• Problem:Problem: Even though depth is still O(logN), each node now comprises up to coefficients, all of which contribute to every child– Data-value reconstruction involves up to coefficients– Number of potential ancestor subsets (S) explodes with dimensionality
– Space/time requirements of our DP formulation quickly become infeasible (even for d=3,4)
• Our Solution:Our Solution: -approximation schemes for multi-d thresholding
Can we Directly Apply our DP?Can we Directly Apply our DP?
12d 1)logN)O((2d
Up to ancestor subsets per node!)O(N 12d
dimensionality d=2
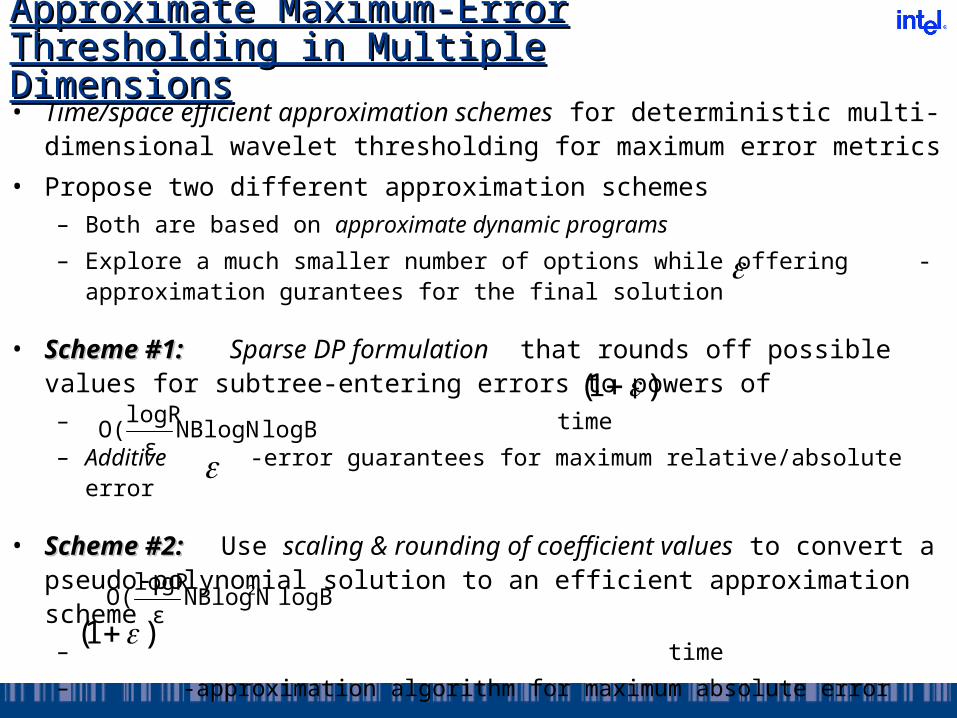
• Time/space efficient approximation schemes for deterministic multi-dimensional wavelet thresholding for maximum error metrics
• Propose two different approximation schemes– Both are based on approximate dynamic programs
– Explore a much smaller number of options while offering -approximation gurantees for the final solution
• Scheme #1:Scheme #1: Sparse DP formulation that rounds off possible values for subtree-entering errors to powers of – time
– Additive -error guarantees for maximum relative/absolute error
• Scheme #2: Scheme #2: Use scaling & rounding of coefficient values to convert a pseudo-polynomial solution to an efficient approximation scheme– time
– -approximation algorithm for maximum absolute error
Approximate Maximum-Error Approximate Maximum-Error Thresholding in Multiple DimensionsThresholding in Multiple Dimensions
)1( logB) NBlogN
εlogR
O(
)1( logB) NNBlog
εlogR
O( 2
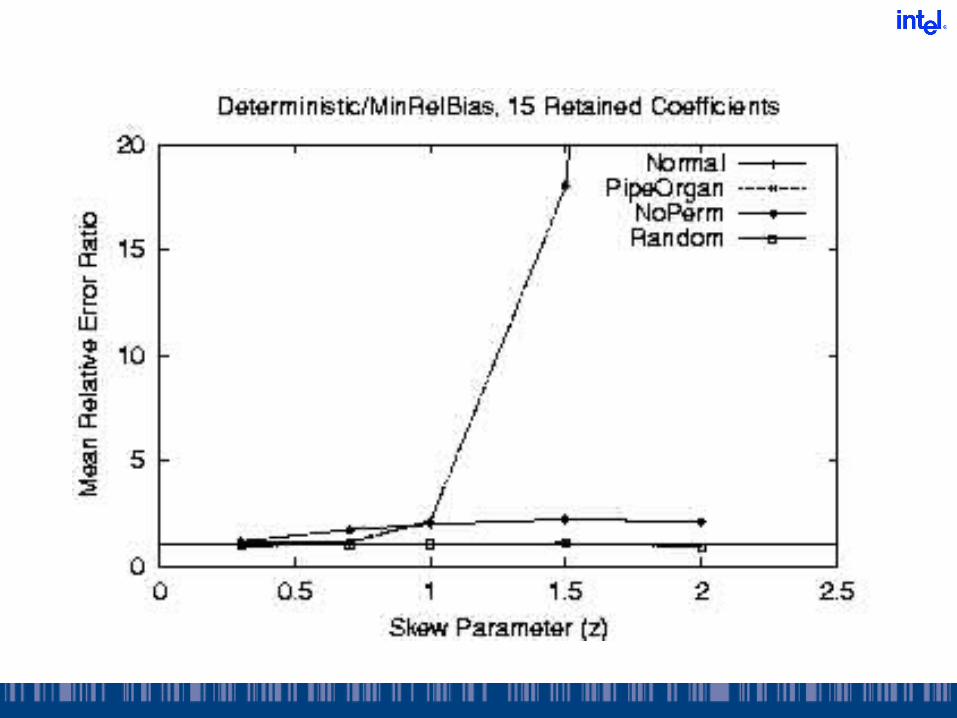
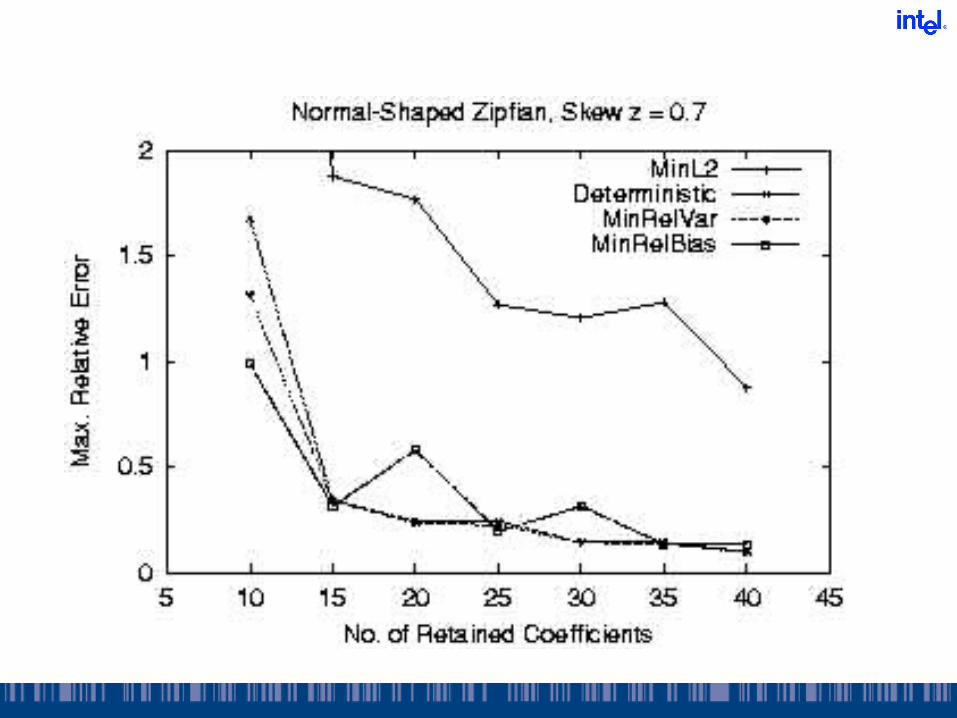
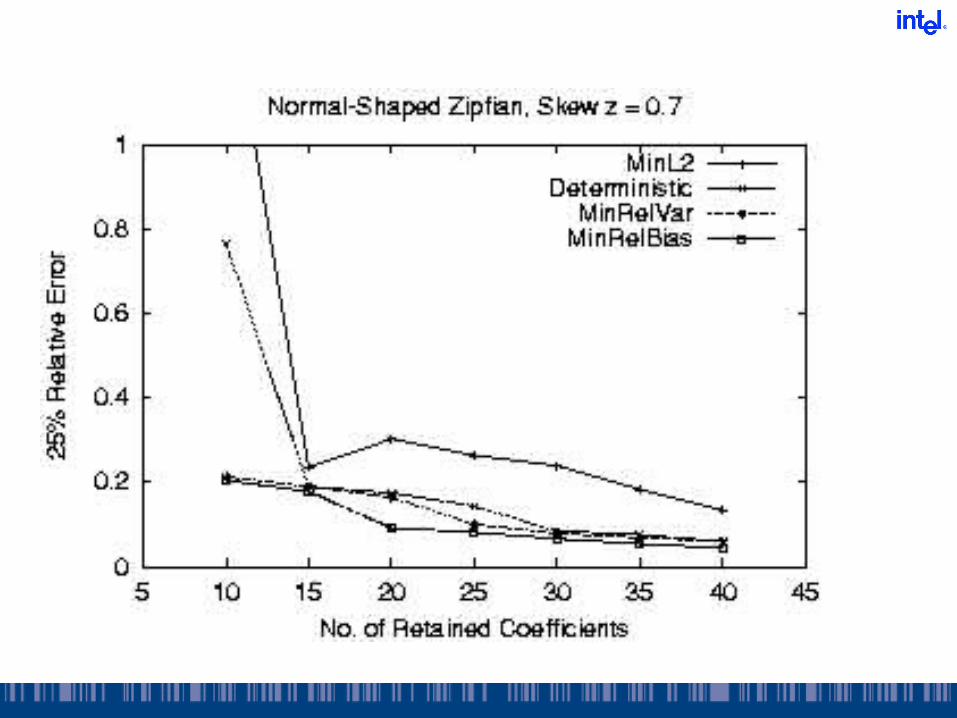
Experimental Study Experimental Study • Deterministic vs. Probabilistic (vs. Conventional L2)
• Synthetic and real-life data sets– Zipfian data distributions
• Various permutations, skew z = 0.3 - 2.0– Weather, Corel Images (UCI), …
• Relative error metrics– Sanity bound = 10-percentile value in data– Maximum and average relative error in approximation
• Deterministic optimization algorithms extend to any “distributive” error metric
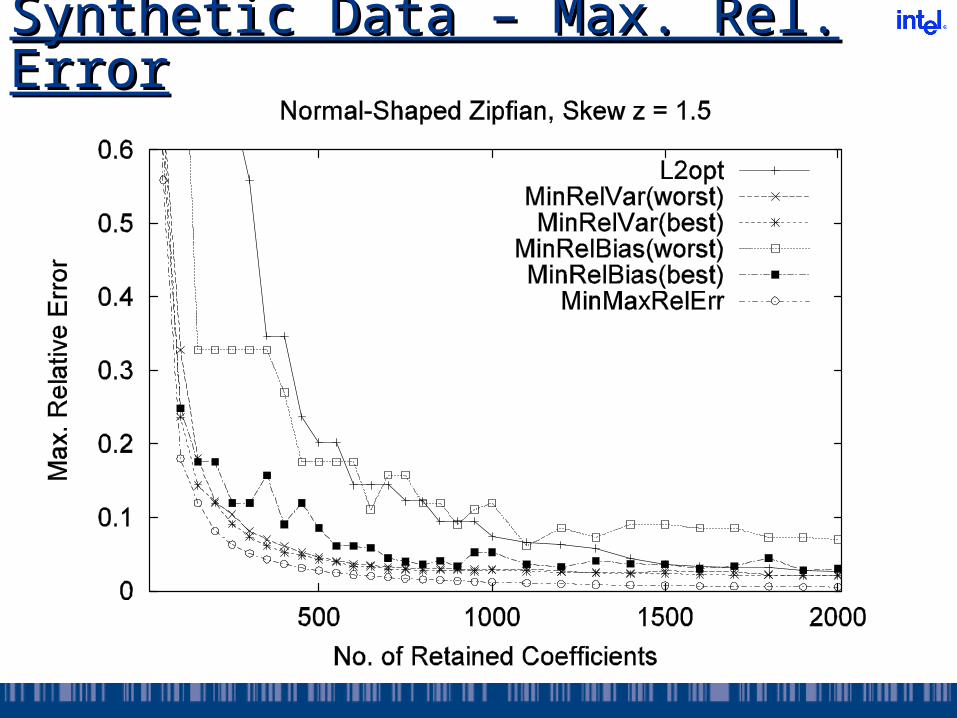
Synthetic Data – Max. Rel. ErrorSynthetic Data – Max. Rel. Error
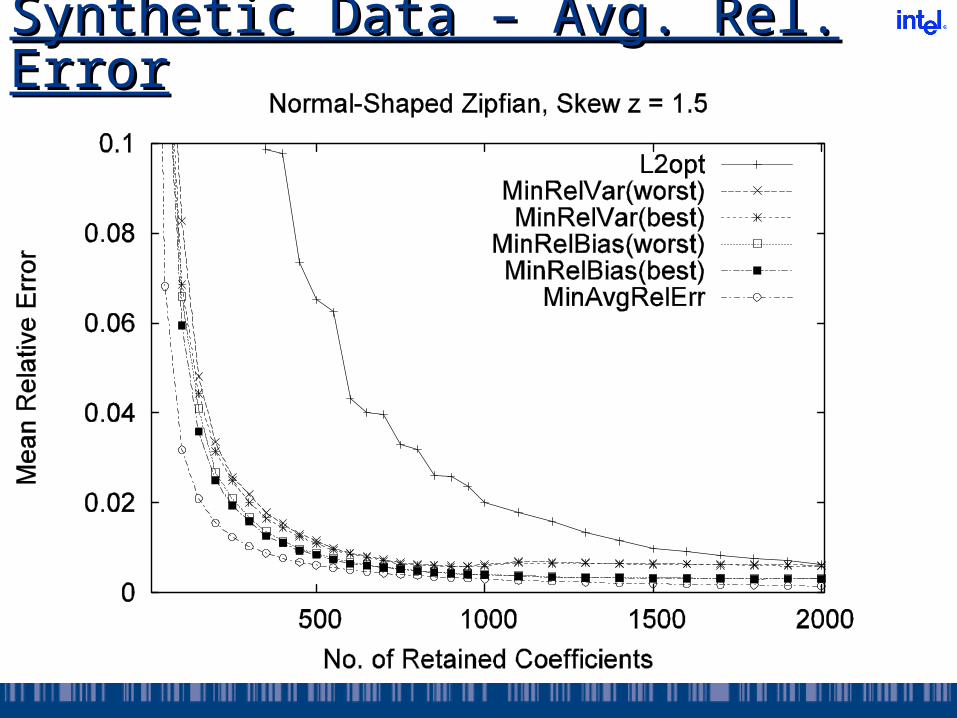
Synthetic Data – Avg. Rel. ErrorSynthetic Data – Avg. Rel. Error
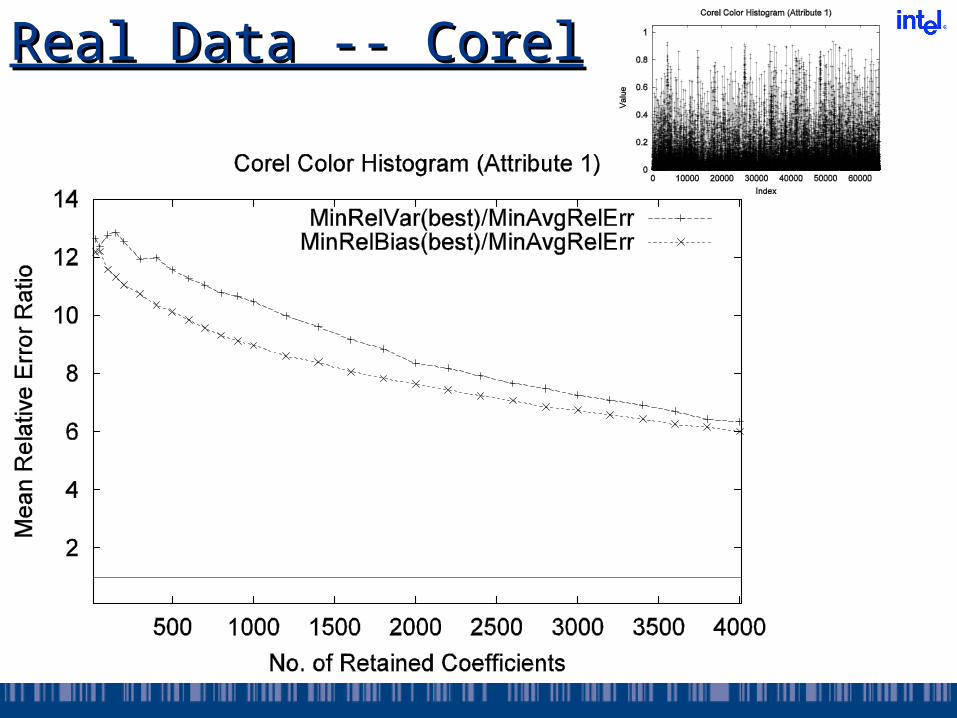
Real Data -- CorelReal Data -- Corel
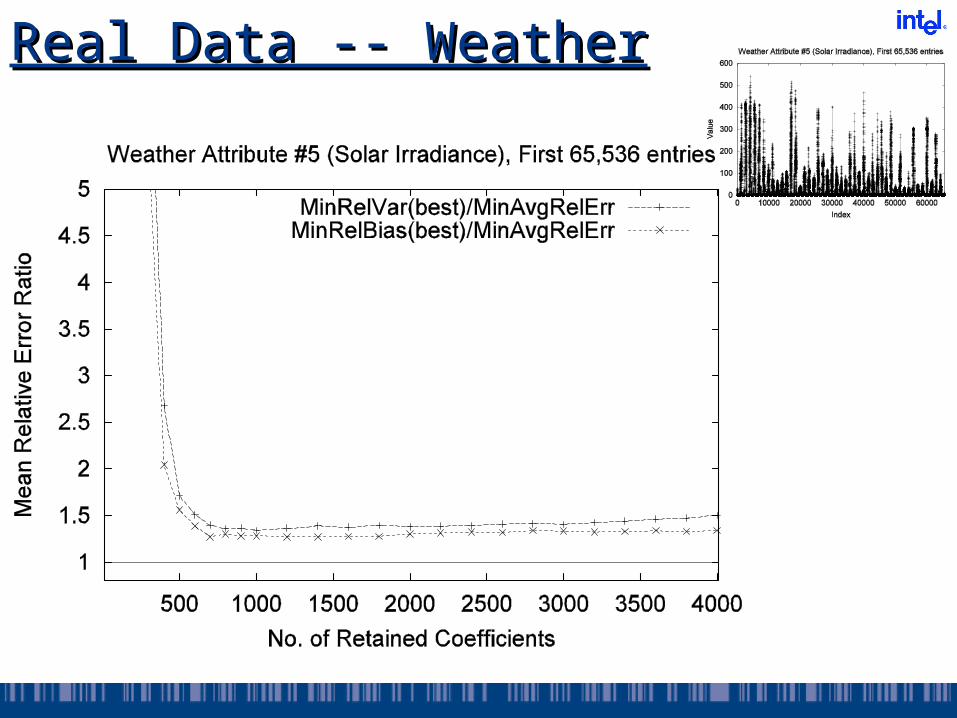
Real Data -- WeatherReal Data -- Weather
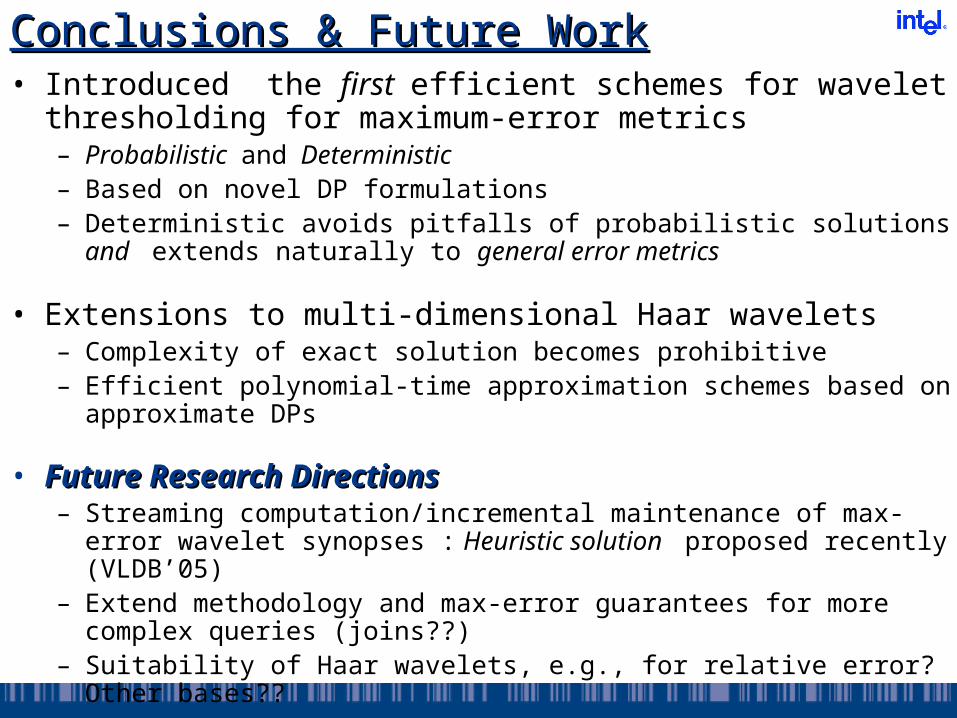
Conclusions & Future WorkConclusions & Future Work• Introduced the first efficient schemes for wavelet
thresholding for maximum-error metrics– Probabilistic and Deterministic – Based on novel DP formulations– Deterministic avoids pitfalls of probabilistic solutions and
extends naturally to general error metrics
• Extensions to multi-dimensional Haar wavelets– Complexity of exact solution becomes prohibitive– Efficient polynomial-time approximation schemes based on
approximate DPs
• Future Research DirectionsFuture Research Directions– Streaming computation/incremental maintenance of max-error
wavelet synopses : Heuristic solution proposed recently (VLDB’05)
– Extend methodology and max-error guarantees for more complex queries (joins??)
– Suitability of Haar wavelets, e.g., for relative error? Other bases??

Thank you!Thank you!
[email protected]@intel.com
http://www2.berkeley.intel-research.net/http://www2.berkeley.intel-research.net/~minos/~minos/
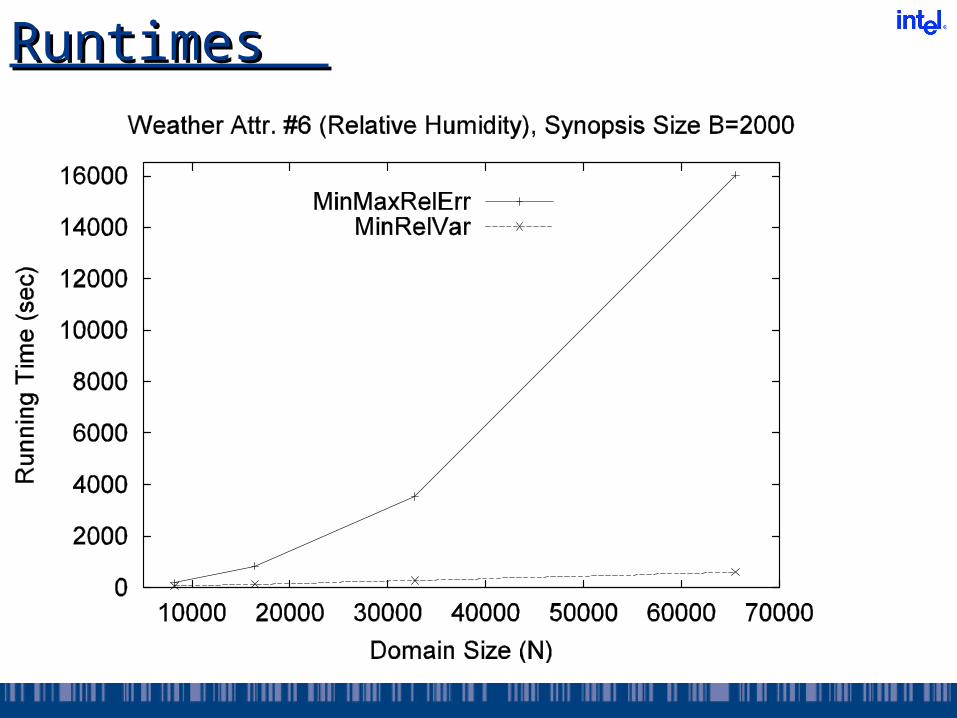
Runtimes Runtimes

Memory RequirementsMemory Requirements
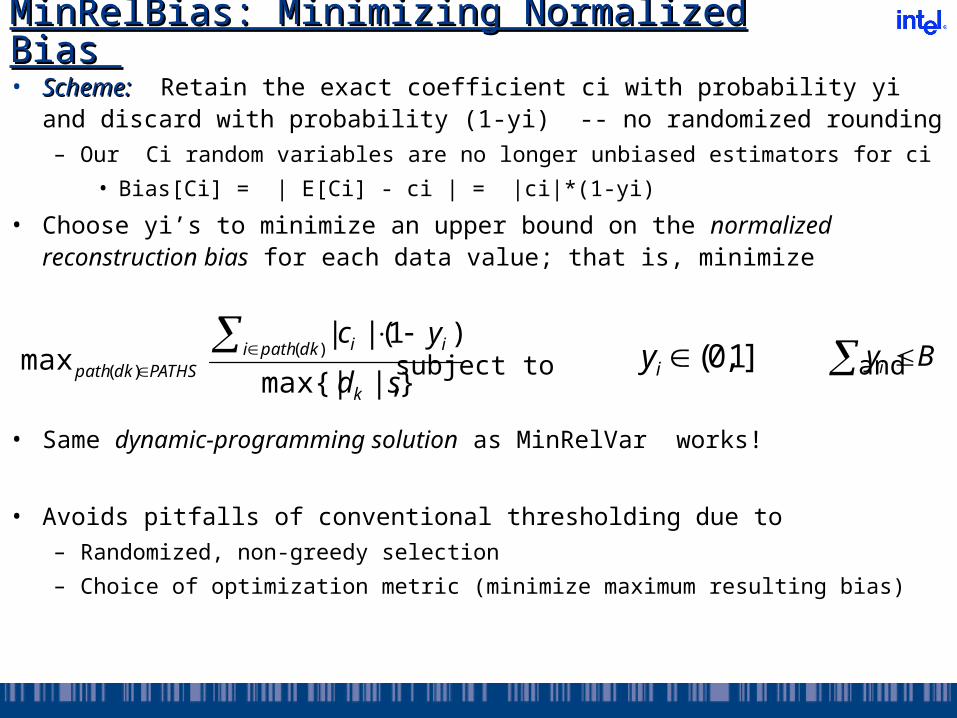
MinRelBias: Minimizing Normalized Bias MinRelBias: Minimizing Normalized Bias • Scheme:Scheme: Retain the exact coefficient ci with probability yi and
discard with probability (1-yi) -- no randomized rounding– Our Ci random variables are no longer unbiased estimators for ci
• Bias[Ci] = | E[Ci] - ci | = |ci|*(1-yi)
• Choose yi’s to minimize an upper bound on the normalized reconstruction bias for each data value; that is, minimize
• Same dynamic-programming solution as MinRelVar works!
• Avoids pitfalls of conventional thresholding due to– Randomized, non-greedy selection
– Choice of optimization metric (minimize maximum resulting bias)
}|,max{|
)1(||max )(
)( sd
yc
k
dkpathi ii
PATHSdkpath
subject to and]1,0(iy Byi
Multi-dimensional Probabilistic Multi-dimensional Probabilistic Wavelet Synopses Wavelet Synopses • A First Issue: Data density can increase dramatically due to
recursive pairwise averaging/differencing (during decomposition)– Previous approaches suffer from additional bias due to ad-hoc
construction-time thresholding
• Our Solution: “Adaptively threshold” coefficients probabilistically during decomposition without introducing reconstruction bias
• Once decomposition is complete, basic ideas/principles of probabilistic thresholding carry over directly to the d-dimensional case– Linear data/range-sum reconstruction– Hierarchical error-tree structure for coefficients
• Still, our algorithms need to deal with the added complexity of the d-dimensional error-tree…
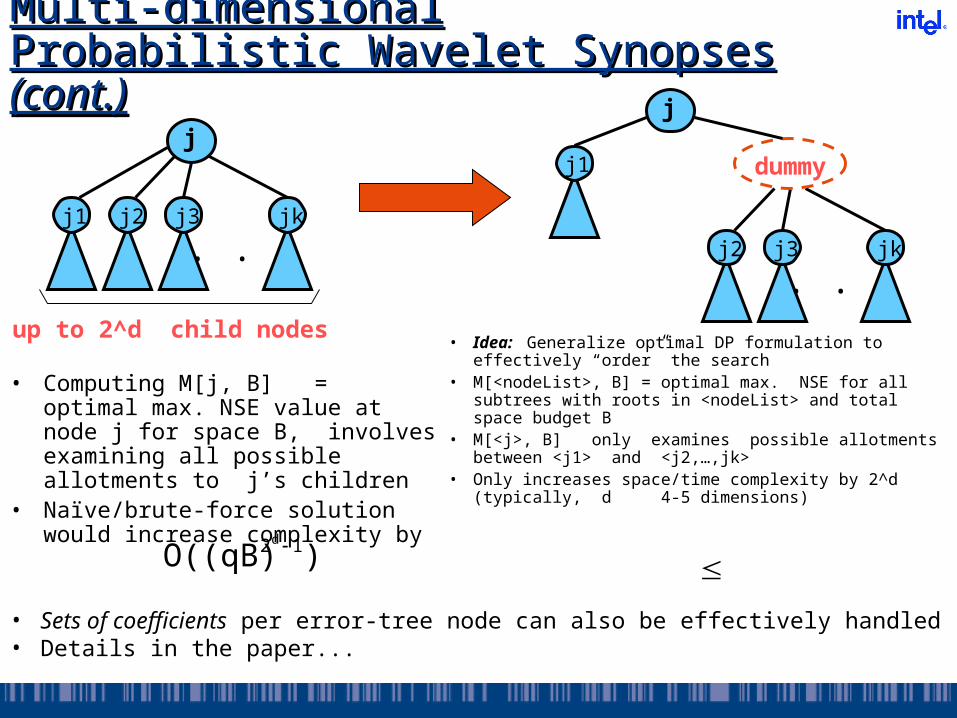
Multi-dimensional Probabilistic Multi-dimensional Probabilistic Wavelet Synopses Wavelet Synopses (cont.)(cont.)
• Sets of coefficients per error-tree node can also be effectively handled• Details in the paper...
• Computing M[j, B] = optimal max. NSE value at node j for space B, involves examining all possible allotments to j’s children
• Naïve/brute-force solution would increase complexity by
j
. . .
up to 2^d child nodes
j1 j2 j3 jk
)O((qB) 12d
j
j1
. . .j2 j3 jk
dummy
• Idea: Generalize optimal DP formulation to effectively “order” the search
• M[<nodeList>, B] = optimal max. NSE for all subtrees with roots in <nodeList> and total space budget B
• M[<j>, B] only examines possible allotments between <j1> and <j2,…,jk>
• Only increases space/time complexity by 2^d (typically, d 4-5 dimensions)
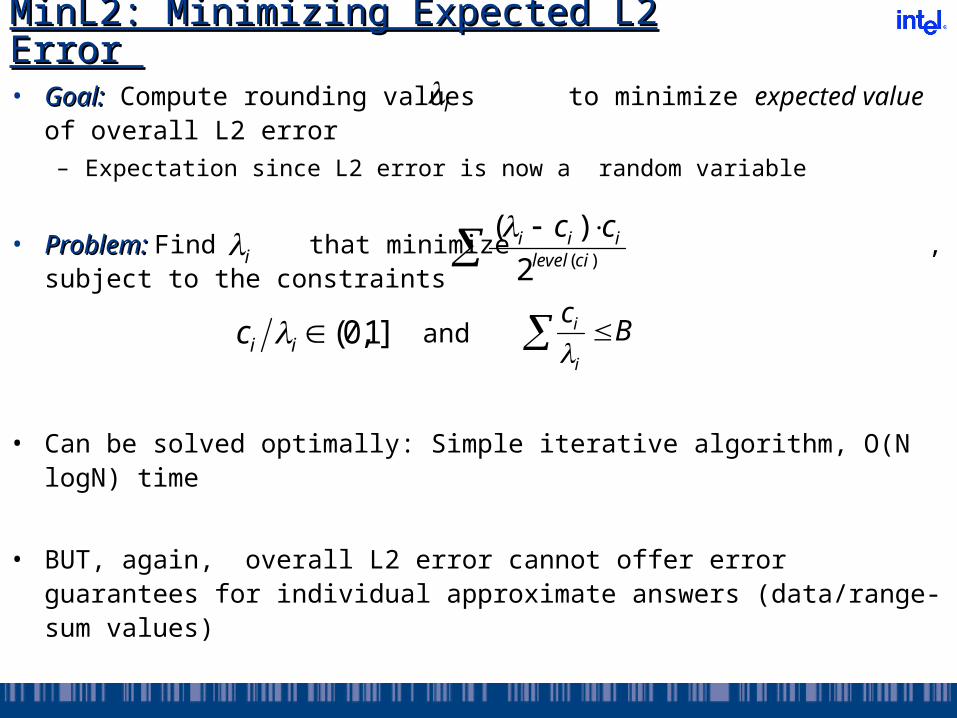
MinL2: Minimizing Expected L2 Error MinL2: Minimizing Expected L2 Error
• Goal:Goal: Compute rounding values to minimize expected value of overall L2 error – Expectation since L2 error is now a random variable
• Problem: Problem: Find that minimize , subject to the constraints
• Can be solved optimally: Simple iterative algorithm, O(N logN) time
• BUT, again, overall L2 error cannot offer error guarantees for individual approximate answers (data/range-sum values)
i
)(2
)(cilevel
iii cci
]1,0(iic Bc
i
i and
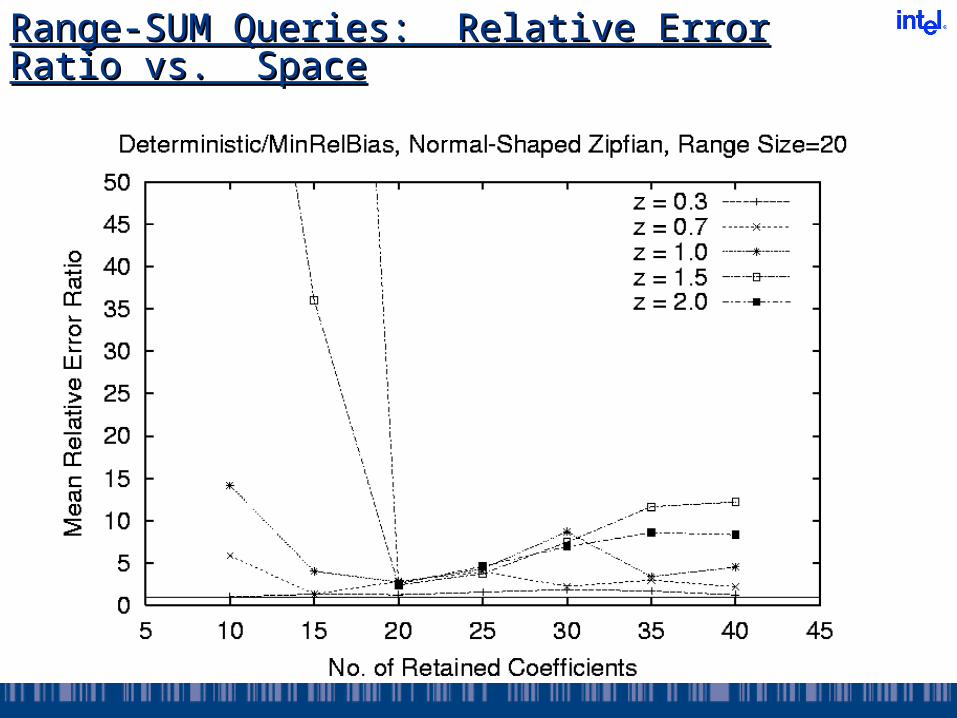
Range-SUM Queries: Relative Error Ratio Range-SUM Queries: Relative Error Ratio vs. Spacevs. Space
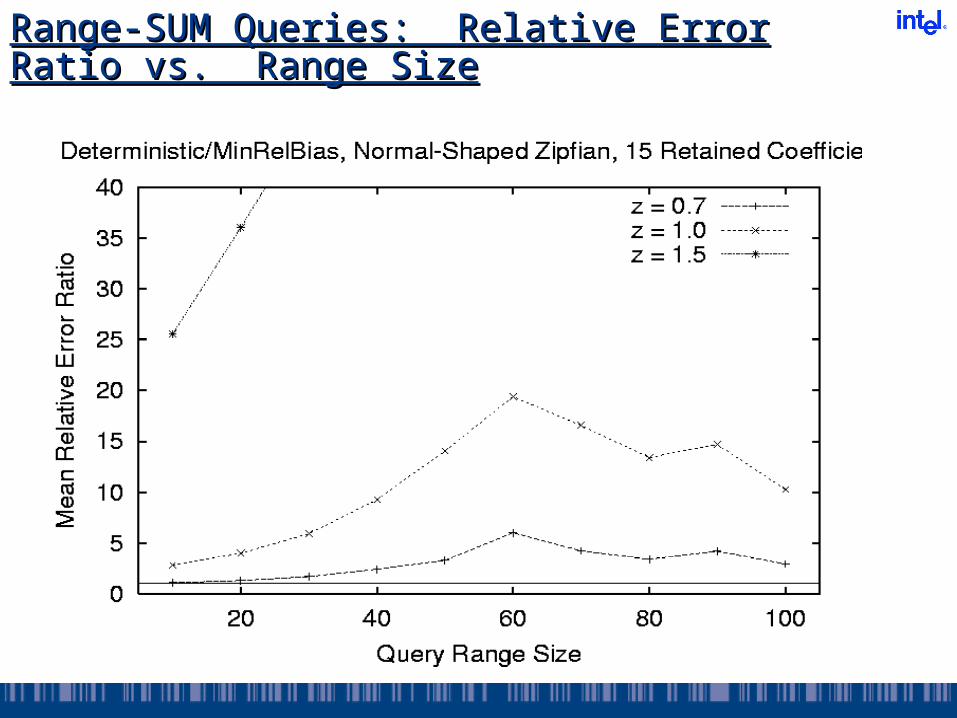
Range-SUM Queries: Relative Error Ratio Range-SUM Queries: Relative Error Ratio vs. Range Sizevs. Range Size