Embed Size (px)
Citation preview
Methods of Measuring Ocean Dynamics on the Coasts of France and Spain
Bruce Allen, Greta Miller, Remi Shaull-Thompson, James Tralie, Lillian Wu, & Sophie Zhang
Waves and Tides
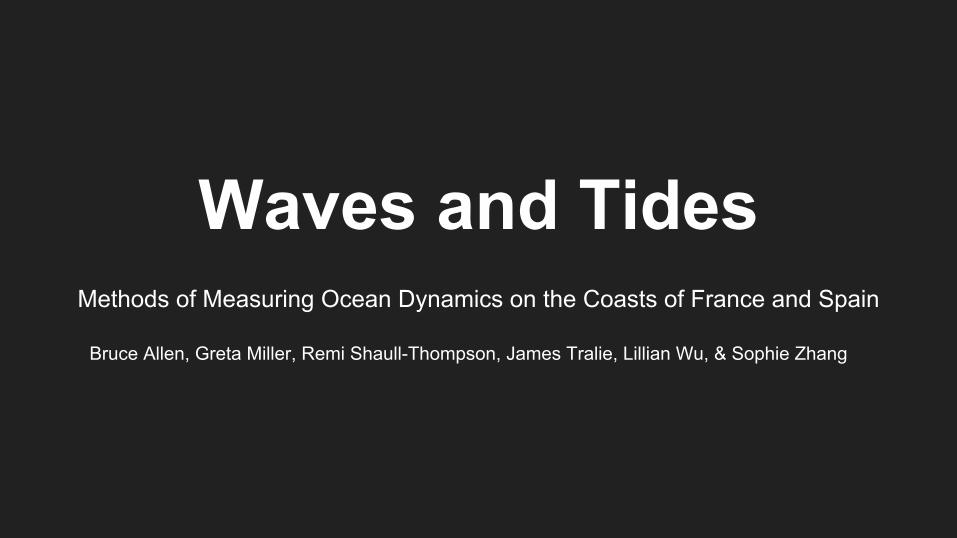
Waves● Waves - movement of energy through
water ● Caused by anything that causes water
to move● Energy transferred by wind depends
on ■ Speed, duration, consistency■ Fetch (space over which it blows)
http://secoora.org/classroom/virtual_wave/waves_fact_sheet
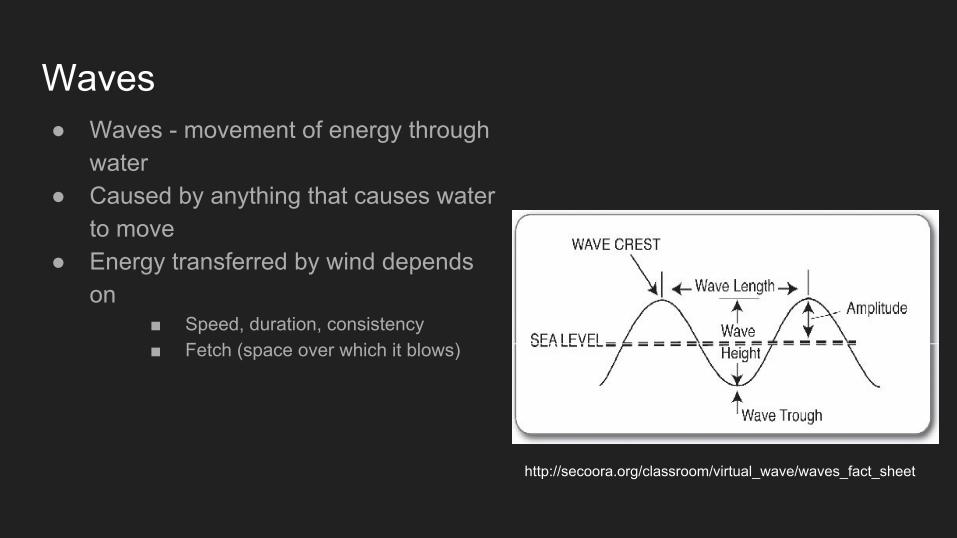
Wave Propagation
http://www.slideshare.net/mswilliams/waves-notes-28619255
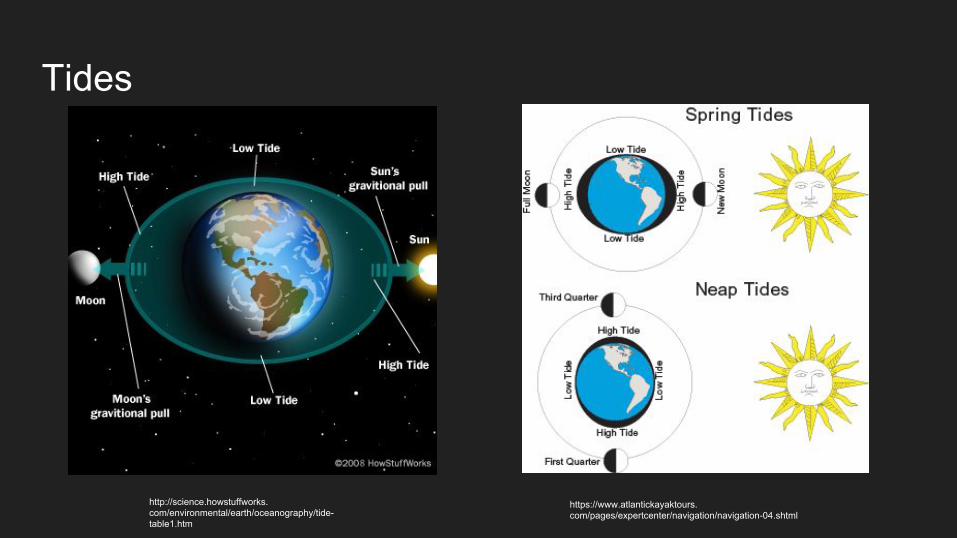
Tides
https://www.atlantickayaktours.com/pages/expertcenter/navigation/navigation-04.shtml
http://science.howstuffworks.com/environmental/earth/oceanography/tide-table1.htm
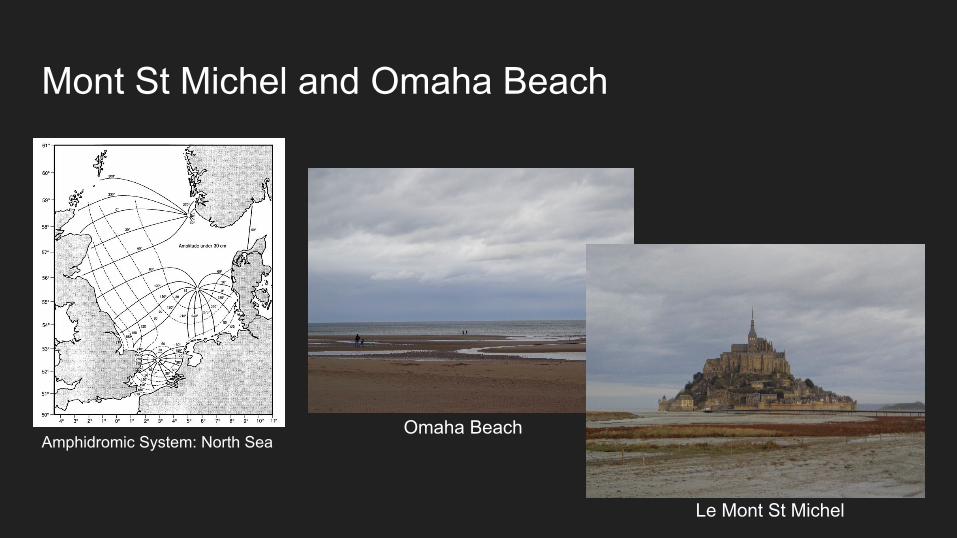
Mont St Michel and Omaha Beach
Omaha Beach
Le Mont St Michel
Amphidromic System: North Sea
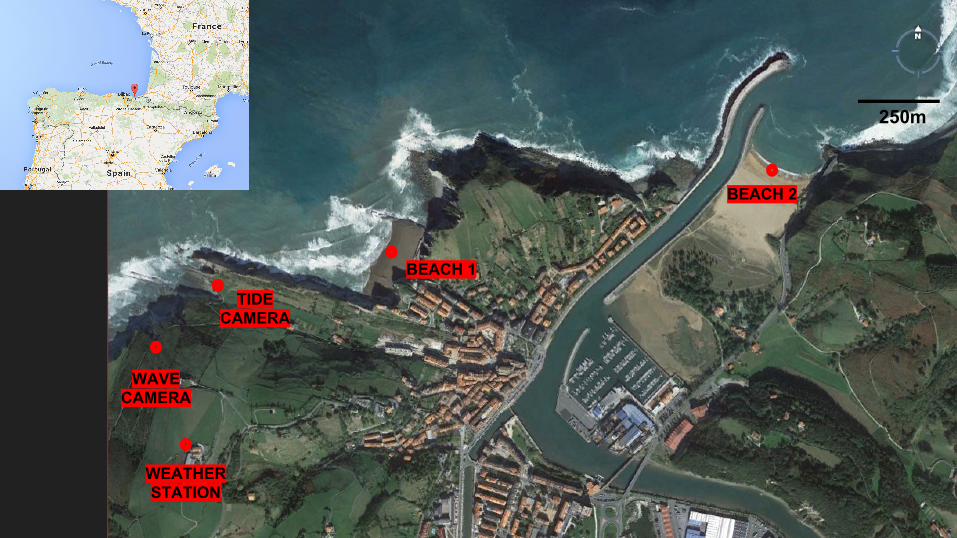
Background on Zumaia (Lillian & Greta)
WEATHER STATION
WAVE CAMERA
TIDECAMERA
BEACH 1
BEACH 2
250m
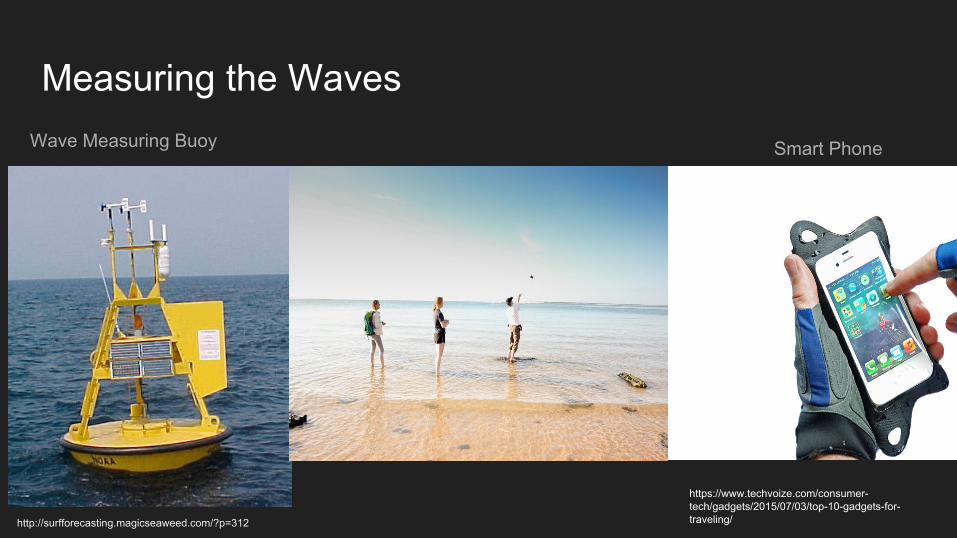
Measuring the Waves Wave Measuring Buoy Smart Phone
http://surfforecasting.magicseaweed.com/?p=312
https://www.techvoize.com/consumer-tech/gadgets/2015/07/03/top-10-gadgets-for-traveling/
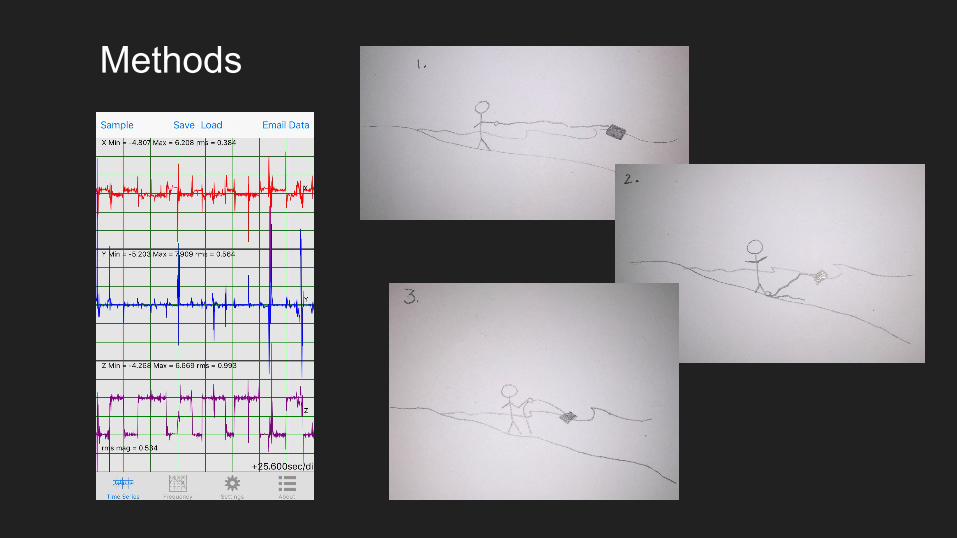
Methods
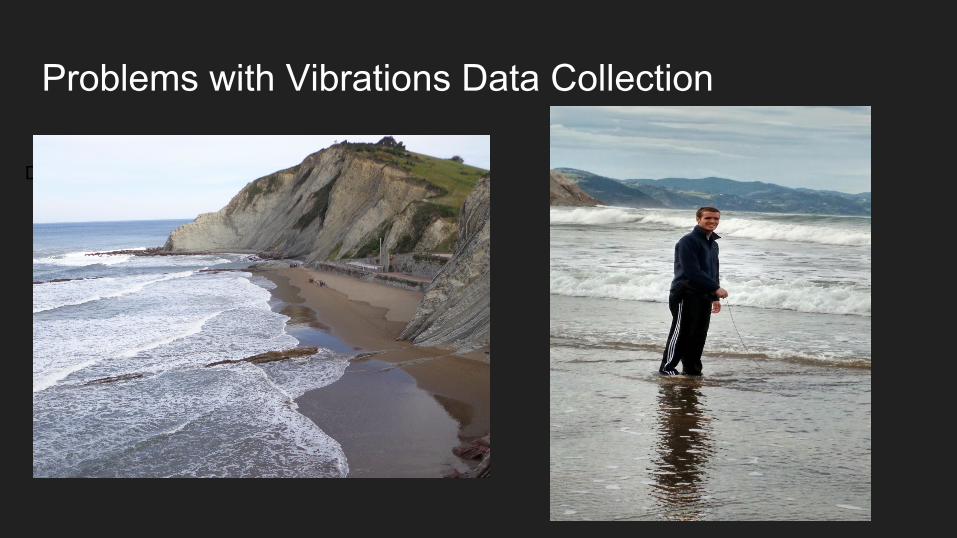
Problems with Vibrations Data Collection●
DSC04884.JPG
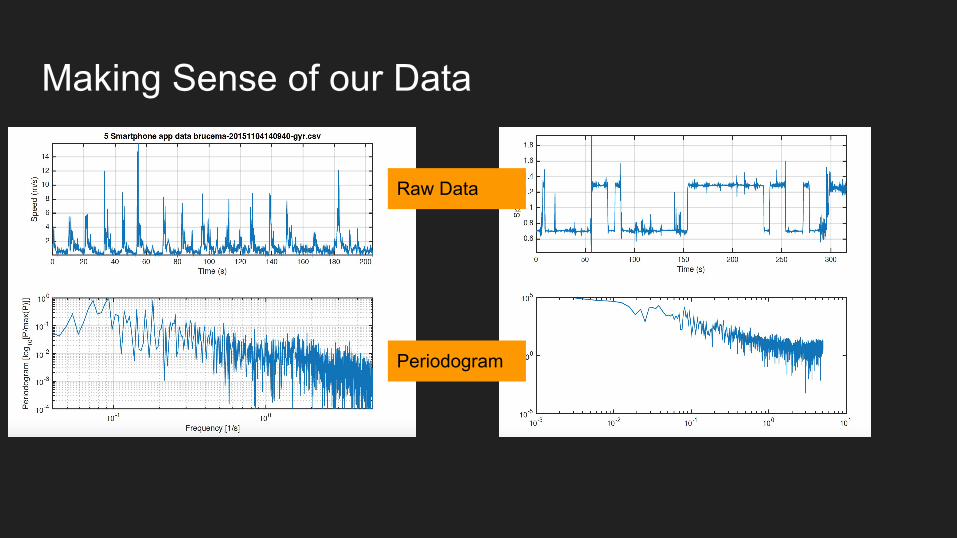
Making Sense of our Data
Raw Data
Periodogram
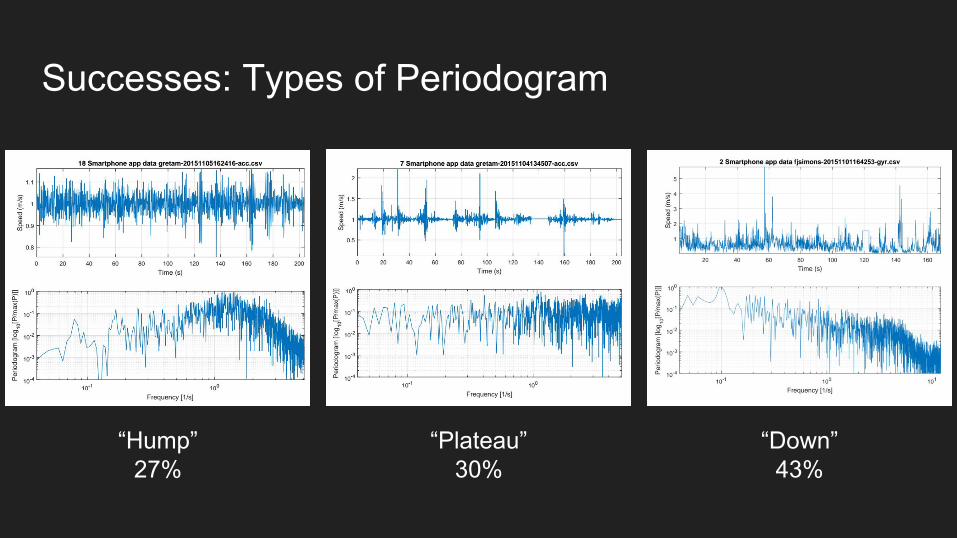
Successes: Types of Periodogram
“Hump”27%
“Plateau”30%
“Down”43%
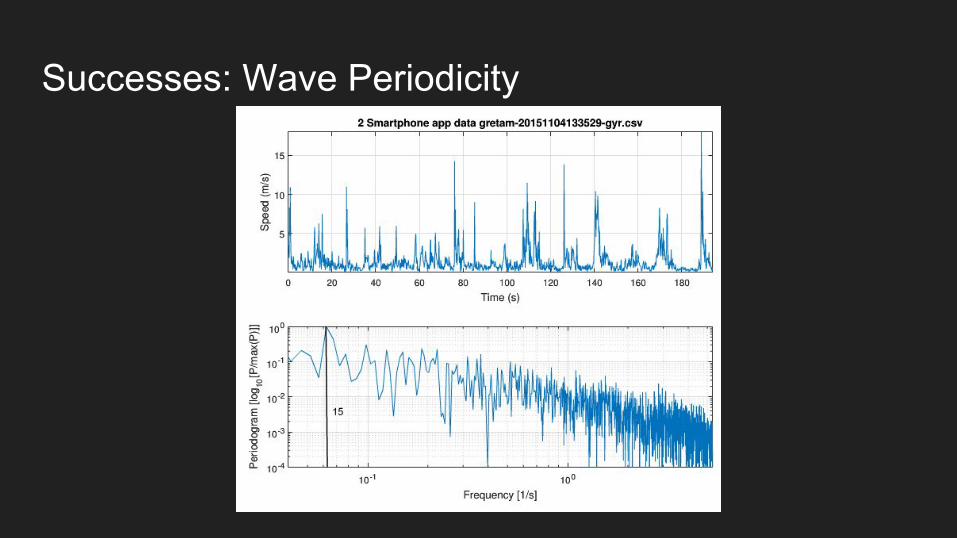
Successes: Wave Periodicity
Smartphone Conclusions● Wave measurements are useful
to coastal communities○ Ensure safety of swimmers
and surfers○ Assess risk to boats and
offshore infrastructure● More advanced applications
○ Long-term forecasting○ Tsunami risk○ Waves as energy sources
https://www.scgov.net/LifeguardOperations/Pages/SwimmingSafety.aspx
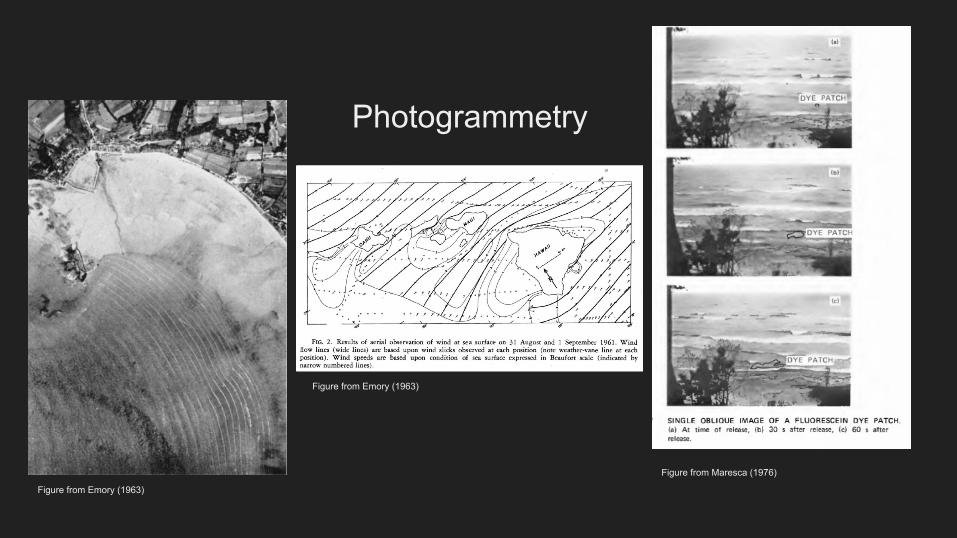
Figure from Maresca (1976)
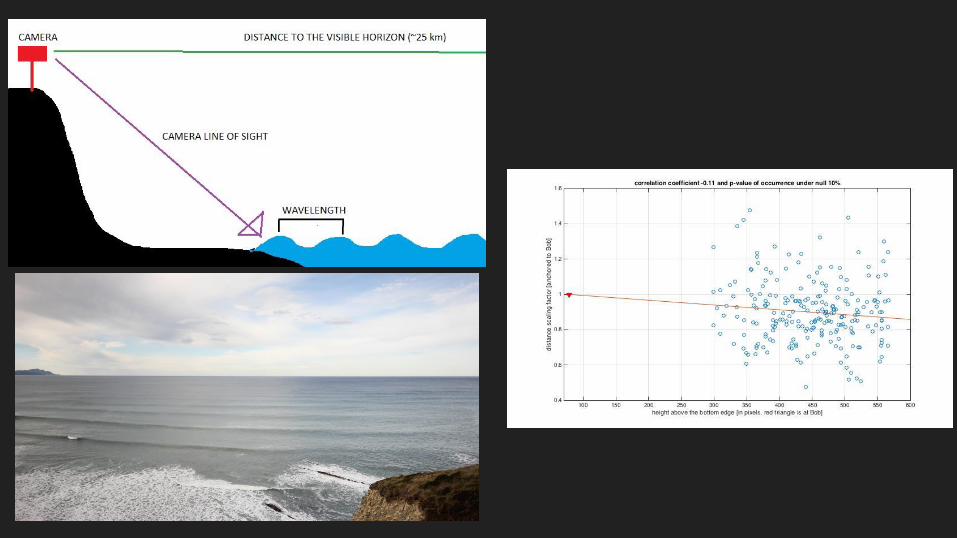
Photogrammetry
Figure from Emory (1963)
Figure from Emory (1963)
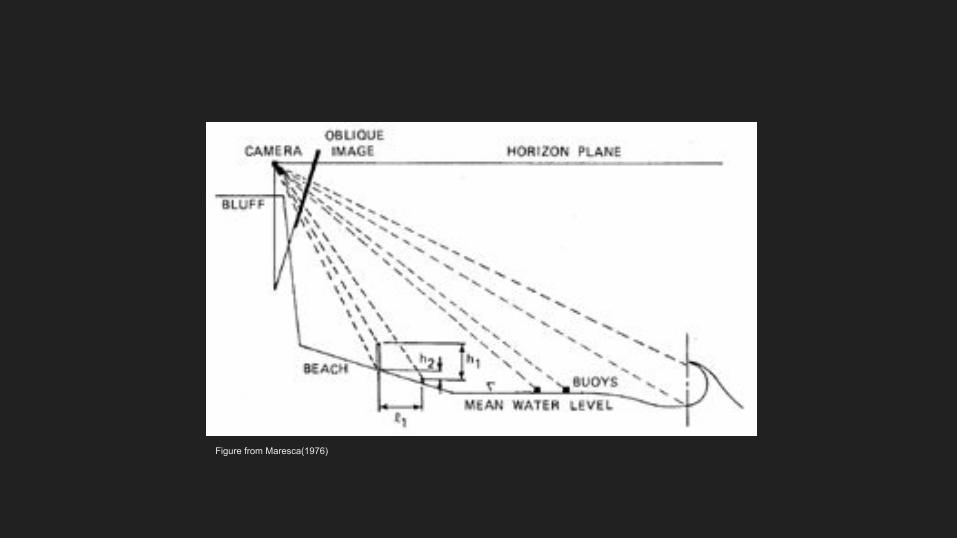
Figure from Maresca(1976)
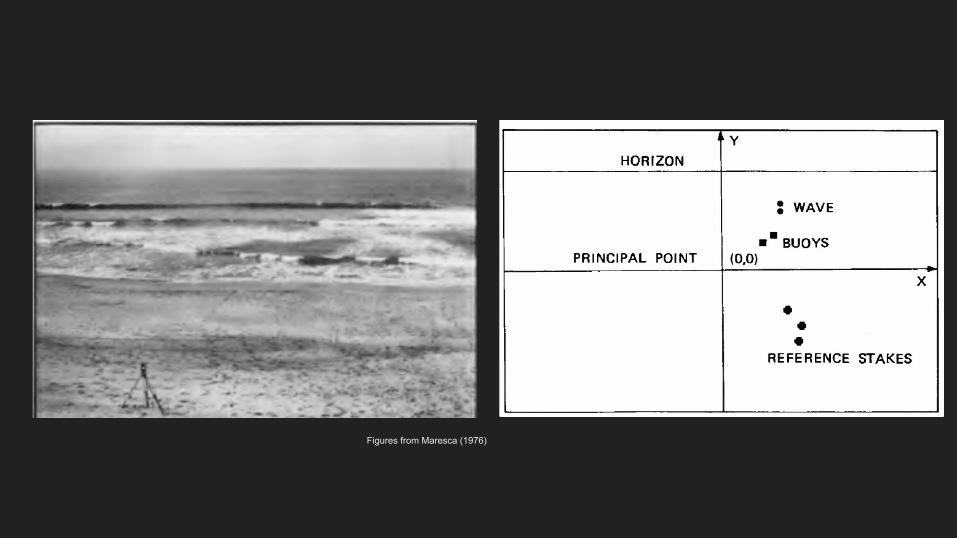
Figures from Maresca (1976)
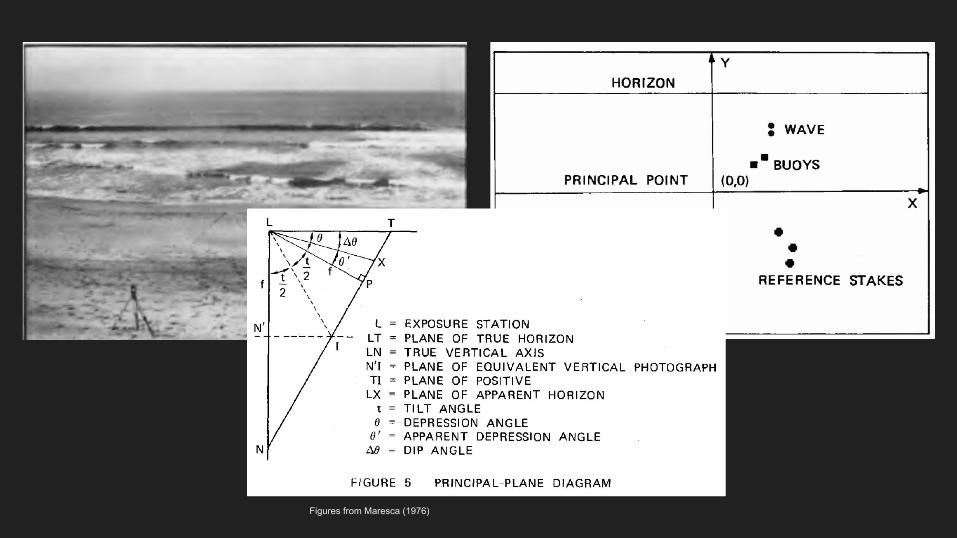
Figures from Maresca (1976)
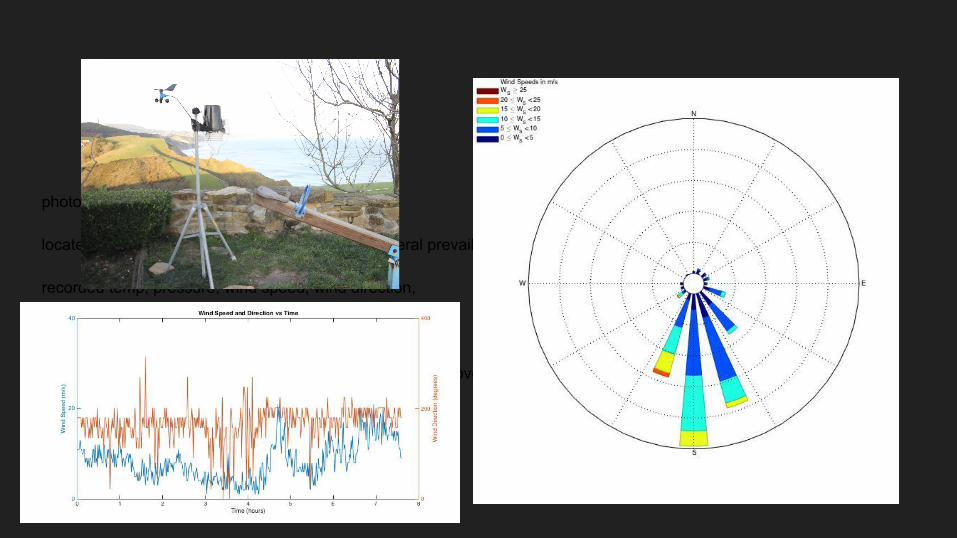
photo of weather station
located above beach/cliffs, hopefully recorded general prevailing winds in the area
recorded temp, pressure, wind speed, wind direction,
wind rose - wind came mostly from south
graph wind direction and wind speed vs time - wind varied over time
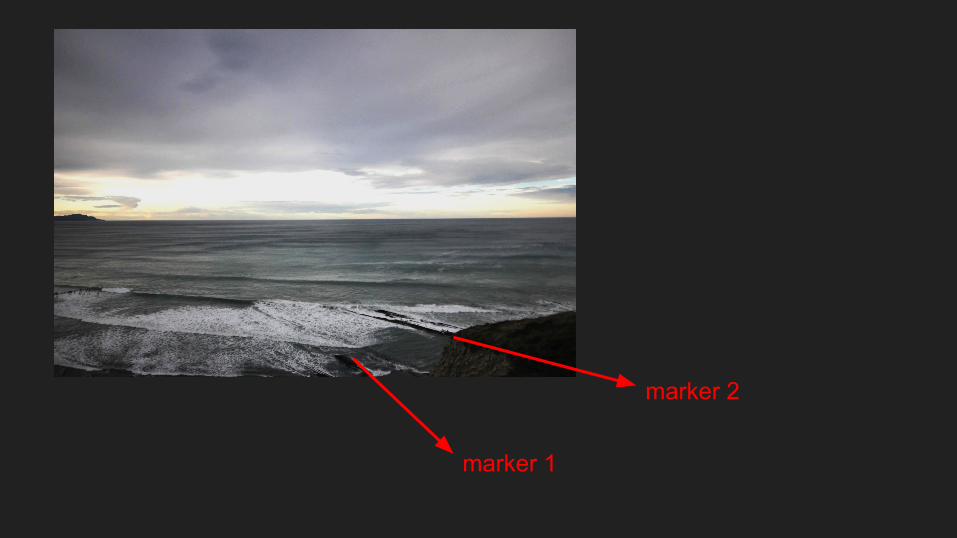
marker 1
marker 2
pdf of the clicking lines
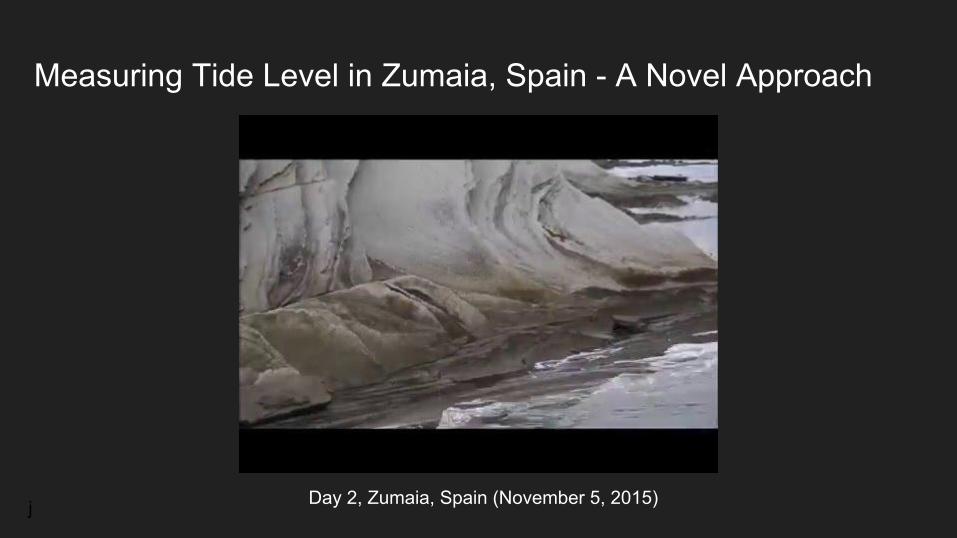
Measuring Tide Level in Zumaia, Spain - A Novel Approach
Day 2, Zumaia, Spain (November 5, 2015)j
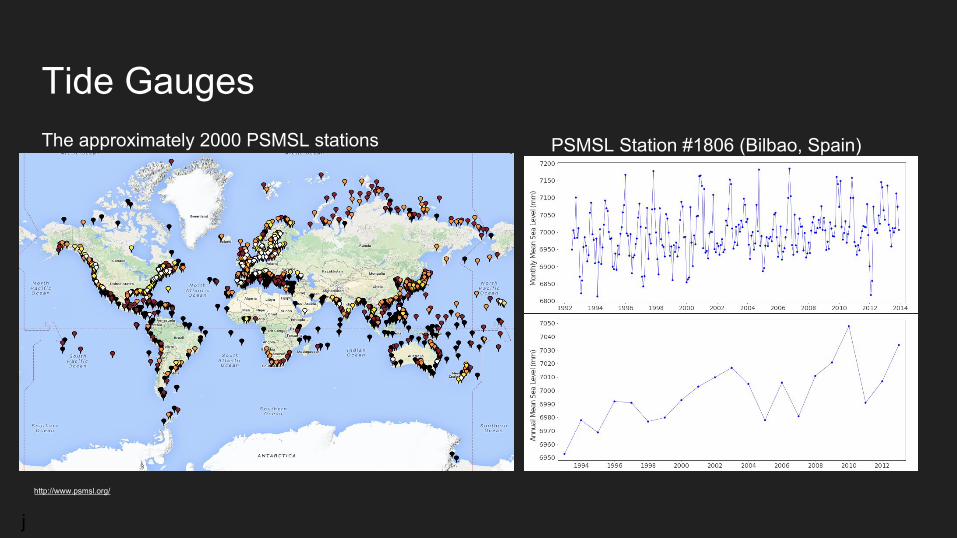
Tide Gauges PSMSL Station #1806 (Bilbao, Spain)The approximately 2000 PSMSL stations
j
http://www.psmsl.org/
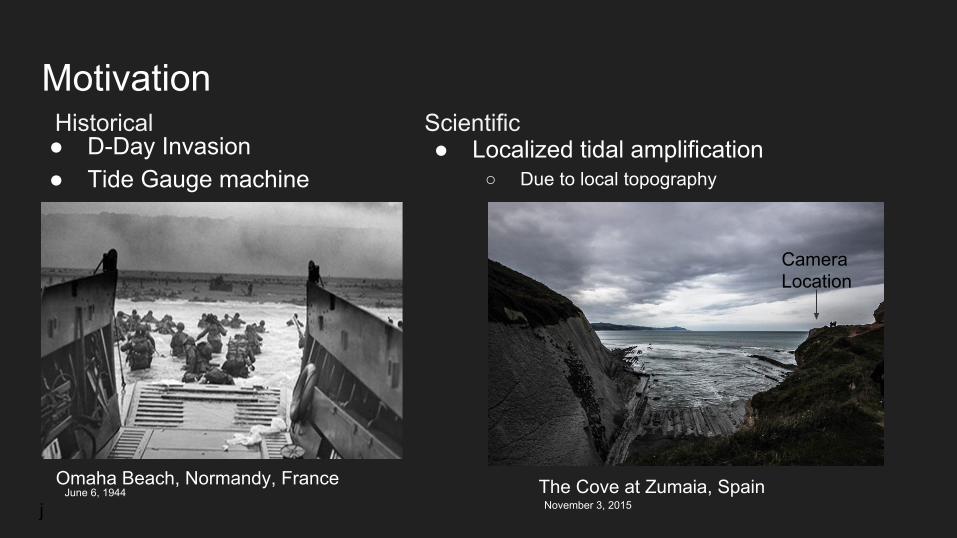
Motivation
● D-Day Invasion● Tide Gauge machine
j
Historical Scientific● Localized tidal amplification
○ Due to local topography
The Cove at Zumaia, SpainNovember 3, 2015
Omaha Beach, Normandy, FranceJune 6, 1944
Camera Location
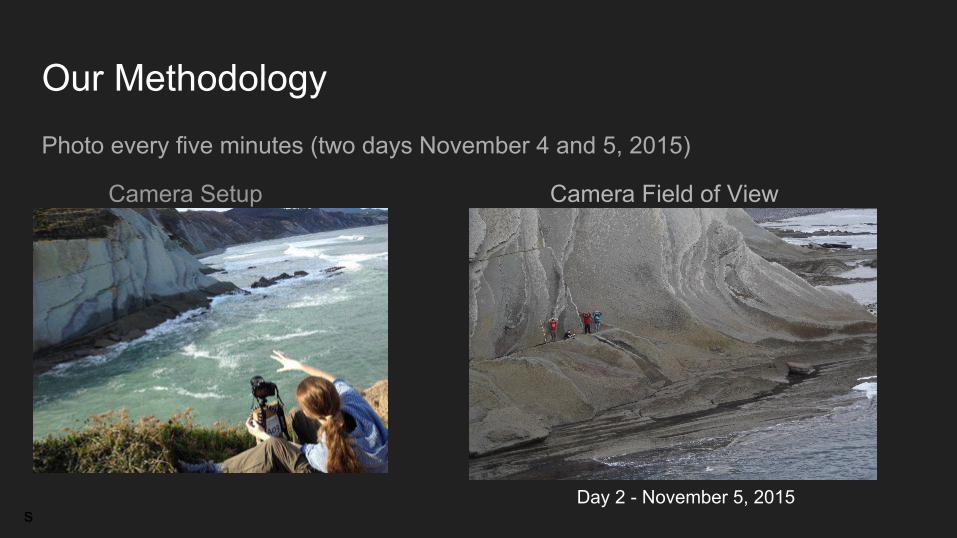
Our Methodology
Photo every five minutes (two days November 4 and 5, 2015)
s
Camera Setup Camera Field of View
Day 2 - November 5, 2015
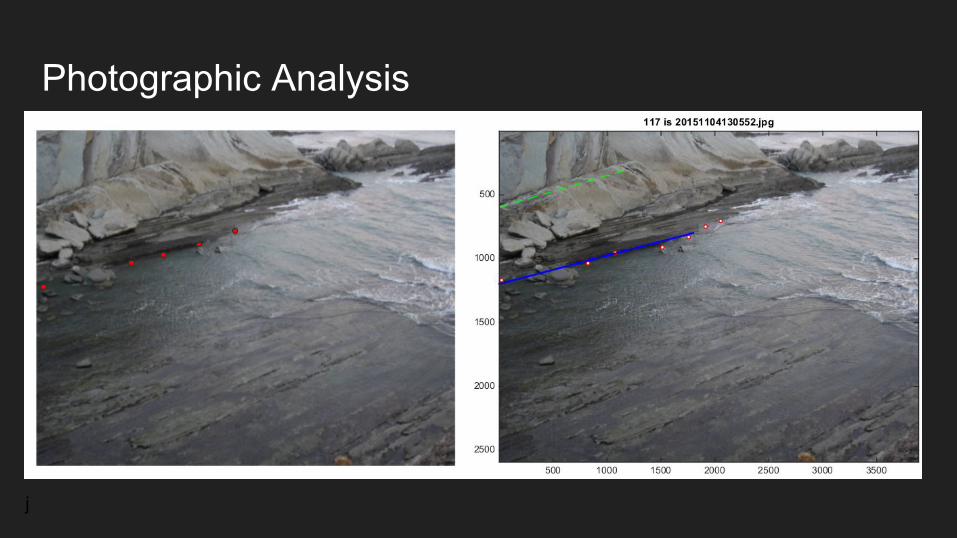
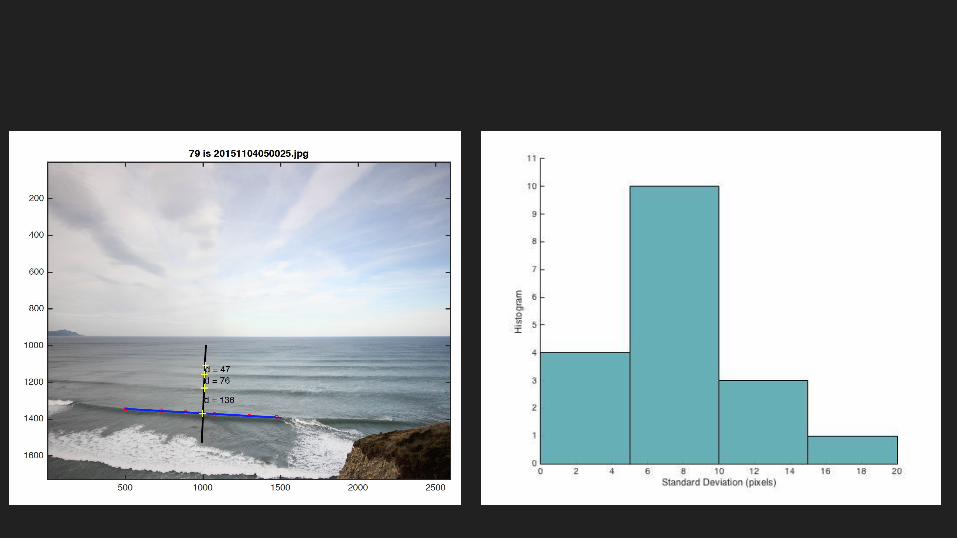
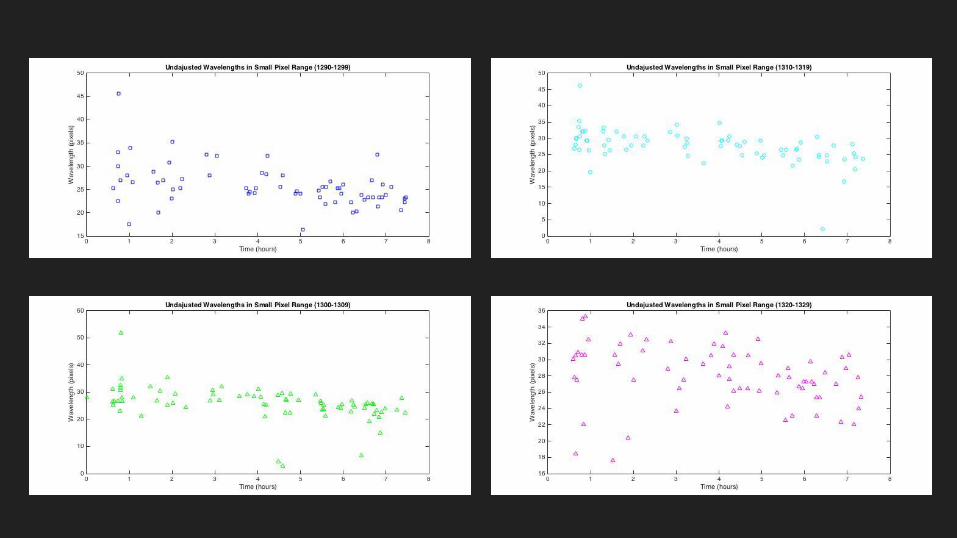
Photographic Analysis
j
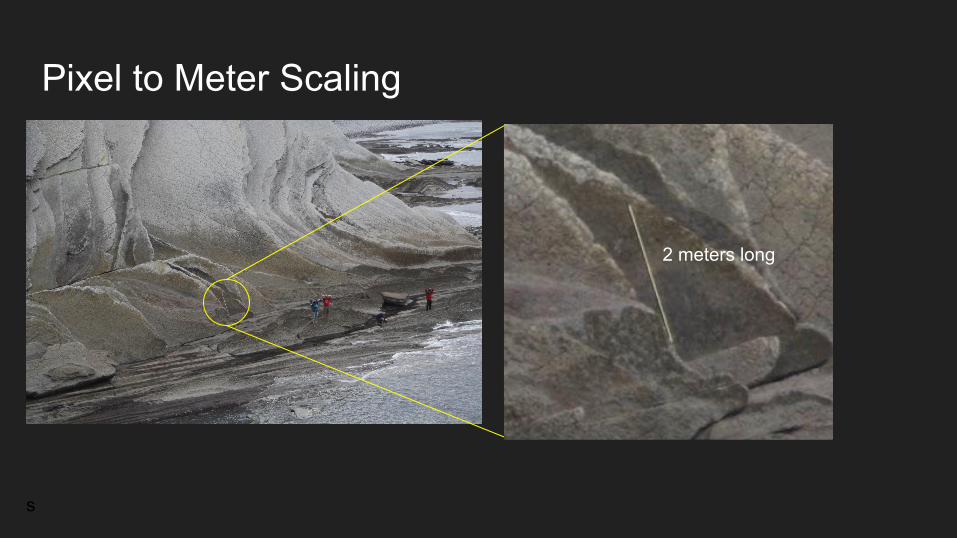
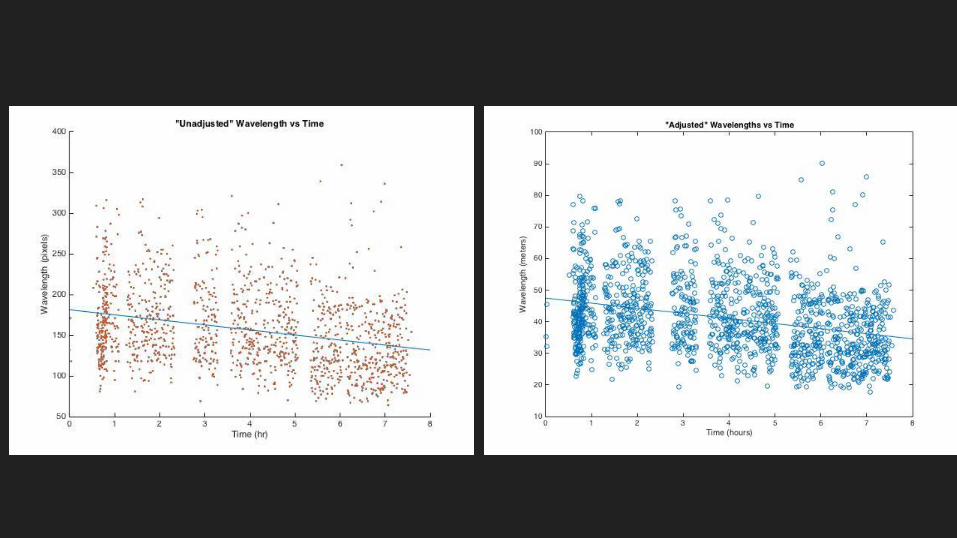
Pixel to Meter Scaling
2 meters long
s
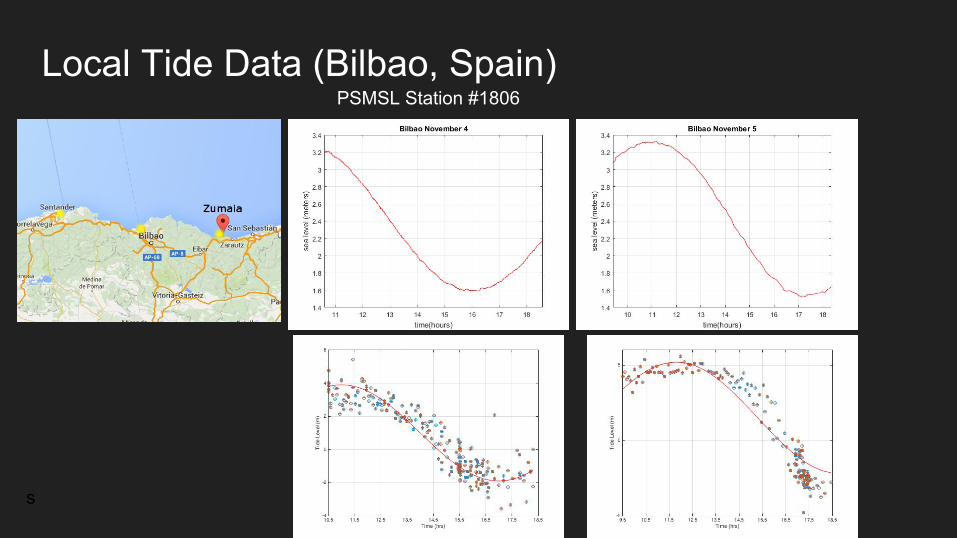
Local Tide Data (Bilbao, Spain)
s
PSMSL Station #1806
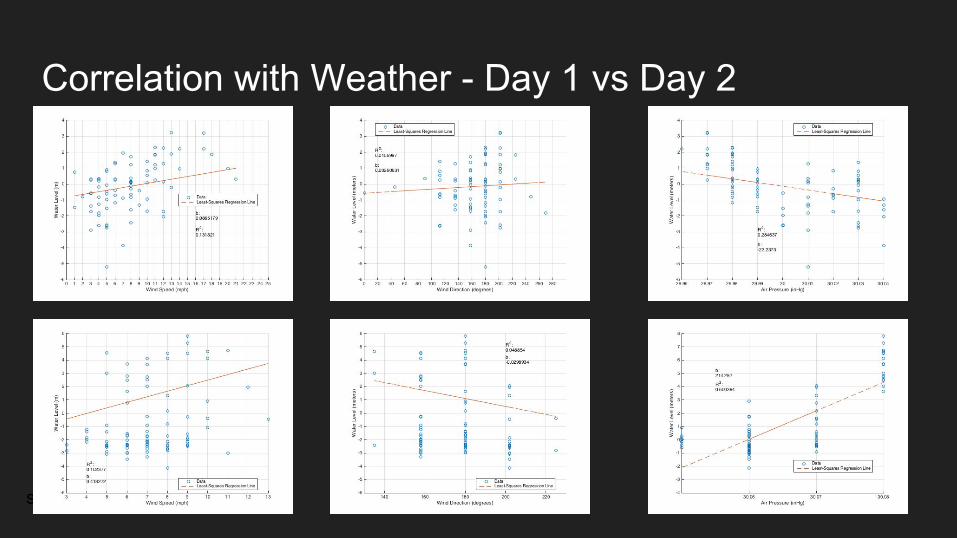
Correlation with Weather - Day 1 vs Day 2
s
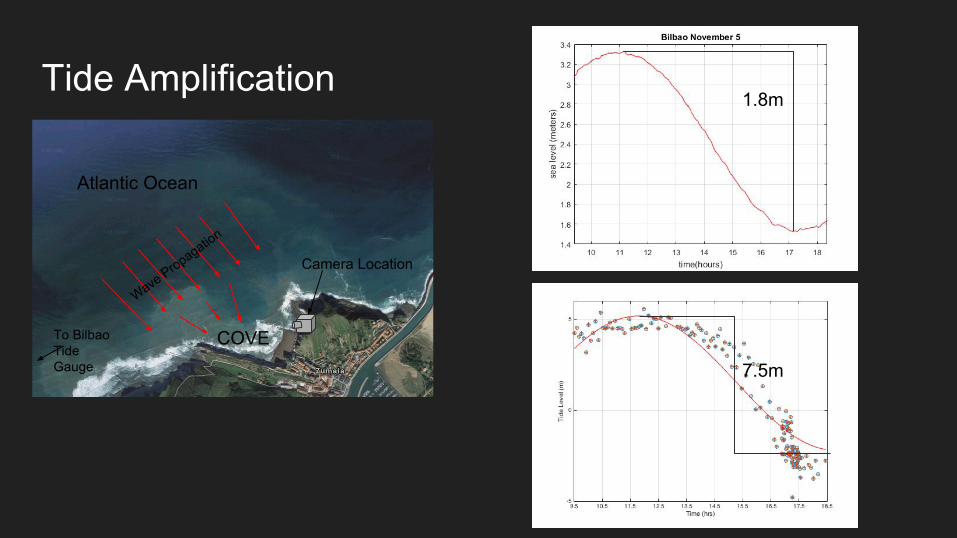
Tide Amplification
COVE
Atlantic Ocean
Wave Propagation
To Bilbao Tide Gauge
Camera Location
1.8m
7.5m
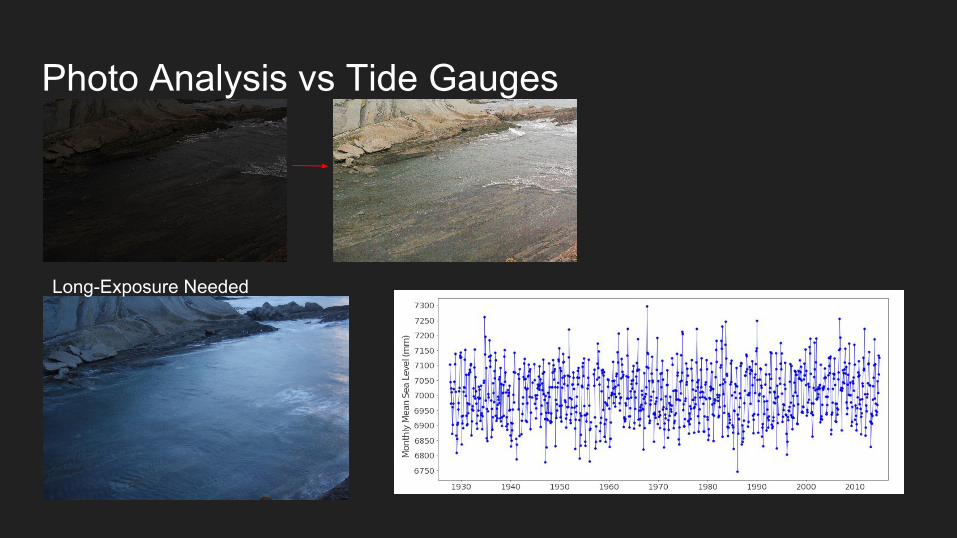
Photo Analysis vs Tide Gauges
Long-Exposure Needed
Conclusions● High and low tide measurements were off● Tide amplification caused larger range● Our wind speed and tide level reveals positive correlation ● However, air pressure data and tide level data is flawed● Tide gauges are more accurate
s

AcknowledgementsThank you to
Professor Frederik Simons and Professor Adam Maloof
Akshay Mehra and Chris Harig