Embed Size (px)
Citation preview

Wax Based Emulsions For Use In
Lipstick Application
By
Akash Beri
A thesis submitted to
The University of Birmingham
for the degree of
DOCTOR OF ENGINEERING
School of Chemical Engineering
College of Physical and Engineering Sciences
The University of Birmingham
February 2015

University of Birmingham Research Archive
e-theses repository This unpublished thesis/dissertation is copyright of the author and/or third parties. The intellectual property rights of the author or third parties in respect of this work are as defined by The Copyright Designs and Patents Act 1988 or as modified by any successor legislation. Any use made of information contained in this thesis/dissertation must be in accordance with that legislation and must be properly acknowledged. Further distribution or reproduction in any format is prohibited without the permission of the copyright holder.

I
Abstract
Water-in-oil emulsions have the potential to eradicate drying of the lips caused by
constant lipstick application by improving moisturising properties and delivering
hydrophilic molecules to the lips.
To conduct this research, a food microstructure approach was utilisied developing
emulsion structures’ using either a batch or continuous process and monitoring the
affect these structures had on physical and material properties. The lubricating
properties of emulsions structures were then compared to a trained sensory panel.
Finally the release behaviour of a moisturising agent was investigated.
It was shown that the ingredients used to produce the microstructure are pivotal in
indicating the melting profile, droplet size and material properties of the final structure.
Specifically, when an aqueous phase is incorporated within a hard shell the elastic
modulus increases as the aqueous phase become part of the wax network. The effect of
lubrication showed that friction coefficient of a solid emulsion could be related to how
smooth a lipstick would be perceived based on the Kokani Model. Finally, it was shown
that the release of a moisturising agent is governed by the droplet size and the amount
of destruction caused to the wax network.
II
Acknowledgements
Firstly I would like to thank my academic supervisor Prof. Ian Norton for all his
help and guidance throughout the EngD scheme, in particular the constant motivation he
provided. I would also like to thank Dr Richard Greenwood for his constant
encouragement, especially during the write up stage.
Within Alliance Boots, I would like to thank both Sonja Clarke and William
O’Leary for their devotion to this project, constant support and useful discussion in
developing a cosmetic product. I would also like to thank Angela Morgan and the
sensory team for their support in running a trained sensory panel and conducting the
sensory analysis for this thesis.
Within the University of Birmingham, I would like to thank the entire
Microstructure group for their constant guidance and support, in particular Dr Roman
Pichot, Dr Jennifer Norton, Dr Thomas Mills and Dr Ben Le Reverend. I would also
like to thank Dr Richard Watson for proof reading my thesis and for helpful
suggestions. Finally I would like to thank all the support staff, particularly John Hooper,
Lynn Draper, Kathleen Haynes and Bob Sharp.
My gratitude goes to the EPSRC for this funding opportunity which has allowed this
work to be conducted.
I would like to thank all my friends from the University of Birmingham for all the
great memories that we have generated in our times together.
Last but not least, I would thank my wonderful family, Ashok, Sumita, Sanjeev,
Chaya and Joanne Beri for all their encouragement throughout the EngD. Without your
support this would not have been possible.

III
Table of Contents
Abstract .............................................................................................................................. I
Acknowledgements ........................................................................................................... I
Table of Contents ........................................................................................................... III
List of Figures ................................................................................................................ VII
List of Tables ................................................................................................................. XX
Nomenclature............................................................................................................. XXIII
Chapter 1. Introduction ................................................................................................ 1
1.1 Background ........................................................................................................ 2
1.2 Objectives .......................................................................................................... 4
1.3 Relevance to Alliance Boots .............................................................................. 5
1.4 Thesis Layout ..................................................................................................... 6
Chapter 2. Literature Review ....................................................................................... 8
2.1 Introduction ........................................................................................................ 9
2.2 Emulsions ........................................................................................................... 9
2.2.1 Emulsification ............................................................................................. 9
2.3 Emulsion Instability ......................................................................................... 11
2.3.1 Creaming/Sedimentation .......................................................................... 12
2.3.2 Flocculation .............................................................................................. 13
2.3.3 Ostwald Ripening ..................................................................................... 14
2.3.4 Coalescence .............................................................................................. 15
2.4 Emulsion Stabilisation ..................................................................................... 19
2.4.1 Electrostatic Stabilisation ......................................................................... 19
2.4.2 Polymeric Stabilisation ............................................................................. 20
2.4.3 Fat Particles in Emulsion Stability ........................................................... 22
2.4.4 Emulsifiers ................................................................................................ 23
2.5 Crystal Networks ............................................................................................. 25
2.5.1 Lipid Composition .................................................................................... 25
2.5.2 Processing Conditions .............................................................................. 27
2.5.3 Crystal Structures ..................................................................................... 28
2.5.4 Links between Crystal Network and Macroscopic Properties ................. 31
2.6 Material Properties ........................................................................................... 33
2.6.1 Hooke’s law .............................................................................................. 33
IV
2.6.2 Stress-strain Relationships ........................................................................ 33
2.7 Tribology ......................................................................................................... 39
2.7.1 Analysing Friction .................................................................................... 40
2.7.2 Sensory Perception and Tribology ........................................................... 41
2.8 Controlled Release from Colloidal Structures ................................................. 43
2.8.1 Release via Diffusion................................................................................ 43
2.8.2 Release in Application .............................................................................. 45
Chapter 3. Materials and Methodology ...................................................................... 46
3.1 Introduction ...................................................................................................... 47
3.2 Materials .......................................................................................................... 47
3.2.1 Waxes and Emulsifiers ............................................................................. 47
3.2.2 Tribometer Surfaces ................................................................................. 47
3.3 Sample Formation ............................................................................................ 48
3.3.1 Wax/Oil Blends ........................................................................................ 48
3.3.2 Emulsions ................................................................................................. 48
3.3.3 Tribology Set-Up ...................................................................................... 52
3.3.4 Release Experiments (Chapter 7) ............................................................. 53
3.4 Analytical Method ........................................................................................... 59
3.4.1 DSC (Chapter 4) ....................................................................................... 59
3.4.2 NMR (Chapter 4, 5, 6 and 7) .................................................................... 64
3.4.3 Interfacial Tension (Chapter 4)................................................................. 70
3.4.4 Microscopy (Chapter 4, 5 and 6) .............................................................. 71
3.4.5 Gravimetric Analysis (Chapter 4)............................................................. 73
3.4.6 Texture Analysis (Chapter 5, 7) ............................................................... 73
3.4.7 Rheology (Chapter 5 and 6)...................................................................... 78
3.4.8 Tribometer (Chapter 6) ............................................................................. 83
3.4.9 Sensory Evaluation – Quantitative descriptive analysis (QDA) (Chapter
6) 84
3.4.10 Fourier Transformer Infra Red (FT-IR) Spectroscopy (Chapter 7) .......... 86
Chapter 4. Designing Wax Based Emulsions for use in Lipstick Application .......... 87
4.1 Introduction ...................................................................................................... 88
4.2 Results and Discussion .................................................................................... 88
4.2.1 Emulsions ................................................................................................. 88
4.2.2 Designing Melting Profiles for Lipstick Application ............................. 105

V
4.2.3 Long term Stability of Emulsions for Lipstick Application ................... 113
4.3 Concluding Remarks ...................................................................................... 116
Chapter 5. Manipulating material properties of wax based emulsion systems for use
in lipstick application ................................................................................................... 117
5.1 Introduction .................................................................................................... 118
5.2 Results and Discussion .................................................................................. 119
5.2.1 Effect of Wax concentrations on Material Properties ............................ 119
5.2.2 Effect of Incorporating Water on Material Properties ............................ 123
5.2.3 Effect of a continuous process ................................................................ 131
5.3 Concluding Remarks ...................................................................................... 145
Chapter 6. Use of a dynamic tribological technique for investigating the lubricating
properties of solid wax based emulsion systems with a sensory comparison .............. 147
6.1 Introduction .................................................................................................... 148
6.2 Results and Discussion .................................................................................. 149
6.2.1 Tribology ................................................................................................ 149
6.2.2 Sensory ................................................................................................... 174
6.2.3 Comparison between Tribology and Sensory ......................................... 179
6.3 Concluding Remarks ...................................................................................... 182
Chapter 7. Release of Glycerol from Wax Based Emulsion Systems for possible use
in a Lipstick Application .............................................................................................. 183
7.1 Introduction .................................................................................................... 184
7.2 Results and Discussion .................................................................................. 185
7.2.1 Release under Quiescent conditions ....................................................... 185
7.2.2 Release under compression .................................................................... 195
7.3 Concluding Remarks ...................................................................................... 201
Chapter 8. Conclusions and Future Recommendation ............................................. 202
8.1 Designing Emulsion Structures ..................................................................... 204
8.2 Manipulating Material Properties .................................................................. 205
8.3 Tribology of Wax Based Systems.................................................................. 207
8.4 Release Behaviour of Glycerol ...................................................................... 208
8.5 Future Work ................................................................................................... 209
Appendices ................................................................................................................... 212
Appendix 1 ................................................................................................................ 213
Appendix 2 ................................................................................................................ 214

VI
Appendix 3 ................................................................................................................ 215
Appendix 4 ................................................................................................................ 216
References .................................................................................................................... 219

VII
List of Figures
Figure 1.1 – Schematic for Microstructural approach (adapted from Norton and Norton (2010). 2
Figure 1.2 – Pie chart of the UK colour cosmetics market divided into company retail market
share (%)(taken from Mintel, 2012) ..................................................................................... 5
Figure 2.1 – Schematic representing both creaming and sedimentation ..................................... 13
Figure 2.2 – Schematic representing flocculation ....................................................................... 14
Figure 2.3 - Schematic representation of Ostwald Ripening ....................................................... 14
Figure 2.4 - Schematic of Coalescence ....................................................................................... 15
Figure 2.5 – Schematic representation of physiochemical processes involved when two droplets
approach one another. Where τFD – film disruption time, τCoag – coagulation time, τFT –
film thinning time and τEnc – encounter time (Image adapted from McClements (2005)). 16
Figure 2.6 - Suggested interaction mechanism between SPI + SSPS complexes in the prescense
of NaCl (taken from Tran and Rousseau, 2013) ................................................................. 20
Figure 2.7 - Schematic of Steric Stabilisation ............................................................................. 21
Figure 2.8 - Schematic of Depletion Stabilisation ...................................................................... 22
Figure 2.9 - Schematic of Pickering stabilisation ........................................................................ 22
Figure 2.10 - Factors affecting macroscopic properties of fat networks (Image adapted from
Narine and Marangoni (1999a)). ........................................................................................ 25
Figure 2.11 – Stacking Possiblities for triacylgylcerol in fat crystals where the letter L
represents fatty acid chain length (Image adapted from Marangoni and Wesdrop (2012)) 26
Figure 2.12 - Examples of the structure of different polymorphs in triacylglycerols (taken from
Sato 2001) ........................................................................................................................... 29
Figure 2.13 – Free Energy of activation Vs free energy of formation for the nucleation of
different polymorphic forms of fat (taken from Marangoni, 2002) .................................... 30
Figure 2.14 Schematic of a typical true stress/true strain curve obtained during uni axial
compression (taken from (Norton et al., 2011). ................................................................. 36

VIII
Figure 2.15 – Typical amplitude sweep (stress from 0.1 – 1000 Pa) curve at a frequency of 1 Hz
............................................................................................................................................ 38
Figure 2.16 Schematic representation of sliding stage (adapted from Luengo et al. (1997)) ..... 40
Figure 3.1– Schematic representation of (a) the scraped surface heat exchanger (SSHE) and (b)
the pin stirrer (PS). Key dimensions are labeled. This Figure shows the inlets and outlets
(represented with arrows) of both the cavity and jacket. .................................................... 50
Figure 3.2 – Schematic representation of experimental set-up used for continuous process
experiments where (1) is scrape surface heat exchanger (SSHE) and (2) SSHE and pin
stirrer. ................................................................................................................................. 51
Figure 3.3 – Schematic representation of the two experimental set ups used in this study. ....... 54
Figure 3.4 - FT-IR spectra (940-1160 cm-1
) of varying glycerol concentrations. ....................... 56
Figure 3.5 - Calibration Curve for all glycerol concentrations ................................................... 56
Figure 3.6 – 3D geometry used with COMSOL. Dimensions match those used in experimental
work. Sample is located at the top and is equivalent to 30 g. Water (200 ml) is located on
the bottom. .......................................................................................................................... 57
Figure 3.7 – Stress strain curves for an emulsion containing 30 % aqueous phase (50:50 mix of
glycerol: water). Tests were performed at a constant rate of 1 mm/s to a strain of 90 %. .. 58
Figure 3.8 - Schematic of Power compensated DSC .................................................................. 59
Figure 3.9 - Graph of Heat Flow Vs Temperature (where Tg - glass transition temperatue, Tc -
crystillisation temperature and Tm - melting temperature) ................................................ 61
Figure 3.10 – Melting Profile curve for (a) 100 wt % carnauba wax and (b) 100 wt %
microcrystalline wax. The samples were heated at a rate of 10 °C/min. ............................ 63
Figure 3.11 – Examples of effect of radio frequencies pulses on rotating frame in the direction
of vector M where (a) open position after a 90° pulse and (b) closed position after a 180°
pulse (Image taken from Bruker Minispec mq Droplet size manual)................................. 65
Figure 3.12 – Schematic of the movement of protons after Hahn spin echo sequence is applied
where (a) is a 90 pulse (b) protons start to fan out after a magnetic field is applied (c) all

IX
signals rotate 180° after a 180° pulse and (d) the protons refocus and the fan closes (Image
taken from Bruker Minispec mq Droplet size manual). ..................................................... 66
Figure 3.13 – Hahn Spin Echo sequence with field gradient pulses (adapted from Bruker
Minispec mq Droplet size manual). .................................................................................... 67
Figure 3.14 – Graph of R (Mg/Mo) Vs time between field gradient pulses (Δ) for (a) unrestricted
and (b) restricted diffusion (Image taken from Bruker Minispec mq Droplet size manual).
............................................................................................................................................ 68
Figure 3.15 – Schematic of a modified Hahn spin echo sequence for measuring W/O emulsions.
Where the 180 pulse- τo sequence (prevents the oil proton signal being received), G -
Gradient strength, δ – gradient duration, Δ - time between gradient pulses and E –the echo
(otherwise known as Mg) (Image modified from Van Duynhoven et Al., 2007) ............. 69
Figure 3.16 – Cryo SEM image of an acrylic latex particle (taken from Ge et al., 2006) .......... 72
Figure 3.17 – Schematic representation of (a) penetration depth, (b) 3 point bend test and (c)
compression testing. ........................................................................................................... 74
Figure 3.18 - Typical True Stress (MPa) vs True strain curves for bulk oil formulations, where
(a) is 10 % carnauba wax (CW) in castor oil (CO), for measurement 1 ( ) and
measurement 2 ( ), and (b) is 5 % microcrystalline wax (MW) and 5 % CW was in CO
( ) and 10 % MW and 5 % CW was in CO ( ). All samples were melted and stirred using
a magnetic stirrer until molten (~ 30-40 minutes) and then cooled quiescently in the
freezer till solid then measured at a compression rate of 1 mm/s at 32 °C. ........................ 77
Figure 3.19 – Schematic of cone and plate geometry (taken from Bohlin-Instruments , 1994) . 79
Figure 3.20 – Schematic of parallel plate geometry (taken from Bohlin-Instruments , 1994) .... 80
Figure 3.21 – Schematic of cup and bob geometries (taken from Bohlin-Instruments , 1994) .. 80
Figure 3.22 – Typical frequency sweep (0.1 – 100 Hz) curve at a controlled stress (within the
linear viscoelastic region). .................................................................................................. 82
Figure 3.23 – Schematic representation of a tribological set up, with a stainless steel ball and an
elastomer disk (with a solid wax/emulsion disk attached). ................................................ 83

X
Figure 4.1 Mean droplet diameter (d3,2, μm) of 10% water W/O emulsions, as measured by
NMR restricted diffusion on day of emulsification, as a function of emulsifier
concentration for sorbitan olivate ( ), monoolein ( ), monostearate ( ) and PGPR ( ).
............................................................................................................................................ 91
Figure 4.2 – Interfacial tension measurements for different emulsifiers in a model system (no
wax). All samples contained 2% emulsifier. ...................................................................... 93
Figure 4.3 - Cyro-SEM micrographs of water droplets surrounded by a hydrophobic continuous
phase where (a) is 10 % aqueous phase with 2 % PGPR and (b) 40 % aqueous phase with
2 % PGPR. .......................................................................................................................... 95
Figure 4.4 - Crystallisation and melting curve for an solution containing 5 % CW and 10 % MW
in 85% castor oil obtained via Differential Scanning Calorimeter (Perkin Elmer DSC
Series 7, UK), equipped with thermal analysis software (Pyris) at a scan rate of 10 °C/min
from 120C to 10 °C. ...................................................................................................... 97
Figure 4.5 - Average droplet size (d3,2) measured by NMR on the day of emulsion formation (10
% W/O where the continuous phase consists of 5 wt % CW, 10 wt % MW in castor oil)
using SSHE unit as a function of exit temperature under varying processing conditions:
Residence time (RT) of 81.5 s , 40.7 s and 27.2 s; Impeller rotational velocity of
500 rpm (open symbols) and 1500 rpm (full symbols). ..................................................... 98
Figure 4.6 - Polarised Microscopy of W/O emulsions formed using a SSHE at an IV of 1500rpm
and (a) Tj = 55C and FR = 30 mL/min, (b) Tj = 65C and FR = 90 mL/min and (c) Tj =
80C and FR = 90 mL/min. The bar represents 50 m. ................................................... 101
Figure 4.7 - Droplet size (d3,2) measured by NMR on the day of emulsion formation (10 % W/O
where the continuous phase consists of 5 wt % CW, 10 wt % MW in castor oil) using
SSHE and PS units as a function of exit temperature. Processing conditions for the PS
unit; IV = 500 rpm, IV = 1000 rpm and IV = 1500 rpm. All emulsions were first
passed through a SSHE ( ) at a Jacket temperature of 65 °C and an IV of 1500 rpm. The
overall flow rate though both units was 60 mL/min. ........................................................ 103

XI
Figure 4.8 - Droplet size (d3,2) measured by NMR on the day of emulsion formation (10 % W/O
where the continuous phase consists of 5 wt % CW, 10 wt % MW in castor oil) using
SSHE and PS units as a function of exit temperature. Processing conditions for the PS
unit; IV = 500 rpm, IV = 1000 rpm and IV = 1500 rpm. All emulsions were first
passed through a SSHE ( ) at a Jacket temperature of 65 °C and an IV of 500 rpm. The
overall flow rate though both units was 60 mL/min. ........................................................ 104
Figure 4.9 – Melting profiles curves for oil phase formulations containing various ratios of
carnauba wax (CW) in castor oil (CO). The sample was heated at a rate of 10 °C/ min. 106
Figure 4.10 - DSC curves for castor oil. The sample was heated at a rate of 10 °C/ min. ........ 107
Figure 4.11 - Melting profiles curves for oil phase formulations containing various ratios of
microcrystalline wax (MW) in castor oil (CO) . The sample was heated at a rate of 10 °C/
min. ................................................................................................................................... 108
Figure 4.12 - Melting profiles curve for a commercially available moisturising lipstick from the
Boots range. The sample was heated at a rate of 10 °C/ min. .......................................... 109
Figure 4.13 – Melting profiles for oil phase formulations containing various ratios of
microcrystalline wax (MW) in castor oil (CO) with 5 % carnauba wax (CW). All samples
were measured using a DSC scan range from 10 to 120 °C at a rate of 10 °C / min. ...... 110
Figure 4.14 - Melting profiles for emulsions containing various aqueous phase volumes where
the continuous phase in castor oil (CO) with 5 % carnauba wax (CW). All samples were
measured using a DSC scan range from 10 to 120°C at a rate of 10°C / min. ................. 112
Figure 5.1 – Bulk Modulus, Young’s Modulus (MPa) and Point of Fracture (MPa) of varying
carnauba wax concentrations in castor oil. All samples were melted and stirred using a
magnetic stirrer until molten (~ 30-40 minutes) and cooled quiescently in the freezer until
solid then measured at a compression rate of 1 mm/s at 32 °C. ....................................... 121
Figure 5.2 - Dependence of Young’s Modulus on carnauba wax (CW) concentration (wt %).
The solid line is a fit to represent the power law dependence. ......................................... 121
Figure 5.3 - Young’s Modulus (MPa), point of Fracture (MPa) and Bulk modulus (MPa) of wax
blends containing 5 – 20 % microcrystalline wax and 5 % carnauba wax in castor oil. All

XII
samples were melted and stirred using a magnetic stirrer until molten (~ 30-40 minutes)
and cooled quiescently in the freezer until solid then measured at a compression rate of 1
mm/s at 32 °C. .................................................................................................................. 123
Figure 5.4 - Young’s Modulus, Point of Fracture and Bulk modulus (MPa) of emulsions
containing 2 wt % PGPR (overall weight %) as a function of aqueous phase volume (10 –
40 wt %), where the continuous phase contains 5 % carnauba wax and 10 %
microcrystalline wax in castor oil. All emulsions were produced using a Silverson high
shear mixer (for 5 minutes and at ~10,000 rpm) and cooled quiescently in the freezer until
solid and measured with a compression rate of 1 mm/s at 32 °C. .................................... 125
Figure 5.5 - Young’s modulus, Point of Fracture and Bulk modulus (MPa) of emulsions
containing 2 wt % PGPR (overall weight %) as a function of aqueous phase volume (10 –
40 wt %) where the continuous phase contains 5 % carnauba wax and 10 %
microcrystalline wax, and either (a) 5 % performalene or (b) 5 % paraffin. All emulsions
were produced using a Silverson high shear mixer and cooled quiescently in the freezer
until solid then measured at a compression rate of 1 mm/s at 32 °C. ............................... 127
Figure 5.6 - G’ (MPa)) as a function of aqueous phase volume for emulsions containing 2wt%
PGPR, where the continuous phase contains 5 % carnauba wax (CW) and 10 %
microcrystalline wax (MW) ( ), and either 5 % paraffin (P) ( ) or 5 % performalene (PF)
( ) in castor oil. All emulsions were produced using a Silverson high shear mixer and
cooled quiescently in the freezer until solid and measured via oscillation rheology. G’
value taken at a strain of 1.4 x 10^-5
and a frequency of 5 Hz. ......................................... 130
Figure 5.7 - G’’ as a function of aqueous phase volume for emulsions containing 2wt% PGPR,
where the continuous phase contains 5 % carnauba wax (CW) and 10 % microcrystalline
wax (MW) ( ), and either 5 % paraffin (P) ( ) or 5 % performalene (PF) ( ) in castor oil.
All emulsions were produced using a Silverson high shear mixer and cooled quiescently in
the freezer until solid and measured via oscillation rheology. G’ value taken at a strain of
1.4 x 10⁻⁵
and a frequency of 5 Hz.................................................................................... 130

XIII
Figure 5.8 - Phase angle As a function of aqueous phase volume for emulsions containing 2wt%
PGPR, where the continuous phase contains 5 % carnauba wax (CW) and 10 %
microcrystalline wax (MW) ( ), and either 5 % paraffin (P) ( ) or 5 % performalene (PF)
( ) in castor oil. All emulsions were produced using a Silverson high shear mixer and
cooled quiescently in the freezer until solid and measured via oscillation rheology. ...... 131
Figure 5.9 - Bulk modulus and point of fracture as a function of exit temperature for 10 % W/O
emulsions (where the continuous phase consisted of 5% CW and 10% MW and 5% P in
castor oil) passed through the SSHE only ((a) and (b)) and both the SSHE (IV = 500 rpm)
and PS ((c) and (d)), at various shaft speeds. Flow rate was fixed at 60 mL/min. All
samples were cooled quiescently in a freezer until solid then tested with a compression
rate of 1 mm/s at 32°C. ..................................................................................................... 135
Figure 5.10 - Elastic modulus G’ as a function of exit temperature for 10 % water-in-oil
emulsions (where the continuous phase consisted of 5% CW and 10% MW in castor oil).
All samples produced using various processing conditions ( is 30 mL/min, is 60
mL/min and is 90 mL/min; shaft speed was adjusted at either 500 rpm (open symbols)
or 1500 rpm (full symbols)). All samples were produced using a SSHE unit and cooled
quiescently in the freezer till solid and measured via oscillation rheology and G’ taken at a
frequency of 5 Hz. ............................................................................................................ 137
Figure 5.11 - Elastic modulus of 10 % W/O emulsions (where the continuous phase consisted
of 5% CW and 10% MW in castor oil) formed at various temperatures in the SSHE unit as
a function of (a) droplet diameter ( is a flow rate of 30 mL/min, 60 mL/min and is
90 mL/min; shaft speed was adjusted at either 500 rpm (open symbols) or 1500 rpm (full
symbols)). All samples were produced using a SSHE and cooled quiescently in the freezer
till solid and measured via oscillation rheology and G’ taken at a frequency of 5 Hz. .... 138
Figure 5.12 - Elastic modulus G’ as a function of exit temperature for continuous phase only
(consisting of 5% CW and 10% MW in castor oil). All samples produced using various
processing conditions ( is 30 mL/min, is 60 mL/min and is 90 mL/min; shaft speed
was adjusted at either 500 rpm (open symbols) or 1500 rpm (full symbols)). All samples

XIV
were produced using a SSHE unit and cooled quiescently in the freezer till solid and
measured via oscillation rheology and G’ taken at a frequency of 5 Hz. ......................... 140
Figure 5.13 - Elastic modulus G’ as a function of exit temperature for “emulsions” made with
10 % glass balontini beads instead of water. Continuous phase consisted of 5% CW and
10% MW in castor oil)All samples produced using various processing conditions ( is 30
mL/min, is 60 mL/min and is 90 mL/min with a shaft speed of 500 rpm. All
samples were produced using a SSHE unit and cooled quiescently in the freezer till solid
and measured via oscillation rheology and G’ taken at a frequency of 5 Hz. .................. 141
Figure 5.14 - Elastic modulus of 10 % W/O emulsions (where the continuous phase consisted of
5% CW and 10% MW in castor oil) formed at various temperatures in the SSHE unit as a
function of flow rate. All samples were produced using a SSHE and cooled quiescently in
the freezer till solid and measured via oscillation rheology and G’ taken at a frequency of 5
Hz. .................................................................................................................................... 142
Figure 5.15 - Elastic Modulus (G’) as a function of exit temperature under varying processing
conditions ( – SSHE only, -SSHE and PS (impeller velocity (IV) of 1500 rpm, -
SSHE and PS (IV of 1000 rpm) and – SSHE and PS (IV of 500 rpm) All 10 % W/O
emulsions (where the continuous phase consisted of 5% CW, 10% MW and 5% P in castor
oil) passed through a SSHE at a Jacket temperature of 65 C and an IV of 500 rpm with an
overall flow rate of 60 ml /min. They were then passed through a PS and cooled
quiescently in the freezer until solid and measured via oscillatory rheology and G’ taken at
a frequency of 5 Hz. ......................................................................................................... 144
Figure 5.16 - Polarised Microscopy of W/O emulsions which have passed through; (a) SSHE
only, (b) SSHE and PS (Impeller velocity (IV) – 1500 rpm and a jacket temperature (JT)
of 55 °C) and (c) SSHE and PS (IV – 500 rpm and JT 80 °C). All utilise a flow rate of 60
ml/min .............................................................................................................................. 145
Figure 6.1 – (a)Friction coefficient and (b) wear vs time for a wax blend (5 wt % carnauba wax
and 10 wt % microcrystalline wax in castor oil) at varying disk speeds. All experiments
were conducted in a pin-on disk set up with a load of 0.5 N. ........................................... 151

XV
Figure 6.2 – Number of revolutions (required to produce a thin film) vs disk speed (mms-1
). All
experiments were conducted in a pin-on disk set up with a load of 0.5 N. All experiments
were conducted on a wax blend (5 wt % carnauba wax and 10 wt % microcrystalline wax
in castor oil) ...................................................................................................................... 152
Figure 6.3 - (a) Friction coefficient and (b) wear vs time for a wax blend (5 wt % carnauba wax
and 10 wt % microcrystalline wax in castor oil) at varying normal forces. All experiments
were conducted in a pin-on disk set up with a disk speed of 10 mms-1
. ........................... 154
Figure 6.4 – Visual representation of before and after a sample has experienced a load (0.5 N)
and a disk speed (10 mms-1
) for samples containing either >15 wt % or <15 wt % in castor
oil. ..................................................................................................................................... 156
Figure 6.5 Typical True stress (MPa) vs True Strain curves for (a) 10 wt % and (b) 15 wt %
carnauba wax in castor oil. ll samples were melted and stirred until molten ( 30 – 40
min) and cooled quiescently in the freezer until solid. They were then compressed at a rate
of 1 mms-1
at 32 °C. .......................................................................................................... 157
Figure 6.6 – Friction coefficient vs time for a varying carnauba wax concentrations in castor oil.
All experiments were conducted in a pin-on disk set up with a load of 0.5 N and a disk
speed of 10 mms-1
. ............................................................................................................ 158
Figure 6.7 – Wear vs time for a varying carnauba wax concentrations in castor oil. All
experiments were conducted in a pin-on disk set up with a load of 0.5 N and a disk speed
of 10 mms-1
. ........................................................................................................... 158
Figure 6.8 – Average time take taken to wear to a thin film ( ) and elastic modulus (G’) ( ) vs
wt % of carnauba wax. amples produced for rheology were produced by melting and
stirring until molten ( 30 – 40 min) and cooled quiescently in the freezer until solid. The
G’ was then measured using oscillatory rheology and taken from a frequency of 5 Hz. . 160
Figure 6.9 – Friction coefficient vs time for a varying microcrystalline wax (MW)
concentrations in castor oil (each sample contained 5 wt % carnauba wax). All
experiments were conducted in a pin-on disk set up with a load of 0.5 N and a disk speed
of 10 mms-1
. ...................................................................................................................... 161

XVI
Figure 6.10 - Average time taken to wear to a thin film ( ) and elastic modulus (G’) ( )vs wt %
of microcrystalline wax. amples produced for rheology were produced by melting and
stirring until molten ( 30 – 40 min) and cooled quiescently in the freezer until solid. The
G’ was then measured using oscillatory rheology and taken from a frequency of 5 Hz. . 162
Figure 6.11 - Friction coefficient vs time for a varying (a) paraffin and (b) performalene
concentrations in castor oil (each sample contained 5 wt % carnauba wax and 10 wt %
microcrystalline wax). All experiments were conducted in a pin-on disk set up with a load
of 0.5 N and a disk speed of 10 mms-1
............................................................................. 164
Figure 6.12 - Average time take taken to wear to a thin film ( ) and elastic modulus (G’) ( ) vs
wt % of (a) paraffin and (performalene). Samples produced for rheology were produced
by melting and stirring until molten ( 30 – 40 min) and cooled quiescently in the freezer
until solid. The G’ was then measured using oscillatory rheology and taken from a
frequency of 5 Hz. ............................................................................................................ 165
Figure 6.13 - Friction coefficient vs time for a varying aqueous phase volumes with 58 – 93 wt
% continuous phase (containing 5 wt % carnauba wax, 10 wt % microcrystalline wax and
5 wt % performalene in castor oil) and 2 wt % polyglycerol polyrinceoleate. All
emulsions were produced using a silverson high shear mixer (10,000 rpm for 5 minutes).
All experiments were conducted in a pin-on disk set up with a load of 0.5 N and a disk
speed of 10 mms-1
............................................................................................................. 167
Figure 6.14 - Average time take taken to wear to a thin film ( ) and elastic modulus (G’) ( ) vs
wt % Aq phase with 58 – 93 wt % continuous phase (containing 5 wt % carnauba wax, 10
wt % microcrystalline wax and 5 wt % performalene in castor oil) and 2 wt %
polyglycerol polyrinceoleate. amples produced for rheology were produced by melting
and stirring until molten ( 30 – 40 min) and cooled quiescently in the freezer until solid.
The G’ was then measured using oscillatory rheology and taken from a frequency of 5 Hz.
.......................................................................................................................................... 168
Figure 6.15 - Friction coefficient vs time for a varying droplet sizes. All samples were produced
using a Silverson high shear mixer (10,000 rpm for 5 minutes) and consist of 20 wt %

XVII
Aqueous phase, 78 – 79.8 wt % continuous phase (containing 5 wt % carnauba wax, 10 wt
% microcrystalline wax and 5 wt % performalene in castor oil) and 0.2 – 2 wt %
polyglycerol polyrinceoleate. All experiments were conducted in a pin-on disk set up with
a load of 0.5 N and a disk speed of 10 mms-1
................................................................... 170
Figure 6.16 - Friction coefficient vs time for a varying polyglycerol polyrinceoleate (PGPR)
concentrations. All samples were produced using a silverson high shear mixer (10,000 rpm
for 5 minutes) and consist of 20 wt % Aqueous phase, 78 – 79.5 wt % continuous phase
(containing 5 wt % carnauba wax, 10 wt % microcrystalline wax and 5 wt % performalene
in castor oil) and 0.5 – 2 wt % PGPR. All experiments were conducted in a pin-on disk set
up with a load of 0.5 N and a disk speed of 10 mms-1
...................................................... 171
Figure 6.17 – Effective viscosity of the dispersed phase with varying wt % of glycerol in
distilled water. All samples were measured at a constant shear rate (100 s-1
) using a 40 mm
acrylic cone and plate geometry (0.15 mm gap width) at a temperature of 32 °C ........... 173
Figure 6.18 - Friction coefficient vs time for a varying dispersed phase viscosities. All samples
were produced using a silverson high shear mixer (10,000 rpm for 5 minutes) and consist
of 20 wt % Aqueous phase (0- 50 wt % glycerol in water), 78 – 79.5 wt % continuous
phase (containing 5 wt % carnauba wax, 10 wt % microcrystalline wax and 5 wt %
performalene in castor oil) and 2 wt % PGPR. All experiments were conducted in a pin-on
disk set up with a load of 0.5 N and a disk speed of 10 mms-1
......................................... 174
Figure 6.19 – The sensory score at different attributes (where H – on hand and L – on lip) for
bench formulation (5, 10, 5 wt % of carnauba wax, microcrystalline wax and paraffin wax
in castor oil) and emulsions varying in aqueous phase volume (5 – 20 wt %) and PGPR
concentrations (0.2 + 2 wt %). Error bars indicate standard deviation. * indicates a
significant result (P < 0.05) and ** indicates a non significant result (P>0.05) at a 95 %
confidence interval. .......................................................................................................... 177
Figure 6.20 – Comparison of average drag score vs final friction final. Results taken from data
presented throughout this chapter. .................................................................................... 180

XVIII
Figure 6.21 – Comparison of drag score vs 1/ friction coefficient multiplied by applied load
(0.5N). .............................................................................................................................. 181
Figure 7.1 - Glycerol release over a period of time into 200 ml of water from 30 g of emulsion
at 3 different temperatures under quiescent conditions. Release was measured using FT-IR.
All emulsions contained 30 wt % aq phase (50:50 glycerol:water), 68 wt % castor oil and 2
wt % PGPR. ...................................................................................................................... 187
Figure 7.2 - Comparison of model output and experimental data for glycerol release over time
from 30 g emulsion samples at (a) 20 °C, (b) 32 °C and (c) 80 °C. All emulsions contained
30 wt % aq phase (50:50 glycerol:water), 68 wt % castor oil and 2 wt % PGPR. ........... 189
Figure 7.3 - Comparison of glycerol release of systems containing wax and no wax over time
(12 days) into 200 ml of water from a 30 g emulsion at three different temperatures: (a) 20
°C, (b) 32 °C and (c) 80 °C under quiescent conditions. Release was measured using FT-
IR. Emulsions contained 30 wt % aq phase (50:50 glycerol:water), 68 wt % continuous
phase (either castor oil or 5 wt % carnauba wax and 10 wt % microcrystalline wax in
castor oil) and 2 wt % PGPR. ........................................................................................... 192
Figure 7.4 - Comparison of glycerol release from systems with varying wax content over time
(10 days) into 200 ml of water from a 30 g emulsion at 32 °C. Release was measured using
FT-IR. ............................................................................................................................... 194
Figure 7.5 - Cyro-SEM micrograph of water/glycerol droplets trapped in a wax shell surrounded
by a hydrophobic continuous phase. Emulsion contained 30 % aquoues phase (50:50 mix
of water and glycerol), 68 % continuous phase (5 % carnauba wax, 10 % microcrystalline
wax and 85 % castor oil) and 2 % polyglycerol polyricinoleate. ..................................... 194
Figure 7.6 - Glycerol release over time (into 200ml of water) from 30g emulsions. Emulsions
were compressed at varying strains (7, 20 and 90 %) every 3 minutes over 21 minutes.
Emulsions contained 2 % PGPR. Release was measured using FT-IR. ........................... 196
Figure 7.7 - Glycerol release over time (into 200ml of water) from 30g emulsions. Emulsions
were compressed at varying strains (7, 20 and 90 %) every 3 minutes over 21 minutes.
Emulsions contained 1 % PGPR. Release was measured using FT-IR. ........................... 197

XIX
Figure 7.8 – Force Distance curves for emulsions at 7 % strain, using 1% polyglycerol
polyricinoleate samples. 30g cylindrical segments were compressed at 1 mm/s, to 7 % of
the original height, 7 times with 3 minute intervals. ........................................................ 198
Figure 7.9 – Cyro-SEM micrographs of water/glycerol droplets surrounded by a hydrophobic
continuous phase where (a), (b) and (c) consist of 15 % paraffin wax in castor oil and (d),
(e) and (f) consist of 5 % carnauba wax and 10 % microcrystalline wax in castor oil. All
samples were treated with 0, 5 or 15 minute etching times. ............................................. 200
Figure 0.1 - Bulk modulus (left) and point of fracture (right) as a function of exit temperature
for W/O emulsions passed both the SSHE (IV = 1500 rpm) and PS, at various shaft
speeds. Flow rate was fixed at 60 mL/min. All samples were cooled quiescently in a
freezer until solid then tested with a compression rate of 1 mm/s at 32°C....................... 214
Figure 0.2 Wear vs time for a varying microcrystalline wax concentrations in castor oil. All
experiments were conducted in a pin-on disk set up with a load of 0.5 N and a disk speed
of 10 mms-1
. ........................................................................................................... 215
XX
List of Tables
Table 3.1 – Definitions and application procedure provided to each panelist ............................ 85
Table 4.1 - Theoretical surface coverage values (m2/g) for emulsifiers used, calculated using
mean droplet size measured by NMR restricted diffusion (values of 23 μm, 25 μm and 5
μm were used for monoglycerides, sorbitan olivate and PGPR, respectively), and head
group size of the emulsifiers taken from (a) Choi, Lee, Kim and Kim (2007), (b) calculated
using ChemDraw (CambridgeSoft, UK) and (c) calculated from hydronamic radii of
PGPR taken from (Gunes et al., 2010). Amount of emulsifier required was then calculated
by dividing the total surface area (based on 30 % Water phase) by the surface coverage. 92
Table 4.2 Mean droplet diameter (d3,2, μm) measured by NMR restricted diffusion on day of
formation as a function of aqueous phase volume and PGPR concentration. Standard
deviation is of triplicate measurements. ............................................................................. 95
Table 4.3 - Effective viscosity of the oil continuous phase containing 5% CW and 10% MW in
castor oil as a function of the temperature, measured with a constant shear rate of 100 s-1
using a cone and plate geometry......................................................................................... 99
Table 4.4 – Melting range, theoretical and experimental melting enthalpies as a function of
carnauba wax concentrations. ........................................................................................... 106
Table 4.5 - Melting range, theoretical and experimental melting enthalpies as a function of
microcrystalline wax concentrations. ............................................................................... 108
Table 4.6 - Onset (Tonset), peak (Tpeak1 and Tpeak
2), and end (Tend) temperatures as a function of
microcrystalline wax concentration .................................................................................. 111
Table 4.7 Mean droplet diameter (d3,2, μm) measured by NMR restricted diffusion from day 0 to
day 180 for emulsions produced with varying PGPR concentrations (0.5, 1, 2 and 5wt%).
All emulsions contain 30 % water. ................................................................................... 113
Table 4.8 - Average water loss of emulsions (with 10 – 40 % aq phase volumes and varying
amounts of microcrystalline wax (MW) stored in three different storage conditions (room
temperature, 30 °C and cyclic (-10 – 40 °C) conditions. All samples also contain 5 %

XXI
carnauba wax as part of the continuous phase. All emulsions were made using a high shear
mixer at 10,000 rpm for 5 min. ......................................................................................... 115
Table 6.1 – Change in temperature within tribometer calculated from Equations 7.1 and 7.2 . 159
Table 6.2 – Final friction values (taken from Figure 6.13) vs aqueous phase volume. ............. 167
Table 6.3 - The sensory score at different attributes (where H – on hand and L – on lip) for
bench formulation (5, 10, 5 wt % of carnauba wax, microcrystalline wax and paraffin wax
in 80 wt % castor oil) and emulsions varying in aqueous phase volume (5 and 20 wt %)
and PGPR concentrations (0.2 and 2 wt %). Error indicates standard deviation. Results
represent least significant difference (L.S.D) data with differences from the bench (D.F.B)
.......................................................................................................................................... 178
Table 6.4 - The sensory score at different attributes (where H – on hand and L – on lip) for
comparison between large droplets ( 100 μm) and small droplets ( 3 μm). Emulsions were
comprised of an aqueous phase volume (20 wt %), PGPR concentrations (0.2 and 2 wt %)
and continuous phase (78 – 79.8 wt % which contained 5, 10, 5 wt % carnauba wax,
paraffin and microcrystalline wax in 80 wt % castor oil). Error indicates standard
deviation. Results represent least significant difference (L.S.D) data with differences
between large and small droplets...................................................................................... 179
Table 7.1 - Effective Diffusivities of glycerol at different temperatures in quiescent conditions.
Calculated assuming Fickian diffusion using a model from COMSOL linked to MATLAB.
.......................................................................................................................................... 190
Table 7.2 - Mean droplet diameter (d3,2, μm) measured by NMR restricted diffusion on day of
formation as a function of PGPR concentration. Standard deviation is of triplicate
measurements. .................................................................................................................. 196
Table 7.3 - Glycerol release over time (into 200 ml of water) from 30 g emulsions. Emulsions
were compressed (90% strain) and stored at 32 C for 12 days. Release was measured using
FT-IR. All emulsions contained 2 % PGPR and a continuous phase of 68 % (either: 5 %
carnauba wax and 10 % microcrystalline wax in castor oil or 15 % paraffin in castor oil).
.......................................................................................................................................... 199

XXII
Table 0.1 Mean droplet diameter (d3,2, μm) measured by NMR restricted diffusion from day 0 to
day 180 for emulsions produced with varying PGPR concentrations (0.5, 1, 2 and 5wt%).
All emulsions contain 10 % (Top), 20 % (Middle) and 40 % (Bottom) water. ................ 213
Table 0.2 – Outline of comments made during in the language generation session ................. 216

XXIII
Nomenclature
Nuclear Magnetic Resonance
d droplet diameter
d3,2 Surface weighted mean droplet diameter
d3,3 Volume weighted mean droplet diameter
G Gradient strength
Mg/E Echo attenuation
Δ Length of time between two starting points of field gradient pulses
δ Length of time for each field gradient pulse
σ Standard deviation of the logarithm of the droplet diameter
τ time
Differential Scanning Calorimetry
M Mass
Q Heat energy transferred
Tc Crystallisation Temperature
Tend End temperature for Melting profile
Tg Glass transition temperature
Tj Jacket temperature
Tm Melting temperature
Tonset Onset temperature for Melting profile
Tpeak Peak temperature during Melting profile
ΔHc Latent heat of crystallisation
Rheology/Compression
A Cross Sectional Area
D Fractal dimension
F Applied load/ Compression Force
G’ Elastic Modulus
G’’ Viscous Modulus

XXIV
H Initial Height
HO Height of each sample as recorded during compression
k Characteristic of the spring
Lo Original Length
M Mass
M Modulus of elasticity
R Radius
x Backbone fractural dimension
ΔL Elongation of the spring
εE Engineering strain
εH True strain
σE Engineering stress
σH True Stress
τ Shear Stress
Φ Particle volume fraction
Shear rate
Tribology
F Frictional Force
Cp Specific heat capacity
k Viscosity
m mass
N vogadro’s number
Q Energy dissipated
R Gas Constant
r radius
V Velocity
W Applied normal force
μ Coefficient of friction
Release
A Area under curve

XXV
c Concentration
D Diffusivity
Gc Glycerol concentration
t Time
Other
ΔPL Laplace Pressure
Ai Area of interface
Er Emulsifier required
Sc Surface coverage
α Alpha
β Beta
β’ Beta prime
γ Surface tension
τcoag Coagulation time
τenc Encounter time
τFD Film disruption time
τft Film thinning time
Abbreviations
ANOVA Analysis of variance
CW Carnauba wax
D.F.B Difference from bench
DSC Differential scanning calorimetry
EM Electron microscope
FT IR Fourier transformer infra red
HLB Hydro lipophilic balance
IFT Interfacial tension
IV Impeller velocity
L.S.D Least significant difference
LVR Linear viscoelastic region
XXVI
MW Microcrystalline wax
NMR Nuclear magnetic resonance
O/W Oil-in-water
PDMS Polydimethyl siloxane
PGPR Polyglycerol polyricinoleate
PS Pin stirrer
RT Residence time
SEM Scanning electron microscope
SPI Soy protein isolate
SSHE Scraped surface heat exchanger
SSPS Soy soluble polysaccharides
TAG Triacylglycerol
W/O Water-in-oil

1. Introduction
1
Chapter 1. Introduction

1. Introduction
2
1.1 Background
The microstructure approach (Figure 1.1) has been used in the food industry to
produce innovative products that meet consumer demands. It states that the properties of
a product are dependent on its microstructure. The microstructure is a function of the
ingredients and the processing conditions (Norton and Norton, 2010). Using this
approach, it is possible to design new products that meet consumer demands within the
cosmetic industry. To the author’s knowledge, this approach has not been implemented
in the design process for developing novel lipstick formulations.
Figure 1.1 – Schematic for Microstructural approach (adapted from Norton and Norton (2010).
Lipsticks are a solid fatty based hydrophobic product comprised of waxes (5 – 25
wt %), oils (30 – 80 wt %) and pigments (1 – 10 wt %) (Harry, 1973). The oil provides
a base for the waxes and allows the pigments to disperse throughout the lipstick. Castor,
mineral, jojoba and vegetable oil are the main oils used in lipstick production. It is
important to note that the oils are normally treated with an antioxidant in order to
improve shelf life. Castor oil is predominately used as it has the ability to dissolve the
pigments used in lipsticks (bromoacid dyes), due to its polar nature. It is comprised of
mainly triglyceride fatty acids with ricinoleic acid (Harry, 1973). Waxes are used to
give structure to the formulation, thus allowing the formulation to be moulded and used
as a lipstick (solid at room temperature and spreadable at lip temperature (32 °C)).
Currently a variety of different waxes (carnauba wax, beeswax, candelilla wax, paraffin
Process
Ingredients
Microstructure
Material
Properties
(Hardness, skin
feel, release of
actives etc)
Consumer
response/
requirements

1. Introduction
3
wax, microcrystalline wax, performalene etc.) are used as a blend to provide a structure
that delivers said properties.
The excess use of hydrophobic lipsticks can lead to lip dryness due to an
accumulation of hydrophobic layers on the lip, which prevents natural lubrication from
saliva and water vapour (in the atmosphere). Currently, to improve wearers comfort,
emollients (alcohols or polysaccharides) are added by manufactures (Decker et al.,
1997). An alternative method to improving lubrication of a lipstick would be to create
water-in-oil (W/O) emulsion based lipsticks. This will allow the delivery of moisture
directly to the lip.
Water, despite its natural attribute as a moisturiser, is not used in the formulation of
commercially available lipstick. However, there are a few examples of W/O emulsion
based lipsticks in the literature. Lombardi and Voccaro (1993) provided a list of
ingredients which were used to produce an emulsion lipstick without providing a
detailed formulation. Dunphy et al. (1992 ) formulated an emulsion based lipstick using
phospholipids to stabilise the water droplets. These two studies highlighted that the
incorporation of water within a lipstick is possible. However, the authors did not discuss
emulsion stabilisation mechanisms, the chemistry between ingredients, the material
properties of the emulsion lipsticks or how emulsion lipsticks were produced. Wang and
Lee (1997) published the first work on the strength of emulsion based lipsticks. The
authors used compression testing to show that emulsifiers (lipophilic or hydrophilic)
had no effect on the strength of the lipstick. They also showed that water inclusion
increased the strength of emulsions. These results were challenged by Le Réverend et
al. (2011b) who showed that higher water content (up to 40 wt %) weakened the lipstick
structure.

1. Introduction
4
Production of lipsticks has also received little attention in the literature.
Traditionally, lipsticks are manufactured using a 4 stage batch process which utilises
varying types of roller mills (ball, sand, roller and corundum) (Daley, 1968). These
methods do not allow control of the crystallisation of waxes during the process which
leads to inhomogeneous structures being formed (Dweck and Burnham, 1980).
In order to fully utilise the microstructural approach for designing emulsion based
lipsticks, one must consider the impact an emulsion structure has on consumer response.
An example can be found in the cosmetic industry where experimental data has been
related to consumer response. Kusakari et al. (2003) related friction from a tribological
technique to ‘spreading’ and ‘stickiness’ scores. However, there is no evidence in the
literature of solid wax based structures being analysed experimentally in a tribometer.
Finally it should be noted that the inclusion of water allows the encapsulation of
active hydrophilic agents into the microstructure. To the author’s knowledge there is no
literature investigating the release of active agents in lipstick formulations. The use of
active agents (such as glycerol) could allow direct delivery of moisturising agents to the
lips, thus prevent drying of the lips.
1.2 Objectives
Given the aforementioned gaps in the knowledge required for designing emulsion
based lipsticks, the aim of this thesis is to advance the understanding of designing
emulsion based lipsticks by utilising the microstructure approach.
Specifically, to achieve this objective, emulsion based lipsticks were produced using
either a batch or continuous process and a variety of ingredients (emulsifiers, waxes and

1. Introduction
5
different aqueous phase volumes). Their final structure and properties were assessed
using a variety of techniques to understand how the structure related to both material
properties and consumer acceptance.
1.3 Relevance to Alliance Boots
Alliance Boots, the industrial funder to this study, is a multinational organisation
that has multiple avenues of business. Alliance Boots controls 16 % of the European
market share for colour cosmetics (Figure 1.2). The total European cosmetic market is
worth approximately £1.5 billion of which lipsticks take up an appropriate £200 million
(Mintel, 2012). Lipstick form an intrinsic part of the company and to maintain/improve
their market share it must develop new and innovative products that meet consumer
demands.
Figure 1.2 – Pie chart of the UK colour cosmetics market divided into company retail market
share (%)(taken from Mintel, 2012)
Alliance Boots consumers have identified that commercially available lipsticks dry
their lips. As a result there has been a drive to produce a lipstick that can deliver
moisture to the lips.

1. Introduction
6
As discussed in the previous section, W/O emulsions have the potential to produce
microstructures that are suitable for lipstick application that deliver moisture directly to
the lip. Furthermore, the ability to monitor the release of an active agent would allow
Alliance Boots to add additional claims for their lipsticks which would improve the
marketability of the product. Finally, the use of a tribological technique to predict
consumer response could reduce the amount of formulations being analysed by a
sensory panel. This would be extremely beneficial for Alliance Boots who operate using
a trained sensory panel which is extremely expensive.
1.4 Thesis Layout
The following chapter (Chapter 2) provides a review of the relevant literature on
four major topics: emulsions, crystallisation, tribology and release. Chapter 3 then
describes the materials used and methodology for all of the different experimental
techniques used throughout the study.
Chapters 4 – 7 are the results chapters for this thesis. Chapter 4 discusses the design
of an emulsion based lipstick. This begins with a discussion on the influence of a batch
process (in particular the effect of emulsifiers and aqueous phase volume) and a
continuous process (in particular processing parameters). The melting behavior of
emulsion based lipsticks is then discussed as this is crucial in a lipstick being used for
its primary function (solid at room temperature but spreadable at lip temperature). The
final part of this chapter discusses the stability of emulsion based lipsticks.
Chapter 5 discusses the material properties of emulsion based lipsticks. For this,
different waxes and wax blends were initially discussed followed by a discussion on the
effect of water inclusion and water content. The material properties were then
manipulated by using a continuous process to control the amount of crystallisation
1. Introduction
7
during processing. The material properties were assessed using either uni axial
compression and/or oscillatory rheology.
Chapter 6 probes the use of a pin-on-disk tribometer in examining the lubricating
properties of solid wax based emulsion. In particular the role of different waxes, water
content, dispersed phase viscosities and droplet size. The second part of this chapter
utilises a trained sensory panel (supplied by Alliance Boots) in order to compare
tribological data with sensory attributes.
Chapter 7, the final results chapter, discusses the development of a technique to
monitor the release of a moisturising agent (glycerol) from a wax based structure.
Initially the release of glycerol is discussed in quiescent conditions. The release
behavior is then discussed by using a COMSOL model. Following this, the release of
glycerol during structural breakdown is discussed, in terms of compression and droplet
size.
The conclusions of this research are summarised (0) along with recommendations
for future work. A full list of the references and appendices used though out this thesis
are then shown.

2. Literature Review
8
Chapter 2. Literature
Review

2. Literature Review
9
2.1 Introduction
The aim of this chapter is to review the relevant literature, related to this study. This
includes an overview of emulsions and how they can be formed. Then, the formation of
crystal structures will be discussed. The fundamentals of tribology are then discussed.
In particular, how tribology has been used in both the cosmetic and food industries to
compare friction with sensory perception. Finally the releases from colloidal structures
are then examined in terms of release via diffusion and release during application.
2.2 Emulsions
Emulsions are a common form of material found in the food, cosmetic and
pharmaceutical industry (Braisch et al., 2009).As previously stated (section 1.1)
emulsions could help deliver moisture to lips. Emulsions are traditionally defined as a
dispersion of droplets of one liquid in another, the two being immiscible (commonly oil
and water) (Dickinson and Stainsby, 1982). However emulsions are thermodynamically
unstable, which will lead to phase separation (Hodge and Rousseau, 2003), in order to
minimise the contact area between the two phases (Rousseau, 2000). To overcome this
instability an emulsifier (discussed in section 2.4.4) is added, these are surface active
molecules that adsorb to the interface to stabilise emulsions (Rousseau and Hodge,
2005). The type of emulsifier can dictate whether one produces a water-in-oil (W/O)
emulsion (such as, margarine) or an oil-in-water (O/W) emulsion (such as moisturizers,
mayonnaise and milk). Fat crystals or particles can also be used to stabilse emulsions
(discussed further in section 2.4.3).
2.2.1 Emulsification
In order to produce an emulsion, one must first supply enough energy into the two
immiscible liquids to provide mechanical agitation (Walstra, 1993) which results in the
dispersion of one liquid into the other. It is important to note that these will immediately

2. Literature Review
10
begin to phase separate (process discussed further in section 2.3). Emulsion formation
(and the size of droplets produced) is controlled by droplet break up, emulsifier
adsorption and droplet coalescence.
2.2.1.1 Droplet Break up
Droplet break up is a function of both disruptive and interfacial forces. The
interfacial forces are controlled by the Laplace pressure ( ) (Equation 1.1) and are
responsible for keeping the droplet spherical (McClements, 2005).
Equation 2.1
Where is the interfacial tension between the water and oil, and d is the droplet
diameter.
In order to break up a droplet a disruptive force (that is greater than the interfacial
forces) is required (Stone, 1994). The disruptive force can be generated by a number of
different homogenisation techniques (Walstra, 1983a). For the purpose of this thesis
only two techniques were investigated; a Silverson high shear mixer (batch process) and
a scraped surface heat exchanger (SSHE) and pin stirrer (PS) (continuous process). A
high shear mixer operates in a batch mode, whereby the two phases are placed in vessel
and mechanically agitated by a mixing head that can rotate at high speeds. This causes
disruption between the interfaces between both phases resulting in larger droplets
breaking into smaller droplets. Increasing the head speed increases the disruptive forces
thus resulting in even smaller droplets. The SSHE and PS is a continuous process that is
commonly used in the food industry to produce margarine. In this technique both
emulsification and crystallisation can occur in the same process. The SSHE has scraper
blades on a rotating axis. These blades provide the disruptive forces to break up the

2. Literature Review
11
droplets into smaller ones. The SSHE also has a temperature control allowing fat
crystals (in the case of margarine) to be formed around water droplets causing Pickering
stabilisation (see section 2.4.3)
2.2.1.2 The role of the emulsifier
As interfacial tension decreases the ease at which a droplet can be disrupted
increases (Equation 2.1). Therefore it should be possible to create greater disruption in
the presence of an emulsifier (see section 2.4.4) as an emulsifier reduces the interfacial
tension (Walstra, 1993). It is important to note that the rate at which an emulsifier
adheres to the interface will affect the efficiency of the process. For example if there is a
low concentration of emulsifier at the interface, greater disruptive forces will be
required to produce smaller droplets. Whereas at high concentrations (a lower interfacial
tension), smaller disruptive forces are required for droplet disruption (Walstra, 1983b).
2.2.1.3 Droplet Coalescence
During emulsification, droplet-droplet collision is extremely probable. Therefore if
the droplets are not protected they will come together and coalesce (process explained
in section 2.3.4). Immediately after disruption, there is a greater surface area of
interface; if there is not sufficient emulsifier present to cover this interface, coalescence
will occur. In order to prevent immediate coalescence, it would be necessary to form an
emulsifier barrier around the newly formed droplet before it has the opportunity to
collide with another droplet (Walstra, 1993).
2.3 Emulsion Instability
As previous stated emulsions are thermodynamically unstable and therefore as soon
as they form they begin to phase separate. Within the emulsions all the droplets undergo
Brownian motion and therefore collide on a regular basis. The instability of emulsions

2. Literature Review
12
is a result of these collisions. There are two basic interactions; attraction and repulsion.
If attraction dominates the droplets adhere together and phase separation begins,
however, if repulsion dominates the emulsion will be stable and remain dispersed.
Phase separation is a result of an emulsion attempting to minimise contact area of
the two phases and therefore lowering the overall energy of the system. There are four
main mechanisms that contribute to emulsion instability including
creaming/sedimentation, flocculation, Ostwald ripening and coalescence (Rousseau,
2000).
2.3.1 Creaming/Sedimentation
Creaming/ sedimentation (Figure 2.1) is caused by a difference in density between
the two different phases under the influence of gravity that can lead to phase separation.
For example Beydonun et al. (1998) investigated the phenomena of settling. This was
done by studying the effect of having a multiphase continuous medium on the settling
velocity of spherical particles. The research showed that by increasing the emulsion
viscosity, the settling velocity decreased (Beydoun et al., 1998). The study worked well
in illustrating the effect on varying emulsion viscosity; however it did not investigate
the effect of varying droplet sizes within the emulsion as this will cause pressure
differences between droplets leading to coalescence.

2. Literature Review
13
Figure 2.1 – Schematic representing both creaming and sedimentation
2.3.2 Flocculation
Flocculation can simply be described as aggregation of particles due to weak
attractive force between droplets (Figure 2.2). This phenomena depends on the
interaction energy between two droplets as a function of inter droplet distance. The
interaction energy is a combination of both repulsive and attractive forces. In emulsions
the repulsive forces are governed by the emulsifier used and the attractive forces are
controlled by London-van-der-Waals forces. It is important to remember that during
flocculation droplets maintain their structural integrity and therefore this phenomena is
reversible (Rousseau, 2000).
Sedimentation(if dispersed phase is
more dense)
EmulsionCreaming(if dispersed phase
is less dense)

2. Literature Review
14
Figure 2.2 – Schematic representing flocculation
2.3.3 Ostwald Ripening
Ostwald ripening (Figure 2.3) is a phenomenon where larger droplets grow at the
expense of smaller ones as a result of a solubility gradient being formed between small
and large droplets (Dickinson et al., 1999).
Figure 2.3 - Schematic representation of Ostwald Ripening
Flocculation(Aggregation of dispersed
phase droplets)
Emulsion
Water diffuses from a small droplets to a larger droplet via a solubility gradient.

2. Literature Review
15
The rate at which the larger droplet grows depends on the solubility of the
continuous phase as this affects the rate of molecular diffusion and the difference in
partial pressures between the dispersed phase droplets (known as the Laplace pressure
difference).
With the emulsions being considered for this research Ostwald ripening is of little
importance as there is limited solubility between the aqueous and oil phases.
2.3.4 Coalescence
Coalescence is where two droplets combine to form a larger droplet after collision
(Figure 2.4) (Kabalnov, 1998). As two droplets approach one another, a thin film
(section 2.3.4.1) of continuous phase is formed between the two droplets (Ivanov et al.,
1999). For coalescence to occur this film must rupture (section 2.3.4.2), allowing the
fluid in the droplets to merge together (Kabalnov, 1998). This mechanism is driven by
the fact that the emulsion wants to move to its most thermodynamically stable state,
where there is the least contact between both phases (McClements, 2005).
Figure 2.4 - Schematic of Coalescence
CoalescenceThin film ruptures
Dispersed phase droplets
Thin film produced

2. Literature Review
16
2.3.4.1 Thin Film
A thin film is produced as two droplets come into close proximity. As the fluid
flows out of the thin film, a hydrodynamic resistance is formed due to the friction
generated from the fluid flow. Before these droplets can get any closer, the remaining
fluid needs to be pushed out. The film will continue to thin resulting in a number of
events occurring. The droplets can either; move away from each other (known as no
aggregation), remain in a state of secondary medium (known as weak flocculation),
remain in a state of primary medium (known as coagulation) or the droplets come
together and coalesce. The outcome of droplet-droplet interaction depends on the
colloidal and hydrodynamic interactions (Figure 2.5)
Figure 2.5 – Schematic representation of physiochemical processes involved when two droplets
approach one another. Where τFD – film disruption time, τCoag – coagulation time, τFT – film
thinning time and τEnc – encounter time (Image adapted from McClements (2005)).
τFrag
τFT, τEncτCoagτFD
h
W (h)
Coalesced 1 Min 2 Min
Energy
Barrier

2. Literature Review
17
No aggregation – After the droplets collide, if there is a high energy barrier and if
the secondary minimum is low, the droplets will move apart.
Weak Flocculation – When there is a large energy barrier and a deep secondary
minimum, the droplets tend to weakly flocculate. This results in a thick film being
produced (in the order of nm) between the droplets.
Coagulation – When the energy barrier is low and there is strong short range
repulsion between droplets then the droplets can fall into primary minimum.
2.3.4.2 Film Rupture
Coalescence occurs when the thin film of liquid between the droplets is ruptured. It
is important to note that if there is no short range repulsion between droplets, then rapid
coalescence will occur after the droplets fall into primary medium. There are a variety
of different mechanisms that can lead to coalescence. This is determined by the
characteristics of the continuous phase which separates the droplets (e.g. the viscosity,
interfacial tension and thickness). The mechanisms that control coalescence depend on
whether there is emulsifier present in the system. If there is no emulsifier present in the
system then the following mechanisms lead to film rupture and coalescence.
Capillary Wave Formation – Capillary waves are a result of thermal motion within
the system and are formed spontaneously. When the amplitude of the thermal variations
is half that of the film thickness then a point of contact will occur between the two
droplets. This leads to the formation of a hole, which allows the fluid between two
droplets to combine.
Spontaneous Hole Formation – Tiny holes can form spontaneously in the thin film
due to thermal motion of the system. Kalbanov (1998) stated that if these holes are

2. Literature Review
18
below a critical value then they will collapse, however if they are above this value they
will grow resulting in film rupture.
In the majority of emulsion systems the droplets are coated by a layer of emulsifier.
Therefore alternative factors may be responsible for film rupture (McClements, 2005).
Insufficient Emulsifier – If there is a lack of emulsifier within the system, it could
lead to incomplete coverage of the W/O interface. This then leads to gaps on the
interface, therefore when two droplets come into close proximity coalescence can occur
via either capillary wave formation or spontaneous hole formation. It should be noted
that this type of coalescence is more likely to occur during homgenisation due to new
interfacial surfaces constantly being created.
Film Stretching – Film stretching occurs if a large stress is applied to the interface.
This causes some of the emulsifier to be dragged across the interface, thus leaving some
areas with a depletion of emulsifier. If two depleted regions of different droplets
approach one another, coalescence could then occur.
Film Tearing – Van Aken (2004) stated that in situations where large stresses are
applied to the interface (when this is comprised of highly cohesive emulsifier molecules
i.e. proteins), a tear can occur in the interfacial membrane. This leads to emulsifier
depleted reaches resulting in coalescence.
Coalescence is a major problem with emulsions and there are various ways in which
the process of coalescence can be reduced. These methods will be discussed in section
2.4.

2. Literature Review
19
2.4 Emulsion Stabilisation
Creaming, flocculation, coalescence and Ostwald ripening are constantly working to
minimise the energy within the emulsion, causing the emulsion to ruin. As previously
discussed this is caused when droplets collide, therefore the basis of stabilisation is
determined by these collisions. Since there are always strong, long-range attractive
forces between similar droplets, it is necessary to provide long range repulsion between
the droplets to impart stability. This repulsion should be at least as strong as the
attractive force and comparable in range of the attractive interaction (McClements,
2005).
Stability can be obtained by surrounding the droplets: with an electrical double layer
(electrostatic stabilisation), with adsorbed or chemically attached polymeric molecules
(steric stabilisation) or with free polymer in the dispersion medium (depletion
stabilisation) (McClements, 2005). It can also be achieved by increasing the viscosity of
the continuous phase which lowers the mobility of the dispersed phase resulting in
fewer collisions.
2.4.1 Electrostatic Stabilisation
Electrostatic stabilisation is an effective way to counterbalance the London van der
Waals attraction between droplets. Ionic groups can be adsorbed to the surface of the
droplet to form a charged layer. To maintain electroneutrality, an equal number of
counter-ions with the opposite charge will surround the droplets and give rise overall
charge neutral double layers (McClements, 2005). This layered droplet will then repel
other similar droplets preventing coalescence. For example Tran and Rousseau (2013)
were able to prevent the destabilisation of soy protein isolate (SPI) dispersions by using
soy soluble polysaccharides (SSPS) under acidic conditions. Figure 2.6 shows a
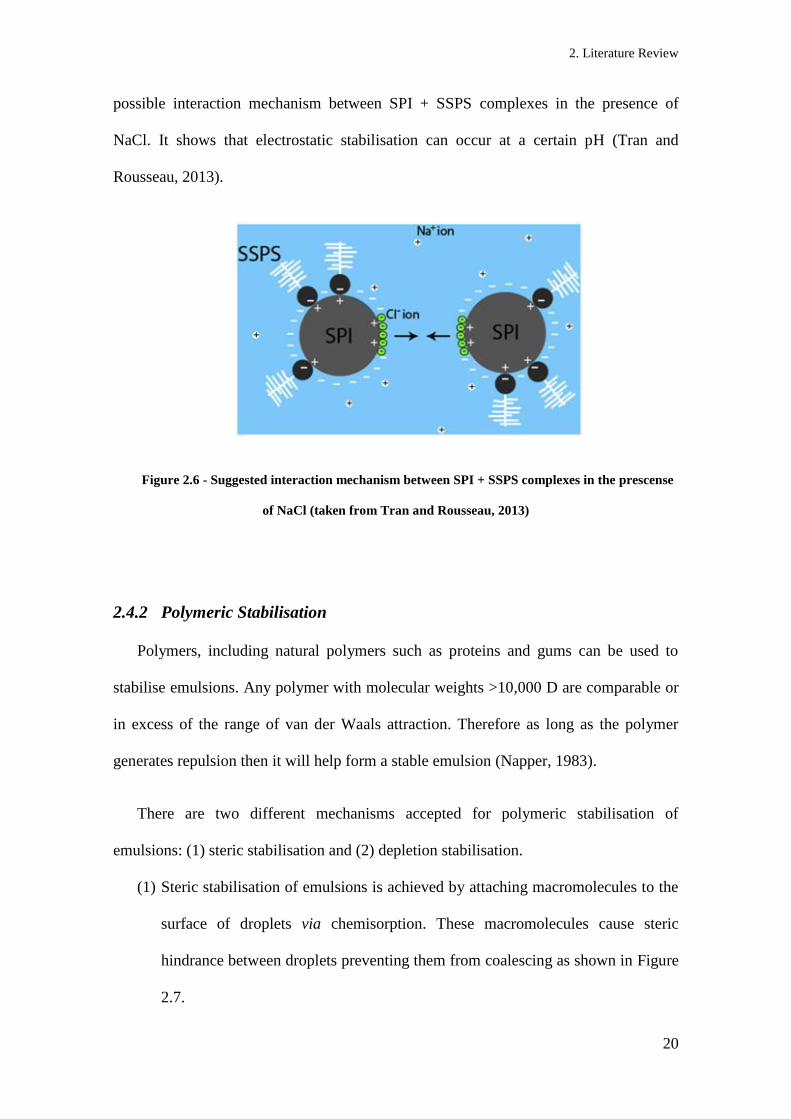
2. Literature Review
20
possible interaction mechanism between SPI + SSPS complexes in the presence of
NaCl. It shows that electrostatic stabilisation can occur at a certain pH (Tran and
Rousseau, 2013).
Figure 2.6 - Suggested interaction mechanism between SPI + SSPS complexes in the prescense
of NaCl (taken from Tran and Rousseau, 2013)
2.4.2 Polymeric Stabilisation
Polymers, including natural polymers such as proteins and gums can be used to
stabilise emulsions. Any polymer with molecular weights >10,000 D are comparable or
in excess of the range of van der Waals attraction. Therefore as long as the polymer
generates repulsion then it will help form a stable emulsion (Napper, 1983).
There are two different mechanisms accepted for polymeric stabilisation of
emulsions: (1) steric stabilisation and (2) depletion stabilisation.
(1) Steric stabilisation of emulsions is achieved by attaching macromolecules to the
surface of droplets via chemisorption. These macromolecules cause steric
hindrance between droplets preventing them from coalescing as shown in Figure
2.7.

2. Literature Review
21
Figure 2.7 - Schematic of Steric Stabilisation
An example of steric stabilisation was shown in 2002 Chanamai and McClements
compared Gum Arabic and modified starch as emulsifiers. The influence of pH, CaCl2
and temperature were investigated to monitor whether steric or electrostatic stabilisation
were the predominant mechanisms for stabilisation (Chanamai and McClements, 2002).
Results showed that steric repulsion has greater significance than electrostatic repulsion
when using either gum Arabic or modified starch stabilised emulsions.
(2) Depletion stabilisation of emulsions is achieved by adding macromolecules that
are free in solution (as shown in Figure 2.8). This creates repulsive forces
between approaching droplets preventing coalescence from occurring.
Polymer
Water droplet

2. Literature Review
22
Figure 2.8 - Schematic of Depletion Stabilisation
2.4.3 Fat Particles in Emulsion Stability
For fat crystals to assist in the stabilisation of emulsions they must collect at the
emulsion droplet interface which will then provide a physical barrier to coalescence
(Figure 2.9) (Rousseau, 2000). This type of emulsion is referred to as a Pickering
emulsion (Dickinson, 2010).
Figure 2.9 - Schematic of Pickering stabilisation
Polymer
Water droplet
Water
Oil
Pickering Particle
W/O Emulsion
2. Literature Review
23
Pickering (1907) was the first to study the formation and stability of colloidal
stabilisation of emulsions. This was done by investigating the use of different metal
sulphates on the stability of emulsions (Pickering, 1907). In the 1960’s Lucassen-
Reynders investigated the role of colloidal particles in food emulsions. It became known
that the addition of solid particles are necessary for product stabilisation via a steric
mechanism (Dickinson, 2010, Rousseau, 2000). For example, ice crystals are used to
stabilise ice cream, fat particles stabilise whipped cream and egg yolk particles stabilise
mayonnaise (Rousseau, 2000).
The use of fat crystals in W/O emulsions can impart stability in two ways, (1)
Pickering stabilisation and (2) the presence of a fat crystal network in the continuous
phase prevents droplet movement therefore preventing coalescence, hence long term
emulsion stability (Frasch-Melnik et al., 2010, Hodge and Rousseau, 2003).
Frasch-Melnik et al. (2010) and more recently Norton and Fryer (2012) have
utilised Pickering particles in stabilising W/O emulsions. The latter also used a
continuous fat network which would result in long term stability. Frasch-Melnik et al.
(2010) investigated the use of both mono and triglycerides as Pickering particles
without the use of other emulsifiers. Results show that sintered shells were formed
around the water droplets. Norton and Fryer (2012) investigated cocoa butter W/O
emulsions; results showed that water droplets were coated with sintered crystals
indicating Pickering stabilisation.
2.4.4 Emulsifiers
An emulsifier is a surface active molecule that is both hydrophilic (‘water loving’)
and hydrophobic (‘water hating’) allowing it to adsorb to a W/O interface which can
prevent droplet aggregations and coalescence during formation and storage (Coupland

2. Literature Review
24
and McClements, 1996, McClements, 2002). Emulsifiers operate by lowering the
interfacial tension between the dispersed and continuous phase (Rousseau, 2000).
The concentration of emulsifier used is crucial in producing stable emulsions. It
needs to be high enough to cover the droplet surface (which increases as the droplet size
decreases). If there is not enough emulsifier to cover in the entire droplet surface
coalescence could occur if the droplets come into close proximity. When excess
emulsifier is used the droplet size formed depends on the emulsification process
involved.

2. Literature Review
25
2.5 Crystal Networks
Crystal networks are comprised of different levels of structures, each of which
contribute to the macroscopic properties of the overall network (Figure 2.10). This
includes the spreadability of spreads, butters and margarines or the snap of chocolate or
the strength of a lipstick (Narine and Marangoni, 1999a).
Figure 2.10 - Factors affecting macroscopic properties of fat networks (Image adapted from
Narine and Marangoni (1999a)).
2.5.1 Lipid Composition
Lipids predominately consist of triacylglycerols (T G’s) and in order for them to be
a fundamental component in a crystal network they must initially crystallise.
Crystallisation is achieved in when a solution (containing crystal particles e.g
T G’s) is cooled below the melting point of the crystal particles. Jensen and Mabis
(1966) showed that when a triacylglycerol (TAG) molecule crystallises it adopts a
tuning fork configuration, otherwise known as a chair conformation. Several of these
‘chains’ then align side by side in order to maximise the van der Waal interactions. s
Macroscopic
Properties
Microstructure
Polymorphism
Lipid
Composition
Processing
Conditions

2. Literature Review
26
shown in Figure 2.11, the chains generally consist of two, three or four chain lengths of
fatty acids constituents of TAG.
Figure 2.11 – Stacking Possiblities for triacylgylcerol in fat crystals where the letter L
represents fatty acid chain length (Image adapted from Marangoni and Wesdrop (2012))
Van den Tempel (1961) developed an early mechanical model which suggested that
fat networks comprised of an assembly of chains which individually consisted of
particles that were packed closely together via van der Waal interactions. These
particles are a result of a nucleation step which allows crystals to be produced.
2.5.1.1 Nucleation
There are two mechanisms by which nucleation can occur. (1) Homogeneous
nucleation (otherwise known as primary nucleation) – this is where crystals are formed
spontaneously or (2) heterogeneous nucleation - this is where crystal formation occurs
around impurities. The rate at which nucleation occurs is determined by two factors.
The first is the energy required to fabricate a new surface area and the second is the
energy gained when the metastable liquid crystal transfers to its thermodynamically

2. Literature Review
27
more stable solid state. The second of these factors drives nucleation allowing a nucleus
to be formed. A nucleus is an aggregation of crystalline structures that is large enough
to lead to a decrease in Gibbs energy (Kloek et al., 2000). It has been found that in the
majority of cases, crystal nucleation starts as a result of impurities. As they provide an
interface that can act as templates for nucleation (Campbell et al., 2002). Walstra (1998)
showed that for most applied systems, bulk fats crystallise via a heterogeneous
mechanism due to the presence of dust or foreign particles (which act as the surface
template for nucleation). Heterogeneous crystallisation is more favourable than
homogenisation crystallisation as the energy required for homogeneous nucleation is a
lot higher (Campbell et al., 2002, Kloek et al., 2000).
2.5.2 Processing Conditions
One of the other major influences on crystal networks are the processing conditions
involved in producing crystal networks (including cooling rate). Campos et al. (Campos
et al., 2002) investigated the effect of cooling rate on the structure and mechanical
properties of milk fat and lard. Results showed that when a cooling rate of > 5 °C / min
were used a higher crystallisation rate was observed. This was due to the formulation
being rapidly cooled causing lots of nucleation sites in shorter time period. Whereas
when a slower rate of cooling is used (< 0.1 °C / min) the frequency at which nucleation
sites occur is reduced. Therefore leading to less crystals being formed (Campos et al.,
2002). The cooling rate can dictate the size of the fat crystals being formed.
Foley and Bradley (1984) investigated temperature induced effects on crystallisation
behaviour. Results showed that when a formulation was cooled slowly large crystal
aggregates were formed. When a slow cooling rate is use, a long induction time is
required to form nuclei. These nuclei then grow to form larger crystals within a

2. Literature Review
28
solution. Crystal growth is favoured over new nuclei formation as the time taken for
nuclei formation is longer than the time taken for mass transfer and diffusion onto a
newly formed crystal. On the other hand when samples are cooled rapidly, the induction
time is short. This results in a large number of crystals being formed which are evenly
distributed throughout the solution. Crystal growth is inhibited as the viscosity of the
solution increases due to the rapid formation of many nuclei (Foley and Brady, 1984,
Campos et al., 2002).
Another processing condition that can affect crystallisation is shear. Shear can
distribute newly formed crystals throughout a sample. For example when using SSHE
which has a jacketed vessel. Initially nucleation occurs at the jacket wall (as this is the
location with the greatest cooling) this can be brought into the bulk solution (by a
scraper), causing seeding of new crystals (Campbell et al., 2002). This phenomena is
known as secondary nucleation.
2.5.3 Crystal Structures
T G’s can exist in one of three main polymorphic forms; alpha (α), beta prime (β’)
or beta (β) (Larsson, 1966). Jensin and Mabis (1966) have been attributed with
determining the first full crystal structure. They determined that tricaprin was in a β-
form structure. The alpha form is the least stable and has a hexagonal subcell, β’ is
slightly more stable and has a orthorhombic subcells and β is the most stable with a
triclinic subcells (Figure 2.12) (Sato, 2001). The different subcell structures control the
arrangement of the crystals in the crystal lattice (Sato, 2001).

2. Literature Review
29
Figure 2.12 - Examples of the structure of different polymorphs in triacylglycerols (taken from
Sato 2001)
Crystal form can be determined using a technique known as differential scanning
calorimetry (DSC). Norton et al. (1985) investigated the melting behaviour of
triglycerides (tripalmitin and tristearin) with triolein. Results showed that when a fast
cooling rate (1 K / hr) was used α crystals (least stable) were favoured. Whereas when a
slow cooling rate was utilised (0.1 K / min) β crystals were more favoured (most
stable). They also found that at faster cooling rates the crystallisation temperature
increased (Norton et al., 1985).
When a solution containing fat crystals is cooled below the crystallisation
temperature, α-form crystals are the first to form. This is due to the low activation
energy of nucleation (Figure 2.13), as a result many α-form crystals from in a short
period of time.

2. Literature Review
30
Figure 2.13 – Free Energy of activation Vs free energy of formation for the nucleation of
different polymorphic forms of fat (taken from Marangoni, 2002)
Fat crystals exhibit polymorphic forms due to their high glyceride content.
However, waxes are defined as simple esters of fatty acids with alcohols. As a result the
polymorphism in waxes is reduced, with the orthorhombic subcell prevailing (Jenning
and Gohla, 2000).
When T G’s present in the melt begin to crystallise into varying polymorphic states
a fat crystal network begins to develop/form. These crystals then aggregate into larger
microstructures via both a mass and heat transfer process (Narine and Marangoni,
1999a). In this microstructural level (Figure 2.10), the solid network can be defined as
an amorphous solid whereas the intramicrostructural level is deemed fractural in nature
(Narine and Marangoni, 1999b). The fractural geometries within the microstructure are
extremely important in determining the macroscopic properties (material properties) of
the fat crystal network and range from 1 – 140 µm (Narine and Marangoni, 1999b).

2. Literature Review
31
2.5.4 Links between Crystal Network and Macroscopic Properties
Van den Tempel (1961) suggested there was a linear link between the elastic
modulus and solid volume fraction. This was later shown to be untrue by Nederveen
(1963) and Papenhuijzen (1971). Nederveen (1963) investigated the mechanical
properties of pure glyceryl tristearate crystals in oil. The author concluded that the
modulus did not follow a linear relationship as was suggested by Van den Tempel
(1961) but required further investigations in order to understand the mechanical
behavior of the crystals in suspension. It was later noted by Edwards and Oakeshott
(1989) that fat crystal networks are mathematically similar to flocculated colloids,
which showed that the elastic properties of polymer gels can be explained using scaling
theory. Brown and Ball (1985) were responsible for the early development of the
scaling theory in terms of colloidal gels. They suggested that aggregates should behave
as mass fractals on a scale that is big enough to be compared to the primary particle
size. From this they produced a power law relationship linking elastic modulus to the
solid volume fraction. This was later confirmed by Shih et al. (1990) who identified two
different regimes (strong-link and weak link regime) depending on the concentration of
the colloidal gel. However, before we can discuss the different regimes it is important to
consider the meaning behind fractal systems.
2.5.4.1 Fractal Systems
As previously stated the microstructure is composed of fractal aggregates, where
each aggregate is comprised of fractal objects that are self similar, with different levels
of scales. Jullien and Botet (1987) related the radius (R) to the mass (M) of the
aggregates;

2. Literature Review
32
Equation 2.2
Where D is a fractal dimension.
Rousseau, Marangoni and Jeffery (1998) showed that the elastic modulus of a network
is controlled by the following relationship;
G’ ~ ɸm
Equation 2.3
Where ɸ is the particle volume fraction. The elastic behavior of the network depends on
the on the concentration of the particles, and can be categorised into either strong link or
weak link regimes.
2.5.4.1.1 Strong-link Regime
In this regime, the crystals (gel particles) grow large. This results in each crystal
acting as a weak spring, causing the elastic constant of the network to be dominated by
the elastic constant of the flocs (Shih et al., 1990), Shih 1990 represented this using the
following relationship:
G’ ~ ɸ[(d+x)/(d-D)]
Equation 2.4
Where D is the fractional dimension, x is the backbone fractural dimension and ɸ
particle concentration,
2.5.4.1.2 Weak - Link Regime
In this regime, the elastic constant of the network is dominated by the links formed
between different fractural geometries and occurs at high particle concentration. De
Gennes (1979) showed that in a semi dilute polymer solutions the elastic constant
increases as a function of ɸ in a power law manner.

2. Literature Review
33
2.6 Material Properties
In the previous section, we introduced how a crystal network affects the materials
properties of a final structure. Therefore it is important to consider the fundamentals of
deformation and material testing.
2.6.1 Hooke’s law
Hooke’s law provides the bases for characterizing the properties of solids. It states that
elongation of a spring (ΔL) is directly proportional to the applied load;
Equation 2.5
Where k is a characteristic of the spring.
The range at which Hooke’s law is obeyed is refered to as the elastic region. In this
region, when the applied load is removed from a spring, the spring will return to its
original position resulting in reversible deformation. Whereas when an applied load is
greater than the elastic limit, irreversible deformation takes place. t this point Hooke’s
law is no longer obeyed. If the load is applied beyond the limit of elasticity, the spring
will reach a breaking point.
Hooke’s law can be applied to semi solid materials, as long as the deformations on the
material remain within the elastic region. In semi solid materials, a material may also
behavior in a plastic manner. This is where the material deforms considerably without
breaking even when passed beyond the limit of elasticity.
2.6.2 Stress-strain Relationships
As previously stated a material will deform when a load is applied, however the amount
of deformation will also be dependent on the dimensions of the material. Therefore the

2. Literature Review
34
constant k (equation 2.5), can be modified to incorporate the dimensions of a material;
Equation 2.6
Where is the cross sectional area, Lo is the original length of the sample, ΔL is the
change in length of the sample and M is the modulus of elasticity.
The applied stress (σ) and resulting strain (ϵE) can be defined as;
Equation 2.7
Therefore;
Equation 2.8
The applied stress is proportional to the strain and the elastic modulus is a constant
that provides information on the elastic properties of the material.
2.6.2.1 Different types of stresses and Moduli
There are three different types of stresses (tensile, compressive and shear) that can
arise when a material is exposed to a load. If a material is stretched or compressed in
one dimension it results in tensile or compressive stresses respectively. If however
opposite forces are applied on opposite faces of the material, shear stresses are
produced. The moduli that results from these stresses can provide information regarding
material properties. Traditionally, these stresses are either applied using a texture
analyser (for more information see section 3.4.6) or rheometer.
Le Reverend et al. (2011b) utilised texture analysis (with a penetration depth
analysis probe) to investigate the effect of water content on material properties. They
related the force required to penetrate the material to hardness. Results showed that as

2. Literature Review
35
the water content increased the penetration depth also increased resulting in a softer
product. Wang and Lee (1997) also utilised texture analysis, however, they used
compression to assess material properties of emulsion lipsticks. They related the force
required to cause fracture to the hardness of a lipstick. Results showed that the
introduction of water in the form of droplets initially softens a formulation (313 30 to
223 22 g), however when the amount of water was increased from 5 wt % to 15 wt %
the hardness also increased (140 13 to 270 28 g). Wang and Lee offered no
explanation for this phenomenon. They simply stated that the water was not in sufficient
quantity to make a contribution to the hardness.
More recently, texture analysis has been used in the world of polymer gels to
understand the mechanical properties of different gel systems. It has been noted by
Norton et al. (2011) that when a True stress- True strain curve is plotted (Figure 2.14)
there are two regions of linearity before the material fractures. The first is indicative of
Young’s modulus which is a measure of stiffness. The second region was termed bulk
modulus and was representative of the materials ability to withstand compression. Other
mechanical properties such as point of fracture and work of failure (area under the
curve) can also be assessed from this curve (Norton et al., 2011).
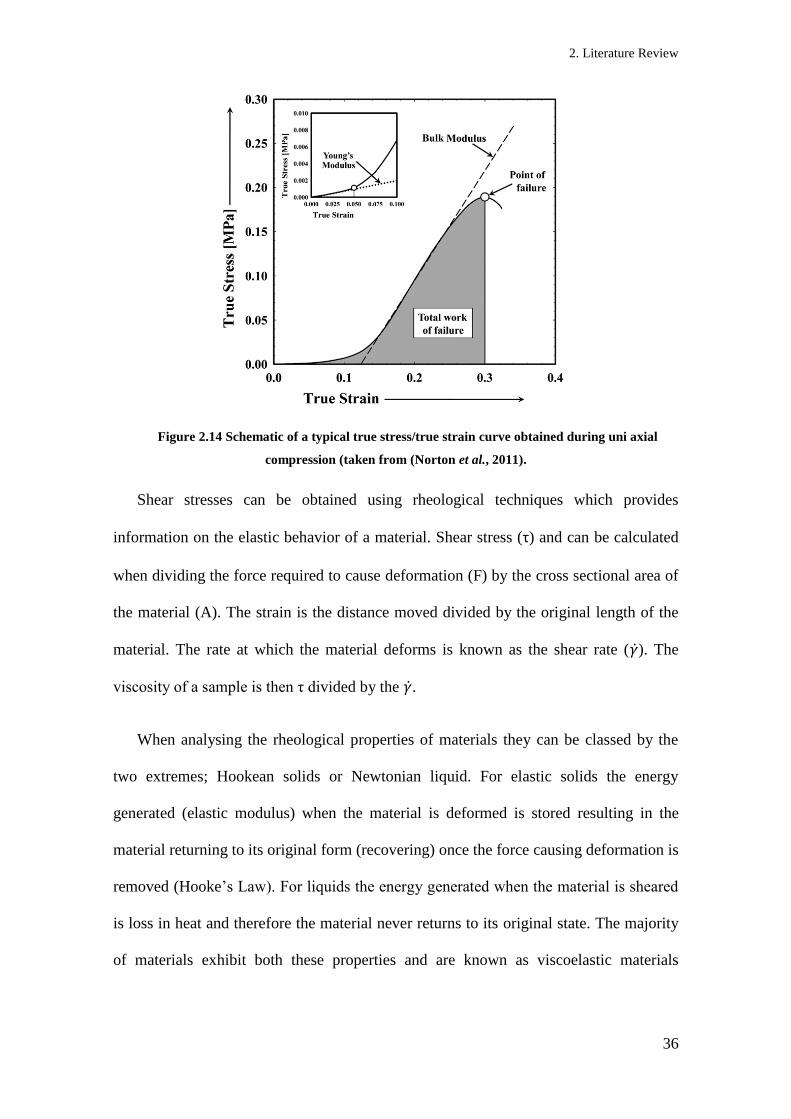
2. Literature Review
36
Figure 2.14 Schematic of a typical true stress/true strain curve obtained during uni axial
compression (taken from (Norton et al., 2011).
Shear stresses can be obtained using rheological techniques which provides
information on the elastic behavior of a material. Shear stress (τ) and can be calculated
when dividing the force required to cause deformation (F) by the cross sectional area of
the material (A). The strain is the distance moved divided by the original length of the
material. The rate at which the material deforms is known as the shear rate ( ). The
viscosity of a sample is then τ divided by the .
When analysing the rheological properties of materials they can be classed by the
two extremes; Hookean solids or Newtonian liquid. For elastic solids the energy
generated (elastic modulus) when the material is deformed is stored resulting in the
material returning to its original form (recovering) once the force causing deformation is
removed (Hooke’s Law). For liquids the energy generated when the material is sheared
is loss in heat and therefore the material never returns to its original state. The majority
of materials exhibit both these properties and are known as viscoelastic materials

2. Literature Review
37
(Bohlin-Instruments, 1994). Oscillation rheometry can give information regarding the
viscoelastic properties and will be discussed in the next section.
Oscillation rheometry
Oscillatory rheometry allows a sinusoidal stress to be applied to the material.
Therefore the resulting strain response will be sinosoidal. The key for oscillation
rheometry is to not destroy the sample during the experiment; this can occur if the
sample is over strained resulting in the destruction of the elastic structure. To prevent
this from happening it is important to measure the linear viscoelastic region (LVR).
This is done by running an experiment where the stress is increased and the frequency is
kept constant resulting in a graph where the elastic (G’) and viscous (G’’) modulus
cross or it is the point whereby G’ and G’’ stop being independent of stress (This is
shown in Figure 2.15). At this point the material is no longer behaving as a solid and is
more viscous like. From this curve a value of strain can be obtained that is within the
LVR, this can be input into a controlled stress experiment where the frequency is varied
allowing information regarding the materials viscoelastic properties to be obtained
(Bohlin-Instruments, 1994). G’ is a measure of the deformation energy which is stored
within the sample during shear, thus showing the elastic (solid-like) behaviour. G’’ is
the deformation energy that is dissipated as heat during in shear, and indicates the
viscous (liquid-like) behaviour (Tabilo-Munizaga and Barbosa-Cánovas, 2005).

2. Literature Review
38
Figure 2.15 – Typical amplitude sweep (stress from 0.1 – 1000 Pa) curve at a frequency of 1 Hz
Operating within the LVR allows a greater understanding of the interactions
between fat crystals (i.e. the weak link regime) and therefore gives an insight into
different levels of structure within the microstructure. Rye et al. (2005) used oscillation
rheology within the LVR to show that G’ was proportional to the yield point (previously
described as point of fracture) of milk fat.
Stress (Pa)
0.01 0.1 1 10 100 1000 10000
Mod
ulu
s (
Pa)
1e+0
1e+1
1e+2
1e+3
1e+4
1e+5
Elastic Modulus (G')
Viscous Moduus (G'')
LVR

2. Literature Review
39
2.7 Tribology
Tribology is the science and technology of interacting surfaces that are in relative
motion. It involves the study of friction, wear and lubrication during application.
Traditionally tribology has been used in the mechanical engineering sector to study/
improve the performance of machine components (such as gears, bearings and brakes).
The performance is governed by the behaviour in the contact between the two surfaces
in relation to the resistance to wear and friction generation (Bhushan and Hsu, 2001,
Barwell, 1974, Nakada, 1994). In these applications, lubricants are added to the surfaces
to reduce friction and wear, which can improve both the lifetime of equipment and the
equipment efficiency.
Friction is a result of the movement of one surface to another and is defined by the
following equation;
Equation 2.9
Where F is the frictional force (N), μ is the coefficient of friction and W is the
applied (perpendicular to the direction of friction) normal force (N).
For any given system, friction is dependent on a number factors which include,
surface roughness, type of lubricant relative speeds of surfaces and temperature.
Friction between two surfaces can be assessed using a tribometer, where either both
surfaces can rotate or where one remains fixed and the other.
Traditionally, different lubricants are used to investigate their affect on reducing
wear within metal contacts. As a result modern day tribometers are able to detect wear
changes in surfaces. This could prove to be valuable when assessing solid wax surfaces
for use in lipstick application, as a lipstick would have to wear to transfer to the lip.
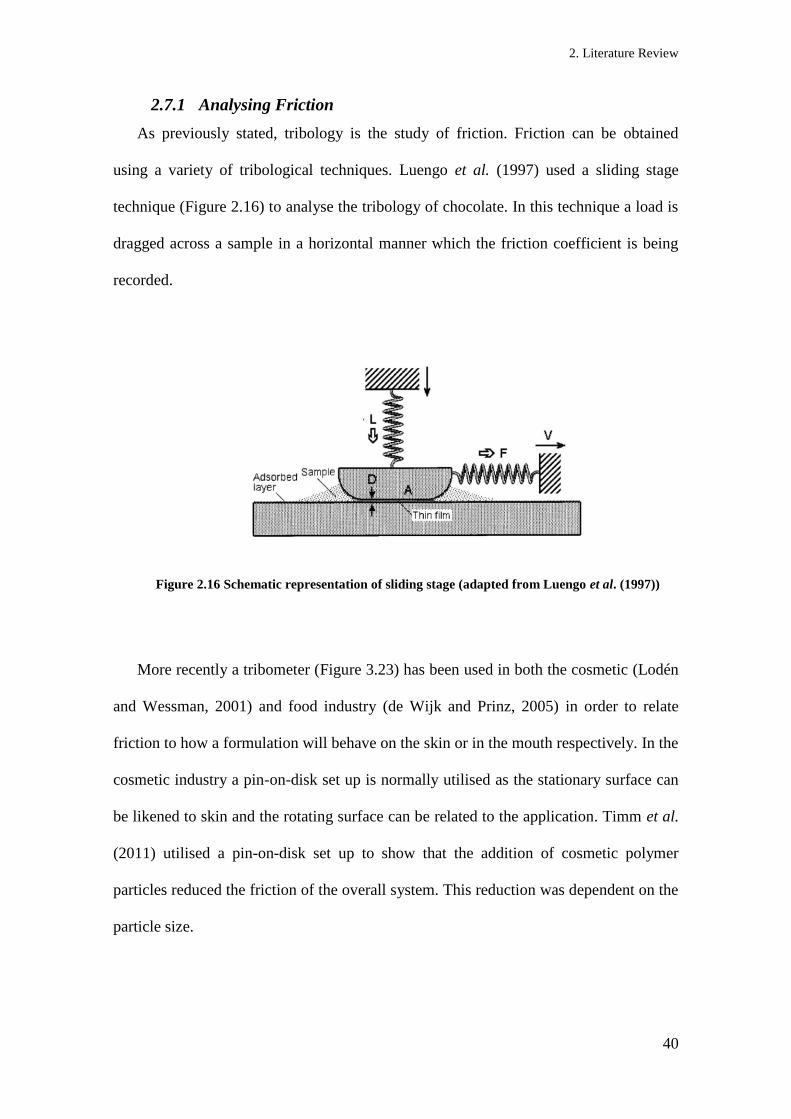
2. Literature Review
40
2.7.1 Analysing Friction
As previously stated, tribology is the study of friction. Friction can be obtained
using a variety of tribological techniques. Luengo et al. (1997) used a sliding stage
technique (Figure 2.16) to analyse the tribology of chocolate. In this technique a load is
dragged across a sample in a horizontal manner which the friction coefficient is being
recorded.
Figure 2.16 Schematic representation of sliding stage (adapted from Luengo et al. (1997))
More recently a tribometer (Figure 3.23) has been used in both the cosmetic (Lodén
and Wessman, 2001) and food industry (de Wijk and Prinz, 2005) in order to relate
friction to how a formulation will behave on the skin or in the mouth respectively. In the
cosmetic industry a pin-on-disk set up is normally utilised as the stationary surface can
be likened to skin and the rotating surface can be related to the application. Timm et al.
(2011) utilised a pin-on-disk set up to show that the addition of cosmetic polymer
particles reduced the friction of the overall system. This reduction was dependent on the
particle size.

2. Literature Review
41
Whereas in the food industry, both surfaces rotate in order to mimic the complex
nature of consuming foods. Dresselhuis et al. (2008, 2007) utilised two rotating surfaces
in a tribometer to show the effect of O/W emulsions in mouth like conditions. It should
be noted that to the author’s knowledge there is limited work conducted on W/O liquid
emulsions and non on solid W/O emulsions in a tribometer. Therefore the latter will be
investigated as part of this thesis.
2.7.1.1.1 Tribopair
The surfaces used for tribology along with the lubricant, help determine friction. In
a tribometer there are two surfaces, traditionally a stainless steel ball and a stainless
steel disk. However this is of little relevance to both the food and cosmetic industry as
the surfaces do not deform which does not represent either a skin or mouth feel
(Dresselhuis et al., 2008). Tribological studies in the cosmetics and food industry tend
to use either two soft surfaces; elastomer disk with a (polydimethyl siloxane (PDMS))
ball or an elastomer disk with a steel ball (Dresselhuis et al., 2007, Timm et al., 2011).
Garrec and Norton (2013) showed that an elastomer-steel ball combination produced the
lowest margin of error when investigating hydrocolloid solutions. Consequently this
tribopair was used for the work presented in this thesis.
2.7.2 Sensory Perception and Tribology
Verhagen and Engelen (2006) stated that there are multiple factors that affect the
mouthfeel of food products. This makes it difficult for industries to correctly predict
how a consumer may respond to new innovative products without using sensory panels.
Tribological measurements have been shown to relate lubrication properties with both
mouthfeel (Malone et al., 2003) and skinfeel (Kusakari et al., 2003). Malone (2003)
related the frictional values of varying fat contents (measured in a tribometer) with
‘fattiness’ scores obtained from a sensory panel. Similarly in the cosmetic industry,

2. Literature Review
42
Kusakari et al. (2003) utilised a tribological technique to relate frictional values of
different moisturisers with ‘spreading and ‘stickiness’ scores obtained from a sensory
panel. However is should be noted that in both systems utilise solids suspended in a
liquid. To the authors knowledge there is no evidence of sensory perception for solid
waxes (lipsticks) being related to frictional values. Therefore there is a need to
investigate the possibility of using a tribometer in assessing how a formulation will be
perceived by a consumer.

2. Literature Review
43
2.8 Controlled Release from Colloidal Structures
Release from colloidal structures has been observed in the pharmaceutical and food
industry (Pothakamury and Barbosa-Cánovas, 1995). Controlled release is defined as a
method by which active agents/ ingredients are made available to a desired site and time
at a specific rate (Pothakamury and Barbosa-Cánovas, 1995). Traditionally, controlled
release is achieved using a microencapsulation technique whereby the desired
component is sealed in capsules and is released upon the influence of stimuli (such as
temperature or pH). The controlled release of the active agent is governed by diffusion,
biodegradation, swelling or osmotic pressure (Pothakamury and Barbosa-Cánovas,
1995). For the purpose of this thesis release by diffusion will be discussed.
2.8.1 Release via Diffusion
There are two main systems (reservoir and matrix) by which controlled release
occurs via diffusion.
2.8.1.1 Reservoir Systems
In a reservoir system the active is surrounded by a rate-controlling barrier. The
barrier can be non porous, macroporous or microporous (Langer and Peppas, 1983b),
with the release rate dependent on the thickness, area and permeability of the membrane
(Baker, 1987). There are 4 steps involved with the release of an active from a reservoir
system (Himmelsten, 1991);
1. Diffusion of the active through the reservoir
2. Dissolution or partitioning of the active agent between the reservoir fluid and the
barrier.
3. Diffusion through the barrier

2. Literature Review
44
4. Transport away from the barrier.
Barrier controlled release has been reported in the literature. Frasch-Melnik et al. (2010)
used fat crystals as Pickering particles to create a barrier which prevented the release of
salt from the reservoir. They also showed that melting the fat crystals resulted in the
barrier being destroyed which allowed the release of the active.
2.8.1.2 Matrix Systems
In a matrix system, an active agent is dissolved throughout a polymer mass (i.e. a
gel structure). The release behaviour depends on the type of carrier material, the
geometry of the system and the amount of active agent (Pothakamury and Barbosa-
Cánovas, 1995). There are three steps involved with release of an active from a matrix
system (Himmelsten, 1991);
1. Diffusion of the active of the active to the matrix surface
2. Partition of the active between the matrix and the surrounding environment.
3. Transport away from the matrix surface.
The release of volatiles from matrix (gel) structures were investigated by both Boland et
al (2006) and Juteau et al. (2004). Boland et al (2006) showed that the use of pectin
lowered the partition coefficient with slowed the release of hydrophobic compounds
(methyl anthranilate). Juteau et al. (2004) showed the use of a polysaccharide (iota-
carrageenan) reduced the amount of ethyl hexanoate released as the mass transfer
coefficient and the partition coefficient is reduced.

2. Literature Review
45
2.8.2 Release in Application
In recent years, there has been a drive towards understanding the release of food
actives during application/use.
Koliandris et al (2008) used a texture analyser (with a two compression repeat model)
to investigate the effect of structural breakdown on the release of sodium ions trapped in
varying gel structures. They showed that the differences in salt concentrations were
related to the strain at rupture and to the extent of fracture during compression. Mills et
al. (2011) took this idea further by using a seven stage compression model (to mimic
chewing) to monitor release of salt from gels. Results showed that when structural
breakdown occurred (after point of fracture), salt was released from the structure
whereas minimal release occurred before fracture (Mills et al., 2011).

3. Materials and Method
46
Chapter 3. Materials and
Methodology
3. Materials and Method
47
3.1 Introduction
This chapter provides detailed information on the materials used and the methods
utilised for sample formation and instrumental analysis. It also includes some theory
behind the analytical techniques.
3.2 Materials
3.2.1 Waxes and Emulsifiers
All materials (castor oil, carnauba wax, microcrystalline wax, hard paraffin,
performalene, Eutanol G, Butylated Hydroxytoluene BP, Multiwax X145 AH, Ocytl
Palmitate, Indopol H-100, Softisan and Parsol MCX) used to produce the continuous
phase of emulsions were supplied by Alliance Boots PLC (UK). These were used in
combination with double distilled water and various emulsifiers: polyglycerol
polyricinoleate (PGPR (HLB 1.5)) (Palsgaard, Denmark), sorbitan olivate (HLB 4.3)
(Aston Chemicals, UK), monoolein (HLB 3.6) (Cargill, Spain) or monostearate (HLB
3.2) (Cargill, Spain) to produce emulsions.
3.2.2 Tribometer Surfaces
Two surfaces were used in tribology studies conducted within this thesis: elastomer
discs and stainless steel balls. The elastomer discs (4 mm White Silicon Sheet, Samco
Silicon Products) were cut from large sheets and used as supplied. The stainless steel
balls were ¾ inch diameter AISI 400 stainless steel (PCS Instruments, London).

3. Materials and Method
48
3.3 Sample Formation
This section discusses the methods used to form the various wax/oil blends, which
were then used as the continuous phase when producing an emulsion
3.3.1 Wax/Oil Blends
All wax/oil blends were prepared by first weighing the exact weight percentage of
each component and melting until molten (~90 °C) using a hot plate and magnetic stirrer
(This took approximately 30 minutes depending on batch size). Once molten wax/oil
blends were poured into a variety of moulds (explained in individual analytical method
sections later (section 3.4)). Moulds were then cooled quiescently by placing into a
freezer for approximately 20 minutes (cooling rate 2.4 0.2 °C/min) to allow for the
wax/oil blend to crystallise.
For all studies (unless otherwise stated), that compared wax/oil blends with
emulsions, 2 wt % PGPR was added to the wax/oil blend in order to monitor the effect
of incorporating water into the microstructure.
3.3.2 Emulsions
Emulsions in this thesis were produced using two techniques; a batch process and a
continuous process.
3.3.2.1 Batch Process
A continuous phase formulation containing castor oil (40 - 95 wt %), carnauba wax
(0 - 20 wt %), microcrystalline wax (0 – 20 wt %) and paraffin (5 wt %) or
performalene (5 wt %) was melted with either PGPR, sorbitan olivate, monoolein or
monostearate (0.2 - 5 wt %) and the aqueous phase (distilled water, 10 – 40 wt %) in
varying quantities until molten (~90 °C). The pre-mixture was emulsified for 5 minutes
using a Silverson L4RT (Silverson Machines Ltd, UK) high shear mixer at ~75 °C,

3. Materials and Method
49
fitted with a fine emulsifier screen (pores ~1 mm) at ~10,000 rpm. Following
emulsification, the emulsion was poured into moulds and cooled quiescently by placing
in a freezer for 20 minutes (cooling rate: 2.4 ± 0.2 °C / min) to allow for the continuous
phase to crystallise.
3.3.2.2 Continuous Process
Emulsions were prepared using a bench-scale process commonly used in the food
industry called a “margarine line” composed by a Scrapped Surface Heat Exchanger
(SSHE) and a Pin Stirrer (PS). This unit was chosen as it can both emulsify and can
control crystallisation during the process.
The SSHE unit (volume ~40 mL) includes a shaft, onto which two series of seven
blades are diametrically attached, rotating in a fixed jacketed envelope (Figure 3.1a).
The PS unit (volume ~150 mL) includes a shaft, onto which four series of pins are
attached in “cross” shape, rotating in a fixed jacketed envelope (Figure 3.1b).

3. Materials and Method
50
Figure 3.1– Schematic representation of (a) the scraped surface heat exchanger (SSHE) and (b)
the pin stirrer (PS). Key dimensions are labeled. This Figure shows the inlets and outlets
(represented with arrows) of both the cavity and jacket.
A pre-emulsion was formed at ~ 90 C using an overhead stirrer fitted with an
anchor shaped impeller until homogeneous for 5 min, and then passed through either the
SSHE unit only or the SSHE unit combined with the PS unit. The margarine line offers
the possibility to adjust 3 different parameters: the flow rate through the unit(s), the unit
Water In
Water Out8mm
7mm
136mm110mm
24mm
32mm
113mm
Water In
Water Out
4mm
28mm
12mm
146mm
4mm
11mm
13mm
28mm
155mm
(a)
(b)

3. Materials and Method
51
jacket temperature and impeller rotational velocity (IV)) of both units. In this thesis,
these parameters were varied as follow; 3 flow rates (30, 60 and 90 mL/min), 4
temperatures (55, 60, 65 and 80 C) and 2 IV for the SSHE unit (500 and 1500 rpm) and
3 IV for the PS unit (500, 1000 and 1500 rpm). A schematic representation of both the
SSHE and PS set up is shown in Figure 3.2.
Figure 3.2 – Schematic representation of experimental set-up used for continuous process
experiments where (1) is scrape surface heat exchanger (SSHE) and (2) SSHE and pin stirrer.
The chosen temperatures were selected specifically based on the crystallisation of
the continuous phase (this will be discussed in Chapter 4). Thermocouples, placed
before and after both units, were used to measure the temperature in order to obtain an
insight into the crystallisation occurring in the process. It is important to note that for
Vessel
containing
various
formulations
Peristaltic Pump
Hot
Plate
Overhead
Stirrer
Tin
T exit
Scrape
Surface
Heat
Exchanger FreezerMould
Water Bath
Peristaltic Pump
Hot
Plate
Overhead
Stirrer
Tin
T exit/in
T exit
Scrape
Surface
Heat
Exchanger
Pin Stirrer FreezerMould
Vessel
containing
various
formulations
1
2
Water Bath Water Bath

3. Materials and Method
52
experiments with set up 1, an additional two temperatures (70 and 75 °C) were
investigated as results indicated a trend that required further investigation. Following
emulsification, the emulsion was placed in a freezer for 20 minutes (cooling rate: 2.4 ±
0.2 °C / min) to allow for the continuous phase to fully crystallise.
The composition of the continuous phase used throughout the continuous process
study was 85 wt % castor oil (CO), 5 wt % carnauba wax (CW) and 10 wt %
microcrystalline wax (MW). This composition was chosen as results in this work have
shown that this provided a melting profile suitable for lipstick application (discussed
later in Chapter 4). Emulsions passed through the SSHE unit only were composed of 88
wt % oil (continuous) phase, 10 wt % water (dispersed phase) and 2 wt % PGPR. For
emulsions passed through both units the continuous phase was altered to contain 80 wt
% CO, 5 wt % CW, 10% wt MW and 5 wt % paraffin (keeping the amount of water and
PGPR the same. The addition of paraffin to the composition strengthens the emulsion
(Le Révérend et al., 2011a) which renders the material property analysis possible;
attempts were made to characterise material properties of emulsion passed through the
whole unit and containing no paraffin, but the formulation was too soft to perform any
measurement. Oil phase with added paraffin when required and PGPR was heated up to
90 C and gently stirred for about 1h. Water was also heated up to 90 C and added to
the oil phase to form the pre-emulsion as mentioned above.
3.3.3 Tribology Set-Up
3.3.3.1 Pin and Disc
A mini traction machine (MTM PCS Instruments, London) was used to investigate
the lubricating properties of both waxes and emulsions. The machine consists of a ball
loaded onto an elastomer disc. In a pin and disc set up, the ball remains stationary and

3. Materials and Method
53
the disc rotates. This results in a contact zone between the two surfaces being produced,
where the material is assessed.
3.3.3.1.1 Sample Preparation
Waxes and emulsions were moulded in a specific manner, so they could be assessed
using a tribological technique. Initially, an elastomer disc was cut out from supplied
sheets and cleaned by sonicating in ethanol (5 min) and then water (5 min). Once clean,
the elastomer disc was placed into a mould (similar design to the cutter) which had a
raised aluminum frame (3 mm). Molten wax or emulsion was then poured into the
mould and placed into the freezer for 20 minutes. Once fully crystallised the top of the
mould was scraped using a flat stainless steel blade to allow a flat surface to be
analysed. Each disc (with 3 mm of material) was analysed once with five repeats of
each material. Secondly, a stainless steel ball was cleaned by sonicating in ethanol (5
min) and water (5 min). It is important to note that these were reused following the
same cleaning procedure.
3.3.4 Release Experiments (Chapter 7)
Experiments were conducted using two different experimental set ups. For quiescent
release, a vessel (Figure 3.3) was used to study the release of glycerol at three different
temperatures (20 °C (room temperature), 32 °C (lip temperature) and 80 °C (above
melting temperature of continuous phase). For release under compression, a cylindrical
vessel (Figure 3.3) was placed on a heated plate (lip temperature), beneath a 40 mm
diameter texture analyser (Stable Micro Systems, TA XT2) probe to investigate the
effect of cyclic compression (compression every 3 minutes) on release. This method
was similar to that shown by Mills et al (2011). In both systems, 0.5 ml of solution were
taken at regular intervals and analysed via FT-IR to calculate the amount of glycerol
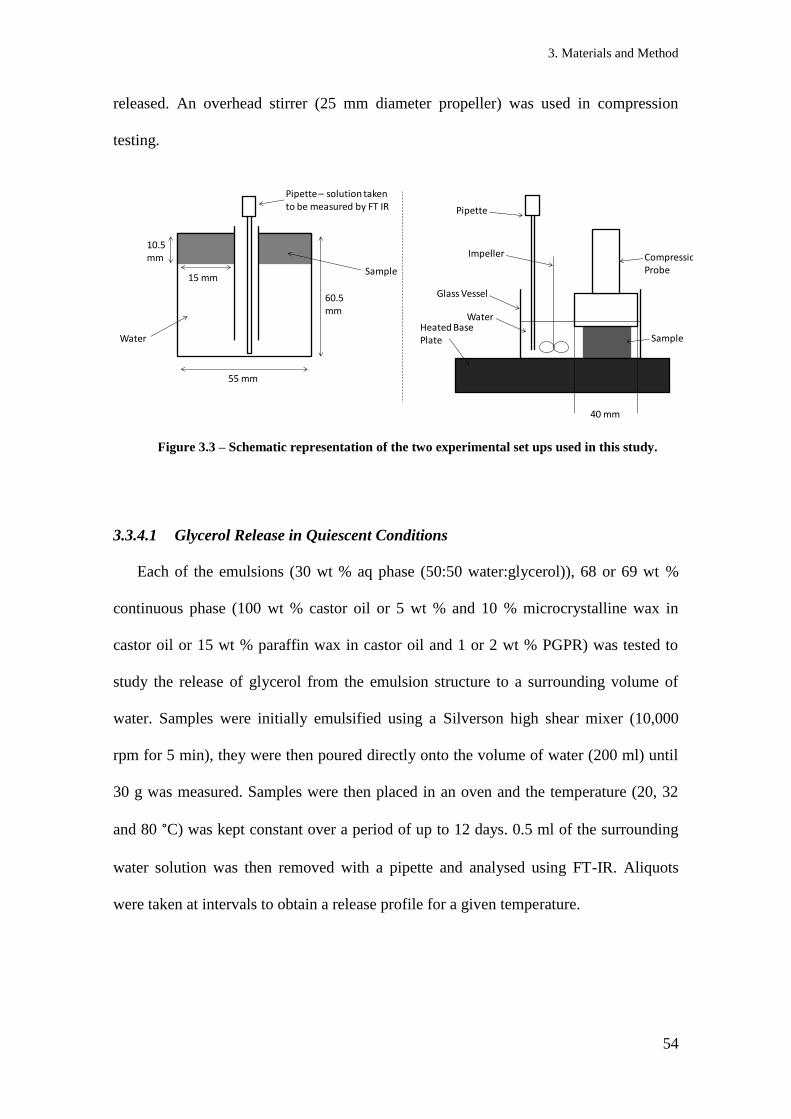
3. Materials and Method
54
released. An overhead stirrer (25 mm diameter propeller) was used in compression
testing.
Figure 3.3 – Schematic representation of the two experimental set ups used in this study.
3.3.4.1 Glycerol Release in Quiescent Conditions
Each of the emulsions (30 wt % aq phase (50:50 water:glycerol)), 68 or 69 wt %
continuous phase (100 wt % castor oil or 5 wt % and 10 % microcrystalline wax in
castor oil or 15 wt % paraffin wax in castor oil and 1 or 2 wt % PGPR) was tested to
study the release of glycerol from the emulsion structure to a surrounding volume of
water. Samples were initially emulsified using a Silverson high shear mixer (10,000
rpm for 5 min), they were then poured directly onto the volume of water (200 ml) until
30 g was measured. Samples were then placed in an oven and the temperature (20, 32
and 80 °C) was kept constant over a period of up to 12 days. 0.5 ml of the surrounding
water solution was then removed with a pipette and analysed using FT-IR. Aliquots
were taken at intervals to obtain a release profile for a given temperature.
Pipette – solution taken to be measured by FT IR
Sample
Water
10.5 mm
15 mm
60.5 mm
55 mm
Glass Vessel
WaterHeated Base Plate
Pipette
Impeller Compression Probe
Sample
40 mm

3. Materials and Method
55
In order to employ FT-IR spectroscopy as a technique for measuring glycerol
release from an emulsion structure, it is important to construct a calibration curve of
known glycerol concentrations. Therefore 25 fold dilutions (assuming that a mix of 50
% water and 50 % glycerol represents a 100 % stock solution) were produced by
diluting the stock solution. This was done by removing 10 ml of the stock (taken for
testing) and adding 10ml of distilled water to the remaining solution, thus allowing a
range of dilutions to be produced with a molarity of 7.2 – 326 nM. Each dilution was
then measured with an FT-IR between 1400 – 800 cm-1
. Figure 3.4 shows the peaks
obtained for 0, 24, 48 and 100 % glycerol solutions. From these curves, it is clear that 2
main peaks were observed at ~1110 and 1045 cm-1
. This broad peak is indicative of the
C-O bond for glycerol (Higson and Amus, 2004). It is important to note that the FT-IR
can detect the O-H bond present in glycerol (at ~3350 ± 50 cm-1
). However this peak
would overlap with the O-H bond in water and therefore were not considered for
analysis. Niewoudt et al (2004) utilised FT-IR to investigate the release of glycerol
from both red and white wine. Their results also detected a peak between 1100 – 1075
cm-1
.
The area under these curves was calculated using the trapezium rule (Allison et al.,
1995) and related to the percentage of glycerol (Figure 3.5) From Figure 3.5 it is
observed that a linear fit which passes through the origin (R2 of 0.993) is obtained,
resulting in the equation;
Equation 3.1
Where A is the area under the curve and Gc is the glycerol concentration (wt %).
This equation was then utilised to calculate the amount of glycerol released for each
sample that was being assessed.

3. Materials and Method
56
Figure 3.4 - FT-IR spectra (940-1160 cm-1
) of varying glycerol concentrations.
Figure 3.5 - Calibration Curve for all glycerol concentrations
3.3.4.2 Mathematical Modelling
The effective diffusivities of each system were obtained using the diffusion model
in COMSOL multiphysics (COMSOL Inc. Burlington), MA, USA), for a comparison to
Wavelength (cm-1
)
950 1000 1050 1100 1150
Absorb
ance (
a.u
)
0.035
0.040
0.045
0.050
0.055
0.060
0.065
0.070
Water
24 wt % Glycerol
48 wt % Glycerol
100 wt % Glycerol
wt % of glycerol
0 20 40 60 80 100
Are
a U
nd
er
Cu
rve
(A
UC
)
0.0
0.2
0.4
0.6
0.8
1.0
A = 0.0083 G

3. Materials and Method
57
the experimental data, this followed a modeling technique shown by Mills et.al.
(2011).The experimental arrangement was drawn in three dimension using the transient
diffusion model showing the emulsion sitting on the body of water. The diffusion
equation was used to calculate the effective diffusivities.
Equation 3.2
Where c is the concentration of glycerol, D is diffusivity and t is time. The
diffusivity of the water was set to 10 m2s
-1 assuming instantaneous mixing once glycerol
has been released from the emulsion structure. The external boundaries of the water
were set to insulate and the temperature was set to 20, 32 and 80 °C. COMSOL was
linked to MATLAB (Mathworks, Cambridge) and run to calculate the diffusivities for
comparison to the average experimental data for each experiment. To improve the
accuracy for the values of diffusivities three iterations were conducted to minimise the
sum of squares between the experimental and theoretically predicted data.
Figure 3.6 – 3D geometry used with COMSOL. Dimensions match those used in experimental
work. Sample is located at the top and is equivalent to 30 g. Water (200 ml) is located on the
bottom.

3. Materials and Method
58
3.3.4.3 Glycerol Release Under Uni Axial Compression
The effect of cyclic (every 3 minutes) uniaxial compression on the release of
glycerol from an emulsion structure was investigated. Samples were initially
compressed in order to determine which strains should be used for testing (Figure 3.7).
From this test three different strains were chosen; 7 % (no destruction of sample), 20 %
(after the point of fracture of sample) and 90 % (full compression of sample). Samples
were held fixed within the testing vessel by lowering the compression arm into contact
with the sample. 200 ml of water was then added to the vessel and cyclic compressions
(7 compressions in total) were conducted every 3 minutes for a total of 20 minutes (with
the first compression occurring at 0 minutes). All measurements were conducted at 32
°C to mimic release at lip temperature.
Figure 3.7 – Stress strain curves for an emulsion containing 30 % aqueous phase (50:50 mix of
glycerol: water). Tests were performed at a constant rate of 1 mm/s to a strain of 90 %.
Strain (%)
0 20 40 60 80
Forc
e (
N)
0
2
4
6
8
10
12
14
16
Run 1
Run 2
Run 3

3. Materials and Method
59
3.4 Analytical Method
Throughout this thesis, a variety of different analytical techniques and tools were
used. This section outlines the analytical procedures that were followed for each
technique.
3.4.1 DSC (Chapter 4)
The melting properties of continuous phase formulations and emulsions were
investigated using a Differential Scanning Calorimeter (Perkin Elmer DSC Series 7,
UK), equipped with thermal analysis software (Pyris). DSC is a thermo analytical
technique which is frequently used to study thermal changes in foods (Fava, 1968,
Yildiz and Unluturk, 2009). The principle of power compensation DSC is highlighted in
the schematic diagram below (Figure 3.8). The reference pan contains only air whereas
the sample pan will contain the sample. The key to this technique is that both pans are
kept at the same temperature during an isothermal or temperature ramp experiment
(Yildiz and Unluturk, 2009). This can be done at various rates of temperature increase
(e.g. 5°C per minute or 10°C per minute).
Figure 3.8 - Schematic of Power compensated DSC
The computer controls the temperature of both pans which have individual heaters
and keeps the rate of heating constant. More energy is required to heat the sample pan,

3. Materials and Method
60
therefore the heater heating this pan has to work harder than the heater for the reference
pan. The machine then measures how much more heat is required to keep the pans at the
same temperature and this is plotted as a graph of heat flow against temperature (Figure
3.9) . Figure 3.9 shows the three different peaks that can be obtained from a DSC
measurement. Tg is the glass transition temperature, this only occurs with polymers and
is not applicable for this thesis. Tc is the crystallisation temperature; this is the
temperature at which the molecules in the sample start to arrange and phase transition
occurs from a liquid to a solid. This releases heat, as a result the heater which heats the
pan no longer has to, and therefore a dip in curve is observed (the Tc is the temperature
at the lowest part of the peak). From this curve we can determine the latent heat of
crystallisation which is the energy required to accomplish a phase change from a liquid
to a solid at a constant temperature. This can be calculated from the following equation;
Equation 3.3
Where, Q – heat energy transferred (J), M – mass (g) and ΔHC – latent heat of
crystallisation (J g -1
)
Once the crystallisation temperature is known it can help improve the procedure of
making certain emulsions, as the crystallisation of the waxes is crucial to the
microstructure of the product.
The rate of crystallisation is also important as it has been found that the rate can be
related to the size of crystals formed. As wax crystals stabilise the W/O interface, the
smaller the crystals, result in a higher proportion of interface being stabilised which is
essential for emulsions.

3. Materials and Method
61
Figure 3.9 - Graph of Heat Flow Vs Temperature (where Tg - glass transition temperatue, Tc -
crystillisation temperature and Tm - melting temperature)
The melting temperature (Tm) is the temperature at which most of the molecules in
the sample melt resulting in a phase transition from solid to a liquid. This is the opposite
to crystallisation, therefore the sample absorbs heat, which means the heater has to heat
the sample pan to keep it at the same temperature as the reference pan, hence a peak is
observed (Figure 3.9).
By using the equation previously mentioned the latent heat of melting can be
calculated, which is the energy required for a phase transition from solid state to liquid
state.
In reality the melting of the sample starts at the start of the peak (Tonset) and ends at
the end of the peak (Tend). This temperature range is crucial for the product as it is
critical for the products performance. This is due to the fact that the consumer requires
the product to be solid at room temperature and for it to be able to spread when it comes
into contact with the lips (~32°C).
Throughout this thesis the instrument was calibrated for temperature using indium
and tin, with an empty aluminum pan as a reference. Samples were loaded into 50 µL

3. Materials and Method
62
capacity aluminum pans, and sealed with aluminum covers. Pans were heated at a rate
of 10 °C/min, from a range of 10 ° C to 120 ° C.
The expected melting enthalpies of continuous phase formulations were calculated
from pure samples of both carnauba wax (Figure 3.10a) and microcrystalline wax
(Figure 3.10b). For example, for a formulation containing 5 wt % carnauba wax (in
castor oil) the expected melting enthalpy wax calculated as 5 % of the melting enthalpy
for a 100 % pure carnauba wax sample.

3. Materials and Method
63
(a)
(b)
Figure 3.10 – Melting Profile curve for (a) 100 wt % carnauba wax and (b) 100 wt %
microcrystalline wax. The samples were heated at a rate of 10 °C/min.
Temperature (C)
20 40 60 80 100
Sp
ecific
He
at
(J/g
*C)
0
5
10
15
20
25
Melting Enthalpy: 147 5.6 Jg
-1
Temperature (C)
20 40 60 80 100
Sp
ecific
He
at
(J/g
*C)
0
1
2
3
4
5
6
Melting Enthalpy: 115 1.5 Jg-1
3. Materials and Method
64
3.4.2 NMR (Chapter 4, 5, 6 and 7)
Droplet size measurements were performed using a pulsed field gradient NMR
equipped with a water droplet size application (restricted diffusion) (Minispec mq
series, Bruker Optics, UK) at ~5 °C in order to measure the volume-weighted mean
droplet diameter (d3,3).
The use of NMR for droplet size determination in W/O emulsions has been well
documented by both Brucker (2001) and van Duynhoven et al. (2002a). It should be
noted that, not only is this technique fast and non destructive, but it can be used to give
micro structural parameters which can be linked to shelf life and mouth feel (Bruker,
2001, van Duynhoven et al., 2002b, van Duynhoven et al., 2002a). The theory behind
NMR measurements will now be discussed.
3.4.2.1 Theory of NMR measurements
The movement of protons within a sample is measured using a low field NMR.
Initially a magnetic field is applied. Once applied the protons align with the magnetic
field, rotating around an axis parallel to the field lines, and showing a net magnetisation
which is in the direction of the magnetic field (along the z-axis). This is known as
vector M.
Different radio frequencies (90° and 180° pulses) are applied to the rotating frame.
At a 90° pulse along the x’ axis, vector M rotates 90° clockwise in the y’z’ plane,
resulting in vector M pointing in the y’ direction (open position) (Figure 3.11). At a 180
pulse, vector M rotates 180 resulting in vector M pointing in the z’ direction (close
position) (Figure 3.11) (Bruker, 2001).

3. Materials and Method
65
Figure 3.11 – Examples of effect of radio frequencies pulses on rotating frame in the direction
of vector M where (a) open position after a 90° pulse and (b) closed position after a 180° pulse
(Image taken from Bruker Minispec mq Droplet size manual).
When different radio frequencies are applied in a specific order it is known as the
Hahn spin echo sequence. This is the sequence used to monitor the movement of
protons. The sequence consists of switching between the open and close states of vector
M after a given time, τ. As a sample contains many protons and vector M is composed
of many magnetic moments each of which have different velocities. After the 90° pulse
the protons move at different velocities and ‘fan out’ (Figure 3.12a and Figure 3.12b).
Once the 180° pulse is applied the magnetic moments are transposed through the y axis
(Figure 3.12c). The movement of protons is now reversed and the ‘fan’ is closed (Figure
3.12d). At time 2 τ, the signal is refocused as a single vector M, resulting in a sharp
echo-signal being received on the oscilloscope. After 2 τ the fanning out begins again,
and the signal height decreases (Bruker, 2001).
Open Closed

3. Materials and Method
66
Figure 3.12 – Schematic of the movement of protons after Hahn spin echo sequence is applied
where (a) is a 90 pulse (b) protons start to fan out after a magnetic field is applied (c) all signals
rotate 180° after a 180° pulse and (d) the protons refocus and the fan closes (Image taken from
Bruker Minispec mq Droplet size manual).
.
Field gradient pulses are then applied for short times in conjunction with the Hahn
Spin-Echo sequence (Figure 3.13). This is done to measure the diffusion of protons
within a sample. Diffusion coefficients are determined by applying field gradient pulses
which move vector M within the xy plane over a specific angle. When a pulse (90°) is
applied the fanning out of Vector M begins, after which a field gradient pulse is applied
resulting in any particular magnetic moment experiencing a different field gradient
strength. This causes that particular magnetic moment to be displaced at different
angles. Then a 180° pulse is applied with the second field gradient pulse. If there was no
diffusion the ‘fan’ would close and the same signal will be given, however as there is
diffusion of the protons which are displaced from different locations within the xy
plane, resulting in a loss of signal and small signal (known as an attenuated echo) to
become present at 2τ (Bruker, 2001).
(a) (b)
(c) (d)

3. Materials and Method
67
Figure 3.13 – Hahn Spin Echo sequence with field gradient pulses (adapted from Bruker
Minispec mq Droplet size manual).
The ‘R-Value’ can be obtained from the relationship between echo attenuation (Mg)
with the peak obtained without the application of field gradient pulse (Mo) in the form
of a ratio; Mg / Mo. In a system where there is unrestricted diffusion of the protons
(Figure 3.14a), the diffusion rate can be calculated by plotting a graph of R value vs the
length of time between the two starting points of field gradient pulses Δ. The slope of
this line provides details about the rate of diffusion. The greater the gradient, the higher
the rate of diffusion. However when analysing W/O emulsions, the movement of the
water protons behave in a restricted regime. The regime is restricted as the protons will
be able to move but only within the limits of the droplet. This limit can be seen in
Figure 3.14b as Δ is increased the R value becomes constant (Bruker, 2001).
Time (ms)
Puls
e se
quen
ce a
nd
res
ponse

3. Materials and Method
68
Figure 3.14 – Graph of R (Mg/Mo) Vs time between field gradient pulses (Δ) for (a) unrestricted
and (b) restricted diffusion (Image taken from Bruker Minispec mq Droplet size manual).
In order to determine the droplet size distribution a series of measurements are
carried out. First an experiment is carried out where δ (the length of time for each field
gradient pulse) is fixed and Δ is varied followed by fixing Δ and varying δ. Packer and
Rees utilised these experiments in 1971 to give information for an emulsion sample
(Packer and Rees, 1971). The Hahn spin echo experiment is slightly varied when
working out droplet size distribution as the time of measurement (Δ) required to gain a
signal is too long. Therefore the second field gradient pulse is split into two 90° pulses
(Bruker, 2001).
One of the major issues when analysing W/O emulsions is that there are also
protons within the oil phase. Therefore it is crucial to nullify the magnetisation of the
protons within the oil phase after the first 90° pulse. The two different types of protons
(oil and water) have different relaxation times, the oil protons relaxes at a quicker rate
and therefore if a 180° pulse is used before the modified Hahn Spin-Echo sequence
(Figure 3.15 (van Duynhoven et al., 2007)) the oil proton magnetisation is 0 and only
(a) (b)

3. Materials and Method
69
the water protons have magnetisation, which results in the oil proton signal being
repressed (Van Den Enden et al., 1990, Goudappel et al., 2001, van Duynhoven et al.,
2002a) (Bruker, 2001).
Figure 3.15 – Schematic of a modified Hahn spin echo sequence for measuring W/O emulsions.
Where the 180 pulse- τo sequence (prevents the oil proton signal being received), G - Gradient
strength, δ – gradient duration, Δ - time between gradient pulses and E –the echo (otherwise known
as Mg) (Image modified from Van Duynhoven et Al., 2007)
Before using the acquired data to calculate the droplet size a couple of assumptions
need to be made. Firstly, that the droplets within the emulsion are spherical (Hindmarsh
et al., 2005) and secondly, that the distribution is log normal (Bruker, 2001).
The Bruker Minispec then generates values of volume weighted mean droplet
diameter (d3,3) and the standard deviation of the logarithm of the droplet diameter (σ).
d3,3 represents the midpoint of the frequency distribution of droplet sizes.
Overall NMR is a valuable tool for predicting droplet size, however there is one
flaw. This is that all data is fitted to a log normal shape curve. This can be an issue if a
W/O emulsion has a bimodal distribution. Therefore the NMR generates a number
(known as ‘free water’) for any proportion of water droplets greater than 100 μm in

3. Materials and Method
70
diameter. The free water is not included in the droplet size calculation but is recorded
separately as a percentage of the total water content.
Throughout this thesis samples were poured into 10 mm NMR tubes and filled to a
height of 10 mm. Samples were then placed into a freezer for 20 minutes. All samples
were stored at room temperature prior to analysis. All NMR analysis was conducted
either on day 0, 1, 7, 10 and 180 after manufacture (where day 0 is day of manufacture).
The mean droplet size (d3,2) was then calculated using Equation 1.2 (van Duynhoven
et al., 2002a):
Equation 3.4
where, d3,2 is the surface-weighted mean droplet diameter, d3,3 is the volume-
weighted mean droplet diameter, and σ is the standard deviation of the logarithm of the
droplet diameter.
3.4.3 Interfacial Tension (Chapter 4)
Interfacial tension measurements of emulsifiers (in castor oil) were carried out in
order to assess their surface active properties. Emulsifiers (PGPR, monoolein,
monostearate and Sorbitan olivate were prepared at the concentrations used for
emulsification (2 wt %).
The interfacial tension between castor oil (containing 2 wt % of emulsifiers) and
water was assessed using Kruss K100 tensiometer. Measurements were conducted using
a Wilhelmy plate (standard plate – platinium, width – 19.9 mm, height - 10 mm and a
depth - 0.2 mm) method. Sample vessel (diameter 70 mm, capacity of 121.5 ml) was
used for all measurements, with ~45 ml of castor oil (2% emulsifier) and 25 ml of

3. Materials and Method
71
double distilled water. Measurements were taken over 2,000 seconds with a surface
detection speed of 15 mm/min. Measurements were performed in triplicate.
3.4.4 Microscopy (Chapter 4, 5 and 6)
Cyro-scanning electron microscopy (SEM) and polarised microscopy were used in
this research to visualise the microstructure.
3.4.4.1 SEM
Electron microscopes (EMs) are valuable tools in determining the microstructure of
products in the range of nanometers (nm) to micrometers (μm). EMs were invented to
overcome the magnification limitations of light microscopy, thus allowing 10,000 x
magnification of microstructures (Bettina Voutou and Stefanaki, 2008). The first EMs
was reported by Marton in 1934 who utilised the technology to view biological images
(Heidenreich, 1964). EMs operate in a similar manner to light microscopy, however
instead of using light for imaging, a highly focused beam of electrons is used. SEM is
conducted under high vacuum which can cause an issue for samples containing water.
However this issue can be overcome by using cryo SEM. In this technique a sample is
frozen cryogenically by submersing the sample in liquid nitrogen. The internal structure
of the sample is then revealed by fracturing the frozen sample. The sample is then
etched, by increasing the temperature to ~95 °C which causes the surface ice that has
been formed to disappear revealing a stronger image.
Freeze fracture cryo SEM has been used to image a variety of different emulsions
which contain a water content (Ge et al., 2006, Norton et al., 2009, Frasch-Melnik et
al., 2010, Wang et al., 2012). Ge et al.(2006) utilised cryo SEM to investigate the
fracture behaviour of colloidal polymer particles in fast frozen suspensions. Figure 3.16
gives an example of an image that was obtained.

3. Materials and Method
72
Figure 3.16 – Cryo SEM image of an acrylic latex particle (taken from Ge et al., 2006)
Throughout this research a XL-30ESEM (Philips, the Netherlands) SEM was used
for analysis. The structure of the sample was preserved using cryogenic temperatures
(below -150 ° C). The sample was attached onto a sample holder and rapidly frozen by
immersion into a liquid nitrogen bath for approximately 2 minutes. The sample was
then transferred to the high vacuum cryo-unit chamber and freeze-fractured. A thin
layer of platinum was sputtered onto the surface. The sample was then moved into the
observation chamber, and observations were carried out at 3 - 5 kV at temperature
between -100 and -180 °C.
In samples examined in Chapter 7, a variety of etching times (0 – 15 min) were used
to examine the effect of waxes at the interface. In the etching process, samples were
heated from – 180 °C to – 85 °C following immersion into liquid nitrogen. Samples
were then transferred to the high vacuum and followed the previous procedure.

3. Materials and Method
73
3.4.4.2 Polarised Microscopy
Polarised Micrographs were obtained with a Brunel SP300F digital camera (Canon
1000D, Bruneleus Microscopes Ltd., UK) fitted with an optical light microscope (Brunel
Microscopes Ltd., Wiltshire, UK).
3.4.5 Gravimetric Analysis (Chapter 4)
Gravimetric analysis was carried out using a standard bench top balance (Denver
Instruments, Model: SI-234, UK). Samples were molded into bullets using a standard
lipstick mould (supplied by Alliance Boots) and placed into three different storage
conditions 20 °C (Room temperature to mimic storage conditions), 30 °C (to mimic lip
temperature) and cyclic conditions (-10 – 40 °C every 4 hours to test how robust the
product was) in order to investigate water loss over a products life cycle. The weight of
each sample was recorded on day 0, 1 month and 3 months. All tests were performed in
triplicate. Each sample was weighed without the holder lid in order to allow any
moisture that has been released during storage to be accounted for.
3.4.6 Texture Analysis (Chapter 5, 7)
Texture analysis is a destructive technique that measures the mechanical properties
of a given material. The technique monitors a force over time as the material is
deformed. As a result a variety of parameters can be determined which gives an insight
into how a material will behave. To obtain this force a variety of different tests (which
utilise different geometries) can be used. These include penetration depth, 3 point bend
and compression testing (Schematics shown in Figure 3.17).
Penetration depth testing involves using a needle to penetrate the material
until a given force is observed (Figure 3.17a). The distance penetrated then
gives an indication into how hard a material behaves. For example the harder

3. Materials and Method
74
the material the less distance the needle will travel and vice versa for a softer
material.
The 3 point bend test has 3 points of contacts with the material being tested.
A load is then placed in the centre of the material and moved downwards
(Figure 3.17b). This can measure a variety of parameters.
In compression testing the material is compressed at a specific rate (Figure
3.17c), allowing analysis of a variety of parameters. Initially the material
will fracture under load and then spread.
Figure 3.17 – Schematic representation of (a) penetration depth, (b) 3 point bend test and (c)
compression testing.

3. Materials and Method
75
Throughout this thesis the mechanical properties of both continuous phase
formulations and emulsions were determined by compression. This was conducted
using a TaXT+ (Stable Microsystems, UK) texture analyser. Compression testing was
chosen as it is a quantitative method that could be comparable to a qualitative technique
currently used in Alliance Boots. Currently Alliance Boots use a trained expert to
compress a lipstick between thumb and forefinger in order to determine a relative
strength.
The measurements in this thesis involved using a standard compression plate (SMS
P/40) with a 40 mm diameter cylindrical aluminum probe. All samples had a diameter
of 20 mm and their length was kept at ~20 mm. All measurements were carried out in
quadruplet with a compression speed of 1 mms-1
.
The data (force/distance) obtained from the texture analyser was converted into true
stress and true strain using Equations 3.5, 3.6, 3.7 and 3.8 (obtained from Moresi &
Bruno, 2007 (Moresi and Bruno, 2007));
Equation 3.5
Equation 3.6
Equation 3.7
Equation 3.8
where, εE and εH are the engineering and true strain respectively, Ho and h are initial
height and height of each sample as recorded during the compression test, σE and σH are

3. Materials and Method
76
the engineering and true stress respectively, and F and Ao are compression force applied
and initial cross sectional area of sample respectively.
From the true stress/true strain curves (typical curves shown in Figure 3.18) the
Young’s modulus (as shown by Norton et al., 2011) was taken (the slope of the first
linear region of the stress-strain curve) and plotted against either percentage of wax or
percentage of water to give an insight into the material properties of the formulations.

3. Materials and Method
77
Figure 3.18 - Typical True Stress (MPa) vs True strain curves for bulk oil
formulations, where (a) is 10 % carnauba wax (CW) in castor oil (CO), for
measurement 1 ( ) and measurement 2 ( ), and (b) is 5 % microcrystalline wax (MW)
and 5 % CW was in CO ( ) and 10 % MW and 5 % CW was in CO ( ). All samples
were melted and stirred using a magnetic stirrer until molten (~ 30-40 minutes) and then
True Strain
0.00 0.02 0.04 0.06 0.08 0.10 0.12
Tru
e S
tre
ss (
MP
a)
0.000
0.001
0.002
0.003
10% CW and 90 % CO
10% CW and 90 % CO
(a)
True Strain
0.00 0.02 0.04 0.06 0.08 0.10 0.12
Tru
e S
tress (
MP
a)
0.000
0.001
0.002
0.003
5% CW, 5% MW and 90 % CO
5% CW, 10% MW and 85 % CO
(b)
3. Materials and Method
78
cooled quiescently in the freezer till solid then measured at a compression rate of 1
mm/s at 32 °C.
3.4.7 Rheology (Chapter 5 and 6)
Throughout this thesis a variety of different rheological techniques were utilised.
This section provides the methodology for all of the different techniques used.
3.4.7.1 Oscillation Rheology
The elastic modulus (G’) and viscous modulus (G”) can be determined using a
variety of geometries, each of which have different advantages and disadvantages and
will be discussed individually.
3.4.7.1.1 Cone and Plate
The cone and plate geometry (Figure 3.19) can be an ideal measuring system as it is
very clean and requires only a small amount of material. More often than not the cones
are truncated and are positioned so that the missing tip would have touched the lower
plate. By removing the tip, a more robust geometry is formed (Bohlin-Instruments,
1994).
Adams and Lodge (1964) showed that by increasing the cone angle the variation in
shear rate across the gap increased. This variation is one of the disadvantages of using
the cone and plate method.

3. Materials and Method
79
Figure 3.19 – Schematic of cone and plate geometry (taken from Bohlin-Instruments , 1994)
The use of cone and plate is not ideal when running temperature sweeps as it is not
possible to guarantees accurate heat transfer due to the gap. Also the cone and plate is
an inadequate technique when analysing material that contains particles. As if the
particles are not 5-10 times smaller than the gap the particles can jam at the cone apex.
Finally if the material contains a high amount of solid material; there can be an issue at
high shear rates as the material can be expelled from the gap.
3.4.7.1.2 Parallel Plate
The parallel geometry (Figure 3.20) is also easy to clean and only requires a small
amount of material. This geometry is not as sensitive to gap setting which makes it the
ideal geometry for use in experiments involving temperature gradients. Like all
geometries parallel plates also have disadvantages. The main disadvantage is that the
shear rate produced varies across the material being tested, as a result the software on a
rheometer uses an average value for the shear rate.

3. Materials and Method
80
Figure 3.20 – Schematic of parallel plate geometry (taken from Bohlin-Instruments , 1994)
3.4.7.1.3 Cup and Bob
There are a variety of different cup and bob geometries (Figure 3.21). For all types a
large volume of material is required and it harder to clean cup and bob geometries. Due
to the high volume of material, issues can arise when performing high frequency
experiments as the material will exhibit large inertia. The advantage of cup and bob
geometries arises when working with low viscosity materials. The large surface area
improves sensitivity allowing data to be obtained at low shear rates and viscosities.
Figure 3.21 – Schematic of cup and bob geometries (taken from Bohlin-Instruments , 1994)

3. Materials and Method
81
Pal (2000) utilised both parallel plates and cone and plate geometry to investigate
the effect of oscillatory rheology on O/W emulsions. Results showed that at high shear
stresses, the viscosities measured for both geometries were in agreement, whereas, with
low shear stresses, the cone and plate geometry measured lower viscosities than when a
parallel plate. This is believed to be due to slippage at the fluid/wall interface.
Throughout this thesis in order to investigate the effect of waxes on the viscoelastic
properties of an emulsion, G’ and G” were measured using a Bohlin Gemini Nano
Rheometer (Malvern, UK), and a 20 mm parallel plate (1 mm gap width) geometry.
This geometry was chosen as it is the exact diameter of the mould used, thus allowing
thin slices of sample to be used which limits the amount of destruction caused to the
wax network during loading.
Initially an amplitude sweep experiment was conducted to calculate the appropriate
stress to use for a frequency sweep experiment. This allows the rheological properties of
the sample to be measured without destroying the microstructure. For amplitude sweep
experiments, the stress was varied (0.1 – 1000 Pa) with a frequency of 1 Hz. A typical
example of this was shown previously in Figure 2.15. A stress was then chosen that lies
within the linear viscoelastic region, which was then used in the frequency sweep (0.1 –
100 Hz) experiment. Figure 3.22 shows a typical frequency sweep curve. G’ and G’’
values were taken at a frequency of 5 Hz and plotted against varying parameters for
analysis. All experiments were run at 32 °C (lip temperature). All samples were
prepared immediately after production by pouring molten solutions into cylindrical
moulds (24 mm diameter and 75 mm length) and cooled in a freezer for 20 minutes.
Thin slices (~1mm in thickness and 20 mm in diameter) were placed in a parallel plate
geometry for testing.

3. Materials and Method
82
Figure 3.22 – Typical frequency sweep (0.1 – 100 Hz) curve at a controlled stress (within the
linear viscoelastic region).
3.4.7.2 Viscosity Measurements
As part of this research, two different viscosity measurements were conducted in
chapter 4 and 5.
3.4.7.2.1 Chapter 4
In this chapter the viscosity of the continuous phase was investigated as a function
of temperature (50 to 85 °C) in order to determine the effect of wax crystals on
viscosity. Effective viscosity was measured using a Bohlin Gemini Nano Rheometer
(Malvern, UK), and a 40 mm cone & plate geometry (0.15 mm gap width). All
measurements were conducted in triplicate.
3.4.7.2.2 Chapter 5
In this chapter the viscosity of the dispersed phase was calculated at 32 °C. The
dispersed phase viscosity was altered by adding varying amounts of glycerol (0, 20, 30,
Frequency (Hz)
0.1 1 10 100
Mo
du
lus (
Pa
)
1e+0
1e+1
1e+2
1e+3
1e+4
1e+5
1e+6
Elastic Modulus (G')
Viscous Modulus (G'')

3. Materials and Method
83
40 and 50 wt % of glycerol in distilled water). The effective viscosity was then
measured using Bohlin Gemini Nano Rheometer (Malvern, UK), and a 40 mm acrylic
cone & plate geometry (0.15 mm gap width). All measurements were conducted in
triplicate.
3.4.8 Tribometer (Chapter 6)
A mini traction machine was set up following the procedure shown in section 3.3.3
(Figure 3.23). Timed tribological experiments were conducted (30 minutes to 8 hours
depending on the time taken to wear a sample to a thin film) at varying loads (0.3, 0.5, 1
and 3N) with one of six disk speeds (1, 3, 5, 10, 30 and 50 mms-1
). At the start of test
the ball is loaded against the sample, at a defined normal load (W). The ball remained
stationary and the disk rotates whilst the frictional force is measured (in the contact) by
force transducers. The machine also measures the height of the ball in relation to the
elastomer disk thus allowing the wear to be calculated over time.
Figure 3.23 – Schematic representation of a tribological set up, with a stainless steel ball and an
elastomer disk (with a solid wax/emulsion disk attached).
Fixed
Pin
Stainless
steel ball
Solid wax
blends/ emulsions
PDMS
disc
Disc Shaft

3. Materials and Method
84
3.4.9 Sensory Evaluation – Quantitative descriptive analysis (QDA)
(Chapter 6)
A trained panel (consisting of 21 women aged 35 - 73) evaluated sensory attributes
of a wax blend (bench sample) and emulsions (with different aqueous phase volumes
and droplet sizes). Due to the limited number of samples (four) that could be assessed
by QDA panelists;
Bench mark sample (containing 5 wt % carnauba wax, 10 wt %
microcrystalline wax and 5 wt % paraffin in castor oil),
5 wt % aq phase W/O emulsion,
20 wt % aq phase W/O emulsion (d3,2 – 3 μm)
20 wt % aq phase W/O emulsion with large droplets (d3,2 > 100 μm).
All emulsions contained 93, 78 or 79.8 wt % wax blend as the continuous phase. 5
wt % and 20 wt % emulsions contained 2 % PGPR where as 20 wt % emulsion (large
droplets) contained 0.2 wt % PGPR.
The panel was trained to score two different attributes (application and sticky/tacky
feel) on both the hand and the lip (see Table 3.1). Table 1.1 also highlights how each
panelist applied the samples for testing. Testing occurred over a three week (2 days per
week) period.
Week 1: Panelists were given a language generation session, whereby they learnt
the meaning of each attribute and were trained on the bench sample. At the end of the
session all panelists agreed on the bench samples scores which were used to compare
against the emulsions

3. Materials and Method
85
Week 2 and Week 3: In these sessions, the emulsions were presented to the
panelists and compared to bench. These were presented unmarked and in a random
sequence (generated by the computer software). Panelists assigned a score on line from
0 – 10 for each attribute. All testing was conducted at 23.5 1.4 °C. It is also important
to note that after each test, panelists washed either their lips or hands with warm water
to remove the sample being tested.
Table 3.1 – Definitions and application procedure provided to each panelist
Attribute Anchor Definition Instructions Application
on hand
0 Drags
10 Glides
Drags – Dry and
difficult application with
resistance
Glides – No resistance
felt on application
1. Apply 2 strokes of lipstick
onto back of hand with 2 forward
strokes and assess.
2. Keep lipstick on back of
hand for next attribute
Sticky/Tack
y feel on hand
0- nil
10 - high
High – A resistance
when fingers are parted
Nil – No resistance
1. Apply 2 strokes of lipstick
onto index fingertip of opposite
hand.
2. Tap index finger with
product on over product on back of
hand twice. Make decision
immediately.
3. Wipe fingers with azo wipes
and tissue, keep lipstick on back of
hand for next attribute.
Application
of lipstick on
lips for half lip
assessment
0 Drags
10 Glides
Drags – Dry and
difficult application with
resistance
Glides – No resistance
felt on application
1. Apply 1 lipstick to half of
the top lip from middle to outer and
apply to half of the bottom lip with
1 stroke.
2. Repeat with second stroke.
3. Apply the second lipstick to
the other half of the lips in the same
way.
Sticky/Tack
y feel on lip
0- nil
10 - high
High – A resistance
when fingers are parted
Nil – No resistance
1. Apply 1 lipstick to half of
the top lip from middle to outer and
apply to half of the bottom lip with
1 stroke.
2. Repeat with second stroke.
3. Apply the second lipstick to
the other half of the lips in the same
way.

3. Materials and Method
86
3.4.9.1 Statistical Analysis
Analysis of variance (ANOVA) with post hoc analysis (least significant difference
(L.S.D) was done using Compusence (Ontario, Canada). All analysis was conducted
using a 95 % confidence interval.
3.4.10 Fourier Transformer Infra Red (FT-IR) Spectroscopy (Chapter 7)
FT-IR (Perkin Elmer spectrometer 100, Cambridge, UK) was used to analyse
samples for both glycerol standards (25 dilutions (assuming that a mix of 50 wt % and
50 wt % glycerol represented a 100 % stock solution)) and aliquots taken from release
experiments. FT-IR spectra were acquired by placing 0.5 ml aliquots of either glycerol
standards or samples from release experiments onto the spectra cell. For all spectra
collections, a resolution of 8 cm-1
was used. 12 scans in the range of 1400 – 800 cm-1
were performed. All analysis was performed in triplicate.

4. Designing Wax Based Emulsions
87
Chapter 4. Designing Wax
Based Emulsions for use
in Lipstick Application

4. Designing Wax Based Emulsions
88
4.1 Introduction
As described in Chapter 1, lipsticks form an intrinsic part of most cosmetic
companies product range and consist mainly of hydrophobic ingredients (waxes,
pigments and oils). The excessive use of hydrophobic ingredients can result in dryness
of the lips as layering the lip with a hydrophobic layer prevents natural lubrication.
Emulsions could be used to deliver moisture to the lips. However, it is critical that an
emulsion based lipstick behaves in the same manner as a conventional lipstick. The aim
of the work reported in this chapter was to advance the understanding of emulsions
designed for lipstick application. This was done in three stages; (1) the effect of
producing emulsions via either a batch process (in particular the effect of emulsifiers
and aqueous phase volume) or a continuous process (in particular processing
parameters) on the final droplet size. This will allow delivery of moisture to the lips
which is one of the main aims of the project. (2) The melting behavior of different
waxes was investigated as this will allow an understanding of a lipstick remaining a
solid at room temperature, but spreadable at lip temperature which is of extreme
importance for consumer acceptance of the product. (3) The stability of emulsion based
lipsticks was investigated.
4.2 Results and Discussion
4.2.1 Emulsions
In order to produce an emulsion based lipstick it is important to consider the impact
of incorporating water into the structure. Therefore, a base formulation (taken from the
literature (Le Révérend et al., 2011b)) was used as the continuous phase to produce a
water-in-oil (W/O) emulsion.

4. Designing Wax Based Emulsions
89
4.2.1.1 Emulsion Design Using a Batch Process
4.2.1.1.1 Emulsion design using emulsifier type and concentration
As described in section 2.4.4, emulsifiers reduce the interfacial tension between two
surfaces. Therefore, a series of experiments were conducted to investigate the effect of
both emulsifier type and concentration on droplet size in wax based formulations. It is
important to note that emulsification was carried out at temperatures (~75 °C) where the
waxes remain molten. This prevents wax crystals (i.e. Pickering particles) acting as the
main stabilising mechanism in the emulsion. The difference between a saturated and
unsaturated chain of an emulsifier was investigated by comparing monoolein with
monostearate (Kulkarni et al., 2011, Mackles, 1987) as it is hypothesised that the
unsaturated nature (double bond) in monoolein could create steric hindrance thus
affecting packing of the emulsifier at the interface. Sorbitan olivate was then used to
explore the effect of a head group size. These were compared to a polymeric emulsifier
(polyglycerol polyricinoleate (PGPR)) as PGPR has been shown to produce small
droplets in the food industry (Norton et al., 2009). Figure 4.1 shows the droplet size
(d3,2, μm) as a function of emulsifier type and concentration. Emulsions formed using
either of the monoglycerides (monoolein and monostearate) resulted in droplets being
formed in the range of 20 – 28 μm. This was independent of the emulsifier
concentration used. Thus suggesting that using either a saturated or unsaturated
monoglyceride has no significant effect on the resulting droplet size. Sorbitan olivate is
an emulsifier currently used in many Boots formulations (mainly in sun creams), it is a
combination of both sorbitan monoolein and sorbitan monostearate. Sorbitan has a head
group size that is more than twice that of monoglycerides (head group of ~ 13.9 Å
compared to 5 Å, obtained from ChemDraw 12.0). Results showed (Figure 4.1) that the
droplet size is ~25 μm which is similar to that obtained for the monoglycerides.

4. Designing Wax Based Emulsions
90
Figure 4.1 also reveals that there is no difference in droplet size when emulsifier
concentration is greater than 1 %. However at lower percentages (0.2-1 %), the NMR
was unable to measure a droplet size. This suggests that at these percentages the
droplets were greater than 100 μm (upper size limit for NMR restricted diffusion). The
difference in the amount of Sorbitan olivate required could be caused by a number of
reasons; 1) insufficient amount of emulsifier for surface coverage, 2) the ability of the
emulsifier to get to the interface during emulsification and 3) the affinity of the
emulsifier for the interface. These three hypotheses were investigated individually.
Firstly the amount of emulsifier required for complete surface coverage (assuming
a monolayer of emulsifier and spherical droplets) was calculated by using the following
equation;
Equation 4-1
Where Er is the emulsifier required for surface coverage, Ai is the total area of
interface and Sc is the surface coverage value for a specific emulsifier.
The theoretical value calculated using equation 4.1 was compared to actual amount
added in reality (shown in Table 4.1). From this it is clear that all emulsifiers were in
excess and therefore the difference in concentration of emulsifier required is either due
to the emulsifier’s ability to get to the interface or its affinity for the interface.
The movement of emulsifier in processing could be dictated by the molecular
weight of the emulsifier. Sorbitan olivate has a molecular weight of ~430 g/mol where
as the monoglycerides have a molecular weight of 356 g/mol. Therefore in theory
Sorbitan olivate should take longer to diffuse to the interface. If this theory was to be
true, one would expect PGPR (~500 g/mol) to produce the largest droplets. However,
Figure 4.1 illustrates that even at low concentrations of PGPR, droplets are formed in

4. Designing Wax Based Emulsions
91
the range of 4 – 7 μm. This is due to PGPR’s ability to produce a thick elastic interface
((Le Révérend et al., 2011b)) preventing coalescence of droplets, by stopping either
capillary wave formation or spontaneous holes being formed (as described in section
2.3.4)
The horizontal nature of all the points displayed in Figure 4.1 is a result of the
droplet surface being saturated by emulsifier, as suggested by the calculations displayed
in Table 4.1.
Figure 4.1 Mean droplet diameter (d3,2, μm) of 10% water W/O emulsions, as measured by
NMR restricted diffusion on day of emulsification, as a function of emulsifier concentration for
sorbitan olivate ( ), monoolein ( ), monostearate ( ) and PGPR ( ).
Emulsifier concentration (%)
0 1 2 3 4 5 6
d3,2
(m
)
0
5
10
15
20
25
30
Sorbitan Olivate
Monoolein
Monostearate
PGPR

4. Designing Wax Based Emulsions
92
Table 4.1 - Theoretical surface coverage values (m2/g) for emulsifiers used, calculated using
mean droplet size measured by NMR restricted diffusion (values of 23 μm, 25 μm and 5 μm were
used for monoglycerides, sorbitan olivate and PGPR, respectively), and head group size of the
emulsifiers taken from (a) Choi, Lee, Kim and Kim (2007), (b) calculated using ChemDraw
(CambridgeSoft, UK) and (c) calculated from hydronamic radii of PGPR taken from (Gunes et al.,
2010). Amount of emulsifier required was then calculated by dividing the total surface area (based
on 30 % Water phase) by the surface coverage.
The reduction in droplet size observed in Figure 4.1 must therefore be due to the
affinity of the emulsifier for the interface. This was investigated using interfacial
tension (IFT) measurements. In order to determine the IFT of the various emulsifiers, a
model system was used where no waxes were incorporated in the continuous phase,
thus allowing a liquid system to be analysed.
Figure 4.2 monitors the IFT over a period of 2000 seconds. It clearly shows that the
introduction of an emulsifier reduces the surface tension. Both monoglycerides and
sorbitan olivate reduce the IFT by approximately 2 mNm-1
(from 14.5 – 12.5 mNm-1
).
In comparison PGPR reduces surface tension by 10 mNm-1
. The reduction in IFT results
in less mechanical work required to break up the dispersed phase resulting in smaller
droplets being formed (Rosen, 1988). This agrees with work shown by Oh and Shah
who investigated the effect of different ionic emulsifiers on interfacial tension. They
found that as the interfacial tension was reduced from 12.55 to 5.0 mNm-1
for lithium
dodecyl sulfate and for cesium dodecyl sulfate, the droplet size reduced from 7 to 2.5
μm respectively (Oh et al., 1993).
EmulsifierSurface Coverage
(m2/g)Amount Required
(mg)Amount added
(mg)
Monoglyceridesa 500 1.57 600
Sorbitan Olivateb 8207 0.09 600
PGPRc 37800 0.9 600

4. Designing Wax Based Emulsions
93
Figure 4.2 – Interfacial tension measurements for different emulsifiers in a model system (no
wax). All samples contained 2% emulsifier.
4.2.1.1.2 Effect of Aqueous phase volume and emulsifier concentration on emulsion
design
The effect of PGRR on aqueous phase volumes has previously been investigated by
Le Reverend et al (2011). At the PGPR concentration stated (1 wt %) they showed that
with increasing aqueous phase volumes (10 – 40 wt %) all emulsions contained droplets
with a d3,3 of 7 μm. This leaves the question of whether by changing the emulsifier
concentration (0.2, 0.5, 2 and 5 %), there will be an effect on the droplet size measured
using NMR restricted diffusion (Chapter 3).
Table 4.2 shows that for all aqueous phase volumes, the droplet size decreases as
PGPR concentration increases. At higher aqueous phase volumes (30 % and 40 %), the
lower concentrations of PGPR (0.2 and 0.5 wt%) are unable to form emulsions with
Time (s)
0 500 1000 1500 2000
Surf
ace T
ensio
n (
mN
/m)
0
5
10
15
20
25
Castor Oil
PGPR
Sorbitan Olivate
Monostearate
Monoolein

4. Designing Wax Based Emulsions
94
droplets under 100 μm. This is a result of there being a greater surface area, and
insufficient time for the emulsifier to diffuse to the interface. To test this hypothesis, the
processing time for an emulsion (40% aqueous phase and 0.5% PGPR) was doubled
from 5 minutes to 10 minutes. This resulted in a reduction in droplet size from 100 μm
to 7.4 0.9 μm. Table 4.2 also shows that the droplet size does not reduce after 2%
PGPR, due to the limitation of the process to produce smaller droplets.
The SEM micrographs (Figure 4.3) show droplets embedded within a continuous
network, which has been previously described in the literature (Ghosh and Rousseau,
2011). The network stabilisation explains the stability against coalescence as the wax
crystals provide a physical barrier, preventing movement. From the image it is unclear
whether the wax particles are in the interface (displacing emulsifier during
crystallisation) or at the interface (moving towards the interface during crystallisation).
These images are similar to those previously published by Norton et al. (2009) for
chocolate. The droplet size observed in the micrographs are comparable to those
obtained by the NMR.

4. Designing Wax Based Emulsions
95
Table 4.2 Mean droplet diameter (d3,2, μm) measured by NMR restricted diffusion on day of
formation as a function of aqueous phase volume and PGPR concentration. Standard deviation is
of triplicate measurements.
Figure 4.3 - Cyro-SEM micrographs of water droplets surrounded by a hydrophobic
continuous phase where (a) is 10 % aqueous phase with 2 % PGPR and (b) 40 % aqueous phase
with 2 % PGPR.
AqPhase
(%)
PGPR Concentration (%)
d3,2 (μm)
Standarddeviation
10
0.2 5.3 1.5
0.5 4.6 1.1
1 4.4 0.8
2 2.4 0.2
5 2.5 0.1
AqPhase
(%)
PGPR Concentration (%)
d3,2 (μm)
Standarddeviation
20
0.2 >100 -
0.5 5.8 1.8
1 3.4 0.2
2 2.8 0.1
5 2.3 0.1
AqPhase
(%)
PGPR Concentration (%)
d3,2 (μm)
Standarddeviation
30
0.2 >100 -
0.5 14.2 3.3
1 6.4 0.6
2 2.9 0.3
5 2.6 0.1
AqPhase
(%)
PGPR Concentration (%)
d3,2 (μm)
Standarddeviation
40
0.2 >100 -
0.5 >100 -
1 3.4 0.0
2 2.7 0.4
5 2.8 0.1
Acc.V Spot Magn Det WD 2 µm5.00 kV 3.0 28991x SE 6.3
Acc.V Spot Magn Det WD 5 µm5.00 kV 3.0 13678x SE 5.0
4. Designing Wax Based Emulsions
96
4.2.1.2 Effect of a Continuous Process on Emulsion Design
In the food industry, a scraped surface heat exchanger (SSHE) and pin stirrer (PS)
has been used to manipulate emulsion droplet size (Norton and Fryer, 2012), as the
continuous process allows for greater control of the crystallisation process and therefore
greater control of the emulsion microstructure. Also from an industrial point of view the
use of a continuous process allows for a more efficient process as there is less down
time between batches, resulting in a greater production rate. In this section the effect of
droplet size produced via a continuous process for an emulsion based lipstick was
investigated. Specifically, the effect of different processing parameters (flow rates,
jacket temperatures and impeller rotational velocities (IV)) on droplet size were
investigated. As described in section 3.3.2.2, the use of a continuous process allows
variation of the jacket temperature for both units (SSHE and PS). Therefore in order to
determine which jacket temperatures to study, the melting and crystallisation of the
continuous phase was investigated. Figure 4.4 shows that the crystallisation starts at ~
60 °C and continues to ~ 20 °C. As a result jacket temperatures were chosen (55, 60, 65
and 80 °C) that would deliver different levels of crystallisation in the process. At 80 °C
there is no crystallisation in the process, whereas at temperatures below 65 °C,
crystallisation can occur in the process. Different cooling rates will result in different
crystal sizes being produced (Campos et al., 2002). This may affect the viscosity of the
continuous phase which in turn has an impact on emulsion droplet size (Norton and
Fryer, 2012, van Duynhoven et al., 2002b). It is important to note that at jacket
temperatures below 55 °C the formulation fully crystallises which results in blockages
of the pipes.

4. Designing Wax Based Emulsions
97
Figure 4.4 - Crystallisation and melting curve for an solution containing 5 % CW and 10 %
MW in 85% castor oil obtained via Differential Scanning Calorimeter (Perkin Elmer DSC Series 7,
UK), equipped with thermal analysis software (Pyris) at a scan rate of 10 °C/min from 120C to
10 °C.
4.2.1.2.1 Effect of SSHE on Emulsion Structure
Initially, the effect of SSHE on emulsion droplet size and structure was investigated.
It is important to note that the exit temperature varied from the jacket temperatures,
therefore, all results will be compared to the exit temperatures. Figure 4.5 shows that
smaller droplets are formed at lower temperatures, regardless of the flow rate and IV;
for example, at an IV of 1,500 rpm and residence time (RT) of 81.5 s, emulsions
produced at an exit temperature ~ 51 °C were ~ 2 μm, whereas those of emulsions
produced with an exit temperature ~ 75 °C were ~ 8 μm.
This reduction in droplet size caused by lowering the temperature is thought to be
due to a change in the viscosity of the continuous phase. The literature shows that
increasing the viscosity of the continuous phase results in a decrease of the emulsion
droplet size (Pal, 1996). This is due to higher disruptive shear forces resulting in a more
Temperature (ºC)
20 40 60 80
Sp
ecific
He
at
(J /
g *
C)
-2.0
-1.5
-1.0
-0.5
0.0
0.5
1.0
Crystallisation
Melting

4. Designing Wax Based Emulsions
98
efficient droplet break-up (Walstra, 1983b), and to a reduction in droplet collision,
decreasing droplet re-coalescence (see section 2.3.4 for more details). On the other
hand, a higher viscosity lowers the emulsifier adsorption rate, which can lead to droplet
re-coalescence.
Figure 4.5 - Average droplet size (d3,2) measured by NMR on the day of emulsion formation (10
% W/O where the continuous phase consists of 5 wt % CW, 10 wt % MW in castor oil) using SSHE
unit as a function of exit temperature under varying processing conditions: Residence time (RT) of
81.5 s , 40.7 s and 27.2 s; Impeller rotational velocity of 500 rpm (open symbols) and 1500
rpm (full symbols).
The viscosity of the oil continuous phase, measured at a fixed shear rate (100 s-1
),
increases from 0.05 to 0.65 Pa.s by decreasing the temperature from 75 to 50 °C,
respectively (Table 4.3). The change in the continuous phase viscosity is due to
formation of wax crystals during cooling. The mixture of CW and MW used in the oil
solution crystallises between ~ 65 and 55 °C. Above 70°C, no or only a few crystals are
Exit Temperature (°C)
50 55 60 65 70 75 80
d3
,2 (
m)
0
5
10
15
20
25
IV: 1500 rpm and RT: 81.5 s
IV: 500 rpm and RT: 81.5 s
IV: 1500 rpm and RT: 40.7 s
IV: 500 rpm and RT: 40.7 s
IV: 1500 rpm and RT: 27.2 s
IV: 500 rpm and RT: 27.2 s

4. Designing Wax Based Emulsions
99
present in the oil phase, resulting in no changes in the viscosity. Lowering the
temperature below 70°C results in an increased number of crystals formed, hence a
higher viscosity at lower temperatures. At room temperature, the oil phase presents a
soft solid structure. Water droplet mobility within the oil phase is reduced at higher
viscosity, reducing the risk of droplet collision. The presence of wax crystals does not
only contribute to thicken the continuous phase, but also favors the stabilisation of the
water droplets. It was shown that MW and CW crystals adsorb at the oil/water interface
to a form steric barrier around the emulsion droplets and prevent their coalescence (Le
Révérend et al., 2011a).
Table 4.3 - Effective viscosity of the oil continuous phase containing 5% CW and 10% MW in
castor oil as a function of the temperature, measured with a constant shear rate of 100 s-1
using a
cone and plate geometry.
It is assumed here that not all wax crystals adsorb at the interface, thus some remain
in the bulk phase. Those crystals form a network that results in a soft solid emulsion
structure. They also contribute to emulsion stability as they form physical barriers
between the droplets, thus trapping the water droplets in a wax network. This stops
coalescence by inhibiting the occurrence of droplet collisions. Emulsion droplet size
was measured at 5°C, after complete crystallisation. Crystal formation occurs either
post-production (jacket temperature Tj ~80°C) or both during emulsification and post-
production (Tj 65°C). Emulsions formed at a temperature below 65°C contain at the
end of emulsification more crystals in the bulk phase than those produced at higher
temperature, and would be then expected to have smaller droplets (due to the lower
viscosity of the continuous phase at lower temperatures). This was supported by the
Temperature (°C)
50 55 60 65 70 75 80 85
Effective Viscosity (Pa s)
0.65 0.007
0.4 0.003
0.24 0.004
0.12 0.0008
0.07 0.0009
0.05 0.0008
0.050.0005
0.04 0.0004

4. Designing Wax Based Emulsions
100
results shown Figure 4.5. The reduction in emulsion droplet size observed at lower
temperature is then due to both Pickering (crystals at the interface) and network
(crystals in the continuous phase) stabilisation. The emulsion size reduction was
observed by polarised microscopy. Micrographs of emulsions produced with different
processing conditions are shown Figure 4.6. It is clear that at a temperature of 80°C, big
droplets are formed. The structure of the continuous phase also seems to be altered by
the processing conditions. At 55 °C (Figure 4.6a), the droplets have a shell like structure
with crystals ‘sitting’ around a droplet. This is caused by more nucleation sites being
produced (due to the greater temperature difference) during the process allowing small
crystals to form which can move towards the interface. When crystals are produced in
both the process and post production (Figure 4.6b) a greater network is observed and the
droplets are integrated into the wax network. However, when crystals are produced in
post production (Figure 4.6c) they do not move towards the W/O interface, this results
in droplets acting as defects which will affect the material properties of the emulsion
(discussed in Chapter 5).
Given these observations an important consideration is the time the sample is within
the process. Figure 4.5 shows that smaller droplets are obtained at higher RT’s. For
example, at 60 C and 500 rpm, the droplet size increases from ~7 m to ~17 m, by
decreasing the RT from 81.5 to 27.2 s, respectively. Emulsions produced at high RT’s
result in smaller droplet sizes as there is longer for droplet disruption to occur. This
effect of RT is reduced at higher IV (1,500 rpm) as droplet break-up occurs faster due to
higher shear forces (see section 2.2.1.1).

4. Designing Wax Based Emulsions
101
Figure 4.6 - Polarised Microscopy of W/O emulsions formed using a SSHE at an IV of 1500rpm
and (a) Tj = 55C and FR = 30 mL/min, (b) Tj = 65C and FR = 90 mL/min and (c) Tj = 80C and
FR = 90 mL/min. The bar represents 50 m.
4.2.1.2.2 Control of Emulsion Structure using a PS
The effect of the addition of a PS unit to the SSHE unit to form part of a “margarine
line” on the emulsion droplet size and structure was investigated. 5% of paraffin was
added to the initial formulation to strengthen the formulation in order to be analysed
using a texture analyser. Nonetheless, droplet sizes of emulsions produced with the
SSHE unit were very similar with or without paraffin (d3,2 ~ 5 µm). In order to limit the
number of parameters to set up for both units, the flow rate was kept constant to 60
mL/min throughout the whole unit, as well as the jacket temperature of the SSHE unit
(65°C). These parameters were chosen as it is important that an emulsion that already
has a crystal network is passed through the PS, thus allowing the effects of the PS to be
examined. Also at low jacket temperatures (55 °C), the heat loss between the units,

4. Designing Wax Based Emulsions
102
caused a blockage in the pipes which prevented the emulsion passing through the PS.
The IV of the SSHE unit was adjusted to be either 500 or 1,500 rpm. The IV of the PS
unit was adjusted to be 3 different velocities (500, 1,000 and 1,500 rpm) and the jacket
temperature was varied from 55 to 80°C.
When the IV of the SSHE unit is set up at 1,500 rpm, droplets that entered the PS
unit were ~ 5 m and no change in droplet size is observed, regardless of the
temperature or the IV in the PS unit (Figure 4.7). However, when the IV of the SSHE
unit is set to 500 rpm the temperature and IV in the PS unit both have an effect on the
final droplet size (Figure 4.8). Firstly the effect of pin stirrer IV is discussed. When the
emulsion enters the PS it has a droplet size of ~ 14 m (Figure 4.8), no change in
droplet size is observed at 500 rpm. However the droplet size does decrease at 1,000
rpm (~ 10 m) and 1,500 rpm (~ 5 – 7 m). It was also observed that, for this particular
system and regardless of the SSHE IV, the smallest droplet diameter (d3,2) obtained was
~ 5 m. Also, in order to reduce the droplet size further using the PS unit, it is necessary
to work at a IV of the PS higher than the one of the SSHE. When equivalent IV are used
in both units, the final droplet size is driven by disruptive forces in the SSHE unit. This
represents a limitation of the process (i.e the maximum IV was used), but could be
expected as the PS unit was originally designed only to adjust the emulsion material
properties (Zhang et al., 2005).
The extent of the decrease in droplet size through the PS unit depends on jacket
temperature (Tj) (Figure 4.8). At 1,500 rpm for example, the size decreases from 15 m
to 6 m at Tj = 55C, but does not change at Tj = 80C. Emulsions exiting the SSHE
chamber at ~ 63C are likely to contain liquid wax which has not crystallised. It is
argued here that wax crystallisation continues in the PS unit adjusted at a temperature

4. Designing Wax Based Emulsions
103
below 65C, which as mentioned in section 4.2.1.2.1, contributes (i) to enhance droplet
disruption by increasing the continuous phase viscosity, and (ii) to stabilise of water
droplets newly formed in the PS chamber by either network or Pickering mechanisms.
At Tj = 80C, no crystals are formed in the PS chamber, resulting in no change in the
droplet size.
Figure 4.7 - Droplet size (d3,2) measured by NMR on the day of emulsion formation (10 % W/O
where the continuous phase consists of 5 wt % CW, 10 wt % MW in castor oil) using SSHE and PS
units as a function of exit temperature. Processing conditions for the PS unit; IV = 500 rpm,
IV = 1000 rpm and IV = 1500 rpm. All emulsions were first passed through a SSHE ( ) at a
Jacket temperature of 65 °C and an IV of 1500 rpm. The overall flow rate though both units was 60
mL/min.
Exit Temperature (°C)
50 55 60 65 70 75 80
d3
,2 (
m)
0
5
10
15
20
SSHE only
SSHE and PS with IV of 1500 rpm
SSHE and PS with IV of 1000 rpm
SSHE and PS with IV of 500 rpm

4. Designing Wax Based Emulsions
104
Figure 4.8 - Droplet size (d3,2) measured by NMR on the day of emulsion formation (10 % W/O
where the continuous phase consists of 5 wt % CW, 10 wt % MW in castor oil) using SSHE and PS
units as a function of exit temperature. Processing conditions for the PS unit; IV = 500 rpm,
IV = 1000 rpm and IV = 1500 rpm. All emulsions were first passed through a SSHE ( ) at a
Jacket temperature of 65 °C and an IV of 500 rpm. The overall flow rate though both units was 60
mL/min.
Exit Temperature (°C)
50 55 60 65 70 75 80
d3
,2 (
m)
0
5
10
15
20
SSHE Only
SSHE and PS with IV of 1500 rpm
SSHE and PS with IV of 1000 rpm
SSHE and PS with IV of 500 rpm

4. Designing Wax Based Emulsions
105
4.2.2 Designing Melting Profiles for Lipstick Application
The melting behavior of wax based emulsions is of extreme importance for lipstick
application as a lipstick needs to remain solid at room temperature but start to melt at lip
temperature (32 °C). However before an emulsion lipstick is considered it is important
to investigate the impact of individual waxes on the melting profiles. Both carnauba
wax (CW) and microcrystalline wax (MW) were selected to produce the base for an
emulsion based lipstick. CW was chosen as it constitutes a large amount of a current
lipstick formulation and it has the highest melting enthalpy (193 J/g) which will provide
a rigid base structure for a cosmetic lipstick (Taylor, 2011). A rigid structure is required
for two reasons; 1) for consumer acceptance and 2) for ease of removal in the molding
process. MW was chosen as McKetta (1993) stated that a prerequisite for a good
lipstick is that it contains at least one wax that has a melting profile in the region of 55 -
75 °C (McKetta, 1993). The effect of varying concentrations on the melting behavior of
both waxes was investigated individually and as blends.
4.2.2.1 Carnauba Wax
The melting profiles of different CW concentrations in castor oil were investigated
and the melting enthalpy was compared to a pure sample (Figure 3.10) of CW. Results
are shown in both Figure 4.9 and Table 4.4. From Figure 4.9 it can be seen that for all
concentrations an endothermic peak is observed with varying melting enthalpies (area
under the curves). The melting enthalpies were calculated using the trapezium rule and
are shown in Table 4.4 (Allison et al., 1995). The experimental melting enthalpies
increase from 8.5 – 33.2 J/g, these results are similar to the expected melting enthalpies
which were calculated from a pure sample of CW (Table 4.4). The expected enthalpies
were calculated by dividing the concentration of CW in the formulation by the total
melting enthalpy of a pure sample of CW.

4. Designing Wax Based Emulsions
106
There is no significant difference between the estimated melting enthalpies and the
experimental melting enthalpy. This indicates that the castor oil does not influence the
melting behavior of CW. This was shown by assessing the melting and crystallisation
behavior of a 100 % castor oil. Figure 4.10 shows that for a temperature range -30 – 50
°C there is no melting or crystallisation behavior, thus, confirming that the melting
behavior is governed by the CW concentration and not the influence of castor oil.
Figure 4.9 – Melting profiles curves for oil phase formulations containing various ratios of
carnauba wax (CW) in castor oil (CO). The sample was heated at a rate of 10 °C/ min.
Table 4.4 – Melting range, theoretical and experimental melting enthalpies as a function of
carnauba wax concentrations.
Sample Melting Range
(°C)
Expected Melting
Enthalpy (J g-1
)
Experimental
Melting Enthalpy (J g-1
)
5 % CW 37.7-87.5 7.4 8.5 ± 2.1
10 % CW 37.7-94.1 14.8 18.8 ± 1.4
15 % CW 37.9-95.9 22.1 23.5 ± 2.0
20 % CW 37.3-94.3 29.5 33.2 ± 2.9
Temperature (°C)
20 40 60 80 100
Sp
ecific
He
at
(J/g
*C)
0.0
0.5
1.0
1.5
2.0
2.5
3.0
3.5
5 % CW
10 % CW
15 % CW
20 % CW

4. Designing Wax Based Emulsions
107
Figure 4.10 - DSC curves for castor oil. The sample was heated at a rate of 10 °C/ min.
4.2.2.2 Microcrystalline Wax
The melting profile of different MW concentrations was investigated and compared
to a pure sample (Figure 3.10) of MW, in order to determine the possibility of using
MW in lipstick formulations. Results are shown in both Figure 4.11 and Table 4.5.
From Figure 4.11 it can be seen that for all MW concentrations an endothermic peak is
observed with 2 peaks at ~56 and ~78 °C with varying melting enthalpies. MW consists
of iso-alkanes and cycloalkanes of different molecular weight. The broad peak obtained
for MW is indicative that the wax is a mixture of different molecular weights that melt
at different temperatures. Peterson (2008) et al investigated the behavior of Vaseline
and a MW. They found that the peaks are due to MW containing multiple components
which melt at different temperatures. They also found that if stored at different
conditions, the melting behavior can be altered. Their results showed that at different
storage temperatures the MW was able to restructure into a more stable crystalline form
(Petersson et al., 2008). The experimental melting enthalpies increase from 5.0 – 25.7
-9
-8
-7
-6
-5
-4
-3
-2
-1
0
-60 -40 -20 0 20 40 60
Sp
ecif
ic H
ea
t (J
/gC
)
Temperature (°C)
Melting
Crystallisation
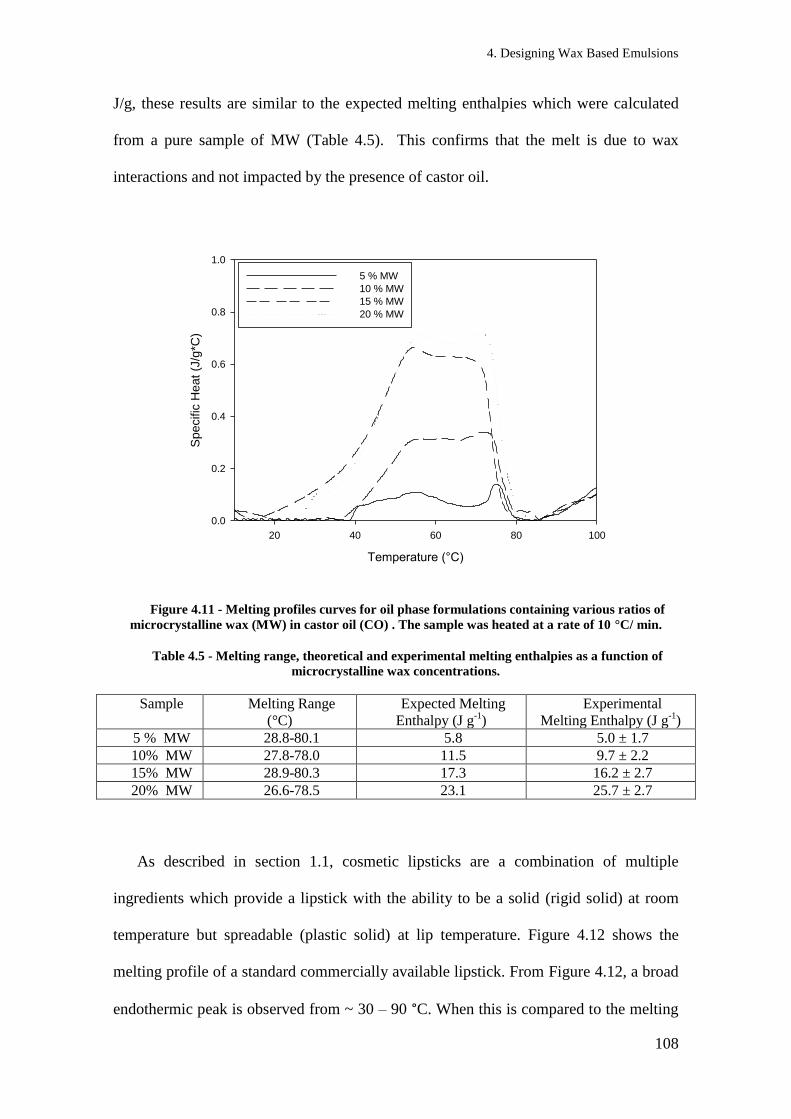
4. Designing Wax Based Emulsions
108
J/g, these results are similar to the expected melting enthalpies which were calculated
from a pure sample of MW (Table 4.5). This confirms that the melt is due to wax
interactions and not impacted by the presence of castor oil.
Figure 4.11 - Melting profiles curves for oil phase formulations containing various ratios of
microcrystalline wax (MW) in castor oil (CO) . The sample was heated at a rate of 10 °C/ min.
Table 4.5 - Melting range, theoretical and experimental melting enthalpies as a function of
microcrystalline wax concentrations.
Sample Melting Range
(°C)
Expected Melting
Enthalpy (J g-1
)
Experimental
Melting Enthalpy (J g-1
)
5 % MW 28.8-80.1 5.8 5.0 ± 1.7
10% MW 27.8-78.0 11.5 9.7 ± 2.2
15% MW 28.9-80.3 17.3 16.2 ± 2.7
20% MW 26.6-78.5 23.1 25.7 ± 2.7
As described in section 1.1, cosmetic lipsticks are a combination of multiple
ingredients which provide a lipstick with the ability to be a solid (rigid solid) at room
temperature but spreadable (plastic solid) at lip temperature. Figure 4.12 shows the
melting profile of a standard commercially available lipstick. From Figure 4.12, a broad
endothermic peak is observed from ~ 30 – 90 °C. When this is compared to the melting
Temperature (°C)
20 40 60 80 100
Specific
Heat
(J/g
*C)
0.0
0.2
0.4
0.6
0.8
1.0
5 % MW
10 % MW
15 % MW
20 % MW

4. Designing Wax Based Emulsions
109
profiles shown in both Figure 4.9 and Figure 4.11 it becomes clear that an individual
wax will not provide the melting profile required for lipstick application for two
reasons. (1) CW has a high melting point with the majority of wax crystals melting at
~85 °C, this would be unsuitable for lipstick application as wax crystals would have to
start to melt at lip temperature (32 °C) and (2) MW is too soft to produce lipstick bullets
even though it does have the desired melting profile (It is important to note that the
softness of the material was observed by attempting to mould the sample and will be
quantitatively analysed in Chapter 5). Therefore a combination of MW and CW was
investigated for their possible use as the continuous phase of an emulsion based lipstick.
Figure 4.12 - Melting profiles curve for a commercially available moisturising lipstick from the
Boots range. The sample was heated at a rate of 10 °C/ min.
Temperature (°C)
20 40 60 80 100
Sp
ecific
He
at
(J/g
*C)
0.0
0.2
0.4
0.6
0.8
1.0

4. Designing Wax Based Emulsions
110
4.2.2.3 Blends of Microcrystalline Wax and Carnauba Wax
The melting profiles of formulations containing 5% CW and varying amounts of
MW (5 – 20%) were investigated for their use in cosmetic lipsticks. Results are shown
in Figure 4.13 and Table 4.6. For all formulations a broad endothermic melting profile
is observed in the range of 23.5 – 80 °C. There are two distinct peaks at ~60 and ~75 °C
which are due the different components in the formulation. Table 4.6 shows that as the
concentration of MW increases from 5% - 20% the onset temperature shifts from 33.8 –
23.5 °C. The shift in onset is due to MW forming irregular sized crystals which disrupts
the wax crystal network (the effect of waxes on material properties is discussed in
Chapter 5).
Figure 4.13 – Melting profiles for oil phase formulations containing various ratios of
microcrystalline wax (MW) in castor oil (CO) with 5 % carnauba wax (CW). All samples were
measured using a DSC scan range from 10 to 120 °C at a rate of 10 °C / min.
Temperature (°C)
20 30 40 50 60 70 80
Specific
Heat
(J/g
* °C
)
0.0
0.2
0.4
0.6
0.8
1.0
1.2
1.4 5 % MW and 5 % CW
10 % MW and 5 % CW
15 % MW and 5 % CW
20 % MW and 5 % CW
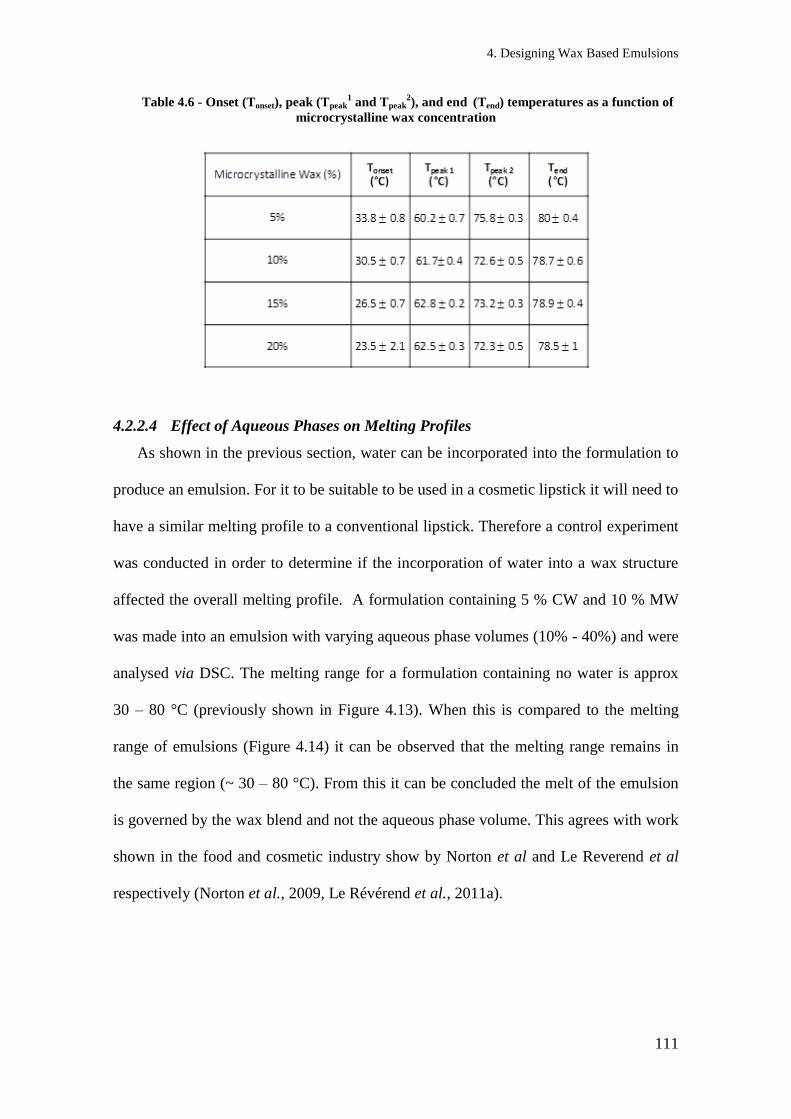
4. Designing Wax Based Emulsions
111
Table 4.6 - Onset (Tonset), peak (Tpeak1 and Tpeak
2), and end (Tend) temperatures as a function of
microcrystalline wax concentration
4.2.2.4 Effect of Aqueous Phases on Melting Profiles
As shown in the previous section, water can be incorporated into the formulation to
produce an emulsion. For it to be suitable to be used in a cosmetic lipstick it will need to
have a similar melting profile to a conventional lipstick. Therefore a control experiment
was conducted in order to determine if the incorporation of water into a wax structure
affected the overall melting profile. A formulation containing 5 % CW and 10 % MW
was made into an emulsion with varying aqueous phase volumes (10% - 40%) and were
analysed via DSC. The melting range for a formulation containing no water is approx
30 – 80 °C (previously shown in Figure 4.13). When this is compared to the melting
range of emulsions (Figure 4.14) it can be observed that the melting range remains in
the same region (~ 30 – 80 °C). From this it can be concluded the melt of the emulsion
is governed by the wax blend and not the aqueous phase volume. This agrees with work
shown in the food and cosmetic industry show by Norton et al and Le Reverend et al
respectively (Norton et al., 2009, Le Révérend et al., 2011a).

4. Designing Wax Based Emulsions
112
Figure 4.14 - Melting profiles for emulsions containing various aqueous phase volumes where
the continuous phase in castor oil (CO) with 5 % carnauba wax (CW). All samples were measured
using a DSC scan range from 10 to 120°C at a rate of 10°C / min.
Temperature (°C)
20 30 40 50 60 70 80
Sp
ecific
He
at
(j/g
* °
C)
0.0
0.5
1.0
1.5
2.0
10 % Aqueous Phase
20 % Aqueous Phase
30 % Aqueous Phase
40 % Aqueous Phase

4. Designing Wax Based Emulsions
113
4.2.3 Long term Stability of Emulsions for Lipstick Application
As previously described (section 2.2), emulsions are thermodynamically unstable
and therefore will phase separate over time. Therefore in this section the long term
stability was investigated using two techniques: droplet size NMR and gravimetric
analysis. Initially, a formulation with varying PGPR concentrations (0.5 – 5 %) was
turned into an emulsion with varying aqueous phase volumes (10, 20, 30 and 40 %).
Table 4.7 shows the results for 30 % aqueous phase. Results indicate that once an
emulsion is formed the droplet size does not vary over a 6 month period. For example
when 2 % PGPR is used the droplet size on day 0 is 2.9 ± 0.3 μm and the droplet size at
the end of 6 months is 2.8 ± 0.4 μm. This suggests that the wax crystal network creates
network stabilisation which prevents coalescence from occurring. These results are also
true for 10, 20 and 40 % aqueous phase volumes and are shown in Appendix 1.
Table 4.7 Mean droplet diameter (d3,2, μm) measured by NMR restricted diffusion from day 0
to day 180 for emulsions produced with varying PGPR concentrations (0.5, 1, 2 and 5wt%). All
emulsions contain 30 % water.
The ability for an emulsion based lipstick to retain its water content in different
conditions is of extreme importance. As during its life cycle it will experience a variety
of conditions. Therefore a formulation with varying amounts of MW (10, 15 and 20 %)
was made into an emulsion of varying aqueous phase volumes (10 – 40 %) and placed
in three different storage facilities. These formulations were chosen as they showed they
Day 0 Day 1 Day 7 Day 10 D ay 180
PGPR Concentration (%)
d3,2 (μm)
SD(σ)
d3,2 (μm)
SD(σ)
d3,2 (μm)
SD(σ)
d3,2 (μm)
SD(σ)
d3,2 (μm)
SD(σ)
0.5 14.2 3.3 14.0 3.2 14.2 3.2 14.1 3.4 13.8 3.2
1 6.4 0.6 6.1 0.6 6.1 0.6 6.1 0.6 5.8 0.6
2 2.9 0.3 2.9 0.3 2.8 0.3 2.8 0.3 2.8 0.4
5 2.6 0.1 2.5 0.3 2.5 0.0 2.3 0.1 2.2 0.2

4. Designing Wax Based Emulsions
114
had a melting profile that was suitable for use in a cosmetic lipstick (Figure 4.13). Three
different storage conditions were chosen to mimic typical conditions a cosmetic lipstick
would experience during its lifetime; 1) room temperature to represent on the shelf
conditions, 2) 30 °C to represent application temperature and 3) cycling (-10 – 40 °C))
conditions to investigate if an emulsion lipstick can withstand temperature fluctuations.
The amount of water loss was monitored over a period of 3 months and the percentage
water loss is shown in Table 4.8.
Results show that as the amount of aqueous phase increases the amount of water
loss increases over a period of 3 months. For example, when 10 % aqueous phase is
stored in room temperature conditions the average water loss increases from 0.07 – 0.4
%. It is also important to note that regardless of the storage conditions the amount of
water loss remains the same. The amount of water loss is also the same regardless of the
amount of MW in the formulation. In general the water loss for all formulations is less
than 1 %, thus indicating the majority of the water is trapped within the emulsion’s
structure. It is suggested here that the 1% water loss is only due to water remaining on
the surface of the emulsion, which evaporates over a period of time.

4. Designing Wax Based Emulsions
115
Table 4.8 - Average water loss of emulsions (with 10 – 40 % aq phase volumes and varying
amounts of microcrystalline wax (MW) stored in three different storage conditions (room
temperature, 30 °C and cyclic (-10 – 40 °C) conditions. All samples also contain 5 % carnauba wax
as part of the continuous phase. All emulsions were made using a high shear mixer at 10,000 rpm
for 5 min.
Room Temperature 30 °C Cyclic (-10 – 40 °C)
Aq
Phase
MW
Conc
1
Month
(%)
3
Month
(%)
1
Month
(%)
3
Month
(%)
1
Month
(%)
3
Month
(%)
10 10 0.07 0.40 0.15 0.49 0.20 0.53
20 10 0.19 0.88 0.25 0.84 0.30 0.89
30 10 0.18 0.59 0.37 1.12 0.49 1.35
40 10 0.29 1.24 0.43 1.36 0.35 1.18
10 15 0.04 0.78 0.12 0.41 0.16 0.52
20 15 0.15 1.17 0.36 1.02 0.30 0.93
30 15 0.24 1.40 0.43 1.32 0.39 1.11
40 15 0.22 1.01 0.4 1.28 0.43 1.38
10 20 0.09 0.33 0.19 0.57 0.21 0.65
20 20 0.07 0.91 0.20 0.64 0.25 0.72
30 20 0.20 1.17 0.34 1.22 0.39 1.14
40 20 0.24 0.99 0.38 1.34 0.39 1.22

4. Designing Wax Based Emulsions
116
4.3 Concluding Remarks
In this chapter the use of different emulsifiers allowed the production of emulsions
with varying droplet sizes. Results showed that the saturated nature of the emulsifier
had very little effect on the droplet size, neither did the use of an emulsifier with a larger
head group (all droplets in region of ~18 – 25 μm). PGPR resulted in emulsions with the
smallest droplets (~3-5 μm), probably as a result of a thick elastic interface (Le
Révérend et al., 2011b).
A lab-scale scraped surface heat exchanger and pin stirrer were shown to be
efficient to (1) produce water containing lipstick and (2) control emulsion properties
(e.g. droplet size). They also allow greater control of crystallisation process which
determines the viscosity of the continuous phase, leading to greater experimental design
of the final droplet size. The greater control of the crystallisation process will also affect
the material properties of emulsion structure. Therefore future work should involve
investigating the material properties of emulsions formulated with different crystal sizes
(see Chapter 5).
The melting behavior of wax based emulsion systems was investigated. It has been
shown that a combination of 5 % CW and 10 % MW provided a melting range of 30 –
80 °C, which is similar to currently available lipsticks (30 – 90 °C). Furthermore the
incorporation of water into the formulation does not alter the overall melting profile of
the sample.

5. Manipulating Material Properties
117
Chapter 5. Manipulating
material properties of wax
based emulsion systems for
use in lipstick application

5. Manipulating Material Properties
118
5.1 Introduction
As described previously in Chapter 4, varying either the formulation or the
processing conditions (batch or continuous) effects the microstructure of the final
emulsion formed. This variation in microstructure, will affect the material properties (as
previously explained in section 1.1)). The aim of this chapter was to investigate the
material properties of wax based emulsions suitable for lipstick application produced
via either a batch process or a continuous process. In order to achieve this the chapter
was split into three stages; (1) the effect of different waxes and wax blends on the
overall material properties was investigated, which provides a better understanding of
the individual waxes involved. (2) The effect of water inclusion into the formulation (an
emulsion) and water content on the material properties. This is important as Muller et
al. (2009) has shown that introducing additional components into a formed network can
affect the material properties. (3) The effect of a continuous process to control the
amount of crystallisation during processing was investigated. Different rates of cooling
fats/wax have been shown to produce different sizes of fat crystals (Campos et al.,
2002). It is hypothesised here that varying crystal size will affect material properties of
wax based emulsion systems as it effects the microstructure of the final emulsion.

5. Manipulating Material Properties
119
5.2 Results and Discussion
The introduction of water droplets into a wax network will affect the overall
material properties, as it will introduce soft particles into an existing network which
could act as defects. In order to examine the effect of water droplets it is important to
first consider the wax network the water droplets will become part of. Therefore the
material properties of different wax blends will be investigated before a wax blend is
turned into an emulsion.
5.2.1 Effect of Wax concentrations on Material Properties
The effect of both CW and MW concentrations on material properties was
investigated. Four samples for each continuous phase blend (containing castor oil (40 –
95 wt %), CW (0 – 20 wt %) and MW (0 – 20 wt %).) were compressed using a texture
analyser. The force/distance data was then converted into true stress and true strain (see
section 3.4.6). The bulk modulus, Young’s Modulus and point of fracture were then
determined using the method described by Norton et al. (2011).
5.2.1.1 Effect of Carnauba Wax
Figure 5.1 shows the relationship between CW concentration and bulk modulus,
Young’s Modulus and point of fracture. For all three parameters, as the percentage of
CW increases from 5 % to 20 %; Young’s modulus, bulk modulus and point of fracture
increase from 0.001 – 0.040, 0.01 – 0.22 and 0.001 – 0.018 M Pa respectively.
The increase in Young’s modulus is similar to the relationship observed by Li
(2002) for polymer gels. Li showed power law dependencies (103.03
) of methylcellulose
in water as the concentration of methylcellulose increased above 1 wt %. This indicated
greater links forming between the methylcellulose molecules. In order to determine the
cross linked nature within the wax crystal network a log plot of Young’s modulus

5. Manipulating Material Properties
120
versus concentration of wax was plotted. Figure 5.2 shows that the Young’s modulus
increases as a function of wax concentration. This follows a power law relationship
(~3), which is indicative of a stronger wax network being formed as greater connections
between wax crystals can occur (see section 2.5.4.1.2), these findings are similar to the
work published for polymer gels. Nakayama et al. (2004) showed that by increasing the
amount of cross-linking, the modulus increases, indicating a critically-crosslinked
network. This behaviour has also been observed in fat crystal networks, with various
studies showing that the hardness of a fat crystal network follows a power law
relationship in regard to the solid fat content (Narine and Marangoni, 1999b, Haighton,
1976, Narine and Marangoni, 1999a). CW consists of a complex mixture of high
molecular weight esters of acids and hydroxyacids (Lacerda et al., 2011). Thus, by
increasing the CW concentration the intrinsic bonding (e.g. hydrogen bonding and Van
der Waals interactions) between crystals can increase, providing greater connections,
which strengthens the network.

5. Manipulating Material Properties
121
Figure 5.1 – Bulk Modulus, Young’s Modulus (MPa) and Point of Fracture (MPa) of varying
carnauba wax concentrations in castor oil. All samples were melted and stirred using a magnetic
stirrer until molten (~ 30-40 minutes) and cooled quiescently in the freezer until solid then
measured at a compression rate of 1 mm/s at 32 °C.
Figure 5.2 - Dependence of Young’s Modulus on carnauba wax (CW) concentration (wt %).
The solid line is a fit to represent the power law dependence.
Wt % of CarnaubaWax
0 5 10 15 20 25
Yo
un
gs M
od
ulu
s (
MP
a)
0.00
0.01
0.02
0.03
0.04
0.05
Po
int
of
Fra
ctu
re (
MP
a)
0.000
0.005
0.010
0.015
0.020
0.025
Bu
lk M
od
ulu
s (
MP
a)
0.00
0.05
0.10
0.15
0.20
0.25
0.30
Youngs Modulus
Point of Fracture
Bulk Modulus
CW Wax percentatge (%)
1 10 100
Youngs
Modulu
s (M
Pa)
0.0001
0.001
0.01
0.1
lope 3
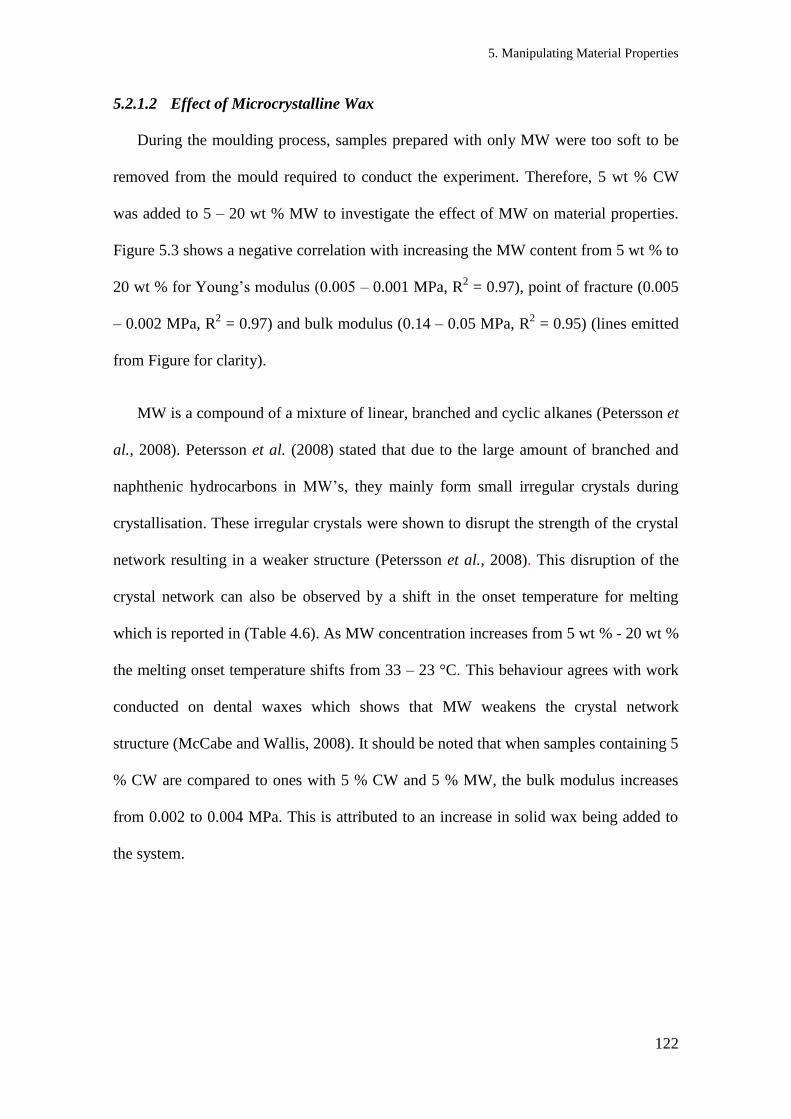
5. Manipulating Material Properties
122
5.2.1.2 Effect of Microcrystalline Wax
During the moulding process, samples prepared with only MW were too soft to be
removed from the mould required to conduct the experiment. Therefore, 5 wt % CW
was added to 5 – 20 wt % MW to investigate the effect of MW on material properties.
Figure 5.3 shows a negative correlation with increasing the MW content from 5 wt % to
20 wt % for Young’s modulus (0.005 – 0.001 MPa, R2 = 0.97), point of fracture (0.005
– 0.002 MPa, R2 = 0.97) and bulk modulus (0.14 – 0.05 MPa, R
2 = 0.95) (lines emitted
from Figure for clarity).
MW is a compound of a mixture of linear, branched and cyclic alkanes (Petersson et
al., 2008). Petersson et al. (2008) stated that due to the large amount of branched and
naphthenic hydrocarbons in MW’s, they mainly form small irregular crystals during
crystallisation. These irregular crystals were shown to disrupt the strength of the crystal
network resulting in a weaker structure (Petersson et al., 2008). This disruption of the
crystal network can also be observed by a shift in the onset temperature for melting
which is reported in (Table 4.6). As MW concentration increases from 5 wt % - 20 wt %
the melting onset temperature shifts from 33 – 23 °C. This behaviour agrees with work
conducted on dental waxes which shows that MW weakens the crystal network
structure (McCabe and Wallis, 2008). It should be noted that when samples containing 5
% CW are compared to ones with 5 % CW and 5 % MW, the bulk modulus increases
from 0.002 to 0.004 MPa. This is attributed to an increase in solid wax being added to
the system.

5. Manipulating Material Properties
123
Figure 5.3 - Young’s Modulus (MPa), point of Fracture (MPa) and Bulk modulus (MPa) of wax
blends containing 5 – 20 % microcrystalline wax and 5 % carnauba wax in castor oil. All samples
were melted and stirred using a magnetic stirrer until molten (~ 30-40 minutes) and cooled
quiescently in the freezer until solid then measured at a compression rate of 1 mm/s at 32 °C.
5.2.2 Effect of Incorporating Water on Material Properties
In order to produce an emulsion based lipstick it is important to consider the effect
that incorporating water into the microstructure has on the material properties.
Figure 5.4 shows that the introduction of water droplets into the formulation
reduces the Young’s modulus from 0.03 – 0.0015 MPa, decreases the point of fracture
from 0.003 to 0.001 MPa and decreases the bulk modulus from 0.09 – 0.03 MPa. The
reductions observed for these parameters could be due to several factors; (1) variation in
water droplet size as the aqueous phase volume increases, (2) an increase in water
droplets (soft filler particles) resulting in greater defects within the microstructure, (3)
wax crystals moving to the W/O interface as the amount of interface increases and (4)
an overall reduction in the solid wax content.
Pal (1996) investigated the effect of droplet size on the rheology on both W/O and
O/W emulsions. Pal showed that by increasing the droplet size of the aqueous phase
Wt % of Microcrystalline Wax
0 5 10 15 20 25
Yo
un
gs M
od
ulu
s (
MP
a)
0.000
0.001
0.002
0.003
0.004
0.005
0.006
Po
int
of
Fra
ctu
re (
MP
a)
0.000
0.002
0.004
0.006
0.008
Bu
lk M
od
ulu
s (
MP
a)
0.00
0.02
0.04
0.06
0.08
0.10
0.12
0.14
0.16
0.18
0.20
Youngs Modulus
Point of Fracture
Bulk Modulus
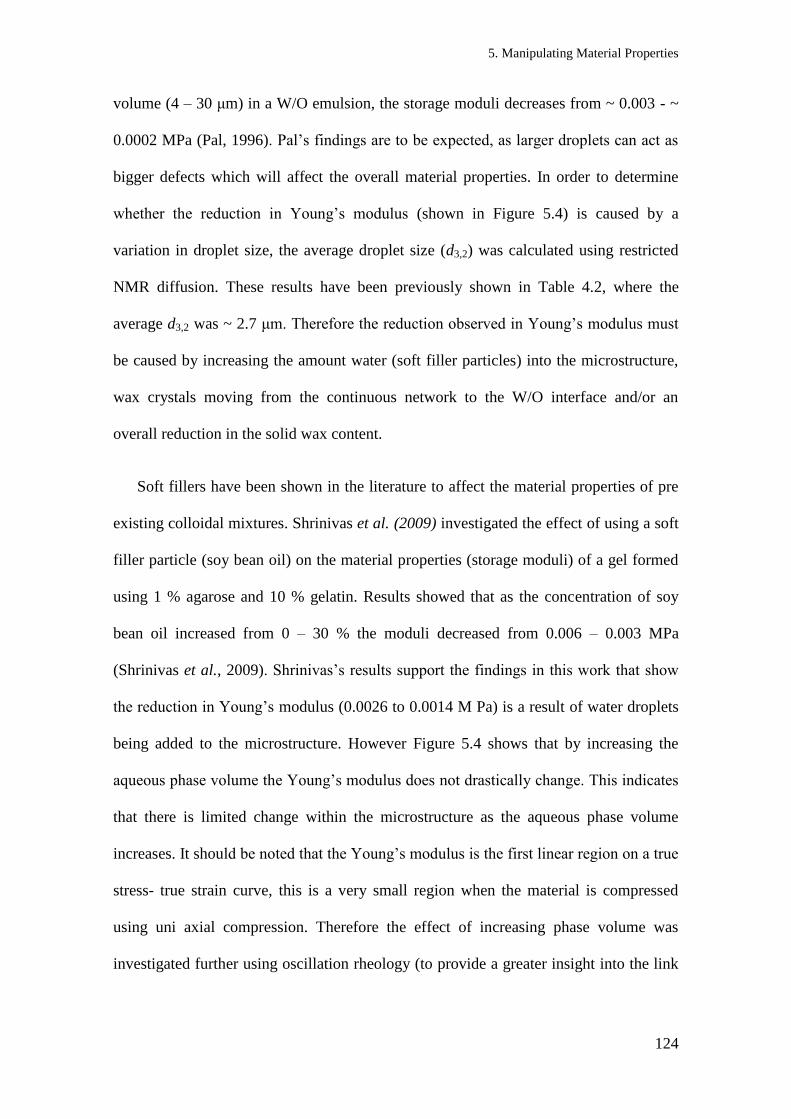
5. Manipulating Material Properties
124
volume (4 – 30 μm) in a W/O emulsion, the storage moduli decreases from ~ 0.003 - ~
0.0002 MPa (Pal, 1996). Pal’s findings are to be expected, as larger droplets can act as
bigger defects which will affect the overall material properties. In order to determine
whether the reduction in Young’s modulus (shown in Figure 5.4) is caused by a
variation in droplet size, the average droplet size (d3,2) was calculated using restricted
NMR diffusion. These results have been previously shown in Table 4.2, where the
average d3,2 was ~ 2.7 μm. Therefore the reduction observed in Young’s modulus must
be caused by increasing the amount water (soft filler particles) into the microstructure,
wax crystals moving from the continuous network to the W/O interface and/or an
overall reduction in the solid wax content.
Soft fillers have been shown in the literature to affect the material properties of pre
existing colloidal mixtures. Shrinivas et al. (2009) investigated the effect of using a soft
filler particle (soy bean oil) on the material properties (storage moduli) of a gel formed
using 1 % agarose and 10 % gelatin. Results showed that as the concentration of soy
bean oil increased from 0 – 30 % the moduli decreased from 0.006 – 0.003 MPa
(Shrinivas et al., 2009). hrinivas’s results support the findings in this work that show
the reduction in Young’s modulus (0.0026 to 0.0014 M Pa) is a result of water droplets
being added to the microstructure. However Figure 5.4 shows that by increasing the
aqueous phase volume the Young’s modulus does not drastically change. This indicates
that there is limited change within the microstructure as the aqueous phase volume
increases. It should be noted that the Young’s modulus is the first linear region on a true
stress- true strain curve, this is a very small region when the material is compressed
using uni axial compression. Therefore the effect of increasing phase volume was
investigated further using oscillation rheology (to provide a greater insight into the link

5. Manipulating Material Properties
125
between the dispersed phase and the continuous phase). This will be discussed in
section 5.2.2.2.
Figure 5.4 - Young’s Modulus, Point of Fracture and Bulk modulus (MPa) of emulsions
containing 2 wt % PGPR (overall weight %) as a function of aqueous phase volume (10 – 40 wt %),
where the continuous phase contains 5 % carnauba wax and 10 % microcrystalline wax in castor
oil. All emulsions were produced using a Silverson high shear mixer (for 5 minutes and at ~10,000
rpm) and cooled quiescently in the freezer until solid and measured with a compression rate of 1
mm/s at 32 °C.
5.2.2.1 Effect of adding paraffin wax and performalene to the continuous phase
Two further waxes, paraffin and performalene were added to the continuous phase
formulation to investigate their effect on the overall mechanical properties of the
emulsion. Performalene is a polyethylene based molecule that forms small crystals
(Harris and Butterworth, 2013), which may allow an increase in the number of
interactions in the wax network. Hard paraffin is a straight chain hydrocarbon (Wang et
al., 2008) and was selected as previous literature has shown that paraffin increases the
strength of emulsions, by producing large crystals which will not travel to the W/O
interface, resulting in a stronger continuous wax network (Le Révérend et al., 2011b).
Aqueous Phase (wt %)
0 10 20 30 40
Young's
Modulu
s (
MP
a)
0.000
0.001
0.002
0.003
0.004
0.005
0.006
Poin
t of
Fra
ctu
re (
MP
a)
0.000
0.001
0.002
0.003
0.004
0.005
0.006
Bulk
Modulu
s (
MP
a)
0.00
0.02
0.04
0.06
0.08
0.10
Young's Modulus
Point of Fracture
Bulk Modulus

5. Manipulating Material Properties
126
When Figure 5.4 (emulsions containing CW and MW’s) is compared to Figure 5.5
(emulsions containing CW, MW and paraffin or performalene), it shows an increase in
Young’s modulus, point of fracture and bulk modulus with the addition of solid wax
(particularly performalene (Figure 5.5a)). For emulsions containing 10 wt % aqueous
phase the addition of performalene increases the Young’s Modulus from ~ 0.003 to ~
0.005 MPa, the point of fracture from ~ 0.001 to ~ 0.005 MPa and the bulk modulus
from 0.09 – 0.13 MPa, indicating a stiffer and stronger emulsion. It should be noted that
the emulsions containing 10 wt % aqueous phase and performalene are stronger than the
control without performalene (i.e. the non-emulsified bulk wax system): the Young’s
moduli are ~0.005 and ~0.0038 MPa, respectively, the points of fractures are ~0.005
and ~0.003 MPa, respectively and the bulk moduli’s ~0.13 and ~0.09 MPa respectively.
The samples containing 20 and 30 wt % aqueous phase and performalene are more
similar to the control formulation (containing 5 % CW and 10 % MW in castor oil) in
terms of Young’s Modulus, point of fracture and bulk modulus, but there is some
weakening of the structure for samples containing 40 wt % water when compared to the
control formulation (Figure 5.4)
The droplet size for all emulsions produced (regardless of wax ratios) were similar
(in the range of 2 - 4 μm), therefore, it is thought that performalene produces a greater
number of interactions in the wax network resulting in an emulsion that is more
resistant to compression, up to a point where the number of droplets (i.e. ‘defects’)
increases and reduces the mechanical strength of the crystal network structure.

5. Manipulating Material Properties
127
Figure 5.5 - Young’s modulus, Point of Fracture and Bulk modulus (MPa) of emulsions
containing 2 wt % PGPR (overall weight %) as a function of aqueous phase volume (10 – 40 wt %)
where the continuous phase contains 5 % carnauba wax and 10 % microcrystalline wax, and either
(a) 5 % performalene or (b) 5 % paraffin. All emulsions were produced using a Silverson high
shear mixer and cooled quiescently in the freezer until solid then measured at a compression rate of
1 mm/s at 32 °C.
Aqueous Phase (wt %)
0 10 20 30 40 50
Young's
Modulu
s (
MP
a)
0.000
0.001
0.002
0.003
0.004
0.005
0.006
Poin
t of
Fra
ctu
re (
MP
a)
0.000
0.001
0.002
0.003
0.004
0.005
0.006
Bulk
Modulu
s (
MP
a)
0.00
0.02
0.04
0.06
0.08
0.10
0.12
0.14
0.16
0.18
Young's Modulus
Point of Fracture
Bulk Modulus
Aqueous Phase (wt %)
0 10 20 30 40 50
Young's
Modulu
s (
MP
a)
0.000
0.001
0.002
0.003
0.004
0.005
0.006
Poin
t of
Fra
ctu
re (
MP
a)
0.000
0.001
0.002
0.003
0.004
0.005
0.006
Bulk
Modulu
s (
MP
a)
0.00
0.02
0.04
0.06
0.08
0.10
0.12
0.14
0.16
0.18
(a)
(b)

5. Manipulating Material Properties
128
Overall, these results show that the introduction of water lowers Young’s Modulus,
point of fracture and bulk modulus resulting in a weaker structure. This observation
concurs with previously reported data on lipsticks and foods, which showed that the
introduction of water droplets decreases strength (Wang and Lee, 1997, Vereecken et
al., 2010). However, Wang and Lee reported that when the water content was increased
from 5 to 15 wt % the strength increased (Wang and Lee, 1997). The results obtained
in this research (Figure 5.4) show that the Young’s Modulus does not increase as water
content increases from 10 – 40 wt %. As previously stated (section 5.2.2) the Young’s
modulus is the first linear region of a true stress- true strain curve, this is a very small
region when the material is compressed using uni axial compression. Thus limiting the
possibility of analysing the interaction between crystals (weak link regime (see section
2.5.4.1.2)). Therefore in order to assess the interaction between wax crystals within the
network, the rheological properties of the emulsion will now be discussed.
5.2.2.2 Rheology of Emulsions
Oscillatory rheology was conducted on emulsions with varying aqueous phase
volumes (10 – 40 %) and with differing continuous phase formulations (5 % CW, 10 %
MW and with the addition of either 5 % performalene or 5 % paraffin). Previous results
(Figure 5.4) have shown increasing the aqueous phase volume did not affect the
Young’s modulus. Both the elastic modulus (G’) and the viscous modulus (G”) were
investigated directly after the emulsion was chilled in freezer. The literature has shown
that by increasing the number of crystals, a more rigid network is produced (Le
Révérend et al., 2011a). Therefore, G’ (i.e. solid-like behaviour) should increase with
the addition of crystalline material (paraffin and performalene). Figure 5.6 shows that
there is a negative correlation between aqueous phase volume and G’ for all the waxes
investigated. This is due to the solid wax content decreasing as aqueous phase volume

5. Manipulating Material Properties
129
increases, resulting in fewer interactions between wax moieties. The addition of either
paraffin or performalene increases G’ (from 0.4 to 0.8 and 1.3 MPa respectively for 10
wt % aqueous phase) with performalene increasing G’ by a greater amount for all
aqueous phase volumes. This could be attributed to its ability to create interactions in
the crystal network, therefore increasing the strength of the crystal network. The
reduction in G’ at greater aqueous phase volumes is caused by the surface area of the
W/O interface increasing with increasing aqueous phase volume, resulting in crystals
from the continuous network moving to the interface during cooling (Le Révérend et
al., 2011b). As a result a rigid crystal network cannot be formed. When Figure 5.7 is
compared to Figure 5.6 it shows that for all emulsions tested, G’ is greater than G’’
indicating that the emulsion behaves more like a solid. On further analysis of both G’
and G’’, the phase angle (δ) can be calculated. Figure 5.8 shows that as the aqueous
phase volume increases (from 10 – 40 wt %), δ increases from 5 to 15°. It is known that
if the phase angle is between 0 – 90° then the material can be classified as viscoelastic
(Tabilo-Munizaga and Barbosa-Cánovas, 2005). From Figure 5.8 we can conclude that
for all aqueous phases studied the emulsion behaves viscoelastically, however, at higher
aqueous phase volumes the emulsion behaves slightly more viscously. This can be
attributed to the fact that the extent of the continuous phase crystal network decreases as
water content increases. This is likely to be caused by a combination of 1) an increase in
the number of droplets (and thus the area of the W/O interface) with increasing aqueous
phase volume, creating an greater number of defects in the structure and 2) movement
of crystals from the bulk to the interface, weakening the network.

5. Manipulating Material Properties
130
Figure 5.6 - G’ (MPa)) as a function of aqueous phase volume for emulsions containing 2wt%
PGPR, where the continuous phase contains 5 % carnauba wax (CW) and 10 % microcrystalline
wax (MW) ( ), and either 5 % paraffin (P) ( ) or 5 % performalene (PF) ( ) in castor oil. All
emulsions were produced using a Silverson high shear mixer and cooled quiescently in the freezer
until solid and measured via oscillation rheology. G’ value taken at a strain of 1.4 x 10^-5
and a
frequency of 5 Hz.
Figure 5.7 - G’’ as a function of aqueous phase volume for emulsions containing 2wt% PGPR,
where the continuous phase contains 5 % carnauba wax (CW) and 10 % microcrystalline wax
(MW) ( ), and either 5 % paraffin (P) ( ) or 5 % performalene (PF) ( ) in castor oil. All
emulsions were produced using a Silverson high shear mixer and cooled quiescently in the freezer
until solid and measured via oscillation rheology. G’ value taken at a strain of 1.4 x 10⁻⁵
and a
frequency of 5 Hz.
Water Phase (wt %)
0 10 20 30 40 50
G' (M
Pa)
0.0
0.2
0.4
0.6
0.8
1.0
1.2
1.4
1.6
5% CW, 10% MW and 85% CO
5% CW, 10% MW, 5% P and 80% CO
5% CW, 10% MW, 5% PF and 80% CO
R2= 0.96
R2= 0.95
R2= 0.98
Water Phase (%)
0 10 20 30 40 50
G''
(MP
a)
0.0
0.1
0.2
0.3
0.4
0.5
5% CW, 10% MW and 85% CO
5% CW, 10% MW, 5% P and 80% CO
5% CW, 10% MW, 5% PF and 80% CO

5. Manipulating Material Properties
131
Figure 5.8 - Phase angle As a function of aqueous phase volume for emulsions containing 2wt%
PGPR, where the continuous phase contains 5 % carnauba wax (CW) and 10 % microcrystalline
wax (MW) ( ), and either 5 % paraffin (P) ( ) or 5 % performalene (PF) ( ) in castor oil. All
emulsions were produced using a Silverson high shear mixer and cooled quiescently in the freezer
until solid and measured via oscillation rheology.
5.2.3 Effect of a continuous process
For the final part of this chapter, the effect of a continuous production process on
the material properties of an emulsion based lipstick was investigated. In previous
sections of this chapter, all emulsions were produced using a batch process (Silverson
high shear mixer) where the operating temperature was greater than the crystallisation
temperature of the continuous phase formulation. In this section the use of a scraped
surface heat exchanger (SSHE) and pin stirrer (PS) (as described in 3.3.2.2) were
investigated as they allow for greater control of the crystallisation process. Specifically,
the effect of processing conditions, including flow rates, jacket temperatures and
impeller rotational velocities (IV) on material properties was investigated. The melting
and crystallistion behavior of the continuous phase was shown in Figure 4.4, which
demonstrated that crystallisation starts at ~ 60 °C and continues until ~20 °C. As a result
Water Phase (%)
0 10 20 30 40 50
Phase A
ngle
(°
)
0
5
10
15
20
25
5% CW, 10% MW and 85% CO
5% CW, 10% MW, 5% P and 80% CO
5% CW, 10% MW, 5% PF and 80% CO

5. Manipulating Material Properties
132
temperatures were chosen (55, 60, 65 and 80 °C) that would deliver different levels of
crystallisation in the process. At 80 °C there is no crystallisation in the process, whereas
at temperatures below 65 °C, crystallisation can occur during processing. It is important
to note that at temperatures below 55 °C the formulation solidifies during processing
which results in pipe blockages preventing manufacture of emulsions. The material
properties of the emulsion were initially assessed by measuring the bulk modulus and
point of fracture under uniaxial compression. Uniaxial compression was chosen, as a
current test at Alliance Boots for measuring the rigidity of a new lipstick involves
simple compression between the thumb and forefinger. Therefore, the use of uniaxial
compression technique allows quantitative assessments of samples. Secondly, the elastic
modulus of emulsions produced using various processing parameters were assessed
using oscillatory rheology. Material testing was conducted for emulsions which passed
either through the SSHE only or both the SSHE and PS.
5.2.3.1 Uniaxial Compression
Pre-emulsions containing 10 % aqueous phase, 88 % continuous phase (5 % CW
and 10 % MW in castor oil) and 2 % PGPR were passed through a SSHE or a SSHE
and PS (these also included 5 % paraffin in the continuous phase) to form an emulsion
based lipstick. These were then analysed via uniaxial compression to measure both the
bulk modulus and the point of fracture. In work done by Wang and Lee (1997), the
hardness of a lipstick was linked to the force required to fracture the lipstick (Wang and
Lee, 1997). Therefore the point of fracture was measured for lipstick emulsions to
understand the effect of processing parameters on the hardness of the emulsions.
Figure 5.9 shows all results as a function of exit temperature. Figure 5.9a and b
show that for emulsions produced with the SSHE only, there is little or no change in the
bulk modulus (~0.020 - 0.025 MPa) and point of fracture ( ~0.002 - 0.0025 MPa) as the

5. Manipulating Material Properties
133
temperature increases from ~ 60 to 75C, regardless of the IV. It is important to note
that the emulsions formed at 55C were too soft to be analysed with the texture
analyser. This could be due to smaller wax crystals being produced at lower
temperatures resulting in more nucleation sites and consequently less crystal growth
(the viscoelastic properties of all samples will be discussed later). As previously shown
section 4.2.1.2, varying the temperature between 60 and 75C modifies the emulsion
droplet size in the range of ~ 2 – 20 m. One would expect these changes to affect the
material properties, however, these changes in droplet size do not seem to affect either
the bulk modulus or point of fracture of emulsions produced through only the SSHE
unit. More surprisingly, both parameters are not affected by any modification in the wax
network formed in the continuous phase by wax crystals. Crystals formed within a
SSHE unit are more likely to be smaller than the ones produced in post production, due
to (i) the mechanical action of the scraping blades and (ii) a higher cooling rate in the
SSHE unit (Campos et al., 2002). It is expected that different crystal sizes within the
continuous phase of emulsions form under different processing conditions, which would
allow a variety of network structures within the continuous phase. One would think that
these structural differences would impart different material properties on the emulsions.
However, no evidence was found regarding this hypothesis through compression
testing. This could be a result of uniaxial compression testing being too destructive to
show differences in crystal interaction (intrinsic bonding between crystals). Once again
oscillatory rheology (within the linear viscoelastic region) was undertaken to investigate
the differences in wax networks produced under different processing conditions (see
section 5.2.3.2)
Emulsions formed with both units display different mechanical properties (Figure
5.9 c and d). It is observed that for high IV and low exit temperatures, the PS reduces

5. Manipulating Material Properties
134
the bulk modulus (from ~ 0.2 – 0.05 MPa) and point of fracture (From 0.008 – 0.003
MPa). With these conditions the interactions between crystals are broken resulting in a
weaker network. At higher temperatures (~80 °C), interactions between crystals will be
broken and melted and then reform during post-production crystallisation.
For the range of temperatures studied, the bulk modulus does not seem to depend on
the shaft speed of the PS unit (this was also observed when the shaft speed of the SSHE
was set up to 1,500 rpm – see Appendix 2). It was previously shown (Figure 4.8) that
for a given jacket temperature, emulsion droplet size decreases by increasing PS shaft
speed. I conclude here that in this range of droplet sizes (5 – 17 μm), the bulk modulus
does not depend on the size of the droplets formed in the process. This is supported by
the observation made for the SSHE unit; even though the droplet size depends on the
shaft speed of the SSHE unit (section 4.2.1.2.1), no difference is observed in the
emulsion point of fracture or bulk modulus.
One would then think that the point of fracture and bulk modulus is a function of the
crystals size formed during emulsification and post production cooling. This seems to
differ with the results found for the SSHE unit only (Figure 5.9a and b). However, the
point of fracture and bulk modulus are measures of the bulk properties, whereas the
difference in wax crystal network could be based on the intrinsic connections between
crystals. Therefore once again oscillatory rheology was conducted to investigate the
wax network properties. It is important to note this information could be calculated
from the existing curves of True stress/True strain (Norton et al., 2011). However the
first region of linearity (Young’s modulus) was extremely difficult to measure from
these curves.

5. Manipulating Material Properties
135
Figure 5.9 - Bulk modulus and point of fracture as a function of exit temperature for 10 %
W/O emulsions (where the continuous phase consisted of 5% CW and 10% MW and 5% P in
castor oil) passed through the SSHE only ((a) and (b)) and both the SSHE (IV = 500 rpm) and PS
((c) and (d)), at various shaft speeds. Flow rate was fixed at 60 mL/min. All samples were cooled
quiescently in a freezer until solid then tested with a compression rate of 1 mm/s at 32°C.
5.2.3.2 Characterisation of the elastic properties of emulsion-based lipstick
5.2.3.2.1 Effect of SSHE on Elastic Modulus
As previously mentioned it was expected that a SSHE would affect the material
properties of the resulting products. Previous results in this work have shown no
significant difference when determining the bulk modulus and point of fracture (Figure
5.9 a and b). Therefore the viscoelastic properties were assessed by measuring the
Exit Temperature (°C)
58 60 62 64 66 68 70 72 74 76 78
Bulk
Modulu
s (
MP
a)
0.00
0.01
0.02
0.03
0.04
500 RPM
1500 RPM
Exit Temperature (°C)
58 60 62 64 66 68 70 72 74 76 78
Poin
t of
Fra
ctu
re (
MP
a)
0.000
0.001
0.002
0.003
0.004(a) (b)
Exit Temperature (°C)
50 55 60 65 70 75 80
Bu
lk M
od
ulu
s (
M P
a)
0.00
0.05
0.10
0.15
0.20
0.25
0.30
0.35
SSHE Only
SSHE and PS with IV of 1500
SSHE and PS with IV of 1000
SSHE and PS with IV of 500
Exit Temperature (°C)
50 55 60 65 70 75 80
Po
int
of
Fra
ctu
re (
M P
a)
0.000
0.002
0.004
0.006
0.008
0.010
0.012
(c) (d)

5. Manipulating Material Properties
136
elastic modulus via oscillation rheology. Once again an initial amplitude sweep was
conducted in order to determine the linear viscoelastic region.
Results for SSHE only at various impeller rotational velocities (500 and 1,500 rpm)
are shown in Figure 5.10, where the elastic modulus is plotted as a function of the exit
temperature (It is important to note that additional jacket temperatures were measured as
initial findings showed a trend which required further investigation). As observed for
the point of fracture and bulk modulus, there is no effect of the impeller rotational
velocities on the elastic modulus. Nonetheless, the elastic modulus of the emulsion,
hence emulsion elasticity (Norton et al., 2011), demonstrated a strong dependence on
the exit temperature; the elastic modulus showed a maximum at 68C (~ 0.12 MPa) and
is lowest (~ 0.02 MPa) at either 55C or 75C. As previously stated, varying the
temperature affects both the emulsion droplet size and the formation of crystals.
Evidence has been found in the literature regarding the effect of emulsion droplet size
on the elastic modulus (Pal, 1996); Pal showed that a decrease in droplet size resulted in
a dramatic increase in the elastic modulus. In order to investigate this reported
behaviour, the elastic modulus was plotted as a function of emulsion droplet size
(Figure 5.11). In general, G’ seems to slightly increase with the droplet size, which
opposes Pal’s findings. But more interestingly, for a given droplet, the elastic modulus
varies. For example, at 5 m, elastic modulus varies from ~ 0.01 MPa to ~ 0.09 MPa,
depending on the flow rate and the impeller rotational velocity. It can be concluded
from these experiments that the change in emulsion droplet size is not the main
parameter affecting the emulsion elasticity in lipstick emulsions.

5. Manipulating Material Properties
137
Figure 5.10 - Elastic modulus G’ as a function of exit temperature for 10 % water-in-oil
emulsions (where the continuous phase consisted of 5% CW and 10% MW in castor oil). All
samples produced using various processing conditions ( is 30 mL/min, is 60 mL/min and is
90 mL/min; shaft speed was adjusted at either 500 rpm (open symbols) or 1500 rpm (full symbols)).
All samples were produced using a SSHE unit and cooled quiescently in the freezer till solid and
measured via oscillation rheology and G’ taken at a frequency of 5 Hz.
Exit Temperature (°C)
50 55 60 65 70 75 80
Ela
stic M
od
ulu
s (
M P
a)
0.00
0.02
0.04
0.06
0.08
0.10
0.12
0.14
0.16
IV: 1500 rpm and 30 ml/ min
IV: 500 rpm and 30 ml/ min
IV: 1500 rpm and 60 ml/ min
IV: 500 rpm and 60 ml/ min
IV: 1500 rpm and 90 ml/ min
IV: 500 rpm and 90 ml/ min

5. Manipulating Material Properties
138
Figure 5.11 - Elastic modulus of 10 % W/O emulsions (where the continuous phase consisted
of 5% CW and 10% MW in castor oil) formed at various temperatures in the SSHE unit as a
function of (a) droplet diameter ( is a flow rate of 30 mL/min, 60 mL/min and is 90 mL/min;
shaft speed was adjusted at either 500 rpm (open symbols) or 1500 rpm (full symbols)). All samples
were produced using a SSHE and cooled quiescently in the freezer till solid and measured via
oscillation rheology and G’ taken at a frequency of 5 Hz.
The other emulsion structural parameters affected by the exit temperature is the
number and size of crystals present in the continuous phase. If these are to modify
emulsion elasticity, it would be expected that the G’ of the continuous phase only
(without water droplets) which passes through the SSHE unit would react in a similar
manner as the emulsion does, to exit temperature changes. However, by comparing
Figure 5.12 with Figure 5.10, it becomes evident that temperature affects emulsion and
continuous phase elasticity differently; the elastic modulus of the continuous phase only
increases with temperature to reach a maximum of ~ 0.3 MPa at 75C. As previously
mentioned, a greater number of smaller crystals are formed in the SSHE chamber at low
temperature, due to more nucleation sites being formed at lower temperatures (Campos
Average d3,2
( m)
0 5 10 15 20 25
Ela
stic M
od
ulu
s (
G') (
M P
a)
0.00
0.02
0.04
0.06
0.08
0.10
0.12
0.14
IV: 1500 rpm and 30ml/min
IV: 500 rpm and 30ml/min
IV: 1500 rpm and 60ml/min
IV: 500 rpm and 60ml/min
IV: 1500 rpm and 90ml/min
IV: 500 rpm and 90ml/min

5. Manipulating Material Properties
139
et al., 2002). Larger crystals are formed post production during emulsion cooling as this
has a higher cooling rate (Beri et al., 2013, Campos et al., 2002). At high temperatures
(largely above crystallisation temperature), wax crystals are only formed during post
production. It is suggested here that the formation of large crystals contributes to the
production of a stronger network in the continuous phase resulting in a higher
continuous phase elasticity. This behavior is similar to that observed by Kim and Bush
(1999) for work on nanocrystalline structures. They showed that as crystal size
increased from 20 to 80 nm, the elastic modulus increased from 115 – 135 GPa (Kim
and Bush, 1999). It is important to note that the G’ of the emulsion is lower than that of
the continuous phase only, as the inclusion of water weakens the overall network
formulation. The difference in G’ noticed between emulsion and continuous phase will
be discussed.
At ~65C, crystallisation occurs in the SSHE chamber and small crystals are
formed. As mentioned in section 4.2.1.2.1, these small crystals have the ability to move
quickly through the continuous phase, to adsorb at the oil/water interface to form
Pickering water droplets (i.e. solid shells). It was shown by Le Révérend et al. that in
presence of PGPR, wax crystals adsorbed at the interface, which then sinter to form a
solid shell (hard shell) around the droplets (Le Révérend et al., 2011a). Nonetheless, at
this temperature, it is assumed that a large quantity of wax remained liquid at the exit of
the SSHE unit, which crystallised in post production.
Emulsions formed at 65C contain “hard shell like” water droplets and large
crystals; this structure allows unique interaction between water droplets and the
crystalline network, providing high elasticity to these emulsions. At higher
temperatures, large crystals are unlikely to adsorb at the interface and the water droplet

5. Manipulating Material Properties
140
acts as defects, lowering the emulsions elasticity. At low temperatures, the small
crystals formed, can adsorb at the interface, but the reduced number of large crystals
formed result in lower elasticity.
Figure 5.12 - Elastic modulus G’ as a function of exit temperature for continuous phase only
(consisting of 5% CW and 10% MW in castor oil). All samples produced using various processing
conditions ( is 30 mL/min, is 60 mL/min and is 90 mL/min; shaft speed was adjusted at
either 500 rpm (open symbols) or 1500 rpm (full symbols)). All samples were produced using a
SSHE unit and cooled quiescently in the freezer till solid and measured via oscillation rheology and
G’ taken at a frequency of 5 Hz.
It is hypothesised here that the interactions between “hard shelled” water droplets
covered by small wax crystals and the large crystals is the mechanism by which the
emulsion strength increases. This is only possible because of the adsorption and
sintering of wax crystals at the interface. To test this hypothesis, glass balontini beads (~
50 μm) were used to replace the water droplets. Glass beads play the role of “hard”
water droplets, with the difference that wax crystals are unable to adsorb at the glass
Exit Temperature (°C)
50 55 60 65 70 75 80
Ela
stic M
od
ulu
s (
G') (
M P
a)
0.0
0.1
0.2
0.3
0.4
0.5
30 ml / min flow rate and 1500 IV
30 ml / min flow rate and 500 IV
60 ml / min flow rate and 1500 IV
60 ml / min flow rate and 500 IV
90 ml / min flow rate and 1500 IV
90 ml / min flow rate and 500 IV

5. Manipulating Material Properties
141
surface. If the hypothesis is correct, the glass beads will not be incorporated in the
crystal network, which should result in different emulsion elasticity’s with changes in
SSHE jacket temperature. Figure 5.13 shows that the hypothesis was correct. Glass bead
“emulsions” exhibit different behavior to water-in-oil emulsions, but show similar
behaviour to the continuous phase only system (Figure 5.12); with elasticity increasing
to a maximum at ~ 80C.
Figure 5.13 - Elastic modulus G’ as a function of exit temperature for “emulsions” made with
10 % glass balontini beads instead of water. Continuous phase consisted of 5% CW and 10% MW
in castor oil)All samples produced using various processing conditions ( is 30 mL/min, is 60
mL/min and is 90 mL/min with a shaft speed of 500 rpm. All samples were produced using a
SSHE unit and cooled quiescently in the freezer till solid and measured via oscillation rheology and
G’ taken at a frequency of 5 Hz.
It was previously stated that by modifying the temperature in the SSHE unit, the
ratio between the number of crystals formed during or after emulsification changes.
This was determined by measuring the elasticity of the final emulsion formed as a
function of flow rate (Figure 5.14). By increasing the flow rate, emulsion G’ increases
for all temperatures except 80C. This increase is due to the fact that fewer crystals are
formed in the chamber, thus a greater number of large crystals are produced post
Exit Temperature (°C)
50 55 60 65 70 75 80
Ela
stic M
odulu
s (
G') (
M P
a)
0.0
0.2
0.4
0.6
0.8
1.0
1.2
IVR: 500 rpm

5. Manipulating Material Properties
142
production, as the emulsion has a shorter residence time. At 80C, all crystals are
formed post production, it is then expected that the flow rate has no effect on the
elasticity.
Figure 5.14 - Elastic modulus of 10 % W/O emulsions (where the continuous phase consisted of
5% CW and 10% MW in castor oil) formed at various temperatures in the SSHE unit as a function
of flow rate. All samples were produced using a SSHE and cooled quiescently in the freezer till solid
and measured via oscillation rheology and G’ taken at a frequency of 5 Hz.
5.2.3.2.2 Effect of the PS on Elastic Modulus
The effect of the PS processing parameters on the elastic modulus of the formulation
was investigated via oscillatory rheology. It is important to note that 5 % paraffin was
added to the formulation as it was expected that the PS would disrupt a network
resulting in a weaker network. Figure 5.15 shows that at exit temperatures below 65 °C
the use of a PS (regardless of the IV) reduces G’. For example at an IV of 1500 rpm, G’
is reduced from 0.3 – 0.05 MPa. It has previously been shown in this chapter that crystal
interactions determine the G’ of the network. Therefore at high IV and low temperatures
0
0.02
0.04
0.06
0.08
0.1
0.12
1
Elas
tic
Mo
du
lus
(G')
(M
Pa)
Flow Rate (ml/min)
JT: 55 °C
JT: 60 °C
JT: 65 °C
JT: 80 °C
30 60 90

5. Manipulating Material Properties
143
the shear of the impeller breaks connections between crystals resulting in a lower G’
being measured. However, at higher temperatures G’ does not seem to increase. This is
due the formulation melting and re-crystallising allowing the connections between
crystals to reform. Polarised microscopy was used to visualise the effect on the
microstructure. When a SSHE is utilised on its own (jacket temperature of 65 °C),
small droplets coated in Pickering particles in a wax network can be observed (Figure
5.16a). When the emulsion was passed through a SSHE and a PS (at an IV -500 rpm
and a jacket temperature of 55 °C), the impeller destroys the wax network resulting in
numerous of Pickering particles that are not connected in a strong network (Figure 5.16
b). However when a high jacket temperature is used for the PS, the bulk can melt and
re-crystallise creating a stronger network (Figure 5.16c).

5. Manipulating Material Properties
144
Figure 5.15 - Elastic Modulus (G’) as a function of exit temperature under varying processing
conditions ( – SSHE only, -SSHE and PS (impeller velocity (IV) of 1500 rpm, - SSHE and PS
(IV of 1000 rpm) and – SSHE and PS (IV of 500 rpm) All 10 % W/O emulsions (where the
continuous phase consisted of 5% CW, 10% MW and 5% P in castor oil) passed through a SSHE at
a Jacket temperature of 65 C and an IV of 500 rpm with an overall flow rate of 60 ml /min. They
were then passed through a PS and cooled quiescently in the freezer until solid and measured via
oscillatory rheology and G’ taken at a frequency of 5 Hz.
Exit Temperature (°C)
50 55 60 65 70 75 80
Ela
stic M
od
ulu
s (
G') (
M P
a)
0.0
0.1
0.2
0.3
0.4
0.5
SSHE Only
SSHE and PS with IV of 1500 rpm
SSHE and PS with IV of 1000 rpm
SSHE and PS with IV of 500 rpm

5. Manipulating Material Properties
145
Figure 5.16 - Polarised Microscopy of W/O emulsions which have passed through; (a) SSHE
only, (b) SSHE and PS (Impeller velocity (IV) – 1500 rpm and a jacket temperature (JT) of 55 °C)
and (c) SSHE and PS (IV – 500 rpm and JT 80 °C). All utilise a flow rate of 60 ml/min
5.3 Concluding Remarks
In this chapter the material properties of wax based emulsion systems were
investigated. These results showed that Young’s modulus, point of fracture and bulk
modulus increase with an increasing percentage of CW (which follows a power law
dependency of 3), but decreases with an increasing percentage of MW. This suggests
that the CW is part of the overall wax crystal network which is comprised of saturated
components, whereas the MW forms irregular crystals that disrupt the overall wax
crystal network. The Young’s modulus, elastic modulus and viscous modulus all
decrease with increasing aqueous phase volume. The slope of the decrease in elastic and
viscous moduli is reliant on the addition of solid wax which strengthens the wax
network. Although the addition of water droplets (2 – 4 μm) weakens the material

5. Manipulating Material Properties
146
properties, the addition of either paraffin or performalene increases strength, this is
more evident for the lower aqueous phase volume emulsions. In particular, the
emulsions containing 30 % aqueous phase had very similar material properties to the
non emulsified control system.
A lab scale scraped surface heat exchanger and pin stirrer were shown to be able to
control the crystallisation of the emulsion during processing. In particular, the size of
the crystals can be adjusted by controlling the temperature gradient between the
emulsion and the inner walls of the SSHE chamber, as the ratio between large crystals
formed in post production and small crystals formed during processing by adjusting the
flow rate through the unit. Due to the greater control over wax crystallisation the
emulsion microstructure and material properties can be selected. In particular, hard
lipsticks can be formed while containing small water droplets coated in small wax
crystals, which allows interactions to be formed with the larger wax crystals in the
continuous phase.

6. Tribology and Sensory Comparison
147
Chapter 6. Use of a
dynamic tribological
technique for investigating
the lubricating properties
of solid wax based
emulsion systems with a
sensory comparison

6. Tribology and Sensory Comparison
148
6.1 Introduction
Designing solid wax stabilised emulsions which could provide moisture to the lips is
one of the key aims of this project. When designing such emulsions it is important to
consider the impact of water incorporation on the lubricating properties of an emulsion
based lipstick. Tribology has been used in both the food (Malone et al., 2003,
Dresselhuis et al., 2008, Prinz and Lucas, 2000) and cosmetic industry (Timm et al.,
2011) to study the lubricating properties of both W/O and O/W liquid emulsion systems
which provides an insight into how samples are perceived by the consumer (de Wijk
and Prinz, 2005, Mills, 2011)). For example; in the food industry Chojnicka-Paszun et
al. (2012) compared the frictional behavior of increasing fat content in milk and related
the findings to perceived creaminess (obtained using a sensory panel). They found a
linear correlation between perceived creaminess and friction was obtained when the fat
content was above 1 wt %. However, to the author’s knowledge there has been no work
done on investigating solid formulations in a tribometer. Therefore the aim of this work
was investigate the possibility of using a pin-on-disk tribometer set-up to examine the
lubricating properties of solid wax based emulsion systems. After which, a small
sensory study was conducted to allow comparison between tribological results and
sensory attributes (application and sticky tacky) in order to determine whether a
tribometer could be used to indicate how a formulation will be received by the
consumer.

6. Tribology and Sensory Comparison
149
6.2 Results and Discussion
6.2.1 Tribology
6.2.1.1 Effect of Disk Speed and Normal Force on Friction and Wear
In order to employ pin and disk tribology to investigate the lubricating properties of
wax based emulsions, it is important to consider both the disk rotation speed and normal
force applied to the sample. This was conducted on a wax blend formulation (containing
5 wt % carnauba wax and 10 wt % microcrystalline wax and in castor oil).
6.2.1.1.1 Disk Speed
Six different disk speeds (1, 3, 5, 10, 30, 50 mms-1
) were investigated over a period
of 3600 seconds with a fixed applied load (0.5 N) using a pin and disk tribological
setup. The different disk speeds were investigated as the speed of the elastomer disk can
be ‘likened’ to the speed at which a lipstick is applied. However, increasing the speed
could lead to greater wear occurring which would result in less wax being within the
contact zones. Figure 6.1 shows the effect of varying disk speeds on both the friction
(Figure 6.1a) and wear (Figure 6.1b) of a wax blend (containing 5 wt % carnauba wax
and 10 wt % microcrystalline wax in castor oil). Wear is an important parameter to
examine, as when a lipstick is applied it must initially wear resulting in a thin film
remaining on the lips.
Figure 6.1a shows that for all disk speeds the friction coefficient decreases over a
period time from 0.7 to reach a plateau value at 0.1. The time taken to reach the
plateau value varies depending on the time taken for the solid emulsion disk to wear to
a thin film. It is important to note that the data points represent a moving average of 3
points and the error bars are representative of the original data. The moving average
presentation of the original data was conducted as previous work by Godfrey (1995) and

6. Tribology and Sensory Comparison
150
Blau (1991) showed that when working with an unlubricated system in a pin-on-disk
tribometer it is unrealistic to expect a single frictional force value as a lot of noise can
be generated. Therefore a moving average of 3 points was conducted to minimise the
noise. It should also be noted that after the sample material goes through the contact
area it wears and displaces from the elastomer disk. It then attaches to the side of the
vessel.
Figure 6.1b shows the wear of the solid disk as a function of time. From this it is
clear that at higher disk speeds the disk is worn away more rapidly. For example to
reach a thin film on the disk at 1 and 50 mms-1 it took 2000 and 400 s respectively.
This is to be expected as at greater speeds the disk will go through more revolutions and
therefore experience the localized applied load at a greater frequency. Therefore one
would expect that if the number of revolutions to wear the sample was plotted against
disk speed, a horizontal line would be obtained. However Figure 6.2 clearly shows a
linear correlation (R2 = 0.98) between the number of revolutions required to wear the
sample to a thin film and the disk speed. This can be attributed to the wax blend not
experiencing the full load at higher disk speeds.

6. Tribology and Sensory Comparison
151
(a)
(b)
Figure 6.1 – (a)Friction coefficient and (b) wear vs time for a wax blend (5 wt % carnauba wax
and 10 wt % microcrystalline wax in castor oil) at varying disk speeds. All experiments were
conducted in a pin-on disk set up with a load of 0.5 N.
Time (s)
0 1000 2000 3000
Friction C
oeff
icie
nt
0.0
0.2
0.4
0.6
0.8
1.0
1 mm
3 mm
5 mm
10 mm
30 mm
50 mm
Time (s)
0 500 1000 1500 2000 2500
We
ar
(um
)
-2500
-2000
-1500
-1000
-500
0
500
1 mm s-1
3 mm s-1
5 mm s-1
10 mm s-1
30 mm s-1
50 mm s-1

6. Tribology and Sensory Comparison
152
Figure 6.2 – Number of revolutions (required to produce a thin film) vs disk speed (mms-1
). All
experiments were conducted in a pin-on disk set up with a load of 0.5 N. All experiments were
conducted on a wax blend (5 wt % carnauba wax and 10 wt % microcrystalline wax in castor oil)
From these graphs, it becomes clear that a disk speed needs to be chosen that not
only can be ‘likened’ to the speed at which a lipstick is applied but also creates enough
wear to allow a thin film of wax in the contact zone. Therefore 10 mm s-1
will be used
for the remainder of the studies.
6.2.1.1.2 Normal Force
Four different normal forces (0.3, 0.5, 1 and 3N) were investigated over a period of
3600 s with a fixed disk speed of 10 mms-1
. Different normal forces were investigated
as it is expected that with increasing downward force an increase in wear will occur on
the sample. It is important to select an appropriate normal force that will not cause the
sample to fracture, as fracture results in the solid wax disk coming away from the
elastomer disk. Figure 6.3 shows the effect of normal force on both friction (Figure 6.3
a) and wear (Figure 6.3 b). Figure 6.3 a shows that the final friction value is the same (
0.03) for all normal forces investigated. The only difference is the time taken to get to
the final friction value, this is caused by the level of wear to the sample. Figure 6.3 b
Disk Speed (mms-1)
0 10 20 30 40 50 60
Re
vo
lutio
ns o
f D
isk
0
20
40
60
80
100
120
140
160
R2
= 0.98

6. Tribology and Sensory Comparison
153
shows that as normal force increases from 0.3 N to 1 N the time taken for the sample to
wear to a thin film decreases from 1200 s to 100 s. This is due to the increased
downward force which destroys the wax network thus allowing the solid wax to
displace and wear away quicker. The effect of normal force on wear depth has been
reported in the literature. Bhushan and Kulkarni (2001) investigated the effect of normal
force on single crystal silicon and silicon oxide. Results showed that for single crystal
silicon as normal force increased from 10 – 40 μN the wear depth increased from 1 – 35
nm. This was also attributed to the greater downward force (Bhushan and Kulkarni,
1996). It is important to note that when 3 N was used, it resulted in immediate fracture
of the solid disk which prevented analysis.

6. Tribology and Sensory Comparison
154
(a)
(b)
Figure 6.3 - (a) Friction coefficient and (b) wear vs time for a wax blend (5 wt % carnauba wax
and 10 wt % microcrystalline wax in castor oil) at varying normal forces. All experiments were
conducted in a pin-on disk set up with a disk speed of 10 mms-1
.
Time (s)
0 1000 2000 3000 4000
Frictio
n C
oe
ffic
en
t
-0.2
0.0
0.2
0.4
0.6
0.8
1.0
0.3 N
0.5 N
1 N
Time (s)
0 1000 2000 3000 4000
Frictio
n C
oe
ffic
en
t
-0.2
0.0
0.2
0.4
0.6
0.8
1.0
0.3 N
0.5 N
1 N
Time (s)
0 200 400 600 800 1000 1200 1400 1600 1800 2000
We
ar
(m
)
-2500
-2000
-1500
-1000
-500
0
500
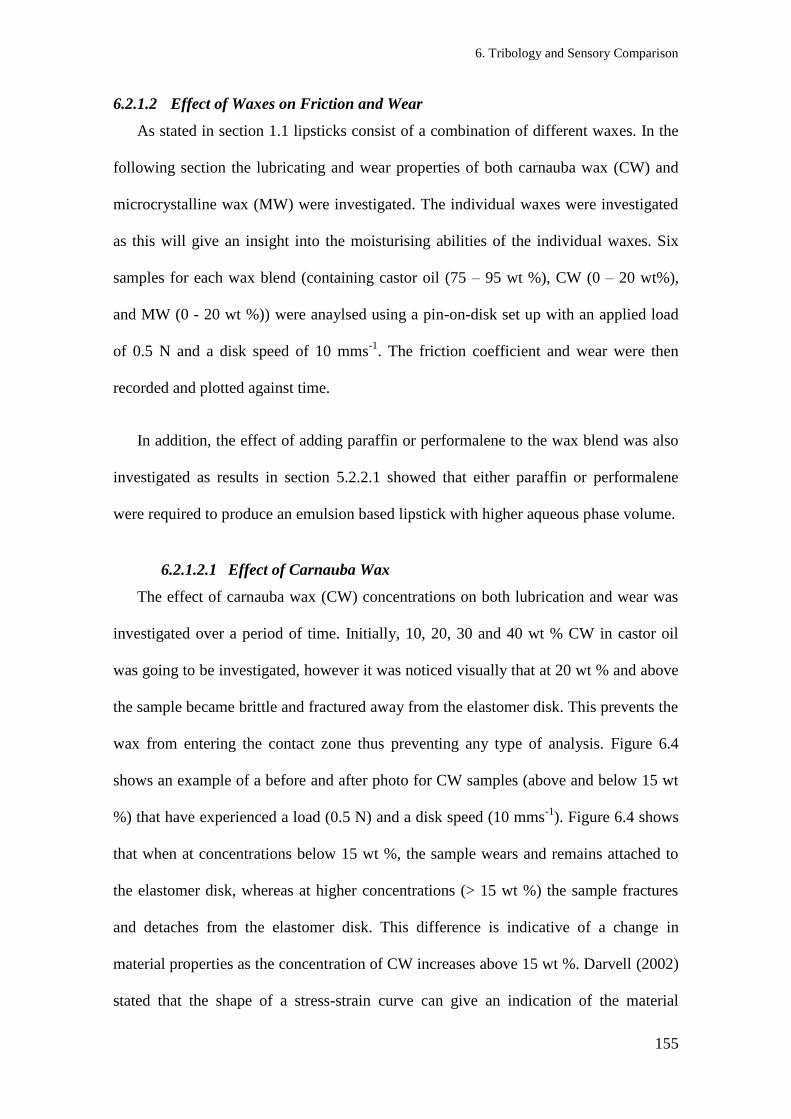
6. Tribology and Sensory Comparison
155
6.2.1.2 Effect of Waxes on Friction and Wear
As stated in section 1.1 lipsticks consist of a combination of different waxes. In the
following section the lubricating and wear properties of both carnauba wax (CW) and
microcrystalline wax (MW) were investigated. The individual waxes were investigated
as this will give an insight into the moisturising abilities of the individual waxes. Six
samples for each wax blend (containing castor oil (75 – 95 wt %), CW (0 – 20 wt%),
and MW (0 - 20 wt %)) were anaylsed using a pin-on-disk set up with an applied load
of 0.5 N and a disk speed of 10 mms-1
. The friction coefficient and wear were then
recorded and plotted against time.
In addition, the effect of adding paraffin or performalene to the wax blend was also
investigated as results in section 5.2.2.1 showed that either paraffin or performalene
were required to produce an emulsion based lipstick with higher aqueous phase volume.
6.2.1.2.1 Effect of Carnauba Wax
The effect of carnauba wax (CW) concentrations on both lubrication and wear was
investigated over a period of time. Initially, 10, 20, 30 and 40 wt % CW in castor oil
was going to be investigated, however it was noticed visually that at 20 wt % and above
the sample became brittle and fractured away from the elastomer disk. This prevents the
wax from entering the contact zone thus preventing any type of analysis. Figure 6.4
shows an example of a before and after photo for CW samples (above and below 15 wt
%) that have experienced a load (0.5 N) and a disk speed (10 mms-1
). Figure 6.4 shows
that when at concentrations below 15 wt %, the sample wears and remains attached to
the elastomer disk, whereas at higher concentrations (> 15 wt %) the sample fractures
and detaches from the elastomer disk. This difference is indicative of a change in
material properties as the concentration of CW increases above 15 wt %. Darvell (2002)
stated that the shape of a stress-strain curve can give an indication of the material

6. Tribology and Sensory Comparison
156
properties. Therefore two different CW concentrations (10 and 15 wt % in castor oil)
were compressed and the true stress was plotted against true strain (Figure 6.5). From
Figure 6.5 a there is no major drop after fracture which is indicative of plastic behavior
whereas the sharp drop observed after fracture in Figure 6.5 b is indicative of brittle
behavior (Darvell, 2002). This behaviour has been explained in Chapter 5 which
showed that as CW concentration increases the level of interaction between CW crystals
increased via a power law relationship ( 3).
Figure 6.4 – Visual representation of before and after a sample has experienced a load (0.5 N)
and a disk speed (10 mms-1
) for samples containing either >15 wt % or <15 wt % in castor oil.
<15%
>15%
Plastic behaviour
Brittle behaviour
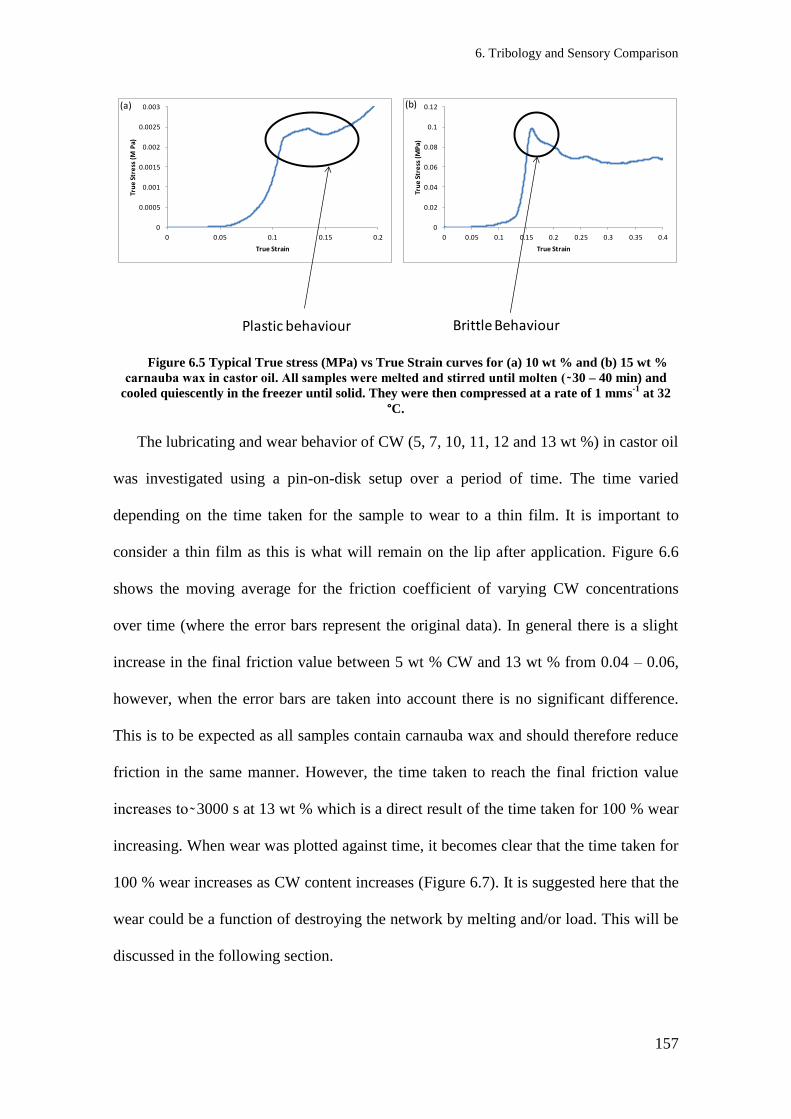
6. Tribology and Sensory Comparison
157
Figure 6.5 Typical True stress (MPa) vs True Strain curves for (a) 10 wt % and (b) 15 wt %
carnauba wax in castor oil. ll samples were melted and stirred until molten ( 30 – 40 min) and
cooled quiescently in the freezer until solid. They were then compressed at a rate of 1 mms-1
at 32
°C.
The lubricating and wear behavior of CW (5, 7, 10, 11, 12 and 13 wt %) in castor oil
was investigated using a pin-on-disk setup over a period of time. The time varied
depending on the time taken for the sample to wear to a thin film. It is important to
consider a thin film as this is what will remain on the lip after application. Figure 6.6
shows the moving average for the friction coefficient of varying CW concentrations
over time (where the error bars represent the original data). In general there is a slight
increase in the final friction value between 5 wt % CW and 13 wt % from 0.04 – 0.06,
however, when the error bars are taken into account there is no significant difference.
This is to be expected as all samples contain carnauba wax and should therefore reduce
friction in the same manner. However, the time taken to reach the final friction value
increases to 3000 s at 13 wt % which is a direct result of the time taken for 100 % wear
increasing. When wear was plotted against time, it becomes clear that the time taken for
100 % wear increases as CW content increases (Figure 6.7). It is suggested here that the
wear could be a function of destroying the network by melting and/or load. This will be
discussed in the following section.
0
0.02
0.04
0.06
0.08
0.1
0.12
0 0.05 0.1 0.15 0.2 0.25 0.3 0.35 0.4
Tru
e S
tre
ss (
MP
a)
True Strain
0
0.0005
0.001
0.0015
0.002
0.0025
0.003
0 0.05 0.1 0.15 0.2
Tru
e S
tre
ss (
M P
a)
True Strain
Plastic behaviour Brittle Behaviour
(a) (b)

6. Tribology and Sensory Comparison
158
Figure 6.6 – Friction coefficient vs time for a varying carnauba wax concentrations in castor
oil. All experiments were conducted in a pin-on disk set up with a load of 0.5 N and a disk speed of
10 mms-1
.
Figure 6.7 – Wear vs time for a varying carnauba wax concentrations in castor oil. All
experiments were conducted in a pin-on disk set up with a load of 0.5 N and a disk speed of
10 mms-1
.
Time (s)
0 1000 2000 3000 4000
Frictio
n C
oe
ffic
ien
t
0.0
0.1
0.2
0.3
0.4
0.5
0.6
0.7
5 % CW
7 % CW
10 % CW
11 % CW
12 % CW
13 % CW
Effect of CW Concentration
Time (s)
0 500 1000 1500 2000
We
ar
(m
)
-3000
-2500
-2000
-1500
-1000
-500
0
500
5%
7%
10%
11%
12%
13%

6. Tribology and Sensory Comparison
159
To investigate the effect of melting on the sample, it is important to consider the
change in temperature (ΔT) within the experiment. This can be calculated by
rearranging the following two equations;
Equation 6-1
Equation 6-2
Where Q – energy dissipated, F – frictional force, V – velocity, m – mass and Cp –
heat capacity.
The ΔT was calculated for both 5 and 10 % CW, as the heat capacity can be
obtained from the specific heat capacity curves shown in Figure 4.9. Results show
(Table 6.1) that for increasing CW concentration there is relatively no change in
temperature (up to 3 °C). As there is relatively no change in temperature the time taken
to wear must be a function of the strength of the wax network. Therefore the elastic
modulus (G’) was determined for each CW concentration using oscillatory rheology and
compared to the average time taken for each sample to wear (Figure 6.8). Figure 6.8
shows there is a direct correlation between time taken to wear and the elastic modulus
of the wax network. Therefore at higher concentrations (12 wt %) it takes longer (550 s)
for the structure to wear to a thin film when compared to lower wax concentrations (7
wt % takes 180 s to wear).
Table 6.1 – Change in temperature within tribometer calculated from Equations 7.1 and 7.2
Carnauba Wax Concentration (wt %) Change in Temp (ΔT) (°C)
5 1.35
10 2.9

6. Tribology and Sensory Comparison
160
Figure 6.8 – Average time take taken to wear to a thin film ( ) and elastic modulus (G’) ( ) vs
wt % of carnauba wax. Samples produced for rheology were produced by melting and stirring
until molten ( 30 – 40 min) and cooled quiescently in the freezer until solid. The G’ was then
measured using oscillatory rheology and taken from a frequency of 5 Hz.
6.2.1.2.2 Effect of Microcrystalline Wax
During in the demoulding process, samples removed from moulds with only MW
were too soft to be removed successfully, therefore it was not possible to analyse such
samples. Hence 5 wt % CW was added to 5 -20 wt % MW to investigate the effect of
MW on both friction and wear. It is important to note that greater than 20 wt % addition
of MW results in shrinkage of the sample; this prevents the sample adhering to the
elastomer thus preventing analysis (Zhang et al., 2002). Figure 6.9 shows that as MW
concentration increases from 5 wt % to 20 wt % the final friction value increases ( 0.04
– 0.11 respectively). It is important to note that if the error bars for the original data are
taken into consideration there is relatively no difference in friction coefficient. However
there is a general trend that increasing MW concentration increases friction slightly.
This increase could be a result of a greater number of irregular crystals (Petersson et al.,
2008) being in the contact zone which could lead to a slight increase in friction.
wt % of CW
4 6 8 10 12 14
Avera
geT
ime t
aken t
o w
ear
(s)
0
200
400
600
800
1000
G' (M
Pa)
0.0
0.1
0.2
0.3
0.4
0.5

6. Tribology and Sensory Comparison
161
The effect of MW concentration on the time taken to wear is shown in Figure
6.10 (original data shown in Appendix 3). Results show that the time taken to wear to a
thin film is directly related to the strength of the network. As MW concentration
increases (5 – 20 wt %) the time taken to wear decreases from 400 to 310 s as does
the elastic modulus ( 0.27 – 0.23 MPa). This decrease is attributed to a weaker
structure being produced as MW concentration increases which has been explained
previously in section 5.2.1.2.
Figure 6.9 – Friction coefficient vs time for a varying microcrystalline wax (MW)
concentrations in castor oil (each sample contained 5 wt % carnauba wax). All experiments were
conducted in a pin-on disk set up with a load of 0.5 N and a disk speed of 10 mms-1
.
Time (s)
0 500 1000 1500 2000
Friction C
oeff
icie
nt
0.0
0.1
0.2
0.3
0.4
0.5
0.6
0.7
5 % MW
10 % MW
15 % MW
20 % MW

6. Tribology and Sensory Comparison
162
Figure 6.10 - Average time taken to wear to a thin film ( ) and elastic modulus (G’) ( )vs wt
% of microcrystalline wax. Samples produced for rheology were produced by melting and stirring
until molten ( 30 – 40 min) and cooled quiescently in the freezer until solid. The G’ was then
measured using oscillatory rheology and taken from a frequency of 5 Hz.
6.2.1.2.3 Effect of Adding Paraffin and Performalene on friction and wear
In Chapter 5 it was shown that paraffin and performalene increases the elastic
modulus of the emulsion based lipsticks. Therefore initially it is important to consider
how they both affect the friction and wear properties of a wax blend. Hence the effect of
adding either paraffin or performalene to a wax blend (5 wt % CW and 10 wt % MW in
castor oil) on friction and wear was investigated.
Figure 6.11 shows the effect of increasing either paraffin (Figure 6.11 a) or
performalene (Figure 6.11 b) concentrations on the friction coefficient. Results show
that as the concentration of either paraffin or performalene increases (5 – 20 wt % and
2.5 – 10 wt % respectively) so does the final friction coefficient (0.06 – 0.12 and 0.08 –
0.14 respectively). These increases can be attributed to a greater number of crystals
being present in the contact zones. This agrees with work reported for food systems
wt % of MW Wax
0 5 10 15 20 25
Avera
ge t
ime t
aken t
o w
ear
(s)
0
100
200
300
400
500
G' (M
Pa)
0.0
0.1
0.2
0.3

6. Tribology and Sensory Comparison
163
which showed that adding large starch particles to a vanilla custard dessert increased the
friction coefficient from 0.6 to 0.81 (de Wijk and Prinz, 2005) due to more large starch
particles present in the contact zone.
It is important to note that the major difference between adding paraffin and
performalene is the time taken for the samples to reach a final friction value. The time
to wear the system to a thin film is again related to the elastic modulus as shown in
Figure 6.12. Results show that as the concentration of paraffin increases (5 - 20 wt %)
the time taken to wear increases from 700 s to 1900 s. This is attributed to the elastic
modulus of the network increasing from 0.5 to 0.6 MPa. If performalene is used instead
of paraffin, the time taken to wear increases from 400 s to 10,000 s as concentration
increases from 2.5 to 10 wt %. This is due to performalene forming a stronger network
which is observed by G’ increasing from 1 – 3 MPa (previously discussed in section
5.2.2.1).

6. Tribology and Sensory Comparison
164
(a)
(b)
Figure 6.11 - Friction coefficient vs time for a varying (a) paraffin and (b) performalene
concentrations in castor oil (each sample contained 5 wt % carnauba wax and 10 wt %
microcrystalline wax). All experiments were conducted in a pin-on disk set up with a load of 0.5 N
and a disk speed of 10 mms-1
Time (s)
0 1000 2000 3000 4000
Friction
Coe
ffic
ien
t
0.0
0.2
0.4
0.6
0.8
5 % Paraffin
10 % Paraffin
15 % Paraffin
20 % Paraffin
Time (s)
0 5000 10000 15000 20000 25000
Frictio
n C
oe
ffic
ien
t
0.0
0.2
0.4
0.6
0.8
2.5 % Performalene
5 % Performalene
7.5 % Performalene
10 % Performalene

6. Tribology and Sensory Comparison
165
(a)
(b)
Figure 6.12 - Average time take taken to wear to a thin film ( ) and elastic modulus (G’) ( ) vs
wt % of (a) paraffin and (performalene). Samples produced for rheology were produced by
melting and stirring until molten ( 30 – 40 min) and cooled quiescently in the freezer until solid.
The G’ was then measured using oscillatory rheology and taken from a frequency of 5 Hz.
wt % of Paraffin Wax
4 6 8 10 12 14 16 18 20 22
Ave
rage
tim
e t
ake
n t
o w
ea
r (s
)
0
500
1000
1500
2000
G' (M
Pa
)
0.0
0.1
0.2
0.3
0.4
0.5
0.6
0.7
wt % of Performalene Wax
2 4 6 8 10 12
Avera
ge t
ime t
aken t
o w
ear
(s)
0
2000
4000
6000
8000
10000
12000
G' (M
Pa)
0.0
0.5
1.0
1.5
2.0
2.5
3.0
3.5

6. Tribology and Sensory Comparison
166
6.2.1.3 Effect of Emulsions on Friction and Wear
In the preceding work in this chapter, the effect of different waxes on lubrication
and wear was investigated. However when producing emulsion based lipsticks, it is
important to consider the impact incorporating water (as an emulsion) has upon the
lubrication and wear.
6.2.1.3.1 Effect of Aqueous Phase Volume
In order to investigate the effect of water content on lubrication and wear, emulsions
were produced containing varying amounts of aqueous phase (5, 10, 20, 30 and 40 wt
%) which were analysed using a pin-on-disk set up. It is important to note that the
continuous phase (58 – 93 wt %) comprised of 5 wt % CW, 10 wt % MW and 5 wt %
paraffin in castor oil with each emulsion containing an overall 2 wt % polyglycerol
polyricinoleate (PGPR). Figure 6.13 and Table 6.2 show the effect of incorporating an
increasing aqueous phase volume. In general, increasing the aqueous phase volume
increases the final friction value (0.056 – 0.143, shown in Table 6.2). It is suggested
here that this increase is due to water droplets being in the contact zones which
increases the friction coefficient. Dresselhuis et al (2007) investigated the tribology of
O/W emulsion under mouth-like conditions. They found that breakdown of the O/W
emulsion resulted in surface induced coalescence of the oil droplets which lowered the
overall friction (Dresselhuis et al., 2007, Dresselhuis et al., 2008). Therefore in the
system examined in this research, structural breakdown of the emulsion will lead to
water droplets in the contact zone resulting in the observed (Table 6.2) increase in
friction coefficient.

6. Tribology and Sensory Comparison
167
Figure 6.13 - Friction coefficient vs time for a varying aqueous phase volumes with 58 – 93 wt
% continuous phase (containing 5 wt % carnauba wax, 10 wt % microcrystalline wax and 5 wt %
performalene in castor oil) and 2 wt % polyglycerol polyrinceoleate. All emulsions were produced
using a silverson high shear mixer (10,000 rpm for 5 minutes). All experiments were conducted in a
pin-on disk set up with a load of 0.5 N and a disk speed of 10 mms-1
Table 6.2 – Final friction values (taken from Figure 6.13) vs aqueous phase volume.
Aqueous Phase (%) Final Friction Coefficient
Value
0 0.056
5 0.082
10 0.086
20 0.093
30 0.117
40 0.143
Time (s)
0 500 1000 1500 2000
Friction C
oeff
icie
nt
0.0
0.2
0.4
0.6
0.8
1.0
1.2
1.4
0 % Aq Phase
5 % Aq Phase
10 % Aq Phase
20 % Aq Phase
30 % Aq Phase
40 % Aq Phase

6. Tribology and Sensory Comparison
168
The effect of aqueous phase volume on wear is shown in Figure 6.14. The time taken to
reach a thin film decreases from 800 to 100 s as the aqueous phase volume increase
from 0 to 40 wt %. This is directly related to water droplets acting as defects resulting in
G’ decreasing from 0.5 to 0.1 with increasing aqueous phase volume (0 – 40 wt %
(explained section 5.2.2).
Figure 6.14 - Average time take taken to wear to a thin film ( ) and elastic modulus (G’) ( ) vs
wt % Aq phase with 58 – 93 wt % continuous phase (containing 5 wt % carnauba wax, 10 wt %
microcrystalline wax and 5 wt % performalene in castor oil) and 2 wt % polyglycerol
polyrinceoleate. amples produced for rheology were produced by melting and stirring until molten
( 30 – 40 min) and cooled quiescently in the freezer until solid. The G’ was then measured using
oscillatory rheology and taken from a frequency of 5 Hz.
6.2.1.3.2 Effect of Droplet Size
It has been reported in the literature that droplet size can have an effect on the
lubricating properties of a material. De Wijk and Prinz (2005) investigated the effect of
fat droplets on the coefficient of friction in an O/W emulsion system. Their results
showed that as the fat droplet size increased (2 – 6 μm), the coefficient of friction
increased from 0.59 – 0.75. However to the author’s knowledge there is no evidence of
the droplet size of the dispersed phase in W/O emulsions being investigated. Therefore
wt % of Aq phase
0 10 20 30 40 50
Avera
ge t
ime t
aken t
o w
ear
(s)
0
200
400
600
800
1000
G' (M
Pa)
0.0
0.1
0.2
0.3
0.4
0.5
0.6

6. Tribology and Sensory Comparison
169
this section looks at the effect of varying the dispersed phase droplet size. As shown in
Table 4.2, varying the amount of PGPR (0.2 – 2 wt %) in the emulsion system can
control the droplet size (100 – 2.8 μm).
Four different droplet sizes (100, 5.8, 3.4 and 2.8 μm) were produced using a
Silverson high shear mixer and these were analysed using a pin-on-disk set-up in a
tribometer. Figure 6.15 shows the effect of droplet size on friction coefficient. There is
a general trend that friction coefficient increases (0.12 – 0.19) as droplet size increases
(2.8 - 100 μm). It is suggested here that this increase is either due to larger water
droplets being in the contact zone or a result of increasing the amount of emulsifier in
the formulation. It has been reported by Cambiella et al. (2006) that emulsifier
concentration can impact the lubricating properties of an emulsion. They investigated
the effect of emulsifiers (anionic, nonionic and cationic) in O/W emulsions on metal
lubrication. Results showed that the mechanism of lubrication between the metal
surface and oil droplets was controlled by the emulsifier concentration, as this dictated
the stability, droplet size distribution and surface/interfacial tension of the droplets. In
order to investigate if PGPR effected the lubricating properties, a control experiment
was conducted to investigate the effect of low (0.5 wt %) and high (2 wt %) PGPR
concentrations on the friction coefficient. Figure 6.16 shows that that friction coefficient
value does not change as the concentration of PGPR increases, therefore the change in
friction coefficient observed in Figure 6.15 is a result of larger water droplets being
present in the contact zone causing an increase in friction. Similar behaviour was
observed by Timm et al. (2011) who investigated the effect of different cosmetic
particle sizes (11.5 – 63.2 μm) on friction coefficient. They found that the friction
coefficient increased from 0.075 – 0.4 as particle size increased from 11.5 – 63.2 μm.
They concluded that this was due to larger particles concentrating around the contact

6. Tribology and Sensory Comparison
170
region of the ball which increases the friction coefficient (Timm et al., 2011, Johnson
and Kauzlarich, 2004).
Figure 6.15 - Friction coefficient vs time for a varying droplet sizes. All samples were produced
using a Silverson high shear mixer (10,000 rpm for 5 minutes) and consist of 20 wt % Aqueous
phase, 78 – 79.8 wt % continuous phase (containing 5 wt % carnauba wax, 10 wt %
microcrystalline wax and 5 wt % performalene in castor oil) and 0.2 – 2 wt % polyglycerol
polyrinceoleate. All experiments were conducted in a pin-on disk set up with a load of 0.5 N and a
disk speed of 10 mms-1
Time (s)
0 500 1000 1500 2000
Frictio
n C
oe
ffic
ien
t
0.0
0.2
0.4
0.6
0.8
1.0
1.2
1.4
100 m
5.8 m
3.4 m
2.8 m

6. Tribology and Sensory Comparison
171
Figure 6.16 - Friction coefficient vs time for a varying polyglycerol polyrinceoleate (PGPR)
concentrations. All samples were produced using a silverson high shear mixer (10,000 rpm for 5
minutes) and consist of 20 wt % Aqueous phase, 78 – 79.5 wt % continuous phase (containing 5 wt
% carnauba wax, 10 wt % microcrystalline wax and 5 wt % performalene in castor oil) and 0.5 – 2
wt % PGPR. All experiments were conducted in a pin-on disk set up with a load of 0.5 N and a disk
speed of 10 mms-1
6.2.1.3.3 Effect of Dispersed Phase Viscosity
In the food industry, it has been reported that the high viscosity dispersed phases in
O/W emulsions lowered the perceived oral friction thus improving the perception of
creaminess (Dresselhuis et al., 2008). Therefore varying the dispersed phase viscosity
of a W/O emulsion may affect the frictional properties of a material which could
enhance its sensory perceptions. In order to vary the dispersed phase viscosity, glycerol
was added in varying quantities (20- 50 wt % of aqueous phase) to distilled water.
Glycerol was chosen for two reasons: (1) it has been shown to improve moisturising
ability (Blichmann et al., 1989) and revive clinical signs of dryness (Serban et al.,
Time (s)
0 500 1000 1500 2000
Frictio
n C
oe
ffic
ien
t
0.0
0.2
0.4
0.6
0.8
0.5 % PGPR
2 % PGPR
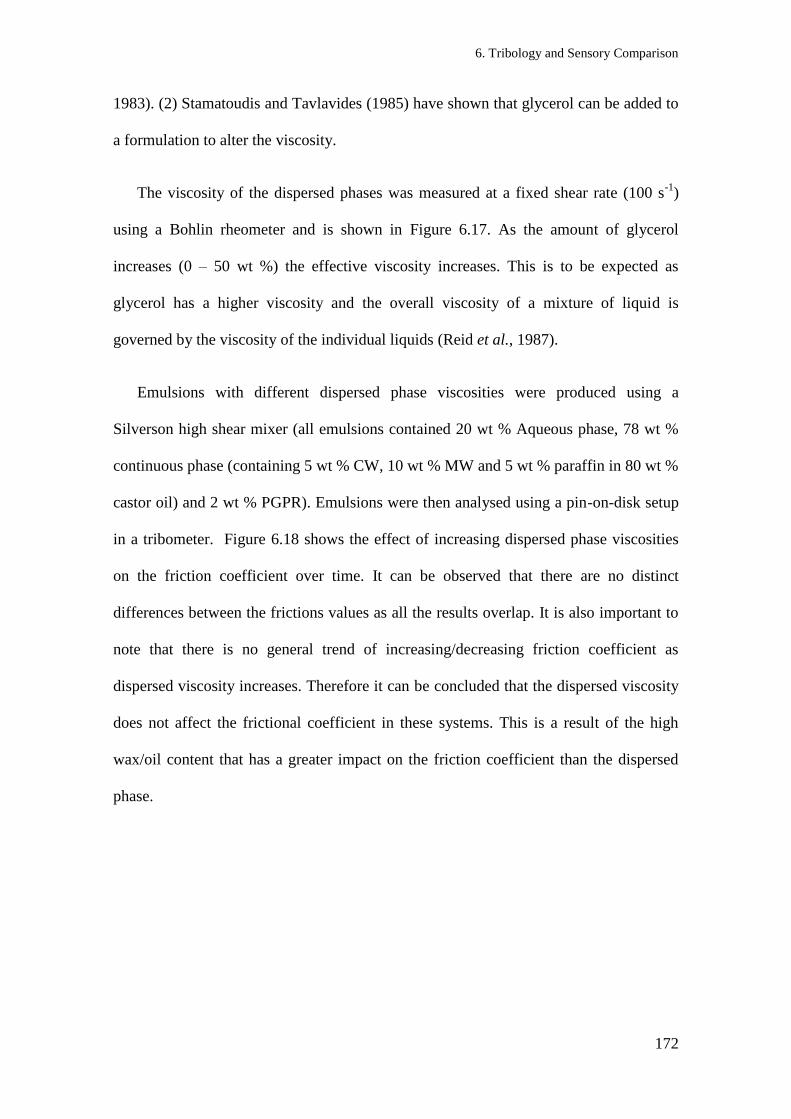
6. Tribology and Sensory Comparison
172
1983). (2) Stamatoudis and Tavlavides (1985) have shown that glycerol can be added to
a formulation to alter the viscosity.
The viscosity of the dispersed phases was measured at a fixed shear rate (100 s-1
)
using a Bohlin rheometer and is shown in Figure 6.17. As the amount of glycerol
increases (0 – 50 wt %) the effective viscosity increases. This is to be expected as
glycerol has a higher viscosity and the overall viscosity of a mixture of liquid is
governed by the viscosity of the individual liquids (Reid et al., 1987).
Emulsions with different dispersed phase viscosities were produced using a
Silverson high shear mixer (all emulsions contained 20 wt % Aqueous phase, 78 wt %
continuous phase (containing 5 wt % CW, 10 wt % MW and 5 wt % paraffin in 80 wt %
castor oil) and 2 wt % PGPR). Emulsions were then analysed using a pin-on-disk setup
in a tribometer. Figure 6.18 shows the effect of increasing dispersed phase viscosities
on the friction coefficient over time. It can be observed that there are no distinct
differences between the frictions values as all the results overlap. It is also important to
note that there is no general trend of increasing/decreasing friction coefficient as
dispersed viscosity increases. Therefore it can be concluded that the dispersed viscosity
does not affect the frictional coefficient in these systems. This is a result of the high
wax/oil content that has a greater impact on the friction coefficient than the dispersed
phase.

6. Tribology and Sensory Comparison
173
Figure 6.17 – Effective viscosity of the dispersed phase with varying wt % of glycerol in
distilled water. All samples were measured at a constant shear rate (100 s-1
) using a 40 mm acrylic
cone and plate geometry (0.15 mm gap width) at a temperature of 32 °C
wt % of glycerol
0 10 20 30 40 50
Eff
ective V
iscosity (
Pa
S)
0.000
0.001
0.002
0.003
0.004
0.005
Shear rate 100 s-1

6. Tribology and Sensory Comparison
174
Figure 6.18 - Friction coefficient vs time for a varying dispersed phase viscosities. All samples
were produced using a silverson high shear mixer (10,000 rpm for 5 minutes) and consist of 20 wt
% Aqueous phase (0- 50 wt % glycerol in water), 78 – 79.5 wt % continuous phase (containing 5 wt
% carnauba wax, 10 wt % microcrystalline wax and 5 wt % performalene in castor oil) and 2 wt %
PGPR. All experiments were conducted in a pin-on disk set up with a load of 0.5 N and a disk speed
of 10 mms-1
6.2.2 Sensory
In order to investigate the effect of emulsion structure on consumer perception, four
samples (bench mark (base formulation with no water), 5 % wt Aqueous phase, 20 % wt
Aqueous phase and 20 % wt Aqueous phase with a larger droplet size) were analysed by
a trained sensory panel using compusense software. These four samples were chosen as
they showed differences in friction coefficient and therefore could be used to directly
compare sensory data to tribology data.
Time (s)
0 500 1000 1500 2000
Friction C
oeff
icie
nt
0.0
0.2
0.4
0.6
0.8
1.0 mPaS
1.6 mPaS
2.4 mPaS
3.1 mPaS
4.2 mPaS

6. Tribology and Sensory Comparison
175
The sensory panel used quantitative descriptive analysis to identify perceived
differences between emulsions and the bench mark. The panel investigated two distinct
attributes; application (drag) and sticky/tacky. These were assessed on both the hand
and lip. The trained panel was also asked to give their opinion verbally (in the language
generation session) regarding the moisturising ability of the samples. Initially, it is
important to check that the panel is performing well and any differences observed
between samples are due to the samples and nothing else. There are two main factors
that influence the sensory score; the samples and the panelists. The Compusense
software utilised analysis of variance (ANOVA) to calculate how significant these
effects were for a 95 % confidence level.
There was a significant panelist effect on both hand and lip for application and
sticky/tacky (p < 0.05 at 95 % confidence interval). This indicates that the panelists are
scoring differently across all the samples, but they are consistently doing so across all
samples (e.g. a panelist is scoring all samples 2 points higher than other panelists).
There was also a significant sample effect on both hand and lip for application (p < 0.05
at 95 % confidence interval) whereas for sticky/tacky the results did not prove to be
significant (p > 0.05 at a 95 % confidence interval) for either hand or lip. This suggests
that there is a significant difference between samples when the application attribute is
being investigated. Before this difference may be examined, it is important to consider
the impact of the interaction effect between the panel effect and sample effect as this
could affect the results of the sensory study. ANOVA results (Table 6.3) generated a p-
value ranging from 0.16 – 0.83 (at a 95 % confidence interval) for the interaction effect
between sample and panelist for all attributes. Thus showing there is no significant
interaction which means the panelists rankings for the samples can be considered for
post hoc analysis.

6. Tribology and Sensory Comparison
176
ANOVA analysis has shown a significant difference in application (drag) for both
hand and lip. Post-hoc analysis was then conducted to analyse the difference between
the four samples (bench mark, 5 % wt aqueous phase, 5 % wt aqueous phase and 5 %
wt aqueous phase with a larger droplet size). Each of the emulsions was compared to the
benchmark sample by a trained professional panel of 21 subjects (average age 56.3, 35 –
73 yrs old). It is important to note that the panelists were trained to position the
benchmark between 0 – 10 for both attributes, this position was then agreed and
between the panelists and set as a standard. They then assessed how different each of
the emulsions were and rated them with regards to a difference from the benchmark
sample. Figure 6.19 shows the sensory scores for the effect of different emulsion
structures on both drag and sticky/tacky feel when applied to either the hand or lip.
Results show that introducing water to the structure (5 wt % aqueous phase sample)
lowers the drag score from 5.5 to 4.1 1.1 (on the hand) and 6 to 4.5 1.0 on the (on
the lips). When the water content is increased from 0 – 20 wt % the drag score
decreased from 5.5 to 4.5 1.5 (on the hand) and 6 to 4.7 1.3 (on the lips). Finally
when the emulsion had larger droplets the drag score decreased from 5.5 to 3.5 1.0
(on the hand) and 6.0 to 3.6 1.3 (on the lips).

6. Tribology and Sensory Comparison
177
Figure 6.19 – The sensory score at different attributes (where H – on hand and L – on lip) for
bench formulation (5, 10, 5 wt % of carnauba wax, microcrystalline wax and paraffin wax in castor
oil) and emulsions varying in aqueous phase volume (5 – 20 wt %) and PGPR concentrations (0.2 +
2 wt %). Error bars indicate standard deviation. * indicates a significant result (P < 0.05) and **
indicates a non significant result (P>0.05) at a 95 % confidence interval.
The differences from the benchmark (D.F.B) sample observed for drag (on either
hand or lips) are shown to be significantly different using the least significant difference
(L.S.D) method (shown inTable 6.3) as the difference from the bench (D.F.B) (1.4 for
hand and 1.5 for lips) is greater than the L.S.D (0.5 for hand and 0.6 for lips).Thus
suggesting that increasing the water content reduces the perception of drag for the
consumers (This will be explained in section 6.2.3 by comparing the sensory data to the
tribology data).
It is important to note that there is no significant difference observed for
sticky/tacky feel for either the hand or the lips which is observed in Table 6.3 as the
D.F.B (0 for hand and 0.3 for lip) is lower than the L.S.D (0.5 for hand and 0.6 for lip).
Drag (H) Drag (L) S/T (H) S/T (L)
Sen
so
ry S
co
re
0
2
4
6
8
10
Bench
5 % Aq Phase
20 % Aq Phase
20 % Aq phase withlarge droplets
*
**

6. Tribology and Sensory Comparison
178
Even though there is not a significant difference observed for the sticky/tacky attribute,
it should be noted that samples on the lip behaved less sticky than on the hand. This
finding is extremely important to industry as a consumer will always test a lipstick on
their hand before purchasing and even though a lipstick may behave less sticky on the
lip a consumer may decline to purchase based on the stickiness observed on the hand.
Table 6.3 - The sensory score at different attributes (where H – on hand and L – on lip) for
bench formulation (5, 10, 5 wt % of carnauba wax, microcrystalline wax and paraffin wax in 80 wt
% castor oil) and emulsions varying in aqueous phase volume (5 and 20 wt %) and PGPR
concentrations (0.2 and 2 wt %). Error indicates standard deviation. Results represent least
significant difference (L.S.D) data with differences from the bench (D.F.B)
Attribute Bench 5% Aq D.F.B 20%
Aq D.F.B
20% Aq
with large
droplets
D.F.B
L.S.D @
95%
confidence
interval
Drag (H) 5.5 4.1
1.1 1.4
4.5
1.5 1
3.5
1.0 2 0.5
Drag (L) 6.0 4.5
1.0 1.5
4.7
1.3 1.3
3.6
1.3 2.4 0.6
S/T (H) 7.0 7.0
1.1 0
6.7
1.4 0.3
7.0
1.5 0 0.5
S/T (L) 6.0 5.7
1.1 0.3
5.5
1.0 0.5
5.6
1.7 0.4 0.6
In order to compare the effect of droplet size on both drag and sticky/tacky, L.S.D
analysis was used to check if there was a significant difference between emulsions made
with 20 wt % aqueous phase and 20 wt % aqueous phase (with larger droplets). Results
show (Table 6.4) the differences observed for drag (on either hand or lip) are shown to
be significant as the difference (1.0 for hand or 1.1 for lip) is greater than the L.S.D
value (0.5 and 0.6 respectively). Thus, suggesting that increasing the droplet size from
2.8 to 100 μm results in the panelists perceiving a reduction in drag (This will be
explained in section 6.2.3 by comparing the sensory data to the tribology data).

6. Tribology and Sensory Comparison
179
Table 6.4 - The sensory score at different attributes (where H – on hand and L – on lip) for
comparison between large droplets (>100 μm) and small droplets ( 3 μm). Emulsions were
comprised of an aqueous phase volume (20 wt %), PGPR concentrations (0.2 and 2 wt %) and
continuous phase (78 – 79.8 wt % which contained 5, 10, 5 wt % carnauba wax, paraffin and
microcrystalline wax in 80 wt % castor oil). Error indicates standard deviation. Results represent
least significant difference (L.S.D) data with differences between large and small droplets
Attribute 20%
Aq
20% Aq with
large droplets Difference
L.S.D @ 95%
confidence interval
Drag (H) 4.5
1.5
3.5
1.0 1.0 0.5
Drag (L) 4.7
1.3
3.6
1.3 1.1 0.6
S/T (H) 6.7
1.4
7.0
1.5 0.3 0.5
S/T (L) 5.5
1.0
5.6
1.7 0.1 0.6
In the qualitative analysis (language generation session) (an overview of language
session is shown in Appendix 4), panelists commented that all three emulsion products
performed well regarding moisturisation. Panelists identified that both emulsions with
20 wt % aq phase (regardless of droplet size) were thought to leave the lips feeling
moisturised, supple and conditioned. Panelists also commented that it felt like the
lipstick was melting and moisture was being absorbed leaving a more natural less
coated feel to the lips.
6.2.3 Comparison between Tribology and Sensory
Friction coefficients obtained in section 6.2.1 via pin on disk tribology were
compared to the sensory data (section 6.2.2) (Figure 6.20), in order to determine
whether tribology was a suitable technique to predict consumer perceptions to new
formulations. It was expected that as the friction of the formulation increased, the drag
would also increase. However Figure 6.20 shows the exact opposite trend, where drag
score decreases (6 – 3.6 (on lip) and 5.5 – 3.5 (on hand)) as friction increases from 0.06
– 0.2. It is hypothesised here that the perception of drag can be related to the attribute
used in the food industry to describe smoothness (Chen and Stokes, 2012). Chen and

6. Tribology and Sensory Comparison
180
Stokes (2012) used the Kokini model (1987) to describe that the smoothness is inversely
proportional to the friction (multiplied by the load). Figure 6.21 shows that when the
Kokini model is applied, a linear relationship is observed for both hand and lip (R2 =
0.9) testing, thus indicating that a tribometer can be used to relate frictional coefficient
to the drag score obtained from a sensory panel. From an industrial point of view this is
an important finding as the use of trained sensory panel is both time consuming and
very expensive. A tribometer could be used to link the formulation design to sensory
perception. However more data points would be required before this could be proved
conclusively.
Figure 6.20 – Comparison of average drag score vs final friction final. Results taken from data
presented throughout this chapter.
Friction Coefficient
0.04 0.06 0.08 0.10 0.12 0.14 0.16 0.18 0.20 0.22
Dra
g S
core
3.0
3.5
4.0
4.5
5.0
5.5
6.0
6.5
On Hand
On Lip

6. Tribology and Sensory Comparison
181
Figure 6.21 – Comparison of drag score vs 1/ friction coefficient multiplied by applied load
(0.5N).
1/ X w
5 10 15 20 25 30 35 40
Dra
g S
core
3.0
3.5
4.0
4.5
5.0
5.5
6.0
6.5
On Hand
On Lip
R2 = 0.9
R2 = 0.9

6. Tribology and Sensory Comparison
182
6.3 Concluding Remarks
In this chapter a pin-on-disk setup in a tribometer was used to examine the
lubricating properties of a solid wax based system. These results showed that an applied
load of greater than 1 N resulted in the solid wax disks fracturing thus preventing
analysis. The disk rotational speed was also important in controlling the time taken for
the disk to wear to a thin film.
In general, the friction coefficient slightly increased as the varying wax
concentration increased (microcrystalline wax, paraffin and performalene). It was
suggested here that this was a result of a greater amount of solid crystals being present
in the contact zones. The friction coefficient also increased as aqueous phase volume
and droplet size increased. This was due to a greater amount of water and larger droplets
being present in the contact zone. It was also shown that the wear was directly linked to
elastic modulus of the samples.
Sensory analysis showed that there was a significant difference when analysing drag
scores. This suggests that panelists were able to distinguish a difference in this attribute.
Post hoc analysis showed that panelists perceived emulsion samples, increasing in
aqueous phase volume and water droplets to drag less than a wax blend formulation. On
comparing the sensory panel drag results with tribological data it was shown that the
drag perception followed the Kokani model. Thus showing that panelist related the
drag to how smooth a formulation felt. These results are a promising start to predict
how consumers will asses new formulations. However, further work is required to
establish tribology as a suitable technique to model consumer expectations from
formulations.

7. Release of Glycerol
183
Chapter 7. Release of
Glycerol from Wax Based
Emulsion Systems for
possible use in a Lipstick
Application

7. Release of Glycerol
184
7.1 Introduction
Addition of a water phase to lipstick formulations allows the introduction of
hydrophilic ingredients (glycerol) that could deliver moisture directly to the lips.
Glycerol has been widely used in the pharmaceutical and cosmetic industry, due to its
humectant and protecting properties (Lodén and Wessman, 2001). Glycerol has been
shown to diffuse into the stratum corneum (Batt and Fairhurst, 1986) which increases
skin hydration (Lodén, 1996, Blichmann et al., 1989, Serban et al., 1983) and relieves
clinical signs of dryness (Batt et al., 1988, Dunlap, 1984).
Thus, the aim of this chapter was to develop a system for measuring the release of
glycerol from wax based structures, which can be related to the release of glycerol from
a lipstick system. Initially the release of glycerol was examined in a model formulation
(without wax) and lipstick formulations (with wax), during quiescent conditions at three
different temperatures (20 °C and 32 °C were chosen as they represent storage
temperature and lip temperature respectively; whereas 80 °C was chosen as it is the
point where all wax crystals are molten (shown in Figure 4.11). The phenomenon which
governs release was modelled using COMSOL with MATLAB, and was related to
temperature. Finally, the effect of compression on release was investigated in order to
monitor the effect of disrupting a wax network.

7. Release of Glycerol
185
7.2 Results and Discussion
In this section, the release of a moisturising agent (glycerol) from an emulsion based
lipstick using two different experimental set ups (quiescent and compression (schematic
shown in Figure 3.3)) was investigated.
7.2.1 Release under Quiescent conditions
Release was initially examined in a model system in order to understand the release
behaviour of glycerol prior to encapsulation. Following this, wax was added to the
system to create a shell that encapsulated the water/glycerol mix.
7.2.1.1 Model System
Figure 7.1 shows the release of glycerol from an emulsion structure as a function of
time for 20, 32 and 80 °C. It should be noted that for all temperatures the shape of the
curve has two distinct sections. Initially there is a fast release which slows as the
majority of the glycerol is released.
Experiments conducted at 20 °C had the lowest release rates, releasing
approximately 0.05 % of glycerol per minute. It is important to note that only 40 % of
glycerol could be released before the emulsion phase separated (observed visually) into
its two component phases (aqueous and oil) (process known as phase separation), which
allowed the glycerol to diffuse freely into the surrounding body of water. At higher
temperatures (80 °C), the highest release rate was observed, resulting in approximately
2.1 % of glycerol per minute being released. At this temperature 80 % of the
encapsulated glycerol was released before phase separation occurred. The Stokes
Einstein equation has been used in the literature to explain temperature based release.
(Young et al., 1980);

7. Release of Glycerol
186
Equation 7.1
Where, D is the diffusion coefficient, R is the gas constant, N is vogadro’s
number, T is the absolute temperature of the system, is the viscosity and r is the radius
of the droplet.
From this equation it is clear that as temperature increases so does the diffusion
coefficient assuming the other parameters remain constant (it is important to note the
particle size will increase as phase separation occurs). This temperature dependence on
the diffusion coefficient has been seen by both Türker and Erdoğdu (2006) and Mills
(2011). Türker and Erdoğdu investigated the effective diffusivity of anthocyanin
pigments from black carrot samples at varying temperatures (25 – 50 °C). Results
showed that the effective diffusivity increased from 3.73 – 7.37 m2/s at pH 2 as
temperature increased from 25 - 50 °C. This was explained using Einstein’s equation
(Cacace and Mazza, 2003) for diffusion which states that the diffusion coefficient is
proportional to the temperature and dynamic viscosity-1
(Türker and Erdogˇdu, 2006).
Therefore one would expect the effective diffusivities of glycerol to increase in a
proportional manner if the release was governed solely by temperature.
7. Release of Glycerol
187
Figure 7.1 - Glycerol release over a period of time into 200 ml of water from 30 g of emulsion at
3 different temperatures under quiescent conditions. Release was measured using FT-IR. All
emulsions contained 30 wt % aq phase (50:50 glycerol:water), 68 wt % castor oil and 2 wt %
PGPR.
7.2.1.2 Mathematical Modelling
The effective diffusivities were calculated using a method developed in COMSOL
(a similar model was used by Mills et al. (2011)). A system was set up which assumed
pure Fickian diffusion, which is defined as diffusion that follows a concentration
gradient over time (Bergman et al., 2011). The model was run as a script linked with
MATLAB. The effective diffusivity was altered to reduce the sum of squares between
the calculated and actual values. Figure 7.2 shows a comparison of calculated and
experimental data for 20, 32 and 80 °C. For all temperatures, the initial predicted
glycerol release is faster than the experimentally measured release. This difference can
be attributed to a lag in recording as the system was under quiescent conditions and
instantaneous mixing would not have occurred. After the initial lag there was close
agreement with both the experimental and calculated data for all temperatures until
~1450 minutes (for 20 °C), ~180 minutes (for 32 °C) and ~40 minutes (for 80 °C). After
these points phase separation of the emulsion occurs, which results in the experimental
Time (Mins)
0 100 200 300 400 5001000 2000 3000
Gly
cero
l R
ele
ase (
%)
0
20
40
60
80
100
20 °C
32 °C
80 °C
7. Release of Glycerol
188
data deviating from the model results. This causes the trapped glycerol to be released
into the surrounding body of water. Therefore the effective diffusivities were calculated
before phase separation. The results observed (Figure 7.2) before the phase separation
point are similar to that shown by Mills et al. (2011), who investigated the release of
salt from gel structures. Mills et al. showed that there was close agreement between
model and experimental data when analysing gel structures made from 0.5 % gellan at
25 °C, which showed an 80 % release of salt after ~60 minutes. They concluded that
this release was governed by a simple diffusion mechanism (Mills et al., 2011).

7. Release of Glycerol
189
Figure 7.2 - Comparison of model output and experimental data for glycerol release over time
from 30 g emulsion samples at (a) 20 °C, (b) 32 °C and (c) 80 °C. All emulsions contained 30 wt %
aq phase (50:50 glycerol:water), 68 wt % castor oil and 2 wt % PGPR.
Time (Mins)
0 500 1000 1500 2000 2500 3000 3500
Avera
ge G
lycero
l R
ele
ase (
%)
0
20
40
60
80
100
Experimental
Model
Time (Mins)
0 200 400 600 800
Avera
ge G
lycero
l R
ele
ase (
%)
0
20
40
60
80
100
Experimental
Model
Time (Mins)
0 50 100 150 200 250 300 350
Avera
ge G
lycero
l R
ele
ase (
%)
0
20
40
60
80
100
Experimental
Model

7. Release of Glycerol
190
Table 7.1 shows the effective diffusivities calculated using the COMSOL model at
three different temperatures (20, 32 and 80 °C). Results show that as temperature
increases from 20 to 80 °C the effective diffusivity increases from 0.013 – 1.36 x 10⁻⁸
m2/s respectively. These values are very similar to that obtained by Henin et al. (2008)
who investigated the diffusion of glycerol through Escherichia coli Aquaglyceroporin
GlpF. They utilised a NAMD simulation package to calculate the effective diffusivity
which was compared to experimental data. They found that their simulations generated
similar effective diffusivities (0.21 x 10⁻⁸
) m2/s) when compared to the experimental
data (0.11 x 10⁻⁸
) m2/s) at 25 °C (Hénin et al., 2008). The values obtained by Henin et
al. are similar to those observed in this study 0.3 x 10⁻⁸
) m2/s at 32 °C. Thus indicating
that the water/glycerol droplets are free to move through the continuous phase (without
being trapped) via simple diffusion.
Table 7.1 - Effective Diffusivities of glycerol at different temperatures in quiescent conditions.
Calculated assuming Fickian diffusion using a model from COMSOL linked to MATLAB.
Temperature (°C) Effective diffusivity
(m2/s)(10
-8)
20 0.013
32 0.30
80 1.36
7.2.1.3 Effect of Wax Addition
It the previous section it was shown that glycerol can move through the continuous
phase via simple diffusion. However, when producing an emulsion suitable for use in
lipstick application, wax needs to be considered as part of the formulation. Therefore
the effect of wax addition on glycerol release in quiescent conditions was investigated at

7. Release of Glycerol
191
three different temperatures. Le Reverend et al. (2011b) have shown that in water-in-oil
emulsions, waxes adsorb at the interface which stabilises the emulsion, thus preventing
coalescence of the water droplets. This is achieved by producing shells around the
aqueous droplets which prevents water migration. Therefore it is hypothesised here that
wax addition will inhibit the release of glycerol by producing shells around the aqueous
droplets resulting in encapsulation of the water/glycerol mix. Thus changing the
diffusion mechanism from simple diffusion to barrier controlled diffusion. Barrier
controlled mechanisms have been shown in the food industry (Pothakamury and
Barbosa-Cánovas, 1995) and are described as reservoir systems, whereby an active
ingredient is trapped in a droplet by a barrier which is either: micro porous, macro
porous or non-porous (Langer and Peppas, 1983a). This barrier then either slows down
the rate of release or inhibits release completely depending on the thickness and
permeability of the barrier (Baker and Lonsdale, 1974).
Figure 7.3 shows the effect of adding wax (barrier) (15 wt % of the continuous
phase (5 wt % carnauba wax and 10 wt % microcrystalline wax in castor oil)) on release
at three different temperatures. At 20 °C (Figure 7.3a) and 32 °C (Figure 7.3b), the
addition of wax prevents the release of glycerol. However at 80 °C (Figure 7.3c), there
is a slow release observed up to 400 minutes. At this point the emulsion phase separates
resulting in full release. The initial slow release is caused as the shells around the
droplets begin to melt allowing glycerol to diffuse through the continuous phase. The
effect of temperature on release has also been observed in the food industry by Frasch-
Melik et al. (2010). In that study they investigated the release of salt from sintered
shells. Results showed that as temperature increases from 5 – 50 °C (allowing crystals to
melt) the time taken for release to occur decreases from > 100 days to 20 seconds
respectively.

7. Release of Glycerol
192
(a)
(b)
(c)
Figure 7.3 - Comparison of glycerol release of systems containing wax and no wax over time (12
days) into 200 ml of water from a 30 g emulsion at three different temperatures: (a) 20 °C, (b) 32 °C
and (c) 80 °C under quiescent conditions. Release was measured using FT-IR. Emulsions contained
30 wt % aq phase (50:50 glycerol:water), 68 wt % continuous phase (either castor oil or 5 wt %
carnauba wax and 10 wt % microcrystalline wax in castor oil) and 2 wt % PGPR.
Time (mins)
0 2000 4000 6000 8000 10000 12000 14000 16000
Avera
ge R
ele
als
e (
%)
0
20
40
60
80
100
No Wax
Wax
Time (mins)
0 2000 4000 6000 8000 10000 12000 14000 16000
Avera
ge R
ele
als
e (
%)
0
20
40
60
80
100
No Wax
Wax
Time (mins)
0 200 400 600 800
Ave
rage
Re
lea
lse
(%
)
0
20
40
60
80
100
No Wax
Wax

7. Release of Glycerol
193
Figure 7.3 clearly shows that the addition of 15 % wax (5 wt % carnauba wax and
10 wt % microcrystalline wax in castor oil) to the continuous phase inhibits the release
of glycerol. However it is unclear whether this is the critical concentration required to
induce barrier controlled release. Therefore the amount of wax added to the continuous
phase was reduced in increments from 15 % to 3.75 % in order to determine the effect
of varying the total wax concentration on barrier controlled release. Figure 7.4 shows
that when no wax is present 80 % of glycerol is released within ~45 hours. The addition
of 3.75 – 15 % wax results in a reduction in the amount of glycerol released, with only
~10 % released over a period of 12 days. The release of glycerol (or lack of release)
from these structures seems to be governed by the presence of wax crystals at the
interface. To visualise these shell like structures Cryo-SEM was utilised. Figure 7.5
shows droplets embedded into a network which are coated with wax crystals that sit
either at or in the interface. These images are similar to those previously published in
the literature by Norton et al. (2009) for chocolates.

7. Release of Glycerol
194
Figure 7.4 - Comparison of glycerol release from systems with varying wax content over time
(10 days) into 200 ml of water from a 30 g emulsion at 32 °C. Release was measured using FT-IR.
Figure 7.5 - Cyro-SEM micrograph of water/glycerol droplets trapped in a wax shell
surrounded by a hydrophobic continuous phase. Emulsion contained 30 % aquoues phase (50:50
mix of water and glycerol), 68 % continuous phase (5 % carnauba wax, 10 % microcrystalline wax
and 85 % castor oil) and 2 % polyglycerol polyricinoleate.
Time (hrs)
0 50 100 150 200 250
Gly
ce
orl R
ele
ase
(%
)
0
20
40
60
80
100 No wax
3.75% Wax
7.5% Wax
15% Wax

7. Release of Glycerol
195
7.2.2 Release under compression
In order to relate the release of glycerol from solid emulsions to application on lips,
it is important to consider the effect of structural breakdown on glycerol release.
Samples were tested using the compression set up described in the materials and method
section (Figure 3.3). A texture analyser was then used to provide compressions. The
use of a texture analyser allows the sample to experience different degrees of disruption
by varying the strain. Samples containing glycerol were then tested using 7, 20 and 90
% strain, and release was calculated using FT-IR (Further details are available in section
3.3.4.3). Cyclic compressions (every 3 minutes) were used at 7 and 20 % each strain to
highlight the effect of multiple compressions on structural breakdown, whereas only
one compression occurred at 90 % strain.
Figure 7.6 shows the release of glycerol from emulsions being compressed every 3
minutes. It clearly shows that there is no difference in release when being compressed at
different strains. For all strains, a release of approximately 10 % is observed. This is
independent of the destruction caused to the structure. It is hypothesised here, that the
10 % release is a result of having an emulsion with varying droplet sizes. Whereby large
droplets (coated in a wax shell) can be fractured under compression and small droplets
(coated in wax shells) interact with the deforming continuous phase allowing them to
flow (un-fractured) under compression. To test this theory; the droplet size of emulsions
was initially calculated using restricted NMR (Table 7.2). This showed that when 2 %
PGPR was used, approximately 90 % of the emulsion resulted in small droplets (d3,2
~12 μm) and ~10 % of the emulsion contained large droplets (d3,2 > 100 μm). These
findings agreed with the initial hypothesis and to test this further, the amount of PGPR
was reduced to increase the amount of larger droplets in the emulsion. When 1 wt %
PGPR was utilised in the formulation the larger droplets increased to ~ 34 %. Therefore

7. Release of Glycerol
196
it is expected that when the 1 % PGPR emulsions are compressed the glycerol release
should increase.
Figure 7.6 - Glycerol release over time (into 200ml of water) from 30g emulsions. Emulsions
were compressed at varying strains (7, 20 and 90 %) every 3 minutes over 21 minutes. Emulsions
contained 2 % PGPR. Release was measured using FT-IR.
Table 7.2 - Mean droplet diameter (d3,2, μm) measured by NMR restricted diffusion on day of
formation as a function of PGPR concentration. Standard deviation is of triplicate measurements.
Time (min)
0 5 10 15 20 25
Ave
rage
Re
lea
se
(%
)
0
20
40
60
80
7 % Strain
20 % Strain
90 % Strain
Points of Compression
Amount of Emulsifier
Mean Droplet Size (d3,2)
Standard deviation Droplets(≥ 100 μm)
2 % PGPR 12 0.4 ~ 10 %
1 % PGPR 17 4.5 ~ 34 %
2% PGPR (onlyParaffin)
8.4 0.9 ~ 7 %

7. Release of Glycerol
197
Figure 7.7 shows the effect of compression on a 1 wt % PGPR emulsion. Results
show there is still minimal release when the sample is compressed under elastic
deformation (7 % strain). It is suggested that there is no destruction of the sample
during elastic compression which results in minimal glycerol release. Figure 7.8 shows
seven repeat force/distance curves for a single 1 wt % PGPR emulsion. The structure is
shown to be elastic under small strains where the curves overlap for each compression.
These findings are similar to those shown by Mills (2011), who showed that gelatine
structures exhibited elastic behaviour under low strain (30 %).
When the structure is fractured (20 % and 90 % strain) approximately 35 % of
glycerol is released after 24 minutes. To confirm that this was due to larger droplets
being fractured, the droplet size of emulsions containing 1 % PGPR was calculated
using a restricted NMR diffusion technique (Table 7.2). Results show that when 1 %
PGPR is utilised then approximately 35 % of droplets are greater than 100 μm. Thus,
confirming the hypothesis that release occurs from larger droplets.
Figure 7.7 - Glycerol release over time (into 200ml of water) from 30g emulsions. Emulsions
were compressed at varying strains (7, 20 and 90 %) every 3 minutes over 21 minutes. Emulsions
contained 1 % PGPR. Release was measured using FT-IR.
Time (min)
0 5 10 15 20 25
Avera
ge R
ele
ase (
%)
0
20
40
60
80
7 % Strain
20 % Strain
90 % Strain
Points of Compression

7. Release of Glycerol
198
Figure 7.8 – Force Distance curves for emulsions at 7 % strain, using 1% polyglycerol
polyricinoleate samples. 30g cylindrical segments were compressed at 1 mm/s, to 7 % of the original
height, 7 times with 3 minute intervals.
To further confirm that release is governed by wax forming at the interface
(resulting in a shell), an alternative wax (paraffin) which is known not to migrate to this
surface was used (Le Révérend et al., 2011b). Paraffin wax is known to form large
crystals that are not surface active, but crystallise in the continuous phase (Le Révérend
et al., 2011b). It is important to note that when paraffin wax was used as the wax
component, the average droplet size did not drastically change (8.4 μm) and neither did
the amount of droplets greater than 100 μm (~7 %). Samples containing paraffin wax
were then compressed to 90 % strain and the release was monitored over a period of 12
days. When wax crystals are not at the interface, release increases from 0.5 to 31 % over
12 days (Table 7.3), whereas when wax crystals are at the interface, release remains
constant from day 1 to day 12 (~18.5 %). This is due to the wax crystals acting as a
barrier which inhibits the release of glycerol.
Distance (mm)
0 2 4 6 8
Fo
rce
(N
)
0.0
0.2
0.4
0.6
0.8
1.0
1.2
1.4
Compression 1
Compression 2
Compression 3
Compression 4
Compression 5
Compression 6
Compression 7

7. Release of Glycerol
199
Table 7.3 - Glycerol release over time (into 200 ml of water) from 30 g emulsions. Emulsions
were compressed (90% strain) and stored at 32 C for 12 days. Release was measured using FT-IR.
All emulsions contained 2 % PGPR and a continuous phase of 68 % (either: 5 % carnauba wax and
10 % microcrystalline wax in castor oil or 15 % paraffin in castor oil).
In an attempt to visualise the differences between wax crystals being at either the
interface or Figure 7.9 shows SEM micrographs of emulsions with varying continuous
formulations (either 15 wt % paraffin wax in castor oil (Figure 7.9 a,b and c) or 5 wt %
carnauba wax and 10 wt % microcrystalline wax in castor oil (Figure 7.9d, e and f)) at
varying etching times. When emulsions with paraffin in the continuous phase were
etched, visible craters are observed in the microstructure. This suggests that the droplets
were not trapped in a shell structure and there the liquid evaporated off during etching.
Whereas when the emulsions containing both carnauba wax and microcrystalline wax in
the continuous phase were etched, no craters were physically visible. Instead coated
shell like droplets were observed, thus confirming that emulsions with wax at the
interface prevent glycerol from freely moving through a structure which inhibits release.
Continuous PhaseAverage Released (%)
After 20 min Day 1 Day 12
Wax Phase (no paraffin) 10.1 1.7 % 19.2 5.9 % 18.5 1.3 %
Wax Phase (only paraffin) 0.5 0.3 % 10.3 2.3 % 31 6.9 %
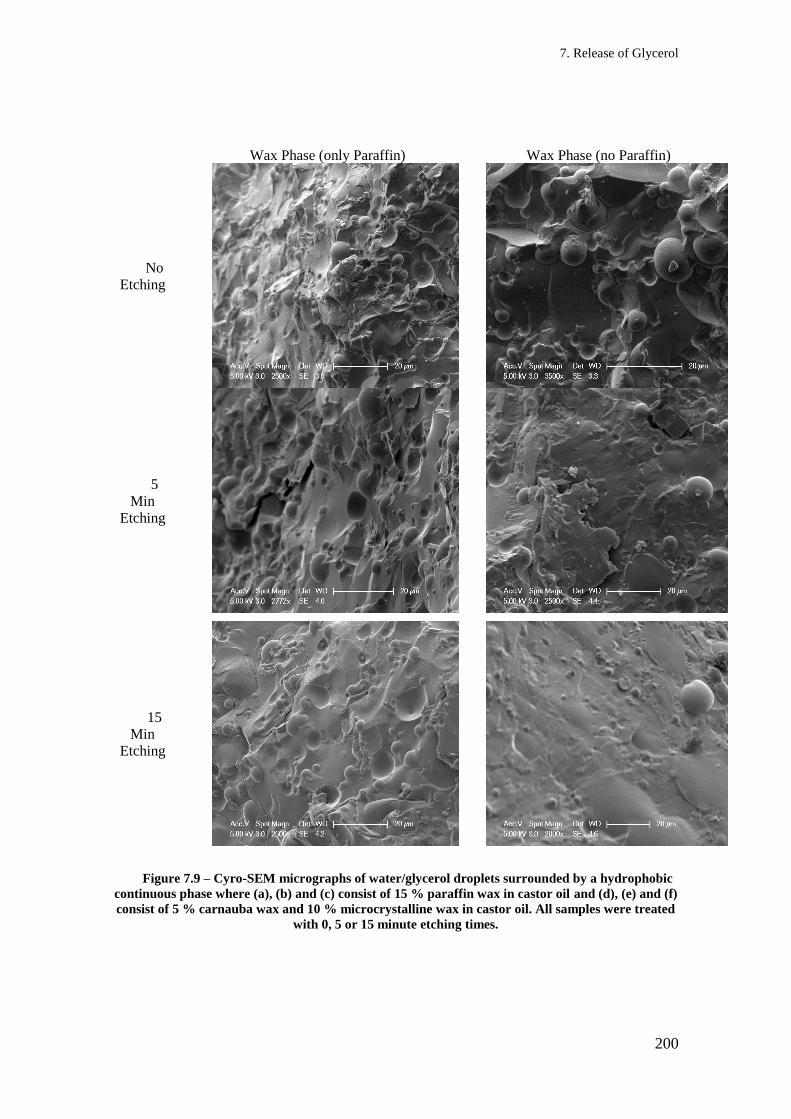
7. Release of Glycerol
200
Wax Phase (only Paraffin) Wax Phase (no Paraffin)
No
Etching
5
Min
Etching
15
Min
Etching
Figure 7.9 – Cyro-SEM micrographs of water/glycerol droplets surrounded by a hydrophobic
continuous phase where (a), (b) and (c) consist of 15 % paraffin wax in castor oil and (d), (e) and (f)
consist of 5 % carnauba wax and 10 % microcrystalline wax in castor oil. All samples were treated
with 0, 5 or 15 minute etching times.

7. Release of Glycerol
201
7.3 Concluding Remarks
It can be concluded from this work that the release curves obtained under quiescent
conditions show that there is very little to impede the diffusion of glycerol in systems
containing no wax. Modelling of quiescent conditions has allowed effective diffusivities
to be calculated and these showed the release rate is controlled by temperature. The
addition of wax changes the release mechanism from simple diffusion to a barrier
controlled mechanism by producing shells that inhibit release.
Compression was then shown to affect the release of glycerol, depending on the size
of the droplets and the disruption caused to the structure. Small shell coated droplets
inhibited release, as the droplets do not fracture under compression. When larger
droplets are produced: release is governed by the amount of strain applied to the
structure. If low strain is used (7 %), there is only elastic deformation which does not
cause release whereas any strain greater than the point of fracture (>20 %) resulted in
glycerol release.
It was shown that the release of glycerol is controlled by a barrier controlled
diffusion when a wax shell is present. This allows these structures to be suitable for use
in lipstick application, as release will not occur in storage but in application. Future
work should consider controlling the release rate of glycerol under compression.

8. Conclusions and Future Work
202
Chapter 8. Conclusions
and Future
Recommendation

8. Conclusions and Future Work
203
This thesis examined the production of wax based emulsion systems suitable for
application in lipsticks. Specifically, this work consisted of
Designing emulsion structures using either a batch (in particular the effect of
emulsifiers and aqueous phase volumes) or continuous process (in particular
processing parameters). This included investigating the melting behaviour of
wax based emulsions. Emulsion structure was assessed using a variety of
techniques.
Manipulating the material properties of wax based emulsion systems. This
included investigating different waxes and wax blends and the effect of
water inclusion and water content. The material properties were then
manipulated using a continuous process which allowed the control of
crystallisation in the process. The material properties were assessed using
either uni-axial compression and/or oscillatory rheology.
Using a pin-on-disk tribometer to monitor the lubricating properties of solid
wax based emulsion systems. This included investigating the role of
different waxes, water content, dispersed phased viscosities and droplet size
on friction coefficient and wear. Following this, a trained sensory panel was
used to compare to identify links between tribological data with sensory
attributes.
Monitoring release of glycerol from wax based structure. This included
investigating a technique to monitor the release of glycerol. Followed by
monitoring the release of glycerol from wax based structure, in both
quiescent conditions and during structural breakdown.

8. Conclusions and Future Work
204
8.1 Designing Emulsion Structures
Water-in-oil (W/O) emulsions were prepared using either a batch process or a
continuous process. Emulsions were initially assessed in terms of droplet size, after
which the melting behaviour of wax based emulsions was investigated.
Batch Process
Emulsions were stabilised using a variety of emulsifiers (monoolein, monostearate,
sorbitan olivate and polyglycerol polyricinoleate (PGPR) Results showed that droplet
size was not affected by the saturated nature of the monoglycerides or by increasing the
head group size (sorbitan olivate) (d3,2 ~ 18 – 25 μm), PGPR stabilised emulsions,
resulted in the smallest droplets (~ 2 – 4 μm) due to its ability to form a thick elastic
interface (Le Révérend et al., 2011b).
Continuous Process
A lab scale scraped surface heat exchanger (SSHE) and pin stirrer (PS) were shown
to be able to (1) produce emulsion based lipsticks and (2) control emulsion properties
(e.g droplet size). Results showed that when the SSHE was utilised with higher impeller
rotational velocities (IV) (1500 rpm) there were greater disruptive forces which
produced smaller droplets (~ 3 μm). The addition of PS to the process only affected the
droplet size when the SSHE had a low IV (500 rpm).
Melting Behaviour
The melting behaviour of different waxes, wax blends was assessed using DSC.
Results showed that a wax blend (5 wt % carnauba wax (CW) and 10 wt %
microcrystalline wax (MW) in castor oil) provided a melting range (30 – 80 °C) similar

8. Conclusions and Future Work
205
to a commercially available lipstick (30 – 90 °C). It was also concluded that the melting
profile is not affected by incorporation of water or by increasing aqueous phase volume.
8.2 Manipulating Material Properties
Material properties of wax based emulsion systems were assessed using either uni
axial compression or oscillatory rheology. Initially individual waxes and wax blends
were investigated. This was followed by the assessment of incorporating water,
increasing aqueous phase volume and controlling crystallisation (in the process) on the
material properties.
Waxes/Wax blends
Results showed that Young’s modulus, bulk modulus and point of fracture increase
with increasing percentage of CW (which follows a power law dependency of 3), but
decreases with an increasing percentage of MW. It was concluded that CW is part of the
overall wax crystal network (comprised of saturated components), whereas the MW
forms irregular crystals that disrupt the overall wax crystal network.
Incorporating an aqueous phase
Increasing aqueous phase volume (droplets with a d3,2 of 2 – 4 μm) resulted in a
decrease of Young’s modulus, elastic modulus and viscous modulus. The slope of the
decrease (for elastic and viscous moduli) is dependent on the addition of paraffin or
performalene (which both strengthen the network). It was concluded that emulsions
containing 30 wt % aqueous phase (with either paraffin or performalene) had very
similar material properties to a non emulsified control system.

8. Conclusions and Future Work
206
Controlling Crystallisation
Controlling crystallisation in the process was achieved using a scraped surface heat
exchanger (SSHE) and pin stirrer. In particular, crystal size was adjusted by altering the
temperature gradient between the inner walls of the chamber and the emulsions. This
allowed the ratio of small crystals formed in the SSHE chamber and large crystals
formed in post production to be altered by varying the flow rate through the unit.
Results showed that emulsions formed where crystallisation occurred in both the
chamber and post production produced water droplets coated in a wax shell, which
allowed the wax coated droplets to interact with the larger wax crystals in the
continuous phase. This resulted in an increase in the strength of the emulsion.

8. Conclusions and Future Work
207
8.3 Tribology of Wax Based Systems
Lubricating properties of solid wax based systems were assessed using a pin on disk
setup in a tribometer. Initially individual waxes and wax blends were investigated. This
was followed by the assessment of incorporating water, increasing aqueous phase
volume and varying dispersed phase droplet size on both the friction coefficient and the
wear. Finally these results were compared to degree of difference scores obtained from
a trained sensory panel.
Waxes/Wax Blends
Results showed that the friction coefficient slightly increased as the wax
concentration increased. This was due to a greater amount of solid wax crystals within
the contact zones. It was also shown that the wear was directly linked to elastic modulus
of the wax samples. This is also true for all emulsion samples.
Increasing Aqueous Phase Volume/ varying droplet size
Results showed that as both aqueous phase volumes increased and droplet size
increased so did the friction coefficient. This was shown to be due to either a greater
volume of water or larger droplets being present in the contact zone.
Sensory Analysis
Results showed that trained panelists were able to distinguish a difference in drag
when investigating increasing aqueous phase volume and droplet size. It was shown that
the drag scores followed the Kokani model, therefore indicating that tribology could be
used to predict how smooth a formulation may feel.

8. Conclusions and Future Work
208
8.4 Release Behaviour of Glycerol
Release of glycerol under quiescent and uni axial compression was assessed using
FT-IR. Initially the release of glycerol was assessed in a model system (no wax) in
order to understand glycerol’s release behaviour. The glycerol was then encapsulated in
a wax shell and the release was assessed in quiescent conditions. Following this the
encapsulated glycerol was compressed to assess the release under structural breakdown.
Quiescent Conditions
Results showed that in a model system, release was a function of temperature, where
the effective diffusivities increased as the temperature increased. This showed that in a
model system, diffusion was controlled by simple Fickian diffusion.
Results also show that the release mechanism changes from simple diffusion to
barrier controlled diffusion upon the addition of wax to the formulation. This is a result
of the wax producing a shell around the glycerol which inhibits release.
Uni Axial Compression
Results show that release under compression is dependent on the size of the droplets
and the disruption caused to the structure. When small encapsulated droplets are
produced, glycerol release is inhibited as the droplets do not fracture. However, when
large encapsulated droplets are produced, release is controlled by the amount of strain
applied to the system. Results showed that a strain of greater than 20% is required to
cause glycerol release.

8. Conclusions and Future Work
209
8.5 Future Work
This section is designed to highlight possible areas of future research based on the
conclusions made throughout this thesis.
Incorporation of pigments into the continuous phase of the formulation.
Throughout this thesis, a model system has been utilised to investigate the use of an
emulsion in lipstick application. In order for this to be considered as a product, one must
consider the impact of pigments on the formulation. Pigments come in various forms
(Eoisin Y and Eoisin B), traditionally in Boots formulations, they are hydrophobic in
nature. In conventional formulations (i.e. completely hydrophobic), pigments are added
to the castor to be dispersed. Therefore one should investigate the effect of adding
pigments to the continuous phase of the emulsions and thus the effect this has on both
the droplet size and material properties of the final emulsion. It is suggested here that
the addition of a solid pigment will increase the G’ of the formulation, this is based on
the results shown in Chapter 5 which showed that the addition of solid material
increased the G’.
The way in which the pigment is added to the emulsion can be investigated. The
pigment could be dispersed through the continuous phase using the SSHE and PS
process or alternatively it could be added to the continuous phase using a Silverson high
shear mixer.
Long term work in this area could include investigating the effect of multi pigment
systems whereby both a hydrophobic pigment and a hydrophilic pigment could be
added in order to produce a lipstick with multiple colors.

8. Conclusions and Future Work
210
Investigate different crystal sizes
Chapter 5 shows the effect of different crystal sizes on material properties. It order
further this work the crystals could be visualised. This can be achieved by using a hot
stage microscope thus allowing the visualisation of crystals to occur as they grow at
varying cooling rates.
The hot stage microscope has been utilised in the pharmaceutical industry. Araya-
Sibaja et al. (2014) used this technology to visualise the polymorphic changes in
progesterone from form 1 to form 2.
Extensive comparison between tribological and sensory data.
Chapter 6 showed a link between drag scores obtained from a sensory panel and
1/friction coefficient obtained from tribological data. This link highlighted that the drag
corresponded to how smooth a formulation behaved based on the Kokani model. To
validate these findings further, more data points are required with varying drag scores.
This can be achieved by producing emulsions with varying aqueous phase volumes (5 –
50 %, at iterations of 5 %). These can then be the analysed by a pin-on-disk tribometer
and assessed by a trained sensory panel. It should be noted that initially this process will
be extremely expensive as a trained sensory panel is an expensive investment. However
once complete, formulations could be assessed using a tribometer to predict how
smooth said formulation would be perceived.

8. Conclusions and Future Work
211
Controlling release of glycerol
The aqueous phase of the emulsion could be turned into a quiescent gel in order to
slow the release of glycerol upon destruction of the network. This would require a
comprehensive investigation into varying hydrocolloids (i.e. xanthan gum, guar gum,
carrageenan etc) to produce a quiescent gel.
Garrec and Norton (2012) produced gels using a SSHE and PS with a selection of
hydrocolloids. These included guar gum, locust bean gum, λ-carrageenan and
scleroglucan. Emulsion based lipsticks have been produced using a SSHE and PS
throughout this thesis, therefore quiescent gels could be produced in the same process.
Following production of a gelled emulsion lipstick, release would have to be
investigated under compression (as results in this thesis have shown no release occurs
from a wax based emulsion unless the network is destroyed). The release rates can then
be compared to deliver varying levels of moisture to the lips.

Appendices
212
Appendices

Appendices
213
Appendix 1
Droplet size vs PGRP concentration over time with varying aqueous phase
volumes
Table 0.1 Mean droplet diameter (d3,2, μm) measured by NMR restricted diffusion from day 0
to day 180 for emulsions produced with varying PGPR concentrations (0.5, 1, 2 and 5wt%). All
emulsions contain 10 % (Top), 20 % (Middle) and 40 % (Bottom) water.
Day 0 Day 1 Day 7 Day 10 D ay 180
PGPR Concentration (%)
d3,2 (μm)
SD(σ)
d3,2 (μm)
SD(σ)
d3,2 (μm)
SD(σ)
d3,2 (μm)
SD(σ)
d3,2 (μm)
SD(σ)
0.5 4.6 1.1 4.2 0.5 4.1 0.5 4.2 0.5 4.1 0.4
1 4.4 0.8 4.2 0.6 4.3 0.8 4.4 0.8 4.3 0.7
2 2.4 0.2 2.1 0.5 2.1 0.4 2.5 0.3 2.1 0.3
5 2.5 0.1 2.5 0.1 2.3 0.3 2.5 0.1 2.0 0.1
Day 0 Day 1 Day 7 Day 10 D ay 180
PGPR Concentration (%)
d3,2 (μm)
SD(σ)
d3,2 (μm)
SD(σ)
d3,2 (μm)
SD(σ)
d3,2 (μm)
SD(σ)
d3,2 (μm)
SD(σ)
0.5 5.8 1.8 5.8 1.8 5.8 1.8 5.8 2.0 5.9 1.9
1 3.4 0.2 3.4 0.2 3.4 0.2 3.3 0.2 3.3 0.2
2 2.8 0.1 2.5 0.4 2.7 0.1 2.6 0.1 2.8 0.1
5 2.3 0.1 2.3 0.5 2.0 0.1 2.0 0.2 2.0 0.2
Day 0 Day 1 Day 7 Day 10 D ay 180
PGPR Concentration (%)
d3,2 (μm)
SD(σ)
d3,2 (μm)
SD(σ)
d3,2 (μm)
SD(σ)
d3,2 (μm)
SD(σ)
d3,2 (μm)
SD(σ)
0.5 n/a n/a n/a n/a n/a n/a n/a n/a n/a n/a
1 3.4 0.1 3.4 0.1 3.5 0.1 3.4 0.1 3.4 0.1
2 2.7 0.4 2.6 0.4 2.7 0.4 2.7 0.5 2.6 0.4
5 2.8 0.1 2.7 0.1 2.8 0.1 2.8 0.1 2.9 0.1

Appendices
214
Appendix 2
Bulk modulus and Point of fracture of an emulsion which passes through both
SSHE and PS
Figure 0.1 - Bulk modulus (left) and point of fracture (right) as a function of exit temperature
for W/O emulsions passed both the SSHE (IV = 1500 rpm) and PS, at various shaft speeds. Flow
rate was fixed at 60 mL/min. All samples were cooled quiescently in a freezer until solid then tested
with a compression rate of 1 mm/s at 32°C.
Exit Temperature (°C)
50 55 60 65 70 75 80
Bulk
Modulu
s (
M P
a)
0.00
0.05
0.10
0.15
0.20
0.25
SSHE Only
SSHE and PS with IV of 1500 rpm
SSHE and PS with IV of 1000 rpm
SSHE and PS with IV of 500 rpm
Exit Temperature (°C)
50 55 60 65 70 75 80
Poin
t of
Fra
ctu
re (
M P
a)
0.000
0.002
0.004
0.006
0.008
0.010
0.012

Appendices
215
Appendix 3
Effect of MW concentration on the time taken to wear
Figure 0.2 Wear vs time for a varying microcrystalline wax concentrations in castor oil. All
experiments were conducted in a pin-on disk set up with a load of 0.5 N and a disk speed of
10 mms-1
.
Time (s)
0 200 400 600 800 1000 1200 1400 1600 1800
We
ar
(m
)
-2500
-2000
-1500
-1000
-500
0
500
5%
10%
15%
20%

Appendices
216
Appendix 4
Overview of Language Session
Table 0.2 – Outline of comments made during in the language generation session
Bench Mark – Standard Base Lipstick
5% Aqueous phase
Feels thicker than a normal lipstick
Thick to apply
Drags/pulls on application
Feels unnatural, heavy feel, sits on the
lips
Waxy coated feel on hands, less so on
lips, but leaves a coated film on lips
which feels like a protective barrier
Product moves on the lips and question
whether product would last (58%),
others felt coating would make it last
(42%)
Tacky, although not really sticky.
Less tacky on the lips vs hand
Lips feel moisturised and more
moisturised than side with no product
Not greasy, but feels more like a lip
balm rather than lipstick
Lips feel smooth
Lips feel supple and conditioned
Shiny on hand and lips
Most similar to BM, but feels lighter
Glides more than the BM, but less than
Ref 233
Slightly tackier than BM (58%) / less
tacky (42%)
Smoothes lips, but feels more like a lip
balm than a lipstick
Leaves protective film on lips, less
than BM but more than Ref 233.
Perception it offers more protection
than Ref 233 would.
Film is more oily/Vaseline like, rather
than sticky like film felt with BM
Greasy
Feel more product than with Ref 233,
but not as drying as Ref 233 or BM
More moisturising than BM and
product moves on lips more than BM
Slip, but lips feel nourished/hydrated

Appendices
217
20% Aqueous phase
20% Aqueous phase (larger water
droplet size)
Looks and feels more solid than BM
Glides smoothly, much more than BM
Feels less heavy than BM when on the
lips, although still aware it is on
More natural feel, lips feel less coated,
but less film suggests product offering
less protection
Feels like a lipstick
Thinner, lighter than BM, perception
you might lick it off
Less sticky on hand and lips vs BM.
BM sticky like a lipgloss
Product feels like it is melting, slightly
more oily than BM – like licking butter
(58%)
Product breaks down quicker than BM,
feels like it has absorbed
Lips feel moisturised, supple and
conditioned, similar to BM
Smoothes out ridges
Lips feel like stroking velvet
Similar tacky feel to BM initially, but
tackier after time (5-10 mins) (58%) /
slightly tacky/sticky (42%)
Perception you would need to reapply
more often than others. Product
melts/absorbs and feels dry giving the
impression you need to reapply to add
moisture to the lips
Seen as a perfect base coat, under your
normal lipstick, to condition lips
Soft bullet
Looks denser than BM
Cold and wet on lips when applied
(58%)
Lighter, thinner feel to BM
Feels more like a lipstick than a lip
balm (58%) / feels like a lip balm
(42%)
Less cushioned feel than BM and less
greasy, product feels more like a
lipstick
Glides really well
Gritty, powdery feel, particularly if
you lick your lips. Feels as though
water evaporates and leaves powder
More mobile for longer than other
products. Moves more on the lips, but
not in a bad way
Slips, melts the most and feels oily,
watery. For some this felt slippery
Fat droplets deposited on hand when
applied
Softens, smoothes lips
More moisturising than BM, not as
coated
Perceived to offer same protection as
BM, but not as heavy/sticky. Same
protection, but lighter feel
Lips feel conditioned
Perceived to be long lasting and
wouldn’t need to be reapplied as often

Appendices
218
without giving colour as the BM
Feels tackier than the BM on the hand
but not on the lips, least tacky on the
lips
Shinier than BM

References
219
References ADAMS, N. & LODGE, A. S. 1964. Rheological Properties of Concentrated Polymer Solutions
II. A Cone-And-Plate and Parallel-Plate Pressure Distribution Apparatus for
Determining Normal Stress Differences in Steady Shear Flow. Philosophical
Transactions of the Royal Society of London. Series A, Mathematical and Physical
Sciences, 256, 149-184.
ALLISON, D. B., PAULTRE, F., MAGGIO, C., MEZZITIS, N. & PI-SUNYER, F. X. 1995.
The Use of Areas Under Curves in Diabetes Research. Diabetes Care, 18, 245-250.
ARAYA-SIBAJA, A. M., PAULINO, A. S., RAUBER, G. S., CAMPOS, C. E. M.,
CARDOSO, S. G., MONTI, G. A., HEREDIA, V., BIANCO, I., BELTRANO, D. &
CUFFINI, S. L. 2014. Dissolution properties, solid-state transformation and
polymorphic crystallization: progesterone case study. Pharmaceutical Development and
Technology, 19, 779-788.
BAKER, R. W. 1987. Controlled release of biologically active agents, John Wiley & Sons.
BAKER, R. W. & LONSDALE, H. K. 1974. Controlled Release: Mechanisms and Rates. In:
TANQUARY, A. C. & LACEY, R. E. (eds.) Controlled Release of Biologically Active
Agents. Springer US.
BARWELL, F. 1974. The tribology of wheel on rail. Tribology, 7, 146-150.
BATT, M. D., DAVIS, W. B., FAIRHURST, E., GERRARD, W. A. & RIDGE, B. D. 1988.
CHANGES IN THE PHYSICAL-PROPERTIES OF THE STRATUM-CORNEUM
FOLLOWING TREATMENT WITH GLYCEROL. Journal of the Society of Cosmetic
Chemists, 39, 367-381.
BATT, M. D. & FAIRHURST, E. 1986. Hydration of the stratum corneum. International
Journal of Cosmetic Science, 8, 253-264.
BERGMAN, T. L., LAVINE, A. S., INCROPERA, F. & DEWITT, D. P. 2011. Fundamentals
of heat and mass transfer, John Wiley & Sons.
BERI, A., NORTON, J. E. & NORTON, I. T. 2013a. Effect of emulsifier type and
concentration, aqueous phase volume and wax ratio on physical, material and
mechanical properties of water in oil lipsticks. International Journal of Cosmetic
Science, n/a-n/a.
BERI, A., PICHOT, R. & NORTON, I. T. 2013b. Physical and material properties of an
emulsion-based lipstick produced via a continuous process. International Journal of
Cosmetic Science, n/a-n/a.
BETTINA VOUTOU & STEFANAKI, E.-C. (eds.) 2008. Electon Microscopy: The Basics.
BEYDOUN, D., GUANG, D., CHHABRA, R. P. & RAPER, J. A. 1998. Particle settling in oil-
in-water emulsions. Powder Technology, 97, 72-76.
BHUSHAN, B. & HSU, S. M. (eds.) 2001. Section IV: Triobology of industrial components and
systems CRC.
BHUSHAN, B. & KULKARNI, A. V. 1996. Effect of normal load on microscale friction
measurements. Thin Solid Films, 278, 49-56.
BLAU, P. 1991. Scale effects in steady-state friction. Tribology transactions, 34, 335-342.
BLICHMANN, C. W., SERUP, J. & WINTHER, A. 1989. EFFECTS OF SINGLE
APPLICATION OF A MOISTURIZER - EVAPORATION OF EMULSION WATER,
SKIN SURFACE-TEMPERATURE, ELECTRICAL CONDUCTANCE,
ELECTRICAL CAPACITANCE, AND SKIN SURFACE (EMULSION) LIPIDS. Acta
Dermato-Venereologica, 69, 327-330.
BOHLIN-INSTRUMENTS 1994. A Basic Introduction to Rheology Bohlin Instruments Ltd

References
220
BOLAND, A. B., DELAHUNTY, C. M. & VAN RUTH, S. M. 2006. Influence of the texture of
gelatin gels and pectin gels on strawberry flavour release and perception. Food
Chemistry, 96, 452-460.
BRAISCH, B., KÖHLER, K., SCHUCHMANN, H. P. & WOLF, B. 2009. Preparation and
Flow Behaviour of Oil-In-Water Emulsions Stabilised by Hydrophilic Silica Particles.
Chemical Engineering & Technology, 32, 1107-1112.
BROWN, W. & BALL, R. 1985. Computer simulation of chemically limited aggregation.
Journal of Physics A: Mathematical and General, 18, L517.
BRUKER 2001. mq Series Oil / Water Droplet Size Applications. Bruker Optik GmbH.
CACACE, J. E. & MAZZA, G. 2003. Mass transfer process during extraction of phenolic
compounds from milled berries. Journal of Food Engineering, 59, 379-389.
CAMBIELLA, A., BENITO, J. M., PAZOS, C., COCA, J., RATOI, M. & SPIKES, H. A. 2006.
The effect of emulsifier concentration on the lubricating properties of oil-in-water
emulsions. Tribology Letters, 22, 53-65.
CAMPBELL, S. D., GOFF, H. D. & ROUSSEAU, D. 2002. Comparison of crystallization
properties of a palm stearin/canola oil blend and lard in bulk and emulsified form. Food
Research International, 35, 935-944.
CAMPOS, R., NARINE, S. S. & MARANGONI, A. G. 2002. Effect of cooling rate on the
structure and mechanical properties of milk fat and lard. Food Research International,
35, 971-981.
CHANAMAI, R. & MCCLEMENTS, D. J. 2002. Comparison of gum arabic, modified starch,
and whey protein isolate as emulsifiers: Influence of pH, CaCl(2) and temperature.
Journal of Food Science, 67, 120-125.
CHEN, J. & STOKES, J. R. 2012. Rheology and tribology: Two distinctive regimes of food
texture sensation. Trends in Food Science & Technology, 25, 4-12.
CHOI, J. H., LEE, H. Y., KIM, J.-C. & KIM, Y. C. 2007. Monoolein Cubic Phases Containing
Hydrophobically Modified
Poly(N-isopropylacrylamide) J. Ind. Eng. Chem, 13, 380-386.
CHOJNICKA-PASZUN, A., DE JONGH, H. H. J. & DE KRUIF, C. G. 2012. Sensory
perception and lubrication properties of milk: Influence of fat content. International
Dairy Journal, 26, 15-22.
COUPLAND, J. N. & MCCLEMENTS, D. J. 1996. Lipid Oxidation in food emulsions Trends
in Food Science and Technology 7, 83-91.
DALEY, P. D. W. 1968. Modern lipstick base manufacture. J. Soc. Cosmetic Chemists, 19, 521-
530.
DARVELL, B. W. 2002. Material Science for Dentistry, Woodhead Publishing.
DE GENNES, P.-G. 1979. Scaling concepts in polymer physics, Cornell university press.
DE WIJK, R. A. & PRINZ, J. F. 2005. The role of friction in perceived oral texture. Food
Quality and Preference, 16, 121-129.
DECKER, G. E., HUNTER, S., TURNER, C. & WATTS-MCMILLAN, K. 1997. Moisturizing
lipstick compositions. United States of America patent application.
DESTEVOU, P. O., MONTENAT, C., LADURE, F. & DAUTREY, L. P. 1998. Tectonic-
sedimentary evolution of the eastern Prebetic domain (Spain) during the Miocene.
Comptes rendus des séances de l'Academie des sciences. Série II, Mécanique, physique,
chimie, sciences de l'univers, sciences de la terre, 87, 111-123.
DICKINSON, E. 2010. Food emulsions and foams: Stabilization by particles. Current Opinion
in Colloid & Interface Science, 15, 40-49.
DICKINSON, E., RITZOULIS, C., YAMAMOTO, Y. & LOGAN, H. 1999. Ostwald ripening
of protein-stabilized emulsions: effect of transglutaminase crosslinking. Colloids and
Surfaces B-Biointerfaces, 12, 139-146.
DICKINSON, E. & STAINSBY, G. 1982. Colloids in Foods.
DRESSELHUIS, D., KLOK, H. J., STUART, M. C., VRIES, R., AKEN, G. & HOOG, E. A.
2007. Tribology of o/w Emulsions Under Mouth-like Conditions: Determinants of
Friction. Food Biophysics, 2, 158-171.

References
221
DRESSELHUIS, D. M., DE HOOG, E. H. A., COHEN STUART, M. A., VINGERHOEDS, M.
H. & VAN AKEN, G. A. 2008. The occurrence of in-mouth coalescence of emulsion
droplets in relation to perception of fat. Food hydrocolloids., 22, 1170-1183.
DUNLAP, F. E. 1984. CLINICAL-EVALUATION OF A HIGHLY EFFECTIVE HAND AND
BODY LOTION. Current Therapeutic Research-Clinical and Experimental, 35, 72-77.
DUNPHY, P. J., MEYERS, A. J. & RIGG, R. T. 1992 Cosmetic Water-in-oil emulsion lipstick
comprising a phospholipid and glycerol fatty acid esters emulsifiying systems. United
States of America patent application.
DWECK, A. C. & BURNHAM, C. A. M. 1980. Moulding techniques in lipstick manufacture: a
comparative evaluation. International Journal of Cosmetic Science, 2, 143-173.
EDWARDS, S. & OAKESHOTT, R. 1989. The transmission of stress in an aggregate. Physica
D: Nonlinear Phenomena, 38, 88-92.
FAVA, R. A. 1968. DIFFERENTIAL SCANNING CALORIMETRY OF EPOXY RESINS.
Polymer, 9, 137-&.
FOLEY, J. & BRADY, J. P. 1984. Temperature-induced effects on crystallization behaviour,
solid fat content and the firmness values of milk fat. Journal of Dairy Research, 51,
579-589.
FRASCH-MELNIK, S., NORTON, I. T. & SPYROPOULOS, F. 2010. Fat-crystal stabilised
w/o emulsions for controlled salt release. Journal of Food Engineering, 98, 437-442.
GARREC, D. A. & NORTON, I. T. 2013. Kappa carrageenan fluid gel material properties. Part
2: Tribology. Food Hydrocolloids.
GE, H. Y., ZHAO, C. L., PORZIO, S., ZHUO, L., DAVIS, H. T. & SCRIVEN, L. E. 2006.
Fracture behavior of colloidal polymer particles in fast-frozen suspensions viewed by
cryo-SEM. Macromolecules, 39, 5531-5539.
GHOSH, S. & ROUSSEAU, D. 2011. Fat crystals and water-in-oil emulsion stability. Current
Opinion in Colloid & Interface Science, 16, 421-431.
GODFREY, D. 1995. Friction oscillations with a pin-on-disc tribometer. Tribology
International, 28, 119-126.
GOUDAPPEL, G. J. W., VAN DUYNHOVEN, J. P. M. & MOOREN, M. M. W. 2001.
Measurement of Oil Droplet Size Distributions in Food Oil/Water Emulsions by Time
Domain Pulsed Field Gradient NMR. Journal of Colloid and Interface Science, 239,
535-542.
GUNES, D. Z., CLAIN, X., BRETON, O., MAYOR, G. & BURBIDGE, A. S. 2010.
Avalanches of coalescence events and local extensional flows – Stabilisation or
destabilisation due to surfactant. Journal of Colloid and Interface Science, 343, 79-86.
HAIGHTON, A. J. 1976. Blending, chilling, and tempering of margarines and shortenings.
Journal of the American Oil Chemists’ Society, 53, 397-399.
HARRIS, J. & BUTTERWORTH, D. K. 2013. Skin conditioning and lubricating creme, and
method of making and using same cross-reference to related applications. United States
of America patent application PCT/US2013/025391.
HARRY, R. G. T. 1973. Harry's Cosmetiology, Hill.
HEIDENREICH, R. D. 1964. Fundamentals of Transmission Electon Microscopy
HÉNIN, J., TAJKHORSHID, E., SCHULTEN, K. & CHIPOT, C. 2008. Diffusion of Glycerol
through Escherichia coli Aquaglyceroporin GlpF. Biophysical Journal, 94, 832-839.
HIGSON, S. & AMUS 2004. Analytical Chemistry. Oxford University Press.
HIMMELSTEN, K. J. 1991. Controlled release: A quantitative treatment. Edited by L. T. Fan
and S. K. Singh. Springer-Verlag: New York. 1989. × + 233 pp. 25 × 17 cm. ISBN 3-
540-50823-6. Price not given. Journal of Pharmaceutical Sciences, 80, 304-304.
HINDMARSH, J. P., SU, J. H., FLANAGAN, J. & SINGH, H. 2005. PFG-NMR analysis of
intercompartment exchange and inner droplet size distribution of W/O/W emulsions.
Langmuir, 21, 9076-9084.
HODGE, S. M. & ROUSSEAU, D. 2003. Flocculation and coalescence in water-in-oil
emulsions stabilized by paraffin wax crystals. Food Research International, 36, 695-
702.

References
222
IVANOV, I. B., DANOV, K. D. & KRALCHEVSKY, P. A. 1999. Flocculation and
coalescence of micron-size emulsion droplets. Colloids and Surfaces A:
Physicochemical and Engineering Aspects, 152, 161-182.
JENNING, V. & GOHLA, S. 2000. Comparison of wax and glyceride solid lipid nanoparticles
(SLN®). International journal of pharmaceutics, 196, 219-222.
JENSEN, L. H. & MABIS, A. J. 1966. Refinement of the structure of [beta]-tricaprin. Acta
Crystallographica, 21, 770-781.
JOHNSON, K. L. & KAUZLARICH, J. J. 2004. Transfer of material between rolling and
sliding surfaces. International Journal of Mechanical Sciences, 46, 343-357.
JULLIEN, R. & BOTET, R. 1987. Aggregation and fractal aggregates, World scientific
Singapore.
JUTEAU, A., CAYOT, N., CHABANET, C., DOUBLIER, J. L. & GUICHARD, E. 2004.
Flavour release from polysaccharide gels: different approaches for the determination of
kinetic parameters. Trends in Food Science & Technology, 15, 394-402.
KABALNOV, A. 1998. Thermodynamic and theoretical aspects of emulsions and their stability.
Current Opinion in Colloid & Interface Science, 3, 270-275.
KIM, H. S. & BUSH, M. B. 1999. The effects of grain size and porosity on the elastic modulus
of nanocrystalline materials. Nanostructured Materials, 11, 361-367.
KLOEK, W., WALSTRA, P. & VLIET, T. 2000. Crystallization kinetics of fully hydrogenated
palm oil in sunflower oil mixtures. Journal of the American Oil Chemists' Society, 77,
389-398.
KOKINI, J. L. 1987. The physical basis of liquid food texture and texture-taste interactions.
Journal of Food Engineering, 6, 51-81.
KOLIANDRIS, A., LEE, A., FERRY, A.-L., HILL, S. & MITCHELL, J. 2008. Relationship
between structure of hydrocolloid gels and solutions and flavour release. Food
Hydrocolloids, 22, 623-630.
KULISIEWICZ, L. & DELGADO, A. 2010. HIGH-PRESSURE RHEOLOGICAL
MEASUREMENT METHODS: A REVIEW. Applied Rheology, 20.
KULKARNI, C. V., WACHTER, W., IGLESIAS-SALTO, G., ENGELSKIRCHEN, S. &
AHUALLI, S. 2011. Monoolein: a magic lipid? Physical Chemistry Chemical Physics,
13, 3004-3021.
KUSAKARI, K., YOSHIDA, M., MATSUZAKI, F., YANAKI, T., FUKUI, H. & DATE, M.
2003. Evaluation of post-application rheological changes in cosmetics using a novel
measuring device: Relationship to sensory evaluation. Journal of cosmetic science, 54,
321-334.
LACERDA, S. P., CERIZE, N. N. P. & RE, M. I. 2011. Preparation and characterization of
carnauba wax nanostructured lipid carriers containing benzophenone-3. International
Journal of Cosmetic Science, 33, 312-321.
LANGER, R. & PEPPAS, N. 1983a. Chemical and Physical Structure of Polymers as Carriers
for Controlled Release of Bioactive Agents: A Review. Journal of Macromolecular
Science, Part C, 23, 61-126.
LANGER, R. & PEPPAS, N. 1983b. CHEMICAL AND PHYSICAL STRUCTURE OF
POLYMERS AS CARRIERS FOR CONTROLLED RELEASE OF BIOACTIVE
AGENTS: A REVIEW. Journal of Macromolecular Science - Reviews in
Macromolecular Chemistry and Physics, C23, 61-126.
LARSSON, K. 1966. Classification of Glyceride Crystal Forms Acta Chemica Scandinavica 20,
2255 - 2260.
LE RÉVÉREND, B. J. D., TAYLOR, M. S. & NORTON, I. T. 2011a. Design and application
of water-in-oil emulsions for use in lipstick formulations. International Journal of
Cosmetic Science, no-no.
LE RÉVÉREND, B. J. D., TAYLOR, M. S. & NORTON, I. T. 2011b. Design and application
of water-in-oil emulsions for use in lipstick formulations. International Journal of
Cosmetic Science, 33, 263-268.
LI, L. 2002. Thermal Gelation of Methylcellulose in Water: caling and Thermoreversibility.
Macromolecules, 35, 5990-5998.

References
223
LODÉN, M. 1996. Urea-containing moisturizers influence barrier properties of normal skin.
Archives of Dermatological Research, 288, 103-107.
LODÉN, M. & WESSMAN, W. 2001. The influence of a cream containing 20% glycerin and
its vehicle on skin barrier properties. International Journal of Cosmetic Science, 23,
115-119.
LOMBARDI, M. H. & VACCARO, J. 1993. Lipstick Article. United States of America patent
application.
LUENGO, G., TSUCHIYA, M., HEUBERGER, M. & ISRAELACHVILI, J. 1997. Thin film
rheology and tribology of chocolate. Journal of Food Science, 62, 767-812.
MACKLES, L. 1987. Aerosol Foam. USA patent application 778026. 27/01/1987.
MALONE, M., APPELQVIST, I. & NORTON, I. 2003. Oral behaviour of food hydrocolloids
and emulsions. Part 1. Lubrication and deposition considerations. Food Hydrocolloids,
17, 763-773.
MARANGONI, A. G. & WESDORP, L. H. 2012. Structure and Properties of Fat Crystal
Networks, Second Edition, Taylor & Francis.
MCCABE, J. & WALLIS, A. 2008. Applied dental materials, Wiley-Blackwell
MCCLEMENTS, D. J. (ed.) 2002. Food Lipids
Chemistry, Nutrition and Biotechnology CRC Press 2008
MCCLEMENTS, D. J. 2005. Food Emulsions - Principles, Practices, and Techniques.
MCKETTA, J. J. 1993. Cosmetics Encyclopedia of chemical processing and design New York:
Marcel Dekker INC.
MILLS, T., SPYROPOULOS, F., NORTON, I. T. & BAKALIS, S. 2011. Development of an
in-vitro mouth model to quantify salt release from gels. Food Hydrocolloids, 25, 107-
113.
MILLS, T. B. 2011. Development of In-Vitro Mouth Models. Ph. D., University of Birmingham
MINTEL 2012. Colour Cosmetics - UK. Report supplied by Alliance Boots.
MORESI, M. & BRUNO, M. 2007. Characterisation of alginate gels using quasi-static and
dynamic methods. Journal of Food Engineering, 82, 298-309.
MÜLLER, C. M. O., LAURINDO, J. B. & YAMASHITA, F. 2009. Effect of cellulose fibers
addition on the mechanical properties and water vapor barrier of starch-based films.
Food Hydrocolloids, 23, 1328-1333.
NAKADA, M. 1994. Trends in engine technology and tribology. Tribology International, 27, 3-
8.
NAKAYAMA, A., KAKUGO, A., GONG, J. P., OSADA, Y., TAKAI, M., ERATA, T. &
KAWANO, S. 2004. High mechanical strength double-network hydrogel with bacterial
cellulose. Advanced Functional Materials, 14, 1124-1128.
NAPPER, D. H. 1983. Polymeric Stabilization of Colloidal Dispersions London.
NARINE, S. S. & MARANGONI, A. G. 1999a. Fractal nature of fat crystal networks. Physical
Review E, 59, 1908-1920.
NARINE, S. S. & MARANGONI, A. G. 1999b. Relating structure of fat crystal networks to
mechanical properties: a review. Food Research International, 32, 227-248.
NEDERVEEN, C. 1963. Dynamic mechanical behavior of suspensions of fat particles in oil.
Journal of Colloid Science, 18, 276-291.
NORTON, A. B., COX, P. W. & SPYROPOULOS, F. 2011. Acid gelation of low acyl gellan
gum relevant to self-structuring in the human stomach. Food Hydrocolloids, 25, 1105-
1111.
NORTON, I. T., LEE-TUFFNELL, C. D., ABLETT, S. & BOCIEK, S. M. 1985. A
Calorimetric, NMR and X ray Diffraction Study of the Melting Behaviour of
Tripalmitin and Tristearin and their Mxing Behaviour with Trioloein. Journal of the
American Oil Chemists' Society, 62, 1237 - 1244.
NORTON, J. & NORTON, I. 2010. Designer colloids—towards healthy everyday foods? Soft
Matter, 6, 3735-3742.
NORTON, J. E. & FRYER, P. J. 2012. Investigation of changes in formulation and processing
parameters on the physical properties of cocoa butter emulsions. Journal of Food
Engineering, 113, 329-336.

References
224
NORTON, J. E., FRYER, P. J., PARKINSON, J. & COX, P. W. 2009. Development and
characterisation of tempered cocoa butter emulsions containing up to 60% water.
Journal of Food Engineering, 95, 172-178.
OH, S. G., JOBALIA, M. & SHAH, D. O. 1993. The Effect of Micellar Lifetime on the Droplet
Size in Emulsions. Journal of Colloid and Interface Science, 156, 511-514.
PACKER, K. J. & REES, C. 1971. Pulsed NMR studies of Restricted Diffusion. Journal of
Colloid and Interface Science, 40, 206 - 218.
PAL, R. 1996. Effect of droplet size on the rheology of emulsions. AIChE Journal, 42, 3181-
3190.
PAL, R. 2000. Slippage during the flow of emulsions in rheometers. Colloids and Surfaces A:
Physicochemical and Engineering Aspects, 162, 55-66.
PAPENHUIJZEN, J. 1971. Superimposed steady and oscillatory shear in dispersed systems.
Rheol. Acta, 10, 493-502.
PETERSSON, M., GUSTAFSON, I. & STADING, M. 2008. Comparison of microstructural
and physical properties of two petroleum waxes. Journal of Materials Science, 43,
1869-1879.
PICKERING, S. U. 1907. Emulsions. Journal of the Chemical Society, 91, 2001-2021.
POTHAKAMURY, U. R. & BARBOSA-CÁNOVAS, G. V. 1995. Fundamental aspects of
controlled release in foods. Trends in Food Science & Technology, 6, 397-406.
PRINZ, J. F. & LUCAS, P. W. 2000. Saliva tannin interactions. Journal of Oral Rehabilitation,
27, 991-994.
REID, R. C., PRAUSNITZ, J. M. & POLLING, B. 1987. The properties of Gases and Liquids,
McGraw-Hill Book Company.
ROSEN, M. 1988. Surfactants and Interfacial Phenomena, John Wiley & Sons.
ROUSSEAU, D. 2000. Fat crystals and emulsion stability - a review. Food Research
International, 33, 3-14.
ROUSSEAU, D. & HODGE, S. M. 2005. Stabilization of water-in-oil emulsions with
continuous phase crystals. Colloids and Surfaces a-Physicochemical and Engineering
Aspects, 260, 229-237.
ROUSSEAU, D., MARANGONI, A. G. & JEFFREY, K. R. 1998. The influence of chemical
interesterification on the physicochemical properties of complex fat systems. 2.
Morphology and polymorphism. Journal of the American Oil Chemists' Society, 75,
1833-1839.
SATO, K. 2001. Crystallization behaviour of fats and lipids — a review. Chemical Engineering
Science, 56, 2255-2265.
SERBAN, G. P., HENRY, S. M., COTTY, V. F., COHEN, G. L. & RIVELEY, J. A. 1983.
ELECTROMETRIC TECHNIQUE FOR THE INVIVO ASSESSMENT OF SKIN
DRYNESS AND THE EFFECT OF CHRONIC TREATMENT WITH A LOTION ON
THE WATER BARRIER FUNCTION OF DRY SKIN. Journal of the Society of
Cosmetic Chemists, 34, 383-393.
SHIH, W.-H., SHIH, W. Y., KIM, S.-I., LIU, J. & AKSAY, I. A. 1990. Scaling behavior of the
elastic properties of colloidal gels. Physical Review A, 42, 4772.
SHRINIVAS, P., KASAPIS, S. & TONGDANG, T. 2009. Morphology and Mechanical
Properties of Bicontinuous Gels of Agarose and Gelatin and the Effect of Added Lipid
Phase. Langmuir, 25, 8763-8773.
STAMATOUDIS, M. & TAVLARIDES, L. L. 1985. Effect of continuous-phase viscosity on
the drop sizes of liquid-liquid dispersions in agitated vessels. Industrial & Engineering
Chemistry Process Design and Development, 24, 1175-1181.
STONE, H. A. 1994. Dynamics of drop deformation and breakup in viscous fluids. Annual
Review of Fluid Mechanics, 26, 65-102.
TABILO-MUNIZAGA, G. & BARBOSA-CÁNOVAS, G. V. 2005. Rheology for the food
industry. Journal of Food Engineering, 67, 147-156.
TAYLOR, M. S. 2011. Stabilisation of water-in-oil emulsions to improve the emollient
properties Lipsticks. Mres, University of Birmingham.

References
225
TIMM, K., MYANT, C., SPIKES, H. A. & GRUNZE, M. 2011. Particulate lubricants in
cosmetic applications. Tribology International, 44, 1695-1703.
TRAN, T. & ROUSSEAU, D. 2013. Stabilization of acidic soy protein-based dispersions and
emulsions by soy soluble polysaccharides. Food Hydrocolloids, 30, 382-392.
TÜRKER, N. & ERDOGˇDU, F. 2006. Effects of pH and temperature of extraction medium on
effective diffusion coefficient of anthocynanin pigments of black carrot (Daucus carota
var. L.). Journal of Food Engineering, 76, 579-583.
VAN AKEN, G. A. 2004. Coalescence mechanisms in protein-stabilized emulsions. Food
emulsions, 299-324.
VAN DEN ENDEN, J. C., WADDINGTON, D., VAN AALST, H., VAN KRALINGEN, C. G.
& PACKER, K. J. 1990. Rapid determination of water droplet size distributions by
PFG-NMR. Journal of Colloid and Interface Science, 140, 105-113.
VAN DEN TEMPEL, M. 1961. Mechanical properties of plastic-disperse systems at very small
deformations. Journal of Colloid Science, 16, 284-296.
VAN DUYNHOVEN, J. P. M., GOUDAPPEL, G. J. W., VAN DALEN, G., VAN BRUGGEN,
P. C., BLONK, J. C. G. & EIJKELENBOOM, A. 2002a. Scope of droplet size
measurements in food emulsions by pulsed field gradient NMR at low field. Magnetic
Resonance in Chemistry, 40, S51-S59.
VAN DUYNHOVEN, J. P. M., GOUDAPPEL, G. J. W., VAN DALEN, G., VAN BRUGGEN,
P. C., BLONK, J. C. G. & EIJKELENBOOM, A. P. A. M. 2002b. Scope of droplet size
measurements in food emulsions by pulsed field gradient NMR at low field. Magnetic
Resonance in Chemistry, 40, S51-S59.
VAN DUYNHOVEN, J. P. M., MAILLET, B., SCHELL, J., TRONQUET, M., GOUDAPPEL,
G.-J. W., TREZZA, E., BULBARELLO, A. & VAN DUSSCHOTEN, D. 2007. A rapid
benchtop NMR method for determination of droplet size distributions in food
emulsions. European Journal of Lipid Science and Technology, 109, 1095-1103.
VEREECKEN, J., MEEUSSEN, W., LESAFFER, A. & DEWETTINCK, K. 2010. Effect of
water and monoglyceride concentration on the behaviour of monoglyceride containing
fat systems. Food Research International, 43, 872-881.
VERHAGEN, J. V. & ENGELEN, L. 2006. The neurocognitive bases of human multimodal
food perception: sensory integration. Neuroscience & Biobehavioral Reviews, 30, 613-
650.
WALSTRA, P. (ed.) 1983a. Formation of emulsions, New York: Marcel Dekker.
WALSTRA, P. 1983b. Formation of Emulsions in Encyclopedia of Emulsion Technology New
York, Marcel Decker
WALSTRA, P. 1993. Principles of emulsion formation. Chemical Engineering Science, 48,
333-349.
WALSTRA, P. 1998. Secondary nucleation in triglyceride crystallization. In: LINDMAN, B. &
NINHAM, B. W. (eds.) Colloid Science of Lipids: New Paradigms for Self-Assembly in
Science and Technology. Berlin 33: Steinkopff Darmstadt.
WANG, J., YANG, F., TAN, J. J., LIU, G. P., XU, J. & SUN, D. J. 2010. Pickering Emulsions
Stabilized by a Lipophilic Surfactant and Hydrophilic Platelike Particles. Langmuir, 26,
5397-5404.
WANG, J. F., CALHOUN, M. D. & SEVERTSON, S. J. 2008. Dynamic rheological study of
paraffin wax and its organoclay nanocomposites. Journal of Applied Polymer Science,
108, 2564-2570.
WANG, Q., ROJAS, E. C. & PAPADOPOULOS, K. D. 2012. Cationic liposomes in double
emulsions for controlled release. Journal of Colloid and Interface Science, 383, 89-95.
WANG, T. S. & LEE, G. 1997. The effect of formulation on the hardness and crystallization of
emulsion lipsticks. Journal of the Society of Cosmetic Chemists, 48, 41-50.
YILDIZ, O. & UNLUTURK, S. 2009. Differential scanning calorimetry as a tool to detect
antibiotic residues in ultra high temperature whole milk. International Journal of Food
Science and Technology, 44, 2577-2582.
YOUNG, M. E., CARROAD, P. A. & BELL, R. L. 1980. Estimation of diffusion coefficients of
proteins. Biotechnology and Bioengineering, 22, 947-955.

References
226
ZHANG, H., JACOBSEN, C. & ADLER-NISSEN, J. 2005. Storage stability study of
margarines produced from enzymatically interesterified fats compared to margarines
produced by conventional methods. I. Physical properties. European Journal of Lipid
Science and Technology, 107, 530-539.
ZHANG, J., HUANG, B., LI, Y. & LI, S.-L. 2002. Influence of Microcrystalline Wax on
Properties of MIM Multi-Component Wax Matrix Binder. Trans. Nonferrous Met. Soc.
China, 12, 918 - 921.