Embed Size (px)
Citation preview
Wayside Detection The Detroit Edison Experience
Dennis J. Buda
Detroit Edison
Railroad Engineering Program
University of Illinois
Urbana-Champaign, ILL
December 2006

Discussion Topics
The Detroit Edison Strategy
WILD Issues
Financial Issues
Conclusions and Recommendations
Wheel Failures and WM Codes
WM 66, Flange Cracked or Broken
WM 68, Cracked Rim
WM 71, Shattered Rim
WM 72, Spread Rim
WM 83, Cracked Plate
WM 75, Shelling, Spalling, Thermal-Mechanical
WM 65 and 67, Out of Round (WILD or Gage)
WM 76, Built-Up Tread
WM 78, Slid Flat
Recent AAR Rule Changes
WM 65 Wheel Impact Load Detector
Removal at Impact Greater Than 90 Kips
97% of the Benefit Falls to Class I RR’s
Rim Thickness Credit – Removed
Window of Opportunity - Stress State
The Detroit Edison Strategy
The Theory
The WILD Program
50+ Kip Maintenance Strategy
The Theory
The private car owner can effectively manage
the life and performance of heavy haul-high mileage wheel sets, by developing a proactive maintenance strategy based upon way-side detection methodologies in combination with Class I Railroads, private railcar maintenance providers, and railway suppliers.
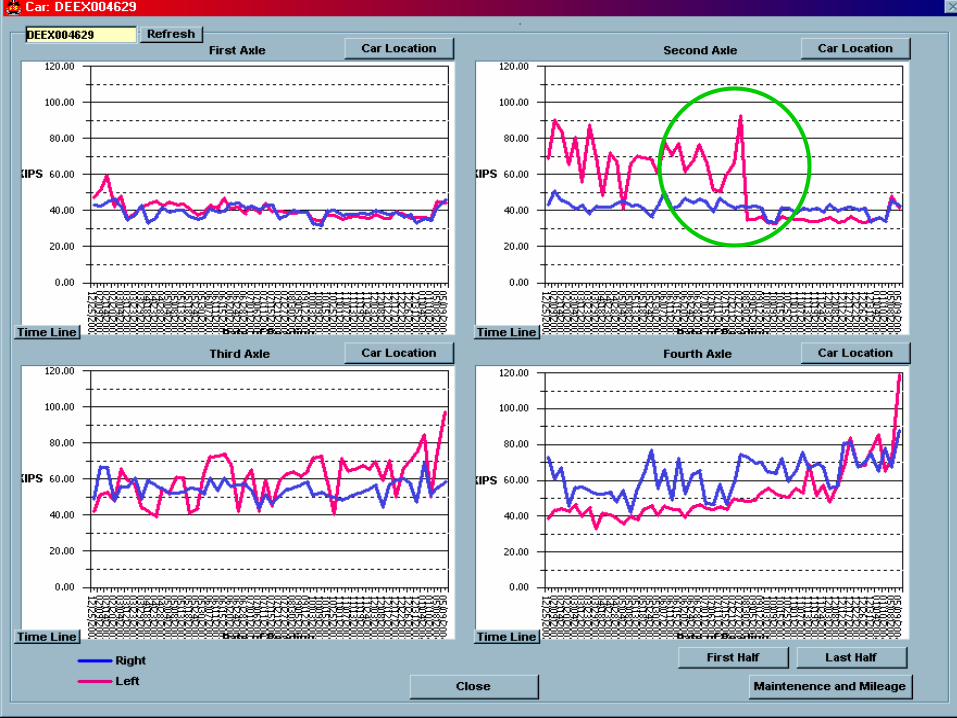
The WILD Program
Data Purchased from TTCI
By Train
By Railcar
By Wheel Location
By Graph
Proactive Maintenance Strategy
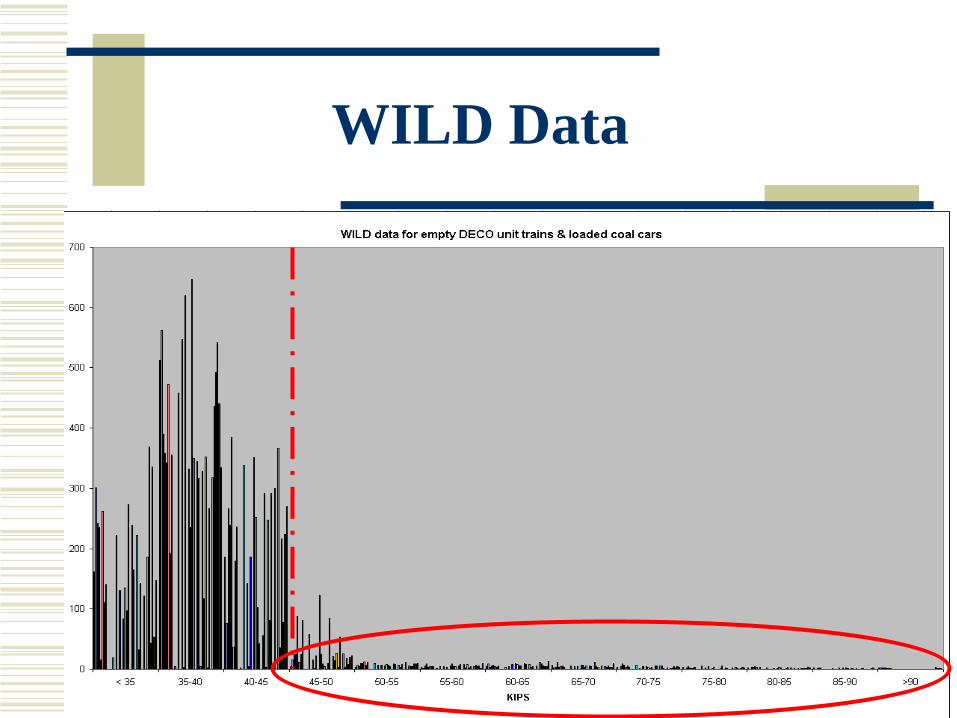
WILD Data
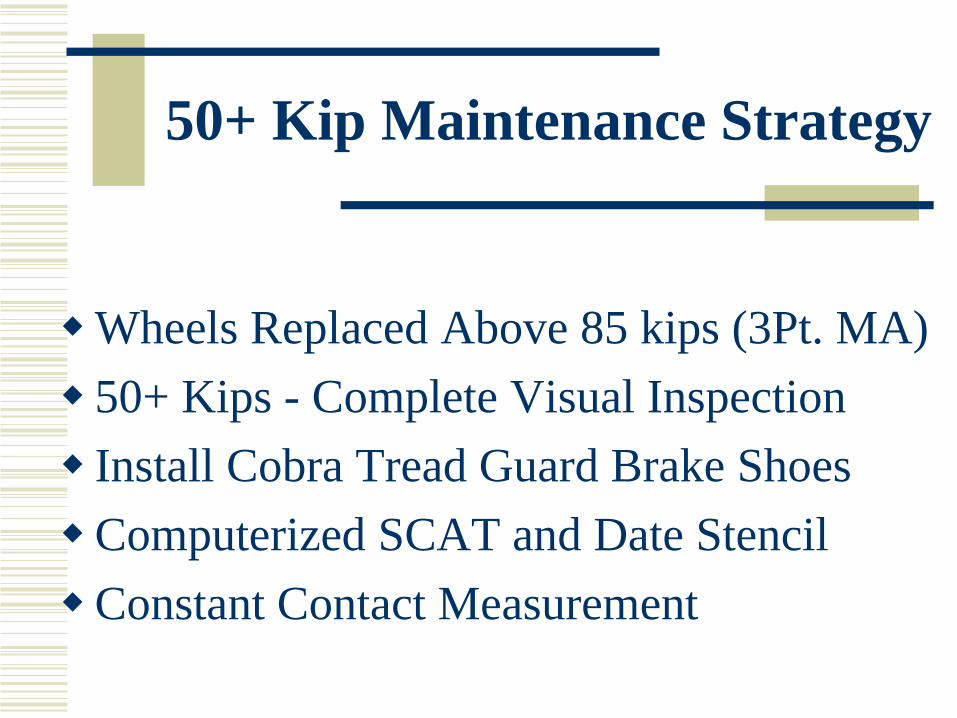
50+ Kip Maintenance Strategy
Wheels Replaced Above 85 kips (3Pt. MA)
50+ Kips - Complete Visual Inspection
Install Cobra Tread Guard Brake Shoes
Computerized SCAT and Date Stencil
Constant Contact Measurement
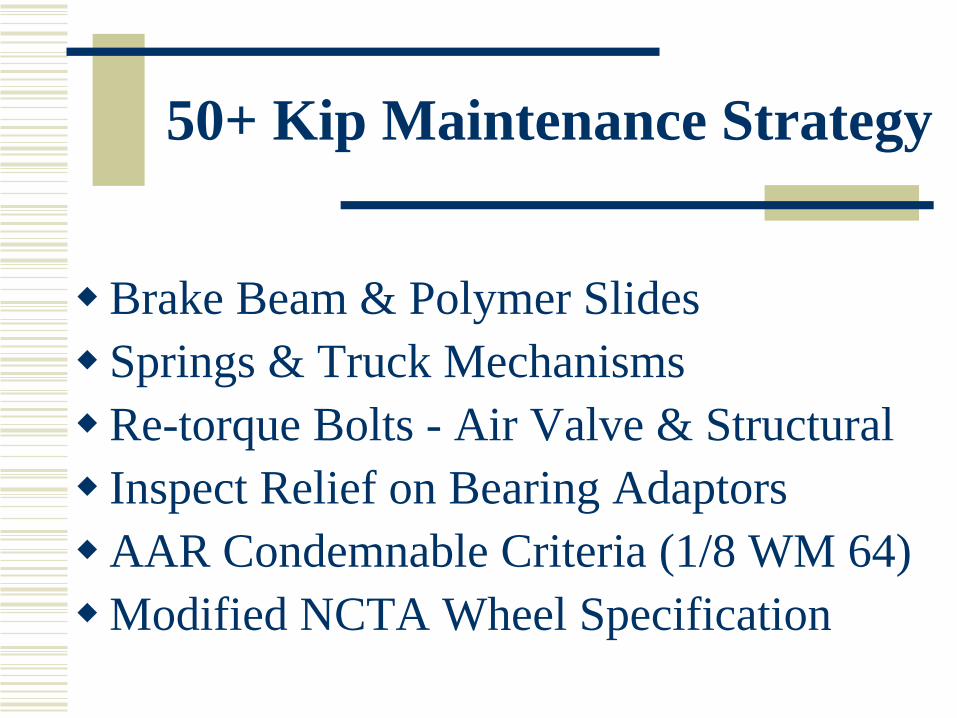
50+ Kip Maintenance Strategy
Brake Beam & Polymer Slides
Springs & Truck Mechanisms
Re-torque Bolts - Air Valve & Structural
Inspect Relief on Bearing Adaptors
AAR Condemnable Criteria (1/8 WM 64)
Modified NCTA Wheel Specification
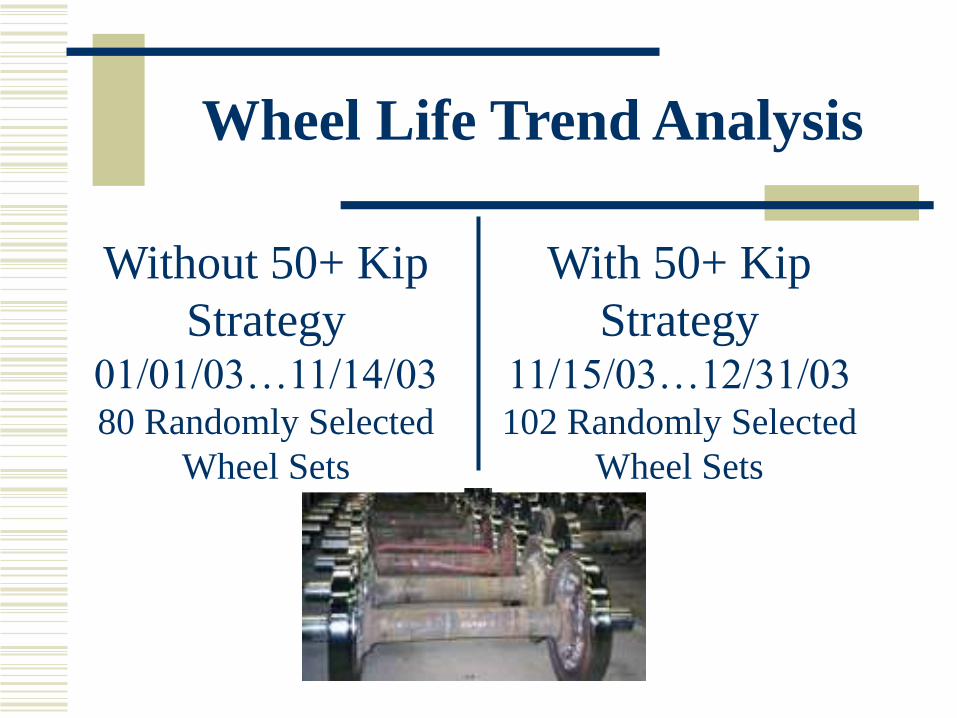
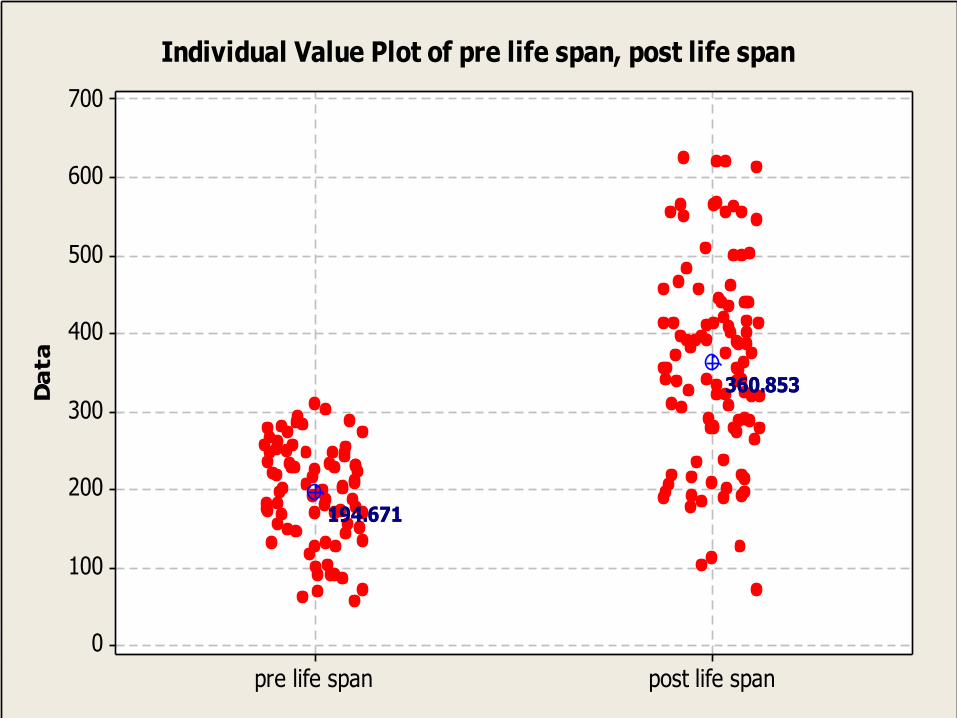
Wheel Life Trend Analysis
Without 50+ Kip
Strategy 01/01/03…11/14/03 80 Randomly Selected
Wheel Sets
With 50+ Kip
Strategy 11/15/03…12/31/03 102 Randomly Selected
Wheel Sets
Da
ta
post life spanpre life span
700
600
500
400
300
200
100
0
194.671194.671
360.853360.853
Individual Value Plot of pre life span, post life span
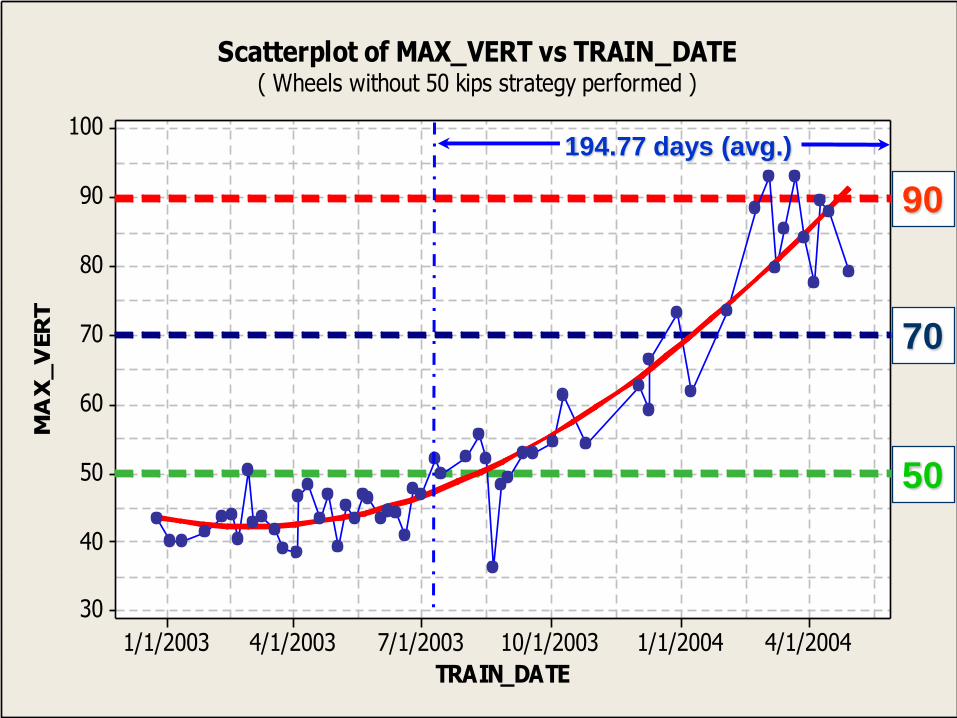
TRAIN_DATE
MA
X_
VER
T
4/1/20041/1/200410/1/20037/1/20034/1/20031/1/2003
100
90
80
70
60
50
40
30
50
70
90
Scatterplot of MAX_VERT vs TRAIN_DATE( Wheels without 50 kips strategy performed )
50
70
90
194.77 days (avg.)
WILD Issues
WILD Calibration: Frequency & Uniformity
Effects of Train Speed
Effects of Track Structure & Sub-grade
Effects of Concrete Ties
WILD Reading Variation
Etc.
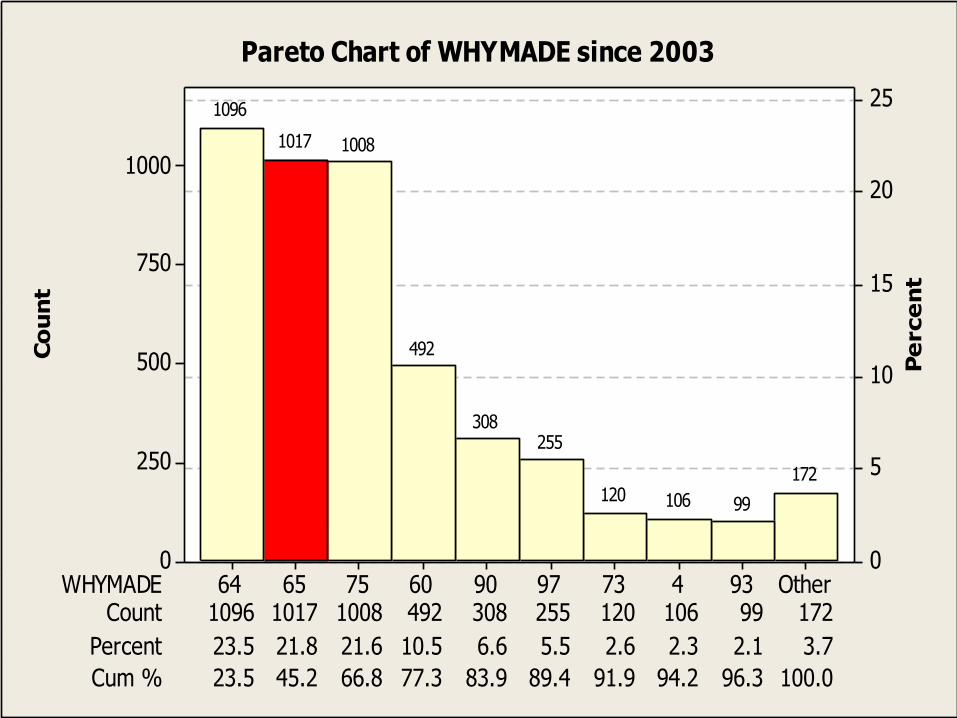
Pareto of whymade since 2003
Co
un
t
Pe
rce
nt
WHYMADECount 99 172
Percent 23.5 21.8 21.6 10.5 6.6 5.5 2.6
1096
2.3 2.1 3.7
Cum % 23.5 45.2 66.8 77.3 83.9 89.4
1017
91.9 94.2 96.3 100.0
1008 492 308 255 120 106Other93473979060756564
1000
750
500
250
0
25
20
15
10
5
0
172
99106120
255308
492
10081017
1096
Pareto Chart of WHYMADE since 2003
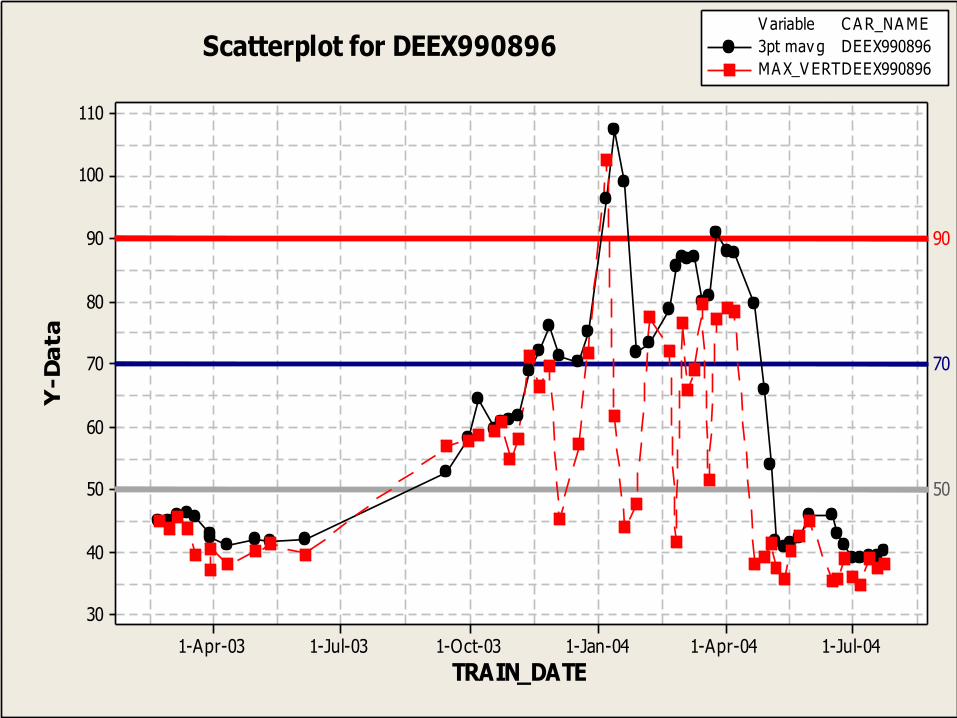
3 pt mavg & kips
TRAIN_DATE
Y-D
ata
1-Jul-041-Apr-041-Jan-041-Oct-031-Jul-031-Apr-03
110
100
90
80
70
60
50
40
30
90
50
70
V ariable
DEEX990896
C A R_NA ME
3pt mav g DEEX990896
MA X_V ERTScatterplot for DEEX990896
Hypothesis
Kips variation vs. Speed change?
Kips variation vs. Car weight?
Kips variation vs. Site change?
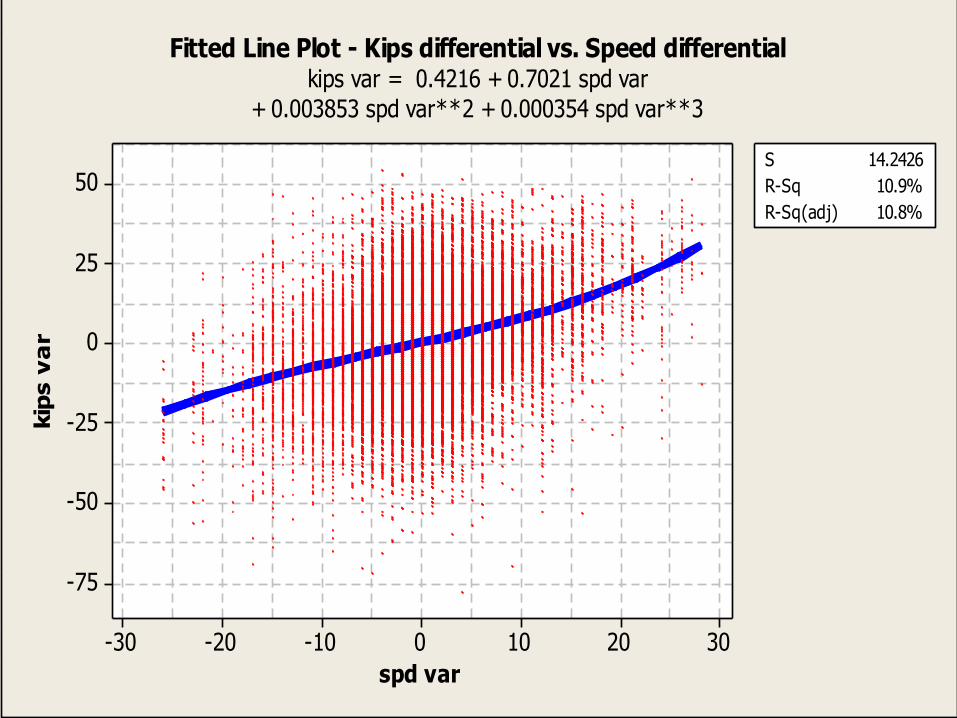
Kips vs. spd correlation
spd var
kip
s v
ar
3020100-10-20-30
50
25
0
-25
-50
-75
S 14.2426
R-Sq 10.9%
R-Sq(adj) 10.8%
Fitted Line Plot - Kips differential vs. Speed differentialkips var = 0.4216 + 0.7021 spd var
+ 0.003853 spd var**2 + 0.000354 spd var**3
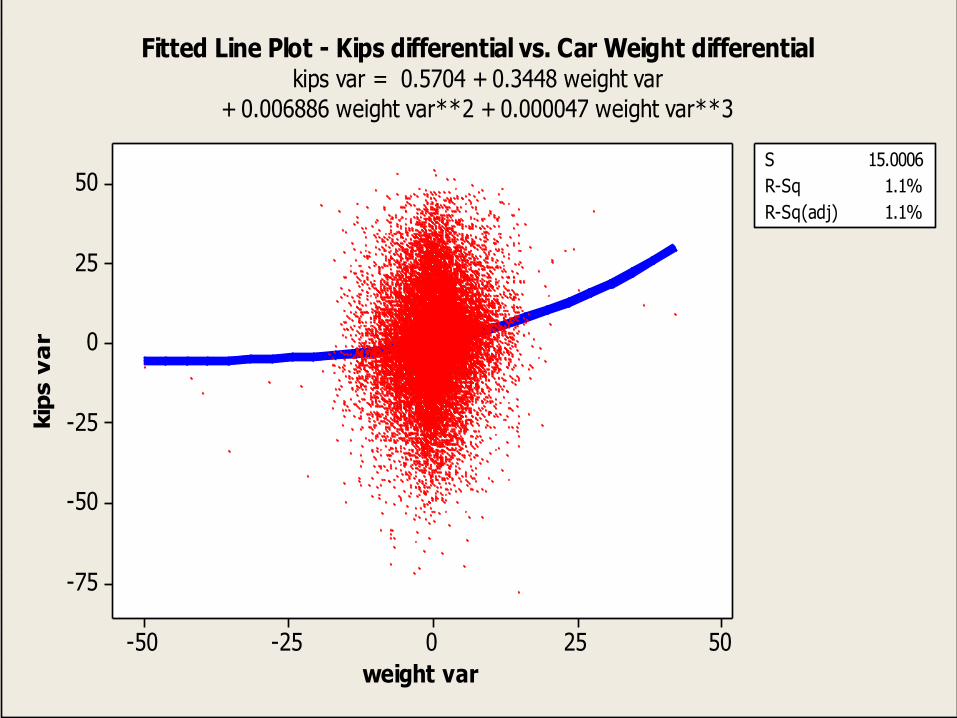
Kips vs. weight correlation
weight var
kip
s v
ar
50250-25-50
50
25
0
-25
-50
-75
S 15.0006
R-Sq 1.1%
R-Sq(adj) 1.1%
Fitted Line Plot - Kips differential vs. Car Weight differentialkips var = 0.5704 + 0.3448 weight var
+ 0.006886 weight var**2 + 0.000047 weight var**3
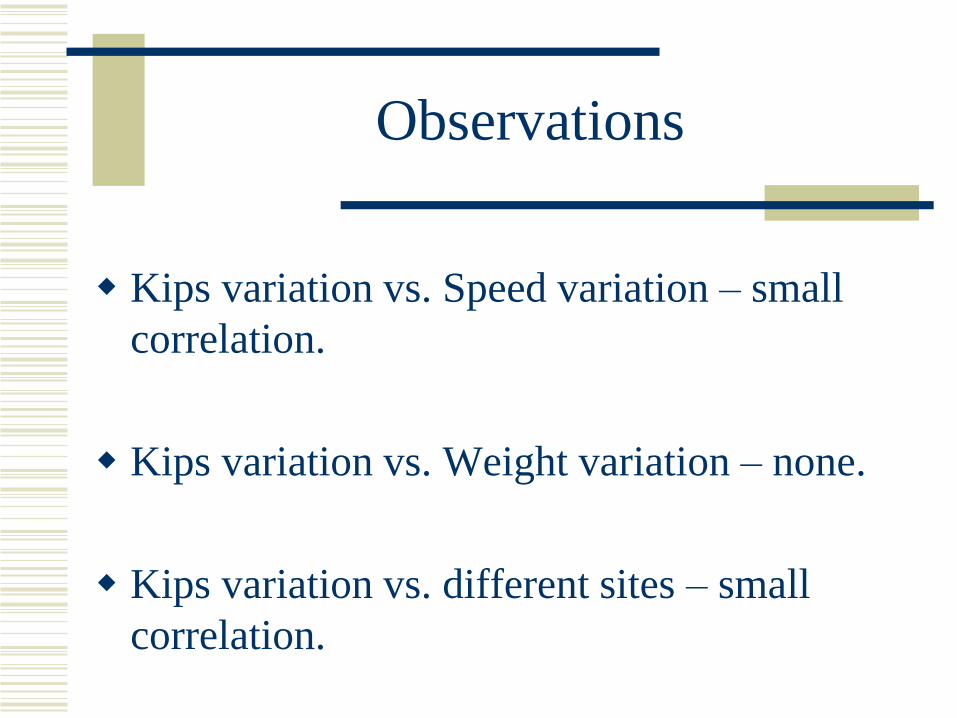
Observations
Kips variation vs. Speed variation – small
correlation.
Kips variation vs. Weight variation – none.
Kips variation vs. different sites – small
correlation.
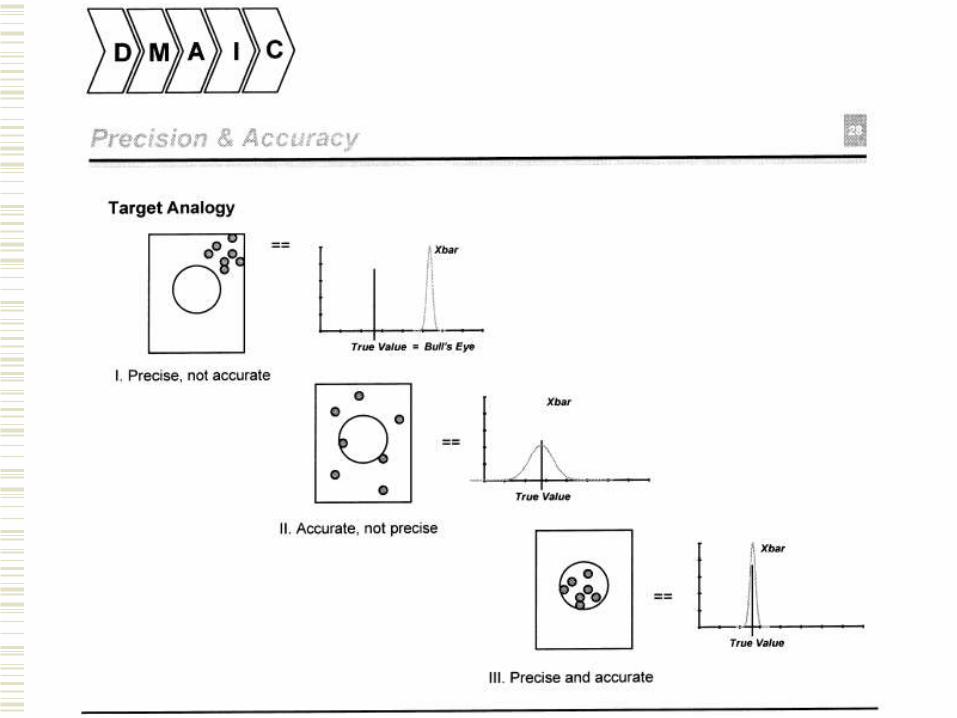
MSA – precise & accurate
Measuring system variation vs. process tolerance
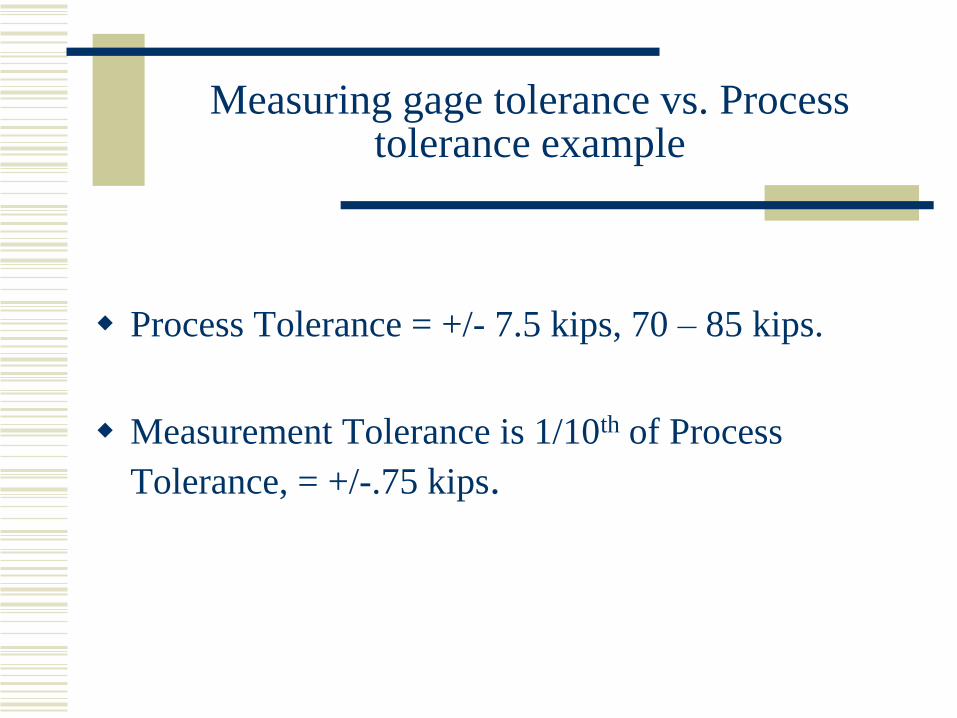
Measuring gage tolerance vs. Process tolerance example
Process Tolerance = +/- 7.5 kips, 70 – 85 kips.
Measurement Tolerance is 1/10th of Process
Tolerance, = +/-.75 kips.
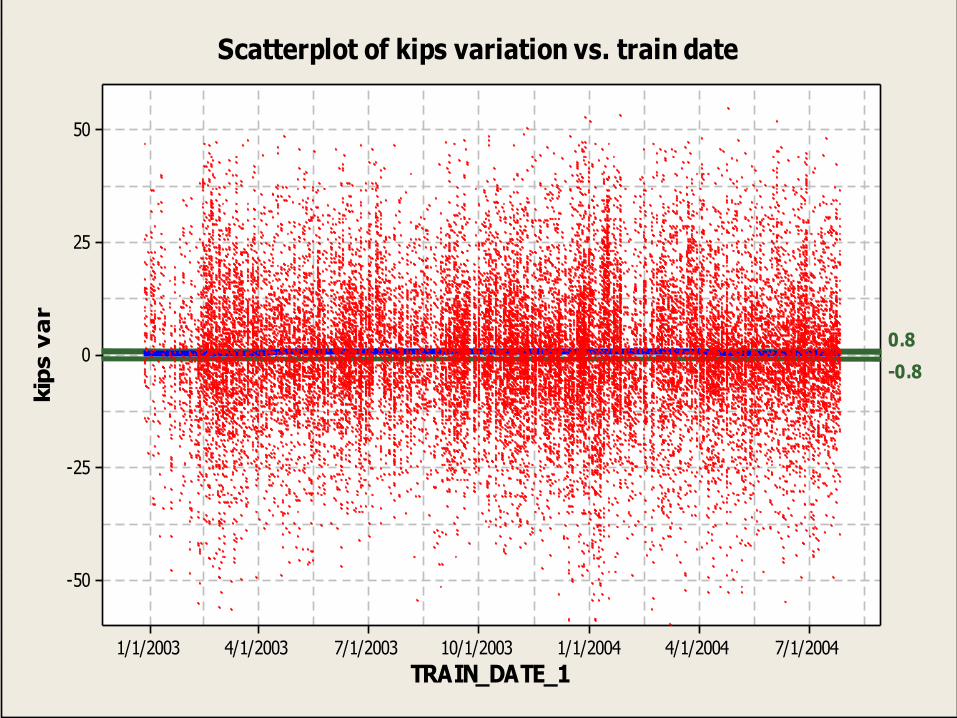
Scatter plot of kips variation vs. train date
TRAIN_DATE_1
kip
s v
ar
7/1/20044/1/20041/1/200410/1/20037/1/20034/1/20031/1/2003
50
25
0
-25
-50
0.8
-0.8
Scatterplot of kips variation vs. train date
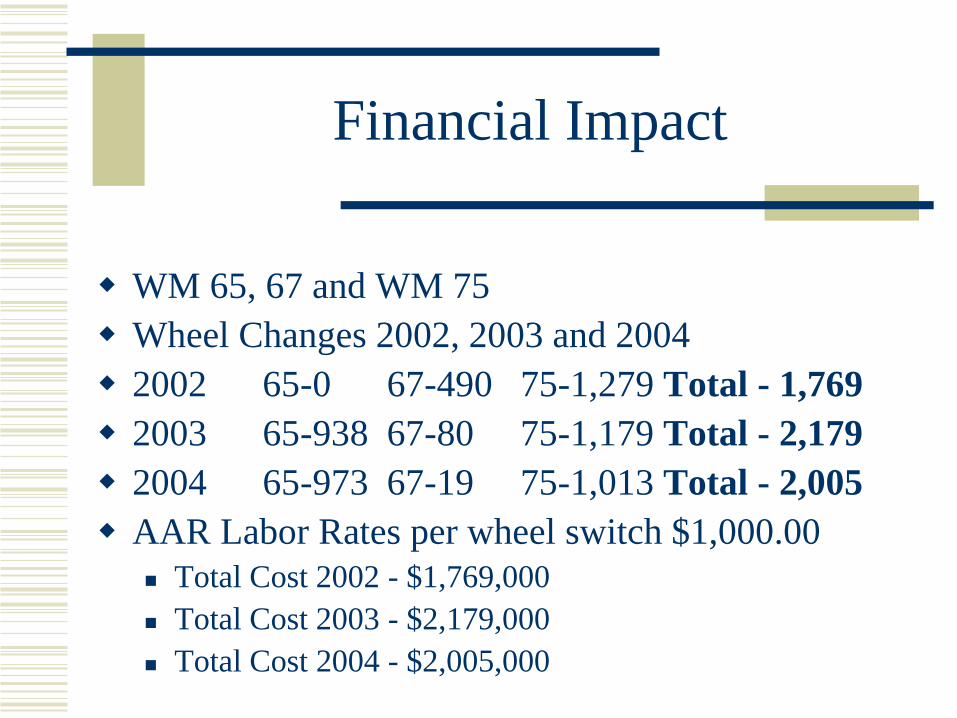
Financial Impact
WM 65, 67 and WM 75
Wheel Changes 2002, 2003 and 2004
2002 65-0 67-490 75-1,279 Total - 1,769
2003 65-938 67-80 75-1,179 Total - 2,179
2004 65-973 67-19 75-1,013 Total - 2,005
AAR Labor Rates per wheel switch $1,000.00
Total Cost 2002 - $1,769,000
Total Cost 2003 - $2,179,000
Total Cost 2004 - $2,005,000
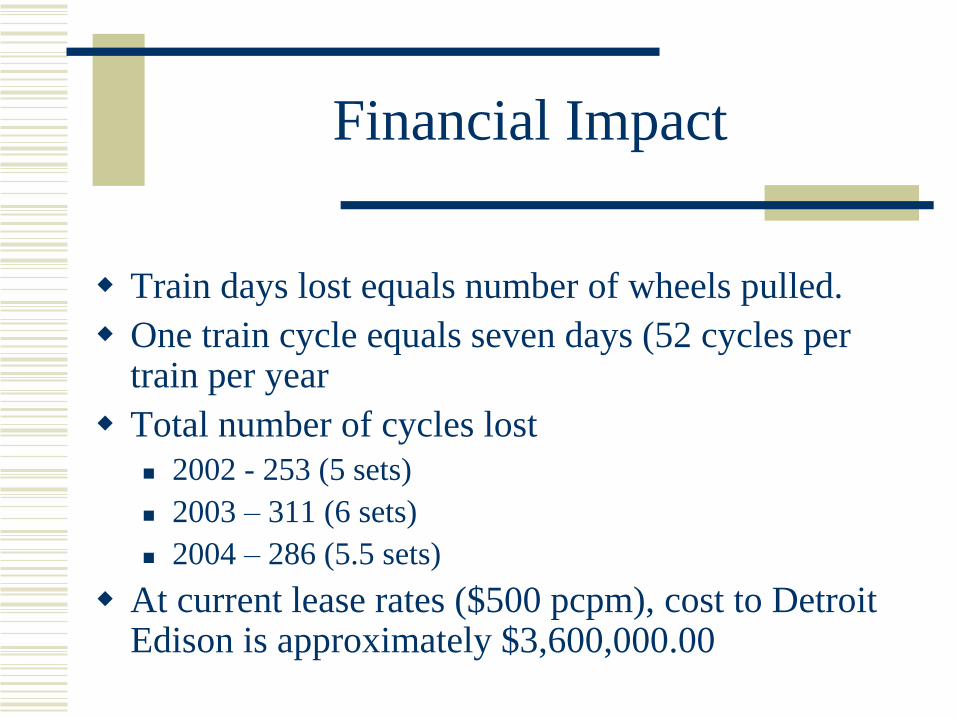
Financial Impact
Train days lost equals number of wheels pulled.
One train cycle equals seven days (52 cycles per train per year
Total number of cycles lost
2002 - 253 (5 sets)
2003 – 311 (6 sets)
2004 – 286 (5.5 sets)
At current lease rates ($500 pcpm), cost to Detroit Edison is approximately $3,600,000.00
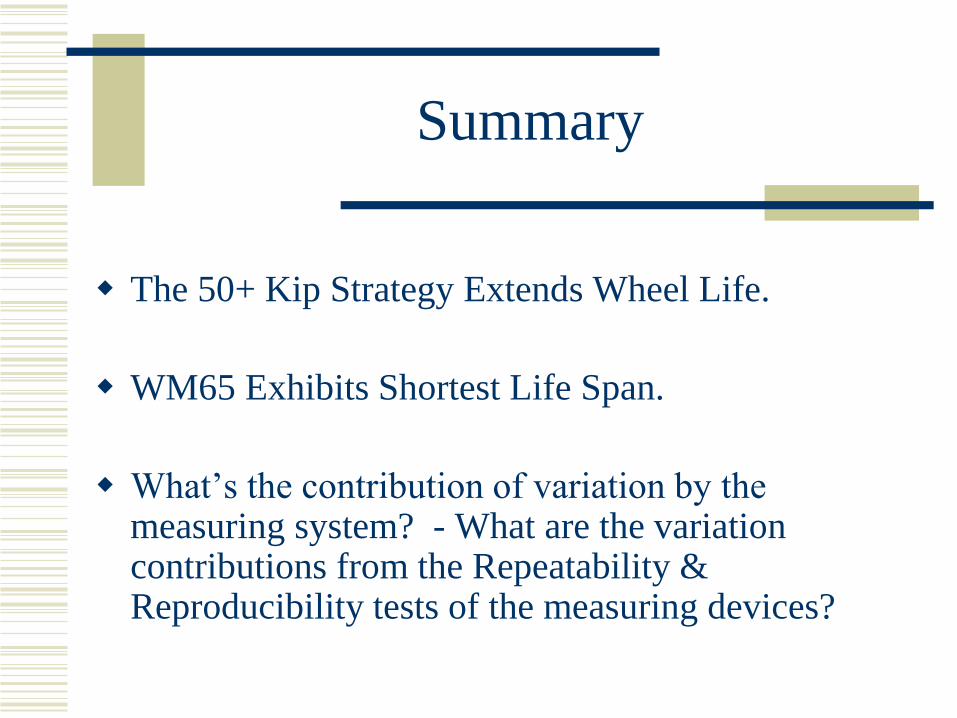
Summary
The 50+ Kip Strategy Extends Wheel Life.
WM65 Exhibits Shortest Life Span.
What’s the contribution of variation by the measuring system? - What are the variation contributions from the Repeatability & Reproducibility tests of the measuring devices?
Recommendations
Root Cause of Wheel Defects WM 65 & WM 75
Computerized SCAT at All Repair Tracks
Rail Maintenance Management Forum
WILD Calibration Should be Standardized and
Meet AAR M-1003 Quality System
Improved Efforts to Share Costs and Benefits
Within the Railroad Industry
Private Railcar Owner - Voting AAR Member
The Final Thought
Our greatest challenge as an industry is to get the departments responsible for the vehicle performance and the track maintenance to work together and define a wheel rail interaction strategy to obtain synergy between the vehicles, track and the long term profitability of the heavy haul operation.
Source: International Heavy Haul Association (2001)