Embed Size (px)
Citation preview

WBCSD & NBI Water
Week
Welcome, context and
introduction by Alex McNamara
(NBI)

WBCSD & NBI Water Week: agenda
09.00-09.05 Welcome by Alex McNamara09.05-09.15 Context and introduction, Alex McNamara09.15-09.30 Overview of WBCSD Water Program, Joppe Cramwinckel09.30-09.50 Water stewardship, Tatiana Fedotova09.50-10.20 Questions & discussion 10.20-10.40 Tea break10.40-11.10 WBCSD tools in the context of water risk mapping, Joppe Cramwinckel11.10-12.20 Questions & discussion12.20-13.00 Lunch break13.00-14.20 Responding effectively; specific approaches (water reuse, natural infrastructure, WASH) Joppe Cramwinckel, Tatiana Fedotova14.20-14.30 Wrapping up and next steps, Alex McNamara

WBCSD & NBI Water
Week
Overview of WBCSD Water
Work Program in light of key
trends & drivers

RE
UT
ER
S/C
hin
a D
aily
AF
P
We are overstepping planetary boundaries
Chri
s J
ord
an

Too much? Too little? Too bad? 6
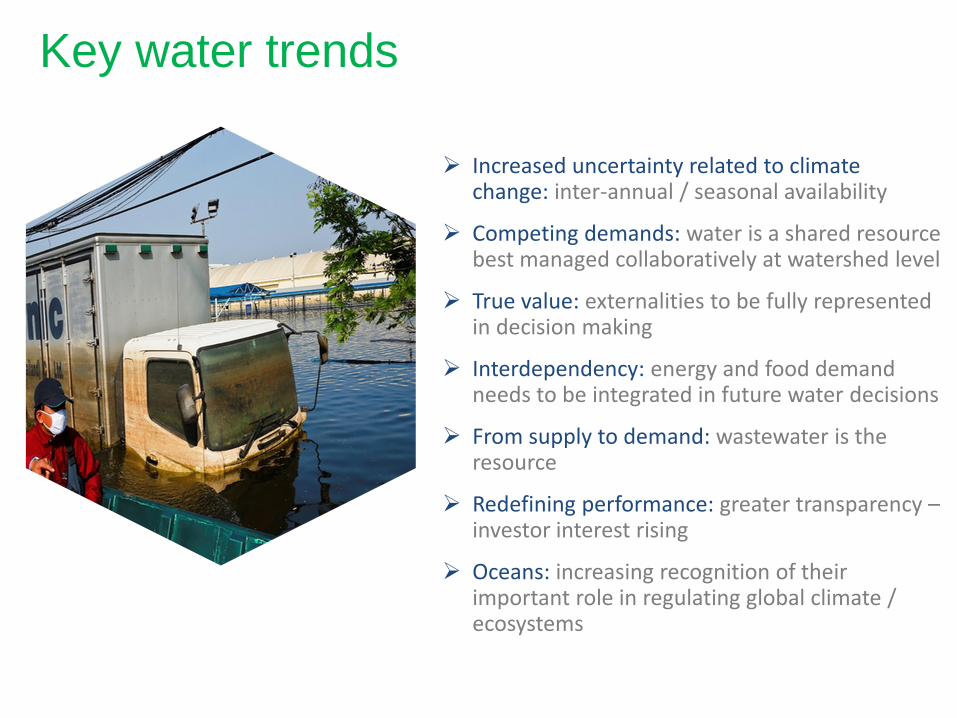
Increased uncertainty related to climate change: inter-annual / seasonal availability
Competing demands: water is a shared resource best managed collaboratively at watershed level
True value: externalities to be fully represented in decision making
Interdependency: energy and food demand needs to be integrated in future water decisions
From supply to demand: wastewater is the resource
Redefining performance: greater transparency –investor interest rising
Oceans: increasing recognition of their important role in regulating global climate / ecosystems
Key water trends

All businesses depend and impact on water
9
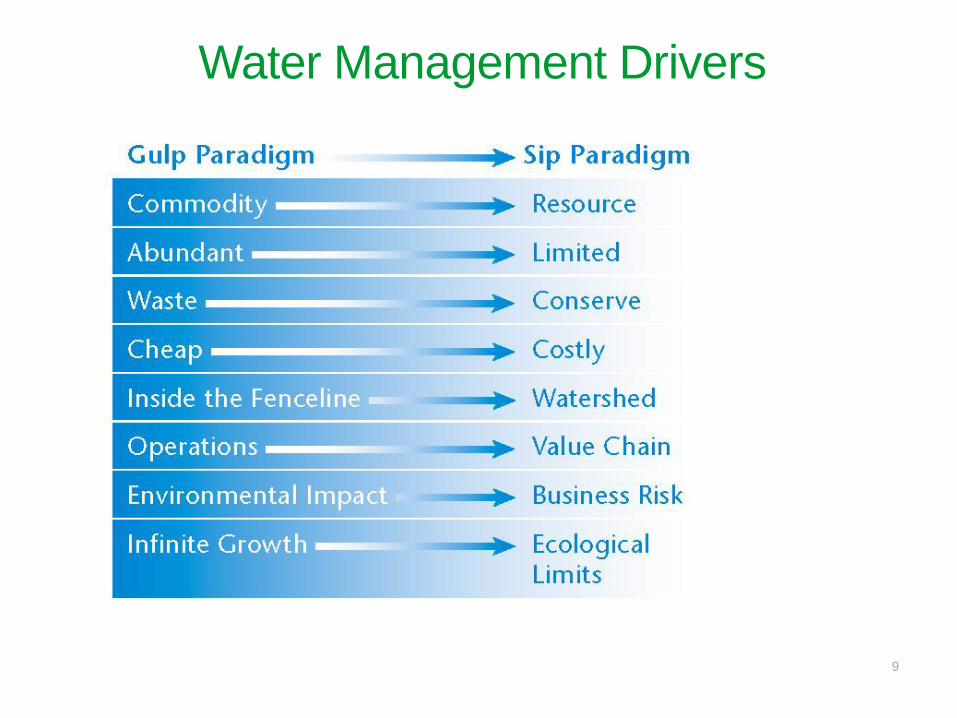
Water Management Drivers

Societal Must-HaveWater of adequate quality and quantity is shared among all users and is in a more sustainable balance
with the limits of renewable water resources and ecosystem requirements
Increasing business participation in reducing shared water risks
Increase Investments in
naturalwater
infrastructure
Strengthen business case and necessary
conditions to scale up investments and
incubate collaborative projects
From assessing risks to implementing response strategies at watershed level in collaboration with other stakeholders
Increase waterefficiency in
Agro-forestry
Improve water efficiency across key points of the agriculture and forestry
value chains
Scale up water reuse & resource
recovery
Implementation of the 5R approach (reduce,
recycle, reuse, recover, replenish) towards a more circular water
management
Increase water, energy, climate
change mitigation and resilience
Identify co-optimized solutions to water and energy security in the
context of climate change
Contribute to universal access to
safe water and sanitation (WASH)
Ensure access to safe WASH for all employees
in all locations under company control
Advocacy, communications, awareness-raising, valuing, measuring, reporting
Water valuation Data and information management (Tools: GWT, IWT, Earth Genome)
Reduce marine plastics pollution
Reduce marine debris by ensuring a better land
based waste management
Water programme

Sustainable Development Goals & Water
11

SDG Goal 6: Ensure availability & sustainable management of water and sanitation for all
Target 6.1/6.2: By 2030, achieve universal and equitable access to safe and affordable drinking water for all; By 2030, achieve access to adequate and equitable sanitation and hygiene for all and end open defecation, paying special attention to the needs of women and girls and those in vulnerable situations
Target 6.3: By 2030, improve water quality by reducing pollution, eliminating dumping and minimizing release of hazardous chemicals and materials, halving the proportion of untreated wastewater and substantially increasing recycling and safe reuse globally
Target 6.4: By 2030, substantially increase water-use efficiency across all sectors and ensure sustainable withdrawals and supply of freshwater to address water scarcity and substantially reduce the number of people suffering from water scarcity
Target 6.6: By 2020, protect and restore water-related ecosystems, including mountains, forests, wetlands, rivers, aquifers and lakes
SDG Goal 14: Conserve & sustainably use the oceans, seas and marine resources for sustainable development
Target 14.1: By 2025, prevent and significantly reduce marine pollution of all kinds, in particular from land-based activities, including marine debris and nutrient pollution
Target 14.2: By 2020, sustainably manage and protect marine and coastal ecosystems to avoid significant adverse impacts, including by strengthening their resilience, and take action for their restoration in order to achieve healthy and productive oceans
WBCSD Societal Must-Have for WaterWater of adequate quality and quantity is shared among all users and is in a more sustainable balance with the
limits of renewable water resources and ecosystem requirements
WASH Pledge: ensure access to safe WASH for all employees
Scale up industrial water reuse & resource recovery
Natural infrastructure for business
Water, energy & climate change resilience
Improve land waste management to reduce marine debris
Increase water efficiency in agriculture
Collective learning, decision-making tools, multi-stakeholder partnerships, advocacy & communications
Water stewardship: Increasing business participation in reducing shared water riskTarget 6.5: By 2030, implement integrated water resources management at all levels, including through transboundary cooperation as appropriate
WBCSD & NBI Water
Week
Water Stewardship: business
case, milestones & trends
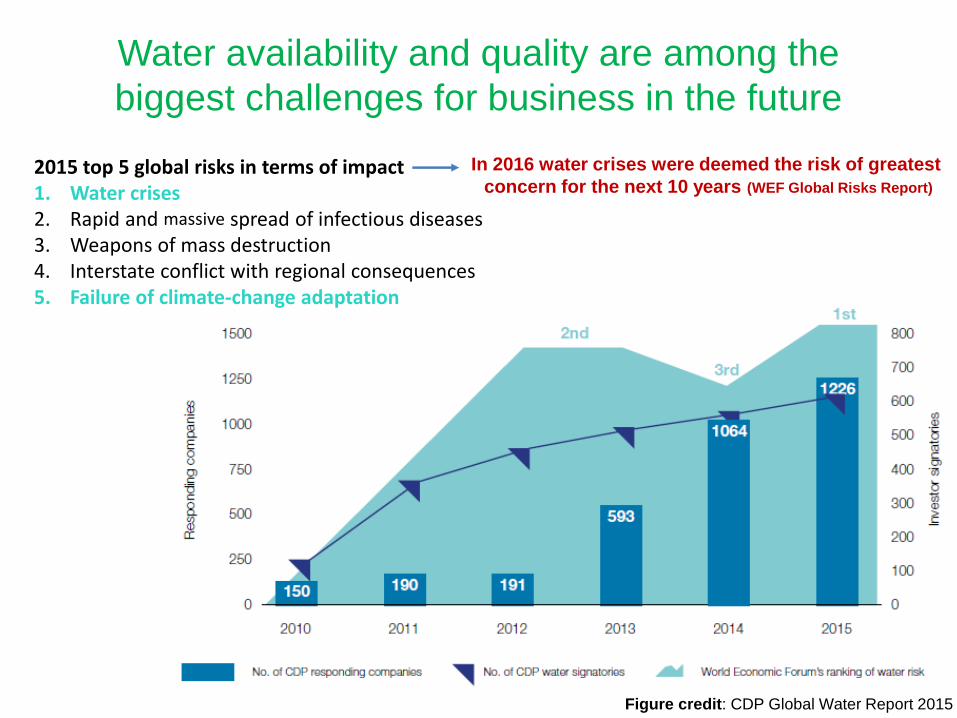
Water availability and quality are among the
biggest challenges for business in the future
Figure credit: CDP Global Water Report 2015
2015 top 5 global risks in terms of impact1. Water crises 2. Rapid and massive spread of infectious diseases 3. Weapons of mass destruction 4. Interstate conflict with regional consequences 5. Failure of climate-change adaptation
In 2016 water crises were deemed the risk of greatest
concern for the next 10 years (WEF Global Risks Report)

Definition of water stewardship
Progression of increased improvement of water use and a reduction in the water-related impacts of internal and value chain operations. More importantly, it is a commitment to the sustainable management of shared water resources in the public interest through collective action with other businesses, governments, NGOs and communities (WWF).

2006 2007 2009
Reporting
Guidelines
2011 2013 2014 2015
Corporate Water
Disclosure Guidelines
Water Stewardship
Standard
Aqueduct Water Risk Atlas
Framework for
21rst
century water risk
management
ISO 14046
Water Footprint
Principles, requirements,
guidelines
Global Water
Footprint
Standard
Water Risk Filter
2012 2010
Global
Water
DisclosureR
eport
Guide to water
related collective
action
Water for
Biz v3 Water
Risk
Valuation
Tool
European
Water
Stewardship
Standard
WBCSD
Guide to water
valuation
A dynamic landscape
Water Governance
Principles
Risk management tools
Disclosure guidance
Management guidance

17
Previous WBCSD Roles
1. Developer – The Global Water Tool (2007 + regular upgrades)
– Customizations to power, oil & gas and cement
2. Collaborator– The GEMI Local Water Tool (2012)
– The Ceres Aqua Gauge (2011)
3. Business voice– E.g. Water Footprint Network (consolidated
feedback provided in June 2010), AWS, ISO
4. Clarifier (promote harmonization)– Water for Business e-Report (2012)
– Identify complementarities, communicate business
needs and promote dialogue

Research project on corporate water strategies
WHAT?
• How do companies
become aware of water
risks?
• How do companies
respond to water risks?
• In-depth understanding of
the strategic rationale
behind engaging in water
stewardship
WHO?
• Ongoing Project in
partnership with ETH Zurich
• Chair for Sustainability and
Technology (SusTec)
• Julian Kölbel, Josefine
Billstrand, Daniel Schaller
• To be continued at MIT
Sloan School of Mgmt. in
Sep. 2016

12 companies from Food &
Beverage, Energy, and
Chemicals
Research Methodology
Sample Data Analysis
18 Interviews with company
representatives (954
minutes, totaling 275 pages
of transcriptions)
Extensive Media Analysis
Reports of the last 20 years
searched for the keyword
«water» (303 Reports,
23’031 pages)
Detailed Analysis of the
Responses to the 2014 CDP
water survey.
Computer Aided Text
Analysis, in codes
and subcodes.
Iterative Cycles
between Data and
Theory.
Cross-validation of
Interview Data with
archival Data.
1168 Codes in 8
hierarchy levels.
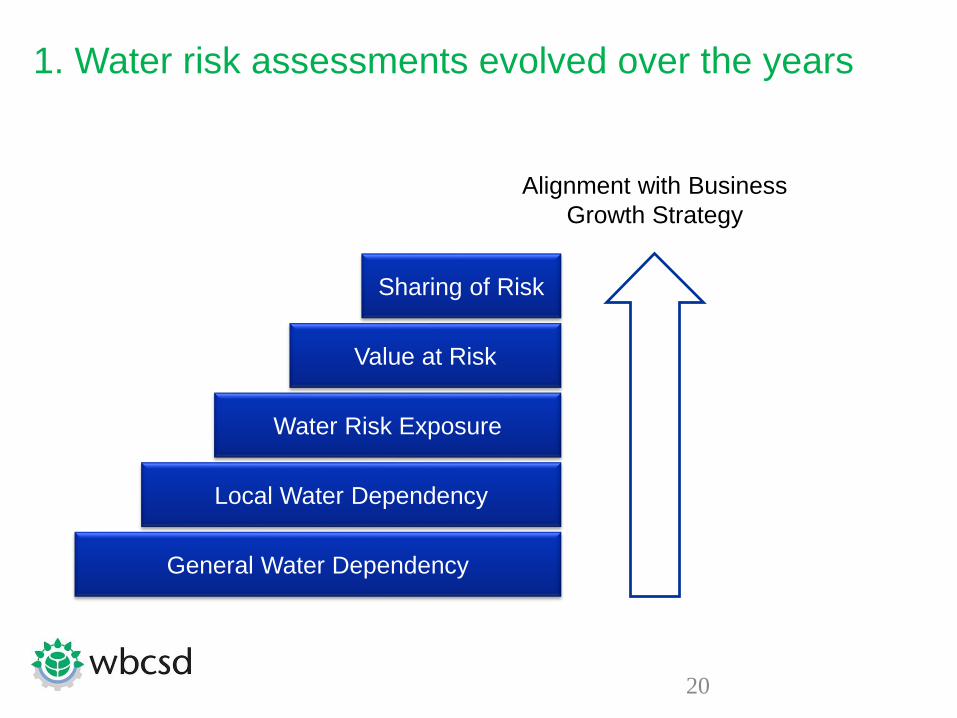
Alignment with Business
Growth Strategy
20
1. Water risk assessments evolved over the years
General Water Dependency
Local Water Dependency
Water Risk Exposure
Value at Risk
Sharing of Risk

21
2. Water Strategy is two-dimensional
1. Risk Exposure
what is the potential damage to business growth?
2. Risk sharing
To what extent is this risk shared with other water
users?
Example:
Physical scarcity risks are shared, require collective action
Reputational risks are not shared, can be addressed internally

22
2. Water Strategy is two-dimensionalR
isk
ex
posu
re
Risk sharing
Water
management
Water
compliance
Water
stewardship
Water
responsibility
Collective action at watershed level
Become a member of a
water association
Comply with regulations
Use a substitute technology
CSR
Round-table discussions
Company-specific
partnerships with NGOs
Seasonal water storage
Certification
Fund an existing
project
Water treatment
Water efficiency
Water replenishment
Water recycling/reuseR&D
Develop industry
standards
Sell water solutions
Influence policy maker
Adopt an industry
standard

23
3. Implementing water strategy is a journey
Different companies aim for
different strategies.
Collective action is not the
right strategy for everyone.
All strategies require
adjustments within the
company, especially water
stewardship.
Ris
k e
xp
osu
re
Risk sharing

Skills: Staff that implement strategic
responses lack the skill-set required
for collective action
Internal resistance: Hard to
motivate the business case for
collective action to decision-makers
Low external credibility:
Stakeholders question the motives of
companies engagement
Low control: Companies consider
collective action as risky due to the
lack of direct control
Cross-functional workshops to
transfer knowledge & develop the
necessary skill set
Develop KPIs for actions beyond
the fence line
Do your own homework first and
partner up with high credibility
organizations
Share data and invest in
monitoring systems, build up trust.
Good data puts everyone on the
same page, trust is the basis of
collective action
3. Implementing water strategy is a journey

25
Three items for the water strategy journey
3
How Benefit
A compass to tell you where you are
All companies need to do a proper risk
assessment in order to understand their water
risk situation: Risk exposure and risk sharing
A map to tell you where to go
Based on this risk assessment, managers can
choose one of four basic strategies. This choice
must be aligned with the overall business
strategy.
Sturdy boots to pass obstacles on the way
Once the strategy is clear, managers have to
address skill gaps and barriers to make the
strategy a success.R
isk
exp
osu
re
Risk sharing
2
1

Growing gap between leading companies and
those that only start recognizing water risk &
opportunity
• Almost half of the companies (48%) fail to conduct comprehensive monitoring of water withdrawals and discharges.
• Only 24% of companies require their key suppliers to report to them or include suppliers in corporate risk assessment.
• Only 26% of companies consider water issues within the river
basin context, and just 12% consider a broad range of river basin stakeholders, such as their suppliers, in their water risk assessment.
• Only 11% of companies have water policies that can be
considered robust and comprehensive (i.e. companywide, KPIs set for direct operations and supply chains, clear goals and guidelines for action, recognition of human rights to water and sanitation).
Source: CDP Global Water Report 2015

Screening of WBCSD members sustainability reports
Out of 173
companies:
120 identify water as
material
72 companies set a target
for their direct operations
31 acknowledge their
indirect water impact
8 have set or are in the
process of setting targets for
their indirect water impact
% of companies per sector that identified water as material, defined a strategy with targets and indicators,
put in place an action plan and report on progress.

28
Have you identified your global water risks?
Do you understand your impacts at site?
What is your response and engagement strategy?
Shared risks shared
opportunities shared
responsibilities
Risk sharing
Risk exposure
WBCSD water stewardship journey

29
In your experience…
How do you understand water stewardship?
How has it evolved over the last 10 years in South Africa?
How can the impact of water stewardship interventions
best be monitored and measured? Would it be realistic to
develop KPIs and establish an opportunity cost of
engaging in collective action at watershed level?
How well is the business value of water being quantified?
(i.e. potential business value at risk from water risks)
What will it take to ensure that integration of water into
business strategy becomes the norm?
How well is water risk understood and addressed in
supply chains?

30

WBCSD & NBI Water
Week
The WBCSD Global Water Tool
in the context of water risk
mapping

2006 2007 2009
Reporting
Guidelines
2011 2013 2014 2015
Corporate Water
Disclosure Guidelines
Water Stewardship
Standard
Aqueduct Water Risk Atlas
Framework for
21rst
century water risk
management
ISO 14046
Water Footprint
Principles, requirements,
guidelines
Global Water
Footprint
Standard
Water Risk Filter
2012 2010
Global
Water
DisclosureR
eport
Guide to water
related collective
action
Water for
Biz v3 Water
Risk
Valuation
Tool
European
Water
Stewardship
Standard
WBCSD
Guide to water
valuation
A dynamic landscape
Water Governance
Principles
Risk management tools
Disclosure guidance
Management guidance

Why should business value water?
BUSINESS BENEFITS:
Enhanced business decisions
Maintain & Enhance revenues
Reduce costs
Manage risks
Enhance reputation

Business Guide to Water Valuation
Help business:
– Commission, manage and
review water valuation
studies
– Make best use of the
findings incl.
communicating the results
internally and externally

Tools mitigating corporate water risks
Have you identified your global water risks?
Phase I: Company-wide water risk assessment to determine value at risk &
identify most at risk areas
Do you understand your impacts/solutions at site?
Phase II: Development of comprehensive water strategy, including
local action plans
What is your response and engagement strategy?
Phase III: Implementation of water stewardship strategies
- action outside the fence line with other users in the
watershed

36
Suite of tools to support better decision
making and action
Water Risk and Opportunity management

37
The Global Water Tool
Maps a company’s water use and helps assess risks by
comparing sites, suppliers and workers location with
external data
• How many of your sites are in water-scarce areas? Which sites
are at greater risk?
• How much of your total production is generated from your most-
at-risk sites?
• How many of your suppliers will be in water-stressed regions in
the future?
• How many of your employees live in countries that lack access to
water and sanitation?
“The Global Water Tool is the first step for any company to
make water-informed decisions”

What does it do?
Provides an automatic link between a
company’s global operations and almost 30
key external water data contextualizing use
Establishes relative water risks in a
company’s portfolio in order to prioritize action
Creates key water reporting indicators in
addition to inventories, risk and performance
metrics
Enables effective communication with internal
and external stakeholders

The datasets were selected to meet all of the
following criteria:
Global coverage
Availability in the public domain
Considered valid by the global community
of water stakeholders including
academics, non-governmental
organizations (NGOs), government
organizations and industry
Recent and regularly updated
Accuracy of mapping and geographical
distribution of the data
The original datasets have not been modified,
except for harmonizing the names of
countries across datasets.
Data selection
39
Data stored within the tool:
Joint Monitoring
Programme for
Water Supply
and Sanitation
Population Division of the Department of Economic
and Social Affairs of the UN Secretariat – UNDESA
(Country data)
Data stored on the WBCSD Server:
(Watershed and
Sub-basin data)

What is it not?
Not a detailed methodology to measure water
footprint – e.g. does not quantify and allocate
impacts
Does not provide specific guidance on local
situations, which requires more in-depth,
systematic analysis
Key limitation: lack of data/monitoring water
situation globally comparable – outputs will be
as robust as the quality of the data included

Key Outcomes
High level risk assessment across a
company’s global portfolio

The India Water Tool Story
June 2012
• No tool that did company-wise risk assessment, at a useful granularity and using Government data
• Scoping of Version 1
July 2013
• IWT v1 and v1.1 launch
• 1500 downloads in 6 weeks
April 2014
• Scoping IWT 2.0
• Working group of Industry and knowledge partners
• Coordination by WBCSD
Feb 2015
• IWT 2.0 Launch
• Over 10,000 unique visitors since launch (27th Feb ‘15)
2015-2017
• Promotion, Debugging, Updates
• Scoping and Development of Version 3
The first step for companies to understand their water risks and prioritize their water actions in India
Why India? 18% of the world’s population and 4% of the world’s usable water resources50% demand-supply gap estimated by 2030¹
¹Source: 2030 Water Resources Global Water Supply and Demand Model; Baseline agricultural
production based on IFPRI IMPACT-WATER base case

www.indiawatertool.in
ADD all your sites, and their
water withdrawal
SEE the water quality and
availability data for each location.
ANALYSE through reports for internal and
external use
14 publically available datasets
on a GIS platform-putting
business operations at the
center of data
Pan-India with block/taluka level
of granularity

A unique Indian partnership
Working Group of 13 members-ten
companies and three knowledge
partners, coordinated by WBCSD
Data providers: • Central Ground Water Board
• Ministry of Water Resources
• Central Pollution Control Board
• India Meteorological Department
• World Resources Institute
• Columbia Water Centre
IWT 2.0 is a unique example of collaboration between key players demonstrating the
leadership role of the industry in the critical area of Water Stewardship
April 2014 to Feb 2015

Our goal: Enable corporations to evaluate risks anduse nature-based solutions to increase water security
Focus on business solutions to water issues
• Enable cost effective watershed-level responses
• Empower collaboration to reduce shared water risk
• Increase investment in natural water infrastructure
• Provide a pathway to one day incorporate water valuation
Complement and build on existing tools
Key ObjectiveIdentify solutions to water risk

46
Water footprint, efficiency
Internalprocesses
Extended value chain
Awareness(My operations)
Redesign, Rethink(My operations)
Beyond My Company(Outside direct control)
true cost
Solving Systems(Broader ecosystem)
Water data and measurement
(internal operations)
New technology,water scarcity/ risk
(existing or new sites)
Transparency, collaboration
(localized to a watershed)
Green investment,water valuation
(spatial: global, regional, and local)
Focu
sA
ctio
nTo
ols
Too
lset
s
External, Solution focused
Internal, risk focused
1 2 43
Water: Our first prioritized focus area.Spectrum of where corporations can focus their water efforts

47
GIST: How the tool works
Where is the water?2 Can we improve this?3
Why is this breakthrough?1. Solutions, not just risk. We enable new and better outcomes2. Aimed at specific end-user decision contexts ($ financial)3. We “mash-up” dozens of datasets, apply science, and make
it easy for users via tools (fixing the signal-to-noise problem)
1 How much water?
Water. Arguably life’s most essential ingredient. It has dramatic environmental and social implications.
How does GIST help solve water issues?
• How do we get “more water when we want it, less water when we don’t?”
• How do we get water in the places it is most needed?
• What solutions can we implement, to improve whereand when there is water?

48
GIST Key Datasets (Page 1 of 3):Introduction
• Surface water (river, streams, lakes)• Reservoir locations• Streamflow• Land use land cover• Soil characteristics• Topography/ digital elevation map• Drainage/ routing• HAND (analysis)
Precipitation Key Datasets
Key Analytics: Water and energy balance (fluxes and storage), streamflowScience: Infiltration, P-ET (Precipitation minus Evapotranspiration), hydrodynamics (will be added in 2016)Resolution: 1/16 grid cell (~6km squared), with some data down to 30mTiming: Last 50 years, daily or semi-daily datasets (e.g. precipitation, temp, wind)GIST analytical/data output: How much water and where (past, present, future), given scenarios?
• Temperature, wind speed, humidity and solar radiation
Evapotranspiration = water loss (recycled to the atmosphere)?
Routing = Where does the water go, over time?Precipitation = water gain (inputs)?
How much water? 1 Where is the water?2
• Precipitation (e.g. rain, snow)• Temperature
Data for historical and future forecasted, by location (x, y, and z) and over time (t)
Evaporation Key Datasets
Evaporation = Water to the airTranspiration = Water within a plant and loss as vapor
Transpiration Key Datasets
• Types of vegetation, land use, soil cover, albedo, leaf area index (LAI)
Routing Key Datasets
In GIST v1 = focused on soil moisture (transient storage)

49
GIST Key Datasets (Page 2 of 3):Which key data inputs are used
Evapotranspiration = water loss? Routing = Where does the water go, over time?Precipitation = water gain?
How much water? 1 Where is the water?2
Streamflow
Land use land cover
Surface water bodies, urban link
Soil characteristics
Topography/ DEM
Routing
Climate (Forecasted)
Climate (Historical)
CMIP5
Vegetation
Albedo/ Leaf Area Index
MODIS: Moderate Resolution Imaging Spectroradiometer
Global Land Cover Facility

50
GIST Key Datasets (Page 3 of 3):Which key data inputs are used
What else factors into an optimization decision?How can we change land use to mitigate water risk?
3
Wetlands
Land use land cover
Population
Biodiversity
Land Ownership
Wetlands
Digital Elevation Model
Can we improve this?
Critical Habitats
USA Federal Lands
National Land Cover Data (via MRLC)
USA National Wetlands Inventory
Parcel Maps
Considerations – Other Data
Gridded Population
Nonindigenous Aquatic Species
National Wetlands InventoryGIEMS-D
HAND analysis(Height Above Nearest Drainage,
theoretical local draining potentials based on topography)
+
+
Climate Forcings
Compilation of multiple datasets
Routing
+
HydroSHEDS (based on NASA’s Shuttle Radar
Topography Mission – SRTM)

Initial Tool:Green Infrastructure Support Tool (GIST)
What is it?A tool to allow corporations to find the best options to enhance water quantity via nature-based solutions*
How does it work? Who is involved? Why is this valuable? What is the timing?Coordination:
End-Users:
Core Team:
• Key capabilities: Enables decisions that improve water storage and availability via wetland restoration
• User input: User-specified criteria
• Data: Aggregates data from over 30+ sources (NOAA, USGS, etc.)
• Science: Application of high-quality hydrological science
• Financial capabilities: Includes NPV, IRR, and ROI to compare options
• Format: Web-based, location specific map visualization (GIS)
* Green infrastructure options for water storage (e.g. restoring a historic wetlands or marshlands)
• Risk identification: Enables companies to identify current and future water stress areas
• Risk reduction: Prioritizes a portfolio of solutions using economic, social, and environmental ROI
• Reduce footprint: Estimates net impact on water for entire water basin
• Designed for decision making: Create visual outputs for engineers, executives, etc.
• December 2015 (Version 1): Tool for Brazos river pilot was ready for testing
• 2016: Extend functionality and geography to North America and global
• Other locations: Other pilot in the Ganges river basin in Indiato be evaluated

Brazos River Basin• River is 840 miles long
• Water for 1M+ people and industrial/ag users• About 6M acre-feet per year is discharged into the gulf
Texas• Shortfall is 3.6M acre-feet per year, growing to 7-8M ac-ft
• Drought causing over $10B per year in lost income• Texas Water Plan is looking at $B’s in water alternatives
Dow interested in exploring solutions to ensure water security.
Wants to consider broader watershed basin solutions where possible.
Dow Chemical’s Freeport Texas facility• Dow’s largest chemical plant
• Challenges given drought• Considering expensive gray solutions
WBCSD/ Earth Genome Water Tool:Initial Pilot in Texas: the Problem Statement

Potential Wetlands
WBCSD/ Earth Genome Water Tool:Enabling Investments in Green Infrastructure

Green Infrastructure Support Tool: Updates since prior Dow demo (Sept 30)
1. Slider now screens out low NPV sites (among all analyzed sites) 2. Slider now indicates which sites
have best ability to decrease 10 year frequency of low flows
5. Custom feature now draws area of exact $ size for that location
6. Added multiple layers: land cover, critical habitats, etc
7. Added WRI Aqueduct water risk and India Water Tool datasets
(showing interoperability)
4. Reviewed cost data with USDA to confirm wetland restoration costs
3. Can now manually adjust value of water and restoration costs
8. Cleaned up visuals, added legend
Others updates (not shown). a) Added cost graphs in pdf output b) added HAND analysis for India GBM basin c) GIST now works on Internet
Explorer d) GIST data storage and computation now in Microsoft Cloud

What next steps would you prioritize based on your company’s priorities?
• Essential to extend beyond US
to continue pushing data availability
• Put significant effort to India pilot (e.g. GIST
Ganga)? Possibly Europe extension?
Expand geography
• Water quantity water flooding, quality
• Surface water ground water
• Ecosystem services, biodiversity
• Coupled green + gray infrastructure
Expand modular functionality
• Agricultural tool
• New links to India Water Tool
• Urban green infrastructure (stormwater)
• Urban source water protection
Build new related tools
• Work with individual companies to prioritize
specific watershed collaborations
• Prioritize specific missing key water
datasets (e.g. ground water) valuable to all
Specific deep dive
For DiscussionWBCSD/ Earth Genome Water Tool:
What Happens Next

Agri solutions: touching several buttons

57
Breakout group discussion & plenary feedback
3 groups to discuss for 30 minutes: From tool to strategy: what is the value of existing water tools & their
relevance to South Africa? How does the usage of tools lead to
development and implementation of water management strategies? Do
they help make the case internally? What else is needed?
Data governance: what data is collected by companies to inform
decision-making? What data sources are available from government
and other stakeholders? What are the gaps? What can be incentives
for data transparency from government and business? What would be
incentives for collective monitoring and data sharing at basin level?
Plenary feedback (5 mins/group)
Plenary discussion about the insight generated by each
group (15mins): what are the gaps in data management and
tool usability in South Africa?

58

WBCSD & NBI Water
Week
Responding specifically: focus
on water reuse

By 2020, the management of water issues by businesses is value driven and follows the
5Rs approach (reduction, reuse, recovery, recycling, and when the occasion occurs,
replenishment) in the broader context of a more circular approach to resource
management and effective, cross sector watershed collaboration.
breaking through the silos of water, energy and waste at a systems levels
allowing the recovery of resources from wastewater (water, energy, nutrients…)
Together with a more effective treatment of effluents, this will contribute to ensure water
is available when and where it’s needed and water and other valuable resources are
used efficiently.
The focus is on own operations –
suppliers will be involved as part of
stewardship activities
and watershed collaboration.
Focus area: water reuseCo-chairs:

Water reuse and recycling, a solution to:
Reduce operational risks e.g. access to water (quality – quantity)
Secure license to operate while catering for environmental needs
Maintain production - increase yields / productivity - enable development of
operations
Generate cost savings and revenues
Why this workstream?
61
increasing demand on
water supply
climate change related
stress - variability
water quality issues
A range of risks has to be managed: operational,
reputational, regulatory, market, financial risks…
Will you have enough water to operate?
Will your suppliers have enough water to operate?
Can you secure your license to operate if water is scarce?
Is your productivity impacted by your employees’ poor health?
Do your customers have enough water to use your products?
Will you be able to secure access to capital and insurance?

With the aim to reveal new opportunities for co-optimized solutions and sustainable models
and inspire action (by problem owners, solution providers, and other stakeholders such as
regulators and policy makers), WBCSD members participating in this work stream will
demonstrate the business benefits,
facilitate a value-driven implementation of projects,
and build the global standard business decision support tools,
based on knowledge and experience of expert organizations:
The proposed alliance
62
Member
Companies
Global Network
Partners
Reuse & Resource
recovery cluster
+
+
Sector organisations such as

A work programme is being set up to move towards a more systemic approach to resources management and encourage water reuse
63
Key focus areas: Key deliverables:
Build collective learning (common
challenges, common understanding and
solutions) - identify next steps to be taken
to implement best practices more widely
Business guide to water reuse and a more
circular approach to water management
Support internal processes Tool to support business decision making
Foster collaboration among businesses,
across industries (industrial symbiosis),
across sectors (municipal, agriculture)
Demonstration pilots in specific geographies,
with a focus on novel collaboration practices, -
concerted efforts at a systems level
Improve the enabling environment
through communications and advocacy
Key messages on reuse, water valuation and on
the business solution (different sets aimed to
internal decision makers, financial/ insurance
community, general public, regulators, policy
makers…) delivered as part of a communication &
advocacy plan to have perceptions reconsidered

How relevant is the 5Rs approach to water to your
company?
What actions are already being implemented?
What are the barriers / challenges?
What are the enablers?
Would you like to get involved in the development of
the business guide?

WBCSD & NBI Water
Week
Responding specifically: focus
on natural infrastructure

Solution Group Members:
Companies: ARCADIS, Bayer, CH2M, Dow, DSM, Deloitte, EDF,
EDP, Eni, ERM, Fibria, Heineken, Jain Irrigation, JP Morgan Chase,
KPMG, Lafarge Holcim, Mitsubishi, Mondi, Monsanto, PepsiCo,
Pöyry, PwC, SABMiller, Shell, Suez Environnement, Suncor Energy,
Syngenta, Sweco Environment, Total, Vale, Veolia, Weyerhaeuser
Global Network: BEC Hong-Kong, CEBDS Brazil, EpE, Indonesia
BCSD, Philippine Business for the Environment, Sustainable
Business Australia, UK BCSD, US BCSD
Partners:
Assessing and investing in natural infrastructure becomes common practice by 2020
Focus area: natural infrastructure for businessin collaboration with Ecosystems & Landscape Management Cluster
Co-chairs:

SMITHGROUP JJR
What is natural infrastructure?
Natural Infrastructure is a planned or managed (often engineered), natural or
semi-natural system designed to fill a specific need.
In addition to providing the required function, NI can provide more categories of co-
benefits, when compared to traditional gray infrastructure.

Examples of business applications
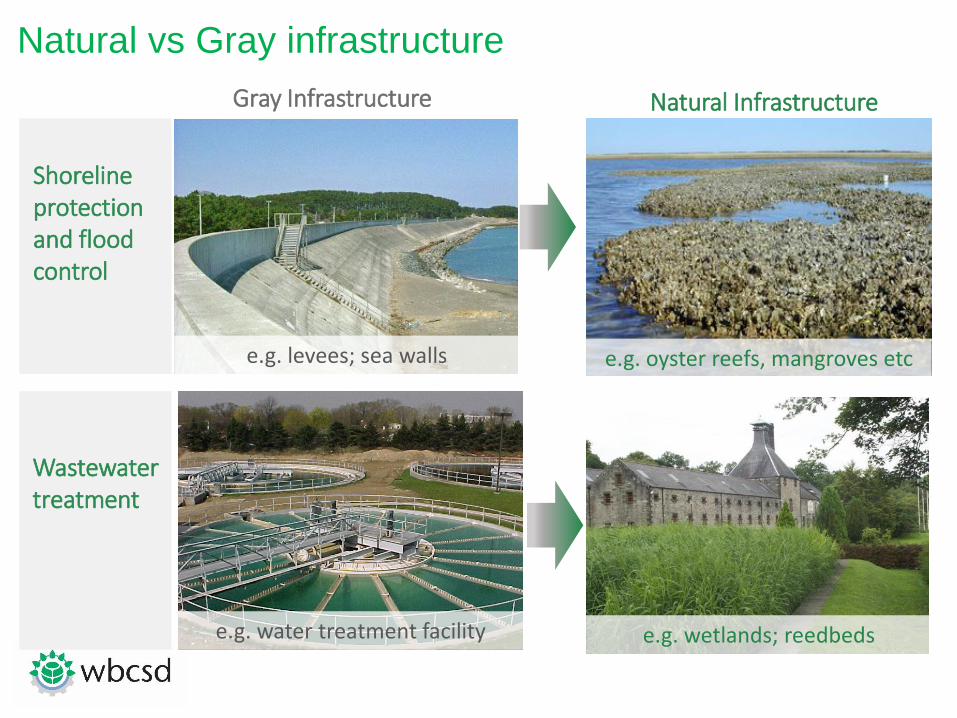
Natural vs Gray infrastructure
Shoreline protection and flood control
Wastewater treatment
e.g. water treatment facility
Gray Infrastructure Natural Infrastructure
e.g. wetlands; reedbeds
e.g. levees; sea walls e.g. oyster reefs, mangroves etc

Examples of natural infrastructure solutions

The Business Case for Natural Infrastructure
Direct Financial Benefits
Capital cost savings Operations & Maintenance savings
Return on investmentInnovation and
revenue creation

The Business Case for Natural Infrastructure
Environmental co-benefits
Mitigation of emissions (air / water)
Resources Conservation
Habitat creation, restoration, connectivity
Enhanced public health, communities, and livability

The Business Case for Natural Infrastructure
Social co-benefits
Operational Safety
Job creation and skill development
Social license to operate
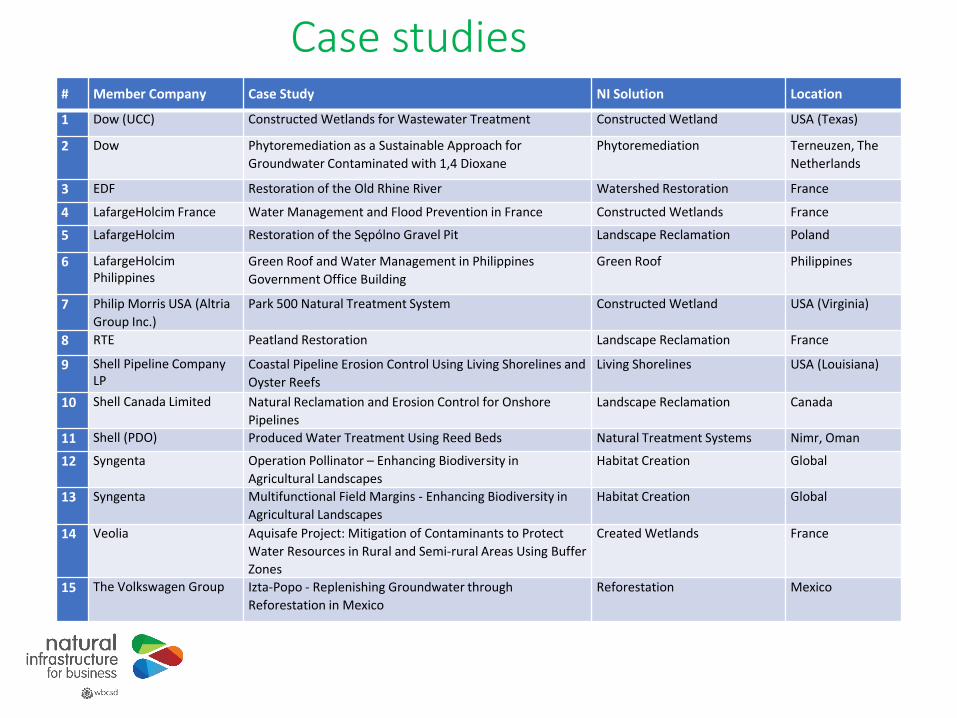
Case studies# Member Company Case Study NI Solution Location
1 Dow (UCC) Constructed Wetlands for Wastewater Treatment Constructed Wetland USA (Texas)
2 Dow Phytoremediation as a Sustainable Approach for
Groundwater Contaminated with 1,4 Dioxane
Phytoremediation Terneuzen, The
Netherlands
3 EDF Restoration of the Old Rhine River Watershed Restoration France
4 LafargeHolcim France Water Management and Flood Prevention in France Constructed Wetlands France
5 LafargeHolcim Restoration of the Sępólno Gravel Pit Landscape Reclamation Poland
6 LafargeHolcim Philippines
Green Roof and Water Management in Philippines
Government Office Building
Green Roof Philippines
7 Philip Morris USA (Altria
Group Inc.)
Park 500 Natural Treatment System Constructed Wetland USA (Virginia)
8 RTE Peatland Restoration Landscape Reclamation France
9 Shell Pipeline Company LP
Coastal Pipeline Erosion Control Using Living Shorelines and
Oyster Reefs
Living Shorelines USA (Louisiana)
10 Shell Canada Limited Natural Reclamation and Erosion Control for Onshore
Pipelines
Landscape Reclamation Canada
11 Shell (PDO) Produced Water Treatment Using Reed Beds Natural Treatment Systems Nimr, Oman
12 Syngenta Operation Pollinator – Enhancing Biodiversity in
Agricultural Landscapes
Habitat Creation Global
13 Syngenta Multifunctional Field Margins - Enhancing Biodiversity in
Agricultural Landscapes
Habitat Creation Global
14 Veolia Aquisafe Project: Mitigation of Contaminants to Protect
Water Resources in Rural and Semi-rural Areas Using Buffer
Zones
Created Wetlands France
15 The Volkswagen Group Izta-Popo - Replenishing Groundwater through
Reforestation in Mexico
Reforestation Mexico

Business Case

How can I get started?
DECISION TREEIs my project suitable for
considering natural infrastructure options? CHECKLIST
How do I appropriately evaluate infrastructure investment
alternatives?
PROJECTSELECT TOOLCompare alternative scenarios
OTHER TOOLSValuation, Risk Assessment, Spatial
Modelling, Spatial Planning

Natural Infrastructure for Business Platform
Business case studies
Business case for investing in natural infrastructure
Tools: decision tree, check list, cost-benefit analysis tool, tool fact sheets
Capacity Building program(Apr. 2016)
www.ni4biz.org

Have you already implemented natural
infrastructure solutions within your company?
What are the main business drivers from your
point of view?
How applicable are natural infrastructure
solutions in South Africa? Are there conducive
regulations?

WBCSD & NBI Water
Week
Responding specifically: focus
on WASH

A WBCSD Action2020 businesssolution to contribute to theachievement of universal access tosafe water, sanitation and hygiene(WASH)
Striking figures: > 1.8 billion people without access
to safe drinking water > 4 billion without access to
adequate sanitation Washing hands with soap can
significantly cut the risk of diarrheaby 40%
Context
Photo credit: WSSCC
WASH at the workplace Pledge – December 2015

What is the WASH Pledge? Commitment: By signing the Pledge, companies commit to
implementing access to safe water, sanitation and hygiene at theworkplace at an appropriate level of standard for all theiremployees in all premises under direct company control within 3years.
Scope of commitment Concerns only direct operations - implementation across the value chain
(extended supply chains, employees’ homes & communities) not part of thecommitment (though addressed by choice by some signatories)
A non-legally binding commitment - aimed to be integrated into existingcompany processes rather than responding to an externally imposedrequirement
No formal reporting requirements - although communication both externallyand with the WBCSD is highly encouraged
WBCSD Support for implementation – WASH Pledge Helpdesk, Self-Assessment tool & Guiding principles(http://www.wbcsd.org/washatworkplace.aspx)
WASH at the workplace Pledge – December 2015

Why should you sign? (1/2)
Impact & Leadership :
Opportunity to demonstrate leadership The Pledge is the only business-led initiative directly tackling
access to safe WASH at the workplace An opportunity to show leadership by being among the first 50
signatories worldwide Demonstrate compliance with internationally recognized
standards
An impactful action Concrete contribution to global objectives such as the Human
Right to Water and Sanitation and upcoming SDGs Participate in creating a global business momentum A WBCSD Action 2020 Business solution
WASH at the workplace Pledge – December 2015

Why should you sign? (2/2)
The business case Investing in safe WASH for employees leads to:
A healthier and more productive workforce It is estimated that for every US$1 invested in water and sanitation, US$4.3
is generated in economic returns through increased productivity.1
Expanded and more vibrant markets In developing countries, providing safe drinking water to an additional 10%
of the population increases per-capita GDP growth by over 2% per year.2
Improved public perception and increased brand value Lower reputational risks and more secured social license to
operate
WASH at the workplace Pledge – December 2015
1 Hutton, G., “Global Costs and Benefits of Drinking-Water Supply and Sanitation Interventions toReach the MDG Target and Universal Coverage,” World Health Organization, WHO/HSE/WSH/12.0, Geneva, Switzerland, 2012. (http://whqlibdoc.who.int/hq/2012/WHO_HSE_WSH_12.01_eng.pdf)
2 Frontier Economics, “Exploring the Links Between Water and Economic Growth,” A ReportPrepared for HSBC, June 2012. (http://www.thewaterhub.org/wp-content/uploads/2012/06/FINAL-Frontier-Report-June2012.pdf)

Pledge Guiding Principles & Self-Assessment tool / Implementation stories @http://www.wbcsd.org/washatworkplace.aspx
Establish Baseline of Operations
Perform Self-Assessment*
Prioritize Gaps*
Develop & Implement
Improvement Plan*
Disclose & Communicate
Straightforward implementation
Global Water Tool
Self-Assessment
Tool
Cases studies, learning &
sharing platform
Cf. decision tree, Guiding Principles page 11
WASH at the workplace Pledge – December 2015
The WBCSD puts at the disposal of signatories a set of non-mandatory implementation tools, which synthesize commonly accepted international standards from the most recognized sources in the field.
Suggested implementation framework
* At each site of operation

E.g. of a decision tree: improvement steps for internal operations
Source: Pledge Guiding Principleshttp://www.wbcsd.org/washatworkplace.aspx
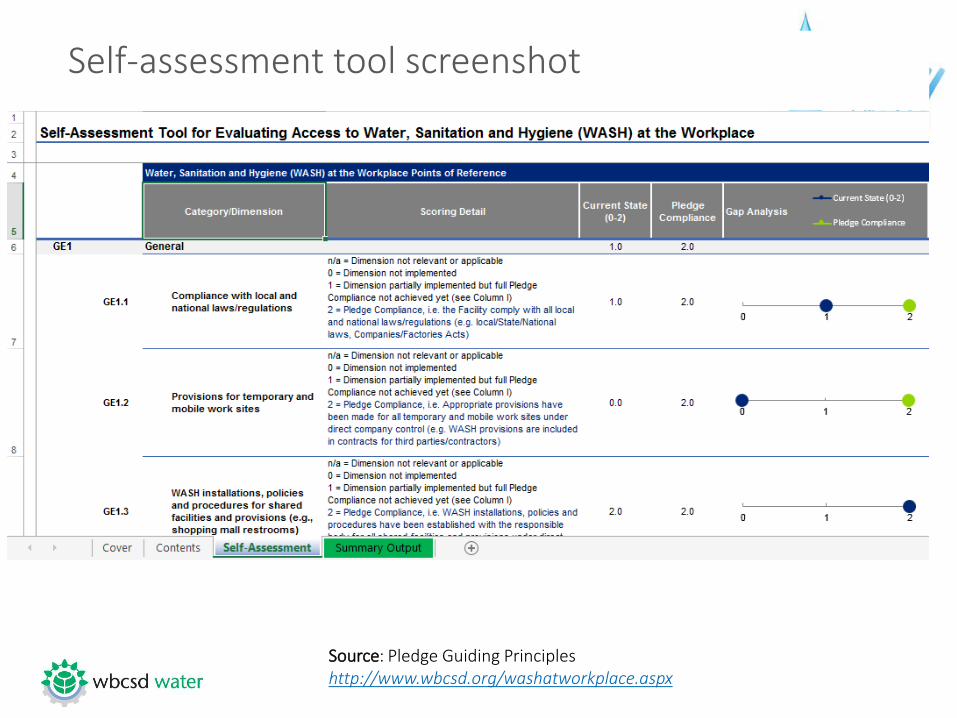
Self-assessment tool screenshot
Source: Pledge Guiding Principleshttp://www.wbcsd.org/washatworkplace.aspx

WASH at the workplace Pledge – December 2015
40 signatories*, with over 2.2 million employees from 14 business sectors covered by the Pledge, and the movement is growing
0
5
10
15
20
25
30
0
200000
400000
600000
800000
1000000
1200000
1400000
1600000
1800000
Se
p-1
3
Nov-1
3
Jan
-14
Ma
r-1
4
Ma
y-1
4
Jul-
14
Se
p-1
4
Nov-1
4
Jan
-15
Ma
r-1
5
Num
ber
of
sig
nato
ries
Num
ber
of
em
plo
yees
The WASH Pledge community
WASH Pledge Signatories - By sector
Chemicals Services Cement
Utilities & power Forest & paper products Agriculture
Tires Conglomerate Oil & gas
Mining & metals Healthcare Consumer goods
Food & beverage Construction
Within the WASH Pledge Community, a large emphasis is put on Sharing & Learning through:• Sector specific guidance • Workshops & webinars
• Peer-to-peer exchange • Case studies
*plus 4 SMEs

WASH at the workplace Pledge – December 2015
Case study 1 – EDF
Pilot at Nam Theun 2 hydro scheme, Laos Application of Pledge to 35 mobile remote
worksites (during construction phase – 9000 workers at the peak)
Inclusion of Pledge reference points in a specific Commission for HES & EDF’s CSR Agreement
Implementation: simple, efficient & compliant with international standards Toilet design & bathing facilities taking into account
local cultural specificities Drinking water and wastewater treatment
Moving beyond the fence - Access to Safe WASH insurrounding communities the Downstream Social Program provided > 156
riparian villages downstream (132 000 people) withaccess to safe WASH. 521 boreholes equipped withhand pumps
Industry: Utilities Signature: Sept 2013 Employees: 158,000

WASH at the workplace Pledge – December 2015
Case study 2 – Nestlé
Industry: Food & beverage Signature: Sep 2013 Employees: 339,000
Nestlé’s W.A.T.E.R. Commitments Water efficiency, water policies/stewardship, water discharge, supplier
engagement, improve WASH along the value chain Pledge sits within commitment on water policies/stewardship (support
to WBCSD) and improve WASH (internal roll-out)
Business case for Nestlé Building a resilient work force Leadership on water stewardship journey Putting into practice Corporate Business Principles and public
commitments on water stewardship
Rolling out the Pledge: globally By end 2015: assess gaps and implement actions Workshop and training on WASH assessment tool with all sites (factories
and offices) Audits across all sites based on self assessment tool
Beyond the fence activities, Nestlé India Clean drinking water projects: 223 projects in village schools, over
94,000 beneficiaries Water awareness program: 51,000 students Sanitation projects: + 100 projects, 36,000 beneficiaries

WASH at the workplace Pledge – December 2015
Case study 3 – Vedanta Resources
Industry: Mining & metals Signature: Oct 2014 Employees: 80,000
Significant challenges in implementing WASH standards Mines and smelters are mostly located in remote areas where standard of living basic
& health and hygiene standards are low Statutory requirements vary across regions and countries
Pledge roll-out to subsidiary Subsidiary CEOs signed Pledge internally in support of group’s commitment Group companies action plans reviewed by corporate, planned inter-company audit,
performance report FY 2016-17
Self-assessment result: 70 – 100% compliance, needs mainly on systems and review mechanisms (low capex required) Areas of improvement: temporary & mobile toilets at remote mines; internal policies
& procedures; provisions for regular inspection, maintenance & repair; water saving technologies & awareness campaigns

Convinced? – Join the 40 multinational company signatories of the WASH Pledge!
Any person in a position to commit the company can sign by sending a writtenstatement in an email to [email protected]
Example paragraph:This emails confirms that Name of the Company has committed to signing the ‘WBCSD Pledge forAccess to Safe Water, Sanitation and Hygiene at the Workplace’. We recognize that by signing thisPledge, Name of the Company commits to implementing access to safe water, sanitation and hygieneat the workplace at an appropriate level of standard for all employees in all premises under our directcontrol within three years of signing the Pledge.
The WASH Pledge is open to the entire business community. Non-WBCSD members areinvited to follow the lead set by members.
WASH at the workplace Pledge – December 2015

Themes for collective learning• How to drive WASH standards to an international level in cases
where domestic legislation on water and sanitation is weak?
• Once a company’s own house is in order, what are the challenges in addressing safe access to WASH in supply chains?
• How to raise awareness among your workforce in cultural contexts where there is little knowledge on WASH issues?
• How to implement WASH standards in leased office space and among hired janitorial staff?
• What do WASH standards mean in an agricultural / forestry context or in complex, remote operations such as underground mining sites?
• How can a company engage with communities re. access to safe WASH?

Can you say with confidence that all of your
employees have access to safe WASH at the
workplace?
Once a company’s own house is in order,
what challenges can you foresee in ensuring
access to safe WASH in supply chains?
Do you or are you looking to engage with
communities re. access to safe WASH?

THANK YOU!
Alex McNamara, Program Manager, Climate Change & Water, [email protected]+27 (11) 544 60 13
Joppe Cramwinckel, Director, Water,[email protected]+41 22 839 31 25
Tatiana Fedotova, Manager, [email protected]+41 22 839 31 37