Embed Size (px)
Citation preview

Copyright © WCST-2015 Published by Infonomics Society ISBN 978-1-908320-53-7CFP1580P-USB
Sponsors
In Cooperation With
Edited By
Charles A. Shoniregun
Galyna A. Akmayeva
World Congress on Sustainable Technologies (WCST-2015)
Technical Co-sponsored by IEEE UK/RI Computer Chapter
December 14-16, 2015, London, UK
WCST-2015 Proceedings
Contents Page Welcome Speech Executive Committees Keynote Speakers
Workshops Sessions PhD / Doctorate Consortium

WCST-2015
December 14-16, 2015, London, UK
Heathrow Windsor Marriott Hotel Ditton Road, Langley
Berkshire SL3 8PT
Tel: +44 (0)1753 598 181 Fax: +44 (0)1753 598 157
World Congress on Sustainable Technologies (WCST-2015)
Copyright © 2015 Technical Co-Sponsored by IEEE UK/RI Computer Chapter 2

Message to WCST Participants
Welcome to the World Congress on Sustainable Technologies (WCST-2015). The WCST-2015 is a conference that
provides opportunity for academicians and professionals to bridge the knowledge gap and to promote research
esteem.
The WCST-2015 received 375 papers from 32 countries of which 53 were accepted after the first review and 29
papers were finally accepted for presentation. The double blind paper evaluation method was adopted to evaluate
each of the conferences submissions. Please note that selected papers will be invited for publications in high
impact International Journals.
Many people have worked very hard to make this conference possible. We would like to thank all who have helped
in making WCST-2015 a success collaborative conference. The Steering Committee and reviewers each deserve
credit for their excellent job. We thank the authors who have contributed to the conference and all our Keynote
Speakers: Professor Kevin Warwick, Dr Martin Visser, Professor Maryline Chetto, Professor Frank Wang, Dr Aspen
Olmsted and Professor Frank Geels, for agreeing to participate in WCST-2015. We will also like to acknowledge
our appreciation to the following organisations for their sponsorship and support: IEEE UK/RI Computer Chapter,
Infonomics Society, Coventry University, Brunel University, University of Kent, University of Manchester, University
of Nantes, BeeCA Consultancy, College of Charleston and Canadian Teacher Magazine. The long term goal of
WCST-2015 is to build a reputation and respectable conference for the international community. On behalf of the
WCST-2015 Executive members, we would like to encourage all the attendees to contribute to the future of WCST
as authors, speakers, panellists, and volunteer conference organisers.
We wish you a pleasant stay in London, and please feel free to exchange ideas with other colleagues.
Charles A. Shoniregun, Infonomics Society, UK and Ireland
Frank Zhigang Wang, University of Kent, UK
World Congress on Sustainable Technologies (WCST-2015)
Copyright © 2015 Technical Co-Sponsored by IEEE UK/RI Computer Chapter 3

Contents Page Welcome Message 3 Contents Page 4 Executive Committees 7 Technical Programme Committees 7
Keynote Speakers 9
Distinguished Keynote Speaker: Professor Kevin Warwick 10 Keynote Speaker 1: Professor Frank Z. Wang 11 Keynote Speaker 2: Dr Martin Visser 12 Keynote Speaker 3: Dr Aspen Olmsted 14 Keynote Speaker 4: Professor Frank Geels 15 Keynote Speaker 5: Professor Maryline Chetto 16
PhD and Doctorate Consortium 17
(Organiser: Charles A. Shoniregun) 18
Workshop 19
Workshop 1 (Part I): Efficient Use of Resources in Steel Plants through Process Integration (REFFIPLANT)
20
Applied Investigation on Waste Minimization in an Integrated Steel Site (Authors: Johan Riesbeck, Kararina Lundkvist, Mats Brämming, Anita Wedholm)
21
Integrated Optimisation of Blast Furnace Gas Wash Water Treatment, Reuse and Cost Savings Part I: Methodological Approach (Authors: Mansour Saiepour, Kokil Jain, Yuhang Lou)
27
Resource Efficiency in the Strategic Research Agenda of the European Steel Technology Platform (Authors: Klaus Peters, Valentina Colla, Enrico Malfa, Louis Brimacombe)
34
Workshop 1 (Part II): Efficient Use of Resources in Steel Plants through Process Integration (REFFIPLANT)
40
Integrated Optimisation of Blast Furnace Gas Wash Water Treatment, Reuse and Cost Savings. Part II: Analysis of Field Trials (Authors: Mansour Saiepour, Kokil Jain, Yuhang Lou)
41
World Congress on Sustainable Technologies (WCST-2015)
Copyright © 2015 Technical Co-Sponsored by IEEE UK/RI Computer Chapter 4

Simulation Techniques for an Efficient use of Resources: An Overview for the Steelmaking Field (Authors: Ismael Matino, Valentina Colla, Lea Romaniello, Felice Rosito, Luigi Portulano)
48
Process Integration in Steelmaking Experiences and Challenges from the PRISMA Excellence Centre (Author: Mikael Larsson)
55
Sessions 61
Session 1: Sustainability and Policy 62
Identifying the Disruptive Potential of Sustainable Innovations: A Case of e-Mobility (Author: Angela Janke, Magdalena Mißler-Behr)
63
Impacts of E-Commerce on Construction Materials Procurement for Sustainable Construction (Authors: Solanke B.H., Fapohunda J.A.)
65
Examining the Implantation of Sustainability into State Procurement Decision models: An Experiential Overview of the Nigerian Public Sector (Author: Victor O. Adebayo)
71
An Investigation into the Costs and Benefits of Green Building in South Africa (Authors: Shallyne Sundayi, Vittorio Tramontin, Claudia Loggia)
77
Session 2: Internet Applications, Technology and Security 83
Optimal QoS Service Selection in Ad-Hoc Mobile Market Using Analytical Hierarchy Model (Authors: Ayotuyi T. Akinola, Matthew O. Adigun, Alaba O. Akingbesote)
84
Method for Anonymity of Authenticated Messages in SNS (Author: Ryuya Uda)
89
Interactive E-Book Design and Development to Support Literacy Learning for Language Minority Students (Authors: Muneeroh Phadung)
95
Performance Monitoring of Virtual Machines (VMs) of Type I & II hypervisors with SNMPv3 (Authors: Asif Iqbal, Colin Pattinson, Ah-Lian Kor)
98
Session 3: Sustainable Technologies and Sustainable Building Design 100
Construction Approaches to Enhance Sustainability in Affordable Housing in Developing Countries (Authors: Bashir O. Ganiyu, Julius A. Fapohunda, Rainer Haldenwang)
101
Data Centre Energy Efficiency (Authors: Nabil Hadj-Ahmed, Colin Pattinson)
108
A Low Cost Functional Electrical Stimulation (FES) System for Essential Tremor Suppression Using off the Shelf Components (Authors: Awais Shafique, Hooriya Anam, Muhammad Arsalan Javed)
110
World Congress on Sustainable Technologies (WCST-2015)
Copyright © 2015 Technical Co-Sponsored by IEEE UK/RI Computer Chapter 5

Session 4: Sustainability 115
Sustainable Water and Energy Use for Irrigation Demands (Author: Bojan Đurin)
116
Development of a Mobile Application for Home Energy Management in Smart Grids (Authors: Imane L’hadi, Mohammed Bakr Sikal, Sarah Lahtani, Ahmed Khallaayoun, Rachid Lghoul)
123
Home Composter: Domestic Use Composter (Authors: Nithika Sailesh, Vikas Shinde)
130
Session 5: Sustainability 133
Simulated and Real Pneumatic Plant Intelligent Controlling Via a Low Budget Interface Board (Authors: Michail Papoutsidakis, Dimitrios Piromalis, Dimitrios Tseles)
134
Economic Optimisation for a Building with an Integrated Micro-grid Connected to the National Grid (Authors: Phan Quang An, Michael D. Murphy, Michael C. Breen, Ted Scully)
140
Experimental and Numerical Simulation of Two Iranian Badgirs in the Persian Gulf, City of Kong and Laft (Authors: G. R. Dehghan-Kamaragi, B. Chanetz)
145
Performance Evaluation of the Electro-Coagulation Treatment Process for the Removal of Total Suspended Solids and Metals from Water (Authors: Hariraj Singh, Brijesh Kumar Mishra)
150
Study on Impacts of Auto-Rickshaws on Fuel Consumption and Delay of Personal Vehicles (Authors: Prasenjit Adak, Suresh Pandian Elumalai, Ravi Sahu)
154
World Congress on Sustainable Technologies (WCST-2015)
Copyright © 2015 Technical Co-Sponsored by IEEE UK/RI Computer Chapter 6

WCST-2015 Executive Committees
General Chair
Charles A. Shoniregun, Infonomics Society, UK and Ireland
Steering Committee Chair
Frank Zhigang Wang, University of Kent, UK
Steering Committees
John Barrett, University of Leeds, UK Ion Tutanescu, University of Pitesti, Romania
Liang-Jie (LJ) Zhang, Kingdee International Software Group, China Paul Hofmann, Saffron Technology, USA
Nick Savage, University of Portsmouth, UK
International Chair
Ayahiko Niimi, Future University-Hakodate, Japan
Publication Chair
Galyna Akmayeva, Infonomics Society, UK and Ireland
PhD Student Forum Chair
Robert M. Foster, University of Wolverhampton, UK
Technical Programme Committee Chair
Roberto Pereira, University of Campinas (UNICAMP), Brazil
Technical Programme Committees
Israel Koren, University of Massachusetts, USA Hicham Adjali, Kingston University, UK
Javier Alonso, Technical University of Catalonia, Spain Mani Krishna, University of Massachussets, USA
Narimantas Zdankus, Kaunas University of Technology, Lithuania Roderick Lawrence, University of Geneva, Switzerland
Andrew Geens, University of Glamorgan, UK Alan Brent, Stellenbosch University, South Africa
Adel Gastli, Sultan Qaboos University, Oman Hakan Aydin, George Mason University, USA
Motamed Ektesabi, Swinburne University of Technology, Australia Jean-Michel Lavoie, Université de Sherbrooke, Canada
Amip Shah, Hewlett-Packard Company, USA Jamal Zemerly, KUSTAR, UAE
Safwan El Assad, Polytech'Nantes, France Chan Yeob Yeun, KUSTAR, UAE
World Congress on Sustainable Technologies (WCST-2015)
Copyright © 2015 Technical Co-Sponsored by IEEE UK/RI Computer Chapter 7

Princely Ifinedo, Cape Breton University, Canada Charles k. Ayo, Covenant University, Nigeria
Zhixiong Chen, Mercy College, USA Youakim Badr, INSA de Lyon, France
Richard Chbeir, Université de Bourgogne, France Sead Muftic, KTH - Royal Institute of Technology, Sweden
Vyacheslav Grebenyuk, Kharkiv National University of Radioelectronics (KNURE), Ukraine Victoria Repka, The People's Access Education Initiative, Australia
Daniel Oberle, SAP Research CEC, Germany Daniel Mosse, University of Pittsburgh, USA
Vania Paula de Almeida Neris, Federal University of Sao Carlos – UFSCar, Brazil
World Congress on Sustainable Technologies (WCST-2015)
Copyright © 2015 Technical Co-Sponsored by IEEE UK/RI Computer Chapter 8

Keynote Speakers
World Congress on Sustainable Technologies (WCST-2015)
Copyright © 2015 Technical Co-Sponsored by IEEE UK/RI Computer Chapter 9

Distinguished Keynote Speaker
Kevin Warwick, is Deputy Vice-Chancellor (Research) at Coventry University. Prior that he was
Professor of Cybernetics at The University of Reading, England. His research areas are artificial
intelligence, control, robotics and biomedical engineering. He is a Chartered Engineer (CEng.)
and is a Fellow of The Institution of Engineering & Technology (FIET). He is the youngest
person ever to become a Fellow of the City & Guilds of London Institute (FCGI). He is the author
or co-author of more than 600 research papers and has written or edited 27 books (three for
general readership), as well as numerous magazine and newspaper articles on scientific and
general subjects. He has broadcast and lectured widely and holds various visiting
professorships.
Title: The Cyborg Experiments
Abstract: In this presentation a practical look is taken at how the use of implant and electrode technology can be
employed to create biological brains for robots, to enable human enhancement and to diminish the effects of
certain neural illnesses. In all cases the end result is to increase the range of abilities of the recipients. An
indication is given of a number of areas in which such technology has already had a profound effect, a key element
being the need for a clear interface linking a biological brain directly with computer technology.
The emphasis is clearly placed on experimental scientific studies that have been and are being undertaken and
reported on. The area of focus is notably the need for a biological/technological connection, where a link is made
directly with the cerebral cortex and/or nervous system. The presentation will consider the future in which robots
have biological, or part-biological, brains and in which neural implants link the human nervous system bi-
directionally with technology and the internet.
World Congress on Sustainable Technologies (WCST-2015)
Copyright © 2015 Technical Co-Sponsored by IEEE UK/RI Computer Chapter 10

Keynote Speaker 1
Frank Z. Wang is the Professor in Future Computing and Head of School of Computing,
University of Kent, UK. The School of Computing was formally opened by Her Majesty the
Queen. Professor Wang's research interests include cloud computing, big data, green
computing, brain computing and future computing. He has been invited to deliver keynote
speeches and invited talks to report his research worldwide, for example at Princeton University,
Carnegie Mellon University, CERN, Hong Kong University of Sci. & Tech., Tsinghua University
(Taiwan), Jawaharlal Nehru University, Aristotle University, and University of Johannesburg. In
2004, he was appointed as Chair & Professor, Director of Centre for Grid Computing at CCHPCF
(Cambridge-Cranfield High Performance Computing Facility). CCHPCF is a collaborative
research facility in the Universities of Cambridge and Cranfield (with an investment size of £40
million). Prof Wang and his team have won an ACM/IEEE Super Computing finalist award. Prof
Wang is Chairman (UK & Republic of Ireland Chapter) of the IEEE Computer Society and Fellow
of British Computer Society. He has served the UK Government EPSRC e-Science Panel and
the Irish Government High End Computing Panel for Science Foundation Ireland (SFI).
Title: Computer Evolution over the Next Decade: Fact or Fiction?
Abstract: Computers evolve fast and the processing power should double every two years by Moore's Law. That
would mean computers 10 years from now would be 32 times more powerful than the current models. In 2005,
Moore said that as transistors reach the atomic scale we may encounter fundamental barrier we can't cross. We
may get around that barrier by building a computer that works similarly to the human brain. However, most of
previous efforts to build brain-like computers have failed because it took about the same silicon area to emulate a
CMOS synapse as that needed to emulate a neuron. In theory, any realistic implementation of a synapse should
ideally be at least four orders of magnitude smaller than that required to build a neuron. The invention of the
memristor opens a new way to implement synapses. A memristor is a simple 2-terminal element, which means a
vast number of memristors could be integrated together with other CMOS elements, in a single chip.
World Congress on Sustainable Technologies (WCST-2015)
Copyright © 2015 Technical Co-Sponsored by IEEE UK/RI Computer Chapter 11

Keynote Speaker 2
Martin Visser have over 35 years of experience in the ICS environment. From engineer,
process information expert, project leader and ICS consultant to Security Officer Industrial
Control Systems. Waternet was more than 30 years my employer. For 10 years I was
responsible for the security of the entire ICS architecture, SCADA and PLC systems of
Waternet. My work consisted of drawing up security policies, conducting risk and GAP
analysis and assessments. Compiling and executing security awareness training programs
and giving ICS advisories. Providing ICS security presentations at home and abroad. From
2006 I have been the vice chairman of the Dutch Water-ISAC. In addition I was ICS security
consultant for the Dutch association of Drinking Water Companies and Dutch Waterboards
and I regularly attended ministerial ICS security working groups. As Waternet representative I
have been member of the security working group of the WIB (International Instrument User’s
Association). The WIB is the founder of the IEC62443-2-4 norm that describes the baseline
security standards and certification for ICS suppliers. In August 2015 I founded BeeCA, Bee
Cyber Aware, Consultancy. BeeCA is an advisory and consultancy office in Cyber security,
Cyber awareness and Information security for Supervisory Control And Data Acquisition
(SCADA), Industrial Control Systems (ICS), Programmable Logic Controller (PLC) and
Operational Technology (OT). As owner/consultant I have a strong focus on cyber security
for all aspects of Industrial Control Systems in critical infrastructures (utility, drinking- and
sewage water, energy). I have the experience and it is my passion to exchange information
and share knowledge with colleagues to create more ICS cyber security awareness from
board to floor and to make the ICS systems and architecture more robust and digital resilient
to be better prepared on the continuous current of increasing cyber threats. Recently I have
organized two cyber security events for the Water companies in the Netherlands.
Title: Swimming against the current – Dealing with ICS cyber threats in the Water Sector
Abstract: The Drinking Water Sector in the Netherlands is a vital part of the critical infrastructure of the
Netherlands. The Drinking Water companies are responsible for reliable and clean drinking water of sufficient
pressure and supply. Everybody trust tap water! The Waterboard companies are also part of the critical
infrastructure of the Netherlands. They are responsible for the quality and safety of the inside and outside dikes
which protect the Netherlands against an overflow of sea- and river water. Besides they are responsible for sewage
water treatment and clean surface water of the right level. In order to perform all these tasks reliable and safe ICS
and SCADA systems, PLC’s and network connections with a high availability are frequently used. All these
technologies also provide an increasing amount of process information shared at a later date with the business
information systems. The data integrity of this process data is of the utmost importance. Unfortunately ICS and
World Congress on Sustainable Technologies (WCST-2015)
Copyright © 2015 Technical Co-Sponsored by IEEE UK/RI Computer Chapter 12

SCADA systems, PLC’s, network components, network connections and data transfer protocols have digital
vulnerabilities and weaknesses which can affect the availability, integrity, reliability and confidentiality of the core
business of drinking water and water board companies.
In this presentation, I will discuss the current cyber threats, challenges and business concerns of the Water Sector
and what the Water Sector is doing to strengthen their digital resilience and to increase the efficiency and
effectiveness of their business operations.
World Congress on Sustainable Technologies (WCST-2015)
Copyright © 2015 Technical Co-Sponsored by IEEE UK/RI Computer Chapter 13

Keynote Speaker 3
Aspen Olmsted is an Assistant Professor at the College of Charleston. He obtained a Ph.D. in
Computer Science and Engineering from the University of South Carolina. Prior to his academic
career, was CEO for Alliance Software Corporation. Alliance Software developed N-Tier
enterprise applications for the performing arts and humanities market. Aspen’s research focus on
the development of algorithms and architectures for distributed enterprise solutions that can
guarantee security and correctness while maintaining high-availability.
Title: Secure Software Engineering in the Cloud
Abstract: In his talk, Dr. Olmsted will investigate the problem of developing secure development of cloud-based
enterprise applications. Consistency, availability, and durability are investigated for web service (WS) transactions.
He proposes an approach that matches the availability of the popular lazy replica update propagation method while
increasing durability and consistency. His replica update propagation method is called the “Buddy System”, which
requires that updates are preserved synchronously in two replicas. The first implementation schedules fine-grained
WS transactions. In these transactions, each activity is a low-level database operation. Later, he considers each
transaction as a black box, with only the corresponding Metadata, expressed as UML specifications, as transaction
semantics. He refers to these WS transactions as coarse-grained WS transactions. The “Buddy System” can
handle these coarse grained WS transactions, using UML stereotypes that allow scheduling semantics to be
embedded into the design model. Dr. Olmsted shows that his approach guarantees one-copy serializability,
matches the performance of the lazy update propagation methods, and increases durability in the presence of
hardware failures. The talk will conclude with current work investigating consistency guarantees for integration of
external systems, cloud-based data models, and payment security.
World Congress on Sustainable Technologies (WCST-2015)
Copyright © 2015 Technical Co-Sponsored by IEEE UK/RI Computer Chapter 14

Keynote Speaker 4
Frank Geels is Professor of System Innovation and Sustainability at the Sustainable
Consumption Institute, at the University of Manchester. Geels is chairman of the international
Sustainability Transitions Research Network (www.transitionsnetwork.org), and one of the world-
leading scholars on socio-technical transitions. Geels practices an inter-disciplinary style, which
makes crossovers between evolutionary economics, innovation studies and neo-institutional
theory. Geels has published six books on socio-technical transitions and more than 45 peer-
reviewed articles. He is particularly well-known for this conceptual and empirical work on the
Multi-Level Perspective (MLP) and Strategic Niche Management (SNM). He has twice won a
Research Publication Award from IAMOT (International Association for the Management of
Technology), has been selected by Thomson Reuters into their prestigious list of ‘Highly Cited
Researchers’, identified as one of The World’s Most Influential Scientific Minds 2014, and
elected as member of the Academia Europaea (social science section).
Title: Socio-technical transitions towards sustainability
Abstract: Addressing persistent environmental problems (climate change, bio-diversity and resource scarcity)
requires shifts in our existing transport, energy, buildings, and agro-food systems. These system innovations will be
analyses as socio-technical transitions, because they entail not only new technologies, but also changes in policy,
consumer practices, infrastructure, cultural debates and business strategies. This presentation consists of three
parts.
First, it will show empirical evidence that these transitions are beginning to unfold, although at varying speeds in
different domains and countries (faster in electricity than in heat, transport, and agro-food).
Second, it will present a conceptual perspective to understand these long-term transformative change processes
(which typically last 30-40 years). This multi-level perspective (MLP) accommodates ideas from evolutionary
economics, innovation studies and institutional theory. Third, it will highlight and illustrate several strategic
dilemmas and puzzles such as: 1) the non-deterministic and non-linear nature of transitions (which often also
involve setbacks), 2) governance and policy, 3) power struggles and resistance from vested interests, 4)
uncertainties about cultural trends, 5) the decline of incumbent regimes and technologies.
World Congress on Sustainable Technologies (WCST-2015)
Copyright © 2015 Technical Co-Sponsored by IEEE UK/RI Computer Chapter 15

Keynote Speaker 5
Professor Maryline Chetto received the degree of Docteur de 3ème cycle in control engineering
and the degree of Habilitée à Diriger des Recherches in Computer Science from the University
of Nantes, France, in 1984 and 1993, respectively. From 1984 to 1985, she held the position of
Assistant professor of Computer Science at the University of Rennes, while her research was
with the Institut de Recherche en Informatique et Systèmes Aléatoires, Rennes. In 1986, she
returned to Nantes and is currently a full professor with the Institute of Technology of the
University of Nantes. She is conducting her research at IRCCyN. Her main research interests
include Scheduling, Fault-tolerance and Dynamic Power Management technologies for real time
embedded applications. She is now studying energy harvesting systems that use renewable
energy to power embedded devices.
Title: Issues in energy harvesting cyber-physical systems
Abstract: A growing number of applications (e.g. medical, automotive) involve many wireless devices that may
be deployed in wide areas and possibly unattainable places. Such systems should be designed to function
perpetually without any human intervention because either costly or impractical. As a consequence, energy
harvesting technology has been an area of rapid development during the last decade. Energy harvesting is a
technology that allows to capture unused ambient energy. It is converted into electrical energy which is used
immediately or later through a storage unit for powering these devices which in addition to energy limitations have
to cope with real-time constraints. Consequently, energy harvesting cyber-physical systems need to be provided
with specific real-time scheduling and power management facilities.
This keynote addresses state of the art as well as our findings in real-time scheduling and processor activity
management for energy harvesting cyber-physical systems.
World Congress on Sustainable Technologies (WCST-2015)
Copyright © 2015 Technical Co-Sponsored by IEEE UK/RI Computer Chapter 16

PhD and Doctorate Consortium
The idea of writing a research paper or developing a topic of research interest that can lead to a PhD / Doctorate degree or proposal is always an endless thinking of where, when, why, what and who. Therefore, becoming an experienced researcher and writer in any field or discipline takes a great deal of practice. The Consortium has the following objectives:
Provide a supportive setting for feedback on current research that will stimulate exchange ofideas;
Guide on the future research directions;
Promote the development of a supportive community of scholars and a spirit of collaborativeresearch;
Contribute to the conference goals through interaction with other researchers and conferenceevents.
The PhD and Doctorate Consortium highlights possible solutions in response to the lack of competence demonstrated by young researchers and PhD and Doctorate students, and the understanding of what contributes to knowledge gap.
Organiser: Charles A. Shoniregun, Infonomics Society UK and Ireland
World Congress on Sustainable Technologies (WCST-2015)
Copyright © 2015 Technical Co-Sponsored by IEEE UK/RI Computer Chapter 17

PhD/Doctorate Consortium
Charles A. Shoniregun is a Professor of Applied Internet Security and Information Systems,
Founder of Infonomics Society. He is an invited speaker to NATO, guest speaker to many
universities in the UK and abroad on issues relating to his research and consultancy area, and
have several times won the IEEE Certificate of Appreciation. In 2008, he was invited speaker to
the Joint C2 Capabilities Conference organised for the senior military and US government
personnel in Washington DC. His research interests are in the fields of Internet security, Cyber
Terrorism, risks assessment of technology-enabled information, electronic and mobile commerce
(emC), second-life applications, third-stream activities, telecommunications and applied
information systems. He is a committee member of the Harvard Research Consortium and
Global Seminars (Harvard University), Editor-in-Chief of Eight International Journals, Author, Co-
author, Adjunct and Distinguished Professor in “Applied Internet Security and Information
Systems”, External Assessor to many Universities, Consultant to private and public sectors.
Title: Writing a Sustainable Research Paper
Abstract: The idea of writing a sustainable research paper or developing a topic of research interest that can lead
to a PhD / Doctorate degree or proposal is always an endless thinking of where, when, why, what and who.
Therefore, becoming an experienced researcher and writer in any field or discipline takes a great deal of practice.
This Keynote Lecture will highlights the possible solutions in response to the lack of competence demonstrated by
young researchers and PhD / Doctorate students, and the understanding of what contributes to knowledge gap.
World Congress on Sustainable Technologies (WCST-2015)
Copyright © 2015 Technical Co-Sponsored by IEEE UK/RI Computer Chapter 18

Workshop
World Congress on Sustainable Technologies (WCST-2015)
Copyright © 2015 Technical Co-Sponsored by IEEE UK/RI Computer Chapter 19
Workshop 1 (Part I): Efficient Use of Resources in Steel Plants through Process Integration (REFFIPLANT)
Applied Investigation on Waste Minimization in an Integrated Steel Site (Authors: Johan Riesbeck, Kararina Lundkvist, Mats Brämming, Anita Wedholm)
Integrated Optimisation of Blast Furnace Gas Wash Water Treatment, Reuse and Cost Savings Part I: Methodological Approach (Authors: Mansour Saiepour, Kokil Jain, Yuhang Lou)
Resource Efficiency in the Strategic Research Agenda of the European Steel Technology Platform (Authors: Klaus Peters, Valentina Colla, Enrico Malfa, Louis Brimacombe)
World Congress on Sustainable Technologies (WCST-2015)
Copyright © 2015 Technical Co-Sponsored by IEEE UK/RI Computer Chapter 20
Applied Investigation on Waste Minimization in an Integrated Steel Site
Johan Riesbeck, Kararina Lundkvist, Mats Brämming Process Integration, Swerea MEFOS
Luleå, Sweden [email protected]
Anita Wedholm SSAB Merox
Luleå, Sweden [email protected]
Abstract— Recycling is of major interest in steel making for environmental reasons as well as economical. All process units produce secondary materials which are recycled, sold or put in landfill. This work evaluates simulated cases for recycling of materials at an integrated steel site. Case studies and industrial tests of different recycling options have been performed. The main focus has been on residues produced in significant quantities and materials put in landfill due to their physical or chemical nature. Chosen case studies have been tested in industrial scale and comprise of recycling of dust, sludge and ladle slag to the blast furnace. The results from test periods have been used to compare modelling with process parameters. Industrial tests show that it will be beneficial to recycle steel plant (BOF) sludge via briquettes to the blast furnace but the main issue is the drying of the sludge. Furthermore ladle slag can be used as slag former in the BF with no negative effect on the process or product. The main advantage is that the resource efficiency increases since less virgin material is used and the depositing of secondary materials is decreased. Major cost savings can be found if internal recirculation can replace raw material such as iron ore, coke and lime stone.
Keywords-component; (waste recycling, process integration, steel plant, waste minimization)
I. INTRODUCTION The steel industry uses large amounts of resources as raw
materials and generates considerable amounts of dusts, sludges and slags. Usually these materials contains significant amounts of valuable metals, energy carriers etc. with potential to be utilized via direct recycling or through reuse either in the steel industry or in external applications. Raw material consumption in an integrated steelworks, generally involve about 500 - 600 kg reducing agents (injection coal and coke), ca. 1,400 – 1,500 kg of iron ore pellets and 100 - 150 kg slag formers such as
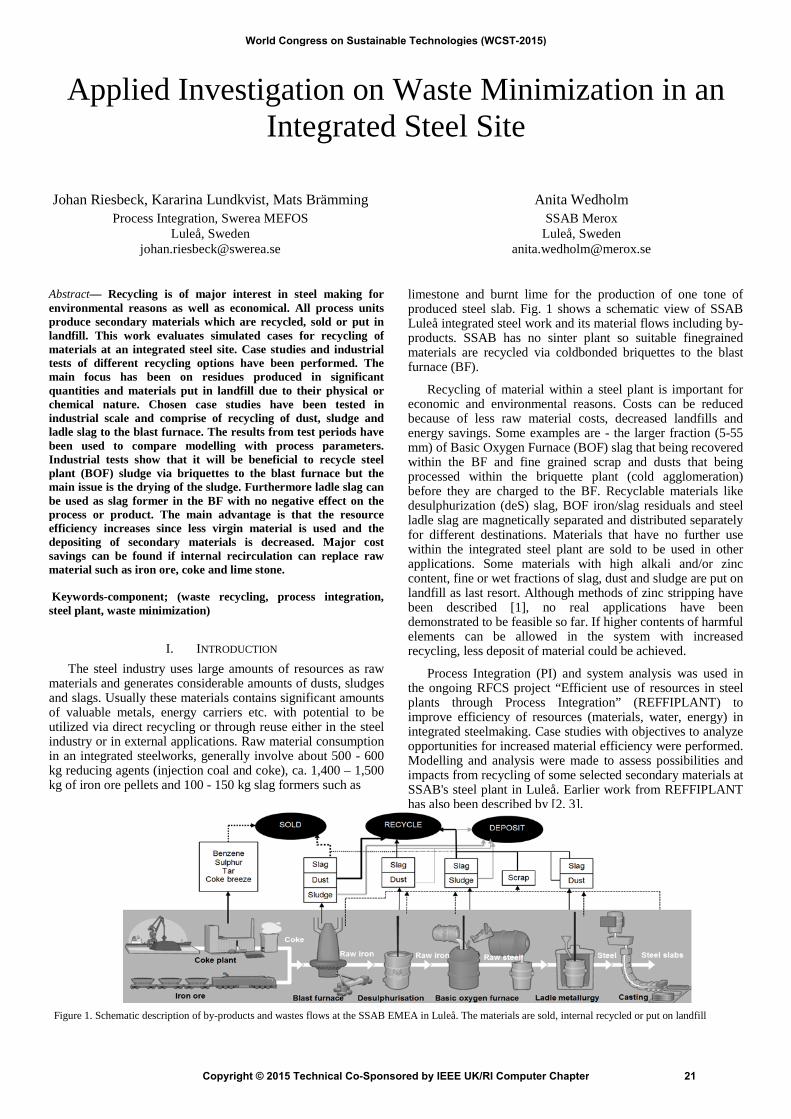
limestone and burnt lime for the production of one tone of produced steel slab. Fig. 1 shows a schematic view of SSAB Luleå integrated steel work and its material flows including by-products. SSAB has no sinter plant so suitable finegrained materials are recycled via coldbonded briquettes to the blast furnace (BF).
Recycling of material within a steel plant is important for economic and environmental reasons. Costs can be reduced because of less raw material costs, decreased landfills and energy savings. Some examples are - the larger fraction (5-55 mm) of Basic Oxygen Furnace (BOF) slag that being recovered within the BF and fine grained scrap and dusts that being processed within the briquette plant (cold agglomeration) before they are charged to the BF. Recyclable materials like desulphurization (deS) slag, BOF iron/slag residuals and steel ladle slag are magnetically separated and distributed separately for different destinations. Materials that have no further use within the integrated steel plant are sold to be used in other applications. Some materials with high alkali and/or zinc content, fine or wet fractions of slag, dust and sludge are put on landfill as last resort. Although methods of zinc stripping have been described [1], no real applications have been demonstrated to be feasible so far. If higher contents of harmful elements can be allowed in the system with increased recycling, less deposit of material could be achieved.
Process Integration (PI) and system analysis was used in the ongoing RFCS project “Efficient use of resources in steel plants through Process Integration” (REFFIPLANT) to improve efficiency of resources (materials, water, energy) in integrated steelmaking. Case studies with objectives to analyze opportunities for increased material efficiency were performed. Modelling and analysis were made to assess possibilities and impacts from recycling of some selected secondary materials at SSAB's steel plant in Luleå. Earlier work from REFFIPLANT has also been described by [2, 3].
Figure 1. Schematic description of by-products and wastes flows at the SSAB EMEA in Luleå. The materials are sold, internal recycled or put on landfill
World Congress on Sustainable Technologies (WCST-2015)
Copyright © 2015 Technical Co-Sponsored by IEEE UK/RI Computer Chapter 21
II. MATERIALS AND METHODS
A. Materials The fine grained BOF sludge from SSAB is currently
landfilled. As the sludge contains about 50% iron (Fe) it would be worthwhile to use it as raw material in some processes e.g. the BF. The possibility to use the BOF sludge as a raw material could be achieved if the sludge is dried and agglomerated either as pellet or briquette. Although the Zn content is rather low it could be a limitation for recycling to BF. Another material sent to landfill is ladle slag which could be used as slag former or as complementary binding agent in agglomerates. These two secondary materials have been investigated in the modelling work with different scenarios to find most suitable combination in terms of material efficiency, energy efficiency, quality and costs. Furthermore injection of BF dust into the BF was investigated and is now to some extent implemented. Examples of investigated and in some cases established routes for site internal recycling of materials at SSAB steel production plant in Luleå, are cold bonded briquetting or pelletizing, [4], recycling of desulphurisation scrap and BOF slag to the BF, [5], as well as injection of BF flue dust in the BF, [6], dust and sludge to BOF, [7].
B. Simulation and modelling The preliminary case studies involved simulations with the
excel-based TOTMOD model. The method and developed model is based on the Microsoft® Office Excel spreadsheet model “Masmod” presented by [8]. The developed model includes element distribution between slag and metal, and can be used for process simulation and analysis of various operating conditions as well as the influence of specific process parameters.
The optimization method used in the modelling work for recycling of secondary materials at the SSAB steel production plant is mixed-integer linear programming (MILP) by using the Java-based software reMIND. This tool has been proved to be powerful when analyzing improvements in energy and material efficiency, [9] and economic and environmental evaluation, [10]. ReMIND has also been demonstrated in scrap based steelmaking and industrial heating systems [11] and [12]. The model is based on a global mass- and energy balance for the production chain and individual sub-balances for the main processes.
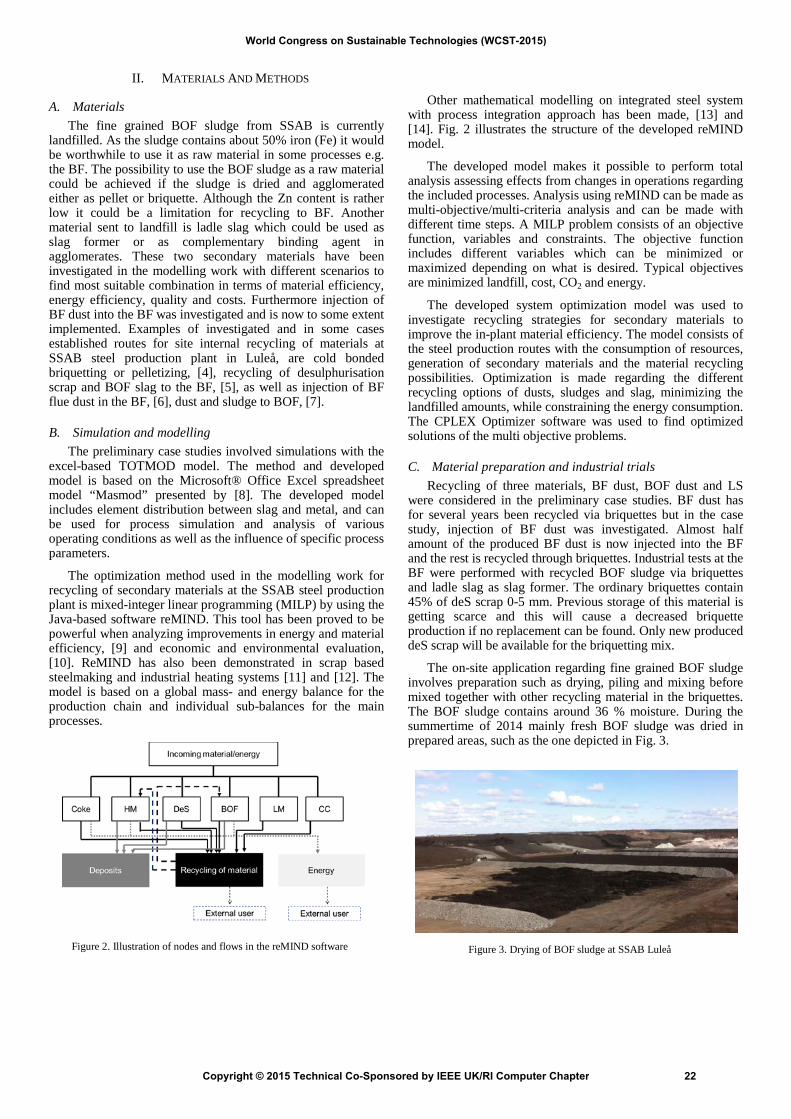
Other mathematical modelling on integrated steel system with process integration approach has been made, [13] and [14]. Fig. 2 illustrates the structure of the developed reMIND model.
The developed model makes it possible to perform total analysis assessing effects from changes in operations regarding the included processes. Analysis using reMIND can be made as multi-objective/multi-criteria analysis and can be made with different time steps. A MILP problem consists of an objective function, variables and constraints. The objective function includes different variables which can be minimized or maximized depending on what is desired. Typical objectives are minimized landfill, cost, CO2 and energy.
The developed system optimization model was used to investigate recycling strategies for secondary materials to improve the in-plant material efficiency. The model consists of the steel production routes with the consumption of resources, generation of secondary materials and the material recycling possibilities. Optimization is made regarding the different recycling options of dusts, sludges and slag, minimizing the landfilled amounts, while constraining the energy consumption. The CPLEX Optimizer software was used to find optimized solutions of the multi objective problems.
C. Material preparation and industrial trials Recycling of three materials, BF dust, BOF dust and LS
were considered in the preliminary case studies. BF dust has for several years been recycled via briquettes but in the case study, injection of BF dust was investigated. Almost half amount of the produced BF dust is now injected into the BF and the rest is recycled through briquettes. Industrial tests at the BF were performed with recycled BOF sludge via briquettes and ladle slag as slag former. The ordinary briquettes contain 45% of deS scrap 0-5 mm. Previous storage of this material is getting scarce and this will cause a decreased briquette production if no replacement can be found. Only new produced deS scrap will be available for the briquetting mix.
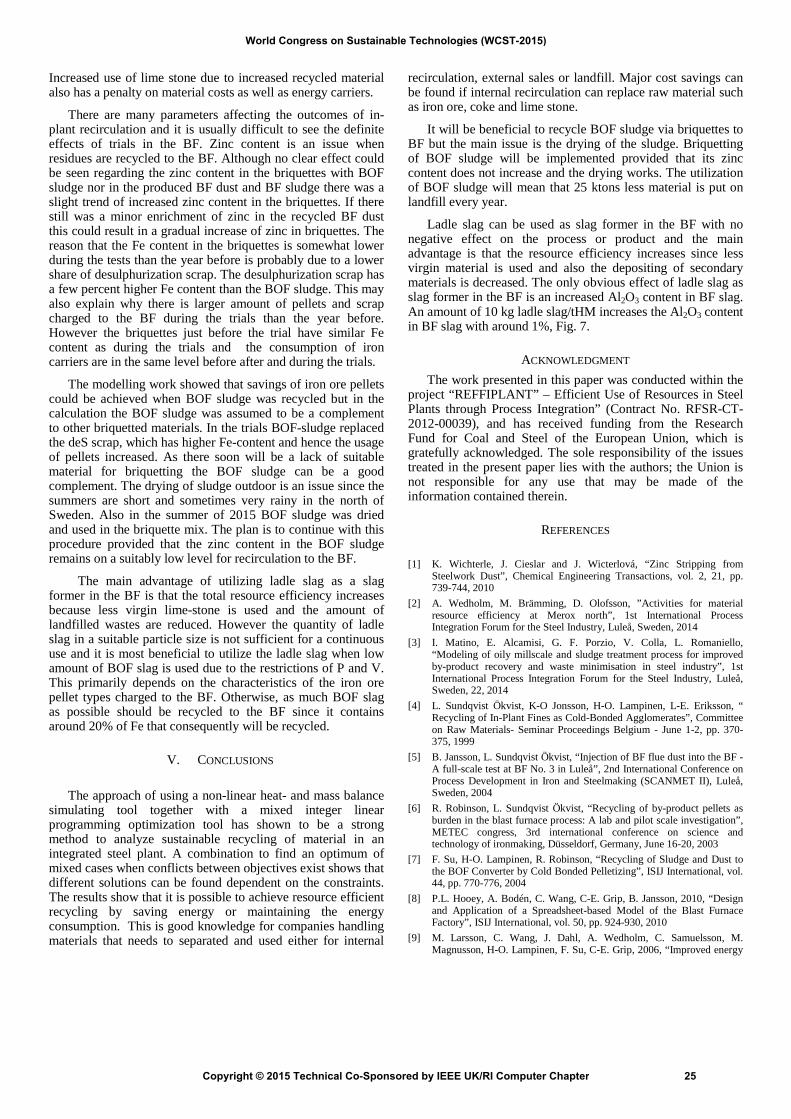
The on-site application regarding fine grained BOF sludge involves preparation such as drying, piling and mixing before mixed together with other recycling material in the briquettes. The BOF sludge contains around 36 % moisture. During the summertime of 2014 mainly fresh BOF sludge was dried in prepared areas, such as the one depicted in Fig. 3.
Figure 2. Illustration of nodes and flows in the reMIND software Figure 3. Drying of BOF sludge at SSAB Luleå
World Congress on Sustainable Technologies (WCST-2015)
Copyright © 2015 Technical Co-Sponsored by IEEE UK/RI Computer Chapter 22

The sludge was evened out to a 0.5 m high layer and a tractor with a harrow was used to prepare the wet BOF sludge for drying. The moister content after 2-3 weeks of drying was de-creased to 18% which was considered appropriate for briquetting. The production of about 80.000 tons of briquettes, with 12% of BOF sludge started in October and continued until the end of January.
Other materials that are briquetted are annual produced amounts of fine grained steel scrap, coarse BOF sludge, briquette fines, filter dusts, some amount of BF dust and small amounts of mill scale and different sludges. Compared to the ordinary briquette recipe it was primarily deS scrap that was reduced during the briquetting trials. During 4 months in the winter of 2014-2015 the briquettes containing BOF sludge were charged to the BF at an approximately rate of 100 kg per ton hot metal (kg/tHM). The cold strength of the briquettes is checked by a tumbling test. The tumbling strength is the most important quality aspect for the briquettes charged to the BF. Fig. 4 shows briquettes in the briquetting plant.
During 2014 ladle slag was tested as supplementary slag former in BF during three periods. An amount of 10 to 25 kg/tHM was charged to the BF, totally 6800 tons. Lime stone and BOF slag are ordinarily used as slag formers in the BF. The major difference between ladle slag and the two other slag formers is the alumina (Al2O3) content. Ladle slag contain 20 - >30% Al2O3 while BOF slag and limestone has less than 2%. There are also around 5 times lower vanadium (V) and phosphorus (P) content in ladle slag compared to the BOF slag. Although the BOF slag is restricted due to the V and P content it can be considered more valuable since it contains about 20% Fe and ladle slag only around 7%.
III. RESULTS
A. Modelling and optimisation Results from modelling of cases and optimization for
multiobjective solutions have been described in earlier work [15], [16] The results from the case study indicate possible gains in reduced need for iron ore pellet and limestone in scenarios simulating BOF fine fraction sludge recycling via briquettes and injection of BF dust. The BF slag rate is decreased in scenarios where BOF fine fraction sludge and BF dust is recycled without adding the ladle slag recycling. Increased BF dust recycling, utilizing the BF dust high carbon content, significantly decreases the coke rate.
Scenarios analyzing effects of charging briquettes in which addition of BOF fine sludge was made by reduced deS scrap, simultaneously with injection of BF dust show decreased use of limestone and a minor increase in iron ore use due to the decreased Fe content in the briquettes.
Results from steel ladle slag recycling shows only slight positive effects on iron ore pellet savings due to lower Fe content compared to BOF fine fraction sludge. Using 100% of the generated ladle slag decreases the limestone use with roughly 4.5 kg/t HM. The oxidic content (mainly SiO2, MgO and Al2O3) in ladle slag increases the BF slag rate by about 4 kg/t HM in scenarios with 100% recycling of ladle slag. However, the manganese oxide in ladle slag slightly decreases the Mn addition.. Both BOF fine sludge and steel ladle slag recycling to BF show potential to decrease the yearly amount of material to landfill. However, the potential is larger for BOF fine sludge.
The approach of using a non-linear heat- and mass balance simulating tool together with a mixed integer linear programming optimization tool has shown to be a strong method to analyze sustainable recycling of material in an integrated steel plant. A combination to find an optimum of mixed cases when conflicts between objectives exist shows that different solutions can be found dependent on the constraints. The results show that it is possible to achieve resource efficient recycling by saving energy or maintaining the energy consumption [16].
From modelling in reMIND it can be seen that while decreasing the deposit there is a small penalty in energy consumption in the system. This can be explained by the fact that recycled material with high iron content replaces iron ore pellets with a higher iron ore content. More slag needs to be melted and more energy has to be used. Also controlling the slag with lime stone will in some cases increase the energy consumption in the blast furnace [16].
There are direct cost savings by replacing purchased iron ore pellets with high iron content recycled material. Increased use of limes stone due to increased use of recycled material also has a penalty on material costs and energy carriers. The best case from the study with recirculation of all BOF sludge saves about 7 kg pellets/t HM [16]. Depending on raw material prices yearly savings would add up to 2 million USD for iron ore and about 1 million USD in lime stone costs. This shows it is worth going into deeper investigation to recycle more BOF sludge for costs and environmental reasons. Energy savings are also likely to occur but continuous production and follow up is needed to prove the feasibility.
B. Industrial trials The production of briquettes with 12% of BOF sludge
went well and no effect could be seen on the cold tumbling strength of the briquettes. Shortly after the production the moister content in the test briquettes was slightly higher than in ordinary briquettes. When the test briquettes were charged to the BF, 4 weeks later the moister content was the same as in ordinary briquettes. No clear effect could be seen regarding the zinc content in the BF dust or BF sludge there was a minor Figure 4. Briquettes (photo Stig-Göran Nilsson, Jernkontoret)
World Congress on Sustainable Technologies (WCST-2015)
Copyright © 2015 Technical Co-Sponsored by IEEE UK/RI Computer Chapter 23

trend of increased zinc content in the briquettes in the later part of the trials.
Analyzes of briquettes before, during, after and the year before indicates that the Fe content is somewhat lower during the tests than the year before, Fig. 5. Still the Fe content in briquettes just before the trial is in the same level as during the trials. Looking at the consumption of iron carriers charged to the BF, Fig. 6, it can be seen that with an increased recirculation of briquettes the pellets and scrap usage is clearly reduced. The charged amount of iron bearing material is higher during the test period compared to the year before. No effects on the production or hot metal quality could be seen during the trial.
All of the handling and the charging of the ladle slag to the BF went smoothly during the trials but the investigation has been hampered due to the alternation of pellets types and some process disturbances which were not caused by the ladle slag. Data from the process data handling system for the BF at SSAB Luleå, was used in the evaluation. The slag rate during period 1 with ladle slag as slag former increased with 4 kg/tHM compared to the slag rate before the trial. This corresponds to the increased amount of slag formers charged to BF. The average BF slag amounts during test period 2 and 3 were 166 respective 165 kg/tHM even though higher amount of slag formers was charged during test period 2. At the same time looking at data for the whole year 2014, it can be said that this is in the range of normal fluctuations. The only obvious effect of ladle slag as slag former in the BF was an increased Al2O3 content in BF slag, Fig. 7. An amount of 10 kg ladle slag/tHM increased the Al2O3 content in BF slag with around 1%. This result is in accordance with modelling case with increased ladle slag.
The average BF slag amounts during test period 2 and 3 were 166 respective 165 kg/tHM even though higher amount of slag formers was charged during test period 2. At the same time looking at data for the whole year 2014, it can be said that this is in the range of normal fluctuations. The only obvious effect of ladle slag as slag former in the BF was an increased Al2O3 content in BF slag, Fig. 7. An amount of 10 kg ladle slag/tHM increased the Al2O3 content in BF slag with around 1%. This result is in accordance with modelling case with increased ladle slag.
1310
1315
1320
1325
1330
1335
1340
1345
1350
1355
1360
75 85 95 105 115
Charged amountof iron carriers
(kg/tHM)
Charged amount of briquettes (kg/tHM)
Iron ore pellets and scrap in relation to briquettes
Year before
Before and aftertrial
Trial
Linjär (Year before)
Linjär (Before andafter trial)
Linjär (Trial)
IV. DISCUSSION
Recycling material in the steel industry is common practice and depending on the plant layout, legal restrictions and physical conditions the level of efficient material use can vary between integrated sites. The integrated steel plants of SSAB in Sweden and Finland all have briquetting plants as a mean to recycle fine material. The common practice in Europe is to use a sinter plant which in many aspects changes the conditions of material use in the blast furnace and related units. However the transferability of the results from this investigation covers the common issue of harmful elements in BOF sludge and ladle slag and the savings that can be reached due to increased material efficiency and total energy consumption. For each plant a specific investigation needs to be made with boundaries and restrictions that apply for that plant in that specific region.
The results will be conflicting when trying to minimize deposits with respect to energy consumption and quality parameters in the product. The energy change is mainly related to coke usage in the blast furnace. However the results show that the energy change is small even when recycling is improved. The test trials show no particular effects on energy consumption and product quality.
There is a direct cost saving by replacing purchased iron ore pellets with high iron content recycled material. With a weakening in iron ore prices as seen during 2014 and the beginning of 2015 the cost benefit will decrease. Costs for landfills and future predictions of increased taxes on landfills need to be accounted for as well as changes in operating costs preparing material for the briquetting plant or sinter plant.
Figure 6. Charged amount of other iron carriers to blast furnace in relation to charged amount of briquettes
36
38
40
42
44
46
48
50
52
54W-% Fe content in briquettes
Year before
Before trial
Trial
After trial
Linjär (Yearbefore)
Linjär (Trial)
Winter 2013-2014Autumn 2014 Winter 2014-2015 – trial Spring 2015Figure 5. Iron (Fe) content in briquettes the year before, months before
during and after production of briquettes with BOF dust
Figure 7. Ladle slag charged to the blast furnace (red staples), alumina content in blast furnace slag (black curve)
World Congress on Sustainable Technologies (WCST-2015)
Copyright © 2015 Technical Co-Sponsored by IEEE UK/RI Computer Chapter 24
Increased use of lime stone due to increased recycled material also has a penalty on material costs as well as energy carriers.
There are many parameters affecting the outcomes of in-plant recirculation and it is usually difficult to see the definite effects of trials in the BF. Zinc content is an issue when residues are recycled to the BF. Although no clear effect could be seen regarding the zinc content in the briquettes with BOF sludge nor in the produced BF dust and BF sludge there was a slight trend of increased zinc content in the briquettes. If there still was a minor enrichment of zinc in the recycled BF dust this could result in a gradual increase of zinc in briquettes. The reason that the Fe content in the briquettes is somewhat lower during the tests than the year before is probably due to a lower share of desulphurization scrap. The desulphurization scrap has a few percent higher Fe content than the BOF sludge. This may also explain why there is larger amount of pellets and scrap charged to the BF during the trials than the year before. However the briquettes just before the trial have similar Fe content as during the trials and the consumption of iron carriers are in the same level before after and during the trials.
The modelling work showed that savings of iron ore pellets could be achieved when BOF sludge was recycled but in the calculation the BOF sludge was assumed to be a complement to other briquetted materials. In the trials BOF-sludge replaced the deS scrap, which has higher Fe-content and hence the usage of pellets increased. As there soon will be a lack of suitable material for briquetting the BOF sludge can be a good complement. The drying of sludge outdoor is an issue since the summers are short and sometimes very rainy in the north of Sweden. Also in the summer of 2015 BOF sludge was dried and used in the briquette mix. The plan is to continue with this procedure provided that the zinc content in the BOF sludge remains on a suitably low level for recirculation to the BF.
The main advantage of utilizing ladle slag as a slag former in the BF is that the total resource efficiency increases because less virgin lime-stone is used and the amount of landfilled wastes are reduced. However the quantity of ladle slag in a suitable particle size is not sufficient for a continuous use and it is most beneficial to utilize the ladle slag when low amount of BOF slag is used due to the restrictions of P and V. This primarily depends on the characteristics of the iron ore pellet types charged to the BF. Otherwise, as much BOF slag as possible should be recycled to the BF since it contains around 20% of Fe that consequently will be recycled.
V. CONCLUSIONS
The approach of using a non-linear heat- and mass balance simulating tool together with a mixed integer linear programming optimization tool has shown to be a strong method to analyze sustainable recycling of material in an integrated steel plant. A combination to find an optimum of mixed cases when conflicts between objectives exist shows that different solutions can be found dependent on the constraints. The results show that it is possible to achieve resource efficient recycling by saving energy or maintaining the energy consumption. This is good knowledge for companies handling materials that needs to separated and used either for internal
recirculation, external sales or landfill. Major cost savings can be found if internal recirculation can replace raw material such as iron ore, coke and lime stone.
It will be beneficial to recycle BOF sludge via briquettes to BF but the main issue is the drying of the sludge. Briquetting of BOF sludge will be implemented provided that its zinc content does not increase and the drying works. The utilization of BOF sludge will mean that 25 ktons less material is put on landfill every year.
Ladle slag can be used as slag former in the BF with no negative effect on the process or product and the main advantage is that the resource efficiency increases since less virgin material is used and also the depositing of secondary materials is decreased. The only obvious effect of ladle slag as slag former in the BF is an increased Al2O3 content in BF slag. An amount of 10 kg ladle slag/tHM increases the Al2O3 content in BF slag with around 1%, Fig. 7.
ACKNOWLEDGMENT The work presented in this paper was conducted within the
project “REFFIPLANT” – Efficient Use of Resources in Steel Plants through Process Integration” (Contract No. RFSR-CT-2012-00039), and has received funding from the Research Fund for Coal and Steel of the European Union, which is gratefully acknowledged. The sole responsibility of the issues treated in the present paper lies with the authors; the Union is not responsible for any use that may be made of the information contained therein.
REFERENCES
[1] K. Wichterle, J. Cieslar and J. Wicterlová, “Zinc Stripping from Steelwork Dust”, Chemical Engineering Transactions, vol. 2, 21, pp. 739-744, 2010
[2] A. Wedholm, M. Brämming, D. Olofsson, ”Activities for material resource efficiency at Merox north”, 1st International Process Integration Forum for the Steel Industry, Luleå, Sweden, 2014
[3] I. Matino, E. Alcamisi, G. F. Porzio, V. Colla, L. Romaniello, “Modeling of oily millscale and sludge treatment process for improved by-product recovery and waste minimisation in steel industry”, 1st International Process Integration Forum for the Steel Industry, Luleå, Sweden, 22, 2014
[4] L. Sundqvist Ökvist, K-O Jonsson, H-O. Lampinen, L-E. Eriksson, “ Recycling of In-Plant Fines as Cold-Bonded Agglomerates”, Committee on Raw Materials- Seminar Proceedings Belgium - June 1-2, pp. 370-375, 1999
[5] B. Jansson, L. Sundqvist Ökvist, “Injection of BF flue dust into the BF - A full-scale test at BF No. 3 in Luleå”, 2nd International Conference on Process Development in Iron and Steelmaking (SCANMET II), Luleå, Sweden, 2004
[6] R. Robinson, L. Sundqvist Ökvist, “Recycling of by-product pellets as burden in the blast furnace process: A lab and pilot scale investigation”, METEC congress, 3rd international conference on science and technology of ironmaking, Düsseldorf, Germany, June 16-20, 2003
[7] F. Su, H-O. Lampinen, R. Robinson, “Recycling of Sludge and Dust to the BOF Converter by Cold Bonded Pelletizing”, ISIJ International, vol. 44, pp. 770-776, 2004
[8] P.L. Hooey, A. Bodén, C. Wang, C-E. Grip, B. Jansson, 2010, “Design and Application of a Spreadsheet-based Model of the Blast Furnace Factory”, ISIJ International, vol. 50, pp. 924-930, 2010
[9] M. Larsson, C. Wang, J. Dahl, A. Wedholm, C. Samuelsson, M. Magnusson, H-O. Lampinen, F. Su, C-E. Grip, 2006, “Improved energy
World Congress on Sustainable Technologies (WCST-2015)
Copyright © 2015 Technical Co-Sponsored by IEEE UK/RI Computer Chapter 25

and material efficiency using new tools for global optimisation of residue material flows”, International Journal of Green Energy, vol. 3(2), pp. 127-137, 2006
[10] M. Larsson, C. Wang, J. Dahl, “Development of a method for analysing energy, environmental and economic efficiency for an integrated steel plant”, Applied Thermal Engineering, vol. 26, pp. 1353-1361, 2006
[11] P. Lingebrant, J. Dahl, M. Larsson, E. Sandberg, “System Optimization of an Electric Steel Making Plant with Sequenced Production and Dynamic Stock level”, Chemical Engineering Transactions, vol. 29, pp. 523-528, 2012
[12] J. Riesbeck, J. Sandberg, C. Wang, “A system analysis of LKAB Malmberget Heating System to Centralisation and Substitution of Fossil Fuels to Biofuels”, Chemical Engineering Transactions, vol. 29, pp. 793-798, 2012
[13] H. Ghanbari, M. Helle, F. Pettersson, H. Saxén, “Steelmaking Integrated with Polygeneration Plant for Improved Sustainability”, Chemical Engineering Transactions, vol. 29, pp. 1033-1038, 2012
[14] H. Ghanbari, H. Saxén, “A Techno-Economic Analysis of Using Residual Top Gases in an Integrated Steel Plant”, Chemical Engineering Transactions, vol. 35, pp. 169-174, 2013
[15] J. Riesbeck, A. Wedholm, K. Lundkvist, M. Brämming, “Systematic Study on Recycling of Waste Materials in an Integrated Steel Site”, AISTech & ICSTI Proceedings, Cleveland, Ohio, USA, 4-7 May, 2015
[16] J. Riesbeck, K. Lundkvist, M. Brämming, A. Wedholm, “New methods for waste minimization in an integrated steel site”, Chemical engineering transactions, vol. 45, pp. 739-744, 2015.
World Congress on Sustainable Technologies (WCST-2015)
Copyright © 2015 Technical Co-Sponsored by IEEE UK/RI Computer Chapter 26

Integrated Optimisation of Blast Furnace Gas Wash
Water Treatment, Reuse and Cost Savings
Part I: Methodological Approach
Mansour Saiepour
Group Environment
Tata Steel Europe
Rotherham, UK
Kokil Jain and Yuhang Lou
Process Integration Limited
Manchester, UK
[email protected], [email protected]
Abstract—Within a European collaborative research project
aimed at improving resource efficiency and environmental
sustainability in steelmaking plants, simulations have been
applied to evaluate integrated solutions for water recycling, reuse
and treatment at a blast furnace gas wash plant. The blast furnace gas washing process, in steelworks, is a major water consumer and significant contributor to water pollution. A two paper series describes the research undertaken at a Tata Steel blast furnace plant (UK) in collaboration with Process Integration Limited (UK) to model and simulate process integration options for improving water quality, increasing water conservation by reuse, maximising energy efficiency and reducing treatment and operating costs. This paper constitutes the first part which introduces the system and describes the underlying issues and opportunities that have been considered in this study. It also provides a methodological framework and defines the base case for the study. Thereafter simulation results for recycle-reuse analysis (without treatment) are discussed and it has been concluded that some form of treatment is essential in order to achieve the stated objectives. Reverse osmosis and magnetic filtration treatment are identified as the suitable options in this regard. Their field trials and subsequent analysis of various regeneration-reuse scenarios and their techno-economic evaluation have been discussed in the second part of the paper.
Keywords - Hydrocyclone; Magnetic Filtration; Blast Furnace
Gas Wash; Water Reuse; Water efficiency; Reffiplant;
I. INTRODUCTION
As part of a European multi-partner research project, REFFIPLANT [1] started in July 2012, aimed at efficiency improvement of resources (materials, water, energy) in integrated steelmaking plants by minimising their consumption and by finding integrated solutions for recycling, reuse, and treatment of waste water. Tata Steel has collaborated with PIL (UK) to develop process integration solutions for recycling and reuse of process water. This paper is the first part of the two paper series which describes research undertaken at a Tata Steel blast furnace plant (UK) to model and simulate process
integration options developed in particular for blast furnace gas wash (BF GW) process water.
Increasingly demanding national and European legislation such as the EU Water Framework Directive [2], Energy Efficiency Directive [3], and Industrial Emissions Directive [4] have made it essential to manage water and reduce emissions.
A blast furnace gas wash process, in steelworks, is a major water consumer and a significant contributor to water contamination within the water system. Thus any reduction in blowdown flowrate from the process would significantly improve the quality of discharge water collected in lagoons. This in turn could unlock the potential water reuse opportunities from this large pool of available lagoon water.
In addition, sludge collected from this process also contains a significant amount of iron which can not currently be reused due to the presence of other undesired metals such as zinc and lead. Thus any improvement in separation efficiency could enable the recycling of iron sludge and thereby improve the material efficiency of the process.
Overall there is a range of benefits in terms of water conservation, material efficiency, energy efficiency, environmental compliance and treatment costs which can be identified by studying the integrated system of the blast furnace gas wash, treatment sections and lagoon systems.
A. Process Description
The site under study was a Tata Steel integrated steelmaking site in the UK with a production capacity of 4.5 million tons per year with four blast furnaces at the heart of this integrated steelworks.
1) Blast FurnaceFigure 1 presents the bird’s-eye view of the blast furnace
water treatment plant at the Tata Steel site. Blast furnaces are large metallurgical furnaces used for reducing iron ore into pig iron. The furnace is charged continuously from the top with sintered iron ore, a fuel (usually coke), and a flux (limestone). Air, which supplies the oxygen for the processes, is supplied to a lower section of the furnace and passes counter-currently to
World Congress on Sustainable Technologies (WCST-2015)
Copyright © 2015 Technical Co-Sponsored by IEEE UK/RI Computer Chapter 27
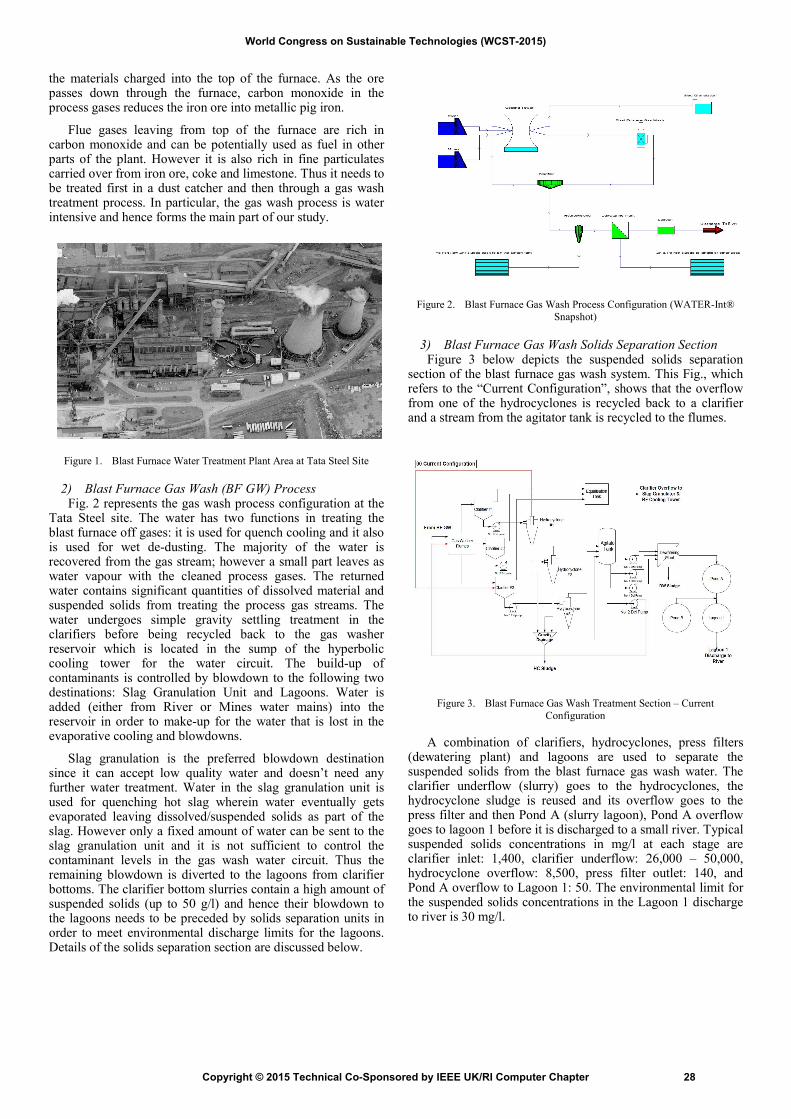
the materials charged into the top of the furnace. As the ore passes down through the furnace, carbon monoxide in the process gases reduces the iron ore into metallic pig iron.
Flue gases leaving from top of the furnace are rich in carbon monoxide and can be potentially used as fuel in other parts of the plant. However it is also rich in fine particulates carried over from iron ore, coke and limestone. Thus it needs to be treated first in a dust catcher and then through a gas wash treatment process. In particular, the gas wash process is water intensive and hence forms the main part of our study.
Figure 1. Blast Furnace Water Treatment Plant Area at Tata Steel Site
2) Blast Furnace Gas Wash (BF GW) ProcessFig. 2 represents the gas wash process configuration at the
Tata Steel site. The water has two functions in treating the blast furnace off gases: it is used for quench cooling and it also is used for wet de-dusting. The majority of the water is recovered from the gas stream; however a small part leaves as water vapour with the cleaned process gases. The returned water contains significant quantities of dissolved material and suspended solids from treating the process gas streams. The water undergoes simple gravity settling treatment in the clarifiers before being recycled back to the gas washer reservoir which is located in the sump of the hyperbolic cooling tower for the water circuit. The build-up of contaminants is controlled by blowdown to the following two destinations: Slag Granulation Unit and Lagoons. Water is added (either from River or Mines water mains) into the reservoir in order to make-up for the water that is lost in the evaporative cooling and blowdowns.
Slag granulation is the preferred blowdown destination since it can accept low quality water and doesn’t need any further water treatment. Water in the slag granulation unit is used for quenching hot slag wherein water eventually gets evaporated leaving dissolved/suspended solids as part of the slag. However only a fixed amount of water can be sent to the slag granulation unit and it is not sufficient to control the contaminant levels in the gas wash water circuit. Thus the remaining blowdown is diverted to the lagoons from clarifier bottoms. The clarifier bottom slurries contain a high amount of suspended solids (up to 50 g/l) and hence their blowdown to the lagoons needs to be preceded by solids separation units in order to meet environmental discharge limits for the lagoons. Details of the solids separation section are discussed below.
Figure 2. Blast Furnace Gas Wash Process Configuration (WATER-Int®
Snapshot)
3) Blast Furnace Gas Wash Solids Separation SectionFigure 3 below depicts the suspended solids separation
section of the blast furnace gas wash system. This Fig., which refers to the “Current Configuration”, shows that the overflow from one of the hydrocyclones is recycled back to a clarifier and a stream from the agitator tank is recycled to the flumes.
Figure 3. Blast Furnace Gas Wash Treatment Section – Current
Configuration
A combination of clarifiers, hydrocyclones, press filters (dewatering plant) and lagoons are used to separate the suspended solids from the blast furnace gas wash water. The clarifier underflow (slurry) goes to the hydrocyclones, the hydrocyclone sludge is reused and its overflow goes to the press filter and then Pond A (slurry lagoon), Pond A overflow goes to lagoon 1 before it is discharged to a small river. Typical suspended solids concentrations in mg/l at each stage are clarifier inlet: 1,400, clarifier underflow: 26,000 – 50,000, hydrocyclone overflow: 8,500, press filter outlet: 140, and Pond A overflow to Lagoon 1: 50. The environmental limit for the suspended solids concentrations in the Lagoon 1 discharge to river is 30 mg/l.
World Congress on Sustainable Technologies (WCST-2015)
Copyright © 2015 Technical Co-Sponsored by IEEE UK/RI Computer Chapter 28

It is desirable to maximise suspended solids separation using hydrocyclones for the following reasons:
a. Hydrocyclones are low cost, compact classificationdevices which can concentrate the clarifier slurry directly into sludge without any further dewatering treatment.
b. Hydrocyclones selectively separate unwanted metals(e.g. zinc and lead) from iron and thus the collected sludge can be directly recycled back to the blast furnaces via sinter plant processing. The recycling of zinc leads to premature failure of blast furnace lining.
c. Direct recycle connection can be set-up betweenhydrocyclone and clarifiers, thereby reducing the cost of pumping water from the agitator tanks.
B. Details of the problem
Based on initial system analysis, the following issues were identified in the system:
1. High ammonia content in the final lagoon dischargewater – the BF GW blowdown water is a major source of contamination (including ammonia) in the lagoon water and hence there is a need for identifying ammonia abatement solutions from the BF GW system.
2. High suspended solids levels in hydrocyclone overflow(7 – 10 g/l) - based on initial measurements and comparison with operating manual performances, it was observed that the hydrocyclone operations were not at optimum performance. Optimising the recycling of the hydrocyclone overflow to the clarifier increases useful sludge production.
3. High suspended solids in clarifier overflow going to thecooling tower - high suspended solids can lead to fouling / clogging issues in cooling tower packings and higher maintenance requirements (control limit = 25 mg/l). Hence additional makeup water will be necessary to replace the blowdown to maintain water quality.
Besides these issues, the following savings/process improvement opportunities were identified in the combined system of blast furnace gas wash and lagoons:
1. Reduction in dewatering plant treatment and pumpingcosts - dewatering plant is owned and operated by a third party who charge per unit mass load of contaminants separated. Also there is a significant pumping cost associated with sending blowdown from BF GW system to the Lagoons. Both of these costs will be reduced by decreasing the BF GW blowdown.
2. Opportunity to recover more metals from sludge - asdiscussed, hydrocyclones separate valuable iron from zinc and lead. Thus more recycling means more recovery of iron-containing sludge which in turn can improve profitability.
C. Need for Process Integration Approach
As highlighted in the above sections, the blast furnace gas wash circuit, slag granulator, solids separation unit (including hydrocyclones and dewatering plant) and lagoons are all inter-connected and overall they present a significant opportunity to address a number of site operational issues and to increase resource efficiency in the Tata Steel integrated steelworks site.
However there are specific constraints or contaminant limits in each of these sections. Also the number of permutations/combinations of connections possible between these sections are large for an experimental trial and error approach. Such a problem is best suited to be tackled by developing an integrated modelling framework for an entire system and thereafter applying various scenarios based on optimisation techniques [5, 6].
The following advantages can be enumerated of such an integrated modelling approach:
a. An overall picture for decision making is provided -integrated modelling enables the study of the interactions among different sections and ensures that improvement in one section does not adversely impact the performance of the other sections. Such comprehensive tracking of contaminants helps to increase confidence in the decision making process.
b. A reduced need for field experimentation - conductingfield trials and subsequent data collection is an expensive and time-consuming process. Such modelling effort enables the analysis of a large number of scenarios before actually deciding on a final solution, which would then be trialled on-site.
II. METHODOLOGY
A. Data Collection and Site Information
Data collection that was performed in four phases is illustrated below in Fig. 4.
Figure 4. Data Collection Overview
1) Overall Site BalanceIn the first phase of the project, a combination of historical
plant data, spot measurements and estimations from senior engineers were used to develop a heat and mass balance of the entire site water network. Heat and mass balance spreadsheets were produced for 14 processes and they were linked together to validate the mass balance for fresh water sources and wastewater discharge streams.
The key contaminants/parameters tracked in this exercise were TSS (total suspended solids), TDS (total dissolved solids), Chlorides, Ammonia and pH.
The chloride level was monitored separately from total dissolved solids because a high chloride content in the BF GW water circuit may lead to corrosion or scale formation in the process components hence a reduction in their lifespan. Similarly ammonia was monitored separately along with chlorides due to separate environmental discharge limits.
2) Lagoon Data CollectionDuring the development of the overall site balance, all the
inlet streams into the lagoon were combined together to create a simplified mass balance around the lagoon system. However in order to develop prediction capability for discharge water quality due to the change proposed in this study, it was decided
Overall Site
Balance
(including BF GW)
Lagoon Data
Collection
Particle Size
Distribution
Data
Fe, Zn & Pb
distribution
data
World Congress on Sustainable Technologies (WCST-2015)
Copyright © 2015 Technical Co-Sponsored by IEEE UK/RI Computer Chapter 29

to quantify water qualities and flowrates of individual water sources. Overall there are 15 different sources of water entering the lagoon.
Four sets of water samples were taken for all individual water sources going into the lagoons. These data sets were then reconciled to obtain a final mass balance around the lagoon systems. Apart from the key contaminants (TSS, TDS, Cl, Ammonia and pH), concentrations of the following metals were also tracked in this exercise: Ca, Mg, Na, K, Fe, Zn, Pb, Ni, Al, Cd, Cr, Cu, Ba, Bo, Li, Mn and St. The solubility of these metals was also measured, since only non-soluble metals take part in particle settlement within the lagoons.
3) Particle Size Distribution (PSD) DataSuspended solids were identified as the key contaminants
which can be mitigated by optimising the operation of the solids separation section. Thus particle size distribution data was collected in order to model/benchmark the performance of the clarifiers, hydrocyclones and press filters.
Three sets of spot measurements were taken for this purpose. PSD measurements were also taken for the Mines water, (Basic Oxygen Steelmaking) BOS Gas Wash, Pond A and Lagoon 1 discharge streams to create a simplified model for predicting the change in particle size distribution for the solids separation section if lagoon 1 water were to be reused.
4) Fe, Zn & Pb Distribution DataIt is commonly known that zinc build-up affects the blast
furnace lining leading to its premature failure. Also the presence of zinc and lead in blast furnace sludge recycled into the sinter plant process can lead to issues with atmospheric emissions from the sinter plant. On the other hand, iron is desirable for recycling and hence Fe, Zn and Pb contents were monitored with the objective of increasing sludge recycling via the sinter plant. Two sets of spot measurements were taken around the solids separation section for this purpose.
B. Modelling
Models at both unit operation level and network level have been developed for this study. The following models have been developed at unit operation level:
a. The hydrocyclone model is a semi-empirical modelbased on particle size distribution data. D50c (cut point of hydrocyclone) & SI (separation index) are two empirical parameters in this model which can be fine-tuned to achieve a close match with plant data. Further details of the hydrocyclone model can be found in Appendix A.
b. The clarifier model is based on particle settlingvelocity, wherein particles larger than a critical diameter are assumed to be 100% recovered, while separation of smaller diameter particles follows a linear distribution. The critical diameter in this model can be fine-tuned to achieve a close match with plant data.
c. The dewatering plant and lagoon models are based ona fixed separation ratio which was back-calculated during the data reconciliation steps.
The network models were based on MILP (Mixed Integer Linear Programming) framework established within WATER-int® software [5, 6]. Fig. 2 presented earlier, illustrates the interface of WATER-int® software and how the network connections are set-up within the software.
C. Simulation
Three sets of simulation files were set-up for this study:
a. Blast Furnace Gas Wash Circuit
b. Solids Separation Unit
c. Lagoon Systems
Both blast furnace gas wash and lagoon system simulation tracked key contaminants of interest in the system (TSS, TDS, Chlorides, Ammonia and pH), while only TSS (total suspended solids) and metals (Fe, Zn, Pb) were tracked in the solids separation section since it was assumed that contaminant concentrations except total suspended solids remain constant across the solids separation section.
D. Optimisation
The following two kinds of analyses were performed in this case study:
a. recycle-reuse analysis - here direct recycle connections,without treatment, can be added/modified
b. regeneration-reuse analysis - here location and capacityof treatment units have been optimised.
The optimisation objective in this case would be to minimise the total cost and the constraints would be not to exceed the existing contaminant levels in the system. Treatment flowrates were the primary optimisation variables in this case.
III. BF GW WATER HYDROCYCLONE OVERFLOW
RECYCLING
Section A below introduces data/simulation results which would establish the base case for the proposed case study. Subsequent sub-section B then discusses the details of the investigation and recommended solutions from this case study.
A. Current Configuration Data Analysis
1) Blast Furnace Gas Wash System Mass BalanceFig. 5 below represents the current configuration of the
blast furnace gas wash circuit and some parameters used in the mass balance. These initial spreadsheet results were used for the purpose of data validation and reconciliation, and were later transferred to WATER-int
® software for further analysis.
World Congress on Sustainable Technologies (WCST-2015)
Copyright © 2015 Technical Co-Sponsored by IEEE UK/RI Computer Chapter 30

Figure 5. Blast Furnace Gas Wash Circuit
2) Lagoon Data CollectionTable I below represents the mass balance around the
lagoon systems for the key contaminants. Since the lagoon water quality is affected by the BF GW discharge water, it was essential to collect data on all of the streams into and out of the Pond A, Pond B and lagoon 1.
TABLE I. MASS BALANCE AROUND LAGOON WATER SYSTEM
3) Particle Size Distribution (PSD) DataTable II below depicts the particle size distribution of
suspended solids in the solids separation section. Based on these PSD profiles, equipment model parameters were curve fitted in order to develop predictive capabilities in the hydrocyclones and clarifier models.
TABLE II. PARTICLE SIZE DISTRIBUTION IN SOLIDS SEPARATION SECTION - CURRENT CONFIGURATION
4) Fe, Zn and Pb Distribution DataThe results of the chemical analysis of the water into and
out of each of the components of the solids separation system were used to calculate their iron, zinc and lead removal percentages. Table III below indicates the separation factors observed for each of the components of the system. As can be seen from the table, hydrocyclones provide an effective means for selective separation of iron over zinc and lead.
TABLE III. FE, ZN & PB SEPARATION IN SOLIDS SEPARATION SECTION
B. Hydrocyclone Overflow Recycling Analysis
As discussed earlier, two types of analysis, i.e recycle-reuse (without treatment) and regeneration-reuse (with treatment) were performed in this case study. 18 different scenarios were simulated for both of these analyses, and the effect of including treatment units with different capacities was studied. The flowrates were optimised in each of these scenarios in order to minimise the total cost. Details of these analyses are discussed below.
1) Recycle-Reuse AnalysisThe hydrocyclone connections are flexible and can be
reconnected back to the clarifiers to achieve the following objectives:
a. Improvement in lagoon water quality
b. Increased sludge recovery
c. Lower third-party dewatering plant costs
d. Decrease in pumping and agitation costs
Bearing this in mind, the following six different flow schemes were studied:
Case #1 - Current Configuration - Hydrocyclone 1 overflow recycled back to Clarifier 3 and one of the agitator tank streams to gas wash flumes;
Case #2 - Base Case Configuration - No recycling from Hydrocyclone 1 or from agitator tanks;
Case #3 - Hydrocyclone 1 Overflow Recycle to Flumes - Same as current configuration except that Hydrocyclone 1 overflow is recycled back to the flumes instead of clarifier 3;
Case #4 - One Hydrocyclone Recycle - Hydrocyclone 1 overflow recycled to Flumes; no recycling from agitator tanks;
Case #5 - Two Hydrocyclone Recycle - Hydrocyclone 1 & 2 overflows recycled to Flumes; no recycling from the agitator tanks;
Case #6 - Three Hydrocyclone Recycle - Hydrocyclone 1, 2 & 3 overflows recycled to Flumes; no recycling from the agitator tanks.
World Congress on Sustainable Technologies (WCST-2015)
Copyright © 2015 Technical Co-Sponsored by IEEE UK/RI Computer Chapter 31
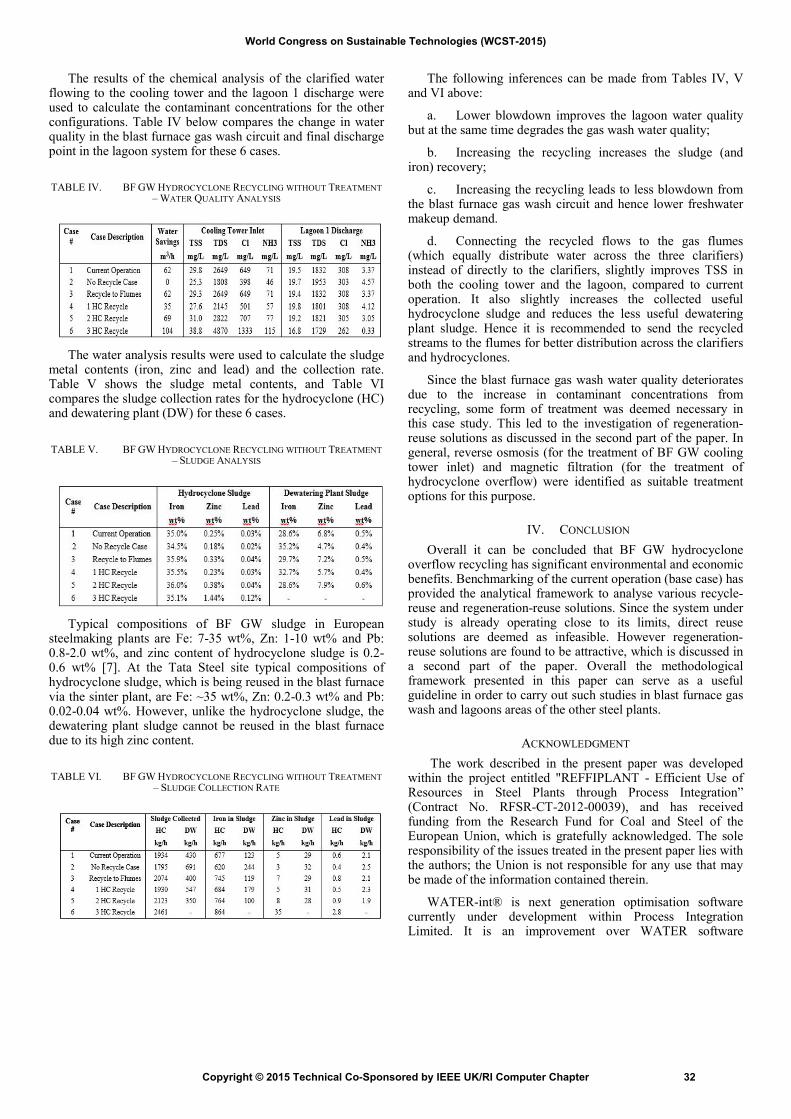
The results of the chemical analysis of the clarified water flowing to the cooling tower and the lagoon 1 discharge were used to calculate the contaminant concentrations for the other configurations. Table IV below compares the change in water quality in the blast furnace gas wash circuit and final discharge point in the lagoon system for these 6 cases.
TABLE IV. BF GW HYDROCYCLONE RECYCLING WITHOUT TREATMENT
– WATER QUALITY ANALYSIS
The water analysis results were used to calculate the sludge metal contents (iron, zinc and lead) and the collection rate. Table V shows the sludge metal contents, and Table VI compares the sludge collection rates for the hydrocyclone (HC) and dewatering plant (DW) for these 6 cases.
TABLE V. BF GW HYDROCYCLONE RECYCLING WITHOUT TREATMENT
– SLUDGE ANALYSIS
Typical compositions of BF GW sludge in European steelmaking plants are Fe: 7-35 wt%, Zn: 1-10 wt% and Pb: 0.8-2.0 wt%, and zinc content of hydrocyclone sludge is 0.2-0.6 wt% [7]. At the Tata Steel site typical compositions of hydrocyclone sludge, which is being reused in the blast furnace via the sinter plant, are Fe: ~35 wt%, Zn: 0.2-0.3 wt% and Pb: 0.02-0.04 wt%. However, unlike the hydrocyclone sludge, the dewatering plant sludge cannot be reused in the blast furnace due to its high zinc content.
TABLE VI. BF GW HYDROCYCLONE RECYCLING WITHOUT TREATMENT
– SLUDGE COLLECTION RATE
The following inferences can be made from Tables IV, V and VI above:
a. Lower blowdown improves the lagoon water qualitybut at the same time degrades the gas wash water quality;
b. Increasing the recycling increases the sludge (andiron) recovery;
c. Increasing the recycling leads to less blowdown fromthe blast furnace gas wash circuit and hence lower freshwater makeup demand.
d. Connecting the recycled flows to the gas flumes(which equally distribute water across the three clarifiers) instead of directly to the clarifiers, slightly improves TSS in both the cooling tower and the lagoon, compared to current operation. It also slightly increases the collected useful hydrocyclone sludge and reduces the less useful dewatering plant sludge. Hence it is recommended to send the recycled streams to the flumes for better distribution across the clarifiers and hydrocyclones.
Since the blast furnace gas wash water quality deteriorates due to the increase in contaminant concentrations from recycling, some form of treatment was deemed necessary in this case study. This led to the investigation of regeneration-reuse solutions as discussed in the second part of the paper. In general, reverse osmosis (for the treatment of BF GW cooling tower inlet) and magnetic filtration (for the treatment of hydrocyclone overflow) were identified as suitable treatment options for this purpose.
IV. CONCLUSION
Overall it can be concluded that BF GW hydrocyclone overflow recycling has significant environmental and economic benefits. Benchmarking of the current operation (base case) has provided the analytical framework to analyse various recycle-reuse and regeneration-reuse solutions. Since the system under study is already operating close to its limits, direct reuse solutions are deemed as infeasible. However regeneration-reuse solutions are found to be attractive, which is discussed in a second part of the paper. Overall the methodological framework presented in this paper can serve as a useful guideline in order to carry out such studies in blast furnace gas wash and lagoons areas of the other steel plants.
ACKNOWLEDGMENT
The work described in the present paper was developed within the project entitled "REFFIPLANT - Efficient Use of Resources in Steel Plants through Process Integration” (Contract No. RFSR-CT-2012-00039), and has received funding from the Research Fund for Coal and Steel of the European Union, which is gratefully acknowledged. The sole responsibility of the issues treated in the present paper lies with the authors; the Union is not responsible for any use that may be made of the information contained therein.
WATER-int® is next generation optimisation software currently under development within Process Integration Limited. It is an improvement over WATER software
World Congress on Sustainable Technologies (WCST-2015)
Copyright © 2015 Technical Co-Sponsored by IEEE UK/RI Computer Chapter 32

developed earlier by Center for Process Integration at The University of Manchester.
APPENDIX A – HYDROCYCLONE UNIT MODEL
Figure A1 below indicates the hydrocyclone geometry and the typical partition curves which form the basis of the proposed hydrocyclone model.
The proposed model is based on following assumptions:
1. Centrifugal force field >> gravitational field
2. d50c & SI are functions of hydrocyclone geometryand remain constant irrespective of the variation inflowrate and/or suspended solids concentration
3. Short circuit fraction (α) is a function of suspendedsolids mass load
4. Density of water = 1000 kg/m3. This assumptionenables the use of units (m
3/h and t/h)
interchangeably.
Figure A1. Hydrocyclone Geometry & typical partition curves
Input data for the clarifier model are:
1. d50c - the cut-point of the hydrocyclone i.e. size of the
particle that has a 50% chance of leaving in either the
underflow or overflow;
2. SI (separation index) or Lambda (λ) – it is an
empirical parameter which is obtained by curve fitting
of empirical correlation on available plant data;
3. Fo/Fi - the ratio between outlet and inlet flowrates;
4. FIN - the inlet volumetric flowrate;
5. TSSIN - the total suspended solids concentration in
the hydrocyclone inlet;
6. TSSIN,a-b - Particle size distribution of suspended
solids in hydrocyclone inlet
7. TSSUF - the total suspended solids concentration in
bottom sludge stream;
Model is able to calculate as outputs:
1. the suspended solids concentration in the hydrocyclone
outlet
2. the suspended solids particle size distribution in the outlet
and sludge streams;
3. the separation efficiency of the hydrocyclone;
Equations Involved
a. Mass Balance Equations:
Applicable for water flowrate, total suspended solids and
suspended solids in each particle size interval.
b. Empirical Partition Curve Model:
c. Short Circuit Effect:
Figure A2. Illustration of Hydrocyclone Short Circuit Effect
If the ideal classification action of the unit is described by a classification function e(dp) and a fraction of the feed short circuits directly to the coarser product then a simple mass balance gives the actual classification curve as
c(dp) = α + (1- α) * e(dp)
e(dp) is called the corrected classification function and c(dp) the actual classification function.
REFERENCES
[1] Colla V. et al: “Efficient use of resources in steel plants through process integration – REFFIPLANT.” RFCS Contract No. RFSR-CT-2012-00039, 2012-2015,pp. 643. ftp://ftp.cordis.europa.eu/pub/coal-steel-rtd/docs/summaries-rfcs_en.pdf. (Access date: 12 Nov. 2015).
[2] EU Water Framework Directive http://eur-lex.europa.eu/legal-content/EN/TXT/HTML/?uri=CELEX:32000L0060&from=EN. (Access date: 12 Nov. 2015).
[3] EU Energy Efficiency Directive http://eur-lex.europa.eu/legal-content/EN/TXT/HTML/?uri=CELEX:32012L0027&from=EN. (Access date: 12 Nov. 2015).
[4] EU Industrial Emissions Directive http://eur-lex.europa.eu/legal-content/EN/TXT/HTML/?uri=CELEX:32010L0075&from=EN. (Access date: 12 Nov. 2015).
[5] Wang, Y.P., and R. Smith, “Wastewater minimisation,” Chemical Engineering Science, 49.7, 1994, pp. 981-1006.
[6] Wang, Y.P., and R Smith, “Design of distributed effluent treatment systems,” Chemical Engineering Science, 49.18, 1994, pp. 3127-3145.
[7] Remus, R.M., et al: “ Best Available Techniques (BAT) Reference Document for Iron and Steel Production” (Report EUR 25521 EN), European Commission - Joint Research Centre - Institute for prospective technological studies, pp.151.http://eippcb.jrc.ec.europa.eu/reference/BREF/IS_Adopted_03_2012.pdf (Access date: 12 Nov. 2015).
World Congress on Sustainable Technologies (WCST-2015)
Copyright © 2015 Technical Co-Sponsored by IEEE UK/RI Computer Chapter 33

Resource efficiency in the Strategic Research Agenda
of the European Steel Technology Platform
Klaus Peters
Secretary General
European Steel Technology Platform (ESTEP)
Brussels, Belgium
Valentina Colla
TeCIP Institute, Scuola Superiore Sant’Anna & ESTEP WG
Planet Secretary
Pisa, Italy
Enrico Malfa
Centro Sviluppo Materiali & ESTEP WG Planet Chairman
Dalmine, Italy
Louis Brimacombe
Tata Steel UK Ltd
London, United Kingdom
Abstract— Steel is the essential material for a circular economy.
Through the technological evolution of human society, steel
remains fundamental to daily life and to the welfare of the
society. In effect it has been recognized as a Key Enabling
Technology. Steel is actually ubiquitous and most artifacts are
either made of steel, in part or in their entirety, or are
manufactured from machines and tools made of steel. It is deeply
embedded in the anthroposphere, and like all materials, its
production requires significant consumption of resources, energy,
raw materials and logistics. However, its recyclability means that
steel produced today will be utilized by future generations.
Resource efficiency is an important topic for the European steel industry: it naturally lies in the operating practice of the standard production cycle, due to the recyclability of steel, the significant quantities of raw materials required for its production and the large volumes of by-products. Further efforts and innovative approaches are demanded to improve resource efficiency. This paper resents how the Strategic Research Agenda of the European Steel Technology Platform addresses the different aspects of resource efficiency in order to highlight the challenges that the sector faces in terms of Research and Innovation fostering a sustainable steel production.
Keywords-component; resource efficiency, steel industry,
sustainability
I. INTRODUCTION
The European Steel Technology Platform (ESTEP) is a European 2020 ETP (European Technology Platform) that is a kind of association meeting criteria set by the European Commission. ESTEP is thus a free association, without formal legal status beyond an informal contract binding its members together. ESTEP represents the whole European Steel sector, its value chain, upstream and downstream operations from its core activities, the research and academic institutions which develop intensive research activities related to steel production and usage, as well as some other stakeholders. ESTEP was funded in 2004 from a joint effort of the whole European steel
community and in this decade acted as think tank, generating a foresight vision of what Steel is to become in the medium and long term and of how it can get there. This vision is presented in the ESTEP's Strategic Research Agenda (SRA), an extensive document that is periodically revised and updated according to the most recent trends and results of the research in the field. The most recent version of the SRA has been published in 2013 [1].
Steel is everywhere: it can be found in a multitude of different tools, equipment, machines, transportation means and infrastructure which form the basis of our daily life, although they often remains invisible underneath decorative, protective or functional layers of other materials. The reason for this extensive presence lies in the fact that steel is directly linked to human activities, as attested by the relevant steel consumption intensity per capita (185.2 kg per capita in the world and 368.1 kg per capita in the EU in 2014 [2]). Noticeably the importance of steel in social life and organization grows with population, standard of living and quality of life.
The core business of the steel industry is to organize the recovery of iron from natural or anthropogenic resources, in order to make possible the construction and the maintenance of the structure of the anthroposphere (technosphere) and of its artifacts. To this aim, significant amounts of primary and secondary raw materials (32/68 % BOF/EAF routes, close to the virgin iron/scrap ratio), of energy (18.5 GJ/t steel) and of logistics (more than 2 t of raw materials per ton of produced steel in an integrated steel mill) are marshalled in complex and professional ways, literally on a global scale. In fact 60% of the iron ore consumption and 80% of the coal are traded internationally. This also requires the contribution of millions of people (2 million jobs, worldwide) and creates a GDP footprint that extends far beyond that of the steel sector (2%), and along the value chain and the life cycle of steel (20%).
Steel is thus deeply and subtly interconnected with the environment, the whole planet and society, and the steel industry is committed not only to simply comply with the
World Congress on Sustainable Technologies (WCST-2015)
Copyright © 2015 Technical Co-Sponsored by IEEE UK/RI Computer Chapter 34

environmental regulation, but also to cooperate with the whole anthroposphere of the human society in the promotion of sustainable development as the only way to couple welfare and progress to respect and protect the natural environment [3]. ESTEP's SRA explores how to manage this cooperation as smoothly as possible in its section devoted to environmental issues [4, 5].
Resource efficiency has a key role in sustainable development and the SRA touches several topics directly or indirectly connected to resource efficiency. The present paper depicts how the ESTEP’s SRA addresses the different aspects of resource efficiency in order to highlight the challenges that the sector faces in terms of Research and Innovation fostering a sustainable steel production. Clearly the final aim is the reduction of the environmental footprint of steel production. This must lead to steel solutions that can only be achieved by reducing the resource consumption, fostering the use of secondary raw materials and, consequently, promoting the establishment of a more closed-loop economy, as well as by implementing energy efficiency, saving exergy, implementing process integration and eco-design approaches.
II. STRUCTURE OF THE SRA
The European Steel industry identifies in the SRA four main pillars for its sustainable growth:
Planet dealing with innovative technologies, includingbreakthroughs, which help to meet environmentalrequirements, promote sustainable steel production anddevelop Life Cycle Thinking and Life CycleAssessment;
Profit ensuring profit-making through innovation andnew technologies within the production processes;
Partners responding to the demands and needs of thesociety by working with the partners of the steel sectorfor proposing innovative steel products and steelsolutions in the sectors of transport, construction andinfrastructure, and energy.
People attracting and securing human resources andskills in a dynamic way by optimizing the deploymentof the human resources and becoming a worldwidereference for health and safety at work.
Seven working groups corresponding to the above listed pillars have been set up. They have developed the following three industrial programs with large societal impacts each of them encompassing several R&D themes and research areas:
Sustainable steel production
safe, cost-effective and lower capital intensivetechnologies
appealing steel solutions for end users
The importance of ICT, Industry 4.0 and BigData was reason to establish the task force Integrated Intelligent Manufacturing (I2M) as an independent working group. The impact of I2M [6] is strongly related to the scope of all other
working groups of ESTEP so that it represents a fifth pillar of the sustainable development.
A transversal objective regarding human resources has also been added, namely:
attracting and securing qualified people to help meetthe steel sector’s ambition
Fig. 1 depicts the connection between the four pillars and the identified industrial programs with large societal impacts based on a sustainability approach.
Figure 1. Connection between the 4P’s and the 3 industrial programmes.
III. SUSTAINABLE STEEL PRODUCTION
Meeting environmental regulation is part of the daily business of the European steel industry and any remaining challenge in this area lies in making steel production processes change incrementally in ways that ensure that they meet both economic and environmental targets in a synergic way. This task involves incremental process modifications that are mostly handled by incremental research, thus it falls within the duties of one ESTEP Working Group which is devoted to process innovation.
On the other hand, the European steel industry needs also to be prepared for a larger evolution that will take the sector further in the direction of sustainable production than ever before. Therefore another ESTEP Working Group named “Planet” tackles more holistic and prospective issues which are not only incremental but also extend into the medium-long term. Such issues can be summarized as follows:
Resource issues due to energy and raw materialssupply
Moving smoothly into a closed-loop economy
World Congress on Sustainable Technologies (WCST-2015)
Copyright © 2015 Technical Co-Sponsored by IEEE UK/RI Computer Chapter 35

Synergies with neighboring communities
Synergies with nature
Life Cycle Assessment (LCA) and Life Cycle Thinking (LCT)
Steel and new energy frontiers
C-lean steelmaking
Global threats and future environmental demands
Of the above-listed topics, the first three can be directly connected in a straightforward way to resource efficiency, and such a connection will be depicted in the next three sections. LCA and its evolution represents a basic tool to implement resource efficiency globally (not just for specific industries) as discussed in [7] and so Sec. VII will overview also this topic.
IV. RESOURCE ISSUES DUE TO ENERGY AND RAW
MATERIALS SUPPLY
Indeed Europe is not the richest mining region in the world, as it imports most of the primary raw materials which are needed for its industrial production. This fact is very relevant to the European steel industry, as most of its virgin material comes from outside Europe. For this reason the Steel model has been one of globalization since the 1980s, with very large capsize vessels and sourcing from Brazil and Australia of very high grade iron ore and coals.
On the other hand, the lack of primary raw materials in Europe, together with the consideration that also at the global levels these kind of resources are finite and not renewable (and both fossil resources and renewable ones are also bound by the competition for land), raises many issues related to access to resources, security of supply, scarcity, criticality, sustainability of material-based activities and simple economic and logistical issues. The European Commission is well aware of the underlying threats and launched a large initiative, framed as a European Innovation Partnership (EIP), the EIP on Raw Materials [8].
The approach focuses on the finiteness of the ecosphere and on the need to preserve its resources for future generations. But this does not apply only to those resources which are intrinsically scarce. Although many resources will remain abundant in the long period, the growth of demand related to population growth and urbanization may have a faster kinetics with respect to the supply capability provided by the economy. This could create tension and volatility on prices and an unbalanced situation of the market which could also affect the competitiveness of the European steel industry.
Therefore the need arises to develop a leaner economy, based on higher energy and raw materials efficiencies, as this represents an acceleration of the pace at which the economy will be relying on close-loop operation. Roughly speaking, there is an increasing demand for industrial ecology solution and synergies between industries, cities and communities, as well as for a reinforcement of reuse and recycling.
Industrial ecology is a multidisciplinary research field which investigates the material and energy flows within
industrial systems often to the aim of analyzing (and possibly reducing) the impacts that industrial activities have on the environment, due to the exploitation of natural resources and the generation and disposal of wastes. According to [9] the term “industrial ecology” derives from and analogy with natural systems that should be used to help to understand how to design sustainable industrial systems.
In order to improve resource efficiency within its production cycle and in the whole society, the European steel industry needs to investigate industrial ecology solutions e.g. for integrating technologies which enhance the use as resources of by-products, discharged water and off-gases. Process integration [10] is currently applied to face this challenge at overall plant level (see some interesting examples in [11-14]), but industrial ecology represents a further step toward a true cross-sectoral and global approach to the problem.
The idea of resource preservation by increasing energy and material efficiency includes the recycling of steel in particular and recycling of the all the large volume of by-products generated by the steel sector both inside and outside the steel production cycle. Steel has been recycled at a high level estimated around 85%. Steel mills are moving towards "zero residues" (zero waste) in a credible way: their energy use is one of the most efficient among Energy Intensive Industries (EII). However, the steel sector is committed to progress further and to imagine solutions for turning into an even leaner sector. Furthermore, transversal, through-process issues are essential to acknowledge in a holistic approach, as well as the quick integration of new technologies developed outside of the sector and cooperation with other economic players.
V. MOVING SMOOTHLY INTO A CLOSED-LOOP ECONOMY
Steel is correctly stated to be the most recycled material in the world and this is often interpreted to mean that steel is part of a closed-loop economy. This is a subtle and complex concept, as an economy can be close-looped for some material and not for others and it can be partially or totally closed (namely the term “closed” can be interpreted in a weak and strong meaning). Steel today is indeed part of a partial closed-loop economy related to the generation and reuse of scrap but also to the reuse of steel without re-melting it, as is commonly practiced for rails or pile sheets.
This practice will be as essential in the future, as it was essential in the past. The steel sector is organized with specialized steelworks, where the production cycle is based on the Electric Arc Furnace (EAF), where the steel scrap is melted to produce new steel products. Moreover, the collection of scrap and its treatment to turn it into a true secondary raw material is mostly a profitable, value-creating business: this is actually why steel is recycled to such a high level. In the future, the fraction of scrap vs iron ore is expected to increase, as the steel produced in the past and especially since the explosion of production, which has taken place since 2000, will be coming back in the economy as scrap. This will raise delicate issues of adjusting the balance between integrated and scrap process routes, for instance in China, which has invested heavily in integrated mills.
World Congress on Sustainable Technologies (WCST-2015)
Copyright © 2015 Technical Co-Sponsored by IEEE UK/RI Computer Chapter 36
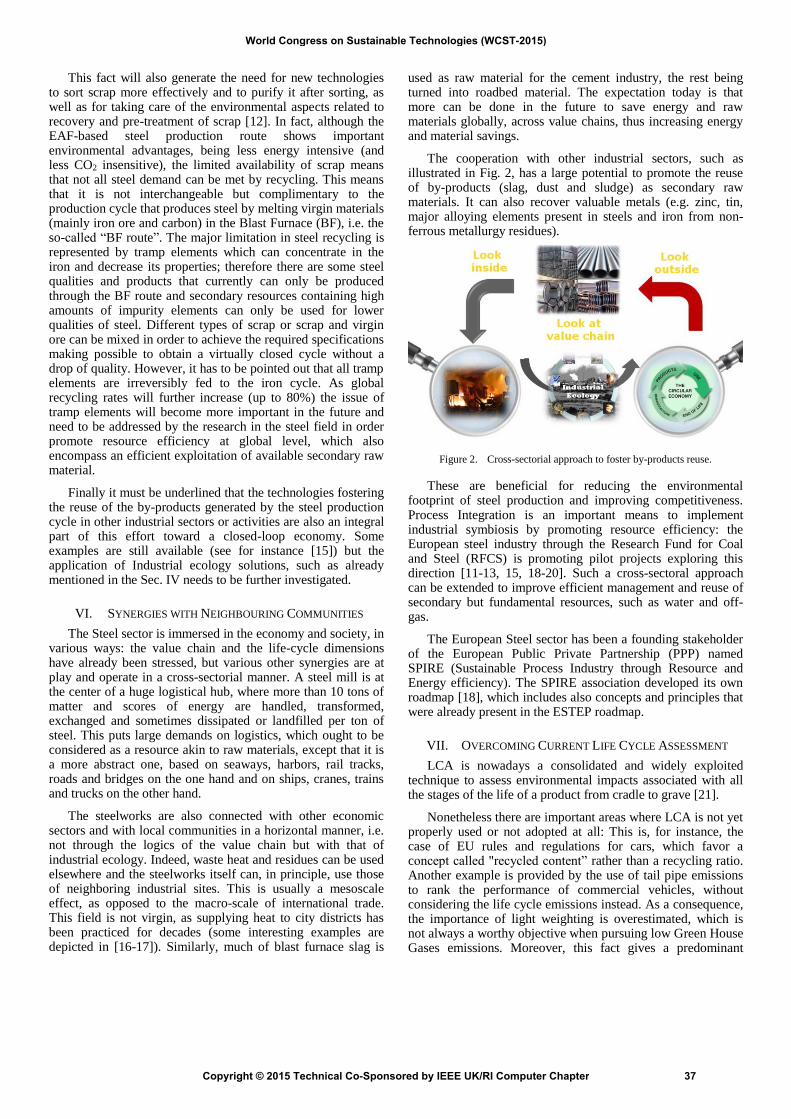
This fact will also generate the need for new technologies to sort scrap more effectively and to purify it after sorting, as well as for taking care of the environmental aspects related to recovery and pre-treatment of scrap [12]. In fact, although the EAF-based steel production route shows important environmental advantages, being less energy intensive (and less CO2 insensitive), the limited availability of scrap means that not all steel demand can be met by recycling. This means that it is not interchangeable but complimentary to the production cycle that produces steel by melting virgin materials (mainly iron ore and carbon) in the Blast Furnace (BF), i.e. the so-called “BF route”. The major limitation in steel recycling is represented by tramp elements which can concentrate in the iron and decrease its properties; therefore there are some steel qualities and products that currently can only be produced through the BF route and secondary resources containing high amounts of impurity elements can only be used for lower qualities of steel. Different types of scrap or scrap and virgin ore can be mixed in order to achieve the required specifications making possible to obtain a virtually closed cycle without a drop of quality. However, it has to be pointed out that all tramp elements are irreversibly fed to the iron cycle. As global recycling rates will further increase (up to 80%) the issue of tramp elements will become more important in the future and need to be addressed by the research in the steel field in order promote resource efficiency at global level, which also encompass an efficient exploitation of available secondary raw material.
Finally it must be underlined that the technologies fostering the reuse of the by-products generated by the steel production cycle in other industrial sectors or activities are also an integral part of this effort toward a closed-loop economy. Some examples are still available (see for instance [15]) but the application of Industrial ecology solutions, such as already mentioned in the Sec. IV needs to be further investigated.
VI. SYNERGIES WITH NEIGHBOURING COMMUNITIES
The Steel sector is immersed in the economy and society, in various ways: the value chain and the life-cycle dimensions have already been stressed, but various other synergies are at play and operate in a cross-sectorial manner. A steel mill is at the center of a huge logistical hub, where more than 10 tons of matter and scores of energy are handled, transformed, exchanged and sometimes dissipated or landfilled per ton of steel. This puts large demands on logistics, which ought to be considered as a resource akin to raw materials, except that it is a more abstract one, based on seaways, harbors, rail tracks, roads and bridges on the one hand and on ships, cranes, trains and trucks on the other hand.
The steelworks are also connected with other economic sectors and with local communities in a horizontal manner, i.e. not through the logics of the value chain but with that of industrial ecology. Indeed, waste heat and residues can be used elsewhere and the steelworks itself can, in principle, use those of neighboring industrial sites. This is usually a mesoscale effect, as opposed to the macro-scale of international trade. This field is not virgin, as supplying heat to city districts has been practiced for decades (some interesting examples are depicted in [16-17]). Similarly, much of blast furnace slag is
used as raw material for the cement industry, the rest being turned into roadbed material. The expectation today is that more can be done in the future to save energy and raw materials globally, across value chains, thus increasing energy and material savings.
The cooperation with other industrial sectors, such as illustrated in Fig. 2, has a large potential to promote the reuse of by-products (slag, dust and sludge) as secondary raw materials. It can also recover valuable metals (e.g. zinc, tin, major alloying elements present in steels and iron from non-ferrous metallurgy residues).
Figure 2. Cross-sectorial approach to foster by-products reuse.
These are beneficial for reducing the environmental footprint of steel production and improving competitiveness. Process Integration is an important means to implement industrial symbiosis by promoting resource efficiency: the European steel industry through the Research Fund for Coal and Steel (RFCS) is promoting pilot projects exploring this direction [11-13, 15, 18-20]. Such a cross-sectoral approach can be extended to improve efficient management and reuse of secondary but fundamental resources, such as water and off-gas.
The European Steel sector has been a founding stakeholder of the European Public Private Partnership (PPP) named SPIRE (Sustainable Process Industry through Resource and Energy efficiency). The SPIRE association developed its own roadmap [18], which includes also concepts and principles that were already present in the ESTEP roadmap.
VII. OVERCOMING CURRENT LIFE CYCLE ASSESSMENT
LCA is nowadays a consolidated and widely exploited technique to assess environmental impacts associated with all the stages of the life of a product from cradle to grave [21].
Nonetheless there are important areas where LCA is not yet properly used or not adopted at all: This is, for instance, the case of EU rules and regulations for cars, which favor a concept called "recycled content” rather than a recycling ratio. Another example is provided by the use of tail pipe emissions to rank the performance of commercial vehicles, without considering the life cycle emissions instead. As a consequence, the importance of light weighting is overestimated, which is not always a worthy objective when pursuing low Green House Gases emissions. Moreover, this fact gives a predominant
World Congress on Sustainable Technologies (WCST-2015)
Copyright © 2015 Technical Co-Sponsored by IEEE UK/RI Computer Chapter 37

importance to climate change without considering other issues and may thus be creating difficulties elsewhere.
Life Cycle Thinking (LCT), the approach behind LCA, is worldwide recognized as beneficial to society and the European steel industry wishes to promote it. However the present methodology is still not perfect and other methodologies are needed to complement it.
To move away from the micro-economic description of the economy related to choosing the functional unit as the central concept of LCA, one should open the scope to macro-economic thinking with Material Flow Analysis (MFA) [20] or Energy Flow Analysis, which lie at the core of the analysis of recycling, a major issue for steel and metals in general and many other materials
This might be insufficient to deal with the main open issues and challenges: thus, more ambitious methodologies, going beyond LCA and MFA have to be developed, or, rather, their development has to be further encouraged. In the steel and structural material sectors, this corresponds to the SOVAMAT initiative [23], which puts forward the concept of "social value", which is close to a more holistic definition of sustainability. The LCA Community is exploring the idea of functionality, beyond that of functional unit, etc. The steel sector needs to be at the forefront of methodological innovation in this area, in order to create a dynamics that would open up to interdisciplinary cooperation, from sociology, socio-economics to scientific ecology by encompassing the various communities of LCA, MFA, economic global modelers, etc.
In order to overcome the current limitations of LCA in the context of process industry, the European Research Framework Program Horizon 2020 (H2020) is currently supporting the following three international research projects running under the umbrella of SPIRE:
1. STYLE - Sustainability Toolkit for Easy Life Cycle Evaluation aims at developing a practical toolkit to be used by EU projects and industry in order to assess the value of new technologies and process modifications focused on improving resource and energy efficiency.
2. MEASURE - harmonised cross-sectorial sustainability assessment in the European process industries, aims at developing a roadmap providing recommendations for standards and best-practice methods and tools for life cycle-based evaluation approaches in process industries and sustainable process design.
3. SAMT - Sustainability assessment methods and tools to support decision-making in the process industries aims at reviewing and making recommendations on the most suitable methods to evaluate sustainability in the process industry, focusing especially on energy and resource efficiency.
The three projects are linked with each other and several steel industries are partners of the first two above-listed project, by thus accomplishing part of the actions planned in the ESTEP’s SRA.
VIII. FUTURE RESEARCH PERSPECTIVES
The ESTEP is committed to stimulate the research in the steel field in order to provide the European steel industry with all the suitable means to face the future challenges at technological, economical and societal levels. This will lead also to gradually broadening the dimension and scope of the investigations and to enlarge the number of potential partners in the research activities. While in the past (roughly until the end of the nineties) the research was focused mostly on mitigation of the environmental risk at the specific site level, current short term research activities are addressed toward the reduction of the environmental impact of the production cycle in both the surrounding areas and in general at a wider level. Resource efficiency lies in this dimension but it is also a far more global topic . In fact, as depicted in the previous section, the global perspective for an effective resource efficiency strategy must be related to the profitable steel production, competitiveness of European steel industry and creation of new jobs opportunities. The real target for medium-long term research activities and initiatives is aimed at decreasing the “social footprint” of the steel industry targeting at high level technical challengers:
maintaining continuous improvement in product performance: e.g. high strength - development of both new products and the capability to make them
Extend service life – through new product development and use of more efficient coatings, the recycling of coatings, closing the loop within manufacturing
Education and communication – influencing public perceptions of steel in general, also for customers and markets
Product data tracking, maintaining steel identity (source/batch/history information) through manufacture, supply chain, use and EOL
Increase re-use – demonstrate the benefits with new business models (technology)
Improving carbon and energy efficiency of steel plant operation
Improving process yield and through supply chain yield– new process routes such as additive manufacturing, or optimize products to meet supply chain
Best use of information technology to balance supply and demand – operational plant IT systems, stock control, flexible manufacturing, response and delivery times
Using LCA/SATs to demonstrate value of steel in circular economy against alternative materials – social aspects such as flood defense, affordable housing, and agriculture and food production
In this frame the cross-sectorial approach and the cooperation with society and stakeholders is also essential. The above-depicted foreseen evolution is summarized in Fig. 3.
World Congress on Sustainable Technologies (WCST-2015)
Copyright © 2015 Technical Co-Sponsored by IEEE UK/RI Computer Chapter 38

Figure 3. Foreseen dimension and time evolution of the R&D activities.
IX. CONCLUSIONS
The paper presented an analysis of the ESTEP’s SRA concerning the topics which are directly related to resource efficiency. The SRA vision is one of smooth cooperation between the anthroposphere and the bio/ecosphere and to enforce a balanced respect for both. This raises challenges that the sector faces in terms of R&I in relation to sustainable steel production. The focus is on reducing the environmental footprint of steel production and steel solutions by reducing resource consumption, fostering the use of secondary raw materials and thus accelerating the move towards a more closed-loop economy, as well as by implementing energy efficiency, saving exergy, implementing process integration and eco-design approaches.
Environmental topics, constraints and commitments that have long been considered as external to the economy, business and metallurgy, are no more simple boundary conditions expressed by bother-some regulations, but an integral part of an holistic system, where nature and society, geo-, bio and anthropo-spheres interact at a complex level.
Holistic, transverse, cross-cultural and cross-sector approaches are the standard ways to move forward. Steel is not starting from a clean slate, as these issues have been embedded in its practice and culture for a long time (recycling, energy efficiency, zero waste, carbon-lean steel production processes, steel as an enabler of a leaner economy, etc.), but the pace of change should not slacken and it might even have to accelerate, as the world is becoming ever more populated, more compact and more demanding.
REFERENCES
[1] "Strategic Research Agenda: a vision for the future of the steel sector," March 2013, available at: ftp://ftp.cordis.europa.eu/pub/estep/docs/sra-052013-en.pdf.
[2] “World Steel in Figures 2015”, WorldSteel Association, May 2015, available at https://www.worldsteel.org/publications/bookshop/product-details.~World-Steel-in-Figures-2015~PRODUCT~World-Steel-in-Figures-2015~.html
[3] J.-P. Birat, “Steel and humanity's grand challenges,” Materiaux et Techniques, vol. 103(5), 2015.
[4] J.-P. Birat, V. Colla, E. Malfa, and J.S. Thomas, “The European Steel Technology Platform's Strategic Research Agenda vision for the sustainable steel production 2030s,” 14th IAEE European Energy Conference on Sustainable Energy Policy and Strategies for Europe, October 2014.
[5] J.-P. Birat, V. Colla, E. Malfa, and J.S. Thomas, “SUSTAINABLE steel production for the 2030s: The vision of the European Steel Technology Platform's Strategic Research Agenda (ESTEP's SRA,” Technical Proceedings of the 2014 NSTI Nanotechnology Conference and Expo, NSTI-Nanotech 2014, vol. 3, pp. 238-241, 2014.
[6] C. Pietrosanti, V. Colla, H. Peters: "Integrated Intelligent Manufacturing and Optimization: the hen and the egg", Proc. 2nd European Steel Technology and Application Days ESTAD 2015, Dusseldorf (Germany), June 15-19 2015.
[7] J.-P. Birat, “Life-cycle assessment, resource efficiency and recycling” Metallurgical Research and Technology, vol. 112(2), 2015.
[8] European Commission, “The European Innovation Partnership (EIP) on Raw Materials,” https://ec.europa.eu/growth/tools-databases/eip-raw-materials/en/content/european-innovation-partnership-eip-raw-materials, (Access date: 3 December 2015).
[9] R.A. Frosch, and N.E. Gallopoulos, “Strategies for Manufacturing,” Scientific American vol. 261(3), pp. 144–152, 1989.
[10] J.J. Klemeš et al., “Recent developments in advanced process integration: Learning the lessons from industrial implementations,” Applied Mechanics and Materials, vol. 625, pp. 454-457, 2014.
[11] G.F. Porzio et al.: “Process integration in energy and carbon intensive industries: An example of exploitation of optimization techniques and decision support,” Applied Thermal Engineering, vol. 70(2), pp. 1148-1155, September 2014.
[12] G.F. Porzio et al., “Process integration analysis and some economic-environmental implications for an innovative environmentally friendly recovery and pre-treatment of steel scrap,” Applied Energy, vol. 161, pp. 656-672, 2016.
[13] G.F. Porzio, E. Alcamisi, I. Matino, and V. Colla, “An integrated approach for industrial water systems optimal design,” Technical Proceedings of the 2014 NSTI Nanotechnology Conference and Expo, NSTI-Nanotech 2014, vol. 3, pp. 529-532, June 2014.
[14] C. Wang et al., “Techno-economic assessment of recovery and reuse of low temperature heat (T<350°C) in the steel industry by means of process integration,” Energy Procedia, vol. 61, pp. 2188-2191, 2014.
[15] T.A. Branca et al. “Investigation of (BOF) Converter slag use for agriculture in europe,” Metallurgical Research and Technology, vol. 111(3), pp. 155-167, 2014.
[16] C.-E. Grip, “Steel and sustainability: Scandinavian perspective,” Ironmaking and Steelmaking, vol. 32(3), pp. 235-241, 2005.
[17] A. Villar, J. Parrondo, and J.J. Arribas, “District heating from industrial surplus heat in Avilés (Spain)”, Environmental Progress and Sustainable Energy, vol. 33(4), pp. 1380-1388, 2014.
[18] E. Alcamisi et al., “Process integration solutions for water networks in integrated steel making plants,” Chemical Engineering Transactions, vol. 45, pp. 37-42, October 2015.
[19] A. Wedholm, M. Brämming, and D. Olofsson. “Activities for material resource efficiency at MEROX north”, 1st International Process Integration Forum for the Steel Industry 2014, Luleå, Sweden, June 2014.
[20] A.SPIRE aisbl. SPIRE Roadmap: Sustainable Process Industry through Resource and Energy Efficiency, issued on 25 October 2013, available at: http://www.spire2030.eu/uploads/Modules/Publications/spire-roadmap_december_2013_pbp.pdf.
[21] “Defining Life Cycle Assessment (LCA).” US Environmental Protection Agency. 17 October 2010.
[22] P.H. Brunner, and H. Rechberger. Practical Handbook of Material Flow Analysis. Lewis Publishers, New York. 2004.
[23] The Sovamat initiative, “The Social Value of Materials”, www.sovamat.org, (Access date: 3 December 2015).
World Congress on Sustainable Technologies (WCST-2015)
Copyright © 2015 Technical Co-Sponsored by IEEE UK/RI Computer Chapter 39
Workshop 1 (Part II): Efficient Use of Resources in Steel Plants through Process Integration (REFFIPLANT)
Integrated Optimisation of Blast Furnace Gas Wash Water Treatment, Reuse and Cost Savings. Part II: Analysis of Field Trials (Authors: Mansour Saiepour, Kokil Jain, Yuhang Lou)
Simulation Techniques for an Efficient use of Resources: An Overview for the Steelmaking Field (Authors: Ismael Matino, Valentina Colla, Lea Romaniello, Felice Rosito, Luigi Portulano)
Process Integration in Steelmaking Experiences and Challenges from the PRISMA Excellence Centre (Author: Mikael Larsson)
World Congress on Sustainable Technologies (WCST-2015)
Copyright © 2015 Technical Co-Sponsored by IEEE UK/RI Computer Chapter 40

Integrated Optimisation of Blast Furnace Gas Wash
Water Treatment, Reuse and Cost Savings
Part II: Analysis of Field Trials
Mansour Saiepour
Group Environment
Tata Steel Europe
Rotherham, UK
Kokil Jain and Yuhang Lou
Process Integration Limited
Manchester, UK
[email protected], [email protected]
Abstract— Within a European collaborative research project aimed at improving resource efficiency and environmental sustainability in steelmaking plants, simulations have been applied to evaluate integrated solutions for water recycling, reuse and treatment at a blast furnace gas washing plant. The blast furnace gas washing process, in steelworks, is a major water consumer and a significant contributor to water pollution. Environmental emissions and energy efficiency legislation have become increasingly stringent, and have made it essential to manage water and reduce emissions. Thus any reduction in blowdown flowrate from the process would significantly improve the quality of the discharged water. This in turn could unlock the potential for water reuse opportunities. This second part of the paper discusses the field trial results and the resulting simulation of different regeneration-reuse scenarios within the research undertaken at a Tata Steel blast furnace plant (UK) in collaboration with Process Integration Limited (UK). The research results have led to the identification of a range of benefits in terms of water conservation, material efficiency, energy efficiency, environmental compliance, and treatment costs.
Keywords - Hydrocyclone; Magnetic Filtration; Blast Furnace
Gas Wash; Water Reuse; Water efficiency; Reffiplant;
I. INTRODUCTION
As part of a European multi-partner research project, REFFIPLANT [1], started in July 2012, aimed at efficiency improvement of resources (materials, water, energy) in integrated steelmaking plants by minimising their consumption and by finding integrated solutions for recycling, reuse, and treatment of waste water. Tata Steel has collaborated with PIL (UK) to develop process integration solutions for recycling and reuse of process water.
This paper is the second part of the two paper series which describes the research undertaken at a Tata Steel blast furnace plant (UK) to model and simulate process integration options developed in particular for the blast furnace gas washing (BF GW) process water.
Earlier, part one of the paper had defined the base case, described the methodological framework and discussed the results for recycle-reuse analysis. It was concluded in the first part that direct recycling of the BF GW hydrocyclone overflow significantly improves the lagoon water quality, however the quality of the clarifier overflow water that flows into the cooling tower will deteriorate, and zinc and lead concentrations in the hydrocyclone sludge will increase to unacceptable levels. Hence, the clarifier overflow and the hydrocyclone overflow must both be treated. Based on these studies reverse osmosis (for the treatment of BF GW clarifier overflow) and magnetic filtration (for the treatment of hydrocyclone overflow) were identified as suitable treatment options for this purpose.
This second part of the paper discusses the field trial results and the resulting simulation of different regeneration-reuse scenarios. The proposed recycling schemes showed the following potential improvements:
• Lagoon discharge water quality improvement up to14% for suspended solids, 5% for dissolved solids,15% for chlorides and 90% for ammonia;
• Suspended and dissolved solids reduction in the inletwater stream to cooling tower up to 19% and 17%respectively;
• Increased recovery of iron from hydrocyclones andfilter sludge up to 28%;
• Reduction in pumping energy up to 1135 kWh due toreduction in pumping for blowdown to Lagoons;
• Reduction in freshwater demand of up to 1008 m3/day;
• Total cost reduction of up to £372 k/year (50%).
World Congress on Sustainable Technologies (WCST-2015)
Copyright © 2015 Technical Co-Sponsored by IEEE UK/RI Computer Chapter 41

II. REGENERATION-REUSE ANALYSIS
A. Reverse Osmosis for treating the clarifier overflow
In order to control the dissolved material (TDS, Chlorides and Ammonia) as well as the suspended solids, it was decided to add a Reverse Osmosis (RO) unit in a side-stream of the BF GW cooling tower inlet (clarifier overflow) stream (Fig. 1). RO unit can concentrate the contaminants in a reject stream which can be sent directly to the slag granulation unit, while the permeate stream (i.e. purified water) can be sent back to the gas wash circuit, hence improving the water quality. Such application of reverse osmosis unit in blast furnace gas wash circuit has been reported in the past by Terril and Neufied [2].
Reverse Osmosis was selected in this case since all three contaminants (TDS, Chlorides and Ammonia) were deemed to be operating close to their operational limits, as a result of the hydrocyclone overflow recycling. Treatment units targeting a particular contaminant can be considered if only one of the contaminants is of concern. For instance, treatment options for ammonia include air stripping and break-point chlorination.
Calculated values of contaminant concentrations for the permeate and the reject streams of a typical RO unit are shown in Fig. 1. Table I indicates the potential improvements in the cooling tower inlet water quality that may be achieved with RO units with flow rates of 13 and 58 m
3/h. The selection of these
RO flow rates was based on initial investigation which showed that a relatively small size (13 m
3/h) is sufficient for the 2
hydrocyclone recycle case, but a larger unit (58 m3/h) would be
required when all three hydrocyclones are recycled.
Figure 1. Reverse Osmosis Unit Location in BF GW process
TABLE I. REVERSE OSMOSIS (RO) TREATMENT UNIT PERFORMANCE
FOR 13 M3/H AND 58 M3/H
B. Filtration of the recycled hydrocyclone overflow
In terms of treatment needs, it was discussed that suspended solids are best managed by applying filtration techniques on streams where suspended solids are in higher concentration e.g. hydrocyclone overflow. This approach has the added benefit of sludge recovery which can be recycled back to the blast furnace if zinc and lead are selectively separated.
Magnetic filtration had previously been used as part of a different research project at a Tata Steel rolling mill [3] and hence was identified as a promising technique in this application. However, this technique had not previously been tested for the BF GW water application and it was decided to carry out a field trial to evaluate the effectiveness of this option.
1) Magnetic Field Trials A commercially available (Automag Skid) magnetic
separation unit [4] has been assessed for the filtration of suspended solids in the hydrocyclone overflow as shown below in Figs. 2 and 3 (a and b).
Figure 2. Flowscheme adopted for magnetic filter trials
Figure 3. Pictures captured during magnetic filter trial period – (a) view of
magnetic filter, clarifier and hydrocyclones
World Congress on Sustainable Technologies (WCST-2015)
Copyright © 2015 Technical Co-Sponsored by IEEE UK/RI Computer Chapter 42
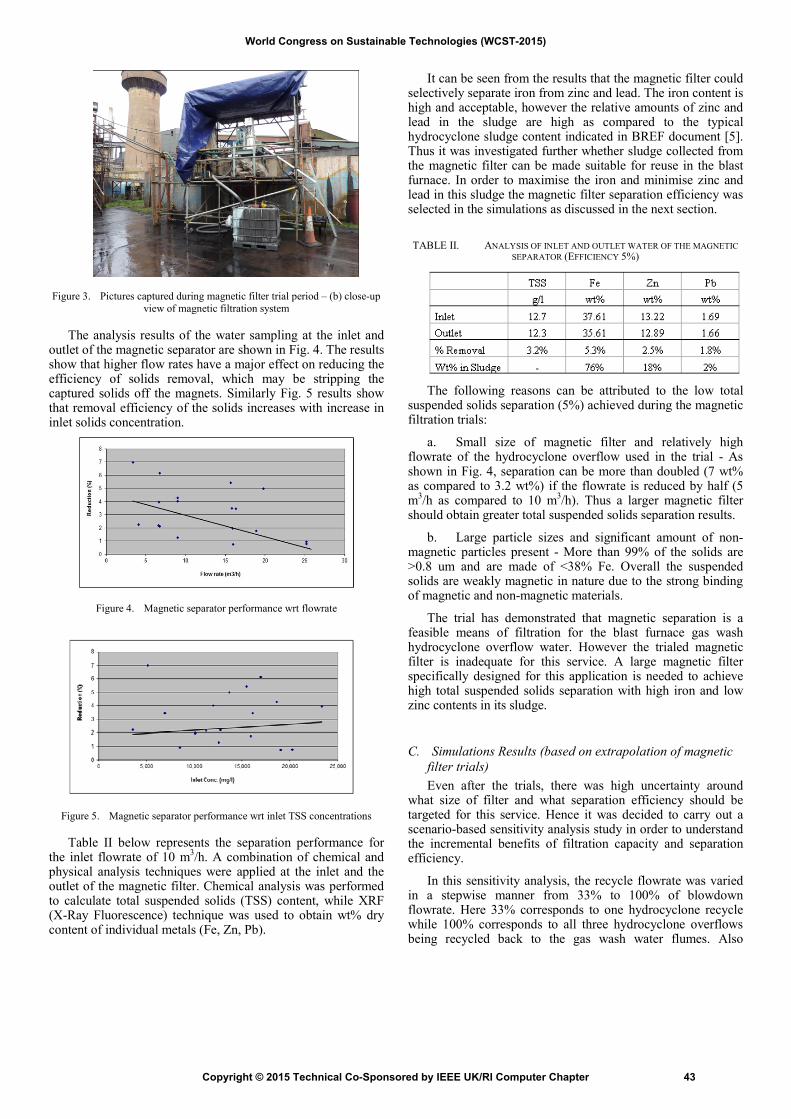
Figure 3. Pictures captured during magnetic filter trial period – (b) close-up
view of magnetic filtration system
The analysis results of the water sampling at the inlet and outlet of the magnetic separator are shown in Fig. 4. The results show that higher flow rates have a major effect on reducing the efficiency of solids removal, which may be stripping the captured solids off the magnets. Similarly Fig. 5 results show that removal efficiency of the solids increases with increase in inlet solids concentration.
Figure 4. Magnetic separator performance wrt flowrate
Figure 5. Magnetic separator performance wrt inlet TSS concentrations
Table II below represents the separation performance for the inlet flowrate of 10 m
3/h. A combination of chemical and
physical analysis techniques were applied at the inlet and the outlet of the magnetic filter. Chemical analysis was performed to calculate total suspended solids (TSS) content, while XRF (X-Ray Fluorescence) technique was used to obtain wt% dry content of individual metals (Fe, Zn, Pb).
It can be seen from the results that the magnetic filter could selectively separate iron from zinc and lead. The iron content is high and acceptable, however the relative amounts of zinc and lead in the sludge are high as compared to the typical hydrocyclone sludge content indicated in BREF document [5]. Thus it was investigated further whether sludge collected from the magnetic filter can be made suitable for reuse in the blast furnace. In order to maximise the iron and minimise zinc and lead in this sludge the magnetic filter separation efficiency was selected in the simulations as discussed in the next section.
TABLE II. ANALYSIS OF INLET AND OUTLET WATER OF THE MAGNETIC
SEPARATOR (EFFICIENCY 5%)
The following reasons can be attributed to the low total suspended solids separation (5%) achieved during the magnetic filtration trials:
a. Small size of magnetic filter and relatively high flowrate of the hydrocyclone overflow used in the trial - As shown in Fig. 4, separation can be more than doubled (7 wt% as compared to 3.2 wt%) if the flowrate is reduced by half (5 m
3/h as compared to 10 m
3/h). Thus a larger magnetic filter
should obtain greater total suspended solids separation results.
b. Large particle sizes and significant amount of non-magnetic particles present - More than 99% of the solids are >0.8 um and are made of <38% Fe. Overall the suspended solids are weakly magnetic in nature due to the strong binding of magnetic and non-magnetic materials.
The trial has demonstrated that magnetic separation is a feasible means of filtration for the blast furnace gas wash hydrocyclone overflow water. However the trialed magnetic filter is inadequate for this service. A large magnetic filter specifically designed for this application is needed to achieve high total suspended solids separation with high iron and low zinc contents in its sludge.
C. Simulations Results (based on extrapolation of magnetic
filter trials)
Even after the trials, there was high uncertainty around what size of filter and what separation efficiency should be targeted for this service. Hence it was decided to carry out a scenario-based sensitivity analysis study in order to understand the incremental benefits of filtration capacity and separation efficiency.
In this sensitivity analysis, the recycle flowrate was varied in a stepwise manner from 33% to 100% of blowdown flowrate. Here 33% corresponds to one hydrocyclone recycle while 100% corresponds to all three hydrocyclone overflows being recycled back to the gas wash water flumes. Also
World Congress on Sustainable Technologies (WCST-2015)
Copyright © 2015 Technical Co-Sponsored by IEEE UK/RI Computer Chapter 43
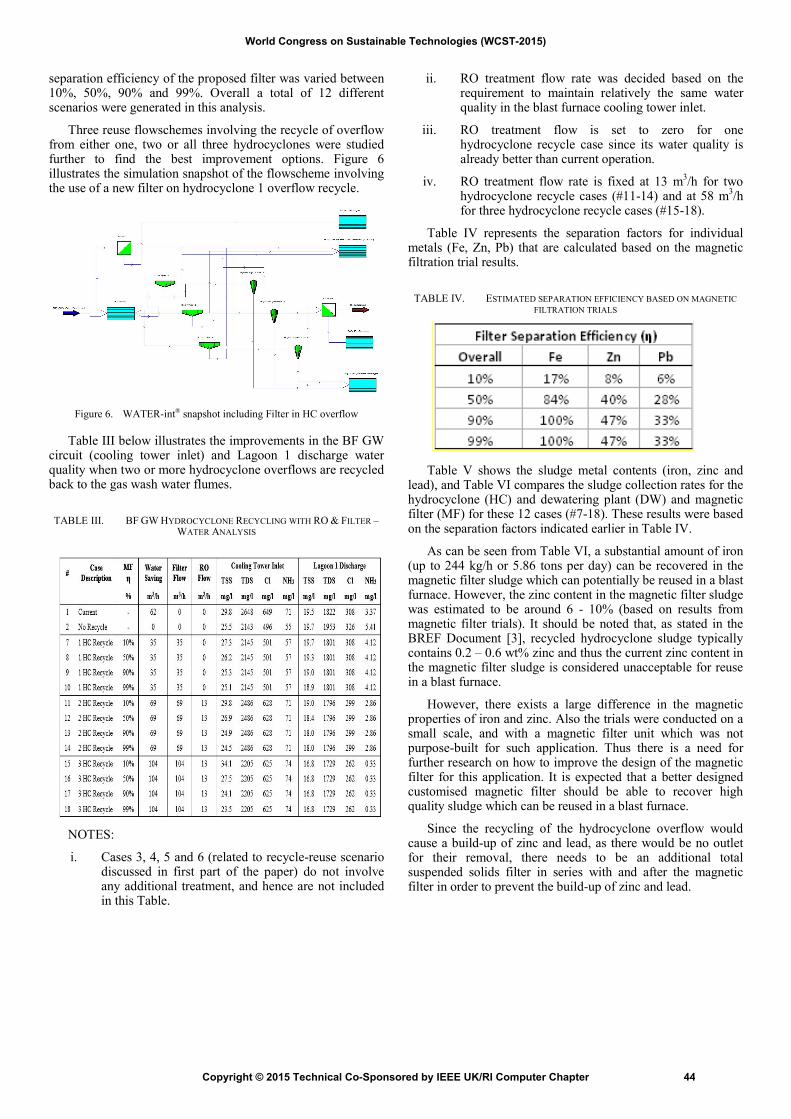
separation efficiency of the proposed filter was varied between 10%, 50%, 90% and 99%. Overall a total of 12 different scenarios were generated in this analysis.
Three reuse flowschemes involving the recycle of overflow from either one, two or all three hydrocyclones were studied further to find the best improvement options. Figure 6 illustrates the simulation snapshot of the flowscheme involving the use of a new filter on hydrocyclone 1 overflow recycle.
Figure 6. WATER-int® snapshot including Filter in HC overflow
Table III below illustrates the improvements in the BF GW circuit (cooling tower inlet) and Lagoon 1 discharge water quality when two or more hydrocyclone overflows are recycled back to the gas wash water flumes.
TABLE III. BF GW HYDROCYCLONE RECYCLING WITH RO & FILTER – WATER ANALYSIS
NOTES:
i. Cases 3, 4, 5 and 6 (related to recycle-reuse scenario discussed in first part of the paper) do not involve any additional treatment, and hence are not included in this Table.
ii. RO treatment flow rate was decided based on the requirement to maintain relatively the same water quality in the blast furnace cooling tower inlet.
iii. RO treatment flow is set to zero for one hydrocyclone recycle case since its water quality is already better than current operation.
iv. RO treatment flow rate is fixed at 13 m3/h for two
hydrocyclone recycle cases (#11-14) and at 58 m3/h
for three hydrocyclone recycle cases (#15-18).
Table IV represents the separation factors for individual metals (Fe, Zn, Pb) that are calculated based on the magnetic filtration trial results.
TABLE IV. ESTIMATED SEPARATION EFFICIENCY BASED ON MAGNETIC
FILTRATION TRIALS
Table V shows the sludge metal contents (iron, zinc and lead), and Table VI compares the sludge collection rates for the hydrocyclone (HC) and dewatering plant (DW) and magnetic filter (MF) for these 12 cases (#7-18). These results were based on the separation factors indicated earlier in Table IV.
As can be seen from Table VI, a substantial amount of iron (up to 244 kg/h or 5.86 tons per day) can be recovered in the magnetic filter sludge which can potentially be reused in a blast furnace. However, the zinc content in the magnetic filter sludge was estimated to be around 6 - 10% (based on results from magnetic filter trials). It should be noted that, as stated in the BREF Document [3], recycled hydrocyclone sludge typically contains 0.2 – 0.6 wt% zinc and thus the current zinc content in the magnetic filter sludge is considered unacceptable for reuse in a blast furnace.
However, there exists a large difference in the magnetic properties of iron and zinc. Also the trials were conducted on a small scale, and with a magnetic filter unit which was not purpose-built for such application. Thus there is a need for further research on how to improve the design of the magnetic filter for this application. It is expected that a better designed customised magnetic filter should be able to recover high quality sludge which can be reused in a blast furnace.
Since the recycling of the hydrocyclone overflow would cause a build-up of zinc and lead, as there would be no outlet for their removal, there needs to be an additional total suspended solids filter in series with and after the magnetic filter in order to prevent the build-up of zinc and lead.
World Congress on Sustainable Technologies (WCST-2015)
Copyright © 2015 Technical Co-Sponsored by IEEE UK/RI Computer Chapter 44

TABLE V. BF GW HYDROCYCLONE RECYCLING WITH RO & FILTER – SLUDGE ANALYSIS
TABLE VI. BF GW HYDROCYCLONE RECYCLING WITH RO & FILTER – SLUDGE COLLECTION RATE
NOTE: HC = Hydrocyclone, MF = Magnetic Filter, DW = Dewatering Plant, η = MF Efficiency
D. Cost-benefit Analysis
Table VII summarises the cost information used for calculating the operating costs of the above discussed regeneration-reuse scenarios. Since size of the treatment unit varies for different scenarios, six-tenth rule was used for capital cost estimation. Capital cost quotations for the base size are indicated in Table VII. For example, RO unit cost for a processing capacity of 58 m
3/h can be estimated as follows:
In this case base cost is £407,760 for a base size of 13 m3/h.
Thus cost for the target size of 58 m3/h =
£407,760 * (58/13)^0.6 = £1,000,220.
TABLE VII. COST INFORMATION
Table VIII represents the operating costs breakdown for the proposed regeneration reuse analysis scenarios. The following conclusions can be drawn from this Table:
a. Pumping represents a major cost in the system due to agitation needs and the large distance between the blast furnace and lagoon systems.
b. RO treatment is not required for 1 hydrocyclone recycle cases, and a relatively small size (13 m
3/h) is required for
2 hydrocyclone recycle cases. It is only when all three hydrocyclones are recycled that the unit size and the cost of RO treatment become substantial, but this is offset by the cost savings and other benefits.
c. Total operating cost reduces with increase in recycle flow due to the reduced pumping and dewatering costs.
For a given recycle flow, operating cost slightly increases with increase in filtration efficiency requirement. However this can be easily overcome by the benefits of improved water quality and increased sludge recovery.
TABLE VIII. BF GW HYDROCYCLONE RECYCLING WITH RO & FILTER – OPERATING COST ANALYSIS
World Congress on Sustainable Technologies (WCST-2015)
Copyright © 2015 Technical Co-Sponsored by IEEE UK/RI Computer Chapter 45

Table IX represents the trade-offs between capital investment and operating costs. The Table indicates the potential payback periods for the different scenarios studied compared to both the current operation and no recycle cases.
As can be seen from Table IX, the payback period is less than one year if compared against the no recycle case which was the original design case for the system. The payback period varies from 1.2 to 2.2 years if compared against the current operation. It should be noted that these payback period calculations are sensitive to the economic value assigned to the recovered iron and water savings, and hence need to be considered further before a final investment decision is made.
TABLE IX. BF GW HYDROCYCLONE RECYCLING WITH RO & FILTER – PAYBACK PERIOD ANALYSIS
NOTES:
a. Water savings are shown in negative because one hydrocyclone recycle case needs more makeup water than current case. This is because the current case already has one hydrocyclone overflow being recycled in addition to recycle from the agitator tanks.
b. Cases 7-10 (for 1 hydrocyclone recycle) have negative payback periods wrt current operation because both capital cost and operating cost are higher in these cases with respect to current operation. This is because 1HC Recycle case needs additional investment in magnetic filter while the amount of recycle is less than current operation and hence pumping and freshwater costs are higher.
III. CONCLUSIONS
Overall it can be concluded that BF GW hydrocyclone overflow recycling with appropriate treatment has numerous
environmental and economic benefits. The most effective treatment identified in this research was Reverse Osmosis in side-stream of the clarifier overflow stream, and magnetic filtration for the hydrocyclone overflow recycled water.
The implementation of hydrocyclone overflow recycling with the above treatment in the BF GW water circuit has the potential to achieve the following objectives:
• Improvement in final lagoon water quality due to reduced blowdown,
• Improvement of water quality in BF GW circuit from treatment,
• Increased sludge (iron) recovery from hydrocyclone and new magnetic filter,
• Lower pumping and agitation costs,
• Lower third-party dewatering plant costs,
• Lower freshwater makeup demand due to reduced blowdown.
Table IX earlier had summarised the economic benefits and payback time that can be expected from the implementation of these solutions. Table X below summarises the range of potential improvements that can be achieved in the water system studied.
TABLE X. SUMMARY OF POTENTIAL IMPROVEMENTS FROM
HYDROCYCLONE OVERFLOW RECYCLING
NOTE: Hydrocyclone recycle cases presented above are based on 90% separation efficiency of magnetic filter.
* Assuming that the magnetic filter is well designed to produce reusable sludge.
A summary of costs, savings and benefits of these options are listed below in Table XI. The Table shows that option “3 HC Recycle” apart from the initial capital investment, and potential increase in zinc content of sludge, provides greater advantages. However, if the capital investment or sludge zinc content becomes a concern then option “2 HC Recycle” will be a good alternative.
World Congress on Sustainable Technologies (WCST-2015)
Copyright © 2015 Technical Co-Sponsored by IEEE UK/RI Computer Chapter 46

TABLE XI. SUMMARY OF OPTIONS
* Assuming that the magnetic filter is well designed toproduce reusable sludge.
An important point to note is that these solutions may enable the Tata Steel site to meet future environmental legislation and to de-bottleneck the water system to enable steel production capacity expansion in future.
Based on the research presented in this two part paper, the following two options may be recommended for implementation:
• Three hydrocyclone overflows recycled back to flumeswith the overflow stream treated by magnetic filtrationwith 90% separation efficiency and side-stream fromclarifier overflow treated in a 58 m
3/h RO unit. This
will achieve significant improvements as mentionedabove with a payback period of 1.5 years.
• Two hydrocyclone overflow recycled back to flumeswith the overflow stream treated by magnetic filtrationwith 90% separation efficiency, and side-stream fromclarifier overflow treated in a 13 m
3/h RO unit. This
will achieve the benefits mentioned above with apayback period of 2.1 years.
Further field trials and discussions with Reverse Osmosis and magnetic filtration vendors are recommended before finalising the design for implementation. The new magnetic filter should be designed for this application such that the iron content in the sludge is maximised, while the zinc and lead contents are minimised to enable recovery of high quality sludge which can be reused in a blast furnace.
ACKNOWLEDGMENT
The work described in the present paper was developed within the project entitled "REFFIPLANT - Efficient Use of Resources in Steel Plants through Process Integration” (Contract No. RFSR-CT-2012-00039), and has received funding from the Research Fund for Coal and Steel of the European Union, which is gratefully acknowledged. The sole responsibility of the issues treated in the present paper lies with the authors; the Union is not responsible for any use that may be made of the information contained therein.
WATER-int® is next generation optimisation software currently under development within Process Integration Limited. It is an improvement over WATER software
developed earlier by Center for Process Integration at The University of Manchester.
REFERENCES
[1] Colla V., et al: “Efficient use of resources in steel plants through process integration – REFFIPLANT.” RFCS Contract No. RFSR-CT-2012-00039, 2012-2015,pp. 643. ftp://ftp.cordis.europa.eu/pub/coal-steel-rtd/docs/summaries-rfcs_en.pdf. (Access date: 12 Nov. 2015).
[2] Terril, M. E. and R. D. Neufeld, “Reverse osmosis of blast-furnace scrubber water.” Environment Progress, 2, 1983, pp. 121–127.
[3] Saiepour, M., & Hubrich, M., Magnetic separation of fine particles from process water circuits in the steel industry. In The European Conference on Sustainability, Energy & the Environment (ECSEE 2015). Brighton, UK.
[4] Automag skid magnetic filtration system – Manufacturer Information. Eclipse Magnetics.
http://www.eclipsemagnetics.com/row/product-range/filtration-systems/amc-skid-single-automag-skid.html (2014). (Access date: 12 Nov. 2015).
[5] Remus, R.M., et al: “ Best Available Techniques (BAT) Reference Document for Iron and Steel Production” (Report EUR 25521 EN), European Commission - Joint Research Centre - Institute for prospective technological studies, pp.151.http://eippcb.jrc.ec.europa.eu/ reference/BREF/IS_Adopted_03_2012.pdf (Access date: 12 Nov. 2015).
World Congress on Sustainable Technologies (WCST-2015)
Copyright © 2015 Technical Co-Sponsored by IEEE UK/RI Computer Chapter 47

Simulation Techniques for an Efficient Use of Resources: An Overview for the Steelmaking Field
Ismael Matino and Valentina Colla TeCIP Institute
Scuola Superiore Sant’Anna, SSSA Pisa, Italy
[email protected], [email protected]
Lea Romaniello*, Felice Rosito and Luigi Portulano *Innovation and Technological Development
ILVA SpA Taranto, Italy
[email protected], [email protected],
Abstract — Resource efficiency has always been a hot topic for the steel industry, due to the large amounts of primary raw materials, by products and water, which are handled in the steelmaking cycle as well as the considerable energy consumptions. The ever more stringent environmental regulations also contribute to pressurize the iron and steel industry to strengthen further its research activities fostering an optimal management and exploitation of resources. Thus important research efforts are spent in order to find the best way to recover wastes and wastewater also involving the implementation of retrofit actions and major plant modifications allowing also the reduction of primary raw material consumption and of waste disposal. In order to achieve such ambitious objective, which implies both environmental benefits and cost savings, process integration is a powerful tool. The assessment of the viability of process integration solution necessarily include a final experimental stage to be performed at plant level, which can be expensive or unsafe. To this aim process simulation can be a useful alternative to accomplish preliminary feasibility studies allowing a deep analysis of all the aspect of a particular technology or retrofit actions, which also allows testing conditions that are very difficult to replicate within practical experiments. Different levels of detail can be achieved and a comprehensive analysis can be carried out. The present paper provides an overview of the simulation techniques exploited during the project entitled “Efficient Use of Resources in Steel Plants through Process Integration” to the aim of optimizing the use of resources in an Italian integrated steelmaking plant. In particular, different case studies are proposed and the obtained meaningful and practical results are presented and discussed.
Keywords-Process simulation, resources efficiency, recycling, steelmaking industry sustainability, process integration
I. INTRODUCTION
A sustainable steel production is possible only by implementing a careful resources management.
The ever more stringent environmental regulations also pressurize all the European process industries to enforce their actions and research activities in order to foster an optimal management and exploitation of resources. [1].
In the particular case of integrated steelmaking facilities, considerable amounts of waste and by-products are produced
that can be valorized by obtaining environmental and economic advantages as well as a decrease in waste generation and disposal [2]. The same resource efficiency concepts can be applied to reduce the freshwater intake and emission [3-4]. For instance, ad-hoc treatments can allow obtaining recyclable fractions from solid by-products. Many studies have been carried out on these topics, such as those dealing with the reuse and recycling of steelmaking slags [5-13] and mill scales [14-15]. Several studies focused also on water blow downs recovery: suitable features make blow down streams appropriate for their reuse as make-up water in other processes with or without ad-hoc pretreatments [3-4] [16]. All these studies belong to the wide category of Process Integration (PI) analyses and methods. PI is defined by International Energy Agency (IEA) as a "Systematic and General Methods for Designing Integrated Production Systems, ranging from Individual Processes to Total Sites, with special emphasis on the Efficient Use of Energy and reducing Environmental Effects" [17].
In the perspective of PI many efforts have been spent in the last years mainly in the energy [18] and water fields: theoretical studies, pinch analyses [19], experimental campaigns as well as innovative techniques [20] such as the combination of common analyses and the use of process modelling and simulation [21-25]. Process simulation can be considered as a transversal tool to couple with the other established process investigation techniques in order to allow detailed analyses taking into account all the relevant aspects for assessing the viability of modifications of over-complex industrial processes [26-27].
Moreover, process simulation allows assessing also non-conventional scenarios or operating conditions that, although can potentially provide process improvements, are difficult to evaluate and test [28-29]. A well designed simulation system can represent a powerful test field, namely as a sort of virtual plant where realistic “experiments” can be performed at limited cost and in an affordable time span without any consequence on plant safety and efficiency, although the consequences also in these contexts can be thoroughly evaluated.
This paper presents an overview of all the simulation techniques and analyses that have been carried out during the
World Congress on Sustainable Technologies (WCST-2015)
Copyright © 2015 Technical Co-Sponsored by IEEE UK/RI Computer Chapter 48
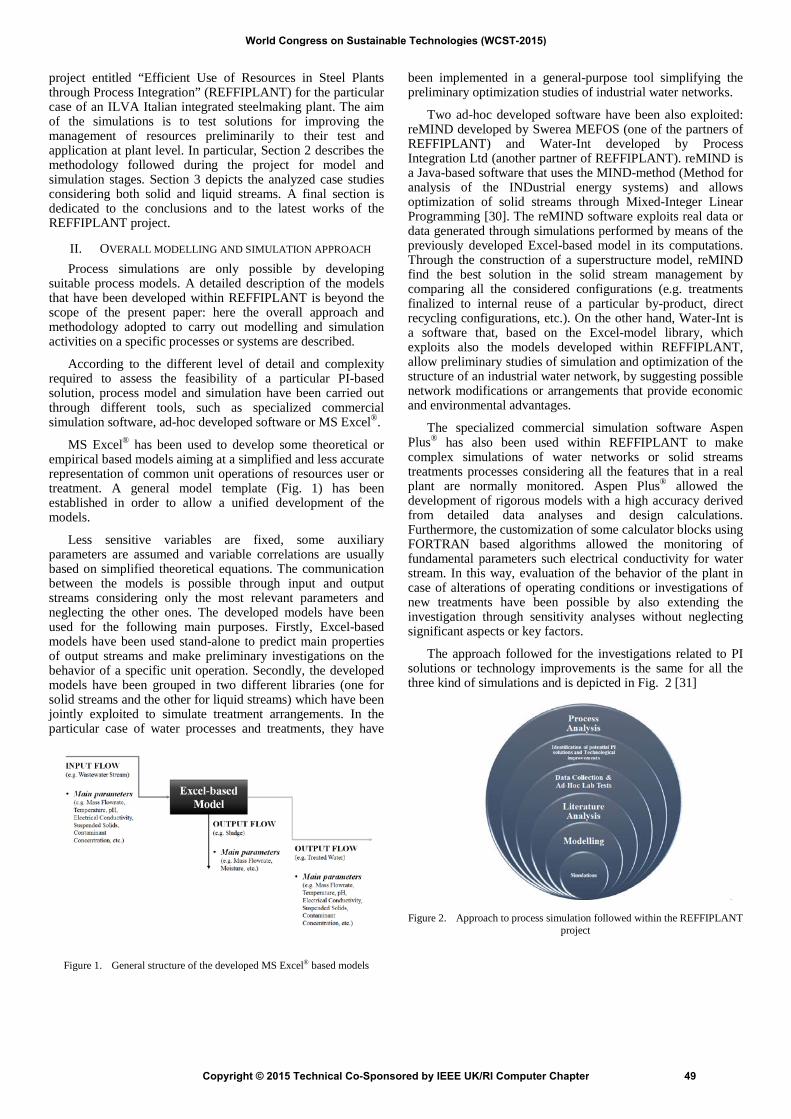
project entitled “Efficient Use of Resources in Steel Plants through Process Integration” (REFFIPLANT) for the particular case of an ILVA Italian integrated steelmaking plant. The aim of the simulations is to test solutions for improving the management of resources preliminarily to their test and application at plant level. In particular, Section 2 describes the methodology followed during the project for model and simulation stages. Section 3 depicts the analyzed case studies considering both solid and liquid streams. A final section is dedicated to the conclusions and to the latest works of the REFFIPLANT project.
II. OVERALL MODELLING AND SIMULATION APPROACH
Process simulations are only possible by developing suitable process models. A detailed description of the models that have been developed within REFFIPLANT is beyond the scope of the present paper: here the overall approach and methodology adopted to carry out modelling and simulation activities on a specific processes or systems are described.
According to the different level of detail and complexity required to assess the feasibility of a particular PI-based solution, process model and simulation have been carried out through different tools, such as specialized commercial simulation software, ad-hoc developed software or MS Excel®.
MS Excel® has been used to develop some theoretical or empirical based models aiming at a simplified and less accurate representation of common unit operations of resources user or treatment. A general model template (Fig. 1) has been established in order to allow a unified development of the models.
Less sensitive variables are fixed, some auxiliary parameters are assumed and variable correlations are usually based on simplified theoretical equations. The communication between the models is possible through input and output streams considering only the most relevant parameters and neglecting the other ones. The developed models have been used for the following main purposes. Firstly, Excel-based models have been used stand-alone to predict main properties of output streams and make preliminary investigations on the behavior of a specific unit operation. Secondly, the developed models have been grouped in two different libraries (one for solid streams and the other for liquid streams) which have been jointly exploited to simulate treatment arrangements. In the particular case of water processes and treatments, they have
been implemented in a general-purpose tool simplifying the preliminary optimization studies of industrial water networks.
Two ad-hoc developed software have been also exploited: reMIND developed by Swerea MEFOS (one of the partners of REFFIPLANT) and Water-Int developed by Process Integration Ltd (another partner of REFFIPLANT). reMIND is a Java-based software that uses the MIND-method (Method for analysis of the INDustrial energy systems) and allows optimization of solid streams through Mixed-Integer Linear Programming [30]. The reMIND software exploits real data or data generated through simulations performed by means of the previously developed Excel-based model in its computations. Through the construction of a superstructure model, reMIND find the best solution in the solid stream management by comparing all the considered configurations (e.g. treatments finalized to internal reuse of a particular by-product, direct recycling configurations, etc.). On the other hand, Water-Int is a software that, based on the Excel-model library, which exploits also the models developed within REFFIPLANT, allow preliminary studies of simulation and optimization of the structure of an industrial water network, by suggesting possible network modifications or arrangements that provide economic and environmental advantages.
The specialized commercial simulation software Aspen Plus® has also been used within REFFIPLANT to make complex simulations of water networks or solid streams treatments processes considering all the features that in a real plant are normally monitored. Aspen Plus® allowed the development of rigorous models with a high accuracy derived from detailed data analyses and design calculations. Furthermore, the customization of some calculator blocks using FORTRAN based algorithms allowed the monitoring of fundamental parameters such electrical conductivity for water stream. In this way, evaluation of the behavior of the plant in case of alterations of operating conditions or investigations of new treatments have been possible by also extending the investigation through sensitivity analyses without neglecting significant aspects or key factors.
The approach followed for the investigations related to PI solutions or technology improvements is the same for all the three kind of simulations and is depicted in Fig. 2 [31]
Figure 1. General structure of the developed MS Excel® based models
Figure 2. Approach to process simulation followed within the REFFIPLANT project
World Congress on Sustainable Technologies (WCST-2015)
Copyright © 2015 Technical Co-Sponsored by IEEE UK/RI Computer Chapter 49
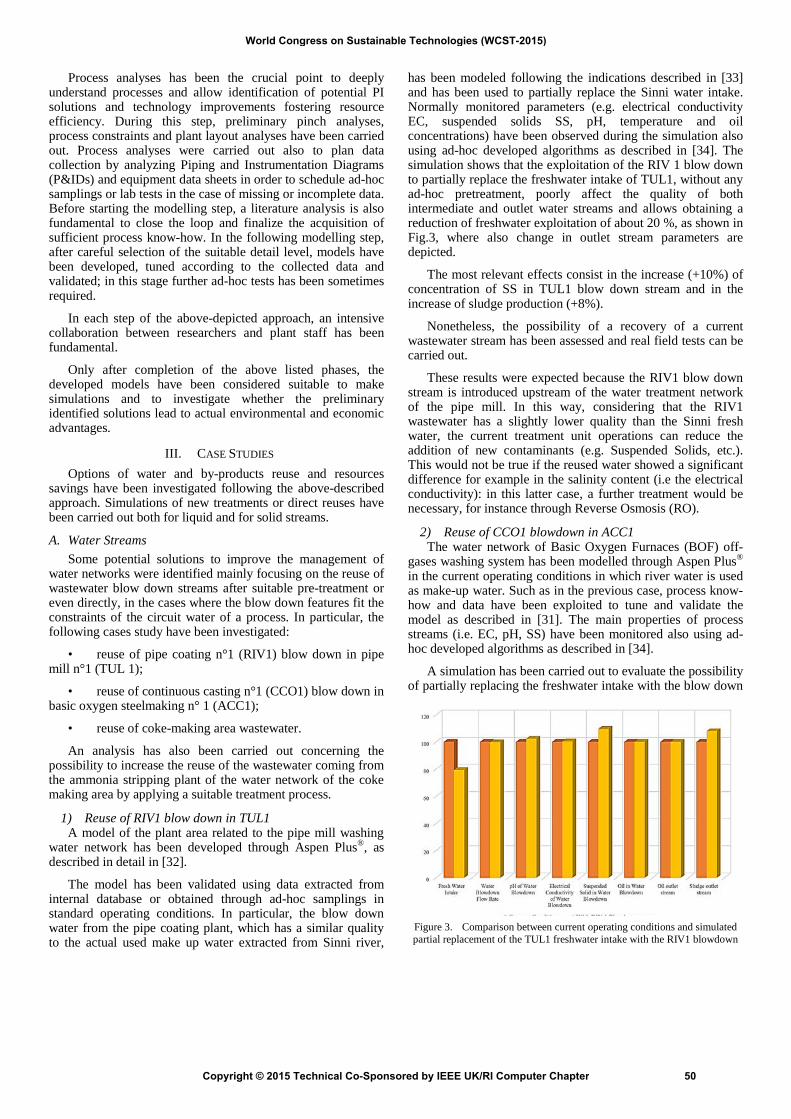
Process analyses has been the crucial point to deeply understand processes and allow identification of potential PI solutions and technology improvements fostering resource efficiency. During this step, preliminary pinch analyses, process constraints and plant layout analyses have been carried out. Process analyses were carried out also to plan data collection by analyzing Piping and Instrumentation Diagrams (P&IDs) and equipment data sheets in order to schedule ad-hoc samplings or lab tests in the case of missing or incomplete data. Before starting the modelling step, a literature analysis is also fundamental to close the loop and finalize the acquisition of sufficient process know-how. In the following modelling step, after careful selection of the suitable detail level, models have been developed, tuned according to the collected data and validated; in this stage further ad-hoc tests has been sometimes required.
In each step of the above-depicted approach, an intensive collaboration between researchers and plant staff has been fundamental.
Only after completion of the above listed phases, the developed models have been considered suitable to make simulations and to investigate whether the preliminary identified solutions lead to actual environmental and economic advantages.
III. CASE STUDIES
Options of water and by-products reuse and resources savings have been investigated following the above-described approach. Simulations of new treatments or direct reuses have been carried out both for liquid and for solid streams.
A. Water Streams Some potential solutions to improve the management of
water networks were identified mainly focusing on the reuse of wastewater blow down streams after suitable pre-treatment or even directly, in the cases where the blow down features fit the constraints of the circuit water of a process. In particular, the following cases study have been investigated:
• reuse of pipe coating n°1 (RIV1) blow down in pipemill n°1 (TUL 1);
• reuse of continuous casting n°1 (CCO1) blow down inbasic oxygen steelmaking n° 1 (ACC1);
• reuse of coke-making area wastewater.
An analysis has also been carried out concerning the possibility to increase the reuse of the wastewater coming from the ammonia stripping plant of the water network of the coke making area by applying a suitable treatment process.
1) Reuse of RIV1 blow down in TUL1A model of the plant area related to the pipe mill washing
water network has been developed through Aspen Plus®, as described in detail in [32].
The model has been validated using data extracted from internal database or obtained through ad-hoc samplings in standard operating conditions. In particular, the blow down water from the pipe coating plant, which has a similar quality to the actual used make up water extracted from Sinni river,
has been modeled following the indications described in [33] and has been used to partially replace the Sinni water intake. Normally monitored parameters (e.g. electrical conductivity EC, suspended solids SS, pH, temperature and oil concentrations) have been observed during the simulation also using ad-hoc developed algorithms as described in [34]. The simulation shows that the exploitation of the RIV 1 blow down to partially replace the freshwater intake of TUL1, without any ad-hoc pretreatment, poorly affect the quality of both intermediate and outlet water streams and allows obtaining a reduction of freshwater exploitation of about 20 %, as shown in Fig.3, where also change in outlet stream parameters are depicted.
The most relevant effects consist in the increase (+10%) of concentration of SS in TUL1 blow down stream and in the increase of sludge production (+8%).
Nonetheless, the possibility of a recovery of a current wastewater stream has been assessed and real field tests can be carried out.
These results were expected because the RIV1 blow down stream is introduced upstream of the water treatment network of the pipe mill. In this way, considering that the RIV1 wastewater has a slightly lower quality than the Sinni fresh water, the current treatment unit operations can reduce the addition of new contaminants (e.g. Suspended Solids, etc.). This would not be true if the reused water showed a significant difference for example in the salinity content (i.e the electrical conductivity): in this latter case, a further treatment would be necessary, for instance through Reverse Osmosis (RO).
2) Reuse of CCO1 blowdown in ACC1The water network of Basic Oxygen Furnaces (BOF) off-
gases washing system has been modelled through Aspen Plus® in the current operating conditions in which river water is used as make-up water. Such as in the previous case, process know-how and data have been exploited to tune and validate the model as described in [31]. The main properties of process streams (i.e. EC, pH, SS) have been monitored also using ad-hoc developed algorithms as described in [34].
A simulation has been carried out to evaluate the possibility of partially replacing the freshwater intake with the blow down
Figure 3. Comparison between current operating conditions and simulated partial replacement of the TUL1 freshwater intake with the RIV1 blowdown
World Congress on Sustainable Technologies (WCST-2015)
Copyright © 2015 Technical Co-Sponsored by IEEE UK/RI Computer Chapter 50
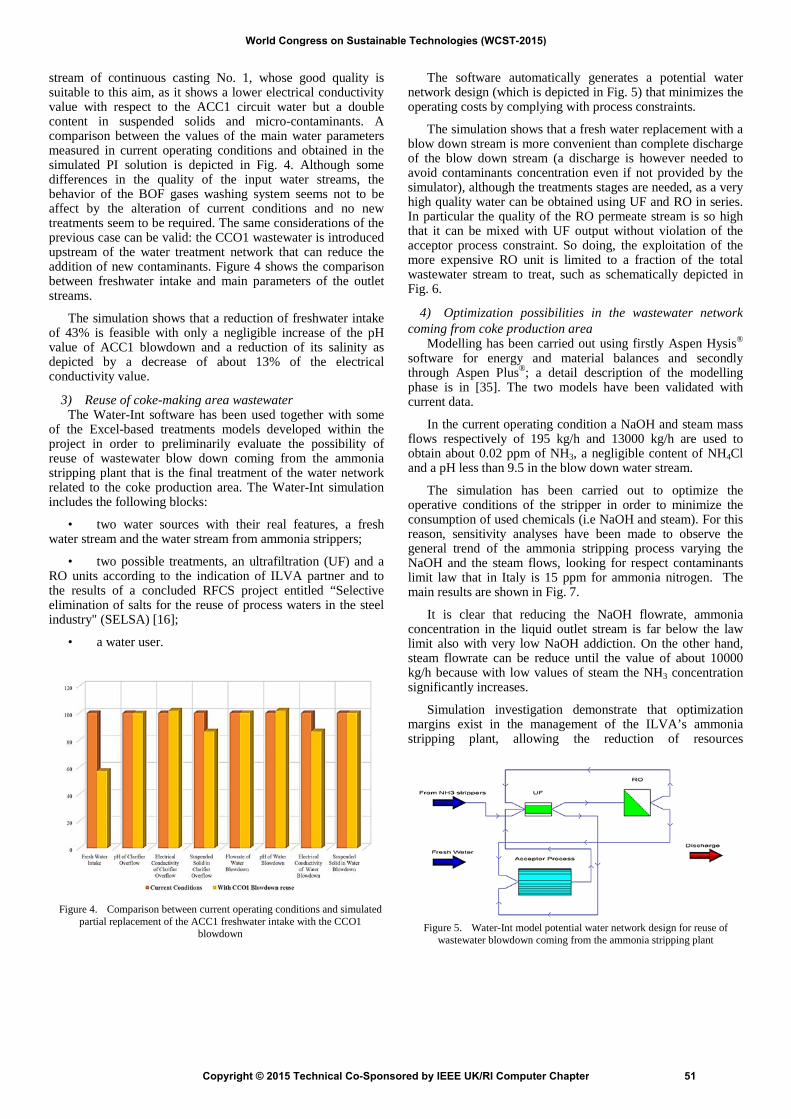
stream of continuous casting No. 1, whose good quality is suitable to this aim, as it shows a lower electrical conductivity value with respect to the ACC1 circuit water but a double content in suspended solids and micro-contaminants. A comparison between the values of the main water parameters measured in current operating conditions and obtained in the simulated PI solution is depicted in Fig. 4. Although some differences in the quality of the input water streams, the behavior of the BOF gases washing system seems not to be affect by the alteration of current conditions and no new treatments seem to be required. The same considerations of the previous case can be valid: the CCO1 wastewater is introduced upstream of the water treatment network that can reduce the addition of new contaminants. Figure 4 shows the comparison between freshwater intake and main parameters of the outlet streams.
The simulation shows that a reduction of freshwater intake of 43% is feasible with only a negligible increase of the pH value of ACC1 blowdown and a reduction of its salinity as depicted by a decrease of about 13% of the electrical conductivity value.
3) Reuse of coke-making area wastewaterThe Water-Int software has been used together with some
of the Excel-based treatments models developed within the project in order to preliminarily evaluate the possibility of reuse of wastewater blow down coming from the ammonia stripping plant that is the final treatment of the water network related to the coke production area. The Water-Int simulation includes the following blocks:
• two water sources with their real features, a freshwater stream and the water stream from ammonia strippers;
• two possible treatments, an ultrafiltration (UF) and aRO units according to the indication of ILVA partner and to the results of a concluded RFCS project entitled “Selective elimination of salts for the reuse of process waters in the steel industry" (SELSA) [16];
• a water user.
The software automatically generates a potential water network design (which is depicted in Fig. 5) that minimizes the operating costs by complying with process constraints.
The simulation shows that a fresh water replacement with a blow down stream is more convenient than complete discharge of the blow down stream (a discharge is however needed to avoid contaminants concentration even if not provided by the simulator), although the treatments stages are needed, as a very high quality water can be obtained using UF and RO in series. In particular the quality of the RO permeate stream is so high that it can be mixed with UF output without violation of the acceptor process constraint. So doing, the exploitation of the more expensive RO unit is limited to a fraction of the total wastewater stream to treat, such as schematically depicted in Fig. 6.
4) Optimization possibilities in the wastewater networkcoming from coke production area
Modelling has been carried out using firstly Aspen Hysis® software for energy and material balances and secondly through Aspen Plus®; a detail description of the modelling phase is in [35]. The two models have been validated with current data.
In the current operating condition a NaOH and steam mass flows respectively of 195 kg/h and 13000 kg/h are used to obtain about 0.02 ppm of NH3, a negligible content of NH4Cl and a pH less than 9.5 in the blow down water stream.
The simulation has been carried out to optimize the operative conditions of the stripper in order to minimize the consumption of used chemicals (i.e NaOH and steam). For this reason, sensitivity analyses have been made to observe the general trend of the ammonia stripping process varying the NaOH and the steam flows, looking for respect contaminants limit law that in Italy is 15 ppm for ammonia nitrogen. The main results are shown in Fig. 7.
It is clear that reducing the NaOH flowrate, ammonia concentration in the liquid outlet stream is far below the law limit also with very low NaOH addiction. On the other hand, steam flowrate can be reduce until the value of about 10000 kg/h because with low values of steam the NH3 concentration significantly increases.
Simulation investigation demonstrate that optimization margins exist in the management of the ILVA’s ammonia stripping plant, allowing the reduction of resources
Figure 5. Water-Int model potential water network design for reuse of wastewater blowdown coming from the ammonia stripping plant
Figure 4. Comparison between current operating conditions and simulated partial replacement of the ACC1 freshwater intake with the CCO1
blowdown
World Congress on Sustainable Technologies (WCST-2015)
Copyright © 2015 Technical Co-Sponsored by IEEE UK/RI Computer Chapter 51

exploitation.
B. Waste and By-Products Streams Two by-products of ILVA steelmaking plant have been
chosen for this simulation: mill-scales and BOF slag. The possibility of their recovery has been analyzed through experimental and simulation investigations of some necessary treatment to eliminate some contaminants or separate different fractions. In particular, mill-scale reuse is possible only if oil content is reduced and two kind of de-oiling processes have been studied. On the other hand, BOF slag can be separated in two main fractions with different features to be used for different purposes.
1) Oily Mill scale Treatments SimulationILVA carried out preliminary experimental studies to
compare two different de-oiling treatment in order to obtain treated mill scales. The two treatments consist of a distillation and pyrolysis process (D&P) and in a special washing and chemical treatment (W&C), respectively. Their descriptions are reported in detail in [36] and [37] together with the description of the modelling phase. The preliminary data by pilot tests have been the base for modelling through Aspen Plus®. The use of some literature informations and assumptions have been fundamental.
The two models have been exploited to develop several sensitivity analyses in order to explore the behavior of the two process under a wide range of operating conditions. According to the simulation outcomes, the D&P process appear more efficient than the W&C treatment with a de-oiling efficiency of about 99.9% with respect to 80-90% of the W&C process. Moreover, the simulation shows that temperature is the main parameter, which mainly affects the efficiency of D&P process; however, a temperature below 500°C allows reaching a high oil removal efficiency also for considerable values of the initial oil content. On the other hand, W&C efficiency is highly affected by a synergistic action of cleaning water and mixing.
2) Recovery of BOF SlagsILVA staff has carried out a deep analysis of BOF slag
features and they appeared suitable for internal reuse in the sinter plant or for external use (e.g. as a potential raw material for the production of fertilizers for agriculture), if they are separated in two main fractions: the former one richer in iron, the second one richer in phosphorous and calcium but with poor metal content.
A possible recovery treatment process has been designed and preliminary tested at laboratory scale. Afterwards a deep analysis has been carried out through simulation using excel-based models of main unit operations [38]. The simulation provided indications on a good arrangement of treatment units in order to obtain suitable fraction separation. In particular, the best configuration (different from the hypothesized) appears composed by the following treatment step sequence:
1. a cooling stage;
2. a grinding and sieving step;
3. two separate magnetic separations, one for finerfraction (<1mm) and the other for coarse fraction (> 1mm);
4. two final mixing steps for the magnetic and non-magnetic fractions.
Figure 7.Trends of liquid outlet pH and NH3 concentration with changes in NaOH (A) and steam (B) flowrates
Figure 6. Schematic flowsheet of a possible water network arrangement for reuse of wastewater blowdown coming from the ammonia stripping plant
World Congress on Sustainable Technologies (WCST-2015)
Copyright © 2015 Technical Co-Sponsored by IEEE UK/RI Computer Chapter 52
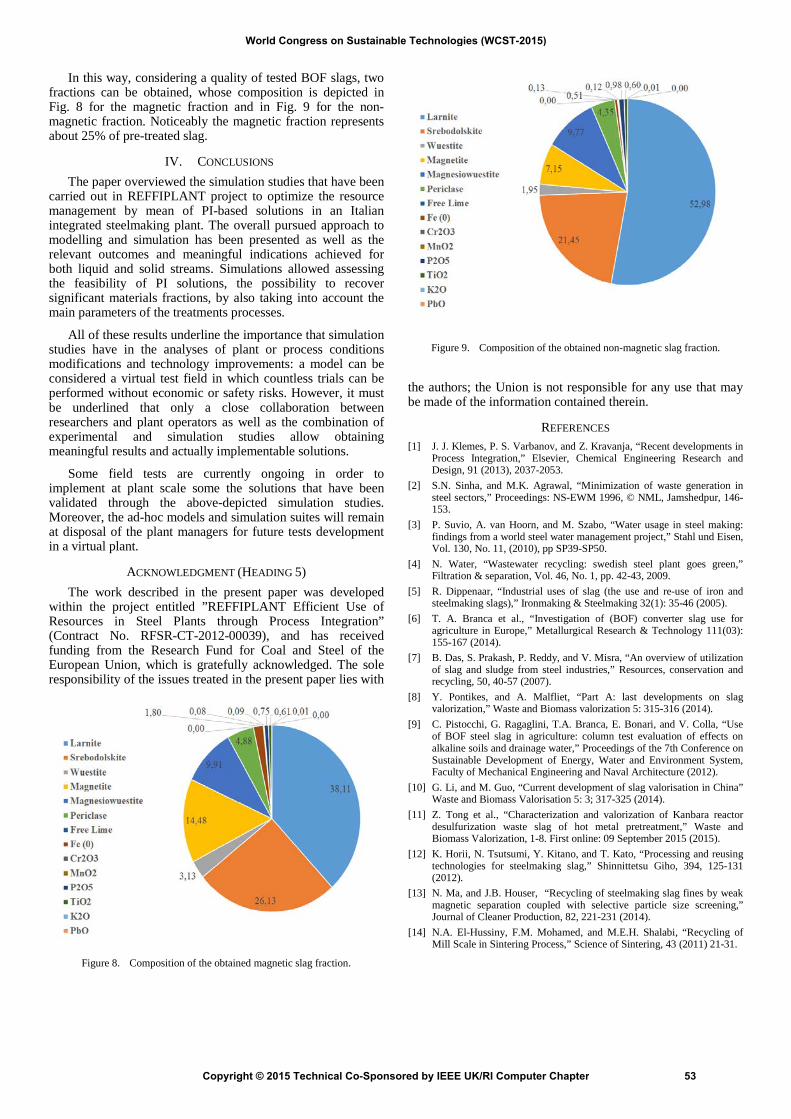
In this way, considering a quality of tested BOF slags, two fractions can be obtained, whose composition is depicted in Fig. 8 for the magnetic fraction and in Fig. 9 for the non-magnetic fraction. Noticeably the magnetic fraction represents about 25% of pre-treated slag.
IV. CONCLUSIONS
The paper overviewed the simulation studies that have been carried out in REFFIPLANT project to optimize the resource management by mean of PI-based solutions in an Italian integrated steelmaking plant. The overall pursued approach to modelling and simulation has been presented as well as the relevant outcomes and meaningful indications achieved for both liquid and solid streams. Simulations allowed assessing the feasibility of PI solutions, the possibility to recover significant materials fractions, by also taking into account the main parameters of the treatments processes.
All of these results underline the importance that simulation studies have in the analyses of plant or process conditions modifications and technology improvements: a model can be considered a virtual test field in which countless trials can be performed without economic or safety risks. However, it must be underlined that only a close collaboration between researchers and plant operators as well as the combination of experimental and simulation studies allow obtaining meaningful results and actually implementable solutions.
Some field tests are currently ongoing in order to implement at plant scale some the solutions that have been validated through the above-depicted simulation studies. Moreover, the ad-hoc models and simulation suites will remain at disposal of the plant managers for future tests development in a virtual plant.
ACKNOWLEDGMENT (HEADING 5) The work described in the present paper was developed
within the project entitled ”REFFIPLANT Efficient Use of Resources in Steel Plants through Process Integration” (Contract No. RFSR-CT-2012-00039), and has received funding from the Research Fund for Coal and Steel of the European Union, which is gratefully acknowledged. The sole responsibility of the issues treated in the present paper lies with
the authors; the Union is not responsible for any use that may be made of the information contained therein.
REFERENCES [1] J. J. Klemes, P. S. Varbanov, and Z. Kravanja, “Recent developments in
Process Integration,” Elsevier, Chemical Engineering Research and Design, 91 (2013), 2037-2053.
[2] S.N. Sinha, and M.K. Agrawal, “Minimization of waste generation in steel sectors,” Proceedings: NS-EWM 1996, © NML, Jamshedpur, 146-153.
[3] P. Suvio, A. van Hoorn, and M. Szabo, “Water usage in steel making: findings from a world steel water management project,” Stahl und Eisen, Vol. 130, No. 11, (2010), pp SP39-SP50.
[4] N. Water, “Wastewater recycling: swedish steel plant goes green,” Filtration & separation, Vol. 46, No. 1, pp. 42-43, 2009.
[5] R. Dippenaar, “Industrial uses of slag (the use and re-use of iron and steelmaking slags),” Ironmaking & Steelmaking 32(1): 35-46 (2005).
[6] T. A. Branca et al., “Investigation of (BOF) converter slag use for agriculture in Europe,” Metallurgical Research & Technology 111(03): 155-167 (2014).
[7] B. Das, S. Prakash, P. Reddy, and V. Misra, “An overview of utilization of slag and sludge from steel industries,” Resources, conservation and recycling, 50, 40-57 (2007).
[8] Y. Pontikes, and A. Malfliet, “Part A: last developments on slag valorization,” Waste and Biomass valorization 5: 315-316 (2014).
[9] C. Pistocchi, G. Ragaglini, T.A. Branca, E. Bonari, and V. Colla, “Use of BOF steel slag in agriculture: column test evaluation of effects on alkaline soils and drainage water,” Proceedings of the 7th Conference on Sustainable Development of Energy, Water and Environment System, Faculty of Mechanical Engineering and Naval Architecture (2012).
[10] G. Li, and M. Guo, “Current development of slag valorisation in China” Waste and Biomass Valorisation 5: 3; 317-325 (2014).
[11] Z. Tong et al., “Characterization and valorization of Kanbara reactor desulfurization waste slag of hot metal pretreatment,” Waste and Biomass Valorization, 1-8. First online: 09 September 2015 (2015).
[12] K. Horii, N. Tsutsumi, Y. Kitano, and T. Kato, “Processing and reusing technologies for steelmaking slag,” Shinnittetsu Giho, 394, 125-131 (2012).
[13] N. Ma, and J.B. Houser, “Recycling of steelmaking slag fines by weak magnetic separation coupled with selective particle size screening,” Journal of Cleaner Production, 82, 221-231 (2014).
[14] N.A. El-Hussiny, F.M. Mohamed, and M.E.H. Shalabi, “Recycling of Mill Scale in Sintering Process,” Science of Sintering, 43 (2011) 21-31.
Figure 8. Composition of the obtained magnetic slag fraction.
Figure 9. Composition of the obtained non-magnetic slag fraction.
World Congress on Sustainable Technologies (WCST-2015)
Copyright © 2015 Technical Co-Sponsored by IEEE UK/RI Computer Chapter 53

[15] V.I. Shatokha, O. O. Gogenko, and S.M. Kripak, “Utilising of the oiled rolling mills scale in iron ore sintering process,” Elsevier, Resources, Conservation and Recycling 55, (2001) 435-440.
[16] V. Colla et al., “Sustainable reverse osmosis application for wastewater treatment in the steel industry”, in press on Journal of Cleaner Production, 2015.
[17] IEA 2005, International Energy Agency, Definition of Process Integration, www.iea-pi.org (accessed 2005-12-14)
[18] G.F. Porzio et al., “Process integration in energy and carbon intensive industries: An example of exploitation of optimization techniques and decision support,” Applied Thermal Engineering, vol. 70(2), pp. 1148-1155, September 2014.
[19] Y.P. Wang, and R. Smith, “Wastewater minimisation”, Chemical Engineering Science, 49 (7), 981-1006.
[20] M. Larsson et al., “Improved energy and material efficiency using new tools for global optimisation of residue material flows,” International journal of green energy, 3, 127-137 (2006).
[21] G. F. Porzio, E. Alcamisi, I. Matino, and V. Colla, “An integrated approach for industrial water systems optimal design,” TechConnect World - Innovation Conference & Expo 2014, Washington, D.C.
[22] J.J. Klemeš, P.S. Varbanov, and Z. Kravanja, “Recent developments in Process Integration,” Chemical Engineering Research and Design, 91, 2037-2053 (2013).
[23] E. Mooney, K. Semkov, C. Adley, and C. Mooney, “Addressing energy and environmental targets through combined process integration techniques,” Chemical Engineering Transactions, 35, 187-192, (2013).
[24] G.F. Porzio, G. Nastasi, V. Colla, M. Vannucci, and T.A. Branca: “Comparison of multi-objective optimization techniques applied to off-gas management within an integrated steelwork,” Applied Energy, vol. 136, pp. 1085-1097, August 2014.
[25] G.F. Porzio et al., “Process integration analysis and some economic-environmental implications for an innovative environmentally friendly recovery and pre-treatment of steel scrap,” Applied Energy, vol. 161, pp. 656-672, 2016.
[26] J.K. Kim, “Process integration and conceptual design with process simulators,” Chemical Engineering Transactions, 18, 833-838, (2009).
[27] J. Du, J. Chen, J.L. Li, and Q.W. Meng, “Water allocation network synthesis involving reliability analysis,” Chem. Eng. Trans., 35, 31-36 DOI:10.3303/CET1335005, (2013).
[28] NFS Blue Ribbon panel report on simulation-based engineering science: revolutionizing engineering science through simulation. NFS Press, 2006.
[29] G.F. Porzio et al., “Process integration in energy and carbon intensive industries: an example of exploitation of optimization techniques and decision support”, Applied Thermal Engineering, Vol. 70, Issue 2, 2014, pp. 1148-1155.
[30] M. Karlsson, “The MIND method: a decision support for optimization of industrial energy systems–principles and case studies,” Applied Energy 88.3, 577-589 (2011).
[31] E. Alcamisi et al., “Process integration solutions for water networks in integrated steel making plants” Chemical Engineering Transactions, Vol. 45, pp. 37-42, DOI: 10.3303/CET1545007 (2015).
[32] I. Matino et al., “Evaluation of water blowdown reuse in integrated steelworks through process simulation”, 2nd European Steel Technology and Application Days - ESTAD 2015, Dusseldorf (Germany).
[33] I. Matino, E. Alcamisi, G.F. Porzio, and V. Colla, “Evaluation and monitoring of physico-chemical properties of water streams through unconventional techniques,” In Proceedings of the 2014 European Modelling Symposium (pp. 281-285). IEEE Computer Society.
[34] E. Alcamisi, I. Matino, M. Vannocci, and V. Colla, “Simplified ionic representation of industrial water streams,” In Proceedings of the 2014 European Modelling Symposium (pp. 286-290). IEEE Computer Society.
[35] E. Alcamisi, I. Matino, G.F. Porzio, and V. Colla, "Wastewater treatment in iron and steel industry: process integration for water re-use.” 1st International Process Integration Forum for the Steel Industry 2014, Luleå, Sweden.
[36] V. Colla et al., “Evaluation of water blowdown reuse in integrated steelworks through process simulation,” 2nd European Steel Technology and Application Days - ESTAD 2015, Dusseldorf (Germany)
[37] I. Matino, E. Alcamisi, G.F. Porzio, V. Colla, and L. Romaniello, “Modelling of oily millscale and sludge treatment process for Improved by product recovery and waste minimization in steel industry”, 1st International Process Integration Forum for the Steel Industry 2014, Luleå, Sweden
[38] I. Matino, T.A. Branca, E. Alcamisi, V. Colla, and L. Romaniello: Evaluation of a BOF Slag Recovery Treatment combining Experimental and Simulation Studies. ISWM-TINOS 2015, Tinos Island (2015)
World Congress on Sustainable Technologies (WCST-2015)
Copyright © 2015 Technical Co-Sponsored by IEEE UK/RI Computer Chapter 54
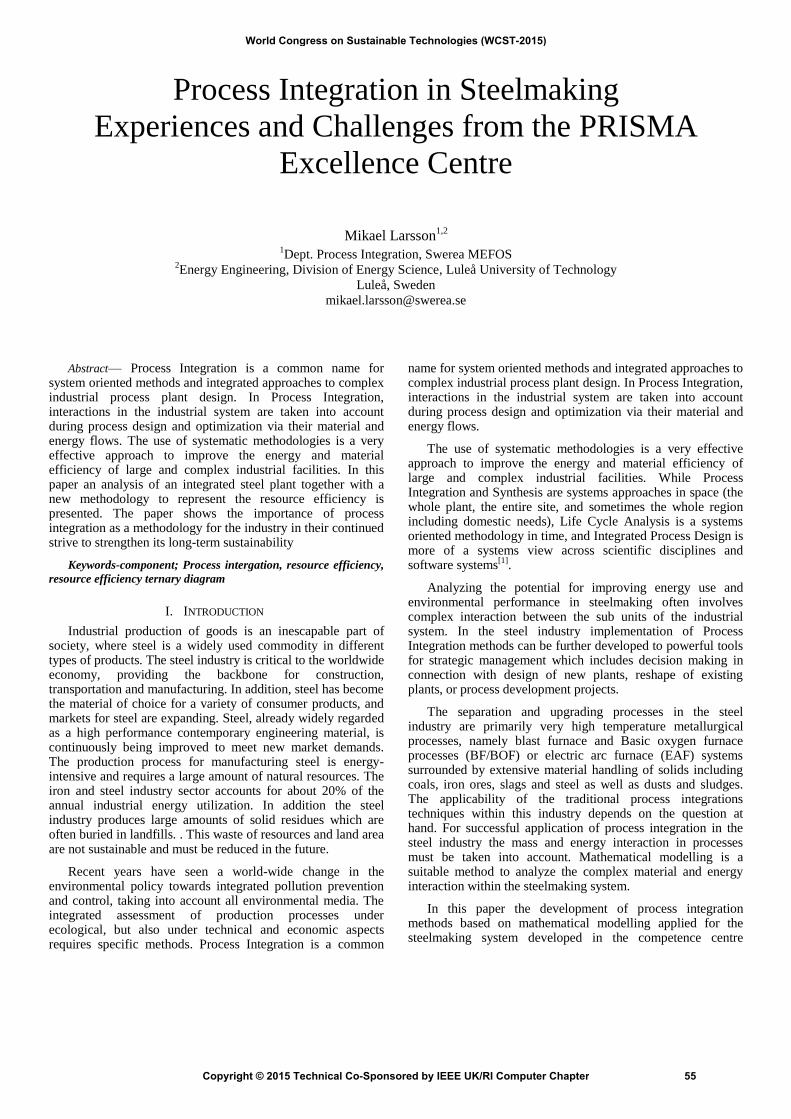
Process Integration in Steelmaking
Experiences and Challenges from the PRISMA
Excellence Centre
Mikael Larsson1,2
1Dept. Process Integration, Swerea MEFOS
2Energy Engineering, Division of Energy Science, Luleå University of Technology
Luleå, Sweden
Abstract— Process Integration is a common name for system oriented methods and integrated approaches to complex industrial process plant design. In Process Integration, interactions in the industrial system are taken into account during process design and optimization via their material and energy flows. The use of systematic methodologies is a very effective approach to improve the energy and material efficiency of large and complex industrial facilities. In this paper an analysis of an integrated steel plant together with a new methodology to represent the resource efficiency is presented. The paper shows the importance of process integration as a methodology for the industry in their continued strive to strengthen its long-term sustainability
Keywords-component; Process intergation, resource efficiency,
resource efficiency ternary diagram
I. INTRODUCTION
Industrial production of goods is an inescapable part of society, where steel is a widely used commodity in different types of products. The steel industry is critical to the worldwide economy, providing the backbone for construction, transportation and manufacturing. In addition, steel has become the material of choice for a variety of consumer products, and markets for steel are expanding. Steel, already widely regarded as a high performance contemporary engineering material, is continuously being improved to meet new market demands. The production process for manufacturing steel is energy-intensive and requires a large amount of natural resources. The iron and steel industry sector accounts for about 20% of the annual industrial energy utilization. In addition the steel industry produces large amounts of solid residues which are often buried in landfills. . This waste of resources and land area are not sustainable and must be reduced in the future.
Recent years have seen a world-wide change in the environmental policy towards integrated pollution prevention and control, taking into account all environmental media. The integrated assessment of production processes under ecological, but also under technical and economic aspects requires specific methods. Process Integration is a common
name for system oriented methods and integrated approaches to complex industrial process plant design. In Process Integration, interactions in the industrial system are taken into account during process design and optimization via their material and energy flows.
The use of systematic methodologies is a very effective approach to improve the energy and material efficiency of large and complex industrial facilities. While Process Integration and Synthesis are systems approaches in space (the whole plant, the entire site, and sometimes the whole region including domestic needs), Life Cycle Analysis is a systems oriented methodology in time, and Integrated Process Design is more of a systems view across scientific disciplines and software systems
[1].
Analyzing the potential for improving energy use and environmental performance in steelmaking often involves complex interaction between the sub units of the industrial system. In the steel industry implementation of Process Integration methods can be further developed to powerful tools for strategic management which includes decision making in connection with design of new plants, reshape of existing plants, or process development projects.
The separation and upgrading processes in the steel industry are primarily very high temperature metallurgical processes, namely blast furnace and Basic oxygen furnace processes (BF/BOF) or electric arc furnace (EAF) systems surrounded by extensive material handling of solids including coals, iron ores, slags and steel as well as dusts and sludges. The applicability of the traditional process integrations techniques within this industry depends on the question at hand. For successful application of process integration in the steel industry the mass and energy interaction in processes must be taken into account. Mathematical modelling is a suitable method to analyze the complex material and energy interaction within the steelmaking system.
In this paper the development of process integration methods based on mathematical modelling applied for the steelmaking system developed in the competence centre
World Congress on Sustainable Technologies (WCST-2015)
Copyright © 2015 Technical Co-Sponsored by IEEE UK/RI Computer Chapter 55
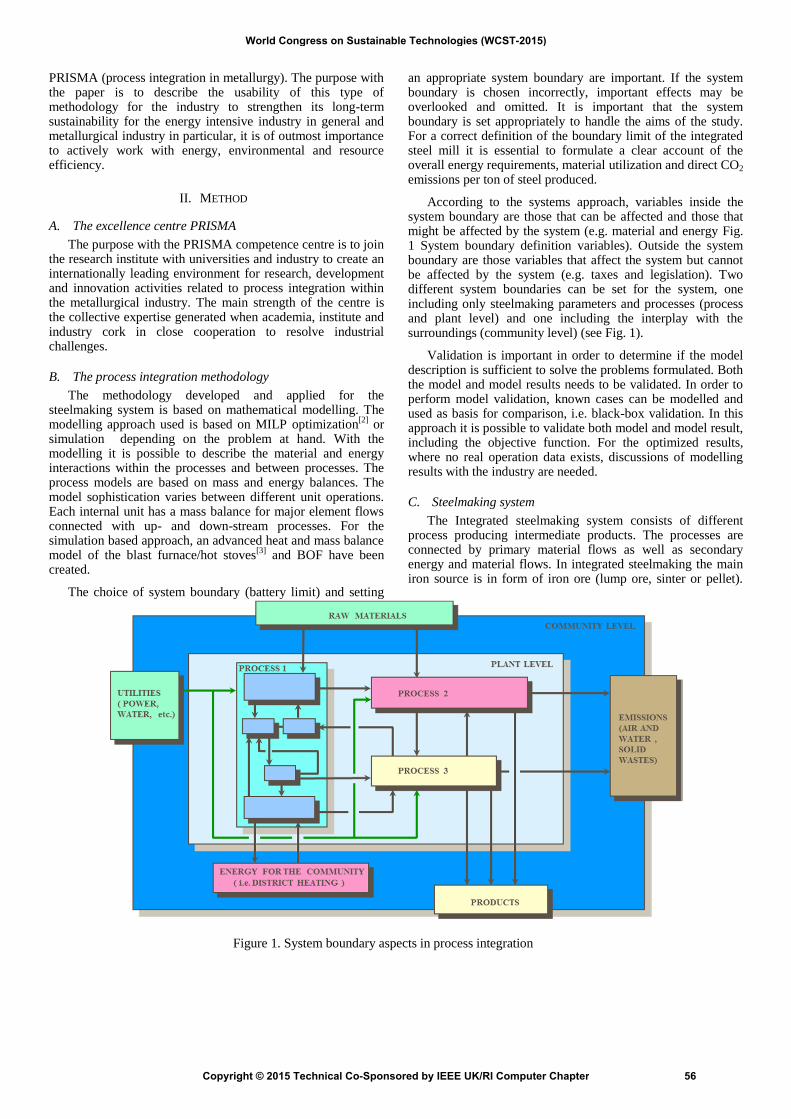
PRISMA (process integration in metallurgy). The purpose with the paper is to describe the usability of this type of methodology for the industry to strengthen its long-term sustainability for the energy intensive industry in general and metallurgical industry in particular, it is of outmost importance to actively work with energy, environmental and resource efficiency.
II. METHOD
A. The excellence centre PRISMA
The purpose with the PRISMA competence centre is to join the research institute with universities and industry to create an internationally leading environment for research, development and innovation activities related to process integration within the metallurgical industry. The main strength of the centre is the collective expertise generated when academia, institute and industry cork in close cooperation to resolve industrial challenges.
B. The process integration methodology
The methodology developed and applied for the steelmaking system is based on mathematical modelling. The modelling approach used is based on MILP optimization
[2] or
simulation depending on the problem at hand. With the modelling it is possible to describe the material and energy interactions within the processes and between processes. The process models are based on mass and energy balances. The model sophistication varies between different unit operations. Each internal unit has a mass balance for major element flows connected with up- and down-stream processes. For the simulation based approach, an advanced heat and mass balance model of the blast furnace/hot stoves
[3] and BOF have been
created.
The choice of system boundary (battery limit) and setting
an appropriate system boundary are important. If the system boundary is chosen incorrectly, important effects may be overlooked and omitted. It is important that the system boundary is set appropriately to handle the aims of the study. For a correct definition of the boundary limit of the integrated steel mill it is essential to formulate a clear account of the overall energy requirements, material utilization and direct CO2 emissions per ton of steel produced.
According to the systems approach, variables inside the system boundary are those that can be affected and those that might be affected by the system (e.g. material and energy Fig. 1 System boundary definition variables). Outside the system boundary are those variables that affect the system but cannot be affected by the system (e.g. taxes and legislation). Two different system boundaries can be set for the system, one including only steelmaking parameters and processes (process and plant level) and one including the interplay with the surroundings (community level) (see Fig. 1).
Validation is important in order to determine if the model description is sufficient to solve the problems formulated. Both the model and model results needs to be validated. In order to perform model validation, known cases can be modelled and used as basis for comparison, i.e. black-box validation. In this approach it is possible to validate both model and model result, including the objective function. For the optimized results, where no real operation data exists, discussions of modelling results with the industry are needed.
C. Steelmaking system
The Integrated steelmaking system consists of different process producing intermediate products. The processes are connected by primary material flows as well as secondary energy and material flows. In integrated steelmaking the main iron source is in form of iron ore (lump ore, sinter or pellet).
Figure 1. System boundary aspects in process integration
World Congress on Sustainable Technologies (WCST-2015)
Copyright © 2015 Technical Co-Sponsored by IEEE UK/RI Computer Chapter 56
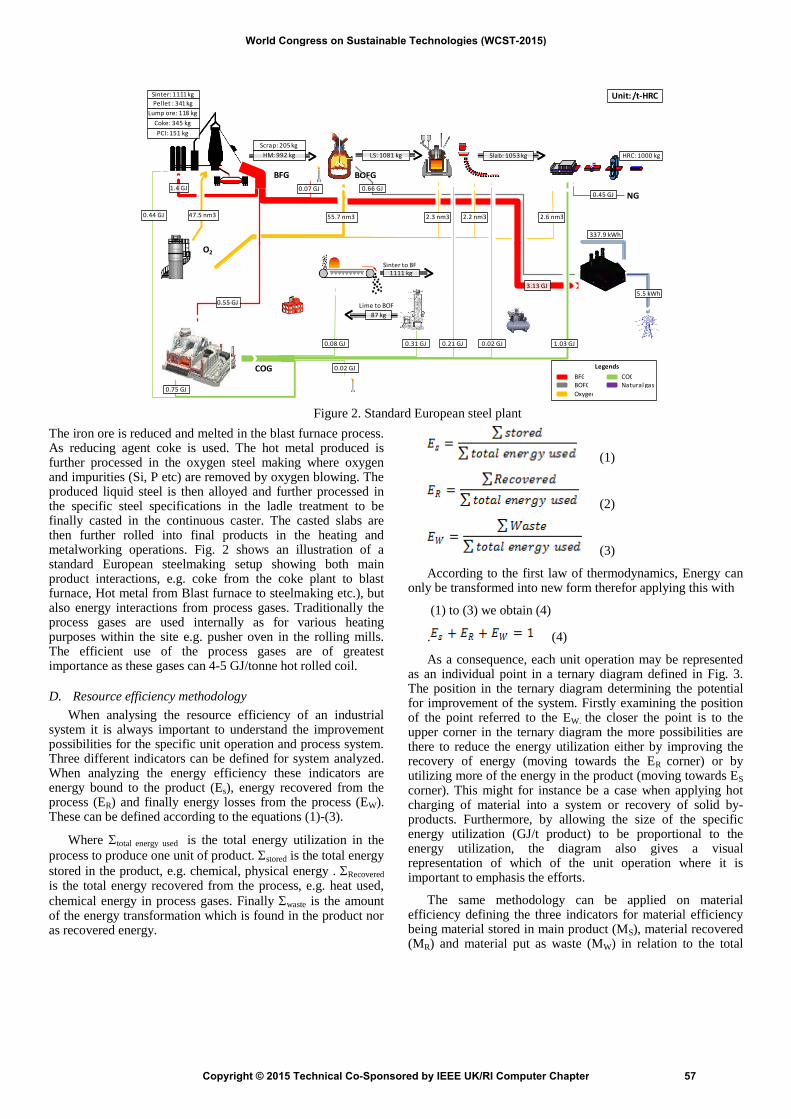
The iron ore is reduced and melted in the blast furnace process. As reducing agent coke is used. The hot metal produced is further processed in the oxygen steel making where oxygen and impurities (Si, P etc) are removed by oxygen blowing. The produced liquid steel is then alloyed and further processed in the specific steel specifications in the ladle treatment to be finally casted in the continuous caster. The casted slabs are then further rolled into final products in the heating and metalworking operations. Fig. 2 shows an illustration of a standard European steelmaking setup showing both main product interactions, e.g. coke from the coke plant to blast furnace, Hot metal from Blast furnace to steelmaking etc.), but also energy interactions from process gases. Traditionally the process gases are used internally as for various heating purposes within the site e.g. pusher oven in the rolling mills. The efficient use of the process gases are of greatest importance as these gases can 4-5 GJ/tonne hot rolled coil.
D. Resource efficiency methodology
When analysing the resource efficiency of an industrial system it is always important to understand the improvement possibilities for the specific unit operation and process system. Three different indicators can be defined for system analyzed. When analyzing the energy efficiency these indicators are energy bound to the product (Es), energy recovered from the process (ER) and finally energy losses from the process (EW). These can be defined according to the equations (1)-(3).
Where total energy used is the total energy utilization in the
process to produce one unit of product. stored is the total energy
stored in the product, e.g. chemical, physical energy . Recovered
is the total energy recovered from the process, e.g. heat used,
chemical energy in process gases. Finally waste is the amount of the energy transformation which is found in the product nor as recovered energy.
(1)
(2)
(3)
According to the first law of thermodynamics, Energy can only be transformed into new form therefor applying this with
(1) to (3) we obtain (4)
. (4)
As a consequence, each unit operation may be represented as an individual point in a ternary diagram defined in Fig. 3. The position in the ternary diagram determining the potential for improvement of the system. Firstly examining the position of the point referred to the EW. the closer the point is to the upper corner in the ternary diagram the more possibilities are there to reduce the energy utilization either by improving the recovery of energy (moving towards the ER corner) or by utilizing more of the energy in the product (moving towards ES corner). This might for instance be a case when applying hot charging of material into a system or recovery of solid by-products. Furthermore, by allowing the size of the specific energy utilization (GJ/t product) to be proportional to the energy utilization, the diagram also gives a visual representation of which of the unit operation where it is important to emphasis the efforts.
The same methodology can be applied on material efficiency defining the three indicators for material efficiency being material stored in main product (MS), material recovered (MR) and material put as waste (MW) in relation to the total
HRC: 1000 kg
BFG BOFG
HM: 992 kg LS: 1081 kg Slab: 1053 kg
NG
Lime to BOF
Sinter to BF
Unit: /t-HRC
COG
O2
1111 kg
87 kg
Scrap: 205 kg
1.4 GJ
0.55 GJ
3.13 GJ
0.07 GJ
0.75 GJ
0.44 GJ
1.03 GJ0.02 GJ0.21 GJ0.31 GJ0.08 GJ
0.02 GJ
0.66 GJ0.45 GJ
5.5 kWh
337.9 kWh
Pellet : 341 kg
Coke: 345 kg
Sinter: 1111 kg
PCI: 151 kg
47.5 nm3 55.7 nm3 2.6 nm32.2 nm32.3 nm3
Lump ore: 118 kg
BFG COGBOFG Natural gas
Oxygen
Legends
Figure 2. Standard European steel plant
World Congress on Sustainable Technologies (WCST-2015)
Copyright © 2015 Technical Co-Sponsored by IEEE UK/RI Computer Chapter 57

material used in the system. Assuming that all material entering is either found in the product, recovered as by-products or is found as waste.
III. RESULTS
To illustrate the use of process integration as a methodology for system efficiency improvements in integrated steelmaking a reference case based on a standard grade hot rolled coil via a typical integrated steelmaking process is used
[4]. The technologies applied and operating parameters
represent a typical European integrated steelplant. A summary of the key characteristics of each sub-unit is given in Table I.
Based on the normal operation practice of a steel mill, various amounts of different raw materials are used. In production of the main products, various by-products and wastes are generated. The recovery of the energetic surplus gases is important to achieve an energy efficient system. The process yield is also an important system parameter which defines the system efficiency.
Calculation of the specific energy use over the process step is shown in Table I. As can be seen in the table the coke oven has the highest energy use with 43.6 GJ/tonne coke in ingoing coking coal, energy for firing of the coke plant, steam for gas treatment, and electricity. Of this almost 29 GJ is found in the main product coke, 9.9 GJ is found in recovered energy (Coke oven gas, COG, Tar, BTX, Sulphur) and 4.6 GJ is losses
(mainly cooling losses but also yield losses will be treated as an energy loss. Similar calculations for all the main process units are found in Table I. Plotting the different operations in the energy ternary diagram (see Fig. 4) the system performance can be visually examined. In the diagram the specific energy demand per tonne of hot rolled coil (final product from the steel mill), calculated by multiplying the specific energy use with the specific production, is plotted. As can be seen by the figure, the steelmaking unit operations are characterized by that a relative large part of the total energy utilization is found within the main products (80-99%), the recovered energy varies between 0-25% and the losses are 3-20%. Since the size of the point is proportional to the total energy use, it can be seen that the coke oven and the blast furnace is the two unit operations with the highest specific energy use.
Calculation of the specific energy use over the process step is shown in Table I. As can be seen in the table the coke oven has the highest energy use with 43.6 GJ/tonne coke in ingoing coking coal, energy for firing of the coke plant, steam for gas treatment, and electricity. Of this almost 29 GJ is found in the main product coke, 9.9 GJ is found in recovered energy (Coke oven gas, COG, Tar, BTX, Sulphur) and 4.6 GJ is losses (mainly cooling losses but also yield losses will be treated as an energy loss. Similar calculations for all the main process units are found in Table I. Plotting the different operations in the energy ternary diagram (Fig. 4) the system performance can be visually examined. In the diagram the specific energy demand
TABLE I. PRODUCTION SPECIFICATIONS OF HOT-ROLLED COIL PRODUCTION
Unit Product Reference plant kg product/t HRC
Notes
Coke Plant Coke 411 Firing BFG + COG.
Blast furnace Hot metal (HM)
992
Desulphurisation DeS HM 997
Oxygen steel making
Crude steel 1081 Total scrap 190 kg/t, O2 consumption 52 nm3/t LS
Ladle metallurgy Liquid steel 1 086
Continuous casting
Slabs 1 053
Hot rolling mill HRC 1 000
By-products recovered and sold
By-product kg-product/t HRC
Recovery
Coke plant Tar, BTX, S 23 COG recovery
Blast furnace BF slag 278 BFG recovery
Oxygen steelmaking
BOF slag 56 BOFG recovery
Unit
Specific energyuse
GJ/t HRC
Product, ES
GJ/t product
Recover,ER
GJ/t product
Loss, EW
GJ/t product
Coke Plant 43.6 29 9.9 4.6
Blast furnace 15.3 9.9 3.7 1.7
Desulphurization 10.1 9.8 0 0.3
Oxygen steelmaking
9.47 7.8 0.8 0.9
World Congress on Sustainable Technologies (WCST-2015)
Copyright © 2015 Technical Co-Sponsored by IEEE UK/RI Computer Chapter 58

per tonne of hot rolled coil (final product from the steel mill), calculated by multiplying the specific energy use with the specific production, is plotted. As can be seen by the figure, the steelmaking unit operations are characterized by that a relative large part of the total energy utilization is found within the main products (80-99%), the recovered energy varies between 0-25% and the losses are 3-20%. Since the size of the point is proportional to the total energy use, it can be seen that the coke oven and the blast furnace is the two unit operations with the highest specific energy use.
By examining the total site energy use (blue dot in the diagram,), it can be seen that almost 40% of the ingoing energy is found in the product as stored chemical energy (Fe), 30% is recovered as secondary products (gases, solids) and 30% is losses. The effect of process yield is seen by the position of the total site efficiency in comparison to the specific unit operations.
Improvements of the energy efficiency of the system thus need to focus on ways to improve the individual unit operations as well as the actual integration of the different units in the system. By analyzing the steel plant system with a holistic approach through process integration different ways of improving the resource efficiency is possible. Example of applications which have large impact on the production system is optimized raw material utilization, material efficiency improvements through increased recovery/recycling of generated waste material, optimized process gas utilization e.g. through increased use of oxygen to increase the internal utilization. Cascade utilization of process gases is a possible way to improve the resource efficiency. Integration of methanol synthesis
[5] is a promising concept to make the most
out of the gases.
From a material efficiency perspective, focus should be paid to ways to improve the yield of the main unit operations as well as ways to minimize the generation of waste. Finding
ways to recycle the internally generated residues is of outmost importance and will also have high impacts on the total energy utilization since this decrease the amount of energy escaping the system. All these aspects can successfully be analyzed with process integration techniques such as mathematical modelling. The final step in the analysis is the actual implementation of the results. Focusing on the implementation early and during the research phase improves the possibility for the results to become implemented.
IV. DISCUSSION
For successful application of process integration in the steel industry the mass and energy interaction in processes must be taken into account. Mathematical modelling is a suitable method to analyze the complex material and energy interaction within the steelmaking system.
Process integration techniques and scenario analysis are suitable for investigation studies such as options to improve the efficiency of the industrial processes and to reduce costs, material and energy use, emissions (CO2, SOx, NOx), by-products (by improved recycling), water use. The concept can be used to investigate improvement options to enhance productivity (logistics), material use, and recovery of valuable by-products from the industrial processes. It is a way to find novel and more sustainable industrial production concepts. The experience gained from the research carried out in the PRISMA research centre have shown that even though the results seems to be effective in solving and improving the total production systems the success of a process integration study is depending on several factors such as:
The possibility to use and adapt existing software andtools:
“…People do not necessarily understand the potential of the techniques, as it requires some basic understanding of optimization. Lack of acceptance and understanding: Psychological inertia. Commercial process simulators do not efficiently solve PI-problems. Static material balance models cannot estimate effects of drastic changes, dynamic models are complex…”
The possibility to present and explain results:
“…Multiple stakeholders/commercial interests which have to understand the results, making high level summaries for decision-makers. Lack of accuracy or missing information may be used as arguments against the technique…”
A successful process integration study includes three main steps starting from analyzing the industrial system, applying processes engineering techniques and realizing the modelling results (being either desk top studies resulting in increased knowledge or introducing actual process changes and retrofit options).
1. The whole picture, consider the production system asan integrated system where the processes areinterconnected with both primary and secondaryprocess streams.
Figure 4. Energy ternary diagram of the integrated steel mill (GJ/tonne hot rolled coil)
World Congress on Sustainable Technologies (WCST-2015)
Copyright © 2015 Technical Co-Sponsored by IEEE UK/RI Computer Chapter 59

2. Process engineering, apply techniques such asthermodynamics, chemistry, mass and heat balancingto analyze the potential attainable improvements onthe scope of material and energy efficiency within thesystem
3. Realize performance, finalize and introduce theprocess designs and retrofit options to realize theidentified system improvements.
Because PI is an emerging field in iron and steelmaking, efforts are needed to educate personnel to gain acceptance and successfully implement PI in the industry. Education is required using a multidisciplinary approach at all management levels. PI is not only about methods and tools, it is about implementing a way of working within companies where PI is a natural part of everyday work.
V. CONCLUSION
Specific conclusions from the collaboration are summarized:
Static site models are quite well developed, good forscenario modelling. E.g. change in one processes unitcan be analyzed on total site, Average description ofthe system.
Lack of industry standard tools for making processmetallurgy modelling.
Lack of model interconnectivity will inhibitcooperation between stakeholders.
Methods are more designed for strategic analysis, notdeveloped for day-to-day optimization of theproduction sites.
Guidance system for optimization of energy userequires further method development, on-line realtime modeling, dynamic modelling.
Site and process models can be further developed andused as operator training tools
Acceptance of models and model results are importanthurdles to overcome for successful implementation.
Further development needed:
Further development of process integration insteelmaking should focus on model designframeworks for enabling process modelinterconnectivity.
The future development of process integration forsteel industry should go towards tools providing multidomain, multi physics and interconnectivitypossibilities.
To pool resources for development on commondevelopment platforms, taking competition betweencompanies from development of modeling of differentprocesses towards the ability to adapt and use themodel framework.
To develop PI educational tools for differentstakeholder groups to increase competence andacceptance
There tend to be a few dedicated to working with PI at individual companies but a critical mass is needed to make greater advances. Common centers like PRISMA give the companies possibility to build and share knowledge. Furthermore a joint development allows for a stronger collaboration between industry – institute – academy. There are ongoing discussions about how to continue this collaboration to ensure that momentum can be maintained and that we can fully realize the potential of Process Integration.
ACKNOWLEDGMENT
We would like to thank the Centre for Process Integration in Steelmaking (PRISMA) for the possibility to present this work.
REFERENCES
[1] Gundersen, Truls: A Process Integration PRIMER, IEA Implementation Agreement on Process Integration, Annex I, 2002.
[2] M. Larsson, J. dahl, ” Reduction of the Specific Energy Use in an Integrated Steel Plant—The Effect of an Optimisation Model” ISIJ International, 43(10), 1664-1673.
[3] P.L. Hooey, A. Bodén, C. Wang, C.-E. Grip, B. Jansson, “Design and application of a spreadsheet-based model of the blast furnace factory”, ISIJ International 50, 924-930.
[4] Iron and Steel CCS study (Techno-Economics Integrated Steel Mill), 2013/04, July, 2013.
[5] J. Lundgren, T. Ekbom, C. Hulteberg, M. Larsson, C.-E. Grip, L. Nilsson, P. Tunå, ” Methanol production from steel-work off-gases and biomass based synthesis gas” Applied Energy 112 (2013) 431–439.
World Congress on Sustainable Technologies (WCST-2015)
Copyright © 2015 Technical Co-Sponsored by IEEE UK/RI Computer Chapter 60

Sessions
World Congress on Sustainable Technologies (WCST-2015)
Copyright © 2015 Technical Co-Sponsored by IEEE UK/RI Computer Chapter 61

Session 1: Sustainability and Policy
Identifying the Disruptive Potential of Sustainable Innovations: A Case of e-mobility (Author: Angela Janke, Magdalena Mißler-Behr)
Impacts of E-Commerce on Construction Materials Procurement for Sustainable Construction (Authors: Solanke B.H., Fapohunda J.A.)
Examining the Implantation of Sustainability into State Procurement Decision models: An Experiential Overview of the Nigerian Public Sector (Author: Victor O. Adebayo)
An Investigation into the Costs and Benefits of Green Building in South Africa (Authors: Shallyne Sundayi, Vittorio Tramontin, Claudia Loggia)
World Congress on Sustainable Technologies (WCST-2015)
Copyright © 2015 Technical Co-Sponsored by IEEE UK/RI Computer Chapter 62
Identifying the Disruptive Potential of the Sustainable Innovation in the Case of e-Mobility
Angela Janke Chair of Planning and Innovation Management
Brandenburg University of Technology Cottbus, Germany
Magdalena Mißler-Behr Chair of Planning and Innovation Management
Brandenburg University of Technology Cottbus, Germany
Abstract— History has shown that technology-based innovation so-called disruptive innovation has led to a downturn in the success of major firms like Nokia or Kodak. Therefore, a continuous technology assessment and a timely adoption of relevant new technologies is critical for the success of a company. Recently, researchers and practitioners have shown an increased interest in sustainable innovation. Existing research recognizes the critical role played by the ex-ante evaluation of disruptive technologies. Surprisingly, the ex-ante evaluation of the disruptive potential of sustainable innovation has yet not been closely examined. A false estimation of the disruptive potential of sustainable innovation can lead to failure of leading firms [2]. This paper presents criteria for the ex-ante evaluation of the disruptive potential of sustainable innovation. The criteria and its application to the case of e-mobility show a medium disruptive potential of this sustainable innovation. (Abstract)
Keywords-disruptive innovation; technology management; sustainability; e-mobility
I. INTRODUCTION In times of climate change, sustainable innovation has
become a central issue for politicians; researchers; and practitioners. The importance of the management of disruptive technologies and green innovation has been growing for several years. To the best of our knowledge, no criteria for the ex-ante evaluation of the disruptive potential of sustainable innovation have yet been identified. This paper has three objectives: (1) to clarify the characteristics of disruptive and sustainable innovation; (2) to use determinants to measure the disruptive potential of sustainable innovation ex-ante; and (3) to identify the disruptive potential of this sustaining innovation.
II. THEORETICAL BACKGROUND
A. Technology based disruptive Innovation There are two views in technology management to explain
the displacement of major firms and established technologies: (1) new technologies with a superior performance and (2) new technologies with an inferior performance and difficulties of major firms by adopting their capabilities [1]. Christensen [2] explains the failure of established firms in developing disruptive technologies by its resources, values and processes, which cause the innovator`s dilemma.
Technology based disruptive innovation can be described by the following characteristics:
1) New technology trajectories [3]: The application ofnew technological knowledge in existing markets or the application of existing technological knowledge in new markets are causing new technology trajectories for disruptive technologies.
2) New performance attributes [1;2]: Disruptivetechnologies are inferior to established technologies in certain performance attributes which are important to mainstream customers and superior to established technologies in performance attributes which are valued in niche markets.
3) Disruptive to market structures: Disruptivetechnologies can impact market structures in four different ways: (1) decreasing market share of established firms [1;2], (2) new markets [2;4]; (3) new business models [2;4] and (4) new value networks [2;5].
B. Sustainable disruptive innovation In addition to the characteristics of disruptive innovation,
sustainable disruptive innovation can be described by the following characteristics [6]: (1) innovation object: product, process, service, method; (2) market orientation; (3) environmental aspect: reduce negative impact; (4) full life cycle to be considered; (5) intention for reduction may be economical or ecological; and (6) setting a new innovation/ green standard to the firm.
III. DISRUPTIVE POTENTIAL OF SUSTAINABLE INNOVATION
Klenner et al. identified the following determinants of increasing the disruptive potential of innovation [7]: low number of firm entries and exits; constant competitors; high market concentration; small number of low-end offers; high market share shifts; less disposition to buy; high value network size; change in value chains; high market entry barriers and benefits; low customer loyalty; high degree of lobbying; and exogenous shocks.
The criteria for the ex-ante evaluation of the disruptive potential of sustainable innovation can be segmented into criteria of sustainable innovation and criteria of disruptive
World Congress on Sustainable Technologies (WCST-2015)
Copyright © 2015 Technical Co-Sponsored by IEEE UK/RI Computer Chapter 63

innovation. As a result, six determinants can be used to access the disruptive potential of sustainable innovation (see table I).
TABLE I. DETERMINANTS OF DISRUPTIVE SUSTAINABLE INNOVATION
Criteria of disruptive innovation
Criteria of sustainable innovation In
nova
tion
obje
ct
Mar
ket
orie
ntat
ion
Env
iron-
men
tal a
spec
ts
Ful
l life
cyc
le
inte
ntio
n
Inno
vatio
n/
gree
n st
anda
rd
New technoly trajectory
1
New performance attributes
2 3 4 6
Disruptive to market structure
5
Each determinant for identifying the disruptive potential of sustainable innovation can be accessed by the following criteria: (1) higher performance in certain dimensions; (2) decreasing disposition to buy, low customer loyalty, high market share shifts, high market entry barriers and high market entry benefits; (3) lobbying, existence of exogenous shocks; (4) performance in each phase of product life cycle changes; (5) low number of firm entries and exists, Constant competitors, high market concentration, small number of low-end offers, high value network size and a change in value; (6) degree of innovation; degree of sustainability.
IV. DISRUPTIVE POTENTIAL OF E-MOBILITY
Disruptive technologies are characterized by new technological trajectories (see Fig. 1), which lead to a higher performance in certain performance dimensions.
Figure 1. technolocial trajectories of cars [2;5]
The e-drive technology has opened new markets for e-mobility such as the e-bike market or the Segway market. Low-end markets for e-mobility consist of users with lower customer needs in the dimension of operating distance. The determinants of the disruptive potential are a decreasing disposition to buy, low customer loyalty, high market share shifts, high market entry barriers and high market entry benefits.
The usage of e-cars fosters the reduction of local emissions. This positive impact plays an important role in metropolises. For example in Hamburg, Germany, the air pollution is high
due to car traffic and the harbor. The Determinants to access the disruptive potential are the degree of lobbying and the existence of exogenous shocks.
The costs and the CO2-emissions of the full life cycle need to be considered in order to analyze the disruptive potential of the sustainable e-car. BMW uses green energy for the production of the i-series; an electricity mix with a higher share of renewable energies for loading the batteries and smart battery and car sharing services can reduce the product life cycle costs and emissions.
The ecological benefits depend on the life cycle costs, as discussed before. New entering firms with new business models like car sharer or charging provider have economical gains. OEMs and major suppliers can foster their competitiveness by developing disruptive technologies. Economical determinants of the disruptive potential are a low number of firm entries and exists; constant competitors; high market concentration; small number of low-end offers; high value network size; and a change in value chains.
Disruptive sustaining innovation can set new standards in products, processes and values and help solving the innovator`s dilemma by Christensen [2].
V. CONSLUSION This paper has introduced criteria to identify the disruptive
potential of sustainable innovation ex-ante. A three step approach has been applied: (1) Identification of characteristics of disruptive and sustainable innovation, (2) Identification of determinants of the disruptive potential of sustainable innovation and (3) Evaluating the disruptive potential of e-mobility. This research suggests that e-mobility has a medium disruptive potential. For increasing the disruptive potential of e-mobility, the performance in the full life cycle needs to be improved; and incentives or exogenous shocks should increase the intention for developing this sustainable technology.
REFERENCES [1] R. Adner, “When are technologies disruptive? A demand-based view of
the emerge of competition,” in Strategic Management Journal, vol. 23, pp. 667-688, March 2002.
[2] C.M. Christensen, “The Innovator`s Dilemma: When new technologies cause great firms to fail,” Boston Mass.: Harvard Business Press, 1997.
[3] C.M. Christensen, “Exploring the limits of the technology s-curve. Part I: Component technologies,” in Production and Operations Management, vol. 1, no. 4, pp.334-357, December 1992.
[4] S.D. Anthony, M.W. Johnson, J.V. Sinfield and E.J. Altmann, “The Innovator's Guide to Growth: Putting Disruptive Innovation to Work,” Boston, Mass.: Harvard Business Press, 2008.
[5] A. Schneider, “Geschäftsmodellwandel durch disruptive Innovationen: Fallstudie zum Elektrofahrzeug in Automobilindustrie und Energiewirtschaft,” Driesen: Dr. H.H. Verlag, 2012.
[6] T. Schiederig, F. Tietze and C. Herstatt, “Green Innovation in Technology and Innovation Management – An exploratory literature review,” in R&D Management, vol. 42, no. 2; pp. 180-192, 2012.
[7] P.Klenner, S.Hüsig and M.Dowling, “Ex-ante evaluation of disruptive susceptibility in established value networks—When are markets ready for disruptive innovation?,” in Research Policy, vol. 42, no. 4; pp. 914-927, 2013.
World Congress on Sustainable Technologies (WCST-2015)
Copyright © 2015 Technical Co-Sponsored by IEEE UK/RI Computer Chapter 64

Impacts of E-Commerce on Construction Materials Procurement for Sustainable
ConstructionSolanke B.H.1
1*Department of Construction Management and Quantity Surveying, Faculty of Engineering
Cape Peninsular University of Technology (CPUT) Cape Town, South Africa.
E-mail: [email protected]
Fapohunda J.A.2
2Department of Construction Management and Quantity Surveying, Faculty of Engineering
Cape Peninsular University of Technology (CPUT) Cape Town, South Africa.
Email: [email protected]
Abstract— Sustainable building construction has become essential in the construction industry with the aim of satisfying the present and future needs of construction stakeholders. Selection and procurement of appropriate materials that satisfies the principles of sustainability is paramount in construction. To this end, the traditional method of materials procurement has been found to be inefficient considering the increased innovations and diversity of materials available for construction. This paper explores the implementation of E-commerce especially e-procurement as a strategy for improving the process of materials procurement in the South African construction industry. This study obtained data quantitatively through questionnaires administered to 150 construction professionals in the Western Cape Province of South Africa. A total of 93 responses were retrieved and analysed. Findings indicated: building cost reduction, enhanced environmental protection and enhanced implementation of government policies as benefits of sustainability in materials procurement towards sustainable building production. However, e-procurement implementation during materials procurement are hindered by (a) lack of awareness, (b) resistance to change, (c) high cost of installation and operation and (d) internet fraud. Given the benefits and impacts of e-commerce, adequate implementation of these findings should proffer a suitable strategy in addressing the challenges of materials procurement towards sustainable building construction.
Keywords- Construction industry, E-commerce, E-procurement, Materials procurement, Sustainable building.
I. INTRODUCTION
Electronic Commerce (E-Commerce) is a revolutionary approach to construction materials procurement. E-Commerce has been widely acknowledged to breach the boundaries of time and distance; expand and modify the scope of business operations; and increase the level of competiveness amongst building contractors by drastically reducing the cost of building production. To buttress this, [1] added that the advent of e-commerce has enabled organizations in the construction industry achieve greater economic results faster and easily through tactical and strategic operations.
The concept of electronic commerce has very much been in existence since the late 1960s in various forms such as Electronic Data Interchange (EDI), Electronic tendering (e-tending), Electronic mails (e-mails), Electronic procurement (e-procurement), e-commerce is a platform for the exchange of construction project information between individuals who are geographically dispersed through the aid of internet services [2]. The review of the evolution of the process of electronic commerce in the construction industry reveal that the adoption of the electronic approach in the acquisition of construction materials for sustainable building production is a bid to improve the traditional procurement method to ensure productivity, accountability and value for money. However, despite the advantages of e-commerce in the process materials procurement during sustainable building construction, construction companies in South Africa have been observed to portray some level of reluctance in adopting the strategies of internet-enabled procurement systems.
As a result, researchers in South Africa have published works to posit the challenges faced currently during materials procurement and the barriers of implementing the strategies of e-commerce specifically e-procurement in the construction industry. Published research works such as: “A framework for the implementation of E-procurement” [3]; “The use of electronic commerce in the materials procurement in SA construction industry” [4]; “Patterns of technological innovation in the use of e-procurement in construction” [5] were identified to buttress the challenges encountered during materials procurement.
In order to improve the process of materials procurement in sustainable building construction in South Africa, there is a need to investigate and understand the current state of construction materials procurement and the extent to which companies in the private and public sectors adopt the strategies of e-commerce to achieve the goals of sustainability during construction. Therefore, this paper explores the implementation of E-commerce especially e-procurement as a strategy for improving the process of materials procurement in the South African construction industry.
World Congress on Sustainable Technologies (WCST-2015)
Copyright © 2015 Technical Co-Sponsored by IEEE UK/RI Computer Chapter 65

II. CONSTRUCTION MATERIALS PROCUREMNT AND E-COMMERCE
Construction materials are a collection of materials consumed or incorporated in buildings or structures at any stage or phase of construction [6]. Reference [6] added that construction materials typically accounts for 40-60% of the total cost of construction projects to buttress the relevance of materials procurement. Therefore, it is essential for every construction company to maintain an effective and efficient materials procurement system to remain abreast of all market conditions towards promoting value for money, accountability, transparency and social equality in the procurement of construction materials
The International Standard Organization [7] defined Construction procurement as a phase of building construction which involves the formation, management and execution of building contracts with respect to the provision of materials, machinery (labor and equipment) and money required towards client satisfaction. Procurement in sustainable building construction has over the years translated to a strategy for cutting production cost, improving building quality and enhancing procurement efficiency [8]. Hence, construction materials procurement emphases on the ability of a construction company to satisfy the expectations of its clients through materials acquisition without incurring time and cost overruns during construction. To buttress this, [9] highlighted that the optimum aim of the project manager is to make decisions on enhancing productivity and value for money at the materials procurement phase effectively; in order to meet the goals and objectives of the project. As a result, the materials procurement strategy implemented by the project manager is prone to have a great impact on the cost, quality, time and sustainability of a building.
A The Traditional Materials Procurement Strategy (TMPs)
In a traditional contractual status quo, the process of materials procurement is a paper-based system. This strategy involves the search for materials and suppliers from paper-based documents and potentials suppliers are communicated with through telephones and fax. Reference [10] defined the traditional materials procurement strategy as is a systematic and specialized procurement process which is predominantly a paper-based technique for materials acquisition during construction. The procurement process comprises of the generation, copying and transfer of various contract paper documents such as materials requisition documents, quotations, purchase orders etc as illustrated in Fig. I.
Buying/ Procurement Department
Suppliers
Confirmation of purchase order &
invoice
Copy of purchase
order
Accounts department
Site office
Archive
Archive
Purchase order
Inv
oice
the
Pu
rch
ase
ord
erC
om
par
e th
e in
vo
ice
&
Mat
eria
ls R
equ
isit
ion
turchase hrder
Copies o
f Tran
saction
docu
men
ts
Copies of Transaction documents
Figure I. Typical Paper-work cycle in Traditional Materials Procurement (Adapted from [11]
1 Limitation and Impacts of the Tradition materials procurement strategy
Reference [10] proffered that the TMPs is limited by the following operational factors in developing countries, South Africa inclusive. These factors are considered to be fostered by communication setbacks:
• Geographical limitation• Stipulated business hours• Limited supplier and product information.• Labour intensity• High operational and transactional cost related to poor
data management• The use of physical catalogue and other paper-works,
makes the procurement process cumbersome andlengthy.
• The adoption of the paper-based system has made theprocess of materials search and cost/quality comparison astrenuous task.
Reference [12] added that as a result of the ineffective purchasing practices of the paper-based procurement strategy, construction companies have experienced various setbacks such as: loss of profit due to time, labour consumption, loss of materials information, and high level of process uncertainty. To further buttress this [13] stated that the impact of these mentioned factors also reduce the competitive level of the contractors in the business market. This is as a result of the use of out-dated supplier details from catalogues, production time consumption etc. With reference to Fig. I, it is noticed that the materials procurement process involves the transfer of different copies of document between the procurement parties all through the process. Thus, it is worthy of note that there exist a high possibility of documentation errors and information transcription. Furthermore, it is perceived that the likelihood of experiencing a bridge in information transfer in the paper-based system is inevitable due to document mix-ups or lost information.
Due to the unending challenges and barriers of TMPs, the implementation of innovative approaches such as the use of Electronic Information and Communication Technology
World Congress on Sustainable Technologies (WCST-2015)
Copyright © 2015 Technical Co-Sponsored by IEEE UK/RI Computer Chapter 66

(EICT) enabled techniques were introduced into the materials procurement system. This approach was initiated to enhance the performance and production processes of materials procurement activities.
B E-commerce Strategies for Construction Materials Procurement
E-commerce is defined as the use of electronic technology and software programmes for the purpose of processing, transferring, storing and presenting information between different parties [12]. The United Nations Commission on International Trade Law (UNCITRAL) from an economy improvement perspective further describes e-commerce as a procurement process which adopts the function of the Electronic Data Interchange (EDI) and other internet based communication methods to improve international trade. Based on the evolution of e-commerce, e-commerce was initiated to create a platform for buyers and sellers to exchange purchase information. Thus, e-commerce provides a virtual space (e-market place) which permits the exchange of information (specifications and price) between procurement participants on considerable materials via an ‘inter-organisational’ internet-based information system [14]. Hence, e-commerce provides a dual win situation for both the buyers and the suppliers.
Subsequently, [15] buttressed in their study that the adoption of the strategies of e-commerce in the execution of construction materials procurement activities improves the system of communication as well as to promote accurate, effective and timely exchange of materials information among the different procurement participants. Another vital benefit and feature of the electronic commerce system is the facility to better manage of materials information overtime. Table I itemises other benefits of e-commerce and its impacts on the construction industry. However, on the other hand, the key barriers of the adoption of e-commerce, particularly e-procurement in the construction industry are generally associated with social, environmental, technological, governmental, organisational and cultural factors.
Table I Benefits and Impacts of e-Procurement in Sustainable building construction
Benefits Reference
Impacts
Advanced Global Communication.
[14]; [16]; [17]; [18]; [19]; [20]
Company and Product promotion, Customer Satisfaction, Unlimited & direct communication with suppliers (new & old); Global market place for buyers and suppliers; Wide range of materials to choose from; Standardization of communication network; increased productivity; increases the speed of returns on investment (ROI)
Reduced Transaction Cost
[16]; [14]; [17]; [18]; [19]
Economic benefits, Budgetary control, Materials Procurement Decentralization; Reduced labour cost/ overhead; Reduced materials cost; Eliminates Maverick expenditure, timely delivery of information; increase in profit margin
Easier Materials trade process
[10]; [21]; [18]; [19]; [20]
Wide range of materials to choose from; Materials procurement decentralization, Service standardization; Electronically enabled supplier payment; enhanced inventory management; Transaction Error elimination; improved documentation style
Reduced Transaction Time
[21]; [19]; [20].
Suppliers’ management, Business process Re-engineering, Eliminates the participation of multiple middlemen; faster communication; shorter overall procurement cycle
Fraud Prevention
[18]; [22]; [16]; [23]
Improved technical interoperability, Legal harmonisation, Improved ICT Skills and Infrastructure, Security and Authentication integration, Risk management.
Prevalent Corruption Reduction
[22]; [21]; [18].
Transparency, Legal Framework reformation, Internet Security improvement, Efficient & effective public procurement system,
Sustainable Societal Development
[16]; [14]; [19]; [20]
Employee development, Supports SME development, Environment protection, Waste reduction, Customer Satisfaction, Environmental purchase opportunities.
III. RESEARCH DESIGN AND METHODS
This study is exploratory in nature and it is a fragment of a larger on-going MTech research project. The research adopted the use of a close-ended questionnaire survey administered randomly to selected construction professionals in the Western Cape Province. This sampling technique was adopted in order to obtain precise data from companies in the district to reach generalizable conclusions. Consultants, government department heads, engineers and contractors were selected as target groups for the survey. These groups were selected because they are capable of performing various significant functions in the construction supply chain and their perspectives would be highly valuable to this research. In order to specifically gain their perspectives, the target groups were subdivided to site managers, project managers, quantity surveyors, procurement officers and company suppliers.
The questionnaires were designed to explore the extent to which e-procurement implemented as a strategy of e-commerce in materials procurement towards sustainable building construction. The questionnaires were completed anonymously to ensure a true reflection of the respondents’ opinions and to meet the ethical criterion of confidentiality. It is therefore assumed that the respondents were sincere in their responses. The survey tool was designed based on findings from reviewed literature and interactions with construction professionals in the course of the pilot study prior to this study. One hundred and fifty (150) questionnaires were administered to the earlier mentioned groups. A total of ninety-three (93) responses (63%) were retrieved were after many phone calls, and visitation to the construction sites and consulting offices. This was observed to be as a result of the busy schedules of the respondents, considering they occupy key positions in their organisations. Data analyses was conducted using the descriptive statically analysis in the
World Congress on Sustainable Technologies (WCST-2015)
Copyright © 2015 Technical Co-Sponsored by IEEE UK/RI Computer Chapter 67
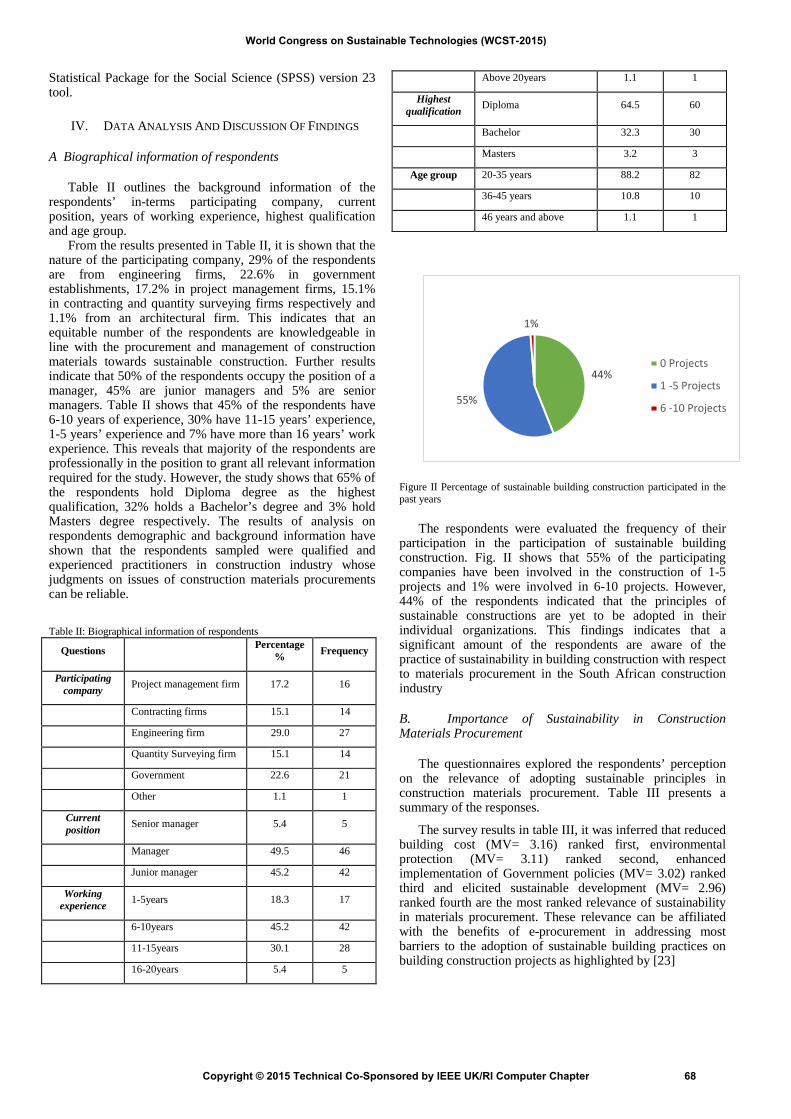
Statistical Package for the Social Science (SPSS) version 23 tool.
IV. DATA ANALYSIS AND DISCUSSION OF FINDINGS
A Biographical information of respondents
Table II outlines the background information of the respondents’ in-terms participating company, current position, years of working experience, highest qualification and age group.
From the results presented in Table II, it is shown that the nature of the participating company, 29% of the respondents are from engineering firms, 22.6% in government establishments, 17.2% in project management firms, 15.1% in contracting and quantity surveying firms respectively and 1.1% from an architectural firm. This indicates that an equitable number of the respondents are knowledgeable in line with the procurement and management of construction materials towards sustainable construction. Further results indicate that 50% of the respondents occupy the position of a manager, 45% are junior managers and 5% are senior managers. Table II shows that 45% of the respondents have 6-10 years of experience, 30% have 11-15 years’ experience, 1-5 years’ experience and 7% have more than 16 years’ work experience. This reveals that majority of the respondents are professionally in the position to grant all relevant information required for the study. However, the study shows that 65% of the respondents hold Diploma degree as the highest qualification, 32% holds a Bachelor’s degree and 3% hold Masters degree respectively. The results of analysis on respondents demographic and background information have shown that the respondents sampled were qualified and experienced practitioners in construction industry whose judgments on issues of construction materials procurements can be reliable.
Table II: Biographical information of respondents
Questions Percentage% Frequency
Participating company Project management firm 17.2 16
Contracting firms 15.1 14
Engineering firm 29.0 27
Quantity Surveying firm 15.1 14
Government 22.6 21
Other 1.1 1
Current position Senior manager 5.4 5
Manager 49.5 46
Junior manager 45.2 42
Working experience 1-5years 18.3 17
6-10years 45.2 42
11-15years 30.1 28
16-20years 5.4 5
Above 20years 1.1 1
Highest qualification Diploma 64.5 60
Bachelor 32.3 30
Masters 3.2 3
Age group 20-35 years 88.2 82
36-45 years 10.8 10
46 years and above 1.1 1
44%
55%
1%
0 trojects
1 -5 trojects
6 -10 trojects
Figure II Percentage of sustainable building construction participated in the past years
The respondents were evaluated the frequency of their participation in the participation of sustainable building construction. Fig. II shows that 55% of the participating companies have been involved in the construction of 1-5 projects and 1% were involved in 6-10 projects. However, 44% of the respondents indicated that the principles of sustainable constructions are yet to be adopted in their individual organizations. This findings indicates that a significant amount of the respondents are aware of the practice of sustainability in building construction with respect to materials procurement in the South African construction industry
B. Importance of Sustainability in Construction Materials Procurement
The questionnaires explored the respondents’ perception on the relevance of adopting sustainable principles in construction materials procurement. Table III presents a summary of the responses.
The survey results in table III, it was inferred that reduced building cost (MV= 3.16) ranked first, environmental protection (MV= 3.11) ranked second, enhanced implementation of Government policies (MV= 3.02) ranked third and elicited sustainable development (MV= 2.96) ranked fourth are the most ranked relevance of sustainability in materials procurement. These relevance can be affiliated with the benefits of e-procurement in addressing most barriers to the adoption of sustainable building practices on building construction projects as highlighted by [23]
World Congress on Sustainable Technologies (WCST-2015)
Copyright © 2015 Technical Co-Sponsored by IEEE UK/RI Computer Chapter 68

Table III Importance of sustainability in construction materials procurement
Importance Mean Rank
Reduces the building cost 3.16 1
Enhances environmental protection 3.11 2 Enhances the implementation of government policies
3.02 3
Triggers sustainable development 2.96 4
Ensures reliability and accountability during procurement
2.87 5
Positively influences the procurement decisions of organizations
2.69 6
C. Barriers of electronic procurement in construction materials procurement towards sustainable building construction.
The respondents were asked to rate a set of selected barriers of materials procurement based on the extent to which it affects the adoption of e-procurement towards sustainable construction.
Table IV Barriers of e-procurement in construction materials procurement activities
Questions Mean Value Rank
Lack of general awareness in the industry 3.48 1 High fear of fraud 3.28 2 Resistance to change in the construction industry
3.28 2
Ineffective system of communication between contractors and supplies.
3.15 3
Lacks standardized documentations in materials requisition and procurement
3.08 4
High cost of materials procurement 2.97 5 Ineffective Government policy on materials procurement
2.85 6
Size of procuring company (size of available manpower)
2.77 7
Risk of information error during information transfer or duplication
2.71 8
Permits unplanned purchases from random suppliers at a higher price (Maverick buying)
2.57 9
Cumbersome nature of the materials selection
2.34 10
The findings in Table IV indicates that general lack of awareness in the industry (MV= 3.48) ranks first, high fear of internet fraud and resistance to change in the industry (MV= 3.28) were ranked second respectively, ineffective medium of communication between client, contractors and suppliers (MV= 3.15) was ranked third and lack of standardised documentations in materials requisition and procurement
(MV= 3.08) ranked fourth. It was inferred that the findings are practically valid in the sense that resistance to change and the high fear of fraud are as a result of lack adequate knowledge in the industry. To buttress this, [24] in their study on “Barriers that impact on the implementation of sustainable design in Kwazulu Natal Province of South Africa” also identified high cost of procurement, materials procurement strategy implementation and education as other barriers to the adoption of e-procurement in materials procurement
V. CONCLUSIONS AND RECOMMENDATIONS
This study evaluated and analyzed the present state of electronic materials procurement during sustainable building construction. Based on the findings of the study, the following conclusions can be made: Firstly, it can be concluded that the adoptability of e-procurement in materials procurement by construction professionals have been enhanced by recounting the benefits of e-procurement in sustainable building construction. Despite the positive impacts of e-procurement in materials procurement, the construction professionals unanimously agreed in the ranking of the barriers of e-procurement that most of the barriers are lucidly limiting factors to the adoption and development of electronic materials procurement. It was inferred that a proper understanding of the relevance of sustainability in materials procurement with relation to the benefits of e-procurement tends to proffer a solution to most barriers of e-procurement. To ensure the construction of buildings that satisfy the present housing needs of construction stakeholders’ without infringing on the ability to meets the social, economic and environment needs of the future generations, construction professionals are advised to educate and train construction stakeholders on electronic materials procurement strategies for future construction projects. Thus, more research studies should be conducted in other provinces in South Africa.
REFERENCES [1] Z. Qin, L. Shundong, H. Yi, D. Jinchun, D., Y.
Linixang and Q. Jun, “Introduction to e-commerce. Springer science & business media", 2010.
[2] S. Laryea, E. O. Ibem, R. Pigawa, and R. Phoi, “Electronic procurement in the South African construction sector: case study of government departments in the Gauteng Province”, 2014.
[3] M. V. Jooste, and W. van Schoor, “A framework for the implementation of E-procurement”, SA Journal of Industrial Engineering, 14(2): pp. 1-22, 2003.
[4] G. Coetzee, and N. Boshoff. “The use of electronic commerce in the materials procurement in SA construction industry”, Construction Informatics Digital Library, 1998.
[5] S. Laryea, and E. O. Ibem, “Patterns of technological innovation in the use of e-procurement in construction”, Journal of Information Technology in Construction, Vol. 19, 104-125, 2014.
[6] D. A. S. Samarasinghe, J. E. Tookey, J. O. B. Rotimi, and S. Thiruchelvam, “Securing best prices for construction materials: An exploratory study of the New Zealand construction industry”, pp.1-15, 2012.
World Congress on Sustainable Technologies (WCST-2015)
Copyright © 2015 Technical Co-Sponsored by IEEE UK/RI Computer Chapter 69

[7] International Organization for Standards (ISO), Construction Procurement –Part 1: Process, Methods and Procedures, IS, Geneva, Switzerland, 2010.
[8] C. A. Sobhani, C. A. Malarvizhi, A. Al-Mamun, and S. Jeyashree, “Strategic procurement and financial performance of Iranian manufacturing companies. Asian social science”, 10(1), p250, 2014.
[9] R. R. Venkataraman, and J. K. Pinto, “Cost and value management in projects”, New Jersey: John Wiley & Sons, 2011.
[10] S. C. W. Kong, H. Li, T. P. L. Hung, J. W. Z. Shi, D. C. Lacouture and M. Skibniewski. “Enabling information sharing between E-commerce systems for construction material procurement”, Automation in construction 13; pp. 261-276, 2004.
[11] E. K. Adzroe, and J. Goulding, “An e-readiness framework for construction materials procurement”, Pp. 1-8, 2004.
[12] N. Kasim, “ICT implementation for materials management in construction projects: Case Study. KICEM”, Journal of Construction Engineering and Project Management, 2011.
[13] Y. Ren, M. J. Skibniewski, and S. Jiang, “Building information modelling integrated with electronic commerce material procurement and supplier performance management system”, Journal of Civil Engineering and Management, 18(5), 642-654, 2012.
[14] A. Grilo, and R. Jardim-Goncalves, “Challenging electronic procurement in the AEC sector: A BIM-based integrated perspective”, Automation in Construction, 20(2), 107-114, 2011.
[15] D. Luzzini, E. Brandon-Jones, A. Brandon-Jones, and G. Spina, “From sustainability commitment to performance: The role of intra-and inter-firm collaborative capabilities in the upstream supply chain”, International Journal of Production Economics, 165, 51-63, 2015.
[16] H. Walker, and S. Brammer, “The relationship between sustainable procurement and e-procurement in the public sector”, International Journal of Production Economics, 2012.
[17] R. Eadie, S. Perera, G. Heaney, and J. Carlisle, “Drivers and barriers to public sector e-procurement within Northern Ireland’s construction industry”, Journal of Information Technology in Construction, 12, 103-120, 2007.
[18] H. H. Chang, and K. H. Wong, “Adoption of e-procurement and participation of e-marketplace on firm performance: Trust as a moderator”, Information & Management, 47(5), 262-270, 2010.
[19] C. Piera, C. Roberto, C. Giuseppe, and M. Teresa, “E-procurement and E-supply Chain: Features and Development of E-collaboration”, IERI Procedia, 6, 8-14, 2014.
[20] P. Toktaş-Palut, E. Baylav, S. Teoman, and M. Altunbey, “The impact of barriers and benefits of e-procurement on its adoption decision: An empirical analysis”, International Journal of Production Economics, 158, 77-90, 2014.
[21] R. Eadie, S. Perera, and G. Heaney, “Analysis of the use of e-procurement in the Public and Private Sectors
of the UK Construction Industry”, Journal of Information Technology in Construction (ITcon), 16, 669-686, 2011.
[22] P. Panda, and G. P. Sahu, “Combating ccorruption in public procurements through e-procurement: challenges and opportunities, In Shri Bhagwan Dahiya, Kavita Chakravarty, Nandita Rathee and Seema V Lamba (Eds.), Governance Issues and Corruption (pp. 173-196). Haryana, India: Intellectual Foundation, 2011.
[23] D. O. Nduka, and O. E. Ogunsanmi, “Stakeholders perception of factors determining the adoptability of green building practices in construction projects in Nigeria”, Journal of Environment and Earth Science, 5(2), 188-196, 2015.
[24] M. Hankinson, and A. Breytenbach, “Barriers that impact on the implementation of sustainable design”, Cumulus Helsinki, 1-11, 2012.
World Congress on Sustainable Technologies (WCST-2015)
Copyright © 2015 Technical Co-Sponsored by IEEE UK/RI Computer Chapter 70
Examining the Implantation of Sustainability into
State Procurement Decision Models: An Experiential
Overview of the Nigerian Public Sector
Victor O. Adebayo
Westminster Business School
University of Westminster
London United Kingdom
Abstract— Green Public Procurement (GPP) is a public policy
tool that facilitates the embedding of the Triple Bottom Line
(TBL) goals of sustainable development. Several research studies
have examined the embedding of sustainability into state
procurement decisions; however, in the main, empirical studies
on the incorporation of sustainability into public procurement
processes, frameworks and decision-making in Sub-Saharan
Africa (SSA) countries have been overlooked. Using data
gathered from a questionnaire survey, this paper aims to examine
the embedding of sustainability into public procurement
decisions in Nigeria. Specifically, the research measures the
impact of procurement policy, lifecycle analysis (LCA),
procurement processes and supplier relationships in the
implanting of sustainability in public procurement. Results were
obtained from a questionnaire sent to 103 respondents working in
procurement departments in the Nigerian public sector. 58
responses were returned representing a 57% response rate. The
findings show that, cumulatively, there are inadequate policy
measures to address the TBL of sustainability. The research
outcomes also show that supplier relationships are not optimized
and LCA is not sufficiently utilised in the public procurement
decision making process in Nigeria. In terms of policy, the study
will enable governments in developing countries to formulate and
implement effective GPP policies.
Keywords-component; LCA, procurement policy, sustainable
procurement and processes
I. INTRODUCTION
There is increasing sentiency that the current trajectory of
human consumption and depletion of the earth’s ecosystem is
unsustainable. There is growing perception that commercial
profit should not be at the expense of the people or planet [1].
T. Johnsen, M. Howard and J. Miemczyk [2] posited that the
planet’s resources are in decline and the climate is changing,
leading to pressures on businesses to embark on de-
carbonisation initiatives, recycling and the development of
greener technologies. In the public sector, there is an increased
cognizance that governments have a role to play in fostering
sustainability by a) leading by example and b) articulating and
effecting policies that will drive sustainability goals in the
society. S. Brammer and H. Walker [3] highlight the
importance of policy and GPP policy; K. Nijaki and G. Worrel
[4] posited that GPP policy can stimulate social equity,
economic development and create environmental benefits.
In 2015, the Nigerian government will spend around 20%
of its national budget on public procurement, this is an
equivalent of $10 billion [5]. In the EU, public procurement
accounts for 16% of GDP, in the UK, 31% of GDP is spent on
GPP while the Netherlands, South Korea and the USA spend
45%, 40% and 28% of GDP respectively on GPP [6]. In view
of this indicatory large volume of government expenditure on
public purchases, this paper argues that a well formulated GPP
policy can facilitate the incorporation of sustainability in
economies, especially in developing countries.
II. REVIEW OF LITERATURE
The notion of GPP attempts to accomplish a competitive,
accountable and durable approach to procuring goods and
services. [3] defined sustainable procurement (SP) as
procurement that is consistent with the principles of
sustainable development, such as, ensuring a strong, healthy
and just society, living within environmental limits and
promoting good governance.
Notably, Defra [7] included the critical component of
whole life cycle evaluation of public procurement decisions by
describing SP as the process whereby organisations meet their
needs for goods, services, works and utilities in a way that
achieves value for money on a whole life basis in terms of
generating benefits not only to the organisation but also to the
society and the environment. This delineation captures the
general fundamentals of SP and it incorporates the following
key elements; a) Meeting organisational procurement needs;
b) Achieving value for money; c) Considering whole life cycle
of purchases and d) Benefit to organisation and environment.
In 1987, the World Commission on Economic Development
(WCED) (now known as the Brundtland Commission) was
formed, the sustainability model of the Commission were
driven by three mainstays- economic growth, environmental
protection, social quality [8], this is illustrated in Fig. 1.
World Congress on Sustainable Technologies (WCST-2015)
Copyright © 2015 Technical Co-Sponsored by IEEE UK/RI Computer Chapter 71

Building on these central pillars of sustainability, J. Elkington
[9] articulated the concept of the “triple bottom line”, which
explains that sustainability is the interrelationship of
economic, environmental and social dimensions. Senge et al,
[10] further developed this notion by conceptualising the
three-nested dependency model that discloses an
interdependence relationship, (see Fig. 2). It represents
humans as an appendage of the environment where economic
models are cultivated to improve their quality of life.
Figure 1. The triple bottom line of sustainability
Figure 2. Three Nested Dependencies Model
III. EMBEDDING SUSTAINABILITY INTO PUBLIC
RPOCUREMENT: THEORECTICAL UNDERPINNINGS AND KEY
ASSUMPTIONS
A. Procurement policy
In an assessment of the process of developing a Green
Public Procurement (GPP) criteria at a Swedish government
department, B. C, S. Hallstedt, Broman and Oldmark [11]
opined that in other to allow for a more strategic approach that
will significantly promote innovative service solutions in
support of sustainable development, policy and process
changes are needed. Simcoe and Toffel [12] posited that public
sector procurement policies may influence private sector
demand for similar products; in a study of municipal policies
in California, USA, they concluded that government
procurement policies facilitate spill-over effects that stimulate,
a) private sector adoption and b) supplier investment in green
building expertise. Researchers [13] argued that due to some
distinctiveness within some sectors such as the heritage
industry, policy makers and practitioners need greater
understanding of the requirements of SME suppliers in
different sectors.
B. Lifecycle analysis
O. Perera, B. Morton and T. Prefrement [14] described
Lifecycle Analysis (LCA) as economic assessment
considering all projected significant cost flows over a period
of analysis expressed in monetary terms. LCA enables
governments to demonstrate that procurement decisions and
activities need to move beyond the consideration of the
purchase price of a good or service but examine the costs over
the phases of the asset lifecycle. B. E. Tysseland [15] in a
research study of public procurement by the Norwegian
defense ministry observed that there is a policy statement that
indicates when procurement decisions are made, purchases
that yield the lowest possible lifecycle cost (LCC) for the
ministry must be procured, even if the initial cost is higher. S.
Hart, [16] explained that in Europe, the European Union (EU)
procurement directives of 2014 favor a lifecycle approach for
public purchases, however, they do not require cradle-to-grave
assessment of environmental impacts. M. Tarantini, A. D.
Loprieno and P. L. Porta [17] opined that LCA facilitates the
identification of the main impacts and critical processes of the
window lifecycle in Italy, this gives a scientific framework to
discuss the sustainability specific criteria with suppliers.
C. Procurement process
According to Vatalis, Manoliadis and Mavridis [18], the
main problem of GPP in Greece is related to the waste in
processes and the lack of quality specifications. [19], agreed
with researcher [18], the paper explained that public
procurement regulation such as tender processes may hinder
innovation through its rigidity. J. Smith, G. Andersson, R.
Gourlay, S. Karner, B. E. Mikkelsen, R. Sonnino and D.
Barling [20] argued that there is a need for political continuity
that supports and enables policy makers and practitioners to
take an incremental approach to change. Testa, Annunziata,
Iraldo and Frey [21] found that raising awareness on GPP
techniques can strongly support the development of public
tenders and also by national and local supporting initiatives.
D. Partnership and supplier relationships
Grudinschi, Sintonen and Hallikas [22] postulated that
well managed partnerships between buyers and suppliers are
needed to achieve collaboration fluency and improve the
effectiveness of procurement, the study concluded that in
World Congress on Sustainable Technologies (WCST-2015)
Copyright © 2015 Technical Co-Sponsored by IEEE UK/RI Computer Chapter 72

collaborative relationships in public procurement, the higher
the perceived relationships, the more positive effects they will
have in terms of increasing trust, communication and the
quality of collaboration management. Vesalainen and
Kohtamäki [23] formulated a parsimonious framework for
relationship integration to create a holistic understanding of
relational configurations. The paper through empirical
research demonstrated the link between relational alignments
and performance. Jost, Dawson and Shaw [24] observed that
the UK public sector increasingly requires private sector
organisations to form supplier groupings, especially for large
projects. The paper identified the following factors as the main
determinants of productive relationships; a) reconciliation of
objectives; b) continuity of staff engagement; c) team
building; and d) trust.
IV. METHODOLOGY
On the basis of the foregoing literature review, a questionnaire was developed to collect primary data applicable to the outlined objectives of this research. The study utilised a cross-sectional field survey. The questionnaires were circulated to 103 procurement professionals operating in Nigerian public sector organisations. In total, 59 responses were received, representing a 57% response rate. 11 of the questionnaires were incomplete and were therefore omitted from the data analysis.
V. RESULTS
A. Questionnaire Respondents
An overview of the respondents are as follows:
1) 72.92% of the respondents indicated that they are
Procurement Officers/Analysts, 16.67% hold the position of
Manager, while 6.25% indicated that they are at the
Graduate/Entry level.
2) 47.92% of the survey participants work in a local
government office, 43.75% indicated that they work in State
government ministry while 4.17% work in government
parastatals.
3) 70.83% of the respondents were male while 29.11%
were female.
B. Sustainability policy and employee experience
When respondents were asked if they have a sustainability
policy, 83.3% indicated they do not have a sustainability
policy while 16.67% indicated they have one.
54.17% of the respondents indicated that they have no
experience in sustainable procurement while 59.57% of the
survey participants stated that they have not undergone any
training or participated in any educational programme relating
to sustainable procurement.
C. Lifecycle analysis and sustainability embedding
The research measured how sustainability is incorporated
into the organisations’ of the participants.
This category had a mean range between 2.67-2.85. Table I
shows the mean and standard deviation for the factors
measured in the data analysis.
Respondents were asked if their organisations use LCA to
evaluate the sustainability of goods and services, 58.3%
indicated that this did not happen in their organisations; 10.4%
indicated that it does occur in their organisation but there was
no consistency; 18.8% said that it usually occurs but it could
be better.
TABLE I. VARIABLE RATINGS FOR LCA AND THE EMBEDDING OF SUSTAINABILITY
n x Std.D Uses a lifecycle
analysis to
evaluate the sustainability of
goods/services
48 2.79 1.15
Asks suppliers to commit to waste
reduction goals
48 2.85 1.26
Asks suppliers to
pay minimum wage for workers
48 2.83 1.27
Active role in
managing capital/project
spend
48 2.73 1.17
Contribute to risk assessments on
capital/project
spend
48 2.67 1.28
The survey participants were also asked if their organisations
asks suppliers to commit to waste reduction goals, 39.6% said
that it does not happen while 18.8% said that it happens
occasionally but there was no consistency. Furthermore, the
survey also enquired if organisations asks suppliers to pay the
minimum wage for workers, 39.6% indicated that it did not
happen, 20.8% said that it did happen but there is no
consistency.
D. Procurement Policy
This section measures the organisations’ procurement
objectives and how they are developed. As can be seen from
Table II, the mean range for this category is 2.65-3.23. The
results show that 37.5% of the participants indicated that their
organisations do not have a formal procurement strategy or
policy. 22.9% indicated that their organisations have a
procurement strategy policy but lacked consistency. The
survey also sought to establish if the participant’s
organisations’ periodically review and update their policies,
33.3% of the respondents indicated that they did not; 12.5%
indicated that it was the recognized way they do business
while 22.9% indicated that they were not consistent. The
research was also interested in establishing if organisations in
the Nigerian public sector have a robust procurement data
repository; 68.8% of the participants said this was not the case
while 12.5% said that it occasionally happens but there is no
consistency.
World Congress on Sustainable Technologies (WCST-2015)
Copyright © 2015 Technical Co-Sponsored by IEEE UK/RI Computer Chapter 73

TABLE II. VARIABLE RATINGS FOR PROCUREMENT POLICY
n x Std.D Formal procurement strategy
and policy
48 3.23 1.19
Periodic review and update of policy
48 3.1 1.37
Systems/processes to monitor department
operating costs
48 2.98 1.36
Supplier appraisal/monitoring system
48 2.98 1.33
Clear objectives and KPIs 48 3.1 1.26
E. Procurement process
This factor measures how effectively the procurement is
run in the participant’s organisations. As may be seen in Table
III, the mean range is between 2.85 to 3.06. The participants
were asked if their organisations’ measure the effectiveness of
their procurement performance, 35.4% indicated that it did not
happen while the same number of respondents indicated that
while it happens occasionally, there is no consistency. The
survey also enquired if the organisations’ measure the
effectiveness of key procurement processes, 43.8% indicated
that it did not happen while 29.2% said that it was not
consistent; 6.3% of the respondents indicated that it is a key
part of their organisation’s procurement culture. When the
survey enquired if the organisations benchmark their
procurement efficiency and effectiveness, 50% of the
respondents said that it did not happen; 20.8% indicated that it
is not consistent; 12.5% indicated that although it does
happen, it could be better.
TABLE III. VARIABLE RATINGS FOR PROCUREMENT PROCESS
n x Std.D Identification of
key procurement
processes critical to meeting
procurement
objectives
48 3.04 1.24
Measure effectiveness of
key procurement processes
48 2.96 1.21
Measure
effectiveness of
procurement performance
48 3.21 1.26
Responsibility for
improving procurement
processes clearly
defined
48 3.06 1.25
Benchmark procurement
efficiency
48 2.85 1.26
F. Partnership and Supplier Relationships
This section measures how organisations create partnership
with their suppliers. Table IV show that the mean ratings for
this category. The research sought to establish if the
organisations develop and manage its relationship with
suppliers in other to create mutuality, 41.7% of the
participants indicated that it did not happen, 35.4% said that it
did happen but there is no consistency. The paper also sought
to establish if the organisations have a clearly documented
supplier management policy, 39.6% indicated that this was not
the case, 25% said that it lacked consistency while 14.6%
expressed that it did happen but it could be better. The
research was also considered if organisations ensure that their
suppliers’ locations are operated in a safe manner, 47.9%
disagreed, and 18.7% indicated that although it does happen,
there is no consistency.
TABLE IV. VARIABLE RATINGS FOR PARTNERSHIP AND SUPPLIER
RELATIONSHIP
n x Std.D Develop and
manage relationship with
suppliers
48 3.04 1.22
Clearly
documented supplier
management
policy
48 3.04 1.26
Ensures suppliers’
locations are
operated in a safe
manner
48 2.79 1.29
Visit suppliers to
confirm working
conditions
48 2.75 1.31
Procurement data
repository
48 2.65 1.28
VI. DISCUSSION
The factors measuring LCA and the embedding of
sustainability into the Nigerian public sector were all < 3.0.
This indicates that these factors (see Table I) are not optimally
accomplished in the organisations surveyed. Factor 1 (uses
LCA to evaluate the sustainability of goods/services) had a
mean rating of 2.79; based on this result, the empirical
assumption is that in overall terms, procurement departments
in the Nigerian public sector do not use LCA in state
procurement decision making. There is parallelism between
the LCA results in this paper and those obtained from S.
Brammer and H. Walker [25] that measured sustainable
procurement in the UK public sector. The LCA mean ratings
for [25] were 2.71 for services, 2.71 for the health sector and
3.0 for the education sector.
Results from the procurement policy category show that,
cumulatively, procurement departments in Nigerian public
sector have, to a certain degree, integrated formal procurement
strategy and policy into their operations. It also indicates that
World Congress on Sustainable Technologies (WCST-2015)
Copyright © 2015 Technical Co-Sponsored by IEEE UK/RI Computer Chapter 74
they do conduct periodic reviews and updates of policy as
these two factors had mean ratings of 3.23 and 3.1
respectively. Although, results also show that their supplier
appraisal and monitoring systems are sub-optimal with a mean
rating <3.0. These results are analogous to conclusions by L.
Li and K. [26], they conclude that environmentally responsible
public procurement is a driving force in the integration of GPP
policy instruments. Geiser G. Oruezabala and J. C. Rico [27],
suggested that in the process of embedding sustainability in
public procurement, new policy rules are created.
Results from the procurement process segment indicate
that the following factors been relatively embedded in the
procurement departments survey; a) identification of key
procurement processes critical to meeting procurement
objectives; b) measurement of the effectiveness of
procurement performance and c) responsibility for improving
procurement processes are clearly defined. Conversely, results
also indicate that there is sub-optimal performance with
regards to benchmarking procurement efficiency and
effectiveness. In support of these argument, [11], posited that
there are several weaknesses of public process, including, lack
of a clear definition of sustainability objectives and no strategy
to prepare for future processes. Likewise, [18] revealed that
the main problem of GPP in Greece is related to a waste in
processes.
Table IV shows that procurement departments have not
optimized supplier relationships. Results indicates an
aggregate weakness in the following factors; a) procurement
departments ensure that suppliers’ locations are operated in a
safe manner; b) visit suppliers to confirm working conditions
and c) procurement data repository, with mean ratings of 2.79,
2.75 and 2.65. These factors are key elements in the
embedding sustainability (in terms of the economic and social
aspects of the TBL) in organisations. These results show
congruity with conclusions made by Igarashi, Mieko, L. d.
Boer and O. Michelsen [28], which concluded that purchasing
organisations do not adequately define sustainability criteria
when communicating with suppliers and during supplier
selection. Similarly, E. Uyarra, J. Edler, J. Garcia-Estevez, L.
Georghiou and J. Yeow, [29] reported that a lack of interaction
with purchasing organisations, the use of over specified
tenders and low competencies are barriers to procurement
innovation.
VII. CONCLUSION, LIMITATIONS AND FUTURE WORK
This paper contributes to and enhances the body of
literature relating to the embedding of sustainability in public
procurement, particularly in developing countries. The paper
also contributes to the concepts of procurement policy/process
in the public sector and developing countries literature. At
practitioner level, this research will allow public procurement
professionals to further understand how procurement
processes are amplified and how to enhance and augment
supplier relationships. Additionally, in terms of policy, the
study will enable governments especially in developing
countries to formulate and implement GPP policies and
coordinate the embedding of sustainability into public
procurement. However, the paper has some limitations, it may
be argued that the population of survey was low. The study
was conducted using quantitative methods; whilst it ensured
that there was no direct contact with or influence on the survey
participants, it also meant that no follow up questions in the
form of qualitative interviews could be conducted, this would
have enabled further analysis. For future work on this paper,
the author proposes the use of a triangulation method to
increase reliability and the utilization of a larger population
data set to reinforce research validity.
REFERENCES
[1] P. Jacques, “Sustainability: The Basics, Routledge., 2014.
[2] T. Johnsen, M. Howard and J. Miemczyk, Purchasing and Supply Chain
Management: A Sustainability Perspective, Routledge, 2014.
[3] S. Brammer and H. Walker, "Sustainable procurement in the public
sector: an international comparative study," International Journal of
Operations & Production Management, vol. 31, no. 4, pp. 452-476., 2011.
[4] K. Nijaki and G. Worrel, "Procurement for sustainable local economic
development.," International Journal of Public Sector Management, vol. 25, no. 2, pp. 133-153., 2012.
[5] BudgIT, "Nigeria Budget data," 2015. [Online]. Available:
//www.yourbudgit.com/data/. [Accessed 2 March 2015].
[6] V. Adebayo, "Embedding Sustainability in the Public Procurement
Framework of Developing Countries- An Empirical Analysis of the Lagos State Government," Journal of Economics and Sustainable
Development, vol. 6, no. 18, pp. 114-125, 2015.
[7] Defra, "Securing the Future: A new Strategy," 2005. [Online]. Available:
https://www.gov.uk/government/uploads/system/uploads/attachment_d
ata/file/69412/pb10589-securing-the-future-050307.pdf . [Accessed 30 January 2014].
[8] G. Brundtland, M. Khalid, S. Agnelli and Al-Athel, "“Our Common Future”.," 1987.
[9] J. Elkington, "Partnerships from cannibals with forks: The triple bottom
line of 21st‐century business.," Environmental Quality Management, vol. 8, no. 1, pp. 37-51, 1998.
[10] Senge, Smith, Kruschwitz, Laur and S. ., "The Necessary Revolution: How Individuals andOrganizations Are Working Together to Create a
Sustainable World. Strategic Direction," vol. 25, no. 8, 2009.
[11] B. C, S. Hallstedt, Broman and Oldmark, "Assessment for criteria development for public procurement from a startegic sustainability
perspective," Journal of Cleaner Production, vol. 52, pp. 309-316,
2013.
[12] Simcoe and Toffel, "Government green procurement spillovers:
Evidence from municipal building policies in California.," Journal of
Environmental Economics and Management,, vol. 68, no. 3, pp. 411-434, 2014.
[13] Loader and Norton, "SME access to public procurement: An analysis of
the experiences of SMEs supplying the publicly funded UK heritage sector.," Journal of Purchasing and Supply Management., 2015.
[14] O. Perera, B. Morton and T. Prefrement, "Lifecycle Cost in Sustainable
Public Procurement: A question of Value," International Institute of Sustainable Development, Manitoba, Canada, 2009.
[15] B. E. Tysseland, "Life cycle cost based procurement decisions: a case
study of Norwegian defence procurement projects," International Journal of Project Managemen, vol. 26(4), pp. 366-375, 2008.
World Congress on Sustainable Technologies (WCST-2015)
Copyright © 2015 Technical Co-Sponsored by IEEE UK/RI Computer Chapter 75

[16] S. Hart, "Green Product Procurement Policy in the European Union: Treatment of Lifecycle Carbon Analysis and Environmental PPM
Restrictions.," Columbia Law School, Sabin Center for Climate Change Law., 2013.
[17] M. Tarantini, A. D. Loprieno and P. L. Porta, "A life cycle approach to
Green Public Procurement of building materials and elements: A case study on windows.," Energy, vol. 36, no. 5, pp. 2473-2482., 2011.
[18] Vatalis, Manoliadis and Mavridis, "Project performance indicators as an
innovative tool for identifying sustainability perspectives in green public procurement.," Procedia Economics and Finance, vol. 1, pp.
401-410, (2012).
[19] Haavisto and Kovács, "A Framework for Cascading Innovation Upstream the Humanitarian Supply Chain through Procurement
Processes," Procedia Engineering, vol. 107, pp. 140-145., 2015.
[20] J. Smith, G. Andersson, R. Gourlay, S. Karner, B. E. Mikkelsen, R. Sonnino and D. Barling, "Balancing competing policy demands: the
case of sustainable public sector food procurement," Journal of Cleaner
Production, 2015.
[21] Testa, Annunziata, Iraldo and Frey, "Drawbacks and opportunities of
green public procurement: an effective tool for sustainable production,"
Journal of Cleaner Production, 2014.
[22] Grudinschi, Sintonen and Hallikas, "Relationship risk perception and
determinants of the collaboration fluency of buyer–supplier
relationships in public service procurement.," Journal of Purchasing and Supply Management, vol. 20, no. 2, pp. 82-91., 2014.
[23] Vesalainen and Kohtamäki, "Toward a typological view of buyer–
supplier relationships: Challenging the unidimensional relationship continuum," Industrial Marketing Management., 2015.
[24] Jost, Dawson and Shaw., "Private Sector Consortia Working for a
Public Sector Client–Factors that Build Successful Relationships:: Lessons from the UK.," European Management Journal, vol. 23, no. 3,
pp. 336-350., 2005.
[25] S. Brammer and H. Walker, "Sustainable procurement in the United Kingdom public sector.," Supply Chain Management:An International
Journal,, vol. 14, no. 2, pp. 128-137., 2009.
[26] L. Li and K. Geiser, "Environmentally responsible public procurement (ERPP) and its implications for integrated product policy (IPP),"
Journal of Cleaner Production, vol. 13, no. 7, pp. 705-715, 2005.
[27] G. Oruezabala and J. C. Rico, "The impact of sustainable public procurement on supplier management—The case of French public
hospitals.," Industrial Marketing Management, vol. 41, no. 4, pp. 573-
580., 2012.
[28] Igarashi, Mieko, L. d. Boer and O. Michelsen, "Investigating the
anatomy of supplier selection in green public procurement," Journal of
Cleaner Production, 2015.
[29] E. Uyarra, J. Edler, J. Garcia-Estevez, L. Georghiou and J. Yeow,
"Barriers to innovation through public procurement: A supplier
perspective," Technovation, vol. 34, no. 10, pp. 631-645., 2014.
[30] OECD, "“OECD Principles for Integrity in Public Procurement”.,"
OECD Publishing, Paris., 2009.
[31] OECD, " "Public procurement spending", in OECD, Government at a Glance 2013,," OECD, Paris, 2013.
[32] C. McCrudden, "Using public procurement to achieve social outcomes. In Natural resources forum," Blackwell Publishing Ltd., vol. 28, no. 4,
pp. 257-267, 2004.
[33] OECD, "“Size of public procurement spending”," 2014. [Online]. Available: http://www.oecd-ilibrary.org/sites/gov_glance-2011
en/09/01/index.html?contentType=/ns/StatisticalPublication,/ns/Chapter
&itemId=/content/chapter/gov_glance-2011-46-en&containerItemId=/content/serial/22214399&accessItemIds=&mime
Type=text/html.. [Accessed 12 February 2015].
[34] E. Commission, "Measurement of Indicators for the Economic Impact of Public Procurement Policy, Working document," European
Commission, Brussels, 2008.
World Congress on Sustainable Technologies (WCST-2015)
Copyright © 2015 Technical Co-Sponsored by IEEE UK/RI Computer Chapter 76
An Investigation into the Costs and Benefits of Green Building in South Africa
Shallyne Sundayi, Vittorio Tramontin, Claudia Loggia Department of Property Development
School of Engineering, University of KwaZulu-Natal Durban 4041, South Africa
[email protected], [email protected], [email protected]
Abstract- With the global concern about sustainable development, also the South African building industry has engaged in sustainable construction. However, the South African green building market has not reached enough maturity and gained strong support from the industry stakeholders yet. Major barriers to green building development are particularly related to the gap of available data about the financial implications of green buildings in the local market, which creates uncertainty for the investments in building “green”. This study aims to provide a contribution towards overcoming these barriers, by investigating the property developers’ perception on green building and its cost implications in the South African province of KwaZulu-Natal, and by providing a preliminary cost-benefit assessment of an accredited green building in Durban. Findings demonstrated that developers have started to recognize the financial benefits of green buildings and perceived that in the near future they will become the norm. The preliminary cost-benefit analysis showed short payback period and profitability for the investment in green measures. The results of this study may constitute a first step into a more comprehensive understanding of the economic implications of green building in a young green building market such as the South African one, encouraging its development and growth.
Keywords - green building, cost-benefit analysis, developing country, developer perception, green building rating system.
I. INTRODUCTION
Mature green building markets such as the ones in Australia and United States have conducted extensive studies on the economic implications of green building, thereby indicating the ranges of cost premiums, operating cost savings and other benefit indications [1] [2]. However, in developing countries such as South Africa the green building market is still at a very young stage and not yet mature.
Misconception about the financial implications of green buildings and lack of access to their cost indications are main factors inhibiting the implementation thereof in such markets. In South Africa, little has been done in terms of studies on the actual cost impacts of green building. A recent study published by the Green Building Council of South Africa (GBCSA) found that “due to the relative immaturity of the South African Green Building market, there is at this stage still a lack of compiled local data which would provide the valuable evidence
of costs and financial benefits for green building in the South African context [3]”.
This lack of information into the reality of the cost impacts of green building in the South African building industry gave reasons and motivations for this study. Finding out the major barriers to green building is critical in order to identify ways to overcome these barriers and to foster its implementation. In a young green building market that is expanding, key role players in the building industry need valuable information to understand relevant financial implications, benefits and how to use costing strategies to evaluate green projects. This would also lead to foster the interest of the industry towards green developments.
The second most populated South African province, KwaZulu-Natal, counts only 7 out of more than 60 Green Star South Africa (GSSA) certified buildings in the country [4]. In the light of this embryonic green building market, this study aimed to investigate the perception of property developers in KwaZulu-Natal on green building and related financial implications. The study also focused on a preliminary cost-benefit analysis of green building in the local context. Previous studies [3] focused on finding out the cost premium of green building in South Africa on a percentage basis. This study however expands on this, relates the premium to the GSSA categories and estimates possible related financial benefits for the implementation of green measures for a case study in the young South African green building market.
A mixed method was adopted, combining literature research with semi-structured interviews and quantitative analyses regarding the cost-benefit assessment of green building. This was conducted through a case study approach, investigating a GSSA certified office building in Durban.
The following section provides a literature review on the topics of the costs and financial benefits of green building, then the methodology is explained in detail. The results of the various steps of the research are then reported and discussed. Finally, in the light of the outcomes of the study conclusions and recommendations are provided.
II. COSTS AND FINANCIAL BENEFITS OF GREEN BUILDING
Green buildings are characterized by environmental, social and economic factors. The environmental factors include site
World Congress on Sustainable Technologies (WCST-2015)
Copyright © 2015 Technical Co-Sponsored by IEEE UK/RI Computer Chapter 77
selection, energy, water, resources, materials and components, transport, emissions and waste. The social factors include improved indoor environmental quality, health, access to facilities, participation, control, education and safety. The economic factors comprise of efficiency of use, operational costs, durability, capital costs, adaptability and maintenance [5] [6].
Present day acceptance of the green building guidelines in developed nations can be attributed to their relatively long involvement in green building movements. In developing countries, the growing interest in green building can be attributed to the public awareness, as well as the international pressure to reduce the environmental impacts such as the increase in CO2 emissions, water usage and soil pollution occurring due to the exponential growth of the built environment [7]. In developing countries such as South Africa the green building market is expanding but not yet mature. This has particularly been affected by the late development of the national policy framework. The regulation on energy efficiency in buildings came into effect only in late 2011 (SANS 10400-XA). On the other hand, the Green Building Council of South Africa, formed in 2007, has played a pivotal role in the green building market by recommending, motivating and certifying green buildings. In early 2014 the GBCSA celebrated the 50th GSSA certification, however there are provinces in which the development of accredited green buildings is still marginal. KwaZulu-Natal, the second most populated province of South Africa counting almost 20% of national population, includes only 7 of the GSSA certified buildings of the country [4]. Thus more in-depth research is essential to find ways to overcome the barriers to and face the challenge of green building development.
Despite the wide interest in sustainable design, the implementation of green buildings is in fact limited by many barriers, of which the misconceptions about their cost impact and their perceived higher cost are principal ones [8]. The perception of developers and clients often is that there are higher investment costs to go green, due to technology application and skill development, and those premiums increase the risk for the business opportunity [9]. This is primarily due to a lack of knowledge and information on green building and their cost-benefit ratio. A study conducted by the Green Building Council of Australia in 2006 demonstrated that construction industry participants believed that current information sources did not fulfil the information need for green building, and this prime information need was essential for the development of the local green building market [10].
The uptake of property as an investment vehicle has increased substantially in recent years as the security of property is considered higher than that of shares. The escalation of the property market in recent years has heightened property as a pure investment vehicle, resulting in property investment decisions tied ultimately to the bottom line of the operating income over the period, the main emphasis being placed on the net present value of the property asset. Investment market participants started relatively late to take up the challenge of sustainable development [11], especially in developing countries such as South Africa. A number of aspects require further research to accelerate the uptake of sustainable buildings in this sector, particularly with regards to
financial business case and risk reduction. The lack of information and substantial data analysis into sustainable buildings makes investing in sustainable buildings risky in terms of financial reporting. The investment community requires financial evidence of business case for green buildings to persuade business practices, foster investment decisions, to inform the public debate and to transform the markets for sustainable buildings. “To be able to encourage developers, clients and stakeholders to risk new approaches and apply new sustainable technologies and strategies in their projects a lot needs to be done to showcase the maximum benefits and minimum financial exposure [12].” Investors need to know their return on investment, the expected income stream and what the market value or sale price of their asset is going to be.
Looking also at this aim, the development and worldwide diffusion of green building rating systems has favored the creation of an officially recognized green building market. Through the sustainability rating systems, together with the energy performance certificate introduced by several policies mostly in developed nations, the development of green buildings has started to become market driven due to the recognized sustainability leadership in the property industry.
Developed nations have carried out broad studies into the costs and financial benefits of green buildings. An extensive study on the Green Star certified buildings in Australia [2] stated that green design strategies have become “the norm” for higher quality buildings, and the perception of “extra‟ cost has diminished. This study showcased that in 2010 capital cost impacts of green buildings were in the range of -5% to -2% for 4 Star Green Star; 0% for 5 Star Green Star and between 6% and more for 6 Star Green Star rated buildings. Most industry commentators claimed already in 2010 that the Australian market was looking at 5 star Green Star Australia rating as the base standard for a marketable building. A research conducted on thirty three green buildings across the United States of America [13] found out that the average premium was slightly less than 2%, which was lower than what was commonly perceived. The majority of this cost was due to the increased architectural and engineering design time, and modelling costs necessary to integrate sustainable building practices.
The South African market being at a tender stage has not yet conducted empirical studies of a great magnitude on the cost impact and benefits of green building locally. Partial initial studies based on 8 case studies provided a range between 1% and 10% as possible expected premium for new commercial green buildings in South Africa [3]. The GBCSA has viewed the consensus on the environmental benefits of green building, however they have acknowledged the lack of thorough financial and economic supporting information on green building in the country [3].
Understanding the financial implications of green buildings in the local context is critical for their wide implementation. Studies in Australia and New Zealand [14] noticed that the development of green buildings was driven primarily by owner-occupiers and developers with special agreement between the government and tenants, and often promoted by government incentives. The private sector was hesitant about the viability of green buildings away from the government
World Congress on Sustainable Technologies (WCST-2015)
Copyright © 2015 Technical Co-Sponsored by IEEE UK/RI Computer Chapter 78

supported leases and owner-occupiers. Government’s views on the viability of green building is generally different to that of the private sector. Other studies observed in fact that governments see the benefits of sustainable buildings more through social and environmental benefits with some regard to financial. On the other hand the private sector may be less likely to care about health and environmental impacts and hence might perceive lower financial benefits of building green. In addition, due to the higher capital costs and hurdle rates, future financial benefits are discounted more heavily by the private sector than by public one, which might potentially further reduce the perceived value of future financial benefits of green building for the private sector [13].
Costs associated to buildings usually fall into the following categories: initial costs, operation, maintenance and repair, replacement; disposal costs, residual value and financial charges [15]. Construction costs are hard, but benefits such as projected energy savings, water savings and productivity gains are considered soft because they are speculative and occur in the future [8]. Also, often the responsible entity for design, construction and initial financing of a building is different from those operating the building, paying employees’ salaries and achieving benefits. However, decisions made at first stage of building design and construction can significantly affect the costs and their efficiency in later phases [16]. This is even more significant for the implementation of green practices.
Benefits of green building are both tangible and intangible [17]. Environmental benefits such as reduction in carbon emissions and energy consumption are primary reasons for the construction of green buildings. Also, green buildings can reduce operating costs to the owner and tenants over the operational life cycle of the building because of energy savings, water savings, mechanical equipment downsizing, better management and minor maintenance, reduced insurance and liability costs. Studies conducted in the United States observed that energy represented 30% of operating expenses in a typical office building and is the largest and most manageable expense in the provision of office space [18]. The better working environment in green buildings can increase profitability by increasing customer satisfaction, worker productivity and reducing employee absenteeism. Green buildings also provide the owner/developer a positive reputation showing social and environmental commitment. Relevant financial benefits are higher property value, higher asset returns, increased marketability and rental premium [3], as demonstrated by a study conducted on 40% of office buildings in Canberra and Sydney, which showed green rental and market value premiums for Green Star Australia certified buildings of 5% and 12% respectively [19]. Other potential benefits include reduced risk and liability, attraction of key tenant classes, minimization of the cost and impact of churn [3].
Some of the reported benefits are direct, such as lower operating costs, which may be critical in South Africa considering the dramatic electricity and water tariff increases, but some are indirect and need also external factors to be effective. For example higher rental premiums and market values need a long-term perspective and a maturity of the green building market to become significant and be appreciated.
III. METHODOLOGY
The study adopted a mixed method, which combined literature research with qualitative and quantitative approaches. Mixed methods have in fact the potential to investigate more in depth the problem and intensify its understanding [20]. A qualitative approach was implemented through semi-structured interviews with local property developers in the eThekwini area (Durban), aimed to understand their perception on green building in KwaZulu-Natal, related financial implications, and possible misconceptions in this regard. This approach was oriented as a means to ascertain whether a provision of understanding into the cost/benefit implications of green building could foster their implementation in the local industry. Stratified sampling was implemented to select relevant property developers for the growth of the local building industry, including both developers with and without green building experience. The sampling process led to five large local property developers that participated in the study and were reasonably representative of the local market.
A quantitative investigation was conducted to supplement and enrich the findings of the qualitative research [21]. Due to the lack of information regarding cost related aspects of green building in South Africa, a case study method was adopted to investigate more in depth the phenomenon within the context [22] [23] through the analysis of an officially accredited green building. Through a purposive and convenience sampling aligned with the aim of the study, a four-star Green Star South Africa certified office building, completed in late 2010, was investigated through a preliminary cost-benefit assessment. The building, Nedbank Ridgeside Office Park, is located in Umhlanga (eThekwini Municipality). The main green features include: high performance glazing façade; extensive use of natural lighting; views to the outdoors; high levels of thermal comfort; reduced demand for cooling and artificial lighting; water harvesting with reuse of the collected water for toilet flushing, irrigation and cooling towers; attenuation system for stormwater management including two ponds and a water feature.
As mentioned at the end of the previous section, most indirect financial benefits relate to a certain degree of maturity of the green building market to be appreciated. Therefore, due to the infancy of the South African green building market and limited information available particularly in KwaZulu-Natal, this study primarily focused on direct financial benefits in terms of operating cost savings. Cost premium for green implementation, Net Present Value (NPV) of operating cost reductions, related Internal Rate of Return (IRR) and discounted Payback period (PB) to recover the cost premium were considered in the analysis in order to compare the green building to conventional buildings in the local context.
The preliminary assessment of the costs and benefits was conducted by looking at the efficiency and value of investing in green strategies, considering lifetime savings based on an economic life of building elements and assuming a typical life of 20 years before renewal or replacement generally adopted according to the methodology followed by other studies [24]. However, it has to be noticed that passive strategies oriented to improve building performance (e.g. better glazing) may have also
World Congress on Sustainable Technologies (WCST-2015)
Copyright © 2015 Technical Co-Sponsored by IEEE UK/RI Computer Chapter 79
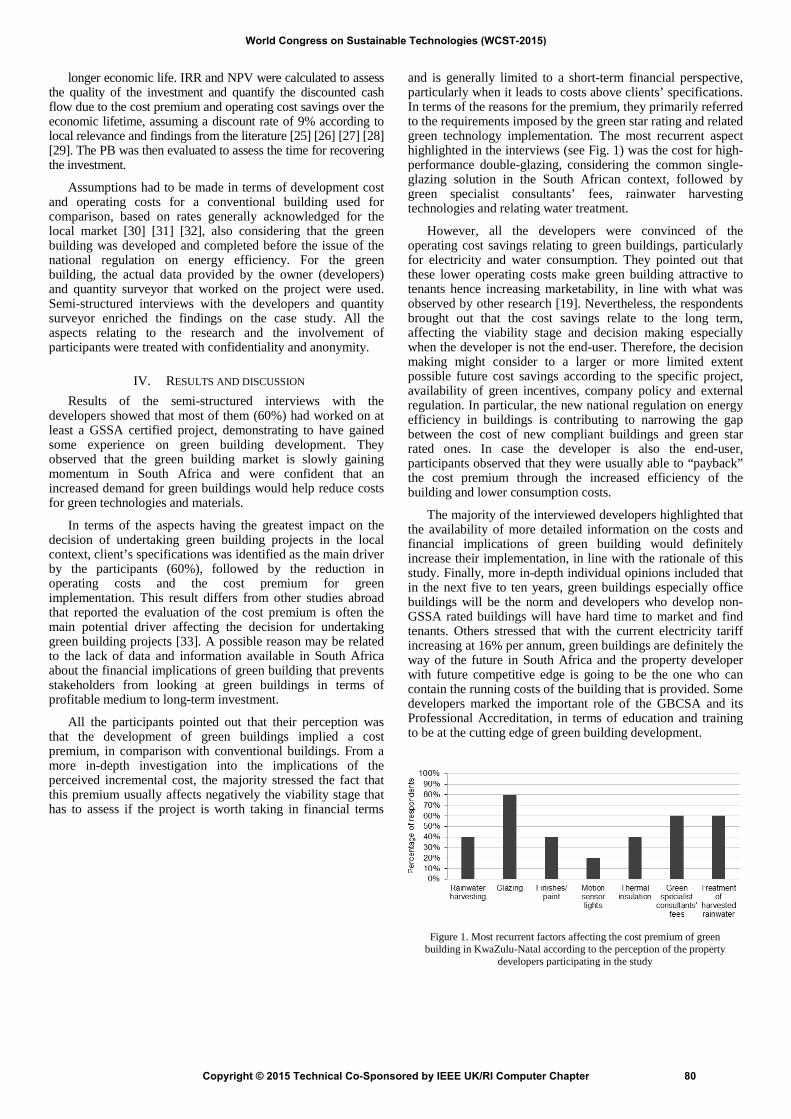
longer economic life. IRR and NPV were calculated to assess the quality of the investment and quantify the discounted cash flow due to the cost premium and operating cost savings over the economic lifetime, assuming a discount rate of 9% according to local relevance and findings from the literature [25] [26] [27] [28] [29]. The PB was then evaluated to assess the time for recovering the investment.
Assumptions had to be made in terms of development cost and operating costs for a conventional building used for comparison, based on rates generally acknowledged for the local market [30] [31] [32], also considering that the green building was developed and completed before the issue of the national regulation on energy efficiency. For the green building, the actual data provided by the owner (developers) and quantity surveyor that worked on the project were used. Semi-structured interviews with the developers and quantity surveyor enriched the findings on the case study. All the aspects relating to the research and the involvement of participants were treated with confidentiality and anonymity.
IV. RESULTS AND DISCUSSION
Results of the semi-structured interviews with the developers showed that most of them (60%) had worked on at least a GSSA certified project, demonstrating to have gained some experience on green building development. They observed that the green building market is slowly gaining momentum in South Africa and were confident that an increased demand for green buildings would help reduce costs for green technologies and materials.
In terms of the aspects having the greatest impact on the decision of undertaking green building projects in the local context, client’s specifications was identified as the main driver by the participants (60%), followed by the reduction in operating costs and the cost premium for green implementation. This result differs from other studies abroad that reported the evaluation of the cost premium is often the main potential driver affecting the decision for undertaking green building projects [33]. A possible reason may be related to the lack of data and information available in South Africa about the financial implications of green building that prevents stakeholders from looking at green buildings in terms of profitable medium to long-term investment.
All the participants pointed out that their perception was that the development of green buildings implied a cost premium, in comparison with conventional buildings. From a more in-depth investigation into the implications of the perceived incremental cost, the majority stressed the fact that this premium usually affects negatively the viability stage that has to assess if the project is worth taking in financial terms
and is generally limited to a short-term financial perspective, particularly when it leads to costs above clients’ specifications. In terms of the reasons for the premium, they primarily referred to the requirements imposed by the green star rating and related green technology implementation. The most recurrent aspect highlighted in the interviews (see Fig. 1) was the cost for high-performance double-glazing, considering the common single-glazing solution in the South African context, followed by green specialist consultants’ fees, rainwater harvesting technologies and relating water treatment.
However, all the developers were convinced of the operating cost savings relating to green buildings, particularly for electricity and water consumption. They pointed out that these lower operating costs make green building attractive to tenants hence increasing marketability, in line with what was observed by other research [19]. Nevertheless, the respondents brought out that the cost savings relate to the long term, affecting the viability stage and decision making especially when the developer is not the end-user. Therefore, the decision making might consider to a larger or more limited extent possible future cost savings according to the specific project, availability of green incentives, company policy and external regulation. In particular, the new national regulation on energy efficiency in buildings is contributing to narrowing the gap between the cost of new compliant buildings and green star rated ones. In case the developer is also the end-user, participants observed that they were usually able to “payback” the cost premium through the increased efficiency of the building and lower consumption costs.
The majority of the interviewed developers highlighted that the availability of more detailed information on the costs and financial implications of green building would definitely increase their implementation, in line with the rationale of this study. Finally, more in-depth individual opinions included that in the next five to ten years, green buildings especially office buildings will be the norm and developers who develop non-GSSA rated buildings will have hard time to market and find tenants. Others stressed that with the current electricity tariff increasing at 16% per annum, green buildings are definitely the way of the future in South Africa and the property developer with future competitive edge is going to be the one who can contain the running costs of the building that is provided. Some developers marked the important role of the GBCSA and its Professional Accreditation, in terms of education and training to be at the cutting edge of green building development.
Figure 1. Most recurrent factors affecting the cost premium of green building in KwaZulu-Natal according to the perception of the property
developers participating in the study
World Congress on Sustainable Technologies (WCST-2015)
Copyright © 2015 Technical Co-Sponsored by IEEE UK/RI Computer Chapter 80
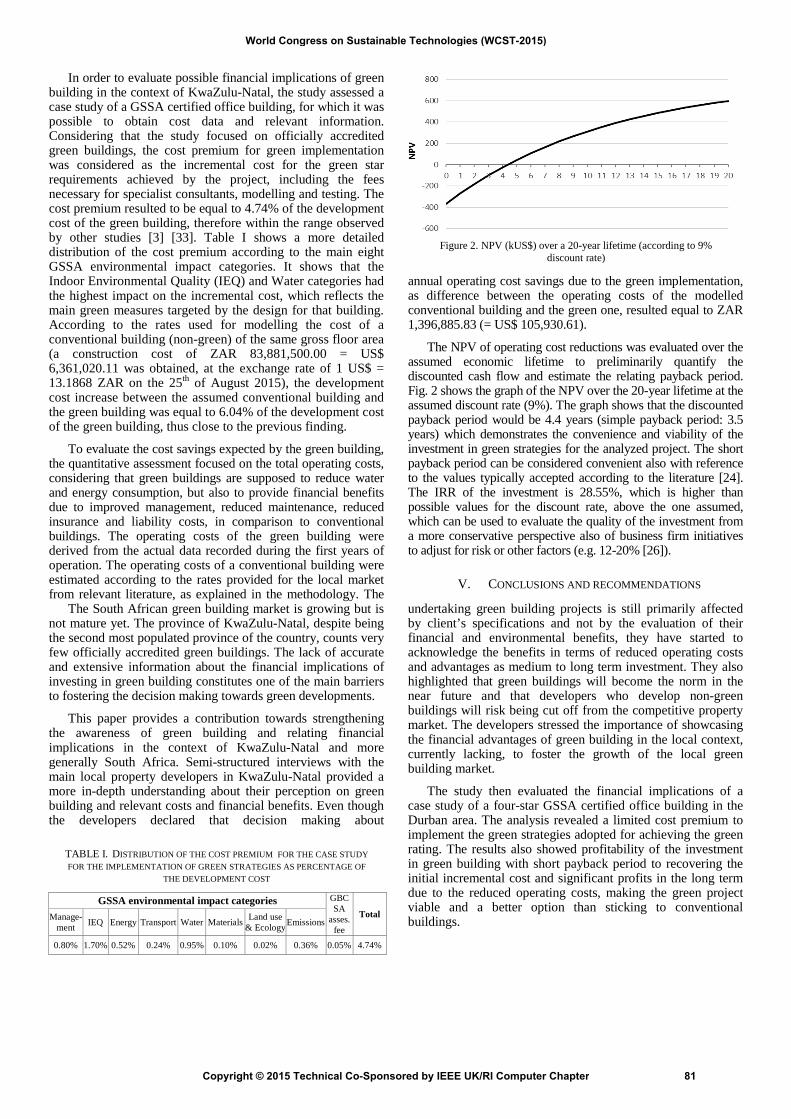
In order to evaluate possible financial implications of green building in the context of KwaZulu-Natal, the study assessed a case study of a GSSA certified office building, for which it was possible to obtain cost data and relevant information. Considering that the study focused on officially accredited green buildings, the cost premium for green implementation was considered as the incremental cost for the green star requirements achieved by the project, including the fees necessary for specialist consultants, modelling and testing. The cost premium resulted to be equal to 4.74% of the development cost of the green building, therefore within the range observed by other studies [3] [33]. Table I shows a more detailed distribution of the cost premium according to the main eight GSSA environmental impact categories. It shows that the Indoor Environmental Quality (IEQ) and Water categories had the highest impact on the incremental cost, which reflects the main green measures targeted by the design for that building. According to the rates used for modelling the cost of a conventional building (non-green) of the same gross floor area (a construction cost of ZAR 83,881,500.00 = US$ 6,361,020.11 was obtained, at the exchange rate of 1 US$ = 13.1868 ZAR on the 25th of August 2015), the development cost increase between the assumed conventional building and the green building was equal to 6.04% of the development cost of the green building, thus close to the previous finding.
To evaluate the cost savings expected by the green building, the quantitative assessment focused on the total operating costs, considering that green buildings are supposed to reduce water and energy consumption, but also to provide financial benefits due to improved management, reduced maintenance, reduced insurance and liability costs, in comparison to conventional buildings. The operating costs of the green building were derived from the actual data recorded during the first years of operation. The operating costs of a conventional building were estimated according to the rates provided for the local market from relevant literature, as explained in the methodology. The
annual operating cost savings due to the green implementation, as difference between the operating costs of the modelled conventional building and the green one, resulted equal to ZAR 1,396,885.83 (= US$ 105,930.61).
The NPV of operating cost reductions was evaluated over the assumed economic lifetime to preliminarily quantify the discounted cash flow and estimate the relating payback period. Fig. 2 shows the graph of the NPV over the 20-year lifetime at the assumed discount rate (9%). The graph shows that the discounted payback period would be 4.4 years (simple payback period: 3.5 years) which demonstrates the convenience and viability of the investment in green strategies for the analyzed project. The short payback period can be considered convenient also with reference to the values typically accepted according to the literature [24]. The IRR of the investment is 28.55%, which is higher than possible values for the discount rate, above the one assumed, which can be used to evaluate the quality of the investment from a more conservative perspective also of business firm initiatives to adjust for risk or other factors (e.g. 12-20% [26]).
V. CONCLUSIONS AND RECOMMENDATIONS
The South African green building market is growing but is not mature yet. The province of KwaZulu-Natal, despite being the second most populated province of the country, counts very few officially accredited green buildings. The lack of accurate and extensive information about the financial implications of investing in green building constitutes one of the main barriers to fostering the decision making towards green developments.
This paper provides a contribution towards strengthening the awareness of green building and relating financial implications in the context of KwaZulu-Natal and more generally South Africa. Semi-structured interviews with the main local property developers in KwaZulu-Natal provided a more in-depth understanding about their perception on green building and relevant costs and financial benefits. Even though the developers declared that decision making about
undertaking green building projects is still primarily affected by client’s specifications and not by the evaluation of their financial and environmental benefits, they have started to acknowledge the benefits in terms of reduced operating costs and advantages as medium to long term investment. They also highlighted that green buildings will become the norm in the near future and that developers who develop non-green buildings will risk being cut off from the competitive property market. The developers stressed the importance of showcasing the financial advantages of green building in the local context, currently lacking, to foster the growth of the local green building market.
The study then evaluated the financial implications of a case study of a four-star GSSA certified office building in the Durban area. The analysis revealed a limited cost premium to implement the green strategies adopted for achieving the green rating. The results also showed profitability of the investment in green building with short payback period to recovering the initial incremental cost and significant profits in the long term due to the reduced operating costs, making the green project viable and a better option than sticking to conventional buildings.
GSSA environmental impact categories GBC SA
asses. fee
TotalManage-ment IEQ Energy Transport Water Materials Land use
& Ecology Emissions
0.80% 1.70% 0.52% 0.24% 0.95% 0.10% 0.02% 0.36% 0.05% 4.74%
TABLE I. DISTRIBUTION OF THE COST PREMIUM FOR THE CASE STUDY FOR THE IMPLEMENTATION OF GREEN STRATEGIES AS PERCENTAGE OF
THE DEVELOPMENT COST
Figure 2. NPV (kUS$) over a 20-year lifetime (according to 9% discount rate)
World Congress on Sustainable Technologies (WCST-2015)
Copyright © 2015 Technical Co-Sponsored by IEEE UK/RI Computer Chapter 81

It is true that tariffs for water and electricity have traditionally been relatively inexpensive in South Africa compared to their impact on other countries, providing historically little incentive to save resource consumption. However, the dramatic tariff increase that is being currently experienced in South Africa makes the transition to green and more energy and water efficient buildings a necessary step for the future South African built environment, also from a developer perspective in order to be competitive and provide a final product oriented to minimize operating costs. This is particularly significant in the light of the continuous growth in the number of customer requiring electricity services and the current and future load shedding protocols to protect the electricity power system in the peak periods from a total blackout.
Recommendations for future studies include the application of similar cost benefit assessment methods to a large number of case studies in the local context, in order to reach general indicators for the market. Once the market reaches a certain degree of maturity, the evaluation and inclusion of further indirect financial benefits such as rental premium and increased property value, might support even more the decision making towards green building in the South African context.
ACKNOWLEDGMENT The authors would like to express sincere gratitude to the
Owner (Developers) of the green building for the precious support, to thank the Quantity Surveyor that worked on that project for his assistance and also the Property Developers that participated in the interviews.
REFERENCES [1] L. F. Mathiessen, and P. Morris, The Cost of Green Revisited.
Reexamining the Feasibility and Cost Impact of Sustainable Design in the Light of Increased Market Adoption. United States: Davis Langdon, 2007.
[2] Davis Langdon, The road to ‘green property’. Australia, 2010. [3] N. Milne, The Rands and sense of green building. Cape Town: Green
Building Council of South Africa, 2012, p. 117. [4] Green Building Council of South Africa, Certified Projects, 2015.
[Online] Available at: https://www.gbcsa.org.za/projects/certified-projects/ (Access Date: 15 July, 2015).
[5] H. A. Hikmat, and F. A. Saba, “Developing a green building assessment tool for developing countries”, Building and Environment, 44(5), 2008, pp. 1053-1064.
[6] D. E. Shier, “Green developments – Environmentally responsible buildings in the UK commercial property sector”, Property Management, 18(5), 2005, pp. 352-365.
[7] V. Potbhare, M. Syal, and S. Korkmaz, “Adoption of Green Building Guidelines in Developing Countries Based on U.S. and India Experiences”, Journal of Green Building, Vol. 4, No. 2, 2009, pp. 158-174.
[8] J. Yudelson, J., Marketing Green Building Services: Strategies FOR Success. Oxford: Elsevier, 2008, p. 69
[9] P. X. W.Zou, and P. Couani, “Managing risks in green building supply chain”, Architectural Engineering and Design Management, 8(2), 2012, pp. 143-158.
[10] Green Building Council of Australia, Green building market report 2006. Australia: GBCA, 2006, pp. 12 –43.
[11] T. Lűtzkendorf, and D. Lorenz, “Integrating sustainability into property risk assessments for market transformation”, Building Research & Information, 35(6), pp. 644-661 (p. 645).
[12] B. Edwards (Ed.), Green Buildings Pay. New York: Spon Press, 2003, p. 2. [13] G. H. Kats, Green Building Costs and Financial Benefits. Massachusetts:
Massachusetts Technology Collaborative, 2003.
[14] G. Myers, R. Reed, and J. Robinson, “Investor perception of the business case for sustainable office building: evidence from New Zealand”, in 14th Annual Pacific Rim Real Estate Society Conference 2008: Investing in Sustainable Real Estate Environment, Kuala Lumpur, Malaysia, 2008.
[15] Whole Building Deisgn Guide, “Cost-effective”, 2012. [Online] Available at: http://www.wbdg.org/design/cost_effective.php (Access Date: 15 July, 2015).
[16] D. A. Gottfried, Sustainable building technical manual: gren building design, construction and operation. US Green building Council.
[17] A. Nelewaik, and V. Venters, “Cost benefits of building green”, Cost Engineering, 51(2), 2009, p. 28.
[18] RICS (Royal Institution of Chartered Surveyors), “Sustainability and the Dynamics of Green Building New Evidence on the Financial Performance of Green Office Buildings in the USA‟, 2010.
[19] University of Western Sydney Australia and University of Maastricht Netherlands in conjunction with Jones Lang LaSalle and CBRE, “Building Better Returns – A Study of the Financial Performance of Green Office Buildings in Australia”, 2011.
[20] W. Fox, and M. S. Bayat, A guide to managing research, Cape Town: Juta and Co Ltd., 2007.
[21] J. W. Creswell, V. L. Plano Clark, M. L. Gutmann, and W. E. Hanson, “Advanced mixed methods research designs”, in A. Tashakkori, and C. Teddlie (Eds.), Handbook of mixed methods in social and behavioral research, Thousand Oaks, CA: Saget, 2003, pp. 209–240.
[22] M. Rehm, and R. Ade, “Construction costs comparison between ‘green’ and conventional office buildings”, Building Research & Information, 41 (2), 2013, pp. 198-208.
[23] R. F. Fellows, and A. M. M. Liu, Research methods for construction. 3rd ed., West Sussex: Wiley-Blackwell, 2008.
[24] Enterprise Green Communities, Davis Langdon, “Enterprise green communities criteria, Incremental cost, measurable savings Update”, 2012. [Online] Available at: http://www.enterprisecommunity.com/servlet/servlet. FileDownload?file=00P3000000DTXl6EAH (Access Date: 30 August, 2015).
[25] B. Mokheseng, “An investigation into life-cycle costing as comparative analysis approach of energy systems”, Proccedings of the Science real and relevant conference 2010, CSIR, 2010, ref. EN03-PO-F.
[26] National Action Plan for Energy Efficiency, “Understanding Cost-Effectiveness of Energy Efficiency Programs: Best Practices, Technical Methods, and Emerging Issues for Policy-Makers”, Energy and Environmental Economics, Inc. and Regulatory Assistance Project, 2008. [Online] Available at: www.epa.gov/eeactionplan (Access Date: 30 August, 2015).
[27] H. Winkler, R. Spalding-Fecher, L. Tyani, and K. Matibe, “Cost-benefit analysis of energy efficiency in urban low-cost housing”, Development Southern Africa, 19(5), 2002, pp. 593-614.
[28] P. H. van Niekerk, and J. A. du Plessis, “Unit Reference Value: Application in appraising inter-basin water transfer projects”, Water SA, 39(4), 2013, 549-554.
[29] J. Burger, and M. Swilling, “Life-cycle cost effectiveness comparison of current housing provision and sustainable living applications”, chapter 10 in Housing Cost Effectiveness Analysis (CEA) Report, 2009. [Online] Available at http://sustainabledevelopmentnetwork.com/manual1/ integrated%20sustainable%20settlements.pdf (Access Date: 30 August, 2015).
[30] Davis Langdon, Africa Region Property and Construction Handbook 2011. [31] Davis Langdon, Africa Region Property and Construction Handbook 2010. [32] Rode & Associates, Rode‟s Report on the South African Property Market
2010 [Online] Available at: http://www.rode.co.za/themes/theme277/demos/ Report/006_Office%20Rentals.pdf (Access Date: 30 August, 2015)
[33] World Green Building Council, The business case for green building: A review of the Costs and Benefits for Developers, Investors and Occupants, 2013, [Online] Available at: http://www.worldgbc.org/files/ 1513/6608/0674/Business_Case_For_Green_Building_Report_WEB_2013-04-11.pdf (Access Date: 30 August, 2015).
World Congress on Sustainable Technologies (WCST-2015)
Copyright © 2015 Technical Co-Sponsored by IEEE UK/RI Computer Chapter 82

Session 2: Internet Applications, Technology and Security
Optimal QoS Service Selection in Ad-Hoc Mobile Market Using Analytical Hierarchy Model (Authors: Ayotuyi T. Akinola, Matthew O. Adigun, Alaba O. Akingbesote)
Method for Anonymity of Authenticated Messages in SNS (Author: Ryuya Uda)
Interactive E-Book Design and Development to Support Literacy Learning for Language Minority Students (Authors: Muneeroh Phadung)
Performance Monitoring of Virtual Machines (VMs) of Type I & II hypervisors with SNMPv3 (Authors: Asif Iqbal, Colin Pattinson, Ah-Lian Kor)
World Congress on Sustainable Technologies (WCST-2015)
Copyright © 2015 Technical Co-Sponsored by IEEE UK/RI Computer Chapter 83
Optimal QoS Service Selection in Ad-Hoc Mobile Market Using Analytical Hierarchy Model
Ayotuyi T. Akinola, Matthew O. Adigun, Alaba O. Akingbesote Dept. of Computer Science, University of Zululand
KwaDlangezwa, South Africa. [email protected]
Abstract— The ad-hoc mobile market is the environment that allows the interconnectivity of mobile devices within community of users that are ready to communicate and share services between providers and consumers. Issues like service discovery and selection are major obstacle in ad-hoc mobile. With the growing of this market, researchers are concentrating on service discovery with little on selection. Provision of optimal service in ad-hoc mobile is a challenge and our goal. To address this, most scholars use various algorithms. For example, the dynamic programming or greedy algorithm, but the complexity of these algorithms especially when the number of consumers and providers in the market are many poses a challenge. To tackle this, we propose Analytic Hierarchy Model (AHM). This model uses the QoS criteria as required by consumers and then systematically process it to rank the services to obtain the optimal service. Experiment is conducted using reputation and location as our criteria. The optimal service is selected based on the required QoS of the consumer.
Keywords:—Ad-hoc mobile market, Analytic hierarchy model, Mobile Cloud Market, Optimal service, Normalization.
I. INTRODUCTION The present-day human society is witnessing a drastic
advancement in development such that human basic needs are brought to them in the form of easily accessible services. These services come in form of utility services, which are payable upon usage. One of such platforms that brings such services to the “doorstep” of consumers is the cloud computing infrastructure [1], [2]. The cloud computing paradigm is a model for enabling easy, on-demand network access to a shared pool of configurable computing resources (e.g. services, servers, storage, applications, and networks) that can speedily be provisioned and consumed with minimal service provider interaction [1]. This paradigm helps to reduce the capital cost of deploying it services through its underlying technology, providing pliability in terms of service provisioning.
Among the notable cloud services is the web service. This is a self-described application that runs on a network using standard Internet technologies to interact with others and across platforms [3]. Consumers from different places source to consume these services residing on the cloud platform using various devices. The dynamic nature of consumers has brought about notably devices. These include various portable mobile devices such as smartphones, tablet, PDAs and PCs etc. Because of the unbounded nature of these devices, it has now progressively becoming an integral part of human life being the most efficient and easiest means of communication
[1],[4]. One major breakthrough with the advancement in mobile technology is its integration with the cloud to mitigate for mobile resource poverty. This integration allows service consumers to shop for services in the cloud resulting into a Mobile-Cloud Market (MCM).
The Mobile Cloud Market (MCM) is an environment that allows mobile devices to communicate with the cloud infrastructure. The idea of the market structure is to move the computing power and data storage away from mobile devices. This gives the devices the opportunity to process and save large volumes of data. This is done by using the infrastructure based approach. This approach allows mobile cloud to reside its hardware at a stationary place where it extends service provisioning to connecting mobile devices [2].
While this approach is good, one main challenge is the intermittent disconnection that occur which sometimes hinders the interconnectivity to function well. This challenge brought about the Ad-hoc Mobile Market. This market allows the interconnectivity of mobile devices within community of users that are ready to communicate and share services between providers and consumers. One good thing about this ad-hoc mobile market is that, it allows providers to be consumers and vice versa. Because of the nature of this market, most organizations and SMMEs (small medium and macro enterprise) are adopting the technology. For example, The GUISET (Grid-Based Utility Infrastructure for SMMEs Enabling Technology) project whose aim initially was to provide infrastructure services to SMMEs in South Africa in the context of m-health, e-commerce and e-learning [5]–[9] is now adopting the Infrastructure less technology and now becomes GUIISET.
However, as various mobile devices of different kind aggregate to form a cloud community of service provider, discovering and selection of nodes for service provisioning are non-trivial task to overcome [10]. Many works exist on discovery of mobile services such as [11]–[14] with less concentration on mobile service selection. With the little work on ad-hoc service selection, the issue of optimal selection I a great challenge. To address this, most scholars use various algorithms. For example, the dynamic programming or greedy algorithm, but the complexity of these algorithms especially when the number of consumers and providers in the market are many poses a challenge. To tackle this, we propose Analytic Hierarchy Model (AHM). This model uses the QoS criteria as required by consumers and then systematically process it to rank the services to obtain the optimal service.
World Congress on Sustainable Technologies (WCST-2015)
Copyright © 2015 Technical Co-Sponsored by IEEE UK/RI Computer Chapter 84

This paper is organized as follow. Section II discusses the related work, section III presents our model formulation while section IV discusses the experiments with the results and section V is the Conclusion.
II. RELATED WORKS
Most works on service selection are in the context of web and cloud services. See [15]–[19]. For example in [15], they use the Ontology Web Language (OWL) to describe the three tier conceptual framework of a good web structure. The idea is to assist client to discover services and also allow the provider to register their services.
The work of [17] use the Multi-dimension Multi-choice Knapsack to handle service selection issues in the context of cloud computing. This approach selects the best fit service among the list of services using the stipulated criteria. Heuristic approach is proposed in [18],[19] to cater for the scalability issues of service selection in the field of cloud computing and mobile cloud computing. Others [20],[21], propose the use of Genetic algorithms to combat the daunting challenge of scalability issues in service selection. The algorithm allows parameters to be chosen randomly and then select the potential candidates. Service discovery related issues in ad-hoc mobile market are solved using other algorithms. See [11]–[14]. For example in [22], the author propose a Bee Ad-Hoc Service Discovery algorithm, the service discovery algorithm is based on the bee metaphor, which also takes into account quality metrics estimates. This is design to work in mobile ad hoc network scenarios operating with Bee Ad-Hoc Service Discovery, a well-known routing algorithm inspired by nature.
On the issue of ad-hoc mobile service selection, the work in [23] propose an optimal route service selection mechanism using dynamic programming approach. In these work, the authors use the Multi-Criteria Decision (MCD) for selection purpose and the Dynamic Programming to search for the optimal route when there are tie in services. The experiment is conducted using 15 sub-locations under the M-health scenario. The result obtained proves to have a better performance on time based on the shortest route.
The work of [24] uses the Multi-constrained optimal path selection method in selecting mobile node to provide better packets in ad-hoc mobile network. In this work, selection is subjected to multiple constraints is addressed through approximation and heuristic algorithms. Their observation reveal that when link weights are positively correlated, the path weights also become positively correlated thus enabling successful finding of feasible optimal path using linear approximation. The inverse is the case whren the link weights are negatively correlated. resulting in poor performance of the approximation algorithms. This work proffer a better performance in all cases of link weights when combining the approximation and heuristic algorithms.
The contributions of these authors give us the opportunity to make ours. For example, the idea of optimal service selection comes out from some the work of these authors. Also the idea of analytic hierarchy process comes in from [25]. However, our observations are based on the
shortcomings of some of these works which enable us to make our contribution. For example, the idea of using mark up and ontology as proposed by [15], [16] may not produce optimal service in the context of similar services with the same functionalities. Also, the proposed work of [17] takes reasonable amount of computational effort on the part of devices due to the node scalability issue. The shortcoming of the proposed algorithms in [18], [19] is the exclusion of solutions based on assumptions which invariably lead to sub optimal. In addition, the Genetic algorithm proposed by [20],[21] depend on the choice of the operators within the algorithm and this has a great influence on the correctness and effectiveness of the proposed algorithm.
Apart from these observations, most of these works are done in the context of web and cloud service selection in which sometimes the dynamic and connectionless properties make the ad-hoc to be different from cloud computing. Other works related to service selection in ad-hoc mobile are based on performance related issues. For example [26], [27]. Even, those that discus on service selections in ad-hoc mobile [23] sometimes fail to fully consider the dynamic nature of the ad-hoc mobile where the number of nodes increase and decrease thereby leading to the complexity of such algorithms. Our work is closely related to [25]. However, two things differentiate ours from these authors:
• Our work is applied in the context of ad-hoc cloudmobile market with reputation and location as ourmetrics.
• We propose a weighted sum for our ranking asagainst the fuzzy logic proposed in [25].
III. FORMULATION OF MODEL
One assumption in this research is that, decision making is based on the already know preference. We consider an ad-hoc mobile market as shown in Fig. 1, where a service consumer (Sk) is requesting for a service among the S1 to S3 services using location and reputation as the two criteria. Two things are important when looking for optimal solution under the AHM. These are:
• Knowing the number of hierarchy involved and therelative importance of this to each other. Forexample in Fig. 1, the hierarchy is 2 and the relateimportance may take any of the following:a. When the location is extremely more important
than reputation.b. When the location is strongly more important
than reputation.c. When they have equal of importance to
reputation.• The number of alternative services and also the
relative importance to each order.
Knowing these, then we determine by
World Congress on Sustainable Technologies (WCST-2015)
Copyright © 2015 Technical Co-Sponsored by IEEE UK/RI Computer Chapter 85

• Establishing a pairwise n*n comparison matrix(where n is the number of criteria). This is such thatthe criterion in row i where I = 1,2,….n is rankedrelative to any other criterion.
• Apply a numerical scale from 1-9. For example inFig.1, we apply
𝑎𝑎𝑖𝑖𝑖𝑖 = 9 when condition a holds 𝑎𝑎𝑖𝑖𝑖𝑖 = 5 when condition b holds 𝑎𝑎𝑖𝑖𝑖𝑖 = 1 when condition c holds
• Making a consistence judgment by studying when𝑎𝑎𝑖𝑖𝑖𝑖 = k, then make 𝑎𝑎𝑖𝑖𝑖𝑖 = 1
𝐾𝐾 . In addition all the
diagonal element of the pairwise matrix is equal to 1.
• Normalize the pairwise matrix to form anothermatrix say B using equation 1 or 2 below
𝐵𝐵𝑘𝑘 = 𝑄𝑄𝑗𝑗𝑚𝑚𝑚𝑚𝑚𝑚−𝑄𝑄𝑖𝑖,𝑗𝑗
𝑄𝑄𝑗𝑗𝑚𝑚𝑚𝑚𝑚𝑚−𝑄𝑄𝑗𝑗
𝑚𝑚𝑖𝑖𝑚𝑚
1 𝑖𝑖𝑖𝑖 𝑄𝑄𝑗𝑗
𝑚𝑚𝑚𝑚𝑚𝑚−𝑄𝑄𝑗𝑗𝑚𝑚𝑖𝑖𝑚𝑚≠0
𝑖𝑖𝑖𝑖𝑄𝑄𝑗𝑗𝑚𝑚𝑚𝑚𝑚𝑚−𝑄𝑄𝑗𝑗
𝑚𝑚𝑖𝑖𝑚𝑚=0 (1)
𝐵𝐵𝑘𝑘 = 𝑄𝑄𝑖𝑖,𝑗𝑗−𝑄𝑄𝑗𝑗
𝑚𝑚𝑖𝑖𝑚𝑚
𝑄𝑄𝑗𝑗𝑚𝑚𝑚𝑚𝑚𝑚−𝑄𝑄𝑗𝑗
𝑚𝑚𝑖𝑖𝑚𝑚
1 𝑖𝑖𝑖𝑖 𝑄𝑄𝑗𝑗
𝑚𝑚𝑚𝑚𝑚𝑚−𝑄𝑄𝑗𝑗𝑚𝑚𝑖𝑖𝑚𝑚≠0
𝑖𝑖𝑖𝑖𝑄𝑄𝑗𝑗𝑚𝑚𝑚𝑚𝑚𝑚−𝑄𝑄𝑗𝑗
𝑚𝑚𝑖𝑖𝑚𝑚=0 (2)
Where 𝑄𝑄𝑖𝑖𝑚𝑚𝑚𝑚𝑚𝑚 = 𝑚𝑚𝑎𝑎𝑚𝑚𝑄𝑄𝑖𝑖,𝑖𝑖, 1≤ 𝑖𝑖 ≤ 𝑛𝑛
and
𝑄𝑄𝑖𝑖𝑚𝑚𝑖𝑖𝑚𝑚 = 𝑚𝑚𝑖𝑖𝑛𝑛𝑄𝑄𝑖𝑖,𝑖𝑖, 1 ≤ 𝑖𝑖 ≤ 𝑛𝑛
and n is the number of services
Figure. 1. Ad hoc mobile market.
and n is the number of services
From this we have our the normalize matrix as
𝐵𝐵 = 𝐵𝐵𝑖𝑖,𝑖𝑖 ; 1 ≤ 𝑖𝑖 ≤ 𝑛𝑛, 1 ≤ 𝑗𝑗 ≤ 𝑚𝑚;
• We then determine the row average as
𝑊𝑊𝑘𝑘 = ∑ 𝐵𝐵𝑖𝑖𝑖𝑖𝑚𝑚𝑖𝑖=1 /∑ 𝐵𝐵𝑖𝑖
𝑚𝑚𝑖𝑖=1 (3)
where n and m represent the upper limit of the matrix row and column. k represents the criteria or the alternative (k=1,2….l).
Therefore, if the hierarchy is 1 and the criteria is 2 (Location and Reputation) as shown in Fig. 1, then 𝑊𝑊𝑘𝑘 becomes 𝑊𝑊𝐿𝐿 which is the weight assign to Location while 𝑊𝑊𝑅𝑅 is the weight for reputation. Also if the alternative services are say three (𝑊𝑊𝑠𝑠1,𝑊𝑊𝑠𝑠2 and 𝑊𝑊𝑠𝑠3 ) as shown in Fig. 1, then 𝑊𝑊𝑘𝑘 becomes 𝑊𝑊𝐿𝐿𝑠𝑠1 which is the location weight assign to service 1 while 𝑊𝑊𝐿𝐿𝑠𝑠2 represent the location weight assign to service 2 and 𝑊𝑊𝐿𝐿𝑠𝑠3 for that of service location three. Also 𝑊𝑊𝑘𝑘 becomes 𝑊𝑊𝑅𝑅𝑠𝑠1 which is the reputation weight assign to service 1 while 𝑊𝑊𝑅𝑅𝑠𝑠2 represent the reputation weight assign to service 2 and 𝑊𝑊𝑅𝑅𝑠𝑠3 for that of service reputation three. Therefore the ranking is done using the formulae:
𝑅𝑅𝑠𝑠𝑖𝑖 = 𝑊𝑊𝐿𝐿(𝑖𝑖) ∗ 𝑊𝑊𝐿𝐿𝑠𝑠1(𝑖𝑖) + 𝑊𝑊𝑅𝑅(𝑖𝑖) ∗ 𝑊𝑊𝑅𝑅𝑠𝑠1(𝑖𝑖) (4)
Where i = 1, 2, …. m. The 𝑅𝑅𝑠𝑠𝑖𝑖 that has the highest score is then the optimal service. Our algorithms are as shown in Fig. 2 and Fig. 3.
Set parameters (p, rt, r) Input
No of hierarchy:
Level of hRel_imp
𝐴𝐴 = (𝐴𝐴; 1 ≤ 𝑖𝑖 ≤ 𝑛𝑛, 1 ≤ 𝑗𝑗 ≤ 𝑚𝑚; )
Call normalization
Set weights (𝑊𝑊𝑘𝑘) = ∑ 𝐵𝐵𝑖𝑖𝑖𝑖𝑚𝑚𝑖𝑖=1 /∑ 𝐵𝐵𝑖𝑖𝑚𝑚
𝑖𝑖=1
Input No of alternatives
Input Level of Rel_imp
Call normalization
Set weights (𝑊𝑊𝑘𝑘) = ∑ 𝐵𝐵𝑖𝑖𝑖𝑖𝑚𝑚𝑖𝑖=1 /∑ 𝐵𝐵𝑖𝑖𝑚𝑚
𝑖𝑖=1
𝑅𝑅𝑠𝑠𝑖𝑖 = 𝑊𝑊𝐿𝐿(𝑖𝑖) ∗ 𝑊𝑊𝑠𝑠𝐿𝐿1(𝑖𝑖) + 𝑊𝑊𝑅𝑅(𝑖𝑖) ∗ 𝑊𝑊𝑠𝑠𝑅𝑅1(𝑖𝑖) End
Figure. 2. Analytic Hierarchy Model Algorithm.
World Congress on Sustainable Technologies (WCST-2015)
Copyright © 2015 Technical Co-Sponsored by IEEE UK/RI Computer Chapter 86

𝑃𝑃 = 𝑃𝑃𝑖𝑖𝑖𝑖 ; 1 ≤ 𝐼𝐼 ≤ 𝑛𝑛 ; 1 ≤ 𝑗𝑗 ≤ 𝑚𝑚; 𝑓𝑓𝑓𝑓𝑓𝑓 (𝑖𝑖 = 0; 𝑖𝑖 < 𝑚𝑚; 𝑖𝑖 + +) 𝑑𝑑𝑓𝑓
𝑓𝑓𝑓𝑓𝑓𝑓 (𝑗𝑗 = 0; 𝑗𝑗 < 𝑛𝑛; 𝑗𝑗 + +) 𝑑𝑑𝑓𝑓 𝑖𝑖𝑓𝑓(𝑞𝑞𝑓𝑓[j]𝑒𝑒𝑞𝑞 0)
𝑖𝑖𝑓𝑓 (𝑑𝑑𝑖𝑖𝑓𝑓𝑓𝑓𝑞𝑞𝑓𝑓𝑑𝑑[j]! = 0) v[i][j] ← (𝑞𝑞𝑚𝑚𝑎𝑎𝑚𝑚[j] − 𝑝𝑝[i][j])/ iffqos[j];
else v[i][j] ← 1;
end else if(𝑞𝑞𝑓𝑓[j] 𝑒𝑒𝑞𝑞 1)
if (𝑑𝑑𝑖𝑖𝑓𝑓𝑓𝑓𝑞𝑞𝑓𝑓𝑑𝑑[j]! = 0) v[i][j] ← (𝑝𝑝[i][j] − 𝑞𝑞𝑚𝑚𝑖𝑖𝑛𝑛[j])/ iffqos[j];
else v[i][j] ← 1
endif endif
𝑽𝑽 = 𝑽𝑽𝒊𝒊,𝒋𝒋;𝟏𝟏 ≤ 𝒊𝒊 ≤ 𝒏𝒏,𝟏𝟏 ≤ 𝒋𝒋 ≤ 𝒎𝒎;
Figure. 3. Weight Normalization Algorithm.
IV. RESULTS AND DISCUSSION
We use the Java Netbean IDE with jdk 7 version to run the experiment and use mobile emulators as our nodes which request for services. We use only one hierarchical structure with three service alternative as shown in Fig.1. Our two criteria are service location and reputation. The three alternative services are assumed to be m-health services (S1-S3) of the same functionality. Our relative of importance of the criteria is based on the fact that location is strongly more important than reputation from the user preference. Therefore a value of 6 is used. The relative importance of the alternative is shown in Table 3. The results are shown in Table 4 to Table 6 respectively. The first Table shows the comparison matrix formed because the location is six times stronger than reputation. Going by our algorithm, this matrix is then normalized and the result is shown in Table 2. The respective location and reputation weights are determined in Table 3 based on the equation 3. Table 3 presents the comparison matrix of the alternative services available and the normalization is obtained in Table 4. The row averages are calculated by using Table 2 and Table 4 respectively. This is shown in Table. 5 and the ranking are done using equation 4 as shown in Table 6 and Fig.4. The optimal service based on this experiment is service S1 with the highest ranking score of 0.5843802.
TABLE I. COMPARISON CRITERIA MATRIX
𝐴𝐴 = 𝐿𝐿𝑅𝑅
𝐿𝐿 𝑅𝑅1 1 6⁄6 1
TABLE II. NORMALIZED MATRIX BASED ON THE CRITERIA
𝑊𝑊𝐴𝐴 = 𝐿𝐿𝑅𝑅
𝐿𝐿 𝑅𝑅0.142857 0.1428570.857143 0.857143
TABLE III. COMPARISON ALTERNATIVE SERVICE MATRIX
𝐵𝐵𝐿𝐿 =𝑆𝑆𝐿𝐿1𝑆𝑆𝐿𝐿2𝑆𝑆𝐿𝐿3
𝑆𝑆𝐿𝐿1 𝑆𝑆𝐿𝐿2 𝑆𝑆𝐿𝐿3
1 1 3⁄ 1 6⁄3 1 1 4⁄6 4 1
𝐵𝐵𝑅𝑅 =
𝑆𝑆𝐿𝐿1𝑆𝑆𝐿𝐿2𝑆𝑆𝐿𝐿3
𝑆𝑆𝐿𝐿1 𝑆𝑆𝐿𝐿2 𝑆𝑆𝐿𝐿3
1 3 6
1 3⁄ 1 4 3⁄1 6⁄ 3 4⁄ 1
TABLE IV. NORMALIZED ALTERNATIVE SERVICE MATRIX
𝑊𝑊𝐿𝐿 =𝑆𝑆𝐿𝐿1𝑆𝑆𝐿𝐿2𝑆𝑆𝐿𝐿3
𝑆𝑆𝐿𝐿1 𝑆𝑆𝐿𝐿2 𝑆𝑆𝐿𝐿3
0.1 0.0625 0.1176470.3 0.1875 0.1764710.6 0.75 0.705882
𝑊𝑊𝑅𝑅 =𝑆𝑆𝑅𝑅1𝑆𝑆𝑅𝑅2𝑆𝑆𝑅𝑅3
𝑆𝑆𝑅𝑅1 𝑆𝑆𝑅𝑅2 𝑆𝑆𝑅𝑅3
0.666667 0.631579 0.720.222222 0.210526 0.160.111111 0.157895 0.12
TABLE V. ROW AVERAGES BASED ON CRITERIA AND ALTERNATIVE
𝑅𝑅𝑓𝑓𝑅𝑅 𝑎𝑎𝑎𝑎𝑒𝑒𝑓𝑓𝑎𝑎𝑎𝑎𝑒𝑒𝑑𝑑 𝑓𝑓𝑓𝑓𝑓𝑓 𝑊𝑊𝐴𝐴
= 𝑊𝑊𝐴𝐴𝐿𝐿 = (0.142857 + 0.142857)/2 = 0.142857𝑊𝑊𝐴𝐴𝑅𝑅 = (0.857143 + 0.857143)/3 = 0.857143
𝑅𝑅𝑓𝑓𝑅𝑅 𝑎𝑎𝑎𝑎𝑒𝑒𝑓𝑓𝑎𝑎𝑎𝑎𝑒𝑒𝑑𝑑 𝑓𝑓𝑓𝑓𝑓𝑓 𝑊𝑊𝐿𝐿
= 𝑊𝑊𝐿𝐿𝐿𝐿1 = (0.1 + 0.0625 + 0.117647)/3 = 0.054167𝑊𝑊𝐿𝐿𝐿𝐿2 = (0.3 + 0.1875 + 0.176471)/3 = 0.1625𝑊𝑊𝐿𝐿𝐿𝐿3 = (0.6 + 0.75 + 0.705882)/3 = 0.45
𝑅𝑅𝑓𝑓𝑅𝑅 𝑎𝑎𝑎𝑎𝑒𝑒𝑓𝑓𝑎𝑎𝑎𝑎𝑒𝑒𝑑𝑑 𝑓𝑓𝑓𝑓𝑓𝑓 𝑊𝑊𝑅𝑅
= 𝑊𝑊𝑅𝑅𝐿𝐿1=(0.666667 + 0.631579 + 0.72)/3 = 0.672749𝑊𝑊𝑅𝑅𝐿𝐿2= (0.222222 + 0.210526 + 0.16)/3 = 0.197583𝑊𝑊𝑅𝑅𝐿𝐿3 = (0.111111 + 0.157895 + 0.12)/3 = 0.129669
TABLE VI. RANKING BASED ON CRITERIA AND ALTERNATIVE SERVICE
𝑅𝑅𝑠𝑠1 = 𝑊𝑊𝐿𝐿(𝑖𝑖) ∗ 𝑊𝑊𝐿𝐿𝑠𝑠1(𝑖𝑖) + 𝑊𝑊𝑅𝑅(𝑖𝑖) ∗ 𝑊𝑊𝑅𝑅𝑠𝑠1(𝑖𝑖) 0.142857*0.054167 + 0.857143*0.672749 =0.5843802
𝑅𝑅𝑠𝑠2 = 𝑊𝑊𝐿𝐿(𝑖𝑖) ∗ 𝑊𝑊𝐿𝐿𝑠𝑠1(𝑖𝑖) + 𝑊𝑊𝑅𝑅(𝑖𝑖) ∗ 𝑊𝑊𝑅𝑅𝑠𝑠1(𝑖𝑖) 0.142857*0.1625 + 0.857143*0.197583 = 0.192571
𝑅𝑅𝑠𝑠3 = 𝑊𝑊𝐿𝐿(𝑖𝑖) ∗ 𝑊𝑊𝐿𝐿𝑠𝑠1(𝑖𝑖) + 𝑊𝑊𝑅𝑅(𝑖𝑖) ∗ 𝑊𝑊𝑅𝑅𝑠𝑠1(𝑖𝑖) 0.142857*0.45 + 0.857143*0.129669 = 0.175431
V. CONCLUSION With the drift of consumers to the ad-hoc mobile market
shopping for services, one main challenge is the selection of optimal service. To tackle this, this research applies the analytic hierarchy model as our solution approach. We formulate the problem, develop the algorithm and run the experiment. Our optimal result is achieved with the service
World Congress on Sustainable Technologies (WCST-2015)
Copyright © 2015 Technical Co-Sponsored by IEEE UK/RI Computer Chapter 87
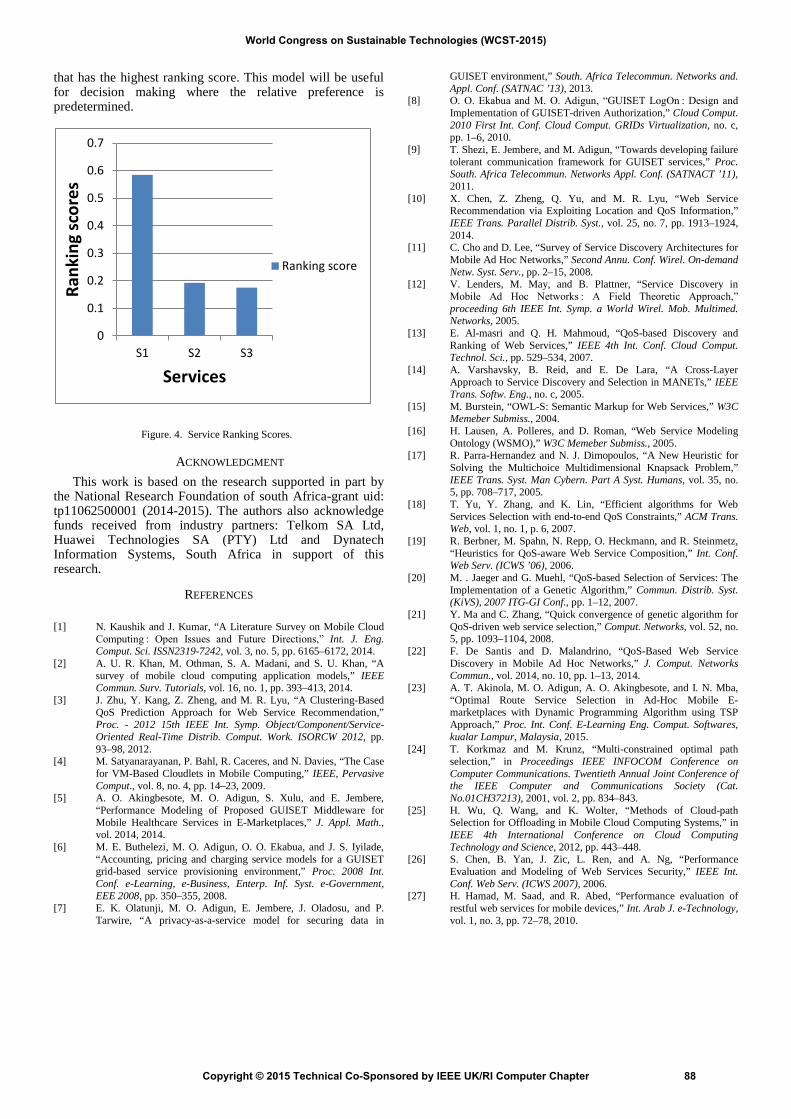
that has the highest ranking score. This model will be useful for decision making where the relative preference is predetermined.
Figure. 4. Service Ranking Scores.
ACKNOWLEDGMENT This work is based on the research supported in part by
the National Research Foundation of south Africa-grant uid: tp11062500001 (2014-2015). The authors also acknowledge funds received from industry partners: Telkom SA Ltd, Huawei Technologies SA (PTY) Ltd and Dynatech Information Systems, South Africa in support of this research.
REFERENCES
[1] N. Kaushik and J. Kumar, “A Literature Survey on Mobile Cloud Computing : Open Issues and Future Directions,” Int. J. Eng. Comput. Sci. ISSN2319-7242, vol. 3, no. 5, pp. 6165–6172, 2014.
[2] A. U. R. Khan, M. Othman, S. A. Madani, and S. U. Khan, “A survey of mobile cloud computing application models,” IEEE Commun. Surv. Tutorials, vol. 16, no. 1, pp. 393–413, 2014.
[3] J. Zhu, Y. Kang, Z. Zheng, and M. R. Lyu, “A Clustering-Based QoS Prediction Approach for Web Service Recommendation,” Proc. - 2012 15th IEEE Int. Symp. Object/Component/Service-Oriented Real-Time Distrib. Comput. Work. ISORCW 2012, pp. 93–98, 2012.
[4] M. Satyanarayanan, P. Bahl, R. Caceres, and N. Davies, “The Case for VM-Based Cloudlets in Mobile Computing,” IEEE, Pervasive Comput., vol. 8, no. 4, pp. 14–23, 2009.
[5] A. O. Akingbesote, M. O. Adigun, S. Xulu, and E. Jembere, “Performance Modeling of Proposed GUISET Middleware for Mobile Healthcare Services in E-Marketplaces,” J. Appl. Math., vol. 2014, 2014.
[6] M. E. Buthelezi, M. O. Adigun, O. O. Ekabua, and J. S. Iyilade, “Accounting, pricing and charging service models for a GUISET grid-based service provisioning environment,” Proc. 2008 Int. Conf. e-Learning, e-Business, Enterp. Inf. Syst. e-Government, EEE 2008, pp. 350–355, 2008.
[7] E. K. Olatunji, M. O. Adigun, E. Jembere, J. Oladosu, and P. Tarwire, “A privacy-as-a-service model for securing data in
GUISET environment,” South. Africa Telecommun. Networks and. Appl. Conf. (SATNAC ’13), 2013.
[8] O. O. Ekabua and M. O. Adigun, “GUISET LogOn : Design and Implementation of GUISET-driven Authorization,” Cloud Comput. 2010 First Int. Conf. Cloud Comput. GRIDs Virtualization, no. c, pp. 1–6, 2010.
[9] T. Shezi, E. Jembere, and M. Adigun, “Towards developing failure tolerant communication framework for GUISET services,” Proc. South. Africa Telecommun. Networks Appl. Conf. (SATNACT ’11), 2011.
[10] X. Chen, Z. Zheng, Q. Yu, and M. R. Lyu, “Web Service Recommendation via Exploiting Location and QoS Information,” IEEE Trans. Parallel Distrib. Syst., vol. 25, no. 7, pp. 1913–1924, 2014.
[11] C. Cho and D. Lee, “Survey of Service Discovery Architectures for Mobile Ad Hoc Networks,” Second Annu. Conf. Wirel. On-demand Netw. Syst. Serv., pp. 2–15, 2008.
[12] V. Lenders, M. May, and B. Plattner, “Service Discovery in Mobile Ad Hoc Networks : A Field Theoretic Approach,” proceeding 6th IEEE Int. Symp. a World Wirel. Mob. Multimed. Networks, 2005.
[13] E. Al-masri and Q. H. Mahmoud, “QoS-based Discovery and Ranking of Web Services,” IEEE 4th Int. Conf. Cloud Comput. Technol. Sci., pp. 529–534, 2007.
[14] A. Varshavsky, B. Reid, and E. De Lara, “A Cross-Layer Approach to Service Discovery and Selection in MANETs,” IEEE Trans. Softw. Eng., no. c, 2005.
[15] M. Burstein, “OWL-S: Semantic Markup for Web Services,” W3C Memeber Submiss., 2004.
[16] H. Lausen, A. Polleres, and D. Roman, “Web Service Modeling Ontology (WSMO),” W3C Memeber Submiss., 2005.
[17] R. Parra-Hernandez and N. J. Dimopoulos, “A New Heuristic for Solving the Multichoice Multidimensional Knapsack Problem,” IEEE Trans. Syst. Man Cybern. Part A Syst. Humans, vol. 35, no. 5, pp. 708–717, 2005.
[18] T. Yu, Y. Zhang, and K. Lin, “Efficient algorithms for Web Services Selection with end-to-end QoS Constraints,” ACM Trans. Web, vol. 1, no. 1, p. 6, 2007.
[19] R. Berbner, M. Spahn, N. Repp, O. Heckmann, and R. Steinmetz, “Heuristics for QoS-aware Web Service Composition,” Int. Conf. Web Serv. (ICWS ’06), 2006.
[20] M. . Jaeger and G. Muehl, “QoS-based Selection of Services: The Implementation of a Genetic Algorithm,” Commun. Distrib. Syst. (KiVS), 2007 ITG-GI Conf., pp. 1–12, 2007.
[21] Y. Ma and C. Zhang, “Quick convergence of genetic algorithm for QoS-driven web service selection,” Comput. Networks, vol. 52, no. 5, pp. 1093–1104, 2008.
[22] F. De Santis and D. Malandrino, “QoS-Based Web Service Discovery in Mobile Ad Hoc Networks,” J. Comput. Networks Commun., vol. 2014, no. 10, pp. 1–13, 2014.
[23] A. T. Akinola, M. O. Adigun, A. O. Akingbesote, and I. N. Mba, “Optimal Route Service Selection in Ad-Hoc Mobile E-marketplaces with Dynamic Programming Algorithm using TSP Approach,” Proc. Int. Conf. E-Learning Eng. Comput. Softwares, kualar Lampur, Malaysia, 2015.
[24] T. Korkmaz and M. Krunz, “Multi-constrained optimal path selection,” in Proceedings IEEE INFOCOM Conference on Computer Communications. Twentieth Annual Joint Conference of the IEEE Computer and Communications Society (Cat. No.01CH37213), 2001, vol. 2, pp. 834–843.
[25] H. Wu, Q. Wang, and K. Wolter, “Methods of Cloud-path Selection for Offloading in Mobile Cloud Computing Systems,” in IEEE 4th International Conference on Cloud Computing Technology and Science, 2012, pp. 443–448.
[26] S. Chen, B. Yan, J. Zic, L. Ren, and A. Ng, “Performance Evaluation and Modeling of Web Services Security,” IEEE Int. Conf. Web Serv. (ICWS 2007), 2006.
[27] H. Hamad, M. Saad, and R. Abed, “Performance evaluation of restful web services for mobile devices ,” Int. Arab J. e-Technology, vol. 1, no. 3, pp. 72–78, 2010.
0
0.1
0.2
0.3
0.4
0.5
0.6
0.7
S1 S2 S3
Rank
ing
scor
es
Services
Ranking score
World Congress on Sustainable Technologies (WCST-2015)
Copyright © 2015 Technical Co-Sponsored by IEEE UK/RI Computer Chapter 88

Method for Anonymity of Authenticated Messages in SNS
Ryuya Uda School of Computer Science
Tokyo University of Technology Hachioji, Tokyo, Japan
Abstract—Anonymity in SNS is one of the important things for protecting privacy. We proposed a method in which nouns are replaced with other nouns in consideration of semantic relations. For example, some nouns in the sentence "I go to Tokyo University of Technology with Alice" are replaced such as "I go to university with her". The method prevents the author from leaking privacy of his/her friends to the third party. Levels of obscurity are decided by the relationship between the author and readers. When the relationship is weaker than that in the example above, the message changes such as "I go to school with a friend". In the method, proper nouns and some specific nouns are automatically replaced with other appropriate nouns by hi-speed filtering with Bloom filter. We also proposed an additional method in which messages are authenticated. In the method messages are signed with sanitizable signature since some nouns have possibility to be replaced. The combination of the two proposals provides anonymity and integrity and authentication at the same time. However, I found the latter method has vulnerability. If attackers have knowledge of privacy of victims, original nouns can be specified with one hundred percent correctness. Therefore, in this paper, I propose an improve method for anonymity. The method provides perfect obscurity with anonymity although messages are authenticated.
Information Security; Privacy Protection; Digital Forensics
I. INTRODUCTION People often depend on SNS (Social Networking Service)
in recent years. On the other hand, privacy is sometimes leaked from SNS. Most of people in SNS do not care their privacy although they think anonymity on Internet is quite important.
There are some researches in which privacy protection is mentioned [1][2][3]. Especially, privacy protection becomes more important since big data are managed in the system with cloud computing. There are two researches in which privacy leakage by others is mentioned. That is, privacy is sometimes leaked by friends in SNS. In existing SNS, no one can stop the leakage of his/her privacy before a message by someone else is opened to public. In those two papers, methods for preventing the leakage are proposed and evaluated the influence to the performance of existing SNS. However, the methods are not enough considered in terms perfect privacy protection. Therefore, in this paper, I point out the problem of the methods after explanation of them. Moreover, I propose an improved method for the perfect privacy protection. When the method is
applied to SNS, submitted messages can work as digital forensics.
In chapter 2, related works and problems are introduced. In chapter 3, details of the problems and proposed method are described. In chapter 4, consideration in terms of security is mentioned. Finally, in chapter 5, the paper is summarized.
II. RERATED WORKS
In this chapter, two related works are introduced.
A. Mutual Anonymity Model in SNS The necessity of mutual anonymity in SNS is indicated by
Utsunomiya et al [4]. The authors in this paper are in my team. Prudent people always care their privacy when they write something in SNS. Moreover, they can confirm their messages before submission by filters which match words in the messages with words which contains their privacy. However, an important thing which is pointed out by Utsunomiya et al. is that someone's privacy is usually leaked by others.
For example, when Alice has a friend named Bob who is an open person, her privacy may be leaked by Bob. In SNS, if he says that Alice goes to Tokyo University of Technology in Hachioji, everyone knows the fact. If he says the fact indirectly, the result is the same. For example, when everyone knows that Bob goes to Tokyo University of Technology in Hachioji, and when he says that I go to the university with Alice everyday, everyone knows that Alice goes to Tokyo University of Technology in Hachioji.
Therefore, Utsunomiya et al. think that names of friends of a user and proper nouns which are related with the names should be hidden in messages in SNS. However, it is inconvenient for users if those words are simply sanitized like that "**** goes to **** in ****". In order to solve the problem, Utsunomiya et al. proposed a method in which specific words are replaced with corresponding obscure words. Examples are shown as follows.
(1) Alice goes to Tokyo University of Technology in Hachioji.
(2) She goes to university in Tokyo.
(3) A friend goes to school in Japan.
World Congress on Sustainable Technologies (WCST-2015)
Copyright © 2015 Technical Co-Sponsored by IEEE UK/RI Computer Chapter 89

The sentence (1) is the original sentence which is submitted by Bob. The sentence changes to the sentence (2) when it is opened to Bob's friends. A name of Bob's friend "Alice" changes to "She", a proper noun "Tokyo University of Technology" which is related with Alice changes to "university", and a proper noun "Hachioji" which is related with the name of the university changes to "Tokyo" since Hachioji is a city in Tokyo Prefecture.
Changing rules of words are shown in Table 1.
TABLE I. CHANGING RULES OF WORDS IN A METHOD BY UTSUNOMIYA ET AL.
AliceOriginal Tokyo University of Technology Hachioji
sheFriends university Tokyo
a friendOthers school Japan
AliceOriginal Tokyo University of Technology Hachioji
sheFriends university Tokyo
a friendOthers school Japan
As shown in Table 1, some words change according to the rules. The original words are shown in the first line of the table. The words change to those in the second line when the sentence is opened to Bob's friends in SNS. The words also change to those in the third line when the sentence is opened to other people. Names of friends appear in the list of Bob's friend as shown in Table 2.
TABLE II. LIST OF FRIENDS
Alice
Charley
John Smith
Mickelson
Alice
Charley
John Smith
Mickelson
The names appear on the list when Bob's friends wanted to protect their privacy from leaking in SNS. If a friend does not care of the leakage, the name does not have to appear on the list. On the other hand, a friend can list plural names on the list such as "John", "Smith", "Jonny" and "John Smith". When one of the names appears on a sentence which will submit by Bob, the privacy filter by Utsunomiya et al. works. That is, when Bob submit "J. Smith" or "John F. Smith", it does not work.
When the filter works, the name and words which are related with the name are filtered. The related words are listed as shown in Table 3.
TABLE III. LIST OF RELATED WORDS OF EACH NAME
Name Alice
Sex Female
Related WordsTokyo University of Technology
HachiojiKatakuramachi
Name Alice
Sex Female
Related WordsTokyo University of Technology
HachiojiKatakuramachi
When proper nouns on the list appear in the sentence with a listed name, the nouns are replaced with other proper nouns. When the noun is not a name of the place, replaced words must be inputted by a user who wants to protect his/her privacy. In Table 3, "Tokyo University of Technology" is not a name the place. Therefore, Alice must input "university" and "school" to
Bob's table. Proper nouns of a name of the place can be replaced automatically as shown in Table 4.
TABLE IV. LIST OF THE NAME OF A PLACE
Hachioji
Tokyo
Japan
City
Province
Country
KatakuramachiTown
Street
Hachioji
Tokyo
Japan
City
Province
Country
KatakuramachiTown
Street
Even if Bob has two friends whose names are Alice, the filter works correctly. In this case, both Alice input related words like Table 3 but there are two tables. When the word "Alice" hits in the sentence, related words on the tables of both Alice are replaced with appropriate words one by one.
Utsunomiya et al. implemented their method with double stage Bloom filter considering with filtering performance. They put a stress on the speed of filtering since owners of SNS servers put cost before security.
B. Sanitizable Signature for Mutual Anonymity Model Kochi et al. proposed a signature method for the mutual
anonymity model in the previous section [5]. The authors in this paper are in my team. Usual methods with public-key signature cannot be applied to the model since some words in a sentence change when the sentence is opened. Therefore, Kochi et al. applied the sanitizable signature method to the model. Sanitizable signature first appears in the paper by Miyazaki et al [6]. They mentioned the problem of public-key signature when some parts of a document are hidden. Moreover, they proposed a new signature method which became famous as sanitizable signature later. Unfortunately, their paper was written in Japanese but the signature method was improved by Izu et al. and published with the name PIATS [7].
In the mutual anonymity model in the previous section, there is no sanitized part. However, the sanitizable signature can be applied if replaced words are held with hash digests of sanitized parts. Moreover, in the mutual anonymity model, words are replaced plural times according to the level of relationship between the author and readers. However, the sanitizable signature can also be applied since a sequential signature method with sanitizable signatures is proposed in PIATS by Izu et al.
In the method by Kochi et al., a sentence in SNS is parted into words and some words are replaced as shown in Figure 1.
Alice goes to Tokyo University of Technology in Hachioji .M0
W0,1 W0,2 W0,3 W0,4 W0,5 W0,6 W0,7
She goes to university in Tokyo .M1
W1,1 W0,2 W0,3 W1,4 W0,5 W1,6 W0,7
A friend goes to school in Japan .M2
W2,1 W0,2 W0,3 W2,4 W0,5 W2,6 W0,7
Alice goes to Tokyo University of Technology in Hachioji .M0
W0,1 W0,2 W0,3 W0,4 W0,5 W0,6 W0,7
She goes to university in Tokyo .M1
W1,1 W0,2 W0,3 W1,4 W0,5 W1,6 W0,7
A friend goes to school in Japan .M2
W2,1 W0,2 W0,3 W2,4 W0,5 W2,6 W0,7
Figure 1. Overview of sanitizable signature method for mutual anonymity model
World Congress on Sustainable Technologies (WCST-2015)
Copyright © 2015 Technical Co-Sponsored by IEEE UK/RI Computer Chapter 90

M0 is the original message in Figure 1. M1 is a replaced message for friends of the author. M2 is a replaced message for others. As the paper by Kochi et al. is written in Japanese, there are some misconduct parts when the method is explained in English. Japanese has no blank between words so that words are cut out by meaning from a sentence. In this case in Figure 1, "Tokyo University of Technology" as W0,4 is a set of four words, but it is managed as one word in Japanese. Two words "A friend" as W2,1 is also a set of two words, but plural form is not distinguished from singular form in Japanese so that "A friend" and "Friends" are the same and both of them are one word in Japanese. Moreover, there is no difference of upper case and lower case in Japanese so that "A friend" is the same as "a friend" and "She" is also the same as "she" in Japanese. In the method by Kochi et al., every word is simply replaced with other appropriate word.
In their method, only different words are newly numbered between M0 and M1. For example, W0,1 changed to W1,1, but W0,2 in M0 is the same W0,2 in M1. That is, if there is W1,2 appears in a mathematical formula, the value is the same as W0,2 as shown in Formula (2.1).
4,04,1
3,03,1
2,02,1
1,01,1
WWWWWWWW
≠
≠
=
≠
(2.1)
Random number is concatenated with each word as shown in Formula (2.2) since the same value among hash digests makes guessing the original words possible.
nnn RWW
RWW
RWW
,0,0,0
2,02,02,0
1,01,01,0
||
||
||
=
=
=
M
(2.2)
Hash digests are calculated from W0,i as shown in Formula (2.3).
)(
)(
)(
,0,0
2,02,0
1,01,0
nn WHashh
WHashh
WHashh
=
=
=
M (2.3)
Hash digest H0 is calculated as shown in Formula (2.4).
)||||||( ,02,01,00 nhhhHashH L= (2.4)
A signature of M0 is created as shown in Formula (2.5).
)( 00 0Hsignsk=σ (2.5)
A set of σ0, W0,1, ..., W0,n and R0,1, ..., R0,n is sent to a person who has the right of knowing original message M0 as shown in Formula (2.6).
The person can validate the signature with the public-key of the author pk0.
0
,01,0
,01,0
,,,,
σn
n
RRWW
L
L
(2.6)
When message M1 is created, R1,i is generated as shown in Formula (2.7). R1,i is not a random number but a hash digest.
nn hR
hRhR
,0,1
2,02,1
1,01,1
=
=
=
M (2.7)
R1,i is added to W1,i as shown in Formula (2.8).
nnn RWW
RWW
RWW
,1,1,1
2,12,12,1
1,11,11,1
||
||
||
=
=
=
M (2.8)
Hash digest h1,i is also calculated as shown in Formula (2.9).
)(
)(
)(
,1,1
2,12,1
1,11,1
nn WHashh
WHashh
WHashh
=
=
=
M (2.9)
Hash digest H1 is calculated by concatenation of h1,i as shown in Formula (2.10).
)||||||( ,12,11,11 nhhhHashH L= (2.10)
Signature of M1 is created with sk1 as shown in Formula (2.11).
)( 11 1Hsignsk=σ (2.11)
A person who validates the signature has W1,1, ..., W1,n, R1,1, ..., R1,n, R0,1, ..., R0,n, σ0 and σ1 as shown in Formula (2.12).
0
1
,01,0
,11,1
,11,1
,,,,,,
σσ
n
n
n
RRRRWW
L
L
L
(2.12)
The person can validates M1 since he/she has W1,1, ..., W1,n and R1,1, ..., R1,n. The person also can validates M0 without W0,1 or W0,3 since h0,1 has the same value of R1,1 and h0,3 has the same value of R1,3. Words which are not replaced can be detected by the calculation as shown in Formula (2.13).
World Congress on Sustainable Technologies (WCST-2015)
Copyright © 2015 Technical Co-Sponsored by IEEE UK/RI Computer Chapter 91

)||( 1,01,01,1 RWHashR = (2.13)
Words which are replaced can also be detected by the calculation as shown in Formula (2.14).
)||( 1,01,11,1 RWHashR ≠ (2.14)
R1,2 can be calculated by the same way of (2.13) as shown in Formula (2.15).
)||( 2,02,12,1 RWHashR = (2.15)
R2,i is calculated as shown in Formula (2.16).
)||(
)||()||(
,1,1,2
2,12,12,2
1,11,11,2
nnn RWHashR
RWHashRRWHashR
=
=
=
M (2.16)
Signature of M2 is created with sk2 as shown in Formula (2.17).
)()||||||(
22
,22,21,22
2Hsign
hhhHashH
sk
n
=
=
σL
(2.17)
A person who validates the signature has W2,1, ..., W2,n, R2,1, ..., R2,n, R1,1, ..., R1,n, R0,1, ..., R0,n, σ0, σ1 and σ2 as shown in Formula (2.18).
0
1
2
,01,0
,11,1
,21,2
,21,2
,,,,,,,,
σσσ
n
n
n
n
RRRRRRWW
L
L
L
L
(2.18)
The person can validates M2 since he/she has W2,1, ..., W2,n and R2,1, ..., R2,n. The person also can validates M1 without W1,1 or W1,3 since h1,1 has the same value of R2,1 and h1,3 has the same value of R2,3. Moreover, the person also can validates M0 without W0,1 or W0,3 since h0,1 has the same value of R1,1 and h0,3 has the same value of R1,3. Integrity of R1,1 or R1,3 is assured by the signature σ2.
C. Problems of Existing Methods In Japan, words in the plural are not distinguished from
those in the singular. Examples which show the problem are as follows.
(4) Alice and Charley go to university in Hachioji.
(5) They go to university in Hachioji.
When only Alice is obfuscated first, the sentence changes as follows.
(6) A friend and Charley go to university in Hachioji.
After that, when Charley is also obfuscated, the sentence changes as follows.
(7) A friend and a friend go to university in Hachioji.
The sentence becomes unnatural. Of course, two friends can be combined as follows.
(8) Two of my friends go to university in Hachioji.
When the set of words "Two of my friends" appears again, it should be written as "They" as follows.
(9) Two of my friends go to university in Hachioji.
(10) They live in Hachioji.
Moreover, "Alice and Charley" does not always change to "They". In the case below, "Alice and Charley" must change to "them".
(11) I go to university with Alice and Charley.
In the method by Utsunomiya et al., the problem with singular and plural form is not cared since the main point at issue of their paper is the speed of filtering by double stage Bloom filters. They did not care that more than one people except the author appears in one message of SNS.
Kochi et al. also ignores the problem since they manage Japanese words and plural form is not distinguished with singular form in Japanese.
III. PROPOSED METHOD
In order to solve the problem in chapter 2, I propose a method with XML (eXtensible Markup Language). In the method, the sentence (4) in chapter 2 is written as shown in Figure 2.
(4) Alice and Charley go to university in Hachioji. <name sex="Female" id="randomid1" obfuscation="0">Alice</name><word id="randomid2">and<word><name sex="Male" id="randomid3" obfuscation="0">Charley</name><word id="randomid4">go</word><word id="randomid5">to</word><proper_noun id="randomid6" obfuscation="0">university</proper_noun><word id="randomid7">in</word><proper_noun_of_place id="randomid8" obfuscation="0">Hachioji</proper_noun_of_place><word id="randomid9">.</word>
<name sex="Female" id="randomid1" obfuscation="0">Alice</name><word id="randomid2">and<word><name sex="Male" id="randomid3" obfuscation="0">Charley</name><word id="randomid4">go</word><word id="randomid5">to</word><proper_noun id="randomid6" obfuscation="0">university</proper_noun><word id="randomid7">in</word><proper_noun_of_place id="randomid8" obfuscation="0">Hachioji</proper_noun_of_place><word id="randomid9">.</word>
Figure 2. XML structure in proposed method
There are four types of elements in these tags as follows.
name: Name of a human.
word: Ordinary word.
proper_noun: Proper noun.
proper_noun_of_place: Proper noun which points a name of area on land.
Each element has attributes and all elements have their IDs (identification numbers). ID is used for identifying each element to keep the same ID even when the vale of elements is changed by obfuscation.
World Congress on Sustainable Technologies (WCST-2015)
Copyright © 2015 Technical Co-Sponsored by IEEE UK/RI Computer Chapter 92

Three types of elements, "name", "proper_noun" and "proper_noun_of_place" have an attribute "obfuscation" which is used for indicating obfuscation levels. When the value of "obfuscation" is "0", the value of the element is original. When the value of "obfuscation" is "1", the value of the element is obfuscated to be suitable for friends. For example, "Alice" is changed to "she", "university" remains as "university" and "Hachioji" is changed to "Tokyo". When the value of "obfuscation" is "2", the value of the element is obfuscated to be suitable for others. For example, "Alice" is changed to "a friend", "university" is changed to "school" and "Hachioji" is changed to "Japan". Of course, the sentence can be changed more obfuscated. However, no one want to send and receive a message such as "Some people go to somewhere on the earth" since it makes no sense for readers.
The element "word" does not have attribute "obfuscation" since the values of the element are ordinary words which are not related with privacy.
The difference of two elements "proper_noun" and "proper_noun_of_place" is predetermined words for obfuscation. The element "proper_noun_of_place" has fixed alternative words for obfuscation. For example, "Hachioji" is changed to "Tokyo" and then it is changed to "Japan" since Hachioji city is in Tokyo prefecture and Tokyo prefecture is in the country of Japan. The relations can be extracted from address maps and the extraction can be done automatically. On the other hand, obfuscation of the element "proper_noun" must be done manually one by one. For example, when a man has Prius which is a famous Japanese hybrid car by Toyota, he wants to obfuscate the word to "Japanese car". At that time, another one wants to obfuscate the word to "hybrid car", and another one wants to obfuscate the word to "Toyota car". Thus, different users want to obfuscate the same word differently. Therefore, the element "proper_noun" must be set by each user.
Attribute "sex" is attached to element "name" so that it is decided whether the value of the element should change to "he" or "she" in obfuscation. For example, the element "name" which has the value of "Alice" has attribute "sex" which has the value of "Female". Therefore, it changes to "she" in obfuscation while the element "name" with "Charley" changes to "he". Of course, there are other nouns which have no sex such as a baby. If "baby" appears, it must be changed to "it" in obfuscation. However, the noun "baby" contains no privacy since it has no name. Therefore, in my method, a noun never appears which has no sex with privacy. When the author of the message does not reveal the sex although someone's name appears in the message, it causes no problem. A name in a privacy filter is created not by the author but by friends of the author themselves. For example, when the author of the message does not reveal the sex of "Sam", Sam knows his or her sex so that he or she can create the privacy filter in my method. If there are two Sams in friends of the author, the noun changes according to the rule of the first item on the filter in obfuscation since no one knows which Sam the author refers to.
In this method, elements are sometimes grouped when the grouping is grammatically required. One of the grouping rules is simple. If there is a specific sequence as shown in Figure 3, the elements are combined.
<name sex="Male" obfuscation="1">any</name><word>and</word><name sex="Male" obfuscation="1">any</name>
<name sex="Male" grouped="grouped">they</name>
<name sex="Female" obfuscation="1">any</name><word>and</word><name sex="Female" obfuscation="1">any</name>
<name sex="Female" grouped="grouped">they</name>
Figure 3. Grouping rule of two people by sex
The attribute "grouped" means the number of elements in one group. In top example in Figure 1, two elements "name" with the attribute "sex" which has the value of "Male" are combined in a group in obfuscation. The value "any" means any name as the value. On the other hand, in bottom example in Figure 1, two elements "name" with the attribute "sex" which has the value of "Female" are combined in a group in obfuscation. Thus, when there are two names and the sex of the names are the same, they are combined to "they" since "he and he" or "she and she" is strange while "he and she" or "she and he" is not strange. Of course, when the two names are used not subjects but objects, they change to "them" in obfuscation. It depends on a morphological analysis before obfuscation.
In XML, attribute with no value is prohibited so that "selected" attribute is written as selected="selected" and "checked" attribute is written as checked="checked". Therefore, I apply the rule like grouped="grouped". The value "1" of the attribute "obfuscation" means the obfuscation level is one, that is, the sentence is opened to friends of the author.
Of course, if there are some more people, tags are combined as shown in Figure 4.
<name sex="any" obfuscation="1">any</name><word>,</word><name sex="any" obfuscation="1">any</name><word>,</word><name sex="any" obfuscation="1">any</name>...<word>and</word><name sex="any" obfuscation="1">any</name>
<name sex="any" grouped="3">they</name>
<name sex="any" obfuscation="1">any</name><word>,</word><name sex="any" obfuscation="1">any</name><word>,</word><name sex="any" obfuscation="1">any</name>...<word>and</word><name sex="any" obfuscation="1">any</name>
<name sex="any" grouped="3">they</name>
Figure 4. Grouing rule of more than two people by sex
When there are people more than two, their sex is not influenced. However, if there are two people and they are a male and a female, their sex should remain in the sentence since friends of the author have the right to know the sex of person on sentences according to the rule in Table 1.
I solved the other problem. In the method by Kochi et al., sequential numbers are added on words in a sentence. In that case, when three people are grouped in one such as "they", readers can know that there are there people. The knowledge is not so important but it is privacy in terms of security. On the other hand, in the method that I proposed, there is an attribute
World Congress on Sustainable Technologies (WCST-2015)
Copyright © 2015 Technical Co-Sponsored by IEEE UK/RI Computer Chapter 93
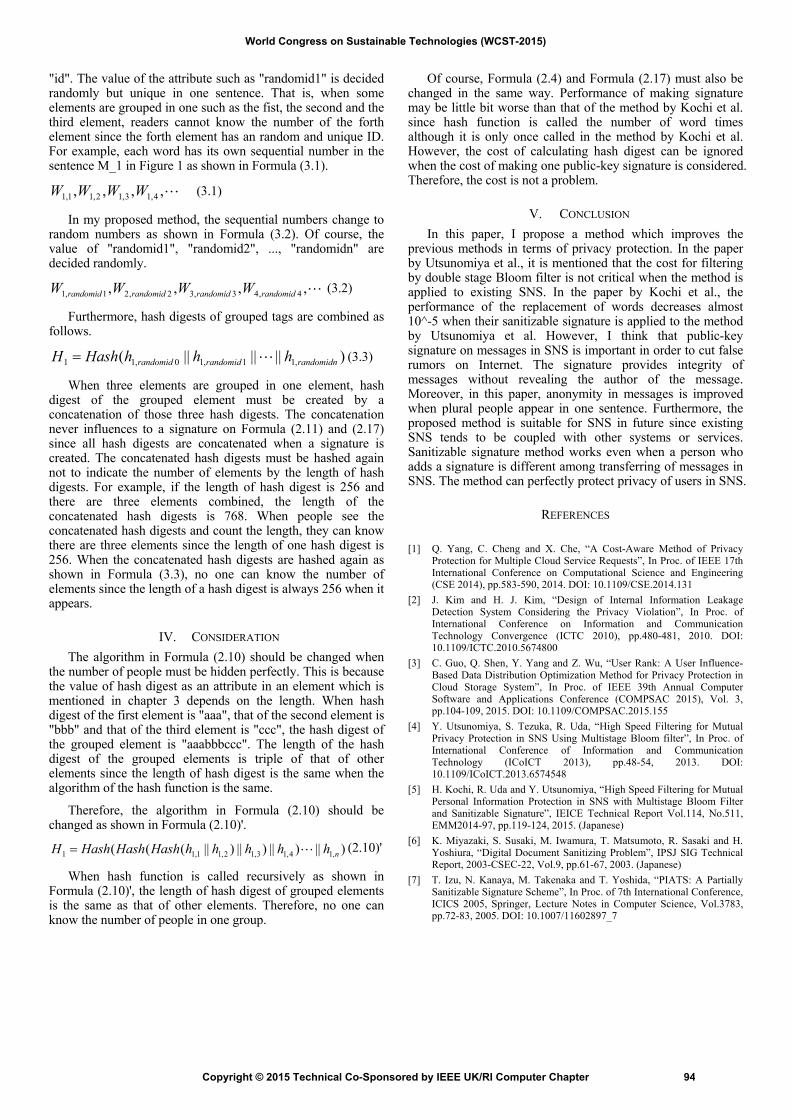
"id". The value of the attribute such as "randomid1" is decided randomly but unique in one sentence. That is, when some elements are grouped in one such as the fist, the second and the third element, readers cannot know the number of the forth element since the forth element has an random and unique ID. For example, each word has its own sequential number in the sentence M_1 in Figure 1 as shown in Formula (3.1).
L,,,, 4,13,12,11,1 WWWW (3.1)
In my proposed method, the sequential numbers change to random numbers as shown in Formula (3.2). Of course, the value of "randomid1", "randomid2", ..., "randomidn" are decided randomly.
L,,,, 4,43,32,21,1 randomidrandomidrandomidrandomid WWWW (3.2)
Furthermore, hash digests of grouped tags are combined as follows.
)||||||( ,11,10,11 randomidnrandomidrandomid hhhHashH L= (3.3)
When three elements are grouped in one element, hash digest of the grouped element must be created by a concatenation of those three hash digests. The concatenation never influences to a signature on Formula (2.11) and (2.17) since all hash digests are concatenated when a signature is created. The concatenated hash digests must be hashed again not to indicate the number of elements by the length of hash digests. For example, if the length of hash digest is 256 and there are three elements combined, the length of the concatenated hash digests is 768. When people see the concatenated hash digests and count the length, they can know there are three elements since the length of one hash digest is 256. When the concatenated hash digests are hashed again as shown in Formula (3.3), no one can know the number of elements since the length of a hash digest is always 256 when it appears.
IV. CONSIDERATION
The algorithm in Formula (2.10) should be changed when the number of people must be hidden perfectly. This is because the value of hash digest as an attribute in an element which is mentioned in chapter 3 depends on the length. When hash digest of the first element is "aaa", that of the second element is "bbb" and that of the third element is "ccc", the hash digest of the grouped element is "aaabbbccc". The length of the hash digest of the grouped elements is triple of that of other elements since the length of hash digest is the same when the algorithm of the hash function is the same.
Therefore, the algorithm in Formula (2.10) should be changed as shown in Formula (2.10)'.
)||)||)||)||((( ,14,13,12,11,11 nhhhhhHashHashHashH L= (2.10)'
When hash function is called recursively as shown in Formula (2.10)', the length of hash digest of grouped elements is the same as that of other elements. Therefore, no one can know the number of people in one group.
Of course, Formula (2.4) and Formula (2.17) must also be changed in the same way. Performance of making signature may be little bit worse than that of the method by Kochi et al. since hash function is called the number of word times although it is only once called in the method by Kochi et al. However, the cost of calculating hash digest can be ignored when the cost of making one public-key signature is considered. Therefore, the cost is not a problem.
V. CONCLUSION In this paper, I propose a method which improves the
previous methods in terms of privacy protection. In the paper by Utsunomiya et al., it is mentioned that the cost for filtering by double stage Bloom filter is not critical when the method is applied to existing SNS. In the paper by Kochi et al., the performance of the replacement of words decreases almost 10^-5 when their sanitizable signature is applied to the method by Utsunomiya et al. However, I think that public-key signature on messages in SNS is important in order to cut false rumors on Internet. The signature provides integrity of messages without revealing the author of the message. Moreover, in this paper, anonymity in messages is improved when plural people appear in one sentence. Furthermore, the proposed method is suitable for SNS in future since existing SNS tends to be coupled with other systems or services. Sanitizable signature method works even when a person who adds a signature is different among transferring of messages in SNS. The method can perfectly protect privacy of users in SNS.
REFERENCES
[1] Q. Yang, C. Cheng and X. Che, “A Cost-Aware Method of Privacy Protection for Multiple Cloud Service Requests”, In Proc. of IEEE 17th International Conference on Computational Science and Engineering (CSE 2014), pp.583-590, 2014. DOI: 10.1109/CSE.2014.131
[2] J. Kim and H. J. Kim, “Design of Internal Information Leakage Detection System Considering the Privacy Violation”, In Proc. of International Conference on Information and Communication Technology Convergence (ICTC 2010), pp.480-481, 2010. DOI: 10.1109/ICTC.2010.5674800
[3] C. Guo, Q. Shen, Y. Yang and Z. Wu, “User Rank: A User Influence-Based Data Distribution Optimization Method for Privacy Protection in Cloud Storage System”, In Proc. of IEEE 39th Annual Computer Software and Applications Conference (COMPSAC 2015), Vol. 3, pp.104-109, 2015. DOI: 10.1109/COMPSAC.2015.155
[4] Y. Utsunomiya, S. Tezuka, R. Uda, “High Speed Filtering for Mutual Privacy Protection in SNS Using Multistage Bloom filter”, In Proc. of International Conference of Information and Communication Technology (ICoICT 2013), pp.48-54, 2013. DOI: 10.1109/ICoICT.2013.6574548
[5] H. Kochi, R. Uda and Y. Utsunomiya, “High Speed Filtering for Mutual Personal Information Protection in SNS with Multistage Bloom Filter and Sanitizable Signature”, IEICE Technical Report Vol.114, No.511, EMM2014-97, pp.119-124, 2015. (Japanese)
[6] K. Miyazaki, S. Susaki, M. Iwamura, T. Matsumoto, R. Sasaki and H. Yoshiura, “Digital Document Sanitizing Problem”, IPSJ SIG Technical Report, 2003-CSEC-22, Vol.9, pp.61-67, 2003. (Japanese)
[7] T. Izu, N. Kanaya, M. Takenaka and T. Yoshida, “PIATS: A Partially Sanitizable Signature Scheme”, In Proc. of 7th International Conference, ICICS 2005, Springer, Lecture Notes in Computer Science, Vol.3783, pp.72-83, 2005. DOI: 10.1007/11602897_7
World Congress on Sustainable Technologies (WCST-2015)
Copyright © 2015 Technical Co-Sponsored by IEEE UK/RI Computer Chapter 94

Interactive E-Book Design and Development to Support Literacy Learning
for Language Minority Students Muneeroh Phadung
Computer Education Program, Faculty of Science Technology and Agriculture, Yala Rajabhat University
Yala, Thailand [email protected]
Abstract— Interactive multimedia application as e-books has benefits and capabilities for enhancing learning rate and increasing students’ concentration and involvement in the learning activities. This study presents interactive e-book design areas to support literacy learning for language minority students within the primary school level. There are three main components of design framework including multimedia design, interactive design, and learning design. Moreover, the researcher attempts to design all three components based on the cultural theme to help language minority students reflect their own cultures and begin to understand the cultures of the language that they are learning. The prototype consists of two main modules including manual module and automatic module. Furthermore, the researcher would like students to interact with the program through interactive whiteboard as a cooperative tool in the classroom. The interactive e-book is expected to be an alternative educational tool to solve the learning problems of language minority students.
Keywords- Interactive Multimedia; e-Book; Language Minority Students.
I. INTRODUCTION Several types of computer software are widely used by
students both at home and in school [1]. Multimedia software, especially interactive e-books, can be powerful educational tools for promoting students’ literacy and language outcomes [2]; [3]; [4]; [5]; [6]. However, some e-books on the market are not efficient for language learning. Therefore, educators must be careful when using e-books [1].
In Thailand; Yala, Pattani, and Narathiwat are three southern border provinces that have cultural identities different from the other parts of the country. In everyday life, 83 percent of the people in this area use the Pattani Malay language [7]. This language is one of the dialects influenced by the Malaysian language [8]. However, the official language used in schools is Thai. Consequently, because of their poor ability in using Thai language, these language minority students face numerous difficulties when it comes to learning the content taught in schools. Besides this, the teaching methods are not compatible with their way of life and traditions, which exacerbates the educational problems [9].
Accordingly, educators need to provide the alternative educational tools to solve the learning problems of students in ethnic minority communities. Using interesting materials at all levels of education including primary education, these students can learn the official language as a second language more effectively with good attitudes toward learning. The potential and advantage of multimedia application in language learning have inspired the researcher to realize that using an interactive e-book can support literacy learning and second language learning for language minority students. As a result, these students will have a better chance at becoming bilingual speakers who have the confidence to communicate with others. This will enable students to use their second language as the official language in school. The key to this success is that students will be motivated to learn a language through the use of interesting tools.
II. OBJECTIVES AND SCOPES
A. The interactive e-book objectives The objectives of the interactive e-book development are:
1. To set the interactive e-book design framework forlanguage minority students.
2. To develop an interactive e-book prototype forlanguage minority students.
3. To evaluate informally the satisfaction of theinteractive e-book prototype with students andteachers who were the targeted users.
B. The interactive e-book scopes The interactive e-book content covered Thai language
learning and was based on the current Thai basic education core curriculum B.E. 2551 (A.D. 2008). The courseware was delivered in Thai. The targeted users were third grade minority language students from three southern border provinces of Thailand using Malay dialect as a mother tongue. This study focuses on the interactive e-book as a cooperative tool in the classroom by using interactive whiteboard. This technique also could be used for individual learning as well.
This work was supported by grants from the National Research Council of Thailand (NRCT) and the Thailand Research Fund (TRF).
World Congress on Sustainable Technologies (WCST-2015)
Copyright © 2015 Technical Co-Sponsored by IEEE UK/RI Computer Chapter 95

III. INTERACTIVE E-BOOK DESIGN PRINCIPLE
The interactive e-book design principle was applied using the learning objects design framework [10]; [11]. According to the design framework described, a design principle is composed of three significant categories of design;
A. Multimedia design How components are presented or shown. This design
category addresses the composition of visual consistency (e.g., image, animation, video, and text) and sound suitability.
B. Interactive design How components describe its use for promoting students
engagement and increasing students outcomes. This design category addresses the interactivities between the e-book and user that offer an easy-to-use approach, such as providing interactivities suitable for motor skills students.
C. Learning design How components relate to an instructional objective. The
learning design category adopts the guidelines of instruction to foster the students’ learning. The researcher is concerned about applying the principles of brain-based learning to this domain.
Furthermore, the researcher realizes that the cultural theme is also significant because it reflects a home-school connection. This especially helps language minority students reflect their own cultures and understand cultures of the second language that they are learning [12]; [13]; [14]; [15]. The interactive e-book built on a cultural theme can support students’ learning. First, it helps students improve the critical thinking and problem-solving skills. Second, choosing topics that mirror the home-school connection and reflect children’s own cultures foster their engagement and adoption of the learning skills which, in turn, deepens their thinking [16]. There are an increasing number of bilingual or multilingual children’s e-books being produced. These e-books can be used to encourage the diversity and inspire the understanding of both their own cultures and other cultures and traditions. This approach can provide alternative opportunities for language minority students to experience and engage in literature [17] (see Fig. 1).
Figure 1. Interactive e-book design framework.
IV. PROTOTYPE DEVELOPMENT
The prototype developed was based on the design framework in Fig. 1. The prototype was divided into two main modules including;
A. The manual module This module has two modes; the first mode is named “Read
to Me”. Each page included animation and highlighted contents were synchronized with voice narration. After that, the user can navigate and control the e-book by clicking buttons on the left top of the screen. The user can repeat this function by clicking the repeat button or clicking on the words that the user would like to learn (See Fig. 2).
The second mode is named “Read It Myself. The user can use this mode in case students want to read the e-book by themselves. Its options are the same with “Read to Me”; only the voice narration is disabled in this mode.
Figure 2. Screenshot of the manual module.
B. The automatic module The module is named “AutoPlay”. The software allowed
the user to play automatically from the first page to the last. The user could control the e-book only using “home”, “stop” and “play” buttons (See Fig. 3).
Figure 3. Screenshot of the automatic module.
World Congress on Sustainable Technologies (WCST-2015)
Copyright © 2015 Technical Co-Sponsored by IEEE UK/RI Computer Chapter 96
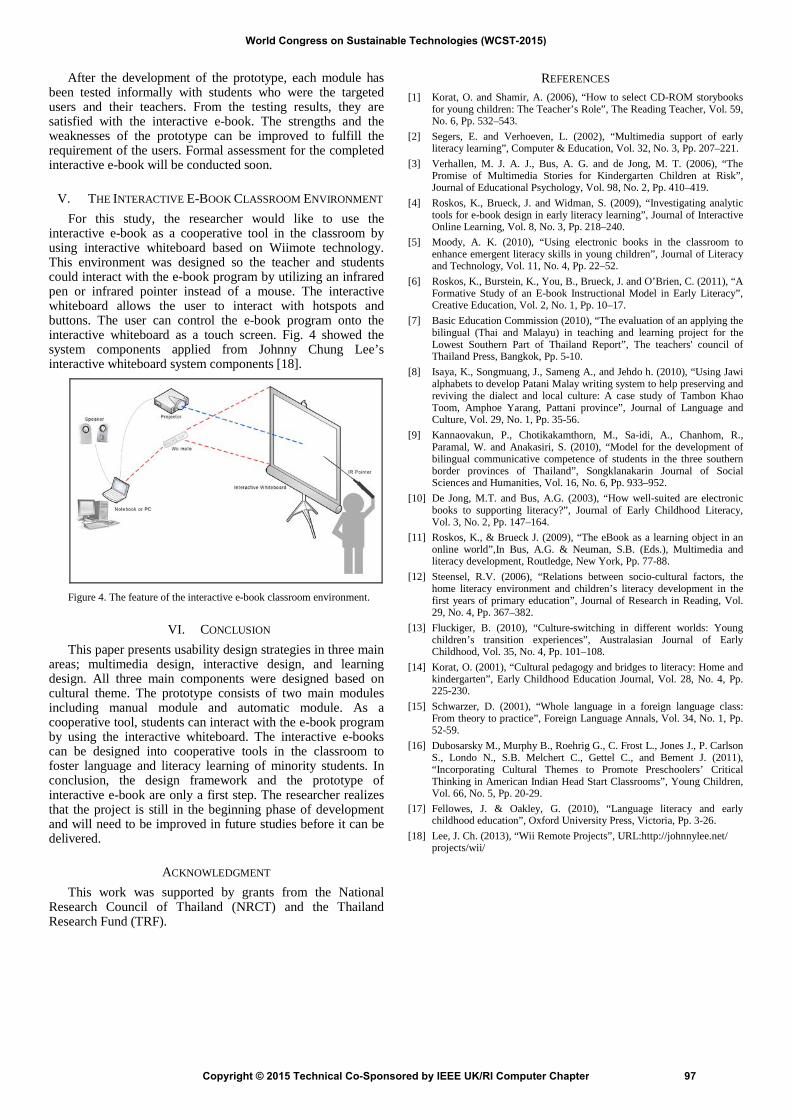
After the development of the prototype, each module has been tested informally with students who were the targeted users and their teachers. From the testing results, they are satisfied with the interactive e-book. The strengths and the weaknesses of the prototype can be improved to fulfill the requirement of the users. Formal assessment for the completed interactive e-book will be conducted soon.
V. THE INTERACTIVE E-BOOK CLASSROOM ENVIRONMENT For this study, the researcher would like to use the
interactive e-book as a cooperative tool in the classroom by using interactive whiteboard based on Wiimote technology. This environment was designed so the teacher and students could interact with the e-book program by utilizing an infrared pen or infrared pointer instead of a mouse. The interactive whiteboard allows the user to interact with hotspots and buttons. The user can control the e-book program onto the interactive whiteboard as a touch screen. Fig. 4 showed the system components applied from Johnny Chung Lee’s interactive whiteboard system components [18].
Figure 4. The feature of the interactive e-book classroom environment.
VI. CONCLUSION
This paper presents usability design strategies in three main areas; multimedia design, interactive design, and learning design. All three main components were designed based on cultural theme. The prototype consists of two main modules including manual module and automatic module. As a cooperative tool, students can interact with the e-book program by using the interactive whiteboard. The interactive e-books can be designed into cooperative tools in the classroom to foster language and literacy learning of minority students. In conclusion, the design framework and the prototype of interactive e-book are only a first step. The researcher realizes that the project is still in the beginning phase of development and will need to be improved in future studies before it can be delivered.
ACKNOWLEDGMENT This work was supported by grants from the National
Research Council of Thailand (NRCT) and the Thailand Research Fund (TRF).
REFERENCES [1] Korat, O. and Shamir, A. (2006), “How to select CD-ROM storybooks
for young children: The Teacher’s Role”, The Reading Teacher, Vol. 59, No. 6, Pp. 532–543.
[2] Segers, E. and Verhoeven, L. (2002), “Multimedia support of early literacy learning”, Computer & Education, Vol. 32, No. 3, Pp. 207–221.
[3] Verhallen, M. J. A. J., Bus, A. G. and de Jong, M. T. (2006), “The Promise of Multimedia Stories for Kindergarten Children at Risk”, Journal of Educational Psychology, Vol. 98, No. 2, Pp. 410–419.
[4] Roskos, K., Brueck, J. and Widman, S. (2009), “Investigating analytic tools for e-book design in early literacy learning”, Journal of Interactive Online Learning, Vol. 8, No. 3, Pp. 218–240.
[5] Moody, A. K. (2010), “Using electronic books in the classroom to enhance emergent literacy skills in young children”, Journal of Literacy and Technology, Vol. 11, No. 4, Pp. 22–52.
[6] Roskos, K., Burstein, K., You, B., Brueck, J. and O’Brien, C. (2011), “A Formative Study of an E-book Instructional Model in Early Literacy”, Creative Education, Vol. 2, No. 1, Pp. 10–17.
[7] Basic Education Commission (2010), “The evaluation of an applying the bilingual (Thai and Malayu) in teaching and learning project for the Lowest Southern Part of Thailand Report”, The teachers' council of Thailand Press, Bangkok, Pp. 5-10.
[8] Isaya, K., Songmuang, J., Sameng A., and Jehdo h. (2010), “Using Jawi alphabets to develop Patani Malay writing system to help preserving and reviving the dialect and local culture: A case study of Tambon Khao Toom, Amphoe Yarang, Pattani province”, Journal of Language and Culture, Vol. 29, No. 1, Pp. 35-56.
[9] Kannaovakun, P., Chotikakamthorn, M., Sa-idi, A., Chanhom, R., Paramal, W. and Anakasiri, S. (2010), “Model for the development of bilingual communicative competence of students in the three southern border provinces of Thailand”, Songklanakarin Journal of Social Sciences and Humanities, Vol. 16, No. 6, Pp. 933–952.
[10] De Jong, M.T. and Bus, A.G. (2003), “How well-suited are electronic books to supporting literacy?”, Journal of Early Childhood Literacy, Vol. 3, No. 2, Pp. 147–164.
[11] Roskos, K., & Brueck J. (2009), “The eBook as a learning object in an online world”,In Bus, A.G. & Neuman, S.B. (Eds.), Multimedia and literacy development, Routledge, New York, Pp. 77-88.
[12] Steensel, R.V. (2006), “Relations between socio-cultural factors, the home literacy environment and children’s literacy development in the first years of primary education”, Journal of Research in Reading, Vol. 29, No. 4, Pp. 367–382.
[13] Fluckiger, B. (2010), “Culture-switching in different worlds: Young children’s transition experiences”, Australasian Journal of Early Childhood, Vol. 35, No. 4, Pp. 101–108.
[14] Korat, O. (2001), “Cultural pedagogy and bridges to literacy: Home and kindergarten”, Early Childhood Education Journal, Vol. 28, No. 4, Pp. 225-230.
[15] Schwarzer, D. (2001), “Whole language in a foreign language class: From theory to practice”, Foreign Language Annals, Vol. 34, No. 1, Pp. 52-59.
[16] Dubosarsky M., Murphy B., Roehrig G., C. Frost L., Jones J., P. Carlson S., Londo N., S.B. Melchert C., Gettel C., and Bement J. (2011), “Incorporating Cultural Themes to Promote Preschoolers’ Critical Thinking in American Indian Head Start Classrooms”, Young Children, Vol. 66, No. 5, Pp. 20-29.
[17] Fellowes, J. & Oakley, G. (2010), “Language literacy and early childhood education”, Oxford University Press, Victoria, Pp. 3-26.
[18] Lee, J. Ch. (2013), “Wii Remote Projects”, URL:http://johnnylee.net/ projects/wii/
World Congress on Sustainable Technologies (WCST-2015)
Copyright © 2015 Technical Co-Sponsored by IEEE UK/RI Computer Chapter 97

Performance Monitoring of Virtual Machines (VMs) of Type I and II hypervisors with SNMPv3 Asif Iqbal
School of Computing, Creative Technologies and Engineering
Leeds Beckett University Leeds, United Kingdom
Colin Pattinson School of Computing, Creative
Technologies and Engineering Leeds Beckett University Leeds, United Kingdom
Ah-Lian Kor School of Computing, Creative
Technologies and Engineering Leeds Beckett University Leeds, United Kingdom
Abstract - Simple Network Management Protocol (SNMP) is the protocol which has the capability to monitor the performance of IP based devices. Also it can monitor components installed on these devices to determine whether they are working or not. In an environment with hundreds of installed servers, it is not possible to check if each machine is working properly. SNMP can also be a used in cloud computing environment for the monitoring of the hardware, infrastructure or virtual machines. To date, not much work has been done on cloud computing monitoring with SNMP. In this research, empirical results of using SNMPv3 to monitor Virtual Machines configured on Type I and II hypervisors and the hypervisor itself vmware ESXi 5.5 resources. Additionally, this research involved the exploration of efficient ways for monitoring the resources and this will lead to the customisation of MIB with Agent X to provide some management features using SNMPv3. The completed research work will consists of four components: (1). Network Management System (NMS), where Zabbix will be used as NMS; (2). SNMP Agent, which will be installed on the devices which need to be monitored; (3). Virtual Machines; (4). Type I and II Hypervisor.
Keywords: SNMP; Virtualization; Hypervisor; Zabbix; Cloud Computing;
I. INTRODUCTION
Monitoring of the virtual machines with high security and minimal overhead is always very important, especially in those environments where hundreds of Virtual Machines VMs are running on dozens of physicals servers. This paper presents the results of monitoring the VMs configured on hosted and bare metal hypervisors with SNMP version 3. Also it is identified that either monitoring hypervisor only will be enough to collect detailed resources consumptions or VMs monitoring will also be required.
To complete the experiment of resource monitoring, HP ProLiant DL380 Gen8 server is used, where VMware ESXi 5.5 bare metal hypervisor is installed. Bare metal hypervisor does not need any Operating System because it runs directly on the machine. Two of the virtual machines are configured on Hypervisor and Zabbix is installed in the laptop.
And to monitor the VMs of Type II hypervisor, two laptops are used, where Ubuntu and Windows Server 2012 are the VMs on Windows 8 host Operating System. Open Source Sun Virtualbox is used as a Type II hypervisor. Type II hypervisors cannot run directly on the hardware, they require an Operating System (OS), that is why Windows 8 is used as host OS for experiment.
II. LITERATURE REVIEW
A. Hypervisor
Hypervisor is also called Virtual Machine Manager. It is a software which creates and runs Virtual Machines (VM).
B. SNMP
SNMP stands for Simple Network Management Protocol. SNMP is used to monitor the IP based devices installed in the network.
C. MIB
A management information base (MIB) is a formal description of a set of network objects that can be managed using the SNMP.
D. Zabbix
Zabbix is Linux based open source software which provide feature to store SNMP results in mySQL database.
III. RELATED WORK
Peng and Chen use two standard MIBs, MIB-II and Host Resources MIB to monitor the performance and to obtain the information for VM [1].
Swarna introduced the concept called auto discovery of the hosts. This experiment was completed by extending custom MIB through the AgentX functionality. To test, they used NMS, MibParser and AgentX [2].
Hillbrecht develope a MIB, called Virtual-Machine-MIB which conducts performing control operations: create,
World Congress on Sustainable Technologies (WCST-2015)
Copyright © 2015 Technical Co-Sponsored by IEEE UK/RI Computer Chapter 98

delete, restart, turn on, pause and shut down virtual machines [3].
Blanquicet and Christensen evaluate a new SNMP power state MIB and its agent to expose equipment power state to the network [4].
Short summary of research work of by 4 different researchers are provided. One important point is that none of them have not mentioned in their research papers the version of SNMP used.
IV. CONFIGURATION AND IMPLEMENTATION OF SNMPAGENT AND ZABBIX
A. Zabbix Installation To install, Zabbix, Ubuntu OS was installed on the
physical machine. PHP and MySQL were compulsory to install because, Zabbix frontend is designed in PHP which can be accessed in http://localhost/zabbix
B. Configurations of SNMP v3 agent on VMware ESXI 5.5
hypervisor (Type I)
It is important to enable the snmpd package on the hypervisor before the configuration is carried out.
C. SNMP Agent on Windows Server 2012
All the operating systems provided by Microsoft, does not support SNMP version 3. So SNMP agent was configured with version 1.
V. EXPERIMENTAL RESULTS
A. Hypervisor Vmware ESXi 5.5
Specifications and utilizations of processor, memory, storage and network are monitored. Moreover it was found the load on all cores of processors.
B. VM Ubuntu Monitoring
To monitor VM, SNMP commands are run on the SNMP server to find out the resources utilization of Virtual Machines.
C. Display Result in Zabbix All the information or values which are collected with
SNMP commands in terminal are displayed in a graph by using Zabbix.
D. Hypervisor vs VM Monitoring Resource monitoring of hypervisor and virtual machines
has performed separately. While monitoring hypervisor, it can be revealed how much amount of memory is utilized by server, but it is not possible to identify which virtual machine is consuming what resources. To find out the resources consumed by virtual machines, an agent is
configured on them and virtual machines resources are monitored by the agent.
E. Hosted Hypervisor (Sun Virtual Box and VMs) Sun Virtual Box which is a hosted hypervisor, and it is
not possible to monitor the hosted hypervisor, because it is not itself an Operating System. Resources of VMs running on this hypervisors are monitored.
F. Zabbix and MIB To perform monitoring with any MIB object, it is
compulsory to add it into Zabbix templates. To make, setup look professional, five templates are created in this experiment. Each template has different MIB objects.
G. Graphs Graphs are actually used to display data with timeline.
Various graphs are created to display data.
VI. CONCLUSION AND FUTURE WORK
Resource monitoring is performed with SNMP v3 of Type I and II Hypervisors including VMs. And it is found that monitoring the hypervisor only will not allow us to know that what recourses are being consumed by each virtual machine. Each Virtual Machine individually needs to be monitored, in order to find out their respective resources consumption.
Load Balancing and VM migration will be a great idea after this monitoring setup. VMs can be migrated to other hypervisor if resources allow us to do and turning off one physical machine will enable us to save energy consumption. But for all this future work, accurate monitoring of the system is very important.
REFERENCES
[1] Peng, Y., & Chen, Y. (2011). SNMP-based monitoring of heterogeneous virtual infrastructure in clouds, 1--6.
[2] Swarna, J., Raja, C.S. and Ravichandran, K.S. (2012) 'Cloud Monitoring based on SNMP', Journal of Theoretical and Applied Information Technology, 40(2), pp. 188-193 [Online]. Available at: http://www.jatit.org/volumes/ Vol40No2/11Vol40No2.pdf(Accessed: 18 November 2014).
[3] Hillbrecht, R., Carlos, de Bona, L. C. E. (2012) 'Utility and Cloud Computing', A SNMP-based Virtual Machine Management Interface, 5(), pp. 279-286 [Online]. Available at:(Accessed: 16 November 2014).
[4] Blanquicet, F., & Christensen, K. (2008). Managing energy use in a network with a new SNMP power state MIB, 509--511.
World Congress on Sustainable Technologies (WCST-2015)
Copyright © 2015 Technical Co-Sponsored by IEEE UK/RI Computer Chapter 99

Session 3: Sustainable Technologies and Sustainable Building Design
Construction Approach to Enhance Sustainability of Low and Medium Income Housing in Developing Countries (Authors: Bashir O. Ganiyu, Julius A. Fapohunda, Rainer Haldenwang)
Data Centre Energy Efficiency (Authors: Nabil Hadj-Ahmed, Colin Pattinson, Ah-Lean Kor)
A Low cost Functional Electrical Stimulation (FES) System for Essential Tremor Suppression Using off the Shelf Components (Authors: Awais Shafique, Hooriya Anam, Muhammad Arsalan Javed)
World Congress on Sustainable Technologies (WCST-2015)
Copyright © 2015 Technical Co-Sponsored by IEEE UK/RI Computer Chapter 100

Construction Approaches to Enhance Sustainability in Affordable Housing in Developing Countries Bashir O. Ganiyu,
Department of Civil Engineering and Survey
Cape Peninsula University of Technology (CPUT)
Cape Town, South Africa. E-mail: [email protected]
Julius A.. Fapohunda, Construction Management and
Quantity Surveying Department, Cape Peninsula University of
Technology (CPUT) Cape Town, South Africa
E-mail: [email protected]
Rainer Haldenwang, Department of Civil Engineering and
Survey Cape Peninsula University of
Technology (CPUT) Cape Town, South Africa
E-mail: [email protected]
Abstract— The responsiveness of the construction industry to the preservation of natural resources for the benefits of future generation has been very poor in developing countries. This is unconnected to the demand for sustainable shelters to house the growing population and meeting the demand for supporting infrastructure to provide better living standards for the people. Building energy efficient houses does not only contribute to better living conditions, but also a better environment thereby culminating into creating sustainable communities. The existing literatures reveal the existence of much discussion about sustainable development, but this is not matched with much action. This paper aims to provide a new approach upon which housing development for low and middle income population in developing countries could be constructed to enhance sustainability. The study employs the use of quantitative methods for data gathering and construction professionals within South African construction industry were the research participants. The data were analysed using descriptive statistical techniques. The research highlights four construction methods and factors which affect the construction methods that enhance sustainability in housing. Eliminating material wastage and complexities in housing processes are the core factors which when achieved will reduce construction cost to a minimum, reduce negative impact of construction on the environment while maintaining high quality in the housing constructed.
Keywords; Construction industry, enhance sustainability, housing development, human settlement, innovative technologies, lean construction, modular construction, sustainable housing
I. INTRODUCTION One of the greatest challenges facing developing nations is the
provision of infrastructure to enhance construction of sustainable shelters in line with the sustainable agenda of the United Nations (UN). Housing contributes significantly to the relationships between society and the environment. This is evident as its construction and operation consume large amounts of natural resources on the one hand and on the other, housing itself is exposed to a variety of environmental impacts [14]. It is the responsibility of government at all levels in a country to make available the much needed resources while the construction industry is saddled with the implementation of construction projects to enable the achievement of sustainable development. It is however to be noted that the tension between
urban growth, poverty alleviation, affordable housing provision, access to quality shelters and environmental conditions can be mitigated through the adoption of appropriate construction approaches in housing development and programmes [14].
Reference [4] stressed that South Africa is experiencing immense pressure on landfill sites, due to high volume of waste generated during construction and demolition activities. The percentage wastes generated from these activities account for 10-20% of landfill space and recycling of this waste have not been given the attention it deserves [4]. Therefore, there is varied and significant political, social and environmental pressure to reduce green-house gas emission and waste generated in construction of low-income housing. It is on this not that, the South Africa housing sector embraced the use of alternative building materials such as; moladi panels, interlocking blocks and sand-bag as walling material for construction of affordable housing for the low income sector over the years. Affordable housing experts notably reference [5] noted that, these building materials have helped to provide housing at relatively cheap cost. Although, acceptable in terms of cost but occupation of buildings constructed with the alternative building materials have always been met with stiff resistance by the targeted users.
Sustainable housing is often believed to mean resource-saving buildings. This paper views ‘’sustainable housing as socially-enhancing and environmentally friendly residential practices integrated into the wider urban settlement system” [14]. It is against this backdrop that this paper aims to provide a new approach upon which housing development for the middle-income class in developing countries could be constructed under the tenet of sustainability learning from the South African affordable housing sector experience.
A. Housing challenges in South Africa
The challenges to provide sustainable affordable housing is prevalent in both developed and developing countries, the need for decent affordable housing is acute in developing nations and for South Africa it is no different. This trend is driven by rapid urbanisation due to rapid population
World Congress on Sustainable Technologies (WCST-2015)
Copyright © 2015 Technical Co-Sponsored by IEEE UK/RI Computer Chapter 101
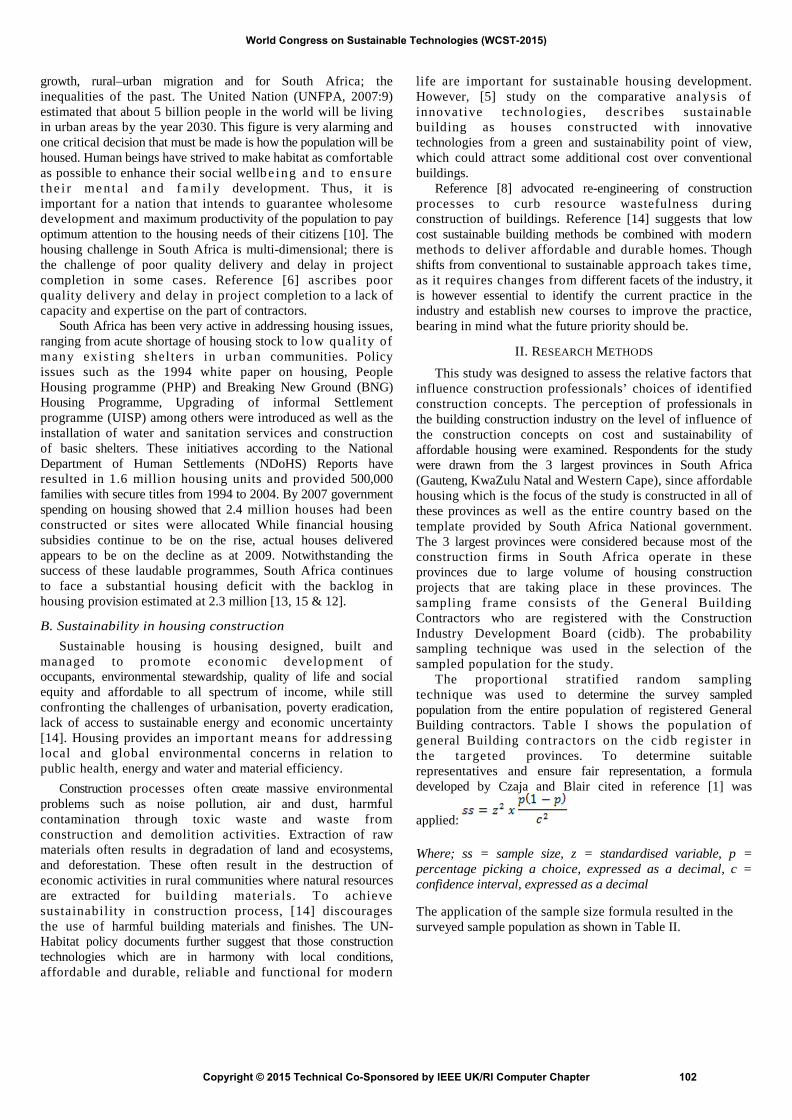
growth, rural–urban migration and for South Africa; the inequalities of the past. The United Nation (UNFPA, 2007:9) estimated that about 5 billion people in the world will be living in urban areas by the year 2030. This figure is very alarming and one critical decision that must be made is how the population will be housed. Human beings have strived to make habitat as comfortable as possible to enhance their social wellb e ing a nd to ensure the i r me nta l and fa m i l y development. Thus, it is important for a nation that intends to guarantee wholesome development and maximum productivity of the population to pay optimum attention to the housing needs of their citizens [10]. The housing challenge in South Africa is multi-dimensional; there is the challenge of poor quality delivery and delay in project completion in some cases. Reference [6] ascribes poor quality delivery and delay in project completion to a lack of capacity and expertise on the part of contractors.
South Africa has been very active in addressing housing issues, ranging from acute shortage of housing stock to low quali ty of many exist ing shelters in urban communities. Policy issues such as the 1994 white paper on housing, People Housing programme (PHP) and Breaking New Ground (BNG) Housing Programme, Upgrading of informal Settlement programme (UISP) among others were introduced as well as the installation of water and sanitation services and construction of basic shelters. These initiatives according to the National Department of Human Settlements (NDoHS) Reports have resulted in 1.6 million housing units and provided 500,000 families with secure titles from 1994 to 2004. By 2007 government spending on housing showed that 2.4 million houses had been constructed or sites were allocated While financial housing subsidies continue to be on the rise, actual houses delivered appears to be on the decline as at 2009. Notwithstanding the success of these laudable programmes, South Africa continues to face a substantial housing deficit with the backlog in housing provision estimated at 2.3 million [13, 15 & 12].
B. Sustainability in housing construction Sustainable housing is housing designed, built and
managed to promote economic development of occupants, environmental stewardship, quality of life and social equity and affordable to all spectrum of income, while still confronting the challenges of urbanisation, poverty eradication, lack of access to sustainable energy and economic uncertainty [14]. Housing provides an important means for addressing local and global environmental concerns in relation to public health, energy and water and material efficiency.
Construction processes often create massive environmental problems such as noise pollution, air and dust, harmful contamination through toxic waste and waste from construction and demolition activities. Extraction of raw materials often results in degradation of land and ecosystems, and deforestation. These often result in the destruction of economic activities in rural communities where natural resources are extracted for building materials. To achieve sustainability in construction process, [14] discourages the use of harmful building materials and finishes. The UN-Habitat policy documents further suggest that those construction technologies which are in harmony with local conditions, affordable and durable, reliable and functional for modern
life are important for sustainable housing development. However, [5] study on the comparative analysis of innovative technologies, describes sustainable building as houses constructed with innovative technologies from a green and sustainability point of view, which could attract some additional cost over conventional buildings.
Reference [8] advocated re-engineering of construction processes to curb resource wastefulness during construction of buildings. Reference [14] suggests that low cost sustainable building methods be combined with modern methods to deliver affordable and durable homes. Though shifts from conventional to sustainable approach takes time, as it requires changes from different facets of the industry, it is however essential to identify the current practice in the industry and establish new courses to improve the practice, bearing in mind what the future priority should be.
II. RESEARCH METHODS
This study was designed to assess the relative factors that influence construction professionals’ choices of identified construction concepts. The perception of professionals in the building construction industry on the level of influence of the construction concepts on cost and sustainability of affordable housing were examined. Respondents for the study were drawn from the 3 largest provinces in South Africa (Gauteng, KwaZulu Natal and Western Cape), since affordable housing which is the focus of the study is constructed in all of these provinces as well as the entire country based on the template provided by South Africa National government. The 3 largest provinces were considered because most of the construction firms in South Africa operate in these provinces due to large volume of housing construction projects that are taking place in these provinces. The sampling frame consists of the General Building Contractors who are registered with the Construction Industry Development Board (cidb). The probability sampling technique was used in the selection of the sampled population for the study.
The proportional stratified random sampling technique was used to determine the survey sampled population from the entire population of registered General Building contractors. Table I shows the population of general Building contractors on the cidb register in the targeted provinces. To determine suitable representatives and ensure fair representation, a formula developed by Czaja and Blair cited in reference [1] was
applied:
Where; ss = sample size, z = standardised variable, p = percentage picking a choice, expressed as a decimal, c = confidence interval, expressed as a decimal
The application of the sample size formula resulted in the surveyed sample population as shown in Table II.
World Congress on Sustainable Technologies (WCST-2015)
Copyright © 2015 Technical Co-Sponsored by IEEE UK/RI Computer Chapter 102
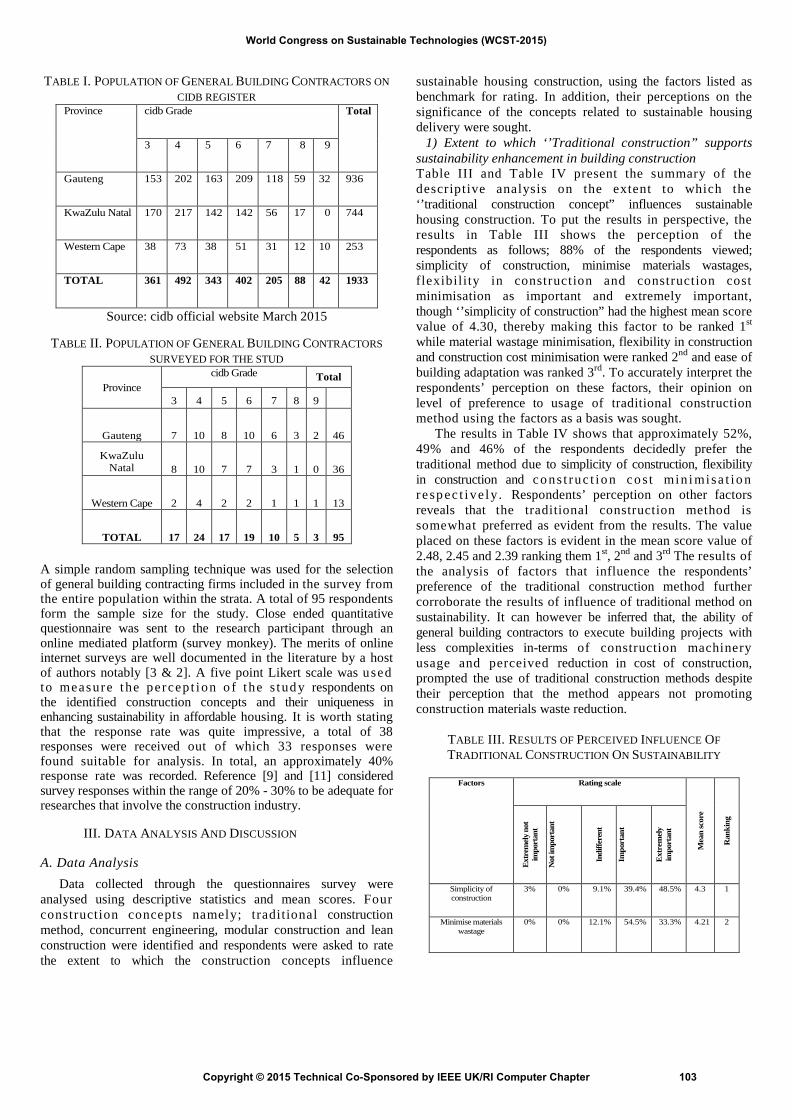
TABLE I. POPULATION OF GENERAL BUILDING CONTRACTORS ON CIDB REGISTER
Province cidb Grade Total
3 4 5 6 7 8 9
Gauteng 153 202 163 209 118 59 32 936
KwaZulu Natal 170 217 142 142 56 17 0 744
Western Cape 38 73 38 51 31 12 10 253
TOTAL 361 492 343 402 205 88 42 1933
Source: cidb official website March 2015
TABLE II. POPULATION OF GENERAL BUILDING CONTRACTORS SURVEYED FOR THE STUD
Province cidb Grade Total
3 4 5 6 7 8 9
Gauteng 7 10 8 10 6 3 2 46
KwaZulu Natal 8 10 7 7 3 1 0 36
Western Cape 2 4 2 2 1 1 1 13
TOTAL 17 24 17 19 10 5 3 95
A simple random sampling technique was used for the selection of general building contracting firms included in the survey from the entire population within the strata. A total of 95 respondents form the sample size for the study. Close ended quantitative questionnaire was sent to the research participant through an online mediated platform (survey monkey). The merits of online internet surveys are well documented in the literature by a host of authors notably [3 & 2]. A five point Likert scale was used to measure the percep t ion o f t he s tud y respondents on the identified construction concepts and their uniqueness in enhancing sustainability in affordable housing. It is worth stating that the response rate was quite impressive, a total of 38 responses were received out of which 33 responses were found suitable for analysis. In total, an approximately 40% response rate was recorded. Reference [9] and [11] considered survey responses within the range of 20% - 30% to be adequate for researches that involve the construction industry.
III. DATA ANALYSIS AND DISCUSSION
A. Data Analysis Data collected through the questionnaires survey were
analysed using descriptive statistics and mean scores. Four construction concepts namely; traditional construction method, concurrent engineering, modular construction and lean construction were identified and respondents were asked to rate the extent to which the construction concepts influence
sustainable housing construction, using the factors listed as benchmark for rating. In addition, their perceptions on the significance of the concepts related to sustainable housing delivery were sought.
1) Extent to which ‘’Traditional construction” supportssustainability enhancement in building construction Table III and Table IV present the summary of the descriptive analysis on the extent to which the ‘’traditional construction concept” influences sustainable housing construction. To put the results in perspective, the results in Table III shows the perception of the respondents as follows; 88% of the respondents viewed; simplicity of construction, minimise materials wastages, flexibility in construction and construction cost minimisation as important and extremely important, though ‘’simplicity of construction” had the highest mean score value of 4.30, thereby making this factor to be ranked 1st while material wastage minimisation, flexibility in construction and construction cost minimisation were ranked 2nd and ease of building adaptation was ranked 3rd. To accurately interpret the respondents’ perception on these factors, their opinion on level of preference to usage of traditional construction method using the factors as a basis was sought.
The results in Table IV shows that approximately 52%, 49% and 46% of the respondents decidedly prefer the traditional method due to simplicity of construction, flexibility in construction and co ns t ruc t io n co s t min i misa t io n r e sp ec t ive ly . Respondents’ perception on other factors reveals that the traditional construction method is somewhat preferred as evident from the results. The value placed on these factors is evident in the mean score value of 2.48, 2.45 and 2.39 ranking them 1st, 2nd and 3rd The results of the analysis of factors that influence the respondents’ preference of the traditional construction method further corroborate the results of influence of traditional method on sustainability. It can however be inferred that, the ability of general building contractors to execute building projects with less complexities in-terms of construction machinery usage and perceived reduction in cost of construction, prompted the use of traditional construction methods despite their perception that the method appears not promoting construction materials waste reduction.
TABLE III. RESULTS OF PERCEIVED INFLUENCE OF TRADITIONAL CONSTRUCTION ON SUSTAINABILITY
Factors Rating scale
Mea
n sc
ore
Ran
king
Extr
emely
not
im
port
ant
Not
impo
rtan
t
Indi
ffere
nt
Impo
rtan
t
Extr
emel
y im
port
ant
Simplicity of construction
3% 0% 9.1% 39.4% 48.5% 4.3 1
Minimise materials wastage
0% 0% 12.1% 54.5% 33.3% 4.21 2
World Congress on Sustainable Technologies (WCST-2015)
Copyright © 2015 Technical Co-Sponsored by IEEE UK/RI Computer Chapter 103

Contribute to depletion of natural
environment
0% 3% 27.3% 54.5% 15.2% 3.81 4
Flexibility in construction
0% 0% 12.1% 54.5% 33.3% 4.21 2
Require more space for construction
activities
0% 15.2% 15.2% 54.5% 15.2% 3.76 5
Minimise cost of construction
0% 0% 12.1% 54.5% 33.3% 4.21 2
Ease of adaptation 0% 3% 15.2% 45.5% 36.4% 4.15 3
TABLE IV. ANALYSIS ON FACTORS DETERMINING LEVEL OF REFERENCE FOR TRADITIONAL CONSTRUCTION
Factors
Level of preference
Mea
n sc
ore
Ran
king
Les
s pr
efer
red
Som
ewha
t pr
efer
red
Hig
hly
pref
erre
d
Simplicity of construction
3% 45.5% 51.5% 2.48 1
Minimise materials wastage
30.3% 27.3% 42.4% 2.12 6
Contribute to depletion of
natural environment
15.2% 51.5% 33.3% 2.18 5
Flexibility in construction
3% 48.5% 48.5% 2.45 2
Require more space for construction
ti iti
21.2% 57.6% 21.2% 2 7
Minimise cost of construction
6.1% 48.5% 45.5% 2.39 3
Ease of adaptation
12.1% 51.5% 36.4% 2.24 4
2) Extent to which ‘’Concurrent Engineering” supportsSustainability enhancement in building construction
Perceptions of General Building contractors in South Africa were sought on the use of concurrent engineering construction methods for housing projects. Table V presents the summary of descriptive statistical analysis on the extent to which the “concurrent engineering” influences sustainable housing construction.
The results in Table V shows that approximately 94% of the respondents (with a mean score value of 4.48) ranked reduction in cost of construction as the most important factor for using concurrent engineering methods in construction of affordable housing.
TABLE V. SA GENERAL BUILDING CONTRACTORS’ PERCEPTION OF CONCURRENT ENGINEERING CONSTRUCTION
METHOD ON SUSTAINABILITY IN HOUSING DELIVERY
Factors
Rating scale
Mea
n sc
ore
Ran
king
Extr
emel
y no
t im
port
ant
Not
im
port
ant
Indi
ffere
nt
Impo
rtan
t
Extr
emel
y im
port
ant
Promote integration of two or more construction methods
3% 3% 15.2% 33.3% 45.5% 4.15 3
Eliminate materials wastages
3% 3% 6% 48.5% 39.4% 4.18 2
Enhance construction
speed
6.1% 0% 6.1% 57.6% 30.3% 4.06 5
Flexibility in
construction
3% 3% 9.1% 69.7% 15.2% 3.90 6
Increase quality
0% 0% 21.2% 45.5% 33.3% 4.12 4
Minimise use of space
for construction
3% 3% 24.2% 45.5% 24.2% 3.84 7
Minimise construction
expenses
3% 0% 3% 33.3% 60.6% 4.48 1
Similarly, 88% of the respondents perceived elimination of materials wastages as the 2nd most important factor, having a mean score of 4.18 and integration of two or more construction method was ranked 3rd based on the results of analysis; 79% of respondents rate the variable as important with mean score of 4.15. Other factors were perceived by over 50% of the respondents as equally important in chosen concurrent engineering for housing projects. The results in Table VI shows that approximately 73% of respondents prefer using concurrent engineering as housing construction method due to the high level affinity of the method to eliminate materials wastage during construction (mean score of 2.66). This factor was ranked 1st and 61% and 58% of the respondents prefer concurrent engineering due to integration of two or more construction methods into the construction process and construction cost minimisation respectively. These two factors have the same mean score value of 2.54 hence they were both ranked 2nd while ‘’increase in quality” of housing product ranked 3rd with a mean score of 2.51.
It is worth noting that the results of the analysis have clearly shown that ensuring sustainability in the housing construction process is greatly enhanced through the use of concurrent engineering as method of construction which is evident from its ability to minimise cost, eliminate material wastage and the integration of two or more construction methods among other factors that were rated to have strong influence as shown in Table V and Table VI.
World Congress on Sustainable Technologies (WCST-2015)
Copyright © 2015 Technical Co-Sponsored by IEEE UK/RI Computer Chapter 104

TABLE VI. ANALYSIS ON FACTORS DETERMINING LEVEL OF REFERENCE FOR CONCURRENT ENGINEERING
Factors
Level of preference
Mea
n sc
ore
Ran
king
Les
s pr
efer
red
Som
ewha
t pr
efer
red
Hig
hly
pref
erre
d
Promote integration of two or more construction methods 6.1% 33.3% 60.6% 2.54 2 Eliminate materials wastages 6.1% 21.2% 72.7% 2.66 1 Enhance construction speed 3% 45.5% 51.5% 2.48 4
Flexibility in construction 3% 63.6% 33.3% 2.30 5 Increase quality 0% 48.5% 51.5% 2.51 3 Minimise use of space for construction 15.2% 45.5% 39.4% 2.24 6 Minimise construction expenses 3% 39.4% 57.6% 2.54 2
3) Extent to which ‘’Modular Construction” supportssustainability enhancement in building construction
Perceptions of General Building contractors in South Africa were sought on the use of Modular construction methods for housing projects. Table VII presents a summary of the descriptive statistical analysis on the extent to which ‘Modular construction” influences sustainable housing construction. The results in Table VII show that approximately 94% of the respondents with a mean score value of 4.60 rated reductions in duration for construction as the most important factors upon which modular construction is used for affordable housing construction. Conversely, 88% of the respondents perceived elimination of material wastages as the 2nd most important factor, having a mean score of 4.45 and minimizing construction cost was ranked 3rd based on the results of analysis which shows an overwhelming support by 94% of respondents and a mean score of 4.39.
Other factors were perceived by over 50% of the respondents as important in chosen modular construction for housing projects, though approximately 15% - 30% of respondents choose ‘’indifferent” option. The results in Table VIII show that approximately 76% of respondents prefer to use modular construction method due to high level attraction to reduce production period, eliminate materials wastage during construction, reduction in cost of construction and prevention of pollution. These factors thus have mean score of 2.72, 2.57 and 2.54 respectively; hence the factors were ranked 1st, 2nd and 3rd. Conclusively, the results of analysis have clearly shown that ensuring sustainability in housing construction process is
somewhat enhanced through the use of modular construction methods, as evident from its ability to eliminate material wastage, faster production rates and reduction in the use of non-renewable materials among other factors shown in Table VII and Table VIII.
TABLE VII. SA GENERAL BUILDING CONTRACTOR’S PERCEPTION OF MODULAR CONSTRUCTION ON SUSTAINABILITY
IN HOUSING DELIVERY
Factors
Rating scale
Mea
n sc
ore
Ran
king
Extr
emel
y no
t im
port
ant
Not
impo
rtan
t
Indi
ffere
nt
Impo
rtan
t
Extr
emel
y im
port
ant
Rigidity in construction
3% 3% 27.3% 24.2% 42.4% 4 7
Avoid materials wastages
0% 3.0% 9.1% 27.3% 60.6% 4.45 2
Reduce use of non-renewable materials
0% 0% 12.1% 54.5% 33.3% 4.21 4
Optimise building design
0% 3% 9.1% 57.6% 30.3% 4.15 5
Minimise use of space
during
0% 9.1% 27.3% 48.5% 15.2% 3.69 9
Minimise cost of
construction
0% 0% 6.1% 48.5% 45.5% 4.39 3
Improve quality of
output
0% 0% 18.2% 54.5% 27.3% 4.09 6
Prevent pollution
0% 0% 27.3% 45.5% 27.3% 4 8
Reduce construction
time
0% 0% 6.1% 27.3% 66.7% 4.60 1
TABLE VIII: ANALYSIS ON FACTORS DETERMINING LEVEL OF REFERENCE FOR MODULAR CONSTRUCTION
Factors
Level of preference
Mea
n sc
ore
Ran
ldng
Les
s pr
efer
red
Som
ewha
t pr
efer
red
Hig
hly
pref
erre
d
Rigidity in construction
15.2% 24.2% 60.6% 2.45 4
Avoid materials wastages
9.1% 24.2% 66.7% 2.57 2
Reduce use of non-renewable
materials
9.1% 51.5% 39.4% 2.30 7
World Congress on Sustainable Technologies (WCST-2015)
Copyright © 2015 Technical Co-Sponsored by IEEE UK/RI Computer Chapter 105

Optimise building design
3% 48.5% 48.5% 2.45 5
Minimise use of space during construction
9.1% 60.6% 30.3% 2.21 8
Minimise cost of construction
9.1% 27.3% 63.6% 2.54 3
Improve quality of output
9.1% 42.4% 48.5% 2.39 6
Prevent pollution 9.1% 27.3% 63.6% 2.54 3
Reduce construction time
3% 21.2% 75.8% 2.72 1
4) Extent to which “Lean concept” support sustainabilityenhancement in building construction
Table IX and Table X present a summary of the descriptive analysis on the extent to which the “Lean construction concept” influences sustainable housing construction. The results in Table IX show the perception of the respondents as follows; 100%, 97% and 94% of the respondents viewed; elimination of materials wastages, construction cost minimisation and minimise negative impact of construction on the environment as important and extremely important. These factor have mean score value of 4.54, 4.51 and 4.45 respectively, thereby ranking them 1st, 2nd and 3rd. However, to ensure correct judgement on the perception of the respondents on these factors, opinion on the level of preference to usage of lean construction concepts using the factors as a basis was determined and the results in Table X shows that approximately 82%, 76% and 67% of the respondents highly prefer lean construction concept due to the elimination of materials wastages, construction cost minimisation and minimise negative impact of construction on the environment respectively.
Respondents’ perception on other factors reveals that lean concept is somewhat preferred as evident in the results. The value placed on these factors is evident from the mean score values of 2.78, 2.75 and 2.6. Thus the variables were ranked 1st, 2nd and 3rd among the factors that influenced respondents’ choice of lean construction concept for housing projects. The results of the analysis of factors that influence respondents’ preference of lean construction concept further confirms that lean concepts have a great influence on construction of sustainable housing development.
TABLE IX: FACTORS THAT INFLUENCE GENERAL BUILDING CONTRACTOR ON CHOICE OF LEAN CONSTRUCTION CONCEPT
FOR HOUSING PROJECT
Factors
Rating scale
Mea
n sc
ore
Ran
king
Ext
rem
ely
not
impo
rtan
t
Not
im
port
ant
Indi
ffere
nt
Impo
rtan
t
Extr
emel
y im
port
ant
Minimise negative
impact on the
environment
0% 0% 6.1% 42.4% 51.5% 4.45 3
Avoid materials wastages
0% 0% 0% 45.5% 54.5% 4.54 1
Improve quality of
output
0% 0% 9.1% 51.5% 39.4% 4.30 4
Enhance flexibility in construction
0% 3% 9.1% 42.4% 45.5% 4.30 5
Minimise use of space
during construction
0% 9.1% 12.1% 51.5% 27.3% 3.96 7
Minimise cost of
construction
0% 0% 3% 42.4% 54.5% 4.51 2
Ease of adaptation
0% 0% 18.2% 54.5% 27.3% 4.09 6
TABLE X: ANALYSIS OF PREFERENCE ON THE FACTORS TOWARDS USE OF LEAN CONCEPT
Factors
Level of preference
Mea
n sc
ore
Ran
ldng
Les
s pr
efer
red
Som
ewha
t pr
efer
red
Hig
hly
pref
erre
d
Minimise 3% 30.3 66.7% 2.63 3 negative impact
on the environment
%
Avoid materials 3% 15.2 81.8% 2.78 1 wastages %
Improve quality 3% 36.4 60.6% 2.57 4 of output %
Enhance 6.1% 36.4 57.6% 2.51 5 flexibility in construction
%
Minimise use of 3% 54.5 42.4% 2.39 6 space during construction
%
Minimise cost of 0% 24.2 75.8% 2.75 2 construction %
Ease of 12.1% 42.4 48.5% 2.33 7 adaptation %
B. Discussions Sustainable construction is conceived to restore and
maintain harmony between the natural and built environment, while creating human settlements that affirms human dignity and encourage economic equity [7]. To achieve creating sustainable settlements, adequate attention has to be given to the utilisation of building material during housing construction.
World Congress on Sustainable Technologies (WCST-2015)
Copyright © 2015 Technical Co-Sponsored by IEEE UK/RI Computer Chapter 106

Figure 1. Overall influence of identified housing construction methods on sustainability enhancement
The results of this analysis have revealed that the construction methods examined have the potential to; eliminate complexities in the housing construction process, eliminate material wastage, produce good quality housing on the one hand and minimise cost of construction on the other. Furthermore, it will promote the efficient utilisation of building materials, which negatively impacts the natural environment.
The interplay of the factors revealed in the results of analysis among the construction methods shows that the mean scores for the overall influence of each of the methods on the cost of housing are above the threshold level of 3.0, while the mean score for aggregate influence o f a l l the methods on susta inab il i ty enhancement in housing are above the threshold level of 2.5 (see Fig. 1).
IV. CONCLUSION
Sustainable construction is an opportunity to use world natural resources efficiently and effectively while creating settlements that affirms human dignity. In South Africa, the acceptance of sustainability is somewhat industry wide and acceptance of the housing produced using modular construction material and method have in most case been rejected by the target users. The paper thus suggests use of more than one construction methods for housing projects in developing countries since the merit of one method could overshadow the demerit of the second method.
ACKNOWLEDGEMENT The authors acknowledged the Cape Peninsula
University of Technology (CPUT) Research Directorate for proving financial support through University Research Fund (URF) award to undertake this study.
REFERENCES [1] P.O. Akadiri, Development of a multi-criteria approach for the
selection of sustainable materials for Building Projects. Unpublished PhD Thesis University of Wolverhampton, Wolverhampton UK 2011.
[2] A. Bryman, Social Research Methods, Fourth edition, Oxford
University Press: New York, 2012. [3] J.W. Creswell, Research design: qualitative, quantitative and
mixed method approaches. 3rd edition, Los Angeles, Sage, 2009. [4] W.I. De Villiers, W.P. Boshoff, A. Van Noordwyk, C. Brewis,
and J. Brits, Full Life Cycle Analysis of Environmental Impact of Low-Income Housing in South Africa, Proceedings of the Sothern African Housing Foundation International Conference and Housing Award, September 2013, held at Cape Town, South Africa.
[5] A. De Villiers, Comparative analysis of innovative technology and conventional technology in low income building, Proceedings of the Sothern African Housing Foundation International Conference and Housing Award, September 2011, held at Cape Town, South Africa
[6] S. Dlodlo, Community Building Co-operatives: An empowering skills development and cost effective alternative approach in low-cost Housing Delivery, Proceedings of the Sothern African Housing Foundation International Conference and Housing Award, September 2011, held at Cape Town, South Africa
[7] C. du Plessis, A strategic framework for sustainable construction in developing countries. Construction Management and Economics, Vol 25: Taylor & Francis, 2007, Pg 67–76.
[8] J.A. Fapohunda, innovations towards efficient construction resources optimal utilisation in the construction industry – A review. Journal of Construction, Vol. 7 (2): ASOCSA, 2014 Pg 51 – 60.
[9] A.B. Idrus, and J.B. Newman, Construction related factors influencing the choice of concrete floor systems. Construction Management and Economics, volume 20: Taylor & Francis, 2002, Pg 13–19
[10] R. Jimoh, and J.J. Van Wyk, Co-operative Housing as an Instrument for Delivery in South Africa, Proceedings of the Sothern African Housing Foundation International Conference and Housing Award, September 2010, held at Cape Town, South Africa
[11] R. Takim, A. Akintoye, and J. Kelly, Analysis of measures of construction project success in Malaysia. In: Khosrowshahi, F (Ed.), 20th Annual ARCOM Conference, 1-3 September 2004, Heriot Watt University. Association of Researchers in Construction Management, Vol. 2, Pg 1123 – 1133.
[12] K. Tissington, A Resources Guide to Housing in South Africa 1994 – 2010: Legislation, Policy, Programmes and Practice. Socio-economic rights institute of South Africa (SERI), Johannesburg, 2011.
[13] UN-Habitat, Housing Finance System in South Africa: The Human Settlement Finance Systems Series, available on www.unhabitat.org. Kenya Nairobi, 2008
[14] UN-Habitat, Sustainable housing for sustainable cities: A policy framework for Developing Countries. United Nations Human Settlement Programme (UN-Habitat), available on www.unhabitat.org. Kenya Nairobi, 2012.
[15] J. Zuma, Address of the President of the Republic of South Africa on Freedom Day at Tshwane, 27th April 2010.
World Congress on Sustainable Technologies (WCST-2015)
Copyright © 2015 Technical Co-Sponsored by IEEE UK/RI Computer Chapter 107
Data Centre Energy EfficiencyNabil Hadj-Ahmed
School of Computing and Creative Teachnology Leeds Beckett University
Leeds, UK
Colin Pattinson School of Computing and Creative Teachnology
Leeds Beckett University Leeds, UK
Abstract— A data centre is an important component in any organisation as it plays a key role in its growth and success; it has become the most popular cost-effective platform for hosting large scale applications. While more data centres are being implemented and existing facilities are continuously expanding in order to meet the so ever increasing demand, the global network of data centres has become similar to the electricity grid, yet the comparison fails dramatically when it comes to the matter of energy efficiency and cost. Data centres incur frightening costs and in some case spiral out control as regards to power consumption and cooling. An efficient method for saving energy in data centres is to dynamically adjust the data centre compute capacity resources. Nonetheless, this is a challenging solution as it will require thorough understanding of the hosted applications, the resource demand characteristics and the impact on the service level agreement (SLA). In this paper, we investigate the possibility of providing an intelligent control mechanism that manages compute resource capacity dynamically which reduces data centre energy while meeting the performance requirements by means of simulation and extensive analysis using Google’s trace workload real data, we will demonstrate how our proposed approach can achieve significant energy savings while meeting the performance requirements
Energy Efficiency; Cloud Computing; Data Centres
I. INTRODUCTION Data centres today are built based on an over provisioned
model to host a huge number and diverse cloud applications with different compute demands and performance requirements. However, when hardware is provisioned for a required application, it is always done on the basis of the requirements to satisfy peak demands, yet the peak demand only occurs for short period of time but the resources required is usually double or even triple the resources required for an average workload [6] As a result all the additional resources required to handle workload that is at peak, are required only for a short period of time, the problem is when peak load completes, most the provisioned resources run at only 5 to 10 percent utilisation leading to unnecessary cost, power consumption as well as cooling.
Research shows that, even when idle, servers consume 30 percent of the power as when running at peak capacity, the overall power consumption and cooling expenses over the life cycle of the hardware resources are significantly higher than the initial hardware cost making the over-provisioned data centre model unsustainable over time [4].
As such, not only a substantial compute power and storage are required to handle this demand, but also a significant
amount of energy to run the physical hosts and for cooling the data centre. Typically, energy consumption of data centre accounts for 12% of the monthly costs , if we put that into perspective, reducing the energy cost for a company like Google by 3% equates to more than a million dollars.
In order to accommodate for the growth in demand for computing resources, adding more power and cooling capacity to existing data centres or build new data centres is required. However both of these options are extremely expensive, not practical and will also increase carbon emission footprint. Hence, improving energy efficiency has become a paramount necessity for data centres.
Extensive research work has been carried out in recent years to try to improve energy efficiency in data centres. A wide range of approaches have been investigated to resolve the en-ergy consumption issues, and it includes power distribution systems control, load balancing algorithms, cooling systems, virtualisation , and computer hardware.
II. RELATED WORK
One of the most favourable solutions to reduce data centres energy is dynamic resource capacity management based mainly on dynamically switching on and off data centre virtual machines. For example reference [12] have proposed a solution for load dispatching and dynamic VM provisioning in a Windows live messenger servers cluster on the basis of time dependency of the TCP connections and users
In this research we use a cloud based simulation based on the Google trace in order to explore new techniques and ideas to control data energy use more efficiently and hence reduce energy consumption without having a negative impact on data centre operations performance.
III. WORKLOAD ANALYSIS
To address and the resolve the challenges of energy efficiency by means of dynamic capacity management, a detailed understanding of the workload behaviour and dynamic resource requirements is very important, thus we have carried out the analysis of the google cluster trace.
On November 29, 2011 Google released a production compute cluster trace of 11,000 machines [5] containing a 29 days cell information. The workload trace which is highly anonymous in terms of job identity contains resource demand, scheduling events as well as usage records for about 25,462,157 tasks spread over 672,003 jobs. On job submission, a user has the ability to specify the resource demand (CPU, memory and disk capacity). Each job consists of one more task
World Congress on Sustainable Technologies (WCST-2015)
Copyright © 2015 Technical Co-Sponsored by IEEE UK/RI Computer Chapter 108

containing many processes that are scheduled on a single physical machine. During execution, the consumption of each type of resource is measured by the usage of a task. The google trace data contains the task usage and demand for CPU, memory and disk capacity recorded at 5 minutes intervals.
In order to justify the approach to resolve the energy efficiency issues, the google workload dataset was analysed [11].
IV. SYSTEM ARCHITECTUREThe planned solution architecture is illustrated in the figure
below.
Proposed System Architecture
The planned solution architecture comprises the following components:
• The tasks controller: This module is responsible forcontrolling the number of VMs required based on the predicted usage. • The scheduler: Responsible for allocating tasks toVMs and reporting on the number of tasks in the queue in order for the controller to make the correct allocations. • The dynamic capacity management: Responsible forselecting the VMs that need to be removed, added or reconfigured based on the status information collected form the controller to satisfy the required CPU and memory usage, it then provides the controller with the list of live VMs. • The Prediction and monitoring: Collects memory andCPU usage statistics and makes an informed prediction of the future usage.
Different resource allocation schemes are used for different schedulers, nonetheless the resource usage for each task might be much lower than the demand and task allocation will adjust dynamically according to the task usage [7].
Similarly, same approach is used in this research as the Google cluster schedulers behave in the same way. Specifically, Google schedulers deliberately over commit resources on each VM [11], all the VMs in the Google cluster are considered to be homogenous with similar capacities.
V. CONCLUSION AND FUTURE WORK Data centres are of a paramount importance for hosting
large cloud infrastructures with high energy consumption to meet the ever growing demand. This has not only increased data centres operational costs but also increased the carbon footprint significantly. The aim if this research is to alleviate these concerns by introducing an intelligent capacity resources management system that dynamically manages the number of active VMs and provision resources according to two key elements: (1) Performance outcome due to resource configuration on VMs and (2) Resource demand variation over time. This approach is based on finding the ultimate balance between switching off or reconfiguring VMs and the impact on performance and achieving the required targets by the system. As seen from the analysis of the Google workload trace, a lot can be achieved towards this goal by investigating and introducing different algorithms to have efficient scheduling capability.
REFERENCES [1] Bash, C., Patel, C., and Sharma, R., 2006. Dynamic thermal
management of air cooled data centers. In IEEE Intersociety Conference on the Thermal and Thermomechanical Phenomena in Electronics Systems (ITHERM).
[2] Chen, G., He, W., Liu, J., Nath, S., Rigas, L., Xiao, L., and Zhao, F., 2008. Energy-aware server provisioning and load dispatching for connection-intensive Internet services. In USENIX Symposium on Networked Systems Design and Implementation (NSDI).
[3] Fu, Y., Lu, C., and Wang, H., 2010. Robust control-theoretic thermal balancing for server clusters. In IEEE International Symposium on Parallel Distributed Processing (IPDPS).
[4] Gandhi, A., Harchol-Balter, M., Das,R., Lefurgy,C., 2009. ‘Optimal power allocation in server farms’, Proceedings of the 11th International Joint Conference on Measurement and Modeling of Computer Systems, ACM, New York, NY, USA, pp. 157–168.
[5] Google(n.d) Googleclusterdata - traces of google workloads - Reference [Internet] Available from: <http://code.google.com/p/googleclusterdata/.> [Accessed 05/05/2015]
[6] Gulati, A., Holler, A., Ji, M., Shanmuganathan, G., Waldspurger, C., and Zhu, X., 2012. VMware distributed resource management: Design, implementation, and lessons learned. In VMware Technical Journal.
[7] Shen, Z., Subbiah, S., Gu, X. and Wilkes, J. Cloudscale: Elastic resource scaling for multi-tenant cloud systems. In Proceedings of the ACM Symposium on Cloud Computing, 2011.
[8] Raghavendra, R., Ranganathan, P., Talwar, V., Wang, Z., and Zhu, X. 2008. No power struggles: Coordinated multi-level power management for the data center. In ACM SIGARCH Computer Architecture News, volume 36. ACM.
[9] Reiss, C. Tumanov, A., Ganger, R., Katz, H., Kozuch,M.A. “Heterogeneity and Dynamicity of Clouds at Scale:Google Trace Analysis,” in: Proceedings of the Third ACM Symposium on Cloud Computing, ACM, 2012
[10] von Laszewski,G., Wang, L., Younge,A., and He,X., 2009. Power-aware scheduling of virtual machines in DVFS-enabled clusters. In IEEE International Conference on Cluster Computing and Workshops (CLUSTER).
[11] Zhang, Q., Hellerstein, J., and Boutaba, R., 2012. Dynamic Energy-Aware Capacity Provisioning for Cloud Computing Environments. ICAC’12, September 18–20, 2012, San Jose, California, USA.
[12] Bodenstein, C., Schryen, G., & Neumann, 2012. 'Energy-aware workload management models for operation cost reduction in data centers', European Journal Of Operational Research, 222, 1, pp. 157-167
World Congress on Sustainable Technologies (WCST-2015)
Copyright © 2015 Technical Co-Sponsored by IEEE UK/RI Computer Chapter 109

A Low Cost Functional Electrical Stimulation (FES) System for Essential Tremor Suppression
Using off the Shelf Components
Awais Shafique Hooriya Anam Muhammad Arsalan Javed
School of Electrical Engineering School of Electrical Engineering School of Electrical Engineering
and Computer Science, and Computer Science, and Computer Science,
National University of Sciences and Technology. National University of National University of
Islamabad, Pakistan. Sciences and Technology. Sciences and Technology.
Email:[email protected] Islamabad, Pakistan. Islamabad, Pakistan.
Abstract— Essential tremor (ET) is one of the most common
movement disorders that causes a rhythmic trembling of the hands, head, voice, legs or trunk. Currently, no medication is specifically designed to treat ET, However, some solutions exist to temporarily suppress tremor. This paper presents a novel low cost alternative to the existing solutions, known as Functional Electrical Stimulation (FES) and its comparison with existing solutions. The paper focuses on the development of a low cost FES circuit with Inertial Measurement Unit (IMU) feedback using off the shelf components which sends out-of-phase electrical pulses to suppress tremor.
Keywords- functional electrical stimulation; essential tremor; tremor acquisition and minimization; feedback control; DC-DC buck converter
I. INTRODUCTION
Essential Tremor is a neurological disorder which causes involuntary rhythmic shaking of particular parts of human body. The pathological form of tremor can cause impaired motor performance owing to high amplitude oscillations of body parts ranging from 3-12Hz. [1] Essential tremor is the most common movement disorder, affecting up to 10 million people in the U.S and Millions other people worldwide. Although the disorder can occur at any age but most often, it occurs during adolescence or in middle age (between ages 40 and 50). In most cases, this disorder gets worse with age and a point may come in the patient’s life when he is unable to eat by himself, drink or in extreme cases, even speak. This continuous involuntary motion makes the patient’s life difficult, if not impossible. As stated by a patient herself, “The greatest fear for Essential Tremor patients is losing their independence”. Even after such medical advancement, the true cause of Essential Tremor is still not understood completely. The origin of the tremor is considered to be the thalamus region of the human brain which causes the abnormal electrical brain activity and this abnormal electrical brain activity is responsible for the loss of muscle control.
Genetics is thought to be responsible for causing ET in half of the patients. This form is referred to as familial tremor. A child with parents having ET, has up to 50% of inheriting
the responsible gene, but may never actually experience symptoms.
A. Existing Solutions for Tremor Suppression
Figure 1. Deep Brain Stimulation
There is no cure for Essential tremor, but treatments that provide relief from its symptoms may be helpful in improving quality of life. These include drugs and surgery that ease tremor. The existing solutions of Tremor includes deep brain stimulation (DBS) (shown in Fig.1), thalamotomy, pallidotomy, mechanical loading, and robotics exoskeletons [3] .Most of these methods are invasive in nature. Particularly, the surgical complications of DBS includes intracranial hemorrhage, stroke and infection [2]. The mechanical methods are found to interfere with the voluntary movement [3] [5].
Although there is no medication specifically designed to treat Essential tremor, yet, there are several medications that can be used to treat the symptoms.
World Congress on Sustainable Technologies (WCST-2015)
Copyright © 2015 Technical Co-Sponsored by IEEE UK/RI Computer Chapter 110

Essential tremor (ET) is a major portion of the world’s Population, yet only about 50% of patients receive satisfactory benefit from the currently available medications. For patients with disabling tremor that is not adequately controlled by Pro- pranolol, Primidone, or other medications, surgical treatments may be an option.
Assistive Technology is an umbrella term that includes assistive, adaptive, and rehabilitative devices for people with disabilities. These assistive devices allow ET patients to per- form specific tasks with greater ease.
B. Proposed Solution- Functional Electrical Stimulation
In the light of such circumstances, a novel technique known as Functional Electrical Stimulation has been used for Essential Tremor Suppression. The technique has been previously employed to improve movement control in stroke and paralysis patients.
Functional Electrical Stimulation (FES) is a form of therapeutic treatment that applies transcutaneous high voltage/low electrical current to initiate contractions in muscles, and is commonly used for individuals with spinal-cord injuries (SCIs) or stroke. FES has been used to facilitate upper and lower extremity mobility, improve respiratory function, restore bowel and bladder function, and to treat and help prevent secondary complications such as muscle atrophy, spasticity, pressure ulcers, deep venous thrombosis, contractures, and bone demineralization. [6]-[8]
Most of the proposed systems have a more or less fixed design and lack an open architecture. They generally operate with preprogrammed stimulation patterns that are stored in a lookup table. Often, a single sensor combined with a control algorithm either triggers preprogrammed stimulation sequences or scales and reads the stimulation parameters out of a lookup table [10].
Various control strategies and circuit design have been developed to provide enhanced functionality, repeatability, and a wide range of stimulation parameters for FES stimulator [8] in order to provide predictability of muscle responses. In general, complicated circuitry and control method are needed for this application which, in turn, imposes designs that are bulky, expensive, and high-power consumption. This paper presents a viable solution to the problem and states its comparison with an FDA approved Electrical Muscle Stimulation devices. The required components are small and the required input voltage is low. The circuit has three degrees of digital controllability which are amplitude, pulse width, and frequency that are ideal candidates for improvement of the FES circuit.
II. PROPOSED FES CIRCUITS
Different stimulation waveforms can be used for neuromuscular stimulation depending on the application.
1) Monophasic - single phase, unidirectional pulse frombaseline to either positive OR negative, as shown inFig.2 (a). Monophasic waveforms are mostappropriate for wound healing.
Figure 2. Common stimulus output trains: (a) Monophasic (b)
Asymmetric biphasic (c) Symmetric biphasic (d) Symmetric
biphasic with interpulse interval
2) Biphasic - two phase, bidirectional wave with onepositive phase and one negative phase.
Can be symmetrical (identical phases that cancel eachother out) or asymmetrical. Different shapes forBiphasic pulses are shown in as shown in Fig. 2 (b)(c) (d).
Asymmetrical balanced biphasic waveforms may bemore useful to stimulate small muscle groups.Symmetrical biphasic waveforms are most oftenreported to be most comfortable and they pose theleast risk for skin reaction.
3) Polyphasic - bidirectional wave with three or morephases in bursts.
All waveforms are capable of activating peripheralnerves. Monophasic and symmetrical biphasicwaveforms generate greater torque with musclecontraction and are less fatiguing than polyphasicwaveforms.
The Square wave allows the frequencies to penetrate the body more efficiently at any KHz range. Square waves are considered the superior frequency to wave output for any Frequency generator device. This paper presents circuits using Monophasic Square wave pulses to reduce complexity but achieve the desired goal.
A. FES transformer Circuit
Fig. 3 shows the design schematic for a low cost, constant voltage FES circuit to Suppress Essential Tremor in the Wrist using a Transformer to step-up the voltage to a maximum of 90Vpp for Biphasic and 45Vpp for Monophasic Stimulus. The high voltage is required to reduce the Human skin resistance and allow the current to flow easily to stimulate the nerve controlling the muscles. The design contains the following 3 main modules:
World Congress on Sustainable Technologies (WCST-2015)
Copyright © 2015 Technical Co-Sponsored by IEEE UK/RI Computer Chapter 111

1) DC-DC Buck Converter - The Buck Converter along
with some switching modifications operates on a
standard 9V Duracell Alkaline Battery. The converter
has been designed using easily available electrical
components and it can step down the voltage to 2.7V
(D=30%). The design specifications for the Buck
converter are given in Table. 1.
2) Feedback and Control - Atmega328p has been used
to provide digital feedback for load regulation and
digital controllability of frequency, amplitude and
pulse width. The voltage divider R1 and R2 samples
the converter output and feeds it to the ADC of the
Atmega328p.
A smart algorithm compares the sampled voltage
with an internally stored reference voltage and
automatically changes the Duty cycle of the Control
1 signal to match the output voltage of the converter
Figure 3. FES Circuit using a Transform with a Digital Feedback system for Load Regulation
World Congress on Sustainable Technologies (WCST-2015)
Copyright © 2015 Technical Co-Sponsored by IEEE UK/RI Computer Chapter 112

to the desired reference voltage and hence providing
load regulation. The Control 2 signal controls the
pulse width and frequency by switching the Load
Switch. The Feedback from the IMU given to the
controller is used to find the frequency and amplitude
of the Tremor signal and then controls the output of
the FES circuit by varying Control 1 and 2.
(b)
Figure 4. Simulated Output Waveforms of FES Circuit across
500Ω
3) Load Switch and Transformer- the Load switch is a
combination of N channel and P channel MOSfets.
The transformer used is a commercially available 12-
0-12V 300mA AC Transformer. The transformer
steps up the voltage to a maximum of 82.5V (Duty
Cycle=1, Vin for transformer= 9V). The high voltage
is required to reduce the human skin resistance.
Table II: Cost Analysis of the FES Circuit using a
Transformer.
(a)
(b)
Figure 5. Output Waveforms of EM41 on Human Skin
Resistance
The output waveforms for the constant voltage FES circuit
across a 500Ω load are shown in Fig. 4(a). The outputs show
that with a Duty cycle of D=60% for the Control 1, the output
of the Buck Converter is 5.4V, as shown in Fig. 4(b).The
Components Unit Price Quantity Total
Axial Inductor 4.7mH, 3A 17 1 17 Polar Capacitor 1000µF,
50V12 1 12
J6079N N-Channel MOSFET
15 2 30 IRF9540 P-Channel
MOSFET45 2 90
10kΩ, 10 W Resistor 13 2 26 1N4007 1000V 1A Diode 2 2 4 12-0-12V AC Transformer 95 1 95
15KΩ 2W 5% 4 1 4 2.2kΩ 2W 5% Resistor 4 1 4 470Ω 2W 5% Resistor 4 1 4
ATMEGA328P-PU 300 1 300 Total (PKR) Rs. 586 Total (USD) USD. 5.61
World Congress on Sustainable Technologies (WCST-2015)
Copyright © 2015 Technical Co-Sponsored by IEEE UK/RI Computer Chapter 113

voltage across the load is stepped up by the transformer to
49.5V with a pulse width of 250µs (for optimum muscle
stimulation), controlled by Duty cycle of Control 2,
represented by Fig. 4 (a).
A complete cost break down of the FES circuit has been
presented in Table. 2 which proves that the circuit is cost
effective and effectively solves the given problem.
B. Comparison with Beurer EM41
Beurer EM41 is an FDA approved TENS/EMS device for pain relief and muscle building, which uses a similar technique for muscle stimulation. The output specifications for the device are shown in Table. 3. RIGOL DS1052E, 50 MHz digital oscilloscope has been used for measuring output of the Beurer EM41. Fig. 5 shows that the device produces Biphasic stimulus for muscle stimulation and tests show that the device regulates its voltage across different loads.
The proposed FES circuit has been developed to match the device specification of EM41 presented in Table. 3. The proposed circuit is superior to the device and other proposed FES circuits because it has the ability to digitally regulate its output voltage and frequency automatically using the IMU feedback system. Moreover, the controller ensures the pulses are out-of-phase by sending predictive electrical pulses, based on the frequency extracted through IMU feedback, for optimum tremor suppression.
Table III: Output Specifications for Beurer EM41
Output Voltage Current Frequency Pulse Width Load
Max 90 Vp-p 180 mA p-p 1-120 Hz 40 - 250 µs 500Ω
III. CONCLUSION AND FUTURE WORKS
In conclusion, a cost effective system for suppression of essential tremor, based on electrical stimulation of nerves is proposed. An exact antiphase signal is generated in the form of monophasic square wave pulses through the novel FES technique. Owing to the bio-feedback using IMU sensors, it is ensured that the pulses perform out of phase cancellation of tremor signals.
Two parameters are of prime focus, cost effectiveness and prefabrication. The former is achieved through the non- invasiveness of the proposed procedure. For accomplishing the latter, the idea of using off the shelf components is chosen in order to ensure stability of the designed system in real time. The future works will be focused on creating a complete prototype of the ET suppression device. Further modules for the ET signal acquisition and processing are to be designed and integrated with the novel FES circuit proposed above. Moreover, the protection and charging circuitry will be incorporated to ensure ease for the ET patients. A companion smart phone application with the device is also under development to keep the patient in the loop and to store patient’s data over cloud to assist the doctors.
REFERENCES
[1] Strahinja Dosen, Silvia Muceli, Jakob Lund Dideriksen, Juan Pablo Romero, Eduardo Rocon, Jose Pons, and Dario Farina, “Online Tremor
Suppression Using Electromyography and Low-Level Electrical Stimula- tion”,2014
[2] Alok Sharma, PhD; Kaylene Szeto, PharmD; Alicia R Desilets PharmD CGP, “Efficacy and Safety of Deep Brain Stimulation as an Adjunct to Pharmacotherapy for the Treatment of Parkinson Disease, The Annals of Pharmacotherapy”. 2012; 46(2):248-254.
[3] ] E. Rocon, J. M. Belda-Lois, A. F. Ruiz, M. Manto, J. C. Moreno, and J.L. Pons, “Design and validation of a rehabilitation robotic exoskeleton for tremor assessment and suppression,” IEEE Trans. Neural Syst. Rehabil. Eng., Sep. 2007.
[4] “National Institute of Neurological Disorders and Stroke”, National Institute of Health, Bethesda, July 2012, updated July 6, 2015
[5] E. Rocon, J. . Gallego, J. M. Belda-Lois, J. Benito-Len, and J. Luis Pons, “Biomechanical loading as an alternative treatment for tremor: A review of two approaches,” Tremor Other Hyperkinet. Mov. , Jan. 2012.
[6] D. Graupe and K. H. Kohn, “Transcutaneous functional neuromuscular stimulation of certain traumatic complete thoracic paraplegics for inde- pendent short-distance ambulation”, Neurolog. Res., vol. 19, pp.323-333, June 1997.
[7] G. M. Yarkony, E. J. Roth, G. Cybulski, and R. J. Jaeger, “Neuromuscular stimulation in spinal cord injury II: Prevention of secondary complica- tions,” Arch. Phys Med. Rehab., vol. 73, pp. 195-200.
[8] J. O. Teeter, C. Kantor, and D. Brown, Functional Electrical Stimulation (FES) Resource Guide for Persons With Spinal Cord Injury or Multiple Sclerosis. Cleveland, OH: Cleveland FES Center, 1995.
[9] M. H. Grant, J. F. Keating, A. C. B. Smith, M. Delargy, and B. J. Andrews, “The use of functional electrical stimulation to assist gait in patients with incomplete spinal cord injury,” Disability Rehab., vol. 14, pp.93-97, 1992.
[10] J. J. Abbas, “Feedback control of coronal plane hip angle in para- plegic subjects using functional neuromuscular stimulation,” IEEE Trans.Biomed.Eng.,vol.38,pp.687698,1991.
World Congress on Sustainable Technologies (WCST-2015)
Copyright © 2015 Technical Co-Sponsored by IEEE UK/RI Computer Chapter 114

Session 4: Sustainability
Sustainable Water and Energy Use for Irrigation Demands (Author: Bojan Durin)
Development of a Mobile Application for Home Energy Management in Smart Grids (Authors: Imane L’hadi, Mohammed Bakr Sikal, Sarah Lahtani, Ahmed Khallaayoun, Rachid Lghoul)
Home Composter: Domestic Use Composter(Authors: Nithika Sailesh, Vikas Shinde)
World Congress on Sustainable Technologies (WCST-2015)
Copyright © 2015 Technical Co-Sponsored by IEEE UK/RI Computer Chapter 115

Sustainable Water and Energy Use for Irrigation Demands
Bojan Đurin University of Zagreb
Faculty of Geotechnical Engineering Varaždin, Croatia
Abstract— System approach and sustainable use of water and energy in all kinds of human activities is not required for financial reasons only. It is also a legal and community obligation. The paper deals with the application of Critical Period Method for irrigation system design. Irrigation system includes a Solar Photovoltaic (PV) generator and inverter, a pump station, a water reservoir and pipelines. PV energy is used as energy source for the pump station. Groundwater in combination with rainwater is used for irrigation water demands. This is in accordance with the world and European legislation, directives and strategies related to the negative impacts of climate changes and greenhouse gas emissions.
Keywords-water, energy, solar photovoltaic water pumping, irrigation, climate changes
I. INTRODUCTION Water supply is of great importance for the sustainability of
both urban and rural areas throughout the world. Given the negative climate changes, increasing and more frequent pollution of groundwater and surface water, and reducing volumes of available sources of fossil fuels, which today is used extensively as a source of energy, sustainable use of water and energy by itself becomes imperative.
Legal provisions contained in a number of guidelines and accompanying regulations also contribute to such reasoning. An important segment of sustainable urban and rural areas is the use of water and energy for irrigation of green areas, grass sports fields, gardens, orchards, nursery-gardens, etc. The primary task of a water supply system is to ensure adequate quality and quantity of water for the needs of both population and industry. However, other segments of water uses including irrigation should not be ignored.
In comparison to all other renewable energy sources (RES), solar photovoltaic (PV) energy is the most suitable form for various uses in water supply ([1-7] and many others). The irrigation system analyzed includes a Solar Photovoltaic (PV) generator and inverter, a pump station, a water reservoir and pipelines. PV energy is used as energy source for the pump station to supply the reservoir with water. The water from the reservoir is dispatched to a grass lawn via the pipelines.
Regardless of the existing technology and methodology of using PV system in the water supply system, the viability of such systems ([1-7] and many others) has been studied recently. The elaborated sizing procedure using the Method of Worst Month, [5], has been improved in [2], using the original and innovative designed Critical Period Method. In doing so, each part of the water supply system is separately sized with respect to its corresponding critical day/period of the year. The Critical Period Method will be modified for application in irrigation for it involves certain specific characteristics which affect the relationships of all parts of the system. This will be described in the case of irrigation of a local football club pitch on location near Varaždin in Croatia. For irrigation water demands, groundwater is used in combination with rainwater.
II. CONCEPT AND DESCRIPTION OF THE OBSERVED SYSTEM
This paper analyses two variants of an autonomous water supply system using PV energy to drive the pump station which pumps the water into the water reservoir; Variant I and Variant II, (see Fig. 1), which uses solar batteries.
Figure 1. Schematic representation of the observed irrigation system variants (Variants I and II)
World Congress on Sustainable Technologies (WCST-2015)
Copyright © 2015 Technical Co-Sponsored by IEEE UK/RI Computer Chapter 116
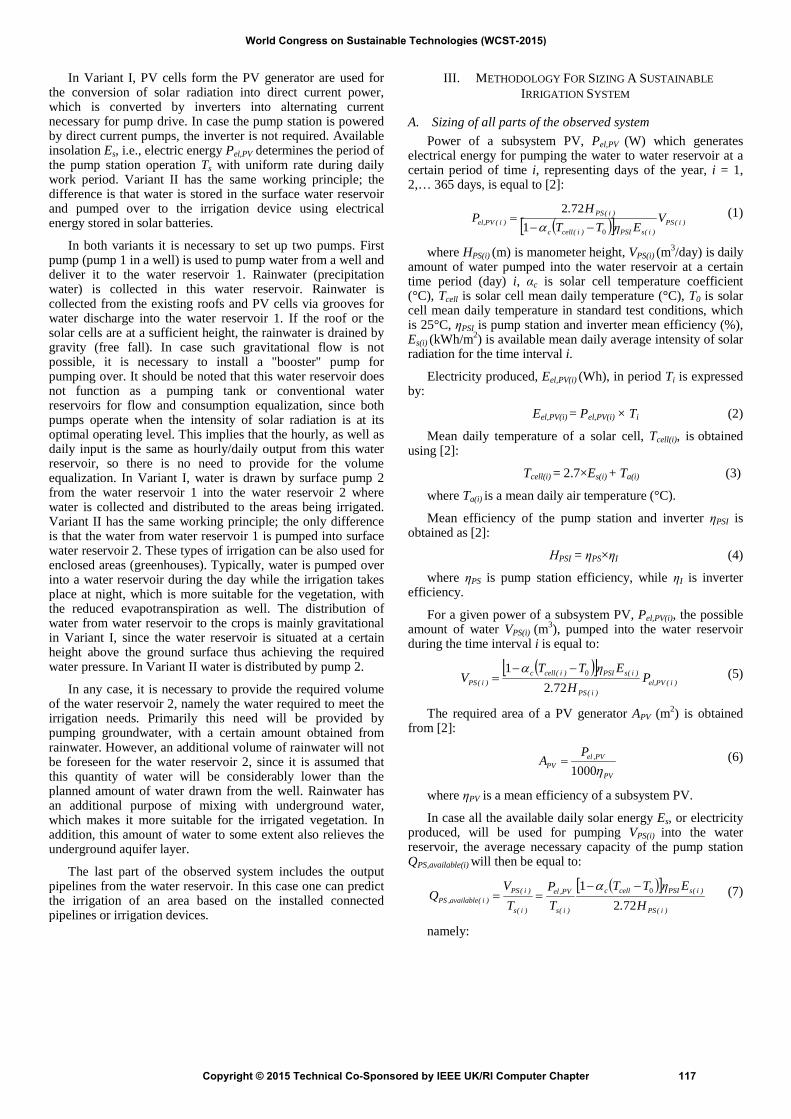
In Variant I, PV cells form the PV generator are used for the conversion of solar radiation into direct current power, which is converted by inverters into alternating current necessary for pump drive. In case the pump station is powered by direct current pumps, the inverter is not required. Available insolation Es, i.e., electric energy Pel,PV determines the period of the pump station operation Ts with uniform rate during daily work period. Variant II has the same working principle; the difference is that water is stored in the surface water reservoir and pumped over to the irrigation device using electrical energy stored in solar batteries.
In both variants it is necessary to set up two pumps. First pump (pump 1 in a well) is used to pump water from a well and deliver it to the water reservoir 1. Rainwater (precipitation water) is collected in this water reservoir. Rainwater is collected from the existing roofs and PV cells via grooves for water discharge into the water reservoir 1. If the roof or the solar cells are at a sufficient height, the rainwater is drained by gravity (free fall). In case such gravitational flow is not possible, it is necessary to install a "booster" pump for pumping over. It should be noted that this water reservoir does not function as a pumping tank or conventional water reservoirs for flow and consumption equalization, since both pumps operate when the intensity of solar radiation is at its optimal operating level. This implies that the hourly, as well as daily input is the same as hourly/daily output from this water reservoir, so there is no need to provide for the volume equalization. In Variant I, water is drawn by surface pump 2 from the water reservoir 1 into the water reservoir 2 where water is collected and distributed to the areas being irrigated. Variant II has the same working principle; the only difference is that the water from water reservoir 1 is pumped into surface water reservoir 2. These types of irrigation can be also used for enclosed areas (greenhouses). Typically, water is pumped over into a water reservoir during the day while the irrigation takes place at night, which is more suitable for the vegetation, with the reduced evapotranspiration as well. The distribution of water from water reservoir to the crops is mainly gravitational in Variant I, since the water reservoir is situated at a certain height above the ground surface thus achieving the required water pressure. In Variant II water is distributed by pump 2.
In any case, it is necessary to provide the required volume of the water reservoir 2, namely the water required to meet the irrigation needs. Primarily this need will be provided by pumping groundwater, with a certain amount obtained from rainwater. However, an additional volume of rainwater will not be foreseen for the water reservoir 2, since it is assumed that this quantity of water will be considerably lower than the planned amount of water drawn from the well. Rainwater has an additional purpose of mixing with underground water, which makes it more suitable for the irrigated vegetation. In addition, this amount of water to some extent also relieves the underground aquifer layer.
The last part of the observed system includes the output pipelines from the water reservoir. In this case one can predict the irrigation of an area based on the installed connected pipelines or irrigation devices.
III. METHODOLOGY FOR SIZING A SUSTAINABLEIRRIGATION SYSTEM
A. Sizing of all parts of the observed system Power of a subsystem PV, Pel,PV (W) which generates
electrical energy for pumping the water to water reservoir at a certain period of time i, representing days of the year, i = 1, 2,… 365 days, is equal to [2]:
( )[ ] )i(PS
)i(sPSI)i(cellc
)i(PS)i(PVel, V
EηTTH.
P01
722−−
=α
(1)
where HPS(i) (m) is manometer height, VPS(i) (m3/day) is daily amount of water pumped into the water reservoir at a certain time period (day) i, αc is solar cell temperature coefficient (°C), Tcell is solar cell mean daily temperature (°C), T0 is solar cell mean daily temperature in standard test conditions, which is 25°C, ηPSI is pump station and inverter mean efficiency (%), Es(i) (kWh/m2) is available mean daily average intensity of solar radiation for the time interval i.
Electricity produced, Eel,PV(i) (Wh), in period Ti is expressed by:
Eel,PV(i) = Pel,PV(i) × Ti (2)
Mean daily temperature of a solar cell, Tcell(i), is obtained using [2]:
Tcell(i) = 2.7×Es(i) + Ta(i) (3)
where Ta(i) is a mean daily air temperature (°C).
Mean efficiency of the pump station and inverter ηPSI is obtained as [2]:
ΗPSI = ηPS×ηI (4)
where ηPS is pump station efficiency, while ηI is inverter efficiency.
For a given power of a subsystem PV, Pel,PV(i), the possible amount of water VPS(i) (m3), pumped into the water reservoir during the time interval i is equal to:
( )[ ])i(PVel,
)i(PS
)i(sPSI)i(cellc)i(PS P
H.EηTT
V722
1 0−−=
α (5)
The required area of a PV generator APV (m2) is obtained from [2]:
PV
PV,elPV
PA
η1000= (6)
where ηPV is a mean efficiency of a subsystem PV.
In case all the available daily solar energy Es, or electricity produced, will be used for pumping VPS(i) into the water reservoir, the average necessary capacity of the pump station QPS,available(i) will then be equal to:
( )[ ])i(PS
)i(sPSIcellc
)i(s
PV,el
)i(s
)i(PS)i(available,PS H.
EηTTTP
TV
Q722
1 0−−==
α (7)
namely:
World Congress on Sustainable Technologies (WCST-2015)
Copyright © 2015 Technical Co-Sponsored by IEEE UK/RI Computer Chapter 117

)i(available,PSPS QmaxQ ≥ (8)
Ts is the daily number of peak sun hours or usable duration of insolation, which is obtained by the [5]:
1000s
sET = (9)
The number of peak sun hours is merely an estimation of the amount of time per day that the irradiance is equal to a peak Sun, and because PV models are rated for their output under peak sun conditions, the number of daily peak sun hours indicates how many hours of each day the PV array will operate at its full power output.
However, if all water quantity VPS(i) does not necessarily need to be pumped over, namely if the water quantity VPS(i) is greater than the required amount of water for the population needs Vdaily(i), then minimal average required pump capacity QCS,needed(i) is equal to:
)i(s
)i(daily)i(needed,PS T
VQ = (10)
Since the purpose of the pump is pumping (lifting) water into the water reservoir, the required capacity *
PSQ is:
( ))i(needed,PS*PS QmaxQ = (11)
Average power of the pump station *PSP is then:
PS
PS*PS*
PS ηHρgQP = (12)
where ηPS is average efficiency of the pump station.
Water reservoirs are typically sized for one-day water equalization of supply and consumption for a day with maximum consumption, but equalization can also be done for more days, up to seven. Operating volume of the water reservoir Vop(i) is defined for each day in a year by method of integral curve, i.e. Ripley method [2]:
( )
−= ∑
=
24
1t)t(hour)t(PS)i(op QQmaxV (13)
where t = 1, 2,…, 24 h.
Equation (13) applies if within a period of t = 1 hour up to 24 hours (one day) the water inflow of the water reservoir is the same as water outfall from the water reservoir. It is a simple methodology based on the fact that within the period of exchange, which can be the period of one up to seven days, all the water inflow is the same as the outfall from the reservoir.
Size, or the capacity of the solar battery CB (Ah) is obtained using the formula, taken and adapted from [5]:
b
Bsys
PV,elB t
VDODE
C ×××
=η
(14)
whereby the depth of the discharge DOD of the solar battery (%), Vsys is the system voltage (V), ηB is the solar battery efficiency and tb is the balancing period (days).
B. Critical Period Method In this paper we used the approach based on critical design
period, whereby the Critical Period Method was devised [2]. This approach includes design elements of the solution: PV generator, pump station and water reservoir based on the critical period of operation of each one. It is also a conservative approach, meaning that the elements of the solution are potentially overdesigned. However, such an approach provides a reliable solution and a required level of reliability, necessary for the functioning of water supply systems. The reliability of the bulk water supply system can be defined in terms of reliability of its storage reservoir/tank, as consumers will only notice a service interruption if the storage tank has failed (i.e., run dry).
The balancing period of water pumping and water reservoir water balance is usually at least one day and may be several days, usually no more than five, (tb = 1 till 5 days). A longer balance period reduces the uncertainty of solar irradiation and increases the reliability of the solution. With a longer balancing period, the system is more cost-effective from the perspective of solar energy harvesting, because the sum of overall available solar radiation is greater when the balancing period is longer. This means that the required water volume can be pumped with lower installed PV system power Pel,PV. Normally, with a longer balancing period, the storage capacity of the reservoir Vop will be higher.
At the beginning of the analysis it is necessary to define the daily quantity of water for irrigation purpose Vdaily (m3/day), according to the vegetation characteristics and water consumption regime throughout the analyzed months of the planning period. After this, the daily water usage pattern Vdaily,t (m3/h) in the period of t = 1, 2,…, 24 hours is determined (diurnal pattern). It is assumed that the same pattern is used for each day and throughout the analyzed months.
Based on the obtained values, the minimum required size of the PV system is determined, which provides the necessary inflow of water in the critical period. Based on the selected/calculated initial values, Pel,PV and VPS, which satisfy water demand Vdaily in the planning period, the minimum required Pel,PV is determined from established differences ΔVtb,i:
i,tb,dailyi,tb,PSi,tb VVV −=∆ (15)
The critical day/period *i,tb,PV,Pelt for PV generator design is
determined by the minimum daily difference using statistical minimization:
*
, , , ,min tb i Pel PV tb iV t∆ ⇒ (16)
where ∆Vtb,i is an acceptable difference in practice application which is typically equal to 0.
The required operation volume of water reservoir 2, Vop, is obtained using the (13). Time step for calculation is one hour, t = 1, 2…, 24 hours. In general, the critical day/period for the design of volume reservoir *
i,tb,Vt is the day with maximum water demand and the shortest duration of solar radiation suitable for pump station operation, providing that on the available day insolation Es(i) is sufficiently high. A critical
World Congress on Sustainable Technologies (WCST-2015)
Copyright © 2015 Technical Co-Sponsored by IEEE UK/RI Computer Chapter 118

day/period for the pump station *i,tb,PSt also coincides with this
critical day. It should be noted that the fire volume is not taken into account for this case, because in this case there are water needs only for irrigation. Also, it is not foreseen to provide additional volume of water reservoirs for emergency situations since it is meant irrigation. Based on the above mentioned, the required volume *
opV for each alternative tb is obtained using statistical maximization, with the associated critical day:
,max*op op iV V≥ => *
i,tb,Vt (17)
The same situation applies to the capacity of pump stations:
PS*PS QmaxQ ≥ => *
i,tb,PSt (18)
Daily quantity of water for irrigation purpose Vdaily (m3/day) is obtained to the most part by pumping groundwater and to a lesser extent from rainwater. Due to stochastic nature of the rain, the safest option is providing backup volume of water
reservoir 1 of a same volume as the quantity of collected rainwater. At the same time this size represents the additional quantity of water for emergency situations.
IV. CASE STUDY, RESULTS AND DISCUSSION
A. Location The described methodology of sizing the irrigation system
will be illustrated on the example of pitch irrigation for the local football club Obreš, located near Varaždin on the territory of Sveti Ilija municipality (see Fig. 2), [8]. The football pitch covers the area of 105 x 70 m. The altitude of the location is 173 m asl. The above mentioned figure shows the position of all elements of the analyzed system for variants I and II. According to the recommendations from bibliography [6] and the position of the available area, the azimuth (angle spread) of the PV generator is in the south direction, while the angle of inclination is equal to 15°.
Figure 2. Irrigation system layout scheme
Groundwater, which is situated in shallow layers at a depth of 5 m, is used for irrigation, and the usage of the existing well showed that its capacity is sufficient. Another favorable fact is that the location is situated in the area of rich Varaždin aquifer. Since the biggest problems include the impracticality of the existing irrigation system with rubber hoses, unsustainable water and energy consumption, as well as insufficient capacity of the existing lifting pump in the well, there is a plan to build a new, more modern and sustainable irrigation system.
B. Input data According to the recommendations from the bibliography
[9] and the actual needs, the adopted daily constant water need (consumption) Vdaily from May to August, and within these 4 months amounts to 30 m3. The football pitch is not irrigated during other periods of the year. There are two daily regimes of water consumption, i.e. water inflow and outfall (input/output) of water reservoir (see Fig. 3).
World Congress on Sustainable Technologies (WCST-2015)
Copyright © 2015 Technical Co-Sponsored by IEEE UK/RI Computer Chapter 119
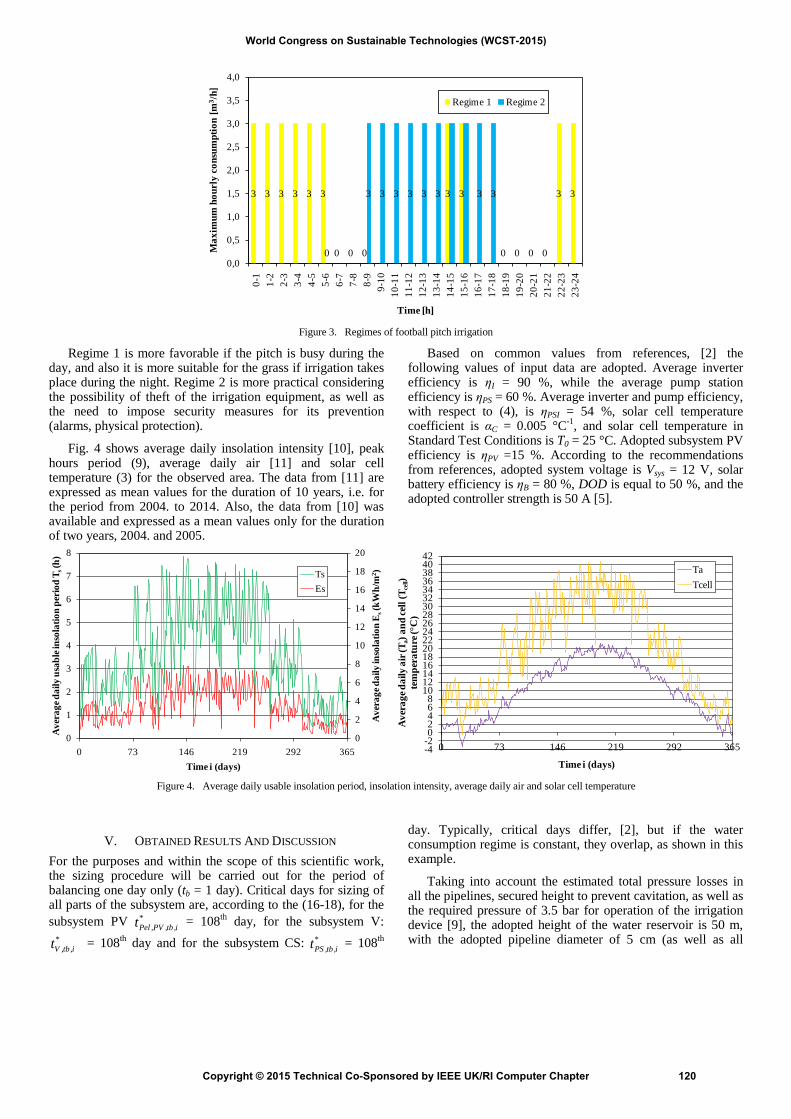
3 3 3 3 3 3
0 0 0
3 3
0 0 0 0
3 3
0
3 3 3 3 3 3 3 3
0,0
0,5
1,0
1,5
2,0
2,5
3,0
3,5
4,0
0-1
1-2
2-3
3-4
4-5
5-6
6-7
7-8
8-9
9-10
10-1
111
-12
12-1
313
-14
14-1
515
-16
16-1
717
-18
18-1
919
-20
20-2
121
-22
22-2
323
-24
Max
imum
hou
rly
cons
umpt
ion
[m3 /
h]
Time [h]
Regime 1 Regime 2
Figure 3. Regimes of football pitch irrigation
Regime 1 is more favorable if the pitch is busy during the day, and also it is more suitable for the grass if irrigation takes place during the night. Regime 2 is more practical considering the possibility of theft of the irrigation equipment, as well as the need to impose security measures for its prevention (alarms, physical protection).
Fig. 4 shows average daily insolation intensity [10], peak hours period (9), average daily air [11] and solar cell temperature (3) for the observed area. The data from [11] are expressed as mean values for the duration of 10 years, i.e. for the period from 2004. to 2014. Also, the data from [10] was available and expressed as a mean values only for the duration of two years, 2004. and 2005.
Based on common values from references, [2] the following values of input data are adopted. Average inverter efficiency is ηI = 90 %, while the average pump station efficiency is ηPS = 60 %. Average inverter and pump efficiency, with respect to (4), is ηPSI = 54 %, solar cell temperature coefficient is αC = 0.005 °C-1, and solar cell temperature in Standard Test Conditions is T0 = 25 °C. Adopted subsystem PV efficiency is ηPV =15 %. According to the recommendations from references, adopted system voltage is Vsys = 12 V, solar battery efficiency is ηB = 80 %, DOD is equal to 50 %, and the adopted controller strength is 50 A [5].
0
2
4
6
8
10
12
14
16
18
20
0
1
2
3
4
5
6
7
8
0 73 146 219 292 365
Ave
rage
dai
ly in
sola
tion
Es(k
Wh/
m2 )
Ave
rage
dai
ly u
sabl
e ins
olat
ion
peri
od T
s(h
)
Time i (days)
TsEs
-4-202468
1012141618202224262830323436384042
0 73 146 219 292 365
Ave
rage
dai
ly a
ir (T
a) an
d ce
ll (T
cell)
tem
pera
ture
(°C
)
Time i (days)
TaTcell
Figure 4. Average daily usable insolation period, insolation intensity, average daily air and solar cell temperature
V. OBTAINED RESULTS AND DISCUSSION For the purposes and within the scope of this scientific work, the sizing procedure will be carried out for the period of balancing one day only (tb = 1 day). Critical days for sizing of all parts of the subsystem are, according to the (16-18), for the subsystem PV *
i,tb,PV,Pelt = 108th day, for the subsystem V: *
i,tb,Vt = 108th day and for the subsystem CS: *i,tb,PSt = 108th
day. Typically, critical days differ, [2], but if the water consumption regime is constant, they overlap, as shown in this example.
Taking into account the estimated total pressure losses in all the pipelines, secured height to prevent cavitation, as well as the required pressure of 3.5 bar for operation of the irrigation device [9], the adopted height of the water reservoir is 50 m, with the adopted pipeline diameter of 5 cm (as well as all
World Congress on Sustainable Technologies (WCST-2015)
Copyright © 2015 Technical Co-Sponsored by IEEE UK/RI Computer Chapter 120
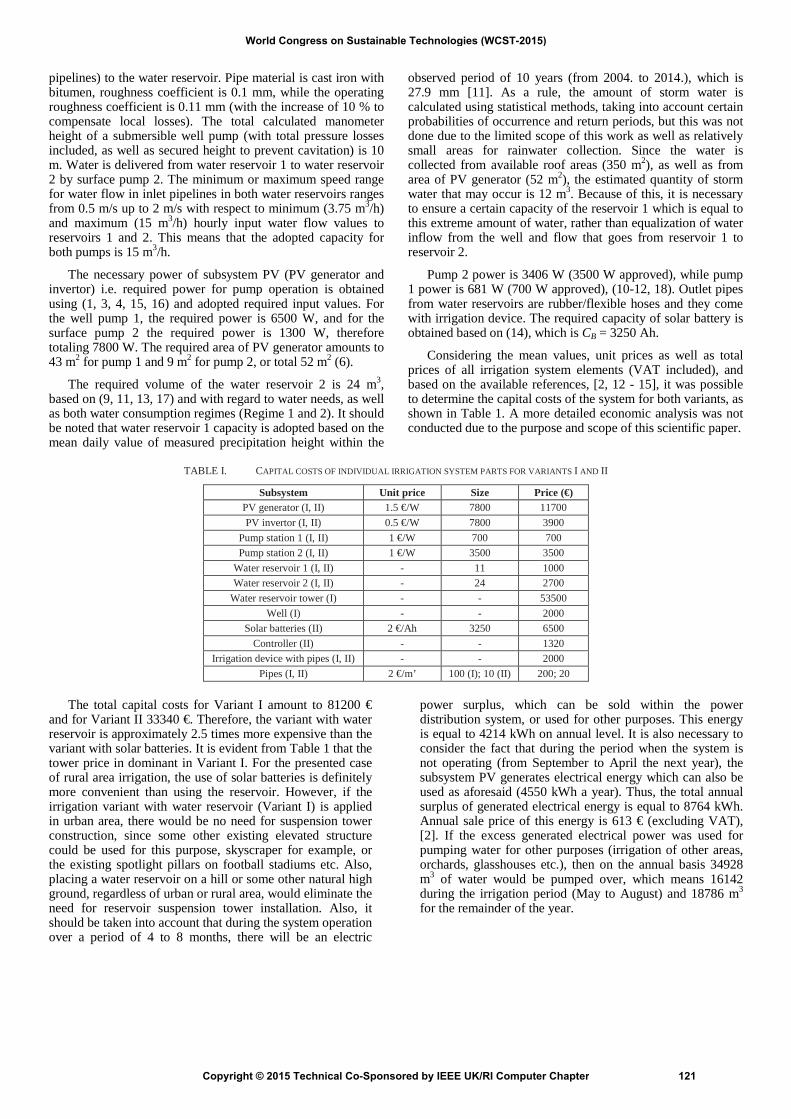
pipelines) to the water reservoir. Pipe material is cast iron with bitumen, roughness coefficient is 0.1 mm, while the operating roughness coefficient is 0.11 mm (with the increase of 10 % to compensate local losses). The total calculated manometer height of a submersible well pump (with total pressure losses included, as well as secured height to prevent cavitation) is 10 m. Water is delivered from water reservoir 1 to water reservoir 2 by surface pump 2. The minimum or maximum speed range for water flow in inlet pipelines in both water reservoirs ranges from 0.5 m/s up to 2 m/s with respect to minimum (3.75 m3/h) and maximum (15 m3/h) hourly input water flow values to reservoirs 1 and 2. This means that the adopted capacity for both pumps is 15 m3/h.
The necessary power of subsystem PV (PV generator and invertor) i.e. required power for pump operation is obtained using (1, 3, 4, 15, 16) and adopted required input values. For the well pump 1, the required power is 6500 W, and for the surface pump 2 the required power is 1300 W, therefore totaling 7800 W. The required area of PV generator amounts to 43 m2 for pump 1 and 9 m2 for pump 2, or total 52 m2 (6).
The required volume of the water reservoir 2 is 24 m3, based on (9, 11, 13, 17) and with regard to water needs, as well as both water consumption regimes (Regime 1 and 2). It should be noted that water reservoir 1 capacity is adopted based on the mean daily value of measured precipitation height within the
observed period of 10 years (from 2004. to 2014.), which is 27.9 mm [11]. As a rule, the amount of storm water is calculated using statistical methods, taking into account certain probabilities of occurrence and return periods, but this was not done due to the limited scope of this work as well as relatively small areas for rainwater collection. Since the water is collected from available roof areas (350 m2), as well as from area of PV generator (52 m2), the estimated quantity of storm water that may occur is 12 m3. Because of this, it is necessary to ensure a certain capacity of the reservoir 1 which is equal to this extreme amount of water, rather than equalization of water inflow from the well and flow that goes from reservoir 1 to reservoir 2.
Pump 2 power is 3406 W (3500 W approved), while pump 1 power is 681 W (700 W approved), (10-12, 18). Outlet pipes from water reservoirs are rubber/flexible hoses and they come with irrigation device. The required capacity of solar battery is obtained based on (14), which is CB = 3250 Ah.
Considering the mean values, unit prices as well as total prices of all irrigation system elements (VAT included), and based on the available references, [2, 12 - 15], it was possible to determine the capital costs of the system for both variants, as shown in Table 1. A more detailed economic analysis was not conducted due to the purpose and scope of this scientific paper.
TABLE I. CAPITAL COSTS OF INDIVIDUAL IRRIGATION SYSTEM PARTS FOR VARIANTS I AND II
Subsystem Unit price Size Price (€) PV generator (I, II) 1.5 €/W 7800 11700 PV invertor (I, II) 0.5 €/W 7800 3900
Pump station 1 (I, II) 1 €/W 700 700 Pump station 2 (I, II) 1 €/W 3500 3500
Water reservoir 1 (I, II) - 11 1000 Water reservoir 2 (I, II) - 24 2700
Water reservoir tower (I) - - 53500 Well (I) - - 2000
Solar batteries (II) 2 €/Ah 3250 6500 Controller (II) - - 1320
Irrigation device with pipes (I, II) - - 2000 Pipes (I, II) 2 €/m’ 100 (I); 10 (II) 200; 20
The total capital costs for Variant I amount to 81200 € and for Variant II 33340 €. Therefore, the variant with water reservoir is approximately 2.5 times more expensive than the variant with solar batteries. It is evident from Table 1 that the tower price in dominant in Variant I. For the presented case of rural area irrigation, the use of solar batteries is definitely more convenient than using the reservoir. However, if the irrigation variant with water reservoir (Variant I) is applied in urban area, there would be no need for suspension tower construction, since some other existing elevated structure could be used for this purpose, skyscraper for example, or the existing spotlight pillars on football stadiums etc. Also, placing a water reservoir on a hill or some other natural high ground, regardless of urban or rural area, would eliminate the need for reservoir suspension tower installation. Also, it should be taken into account that during the system operation over a period of 4 to 8 months, there will be an electric
power surplus, which can be sold within the power distribution system, or used for other purposes. This energy is equal to 4214 kWh on annual level. It is also necessary to consider the fact that during the period when the system is not operating (from September to April the next year), the subsystem PV generates electrical energy which can also be used as aforesaid (4550 kWh a year). Thus, the total annual surplus of generated electrical energy is equal to 8764 kWh. Annual sale price of this energy is 613 € (excluding VAT), [2]. If the excess generated electrical power was used for pumping water for other purposes (irrigation of other areas, orchards, glasshouses etc.), then on the annual basis 34928 m3 of water would be pumped over, which means 16142 during the irrigation period (May to August) and 18786 m3 for the remainder of the year.
World Congress on Sustainable Technologies (WCST-2015)
Copyright © 2015 Technical Co-Sponsored by IEEE UK/RI Computer Chapter 121

VI. CONCLUSIONS
The analysis, although simplified due to the scope and the purpose of this work, gives a realistic insight into the possibility of systemic utilization of water and energy in a rural area. The displayed conceptual solution for playground irrigation of a local football club can be applied for urban areas as well, on a local as well as regional scale. The resulting solution is conservatively selected/sized enabling high reliability of irrigation system. It also allows the use of surplus generated electricity for other purposes (lighting, operation of various electrical devices) or for sale within the electricity network. The application of the methodology described above is resulting in more rational sizing of the entire irrigation system i.e. in achieving the sustainability of systematic use of water and energy. The above statement can be read in terms of the selection of water consumption parameters/quantities and energy production, which are given as mean values in a small scale (daily, instead of monthly, as it is usually done). An important fact is that cloudy sky or precipitations do not present a big problem since irrigation is not needed in those cases. Due to small quantities of collected rainwater, in this analysis it does not replace the affected groundwater, but still ensures a certain backup volume of water. Storm water improves the quality of water used for irrigation. It is also shown that water reservoirs, apart from irrigation purposes and hydraulic function of water storage, function as energy storage as well.
This concept can also be used for irrigation of green areas for various purposes, such as orchards, gardens, farms, greenhouses and the like. If water quality is satisfactory in terms of industry or livestock requirements, the presented concept is suitable for these purposes as well. At the local level, the presented sizing methodology can be applied to the population needs, while ensuring satisfactory water quality, i.e. the procedures of raw water conditioning, and obtaining drinking water as a result. It is important to note that purified wastewater can also be used for irrigation of grass areas, especially in rural areas without significant influence of industry. The use of rainwater, which is particularly significant in volume if it is collected from bigger surfaces (roofs, eaves and similar residential/commercial buildings in urban areas, larger stadiums) satisfies the economic, environmental and social sustainability targets not only for the system analyzed, but also for its environment. This solution fits into global and European strategies and guidelines related to the reduction of greenhouse gasses, increasing the use of renewable energy sources and energy efficiency increase.
Further research would consist of more accurate determination of available quantities of storm water with regard to return periods and probability of occurrence. This would be especially evident in case of collected quantities of rainwater which could, to a larger extent, satisfy the needs for water and reduce the amount of exploited groundwater or water from some other source (natural or artificial lakes and/or water courses). There is also a plan for further sizing of the irrigation system for the balancing periods longer than one day.
REFERENCES [1] B. Boizidi, ''New sizing method of PV water pumping systems,'' Sustainable Energy Technologies and Assessments, vol. 4, pp. 1-10, 2013. [2] B. Đurin, and J. Margeta, ''Analysis of the possible use of solar photovoltaic energy in urban water supply systems,'' Water, vol. 6, pp. 1546-1561, 2014. [3] S. S. Chandel, M. Nagaraju Naik, and R. Chande, ''Review of solar photovoltaic water pumping system technology for irrigation and community drinking water supplies,'' Renewable and Sustainable Energy Reviews, vol. 49, pp. 1084-1099, 2015. [4] Y. Bakelli, A. A. Hadj, and B. Azoui, ''Optimal sizing of photovoltaic pumping system with water tank storage using LPSP concept,'' Solar Energy, vol. 85, pp. 288-294, 2011. [5] M. S. Y. Ebaid, H. Qandil, and M. Hammad, ''A unified approach for designing a photovoltaic solar system for the underground water pumping well-34 at Disi aquifer,'' Energy Conversion and Management, vol. 75, pp. 780-795, 2013. [6] A. A. Ghoneim, ''Design optimization of photovoltaic powered water pumping system,'' Energy Conversion and Management, vol. 47, pp. 1449-1463, 2006. [7] A. Hamidat, and B. Benyoucef, ''Systematic procedures for sizing photovoltaic pumping system, using water tank storage,'' Energy Policy, vol. 37, pp. 1489-1501, 2009. [8] Google map, location of Sveti Ilija, football field F.C. Obreš, https://www.google.hr/maps/@46.2510825,16.3241596,314m/data=!3m1!1e3, (Access Date: 20 July, 2015). [9] Buy Irrigation, https://buyirrigation.wordpress.com/tag/football-pitch-irrigation/, (Access Date: 28 July, 2015). [10] SODA-Solar Radiation Data-Solar Energy Services for Professionals, http://www.soda-is.com/eng/services/services_radiation_free_eng.php, (Access Date: 2 August, 2015). [11] Meteorological and Hydrological Service (MHSC), ''Meteorological and hydrological data for Varaždin from 2004. till 2014.,'' (In Croatian), MHSC: Zagreb, Croatia, 2015. [12] PVInsights, http://pvinsights.com/RetailerPrice.php, (Access Date: 11 September, 2015. [13] Pipelife, ''Price list,'' Sveta Nedelja, Croatia, 2014. [14] E. Hau, ''Wind Turbines: Fundamentals, Technologies, Application, Economics,'' 2nd edition, Springer - Verlag: Berlin, Heidelberg, 2006. [15] SolarnoHr, http://www.solarno.hr/ (Access Date: 10 September, 2015).
World Congress on Sustainable Technologies (WCST-2015)
Copyright © 2015 Technical Co-Sponsored by IEEE UK/RI Computer Chapter 122

Development of a Mobile Application for Home Energy Management in Smart Grids
Imane L’hadi, Mohammed Bakr Sikal, Sarah Lahtani, Ahmed Khallaayoun, Rachid Lghoul School of Science and Engineering Al Akhawayn University in Ifrane
Ifrane, Morocco i.l’hadi, m.sikal, s.lahtani, a.khallaayoun, [email protected]
Abstract— The current electricity grid in Morocco is facing challenges due to its conventional nature. The conventional sources of energy used are one of the major participants in pollution, and they are inefficient and unreliable in securing the national energy security. Morocco is energy dependent as it imports about 97% of its energy needs. To improve the current situation, the energy in the residential sector needs to be managed in order to reduce peak demand, protect the environment, reduce cost, avoid energy deficit, involve consumer, and efficiently use its renewable energy potential. This paper tackles the building blocks of smart grids, namely, the residential microgrid. The development of a home energy management mobile application on smart devices (phones, tablets, etc.) is presented which has as goals the establishment of a two-way flow of power and data, and the management of residual energy. In addition, the mobile application architecture and design are detailed. Methods for testing the application are suggested, and finally, algorithms for home energy demand optimization are presented as an extension of the home energy management mobile application features.
Keywords— smart grid; smart devices; renewable energies; home energy management system application.
I. INTRODUCTION As a developing country, Morocco has known a
remarkable increase in energy demand and electricity consumption. According to [1], [2] and [3], from 2002 to 2011, the energy annual consumption has increased with an average rate of 5.7% with a record of 85.9 billion dirhams (MAD) in Morocco’s gross energy bill for 2011 due to an energy consumption of 200 trillion Wh. Electricity demand has also increased in the past decade at an average rate of 7% until it has reach 28.8 trillion Wh [3], [4]. Morocco is considered the largest energy importer in North Africa with an energy dependency rate on foreign imports of 95.6% recorded in 2011 [2]. Still, the majority of the energy sources are conventional where petroleum products account for 62.9% of the energy consumption, 22.5% is covered by coal, and the remaining is covered by electricity trade (imports minus exports), natural gas and renewable energy sources (RES) [1], [4]. One of the major negative impacts of the stated energy consumption distribution is environment pollution. The current electricity grid in Morocco is not energy efficient as it is a unidirectional grid. Only one third of fuel energy is
converted into electricity knowing that the waste heat is generally not recovered. In addition, during transmission, 8% of the grid output is wasted, and 20% of its generation capacity is used to meet peak demand only [5]. Morocco, however, has a gap of improvement, which is RES. In [4] and [6], Morocco is identified to have both the potential to be a regional hub that ensures the interconnection between Europe and North Africa, and the potential to be a major renewable energy producer. According to [4] and [7], Morocco registers an average of 2300 KWh/m2 per year of solar radiance along with an immense potential for wind power found especially in the north and the south. Therefore, the question is, what does Morocco need to do in order to overcome these weaknesses and cease the available opportunities?
In the past decades, the smart grid has seen a significant interest due to environment issues, increasing fuel cost and increasing energy demand. Morocco needs to keep up with the demand, maintain the same quality, and introduce management at the demand side by changing the electricity grid into a smart one. The first step into achieving the mentioned goal consists of developing smart microgrids that constitute the building blocks of the larger smart grid. Microgrids at the residential level, for instance, need to be equipped with a management tool that consists of smart meters and an energy management system (EMS). The latter has a set of predefined key requirements, which are monitoring, disaggregation, availability and accessibility, information integration, affordability, control, cyber-security and privacy, and finally, intelligence and analytics. The EMS should provide real-time information about the energy consumption. The energy consumption of individual appliances should be available. The system should also integrate other information such as historical data and energy usage of the different appliances. The consumer should be able to access information at any time through a user-friendly interface. In addition, the EMS should be easy to install, configure and maintain while consuming minimal energy and requiring low running cost. Most importantly, the system should ensure data and control signal security as well as the privacy of the consumers’ consumption profiles. Since consumers have limited time and knowledge to make energy-
World Congress on Sustainable Technologies (WCST-2015)
Copyright © 2015 Technical Co-Sponsored by IEEE UK/RI Computer Chapter 123

related decisions, it is necessary to have an intelligent system that is able to seamlessly come up with measures that will ensure energy saving for the home owner [8].
The remainder of the paper is structured as follows: Section II introduces the management tool components, and presents the suggested EMS. In Section III, the mobile application architecture is detailed, and its design along with the suggested testing methods, are presented in Section IV. Section V introduces algorithms for home energy demand optimization, and finally, Section VI concludes the paper.
II. THE MANAGEMENT TOOL COMPONENTS
A. Smart Meters 1) Are Smart Meters Smart Enough?
As discussed earlier, fulfilling the two-way flow of data and energy is imperative in developing a residential microgrid. The latter is one of the major reasons for moving toward a smart grid and cannot be achieved without the presence of a smart meter. Thus, what is a smart meter? What does it do? Is it smart enough?
Smart meter can be defined as a digital power meter with improved communication capabilities to notify the consumers about their energy usage [9]. The smart meter is coupled with an in-home display (IHD) that informs the consumers about their whole-house power and energy consumptions, but does not provide them with enough transparency in regards to their individual appliances consumption.
In [9], a demand response (DR) example scenario is provided to show the limitations of smart meters and conclude that smart meters are not actually smart. The scenario states that a house occupant receives on his IHD a DR sign through a smart meter to notify them that they have two minutes to reduce their consumption by 5KW if they want to receive a financial incentive. The occupant checks first the IHD and finds out a current demand of 15 KW. The challenge for the occupant is to find out which appliances are consuming the 5 KW that they need to reduce. A trial and error method might be useful if the occupant turns off each appliance one at a time, and checks the displayed demand in the IHD. However, the latter is not practical within the two-minute timeframe.
Thus, from the scenario, we can say that the smart meter did not help the occupant make a decision; it just facilitated the coordination of the occupant decision-making process. The key component, therefore, that we are looking for is a meter with the intelligence that can provide the occupant with potential appliances to switch off in order to cut the consumption by 5KW. The necessary meter is a meter with a load disaggregation intelligence, which is the cognitive smart meter, or the cognitive power meter.
2) Cognitive Smart Meters and Load DisaggregationA cognitive meter is defined as a smart meter with
embedded load disaggregation intelligence [9]. In other words, a cognitive meter is a meter that informs consumers not only about their whole-house power and energy consumption, but it
also enables them to monitor every single load at the consumer side. In the scope of this paper, load disaggregation is done using the cognitive meter that plays the role of a gateway. The latter receives data about energy consumption from either smart appliances or from sensors installed in appliances. It is part of the proposed energy management system.
B. Energy Management System
1) State of the ArtThere are several EMS that fulfill some of the predefined
key requirements, but fail to provide others. Thus, the available EMSs do have different features, but also certain limitations [8]. PERSON [10] is an EMS, and it is based on the Pervasive Service-Oriented Networks. It is known for its low cost and low energy consumptions, and it offers mainly monitoring and controlling tools. However, PERSON lacks privacy and security. WattDepot [11] is an open source service-oriented framework for energy management, but it does not have any programmable or automatic control and its lacks intelligence. ViridiScope [12] is an EMS designed for “Fine-grained” monitoring of residential energy consumption. It is affordable and ensures information integration. However, its does provide neither security nor manual, programmable or intelligent appliances control. Mobile-Based Feedback System [13] is a mobile phone application that is developed to monitor and measure energy consumption of every appliance using a smart meter. In this EMS, operations are not automated and security along with remote control is not provided. DEHEMS [14] is a digital home EMS that provides feedback to consumers based on the collected user experiences and preferences. One of the DEHEMS’ limitations is the lack of security and privacy as well as control of appliances. There is another energy management mobile application named EnergyWiz [15] that provides energy consumption information and compares it with other consumers to change practices and correct behavior, but it also lacks privacy and security, appliances control, intelligence, automation of operations, and information integration. NOBEL [16] is also an EMS, but user-dependent. It supports decisions using data collected from the consumer. Also, no privacy and information integration provided. Last but not least, ALIS [17] is an Adaptive Living Interface System for monitoring, controlling and feedback. The main limitations of ALIS are in terms of affordability, intelligence, security and privacy.
2) What makes our EMS different?Relying on the fact that, in 2012, 15.6 million Moroccan
individuals aged between 6 and 74 are connected to Internet while 56% of these connected people use Internet on a daily basis [18], and inspired from the existing EMS, the proposed energy management system is a mobile application that encapsulates the predefined key requirements, and overcomes the encountered limitations. The latter is the first ring from the smart grid chain that emphasizes on peak shaving and energy saving. In other words, the proposed EMS will enable the adequate management of electricity when there is a huge demand, which will help in reducing the cost, the budget, and avoid deficit. It will enable the consumer to be conscious of his or her energy consumption. In addition, a new feature is
World Congress on Sustainable Technologies (WCST-2015)
Copyright © 2015 Technical Co-Sponsored by IEEE UK/RI Computer Chapter 124

introduced, which is the production of renewable energies. The consumer will be able to produce energy and use it while targeting an optimized load profile. The latter will help in minimizing the overall energy demand at the national level, and reducing the pollution caused by the use of conventional energy sources. The EMS will also provide the consumer with information about individual appliances and sources through a user-friendly interface that will enable monitoring and controlling at a low running cost and energy consumption. The system is designed to propose and make decisions while ensuring security and privacy of the user.
To summarize, the suggested mobile application is a tool to reduce the consumer’s electricity bill, to protect the environment through the use of RES, to involve the consumer as a producer of renewable energy, and to ensure consumption and production transparency in order to avoid any surprises in the electricity bill. The architecture of the suggested EMS is detailed in the next section.
Figure 1. EMS Architecture
III. EMS ARCHITECTURE
The purpose behind establishing the system architecture is to draw a global picture of the system, and build the connectivity between the physical layer and the information system layer. The role of the presented architecture is to provide a view of the system from different angles, and to show the flow of data, instructions, and decisions from one layer to the other. Thus, in this section, the EMS architecture is presented in Fig. 1, and a detailed explanation and a sketching of every layer are provided.
Fig. 1 shows the different components of every layer in the architecture. Within a house that is connected to the smart grid, the owner has appliances and RES that he or she wants to control and monitor using a mobile application loaded on his or her smart device (smartphone, tablet, etc.). Once the user accesses the application, a communication between the client side and the server side is established through Hypertext Transfer Protocol (Http). Any reading or writing from and in
the application is done from and in the database at the level of the information system layer.
A. Physical Layer The physical layer is basically a house model that
demonstrates the connection between the appliances, the RES, the smart grid and the smart device (mobile application). The house contains copious appliances such as light bulbs, heater, washing machine, TV and fridge along with a renewable energy source, which is in our case a PV system. The RES and the smart grid feed in the house with energy, while the RES might also inject into the grid. A gateway is inserted between the house and the smart device in order to ensure communication. The latter is split into two stages. The first stage is the home appliances/sources and the gateway communication established using Zigbee Protocol. The second stage is the communication between the gateway and the mobile application ensured using Wi-Fi. Finally, the gateway can also telecommunicate with the smart grid via all sorts of technologies (Ethernet, Wi-Max, Wi-Fi, etc.) but for the time being, in the architecture we suggest, the database could be seen as the smart grid as that is were all the decisions are made. Fig. 2 is a detailed representation of the physical layer for better understanding of the communication between the different entities.
Figure 2. Physical Layer: Components and Communication
B. Communication Layer The communication layer is the intermediary layer
between the physical layer and the information system layer in which the communication between the client side and the server side is established through Http. As shown in Fig. 3, this layer is the set of events that happens when the user opens the application. First, the application sends an Http request to the server. The latter acknowledges the request, and replies with the requested page’s source code. When the application receives the source code, it renders it to a viewable content and displays it to the user. Note that the application is a web application that is loaded through a web view in a mobile application. For example, if the user wants to view the past
World Congress on Sustainable Technologies (WCST-2015)
Copyright © 2015 Technical Co-Sponsored by IEEE UK/RI Computer Chapter 125

consumption of an appliance, in the application, an appliance menu is displayed from which the user can select “Past Consumption”. The application sends a GET Http request to the server. The server executes the Hypertext preprocessor (Php) script, which sends a Structured Query Language (SQL) query to retrieve data from the database. The server returns a Hypertext Markup Language (HTML) page containing the retrieved data to the application. Afterward, the application renders the code to a viewable content, and displays the requested past consumption.
C. Information System Layer The information system layer consists of a database that
enables the display of the requested information, and the storage of the entered information from and in the mobile application. The database is composed of classes, attributes and relationships shown in Fig. 4. The presented entity-relationship diagram (ERD) is a summary of the conducted software engineering study in which different diagrams were used (the sequence diagrams, the class diagram and the use case diagram) in order to come up with a complete database design. It models a house with rooms, smart-plugs, appliances and sources. Each appliance has consumption history, and each source has production history. The database also contains pieces of information and advice the user might be seeking.
When a new appliance is purchased and added in the application, it is stored along with its attributes in the appliance’s table. The latter is identified by the smart-plug to which it is connected. The plug is located in a specific room in the user’s house. The history of appliances’ consumption and the history of sources’ production are stored into the database regularly with a granularity chosen by the user.
Figure 3. Communication Layer: Sequence of Events
IV. IMPLEMENTATION AND TESTING OF THE EMS
A. Implementation of the EMS Initially, the EMS mobile application was implemented as
an Android mobile application. One of the limitations of this approach was the limited use of this application by only Android devices’ owners, and trying to develop an iOS version would be a redundant work and that would require mastering its native programming language. Let alone, if we consider developing also a Blackberry version, and a
Windows version. Therefore, we opted for a responsive web application that can adapt with all screen sizes. The user can, then, access the application from any mobile device, and even from a web browser. To upload the application on an Android device, we simply created an Android application in which web viewing is enabled. Fig. 6 shows snapshots from the developed web application.
B. EMS Testing Methods Once done with the implementation phase, testing comes
after as a necessary step to check the alignment of the implemented functionalities with the design and the requirements. In order to test the developed EMS, three options are available. The first one is having a real house and an existing smart grid. However this method is still unfeasible since Morocco still does not have a smart grid, and the used appliances in households are neither smart appliances nor appliances equipped with sensors and relays to be able to receive data from them and control them.
The second one is building a model house in a database and populating it with all necessary data (consumption, peak-time tariffs, etc.). This is actually the method that was initially used to test the EMS. After implementing all the functionalities, a database is constructed and populated with necessary data about appliances, sources, consumption and production from excel files built from different forums, and websites of different brands of appliances and sources. Both the application and the database are hosted in a web server. The application is loaded once the user opens the web viewing android application, and he or she can read from the database or write in it depending on the selected functionality.
The last option is building a test-bed in the laboratory containing a house model that is connected to the application through a gateway. In the proposed architecture as shown in Fig. 6, every home appliance is connected to a smart plug, which consists of an Arduino UNO, a relay box, a current sensor, and a light sensor. Each smart plug collects data from the sensors and sends it to the gateway via ZigBee, which writes it to the database via Wi-Fi. The application allows, through the “Monitoring module”, the user to consult these data. The “Control Module” can also be tested with this architecture as the gateway is constantly checking the status of the appliances and sending them to the corresponding smart plugs. After the user switches on or off an appliance through the application, its status is changed at the level of the database. The gateway detects the modification by sending HTTP requests to the database server, and sends a message to the corresponding smart plug, via Zigbee, notifying it with the new appliance’s status. The latter applies a high or low voltage on the appliance causing it to switch on or off accordingly. The laboratory test-bed is a work conducted by two other colleagues to appear in another paper.
V. TOWARD AN OPTIMAL EMS: ALGORITHMS FOR HOMEENERGY DEMAND OPTIMIZATION
Once the smart grid replaces the conventional grid, the human dimension becomes one of the major influencers of the
World Congress on Sustainable Technologies (WCST-2015)
Copyright © 2015 Technical Co-Sponsored by IEEE UK/RI Computer Chapter 126

grid efficiency, especially at the microgrid level (residential). In other words, residential users are seen as actors who play an essential role in improving the network efficiency when adopting intelligent mechanisms for energy demand management [19]. In the smart grid, huge amount of data is made accessible for the users such as appliances power consumption [20], [21] and real-time information on the economic value of energy [19]. In addition, with the distinctive feature that the smart grid is offering which is the two-way flow of electricity and information between the grid and the customers [22], users can send to the grid the consumption data of each of their appliances, and these data can be used by the mechanisms for demand load management. These mechanisms guide users in the process of decision making about their energy demand profile with the purpose of, first, reducing the electricity bill, and second, using efficiently the energy (reducing wastes) [19]. The latter aims at introducing a revolution in the social approach to electric energy with the ultimate goals of both reducing the users’ electricity bill and improving the performance of the overall energy system [19]. In order to exploit the opportunities presented through this revolution, it is necessary to use Information and Communication technologies (ICT) components along with the mechanisms of the grid. As in this paper an EMS is already developed to work as a user interface and a facilitator of the two-way flow of information and electricity, the features of the EMS could be extended to serve as a tool for home energy demand optimization. These additional features can be implemented through the use of optimization algorithms. Thus, the question to be asked is: what type of optimization algorithms would be more appropriate to satisfy this need?
The most efficient way to design the appropriate algorithm is to solve a scheduling problem [23]. Thus, over the years, several algorithms has appeared in the literature using different optimization techniques which are: linear programming (LP) [24], Particle Swarm Optimization (PSO) [25], Adaptive Dynamic Programming (ADP) [26], Artificial Neural Networks [27], Fuzzy-Logic [28], and Ant Colony Optimization [29]. Since The LP algorithm has been proven to offer the best solution with very low complexity compared to the other algorithms [23], the focus in this section will be on LP algorithm.
In [19], the authors opt for Mixed Integer LP model applied in two scenarios. First scenario is a single-user scenario in which single users manage individually their electricity demand. Thus, the LP model is designed to schedule the energy plan of a single house for the next day. In the second scenario, users are expected to cooperate in the management of their energy demand. Therefore, the energy plan is scheduled for a set of users. Since the designed EMS in this paper is build upon the first scenario, the focus would be on the single-user model only. In the considered residential scenario, the house model is a house equipped with a set of appliances to be used during the day at a specific period depending on the users preferences, solar panels that produce
energy, and batteries that enable the storage of energy. The objective function of this model is to minimize the daily energy bill while scheduling when to buy, sell and store energy, and when to power on or off the home appliances [19].
The authors in [19] used a Mixed Integer LP model as they used two types of variables. The first type of variables is binary variables to represent to state of the appliances (on/off), and the second type of variables is continuous non-negative variables to represent the amount of energy sold and bought. In order to define a time horizon, the 24-hour daytime was divided into 15 minutes time slots resulting of 96 periods represented by the set T.
A. Objective Function As mentioned earlier, the objective is to minimize the daily
electricity bill. The latter can be calculated using the difference between the costs of the total amount of energy bought and the total amount of energy sold in every one of the 96 periods. Thus, the objective function can be summarized as follows [19]:
Min Σ t ε T (ct . yt –gt . zt)
where 𝑦𝑦𝑡𝑡 and 𝑧𝑧𝑡𝑡 represent, respectively, the total amount of energy bought and sold, while 𝑐𝑐𝑡𝑡 and 𝑔𝑔𝑡𝑡 represent, respectively, the costs of bought and sold energy.
B. Constraints 1) Activity scheduling constraints: Every activity of an
appliance is associated with a start time and an end time. Thus, the constraint should ensure that an activity starts exclusively at one time slot and is carried over the specified time interval.
2) Batteries constraints: The battery can experiencethree possible modes which are charging, discharging and off. Therefore, we need to ensure that the battery is in one of the modes one at a time. In addition, battery energy at a specific time period is dependent on the energy in the battery from the previous period. Hence, another constraint is needed to explicitly express the relationship.
3) Balancing constraints: These constraints emphasize,first the balance between the consumed and the produced energy, and second, the limits imposed by the grid in terms of the maximum energy to buy from the grid. The latter should not exceed the Contractual Peak Power (CPP) limits.
In [19], the constraints equations are explained in details.
VI. CONCLUSION
A home energy management mobile application on smart devices has been developed to establish a two-way flow of power and data, and to ensure residual energy management. On of the main objective of the proposed EMS is to change the Moroccan electricity grid into a smart one in order to keep up with the demand, and benefit from the immense renewable energy potential. The path toward building a smart grid requires the establishment of microgrids. Among the latter, we can list the microgrids at the residential level, which need to be equipped with a management tool that consists of smart meters and an EMS. The mobile application has been
World Congress on Sustainable Technologies (WCST-2015)
Copyright © 2015 Technical Co-Sponsored by IEEE UK/RI Computer Chapter 127
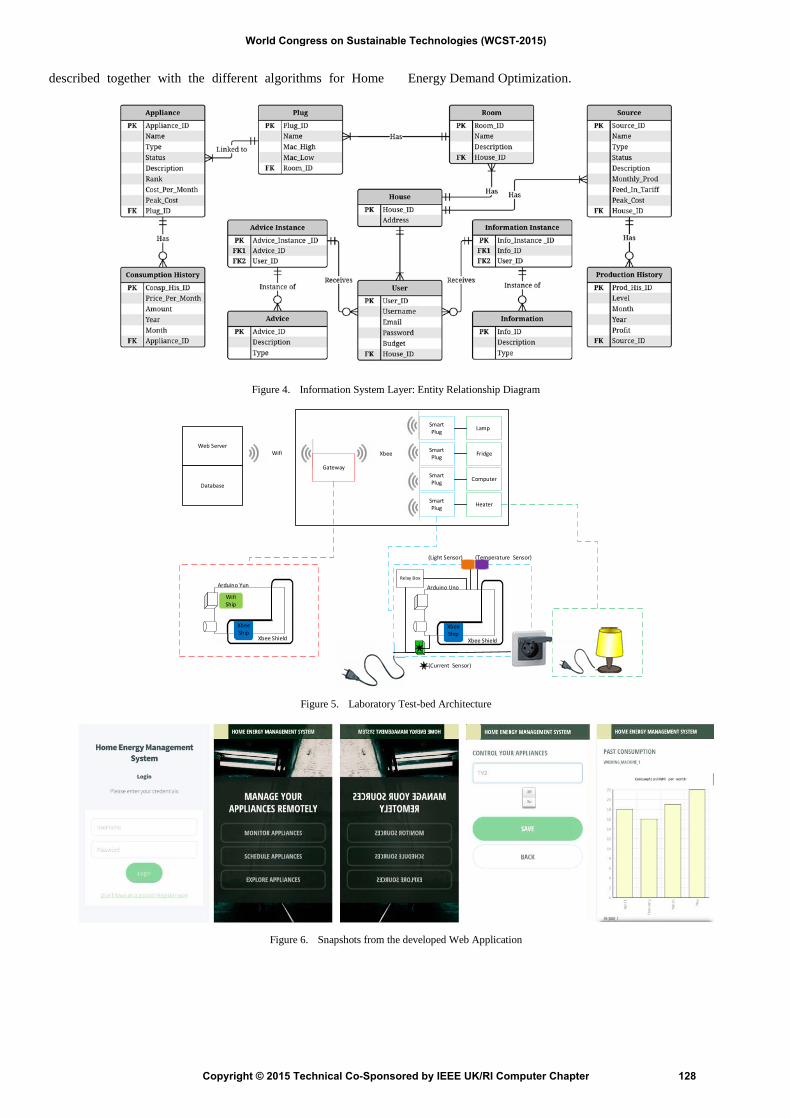
described together with the different algorithms for Home Energy Demand Optimization.
Figure 4. Information System Layer: Entity Relationship Diagram
Figure 5. Laboratory Test-bed Architecture
Figure 6. Snapshots from the developed Web Application
Lamp
Fridge
Computer
Heater
Smart Plug
Smart Plug
Smart Plug
Smart Plug
XbeeWifiWeb Server
Database
Gateway
Xbee Ship
Xbee Ship
Wifi Ship
Arduino Yun
Xbee Shield
Arduino Uno
Xbee Shield
(Light Sensor) (Temperature Sensor)
Relay Box
(Current Sensor)
World Congress on Sustainable Technologies (WCST-2015)
Copyright © 2015 Technical Co-Sponsored by IEEE UK/RI Computer Chapter 128

FUTURE WORK As far as future work is concerned, a test-bed for a smart
home is being implemented at the smart grid group. The test-bed currently consists of smart plugs using an Arduino UNO for each appliance along with a PV system that includes batteries. Optimization algorithms are also being implemented as for a purpose to reduce the consumers’ electric bill while minimizing the dependency on the grid.
ACKNOWLEDGEMENT
This work was supported by Al Akhawayn University research grant number 92872.
REFERENCES [1] MEMWE, “An overview of the energy sector in Morocco”, Ministry
of energy, Mines, Water and Environment, Morocco, 2013.[2] G. Escribano-Frances, and E. S. M. Gonzalez, “Morocco, the
European energy policy: an environmental approach”, ed. F. Morata, l.Solorio Sandoval, pp. 193-210, 2012.
[3] ONEE, “Rapport Annuel 2011”, Office National de L’Electrivité et de l’Eau Potable, Morocco, 2011.
[4] C. C. cîrlig, “Solar energy development in Morocco”, Library Briefing: Library of the European Parliament, 2013.
[5] H. Farhangi, “The Path of the Smart Grid”, IEEE Pwer & Energy Magazine, Vol. 8, pp. 18-28, 2010.
[6] IRENA, “Renewable energy country profile: Morocco”, International Renewable Energy Agency, European Union, 2010.
[7] ADEREE, “Programme d’efficacité énergétique”, National Agency for the Development of Renewable Energy and Energy Efficiency, Morocco, 2009.
[8] S. Makonin, F. Popowich and B. Gill, The cognitive power meter: looking beyond the smart meter. In CCECE ’26, pages 1-6. IEEE, 2013.
[9] S. Aman, Y.Simmhan and V.K. Prasanna, Energy management systems: state of the art and emerging trends. IEEE Communications Magazine, pp. 114-119, 2013.
[10] G. Yang and V. O. K. Li, Energy management system and Pervasive Service-Oriented Networks. IEE Smart-GridComm, 2010.
[11] R. Brewer and P. Johnson, WattDepot: an open source software ecosystem foe entreprise-scale energy data collection, storage, analysis, and visualization. IEEE SmartGridComm, 2010.
[12] Y. Kim et al., ViridiScope: design and implementation of a fine-grained power monitoring system for homes. Int’l. conf. Ubiquitous Computing, 2009.
[13] M. Weiss et al. Handy feedback: connecting smart meters with mobile phones. Proc. Int’l. Conf. Mobile and Ubiquitous Multimedia, 2009.
[14] V. Sundramoorthy et al., Domestication energy-monitoring systems: challenges and design concerns. IEEE Pervasive Computing, Vol. 10, no. 1, pp. 20-27, 2011.
[15] R. C. Medland, M. Forth and P. Petkov, Connecting people and resource consumption in real time. IEEE Pervasive Computing, Vol. 10, no. 1, pp. 63-65, 2011.
[16] S. Karnouskos, Crowdsourcing information via mobile devises as a migration enabler toward the smartgrid. IEEE SmartGridComm, 2011.
[17] L. Bartram, J. Rodgers, and K. Muise, Chasing the Negawatt: visualization for sustainable living. IEEE Computer Graphics and Applications, Vol. 30, issue 3, 2010.
[18] ARNT, “Etude sur l'usage des Technologies de l'Information et de Communication au Maroc”, Agence Nationale de Réglementation des Télécomunications, Morocco, 2012.
[19] A. Barbarto, A. Capone, M. Delfani, M. Merlo, and A. Zaminga, House energy demand optimization in single and multi-user scenarios. InSmartGridComm ’11, pp. 345-350, 2011.
[20] X. Jiang, S. Dawson-Haggerty, P. Dutta and D. Culler, Design and implementation of a high-fidelity ac metering network. In IPSN ’09, pp. 253–264. IEEE, 2009.
[21] N. Bressan, L. Bazzaco, N. Bui, P. Casari, L. Vangelista and M. Zorzi, The Deployment of a Smart Monitoring System using Wireless Sensors and Actuators Networks. In SmartGridComm ’10, pp. 49–54. IEEE, 2010.
[22] X. Fang, S. Misra, G. Xue, and D. Yang, Smart grid – the new and improved power grid: A survey. IEEE Communications Surveys and Tutorials (COMST), 14, pp. 944–980, 2012.
[23] S. Squartini, M. Boaro, F. De Angelis, D. Fuselli, and F. Piazza, Optimization algorithms for home energy resource scheduling in presence of data uncertainty. In ICICIP ‘4, pp. 323-328. IEEE, 2013.
[24] H. Morais, P. Kadar P. Faria, Z.A. Vale, and H. M. Khodr, Optimal scheduling of a renewable micro-grid in an isolated load area using mixed-integer linear programming. Renewable Energy - An International Journal, Vol 35, issue 1, pages: 151-156, 2009.
[25] N. Gudi, L. Wang, V. Devabhaktuni, and S.S.S.R.Depuru, A Demand-Side Management Simulation Platform Incorporating Optimal Management of Distributed Renewable Resources. Proceedings of Power Systems Conference and Exposition (PSCE), pp.1-7, 2011.
[26] D. Fuselli, F. De Angelis, M. Boaro, D. Liu, Q. Wei, S. Squartini, and F. Piazza, Optimal Battery Management with ADHDP in Smart Home Environments. Advances in Neural Networks - ISNN 2012, LNCS Springer, Vol 7368, 2012.
[27] Z.A. ale, P. Faria, H. Morais, H.M. Khodr, M. Silva, and P. Kadar, Scheduling Distributed Energy Resources in an Isolated Grid. An Artificial Neural Network Approach, IEEE Power and Energy Society General Meeting pp. 1-7, 2010.
[28] R. H. Liang, and J. H. Liao, A Fuzzy-Optimization Approach for Generation Scheduling with Wind and Solar Energy Systems. IEEE Transactions on Power Systems, Vol 22, Issue 4, pp. 1665-1674, 2007.
[29] C.M. Colson, M.H. Nehrir, and C. Wang, Ant colony optimization for microgrid multi-objective power management. IEEE, Electrical and Computer Engineering Department, Montana State University, Bozeman, MT, USA, 2009.
World Congress on Sustainable Technologies (WCST-2015)
Copyright © 2015 Technical Co-Sponsored by IEEE UK/RI Computer Chapter 129

Home Composter Domestic Use Composter
Nithika Sailesh
Environ-Biotech Division
Excel Industries Limited
Mumbai, India
Vikas Shinde
Environ-Biotech Division
Excel Industries Limited
Mumbai, India
Abstract — As urbanization grips the booming cities of India, the
problem of waste is rapidly becoming an enormous, vicious
repercussion. In a country as vast as India, with cities as spread
out as Mumbai, decentralization is the most effective solution for
a fast approaching waste management crisis. Treating the
household organic waste at source can help reduce the problem
of waste drastically. This paper discusses the research and
development of a home composter designed for city households,
which can manage, dispose and utilize the organic kitchen and
food waste at the source of waste generation. This automatic,
dual chamber composter ensures easy usage, easy maintenance
and user friendly interface. The output compost is free flowing,
earthy smelling and ready to use for plant application. The home
composter hence effectively replaces the kitchen waste bin with
significant value addition.
Keywords- waste management; composting; organic waste;
home composter
I. INTRODUCTION
In India, 300 to 400 grams of solid waste per person per day
is generated in a town of normal size. The figure is almost 500
to 800 grams per person per day in cities like Delhi and
Bombay [1]. Waste management and its disposal, especially in
cities is day by day becoming a massive and expensive
problem to the authorities.
In a country, where organic waste constitutes almost 35% of
the total waste, disposing off at least the household organic
waste at source, can create a positive impact in the domain of
waste disposal [1]. Further, if reused efficiently it can prove to
be a useful material.
II. BACKGROUND ART
The process of composting organic waste by the means of
in-vessel composting, wherein fertilizer in the form of compost
may be prepared, and undesirable organic kitchen waste,
including food waste can be conveniently disposed of.
Currently, problems are encountered when potential customers
are shut out of the composting technologies owing to
expensive, space consuming and complicated methods of
composting solutions offered by large vessel capacity organic
composters as opposed to what is normally required by a
domestic household. The six to eight month natural composting
process poses problems due to the consumption of time for
composting and maintenance of the composting process.
A waste free scenario as upheld by the cradle to cradle
approach of manufacturing can be mimicked to formulate
garbage to garden to utilize the organic household kitchen and
food waste.
III. PROJECT DESCRIPTION
The project aims at developing a solution to efficiently
manage, dispose and reuse the organic waste generated in the
kitchens of city households and further proposes to develop a
Home Use Domestic Composter which converts organic
kitchen waste into usable compost, a good manure for plants
and crops.
IV. OBJECTIVES
To develop an efficient in-vessel composting method
to compost organic kitchen waste and food waste
generated in city households.
To determine the quality of compost, the end product
of the proposed in vessel composting method.
To design an easy to handle and maintain home
composter to effectively encase the proposed
composting method.
V. PROCESS DESCRIPTION
Composting is the controlled aerobic biological
decomposition of organic matter into stable, humus like
product called compost. It is fundamentally the same process as
natural decomposition except that it is enhanced and
accelerated by mixing organic waste with other ingredients to
optimize microbial growth.
The organisms responsible for composting require certain
nutritional and environmental conditions to thrive and
function. They require adequate amounts of macro- and micro-
nutrients, C:N (Carbon:Nitrogen) ratio, oxygen, and water.
World Congress on Sustainable Technologies (WCST-2015)
Copyright © 2015 Technical Co-Sponsored by IEEE UK/RI Computer Chapter 130

These organisms experience optimal growth rates only within
certain temperature and pH ranges [2].
VI. IN-VESSEL COMPOSTING PARAMETERS
Table 1 summarizes the various parameters of in-vessel
composting that are followed for the proposed composting
process.
TABLE I. IN-VESSEL COMPOSTING PARAMETERS
Parameters Remarks
Temperature 40-70oC
Aeration Regular agitation
Inoculum Used Bioculum
Bioculum, a product of Excel Industries Ltd. is a mixture of
microorganism cultures that accelerate the aerobic composting
of bio degradable organic waste. It also treats the waste and
makes it free from pathogens, foul smells and weed seeds.
VII. DESIGN CRITERIA
1. Frequency of Use: The waste is input once every day; our
research indicates that owing to the busy urban lifestyle,
the output compost would be taken out probably only once
a week, on Saturdays or Sundays. The output is taken only
once in a week.
2. Easy Handling: The output compost should be in a
manageable form to avoid any inconvenience to the people
handling it. The compost can be taken out in easy to handle
trays.
3. Location: The Home Composter can either be placed in
balconies or kitchens of urban residences. In the latter
option, it can be kept inside kitchen cabinets or under
counters.
4. Size Compatibility: The dimensions of the Home
Composter would be compatible with the standard modular
kitchen dimensions followed in Indian kitchens.
5. Visual Permeability: The psychological desire to not
encounter waste within one’s kitchen or household helps
define the visual permeability parameter of the Home
Composter. The actual process of composting would be
visually invisible while the interface will provide all the
required information in an easy to comprehend manner to
the user.
6. Odour Control: The Home Composter would not give out
any odour or stink owing to any sort of waste or interior
composting conditions.
7. Acoustic Shielding: The Home Composter’s noise
limit shall be well within the permissible limits of a
home kitchen appliance.
8. Feedback System: The Home Composter shall house
a feedback system to enhance the human interaction
with the composter.
9. Aesthetic Ecosystem: As an integral part of an urban
household, the design language of the Home
Composter would be at par with the other kitchen
appliances.
A. Quantity of Waste generated
Sampling of waste generated in a household was carried
out to obtain the waste input expected for the proposed Home
Composter (see Fig. 1). Table 2 presents the data for the same.
TABLE II. DAILY WASTE GENERATION
Day 1 2 3 4 5 6 7
Waste Generated
(in grams) 820 780 695 830 805 850 868
B. Quantity Reduction of Waste
A 50% quantity reduction happens when household
organic waste is subject to the process parameters as
mentioned in Table 1. With a daily input of 1.5 kg (waste) per
day, compost output of 5 kgs is expected on every 7th
day.
C. Vessel Capacity Determination
The vessel capacity for the home composter is calculated
against the highest value of waste contained within a single
composting chamber. The density of compost is taken as 581.8
kg/cubic metre. Maximum vessel capacity required is 20 L per
composting chamber.
VIII. PRODUCT DESCRIPTION
The present invention provides a small capacity domestic
composter structure which shreds the input organic waste
before being transferred to the composting chambers.
The home composter made of moulded plastic skin with a
cylindrical body, comprising of multiple chambers; a
shredding chamber, a bio-culture mixture chamber, dual
stainless steel composting chambers and one moulded plastic
compost outlet tray.
The shredder chamber along with the shredder blade
assembly may be easily detached for regular cleaning. The lid
that covers the shredder chamber may be easily detached, or
may be opened to a complete-access position for one-handed
deposition of waste therein.
Semi cylindrical dual composting chambers selectively
receive input from the shredder chamber. Each of the dual
composting chambers is equipped with separate agitators,
powered by the motor housed above the composting
World Congress on Sustainable Technologies (WCST-2015)
Copyright © 2015 Technical Co-Sponsored by IEEE UK/RI Computer Chapter 131

chambers. The agitators would enable regular aeration of the
compost mixture. The compost chambers would be kept
heated to meet the temperature requirement of the composting
process. A mechanically enabled opening at the base controls
the output compost transferred to the compost outlet tray.
IX. CONCLUSION
In terms of industrial applicability the composter is well
suited to mass production by moulding processes and sheet
folding, cutting and welding processes and meets a longevity
requirement. The composter as well meets a long-felt domestic
need by value adding to the act of waste disposal and further,
in the long run contributes towards solving a global waste
management crisis.
REFERENCES
[1] What a Waste: A Global Review of Solid Waste Management, www.siteresources.worldbank, The Gaurdian
[2] Part 637 Environmental Engineering National Engineering Handbook, C2 Composting, February 2000.
[3] Excel Industries, http://www.excelind.co.in/Excel_ENBT/treatRange.html
Figure 1. Home Composter
World Congress on Sustainable Technologies (WCST-2015)
Copyright © 2015 Technical Co-Sponsored by IEEE UK/RI Computer Chapter 132

Session 5: Sustainability
Simulated and Real Pneumatic Plant Intelligent Controlling Via a Low Budget Interface Board (Authors: Michail Papoutsidakis, Dimitrios Piromalis, Dimitrios Tseles)
Economic Optimisation for a Building with an Integrated Micro-grid Connected to the National Grid (Authors: Phan Quang An, Michael D. Murphy, Michael C. Breen, Ted Scully)
Experimental and Numerical Simulation of Two Iranian Badgirs in the Persian Gulf, City of Kong and Laft (Authors: G. R. Dehghan-Kamaragi, B. Chanetz, A. Hocine)
Performance Evaluation of the Electro-Coagulation Treatment Process for the Removal of Total Suspended Solids and Metals from Water (Authors: Hariraj Singh, Brijesh Kumar Mishra)
Study on Impacts of Auto-Rickshaws on Fuel Consumption and Delay of Personal Vehicles (Authors: Prasenjit Adak, Suresh Pandian Elumalai, Ravi Sahu)
World Congress on Sustainable Technologies (WCST-2015)
Copyright © 2015 Technical Co-Sponsored by IEEE UK/RI Computer Chapter 133
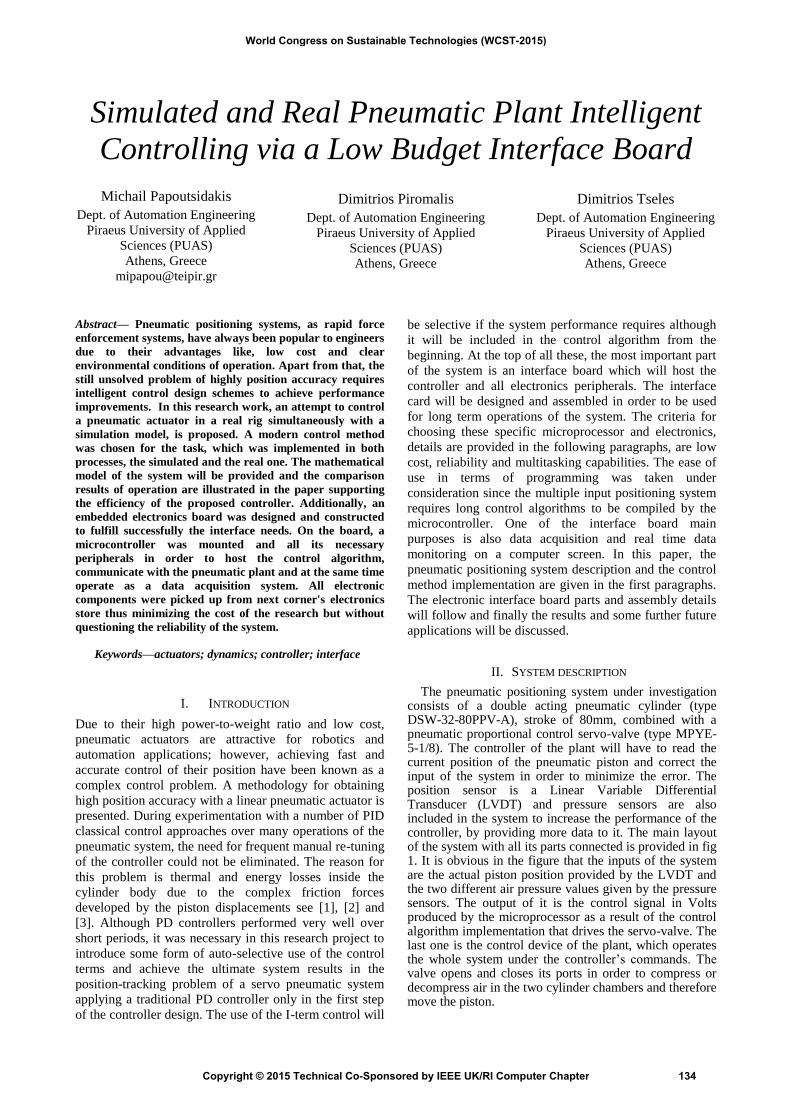
Simulated and Real Pneumatic Plant Intelligent
Controlling via a Low Budget Interface Board
Michail Papoutsidakis
Dept. of Automation Engineering
Piraeus University of Applied
Sciences (PUAS)
Athens, Greece
Dimitrios Piromalis
Dept. of Automation Engineering
Piraeus University of Applied
Sciences (PUAS)
Athens, Greece
Dimitrios Tseles
Dept. of Automation Engineering
Piraeus University of Applied
Sciences (PUAS)
Athens, Greece
Abstract— Pneumatic positioning systems, as rapid force
enforcement systems, have always been popular to engineers
due to their advantages like, low cost and clear
environmental conditions of operation. Apart from that, the
still unsolved problem of highly position accuracy requires
intelligent control design schemes to achieve performance
improvements. In this research work, an attempt to control
a pneumatic actuator in a real rig simultaneously with a
simulation model, is proposed. A modern control method
was chosen for the task, which was implemented in both
processes, the simulated and the real one. The mathematical
model of the system will be provided and the comparison
results of operation are illustrated in the paper supporting
the efficiency of the proposed controller. Additionally, an
embedded electronics board was designed and constructed
to fulfill successfully the interface needs. On the board, a
microcontroller was mounted and all its necessary
peripherals in order to host the control algorithm,
communicate with the pneumatic plant and at the same time
operate as a data acquisition system. All electronic
components were picked up from next corner's electronics
store thus minimizing the cost of the research but without
questioning the reliability of the system.
Keywords—actuators; dynamics; controller; interface
I. INTRODUCTION
Due to their high power-to-weight ratio and low cost,
pneumatic actuators are attractive for robotics and
automation applications; however, achieving fast and
accurate control of their position have been known as a
complex control problem. A methodology for obtaining
high position accuracy with a linear pneumatic actuator is
presented. During experimentation with a number of PID
classical control approaches over many operations of the
pneumatic system, the need for frequent manual re-tuning
of the controller could not be eliminated. The reason for
this problem is thermal and energy losses inside the
cylinder body due to the complex friction forces
developed by the piston displacements see [1], [2] and
[3]. Although PD controllers performed very well over
short periods, it was necessary in this research project to
introduce some form of auto-selective use of the control
terms and achieve the ultimate system results in the
position-tracking problem of a servo pneumatic system
applying a traditional PD controller only in the first step
of the controller design. The use of the I-term control will
be selective if the system performance requires although
it will be included in the control algorithm from the
beginning. At the top of all these, the most important part
of the system is an interface board which will host the
controller and all electronics peripherals. The interface
card will be designed and assembled in order to be used
for long term operations of the system. The criteria for
choosing these specific microprocessor and electronics,
details are provided in the following paragraphs, are low
cost, reliability and multitasking capabilities. The ease of
use in terms of programming was taken under
consideration since the multiple input positioning system
requires long control algorithms to be compiled by the
microcontroller. One of the interface board main
purposes is also data acquisition and real time data
monitoring on a computer screen. In this paper, the
pneumatic positioning system description and the control
method implementation are given in the first paragraphs.
The electronic interface board parts and assembly details
will follow and finally the results and some further future
applications will be discussed.
II. SYSTEM DESCRIPTION
The pneumatic positioning system under investigation consists of a double acting pneumatic cylinder (type DSW-32-80PPV-A), stroke of 80mm, combined with a pneumatic proportional control servo-valve (type MPYE-5-1/8). The controller of the plant will have to read the current position of the pneumatic piston and correct the input of the system in order to minimize the error. The position sensor is a Linear Variable Differential Transducer (LVDT) and pressure sensors are also included in the system to increase the performance of the controller, by providing more data to it. The main layout of the system with all its parts connected is provided in fig 1. It is obvious in the figure that the inputs of the systemare the actual piston position provided by the LVDT and the two different air pressure values given by the pressure sensors. The output of it is the control signal in Volts produced by the microprocessor as a result of the control algorithm implementation that drives the servo-valve. The last one is the control device of the plant, which operates the whole system under the controller’s commands. The valve opens and closes its ports in order to compress or decompress air in the two cylinder chambers and therefore move the piston.
World Congress on Sustainable Technologies (WCST-2015)
Copyright © 2015 Technical Co-Sponsored by IEEE UK/RI Computer Chapter 134
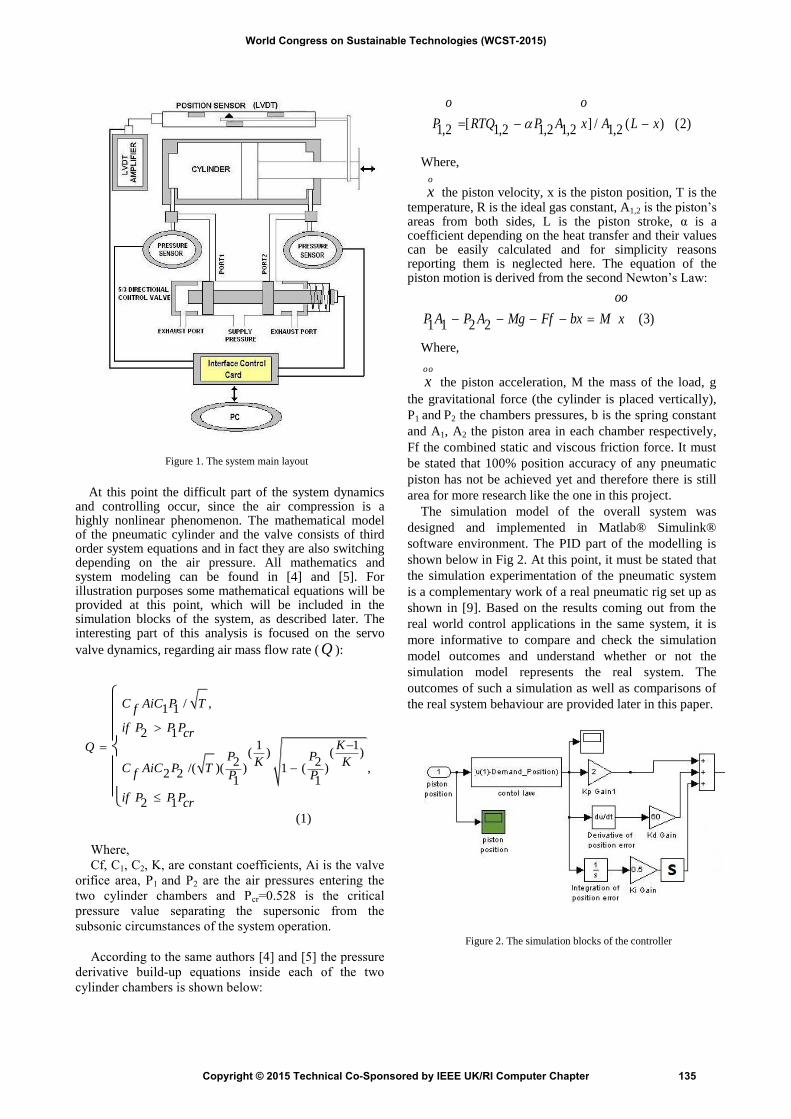
Figure 1. The system main layout
At this point the difficult part of the system dynamics and controlling occur, since the air compression is a highly nonlinear phenomenon. The mathematical model of the pneumatic cylinder and the valve consists of third order system equations and in fact they are also switching depending on the air pressure. All mathematics and system modeling can be found in [4] and [5]. For illustration purposes some mathematical equations will be provided at this point, which will be included in the simulation blocks of the system, as described later. The interesting part of this analysis is focused on the servo
valve dynamics, regarding air mass flow rate ( Q ):
/ ,1 1
2 11 1
( ) ( )2 2
/( )( ) 1 ( ) ,2 21 1
2 1
C AiC P Tf
if P P PcrKQ
P PK KC AiC P Tf P P
if P P Pcr
(1)
Where,
Cf, C1, C2, K, are constant coefficients, Ai is the valve
orifice area, P1 and P2 are the air pressures entering the
two cylinder chambers and Pcr=0.528 is the critical
pressure value separating the supersonic from the
subsonic circumstances of the system operation.
According to the same authors [4] and [5] the pressure
derivative build-up equations inside each of the two
cylinder chambers is shown below:
[ ] / ( ) (2)1,2 1,2 1,2 1,2 1,2
o o
P RTQ P A x A L x
Where,
o
x the piston velocity, x is the piston position, T is the temperature, R is the ideal gas constant, A1,2 is the piston’s areas from both sides, L is the piston stroke, α is a coefficient depending on the heat transfer and their values can be easily calculated and for simplicity reasons reporting them is neglected here. The equation of the piston motion is derived from the second Newton’s Law:
(3)1 1 2 2
oo
P A P A Mg Ff bx M x
Where,
oo
x the piston acceleration, M the mass of the load, g
the gravitational force (the cylinder is placed vertically),
P1 and P2 the chambers pressures, b is the spring constant
and A1, A2 the piston area in each chamber respectively,
Ff the combined static and viscous friction force. It must
be stated that 100% position accuracy of any pneumatic
piston has not be achieved yet and therefore there is still
area for more research like the one in this project.
The simulation model of the overall system was
designed and implemented in Matlab® Simulink®
software environment. The PID part of the modelling is
shown below in Fig 2. At this point, it must be stated that
the simulation experimentation of the pneumatic system
is a complementary work of a real pneumatic rig set up as
shown in [9]. Based on the results coming out from the
real world control applications in the same system, it is
more informative to compare and check the simulation
model outcomes and understand whether or not the
simulation model represents the real system. The
outcomes of such a simulation as well as comparisons of
the real system behaviour are provided later in this paper.
Figure 2. The simulation blocks of the controller
World Congress on Sustainable Technologies (WCST-2015)
Copyright © 2015 Technical Co-Sponsored by IEEE UK/RI Computer Chapter 135
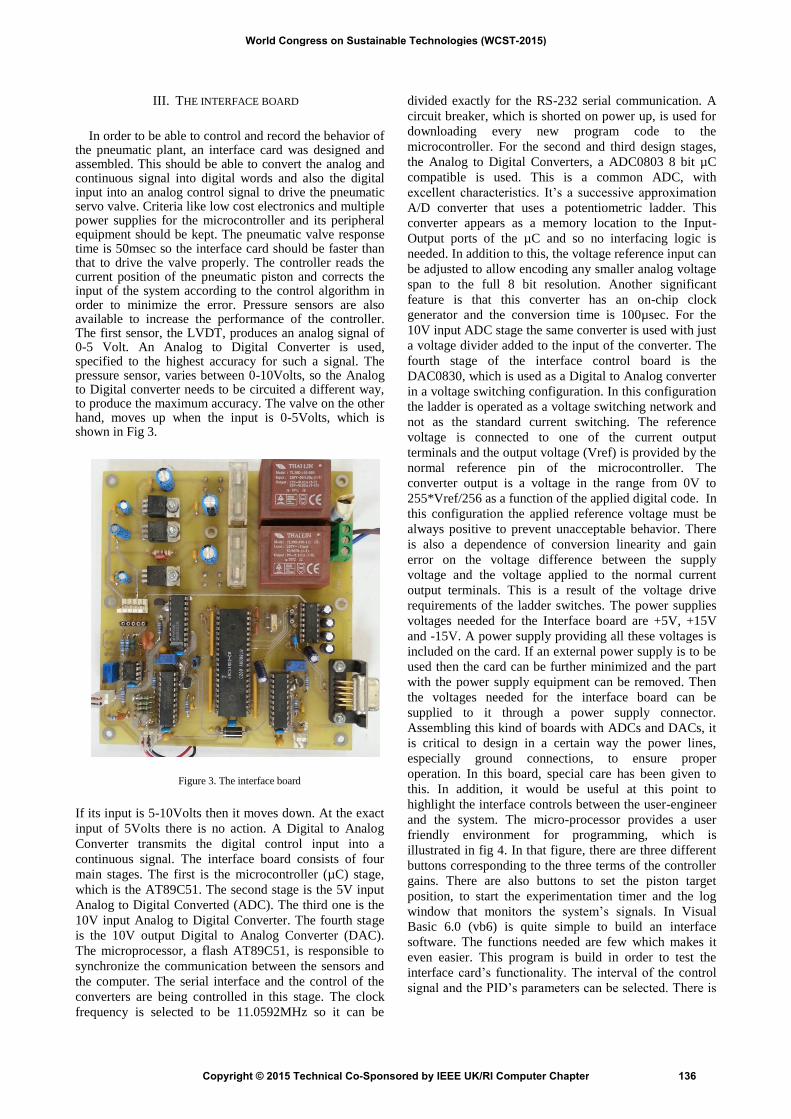
III. THE INTERFACE BOARD
In order to be able to control and record the behavior of
the pneumatic plant, an interface card was designed and assembled. This should be able to convert the analog and continuous signal into digital words and also the digital input into an analog control signal to drive the pneumatic servo valve. Criteria like low cost electronics and multiple power supplies for the microcontroller and its peripheral equipment should be kept. The pneumatic valve response time is 50msec so the interface card should be faster than that to drive the valve properly. The controller reads the current position of the pneumatic piston and corrects the input of the system according to the control algorithm in order to minimize the error. Pressure sensors are also available to increase the performance of the controller. The first sensor, the LVDT, produces an analog signal of 0-5 Volt. An Analog to Digital Converter is used, specified to the highest accuracy for such a signal. The pressure sensor, varies between 0-10Volts, so the Analog to Digital converter needs to be circuited a different way, to produce the maximum accuracy. The valve on the other hand, moves up when the input is 0-5Volts, which is shown in Fig 3.
Figure 3. The interface board
If its input is 5-10Volts then it moves down. At the exact
input of 5Volts there is no action. A Digital to Analog
Converter transmits the digital control input into a
continuous signal. The interface board consists of four
main stages. The first is the microcontroller (µC) stage,
which is the AT89C51. The second stage is the 5V input
Analog to Digital Converted (ADC). The third one is the
10V input Analog to Digital Converter. The fourth stage
is the 10V output Digital to Analog Converter (DAC).
The microprocessor, a flash AT89C51, is responsible to
synchronize the communication between the sensors and
the computer. The serial interface and the control of the
converters are being controlled in this stage. The clock
frequency is selected to be 11.0592MHz so it can be
divided exactly for the RS-232 serial communication. A
circuit breaker, which is shorted on power up, is used for
downloading every new program code to the
microcontroller. For the second and third design stages,
the Analog to Digital Converters, a ADC0803 8 bit µC
compatible is used. This is a common ADC, with
excellent characteristics. It’s a successive approximation
A/D converter that uses a potentiometric ladder. This
converter appears as a memory location to the Input-
Output ports of the µC and so no interfacing logic is
needed. In addition to this, the voltage reference input can
be adjusted to allow encoding any smaller analog voltage
span to the full 8 bit resolution. Another significant
feature is that this converter has an on-chip clock
generator and the conversion time is 100µsec. For the
10V input ADC stage the same converter is used with just
a voltage divider added to the input of the converter. The
fourth stage of the interface control board is the
DAC0830, which is used as a Digital to Analog converter
in a voltage switching configuration. In this configuration
the ladder is operated as a voltage switching network and
not as the standard current switching. The reference
voltage is connected to one of the current output
terminals and the output voltage (Vref) is provided by the
normal reference pin of the microcontroller. The
converter output is a voltage in the range from 0V to
255*Vref/256 as a function of the applied digital code. In
this configuration the applied reference voltage must be
always positive to prevent unacceptable behavior. There
is also a dependence of conversion linearity and gain
error on the voltage difference between the supply
voltage and the voltage applied to the normal current
output terminals. This is a result of the voltage drive
requirements of the ladder switches. The power supplies
voltages needed for the Interface board are +5V, +15V
and -15V. A power supply providing all these voltages is
included on the card. If an external power supply is to be
used then the card can be further minimized and the part
with the power supply equipment can be removed. Then
the voltages needed for the interface board can be
supplied to it through a power supply connector.
Assembling this kind of boards with ADCs and DACs, it
is critical to design in a certain way the power lines,
especially ground connections, to ensure proper
operation. In this board, special care has been given to
this. In addition, it would be useful at this point to
highlight the interface controls between the user-engineer
and the system. The micro-processor provides a user
friendly environment for programming, which is
illustrated in fig 4. In that figure, there are three different
buttons corresponding to the three terms of the controller
gains. There are also buttons to set the piston target
position, to start the experimentation timer and the log
window that monitors the system’s signals. In Visual
Basic 6.0 (vb6) is quite simple to build an interface
software. The functions needed are few which makes it
even easier. This program is build in order to test the
interface card’s functionality. The interval of the control
signal and the PID’s parameters can be selected. There is
World Congress on Sustainable Technologies (WCST-2015)
Copyright © 2015 Technical Co-Sponsored by IEEE UK/RI Computer Chapter 136
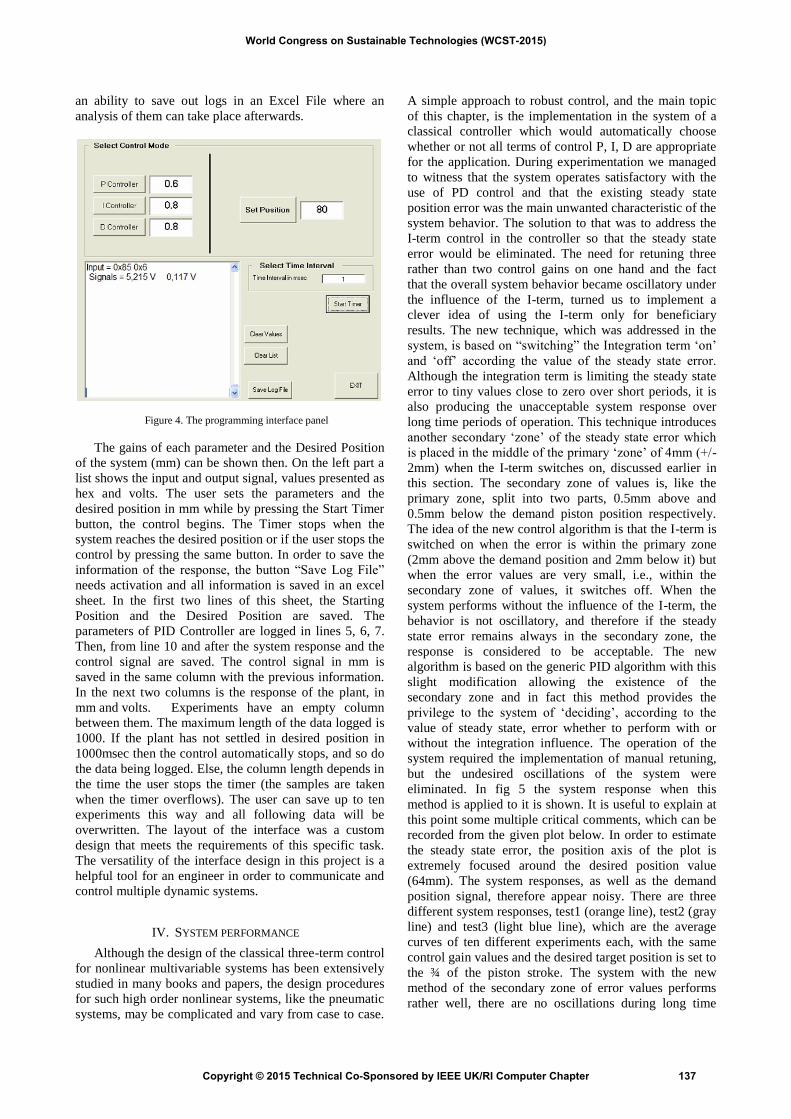
an ability to save out logs in an Excel File where an
analysis of them can take place afterwards.
Figure 4. The programming interface panel
The gains of each parameter and the Desired Position
of the system (mm) can be shown then. On the left part a
list shows the input and output signal, values presented as
hex and volts. The user sets the parameters and the
desired position in mm while by pressing the Start Timer
button, the control begins. The Timer stops when the
system reaches the desired position or if the user stops the
control by pressing the same button. In order to save the
information of the response, the button “Save Log File”
needs activation and all information is saved in an excel
sheet. In the first two lines of this sheet, the Starting
Position and the Desired Position are saved. The
parameters of PID Controller are logged in lines 5, 6, 7.
Then, from line 10 and after the system response and the
control signal are saved. The control signal in mm is
saved in the same column with the previous information.
In the next two columns is the response of the plant, in
mm and volts. Experiments have an empty column
between them. The maximum length of the data logged is
1000. If the plant has not settled in desired position in
1000msec then the control automatically stops, and so do
the data being logged. Else, the column length depends in
the time the user stops the timer (the samples are taken
when the timer overflows). The user can save up to ten
experiments this way and all following data will be
overwritten. The layout of the interface was a custom
design that meets the requirements of this specific task.
The versatility of the interface design in this project is a
helpful tool for an engineer in order to communicate and
control multiple dynamic systems.
IV. SYSTEM PERFORMANCE
Although the design of the classical three-term control
for nonlinear multivariable systems has been extensively
studied in many books and papers, the design procedures
for such high order nonlinear systems, like the pneumatic
systems, may be complicated and vary from case to case.
A simple approach to robust control, and the main topic
of this chapter, is the implementation in the system of a
classical controller which would automatically choose
whether or not all terms of control P, I, D are appropriate
for the application. During experimentation we managed
to witness that the system operates satisfactory with the
use of PD control and that the existing steady state
position error was the main unwanted characteristic of the
system behavior. The solution to that was to address the
I-term control in the controller so that the steady state
error would be eliminated. The need for retuning three
rather than two control gains on one hand and the fact
that the overall system behavior became oscillatory under
the influence of the I-term, turned us to implement a
clever idea of using the I-term only for beneficiary
results. The new technique, which was addressed in the
system, is based on “switching” the Integration term ‘on’
and ‘off’ according the value of the steady state error.
Although the integration term is limiting the steady state
error to tiny values close to zero over short periods, it is
also producing the unacceptable system response over
long time periods of operation. This technique introduces
another secondary ‘zone’ of the steady state error which
is placed in the middle of the primary ‘zone’ of 4mm (+/-
2mm) when the I-term switches on, discussed earlier in
this section. The secondary zone of values is, like the
primary zone, split into two parts, 0.5mm above and
0.5mm below the demand piston position respectively.
The idea of the new control algorithm is that the I-term is
switched on when the error is within the primary zone
(2mm above the demand position and 2mm below it) but
when the error values are very small, i.e., within the
secondary zone of values, it switches off. When the
system performs without the influence of the I-term, the
behavior is not oscillatory, and therefore if the steady
state error remains always in the secondary zone, the
response is considered to be acceptable. The new
algorithm is based on the generic PID algorithm with this
slight modification allowing the existence of the
secondary zone and in fact this method provides the
privilege to the system of ‘deciding’, according to the
value of steady state, error whether to perform with or
without the integration influence. The operation of the
system required the implementation of manual retuning,
but the undesired oscillations of the system were
eliminated. In fig 5 the system response when this
method is applied to it is shown. It is useful to explain at
this point some multiple critical comments, which can be
recorded from the given plot below. In order to estimate
the steady state error, the position axis of the plot is
extremely focused around the desired position value
(64mm). The system responses, as well as the demand
position signal, therefore appear noisy. There are three
different system responses, test1 (orange line), test2 (gray
line) and test3 (light blue line), which are the average
curves of ten different experiments each, with the same
control gain values and the desired target position is set to
the ¾ of the piston stroke. The system with the new
method of the secondary zone of error values performs
rather well, there are no oscillations during long time
World Congress on Sustainable Technologies (WCST-2015)
Copyright © 2015 Technical Co-Sponsored by IEEE UK/RI Computer Chapter 137
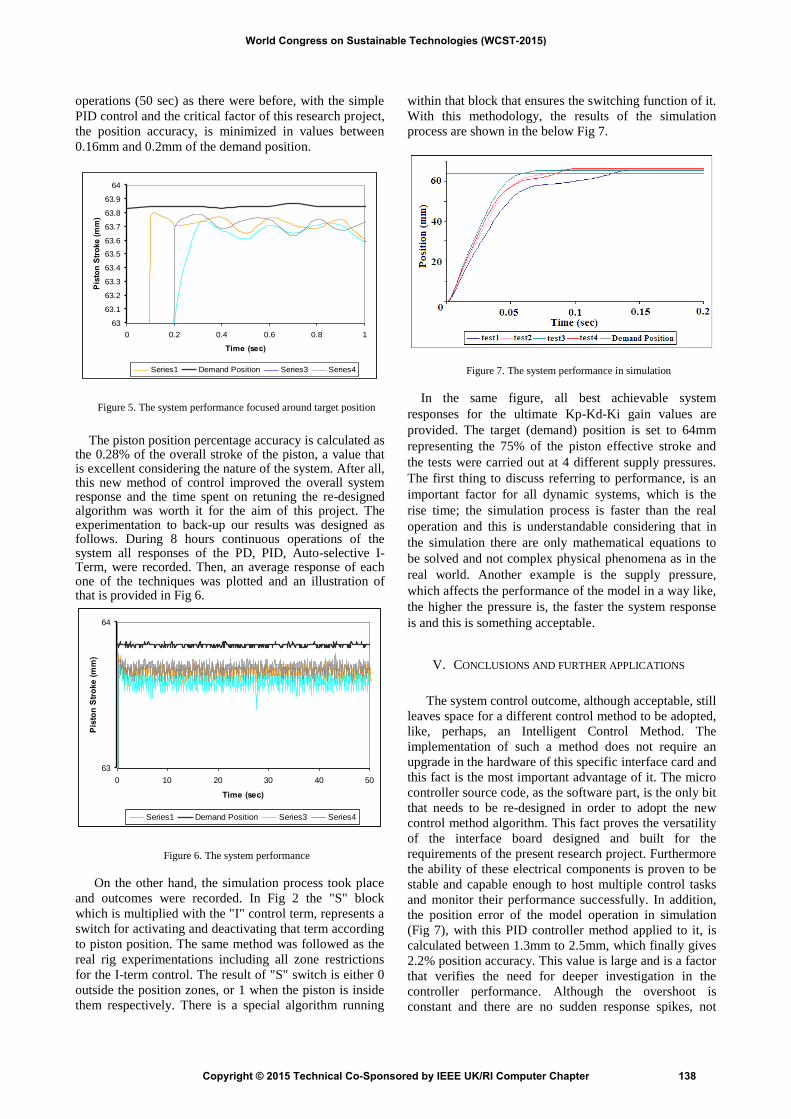
operations (50 sec) as there were before, with the simple
PID control and the critical factor of this research project,
the position accuracy, is minimized in values between
0.16mm and 0.2mm of the demand position.
Figure 5. The system performance focused around target position
The piston position percentage accuracy is calculated as
the 0.28% of the overall stroke of the piston, a value that is excellent considering the nature of the system. After all, this new method of control improved the overall system response and the time spent on retuning the re-designed algorithm was worth it for the aim of this project. The experimentation to back-up our results was designed as follows. During 8 hours continuous operations of the system all responses of the PD, PID, Auto-selective I-Term, were recorded. Then, an average response of each one of the techniques was plotted and an illustration of that is provided in Fig 6.
Figure 6. The system performance
On the other hand, the simulation process took place
and outcomes were recorded. In Fig 2 the "S" block
which is multiplied with the "I" control term, represents a
switch for activating and deactivating that term according
to piston position. The same method was followed as the
real rig experimentations including all zone restrictions
for the I-term control. The result of "S" switch is either 0
outside the position zones, or 1 when the piston is inside
them respectively. There is a special algorithm running
within that block that ensures the switching function of it.
With this methodology, the results of the simulation
process are shown in the below Fig 7.
Figure 7. The system performance in simulation
In the same figure, all best achievable system
responses for the ultimate Kp-Kd-Ki gain values are
provided. The target (demand) position is set to 64mm
representing the 75% of the piston effective stroke and
the tests were carried out at 4 different supply pressures.
The first thing to discuss referring to performance, is an
important factor for all dynamic systems, which is the
rise time; the simulation process is faster than the real
operation and this is understandable considering that in
the simulation there are only mathematical equations to
be solved and not complex physical phenomena as in the
real world. Another example is the supply pressure,
which affects the performance of the model in a way like,
the higher the pressure is, the faster the system response
is and this is something acceptable.
V. CONCLUSIONS AND FURTHER APPLICATIONS
The system control outcome, although acceptable, still
leaves space for a different control method to be adopted,
like, perhaps, an Intelligent Control Method. The
implementation of such a method does not require an
upgrade in the hardware of this specific interface card and
this fact is the most important advantage of it. The micro
controller source code, as the software part, is the only bit
that needs to be re-designed in order to adopt the new
control method algorithm. This fact proves the versatility
of the interface board designed and built for the
requirements of the present research project. Furthermore
the ability of these electrical components is proven to be
stable and capable enough to host multiple control tasks
and monitor their performance successfully. In addition,
the position error of the model operation in simulation
(Fig 7), with this PID controller method applied to it, is
calculated between 1.3mm to 2.5mm, which finally gives
2.2% position accuracy. This value is large and is a factor
that verifies the need for deeper investigation in the
controller performance. Although the overshoot is
constant and there are no sudden response spikes, not
63
63.1
63.2
63.3
63.4
63.5
63.6
63.7
63.8
63.9
64
0 0.2 0.4 0.6 0.8 1
Time (sec)
Pist
on S
troke
(mm
)
Series1 Demand Position Series3 Series4
63
64
0 10 20 30 40 50
Time (sec)
Pist
on S
troke
(mm
)
Series1 Demand Position Series3 Series4
World Congress on Sustainable Technologies (WCST-2015)
Copyright © 2015 Technical Co-Sponsored by IEEE UK/RI Computer Chapter 138

many conclusions can be derived from the current
simulation process of the PID position control
implementation. The same simulation system is robust
enough to host another control technique and keep
following up the real experimentation's methods. The
only part of it that the user need to interfere is the
controller group of blocks shown earlier.
In conclusion, this research study introduced a interface
board to control a highly nonlinear dynamic positioning
system with a "smart" control method. At the same time a
simulation model of the whole system was built to verify
the control results of the real system. Both can be
considered as helpful tools for further investigation and a
joint robust platform for testing various modern control
methods
ACKNOWLEDGMENTS
All authors would like to thank the Piraeus University
of Applied Sciences for providing the necessary
equipment and funding to undertake this research work.
REFERENCES
[1] Richard E.,Scavarda, S.,1996, Comparison Between Linear and Nonlinear Control of an Electropneumatic Servodrive ,Journal of
Dynamic Systems, Measurement and Control,Vol.118,pp.245-118.
[2] Jihog Wang, Junsheng Pu, Philip Moore, “Accurate Position Control of Servo Pneumatic Actuator Systems”, Control
Engineering Practice, 1999, pp. 699-706
[3] J. E. Bobrow, B.W. McDonell, “Modeling, Identification and Control of a Pneumatically Actuated, Force Controllable Robot”,
draft Thesis 1990, California University,USA.
[4] Richer E. and Hurmuzlu Y., ‘A High Performance Force Actuator System Part 1 Nonlinear Mathematical Model’, ASME Journals of
Dynamics Systems Measurement and Control, 2000, Vol. 122,
No3, pp. 416-425 [5] Belforte G., Mattiazzo G., Mauro S., “Design criteria for flow
proportional control valves”, Proceedings of sixth triennual
international symposium on Fluid control, Measurement and Visualization, Flucome 2000, August 13-17, Sherbrooke, Canada.
[6] Khol, R., editor, “Electrical & Electronics Reference Issue,”
Machine Design, Vol 57, No 12, May 30, 1985. [7] Benjamin C. Kuo, Digital Control Systems, Second Edition, New
York: Oxford University Press.
[8] J. Proakis and D. Manolakis, Digital Signal Processing: Principles, Algorithms, and Applications, New York: Macmillan
Publishing Company, 1992.
[9] Papoutsidakis M.G., Chamilothoris G.E, Dailami F., Larsen N. and Pipe A., (2005) “Accurate control of a pneumatic system
using an innovative fuzzy gain-scheduling pattern”, International
Academy of Sciences, 6th International Conference on Enformatika, System Science and Engineering, Budapest,
Hungary.
World Congress on Sustainable Technologies (WCST-2015)
Copyright © 2015 Technical Co-Sponsored by IEEE UK/RI Computer Chapter 139
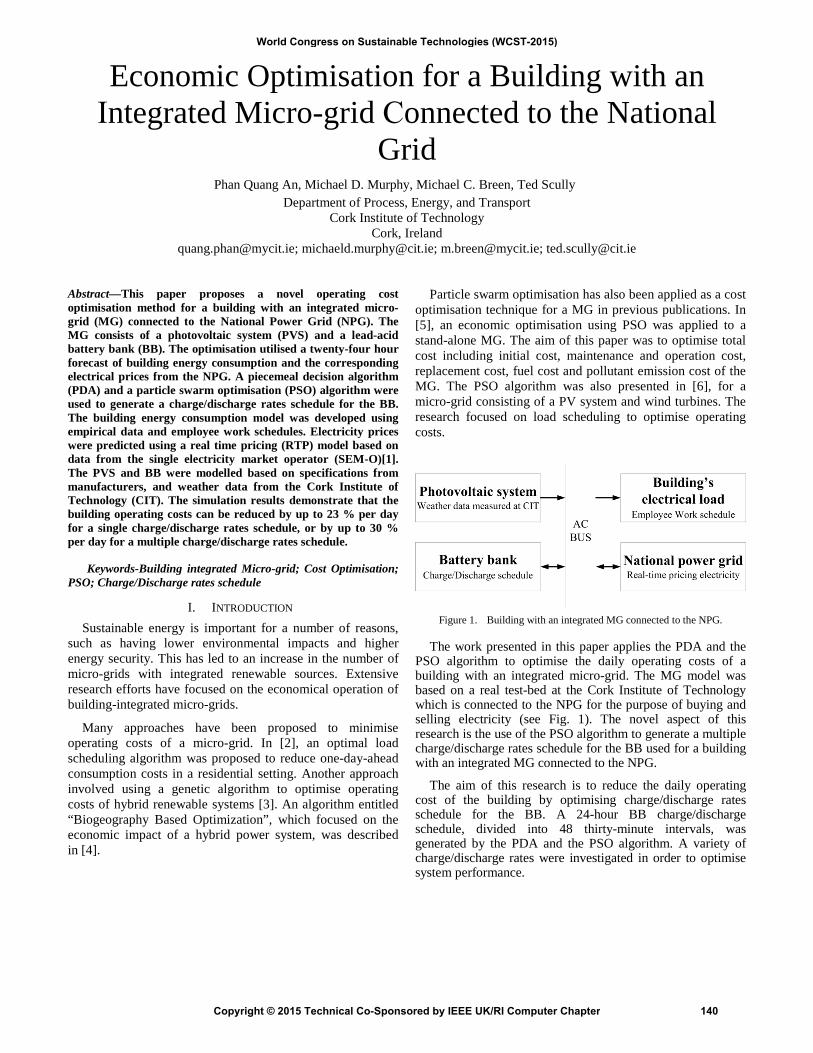
Economic Optimisation for a Building with an Integrated Micro-grid Connected to the National
Grid Phan Quang An, Michael D. Murphy, Michael C. Breen, Ted Scully
Department of Process, Energy, and Transport Cork Institute of Technology
Cork, Ireland [email protected]; [email protected]; [email protected]; [email protected]
Abstract—This paper proposes a novel operating cost optimisation method for a building with an integrated micro-grid (MG) connected to the National Power Grid (NPG). The MG consists of a photovoltaic system (PVS) and a lead-acid battery bank (BB). The optimisation utilised a twenty-four hour forecast of building energy consumption and the corresponding electrical prices from the NPG. A piecemeal decision algorithm (PDA) and a particle swarm optimisation (PSO) algorithm were used to generate a charge/discharge rates schedule for the BB. The building energy consumption model was developed using empirical data and employee work schedules. Electricity prices were predicted using a real time pricing (RTP) model based on data from the single electricity market operator (SEM-O)[1]. The PVS and BB were modelled based on specifications from manufacturers, and weather data from the Cork Institute of Technology (CIT). The simulation results demonstrate that the building operating costs can be reduced by up to 23 % per day for a single charge/discharge rates schedule, or by up to 30 % per day for a multiple charge/discharge rates schedule.
Keywords-Building integrated Micro-grid; Cost Optimisation; PSO; Charge/Discharge rates schedule
I. INTRODUCTION Sustainable energy is important for a number of reasons,
such as having lower environmental impacts and higher energy security. This has led to an increase in the number of micro-grids with integrated renewable sources. Extensive research efforts have focused on the economical operation of building-integrated micro-grids.
Many approaches have been proposed to minimise operating costs of a micro-grid. In [2], an optimal load scheduling algorithm was proposed to reduce one-day-ahead consumption costs in a residential setting. Another approach involved using a genetic algorithm to optimise operating costs of hybrid renewable systems [3]. An algorithm entitled “Biogeography Based Optimization”, which focused on the economic impact of a hybrid power system, was described in [4].
Particle swarm optimisation has also been applied as a cost optimisation technique for a MG in previous publications. In [5], an economic optimisation using PSO was applied to a stand-alone MG. The aim of this paper was to optimise total cost including initial cost, maintenance and operation cost, replacement cost, fuel cost and pollutant emission cost of the MG. The PSO algorithm was also presented in [6], for a micro-grid consisting of a PV system and wind turbines. The research focused on load scheduling to optimise operating costs.
Figure 1. Building with an integrated MG connected to the NPG.
The work presented in this paper applies the PDA and the PSO algorithm to optimise the daily operating costs of a building with an integrated micro-grid. The MG model was based on a real test-bed at the Cork Institute of Technology which is connected to the NPG for the purpose of buying and selling electricity (see Fig. 1). The novel aspect of this research is the use of the PSO algorithm to generate a multiple charge/discharge rates schedule for the BB used for a building with an integrated MG connected to the NPG.
The aim of this research is to reduce the daily operating cost of the building by optimising charge/discharge rates schedule for the BB. A 24-hour BB charge/discharge schedule, divided into 48 thirty-minute intervals, was generated by the PDA and the PSO algorithm. A variety of charge/discharge rates were investigated in order to optimise system performance.
World Congress on Sustainable Technologies (WCST-2015)
Copyright © 2015 Technical Co-Sponsored by IEEE UK/RI Computer Chapter 140

II. MICRO-GRID AND BUILDING MODELS
A. Photovoltaic system model The PVS used for the building consists of 48 poly-
crystalline panels with a peak power of 12 kWp. A PV panel is made up of many cells which are in a matrix connected in series or parallel. The size of the matrix and the number of cells are given in the manufacturer’s datasheet. Parameters of a PV panel are presented in Table I. Output power of a panel depends not only on weather conditions (in this paper two major elements were taken into account: solar irradiance and temperature) but also on load demand [7]. Therefore, the PVS model was constructed using single cell models. The output power of a cell depends on the fill factor [8]:
Pmpp = Vmpp
· Impp = FF·Voc · Isc (1)
FF = VocVT
- lnVocVT
+ 0.72Voc VT
+ 1(2)
Where Pmpp, Vmpp, Impp are power (W), voltage (V), current (A) at maximum power point, respectively. Voc is open-circuit voltage (V), Isc is short-circuit current (A) and VT is thermal voltage (V). FF is the fill factor.
TABLE I. PARAMETERS OF A POLY-CRYTALLINE PV PANEL
Parameters at standard conditions 25ºC, 1000W/m2 Symbol Expression Value Unit Pmpp,std Power at maximum power point 250 W Vmpp,std Voltage at maximum power point 30.9 V Impp,std Current at maximum power point 8.1 A Voc,std Open circuit voltage 38.2 V Isc,std Short circuit current 8.6 A Kv Temperature coefficient of Voc -0.32 %/K KI Temperature coefficient of Isc -0.048 %/K
Open-circuit voltage and short-circuit current at any weather condition are calculated from specifications at standard conditions (Tstd = 25 ºC and Gstd = 1000 W/m2)
Voc=Voc,std + KV · T - Tstd (3)
Isc = Isc,std· GGstd
· 1 - KIT - Tstd (4)
Where Voc,std and Isc,std are open-circuit voltage (V) and short-circuit current (A) at standard conditions. KV and KI are temperature coefficients of Voc and Isc. G and T are irradiance (W/m2) and temperature (ºK).
B. Battery bank model The BB used for the building consists of 40 sealed lead-
acid batteries. It is housed indoors to keep its temperature at approximately 25 ºC. Parameters of a battery are presented in Table II. The role of the BB is to store energy from the micro-grid and release it when needed. Therefore, the BB model was divided into two modes: charge mode for storing energy and discharge mode for releasing energy. The model for a single battery cell at 25 ºC, used in this paper, was based on the Ciemat model [9].
• Charge mode:The charge mode may have a constant current period and
a constant voltage period. Constant current charge was used when a cell’s voltage was below 2.4 V. The voltage of the batteries increases during the constant current charge period [9]. The relationship between charge voltage and state of charge of a battery cell is shown in functions (5), (6) and (7).
VC = 2 - 0.16·SOC + 1C10
· 61 + I0.86 + 0.48
1 - SOC1.2 + 0.036 (5)
SOC = SOCo + μc·I·tC
(6)
μc = 1 - exp20.73·(SOC - 1 )I
I10 + 0.55
(7)
Where Vc is charge voltage (V), SOC is state of charge (%), SOCo is the initial value of SOC, I is charge current (A) and C is the capacity (Ah), t is charge time (hour), µc is charge efficiency.
Constant voltage charge was used when a cell’s voltage reaches 2.4 V, with current values in this period calculated using empirical data.
• Discharge mode:Constant current discharge was applied for batteries in
this paper. The relationship between discharge voltage and state of charge of a battery cell is shown in functions (8), (9) and (10).
V = 2.08 - 0.12·(1 - SOC) - 1C10
· 41 + I1.3 + 0.27
SOC1.5 + 0.02 (8)
SOC = 1 - μD·I·tC
(9)
CC10
= 1.67
1 + 0.67· II10
0.9 (10)
Where V is discharge voltage (V), µD is discharge efficiency.
TABLE II. LEAD-ACID BATTERY PARAMETERS
Battery parameters at standard condition 25 ºC Symbol Expression Value Unit
V Nominal Voltage 12 V n Number of cells 6 cell
C10 Capacity at10 hour rate 100 Ah
C. Energy consumption model The test building located at CIT consists of offices for
lecturers and researchers. Opening hours are from 8:00 to 17:00 every weekday. The electrical demand of the building depends on the number of staff members present and their work timetables, as well the electrical demand of the building’s equipment. Electrical loads were classified into three groups: lighting, heating and general services (11). General services include refrigerators, coffee machines, kettles, printers, computers, and personal electronic devices. In this paper, the energy demand of general services was based
World Congress on Sustainable Technologies (WCST-2015)
Copyright © 2015 Technical Co-Sponsored by IEEE UK/RI Computer Chapter 141

on staff work schedules while the amount of energy used for the lighting and heating systems was based on historical data.
Load(i) = General(i) + Light(i) + HP(i) (11)
Load(i) is amount of electricity (kWh) consumed at the ith interval, General(i), Light(i) and HP(i) are amounts of electricity consumed by general services (kWh), lighting (kWh) and heat pump (kWh), respectively at the ith interval.
D. Real time pricing model Real time pricing of electricity varies every thirty
minutes, based on national electricity production and consumption. The electricity price is based on the system marginal electricity price (SMP) obtained from the SEM-O [1]. The SMP, however, does not reflect the price paid by consumers, as other charges apply, such as transmission costs, balancing costs, distribution costs, environment cost and retail margin [10], [11]. The real time pricing of electricity (2015) is presented in (12):
RTP(i) = SMP(i) + Tc + Dc + Bc + Ec + Rm (12)
Where Tc is transmission cost, (0.0105 €/kWh), Bc is balancing cost, (0.0056 €/kWh), Dc is distribution cost (0.059 €/kWh), Ec is environment cost (0.051 €/kWh) and Rm is retail margin cost (0.017 €/kWh).
III. ALGORITHM DETAILS The amount of energy bought from or sold to the NPG
(EGRID) depends on the amount of energy produced by the PVS (EPVS), the energy consumption of the building (ELOAD), and the energy stored in and released from the BB (EBB), (13);
EPVS - ELOAD ± EBB = EGRID (13)
If EGRID is positive, users have to buy electricity from the Grid with the current RTP. In the case where EGRID is negative, electricity is sold to the Grid. In this paper, selling price (SELL) was equal to 70 % of the current RTP (14).
SELL(i) = 70 %·RTP(i) (14)
A 24-hour BB charge/discharge schedule, divided into 48 thirty-minute intervals was applied to the BB in order to optimise the operating cost of the building. The state of charge of the BB was maintained between 20 % and 90 %.
A. Piecemeal decision algorithm (PDA) The piecemeal decision algorithm was based on the RTP,
the energy generated by the PVS and the building’s electrical demand at each 30 minute interval. At every interval, a decision was made regarding which the BB operating mode to apply. Four operating modes of the BB (Mode 1 to 4), used for the algorithm, are presented in Table III.
TABLE III. PIECEMEAL DECISION ALGORITHM
Decision for every 30 minute interval Conditions ∆Energy > 0 ∆Energy < 0
∆Price > 0 Mode 1: No Battery Sell electricity to NPG Mode 2: Discharge
∆Price < 0 Mode 3: Charge Mode 4: No Battery Buy electricity from NPG
Where:
∆Energy(i) = EPVS(i) - ELOAD(i) (15)
∆Price(i) = RTP(i) - mean(RTP) (16)
From Table III, the BB operating modes depend on ∆Energy and ∆Price for each interval. If the energy from the PVS cannot match the demand from the building and electricity price is higher than average, the BB will discharge (Mode 2). On the other hand, when the building’s consumption is lower than the energy generated by the PVS, and the electricity price is lower than average, the BB will be charged to store energy (Mode 3). A single charge/discharge rate is used for Mode 2 and Mode 3. The BB is not used in Mode 1 and Mode 4 as electricity will be bought from /sold to the NPG.
B. Particle swarm optimisation (PSO) algorithm The PSO algorithm was used to generate a
charge/discharge rates schedule to control the amount of energy stored in/released by the BB. There were three main steps in each cycle of the PSO algorithm (see Fig. 2):
Figure 2. PSO algorithm
Step 1: Generation of initial particles
Random schedules of charge/discharge rates, called initial particles, were generated based on size and dimension of the swarm. Size of the swarm in this paper was 1000 particles and its dimension was 48 (representing 48 thirty minute intervals). The number of iterations was set to 100.
Step 2: Calculation of daily operating cost
From the particles created in the Step 1, the operating costs were calculated using a fitness function (17). This function was based on 4 models: the PVS, the BB, the RTP and the building electricity consumption. For each particle, a daily operating cost value was calculated. A local best cost was determined among particles in a generation and a global best cost was obtained.
World Congress on Sustainable Technologies (WCST-2015)
Copyright © 2015 Technical Co-Sponsored by IEEE UK/RI Computer Chapter 142

Cost function:
f=∑ [ti·∆i·RTPi 48i=1 - 1 - ti·∆i
·SELLi] (17)
Where, RTPi is the electricity price (€/kWh) when purchasing from the NPG and SELLi is the electricity price (€/kWh) when selling to the NPG, at the ith interval. ∆i is equal to EGRID in (13) and ti is the state of buying/selling electricity from/to the NPG (“1” when buying, “0” when selling).
Step 3: Updating of particles
After every cycle, particles were updated for the next generation. Updating was dependent on current particles, local best cost, global best cost and a number of experimental parameters. In this paper, cognitive factor and social factor were equal to “2”.
x = w·x + c1·r1pst - lcl+c2·r2pst - gbl (18)
Where x is a particle, pst is current cost (€), lcl is local best cost (€), gbl is global best cost (€), w is a random number between [0, 1], c1 is cognitive factor, c2 is social factor.
IV. RESULTS The use of single charge/discharge rates was applied for
both the PDA and the PSO algorithm whereas multiple charge/discharge rates were only applied for the PSO algorithm. A ten day period from 19/02/2015 to 28/02/2015 was used for analysis.
TABLE IV. 24-HOUR OPERATING COST USING PDA AND PSO
PDA and PSO algorithms (Single rate)
Day Cost (€)
ADP PDA PSO
19/2/2015 Thursday 11.05 10.85 2 % 20/2/2015 Friday 6.48 5.93 8 % 21/2/2015 Saturday 1.41 -2.80 299 %
22/2/2015 Sunday 5.41 -0.28 105 % 23/2/2015 Monday 7.87 5.26 33 %
24/2/2015 Tuesday 5.34 4.48 16 % 25/2/2015 Wednesday 10.84 10.26 5 % 26/2/2015 Thursday 9.68 9.68 0 %
27/2/2015 Friday 8.97 8.56 5 % 28/2/2015 Saturday 2.88 2.09 27 %
Average 6.993 5.403 23 %
The results for single charge/discharge rates using the PDA and the PSO algorithms are presented in Table IV. Standard charge and discharge rates are 0.1C (C10) and 0.1D (D10). During these 10 day period use for analysis, daily operating costs calculated using the PSO algorithm were less than or equal to those calculated using the PDA. On average, the use of PSO algorithm reduced operating costs by 23 %. It was particularly evident on weekend days (21/2 and 22/2) where profits of 2.80 €/day and 0.28 €/day were made by the PSO algorithm (far better than the PDA). This difference was due to the fact that the building electricity demand on weekend
days was lower. Moreover, storing and releasing the BB using the PSO algorithm was flexible whereas operating modes were fixed for the PDA.
In order to improve savings on operating cost, a charge/discharge schedule using multiple rates was introduced for the PSO algorithm. Three levels of charge/discharge rates were used, low rates of 0.05C (C20) and 0.05D (D20), standard rates of 0.1C (C10) and 0.1D (D10), and high rates of 0.2C (C5) and 0.2D (D5). The resulting operating costs when using these multiple charge/discharge rates are presented in Table V. Compared to single charge/discharge rates, the costs were reduced by 7 % on average over the aforementioned ten day period.
TABLE V. 24-HOUR OPERATING COST USING PSO
PSO algorithm (Single rate and Multiple rates)
Day Cost (€)
ADP Single rate Multiple
rate 19/2/2015 Thursday 10.85 10.32 5 % 20/2/2015 Friday 5.93 5.12 14 %
21/2/2015 Saturday -2.80 -3.10 11 % 22/2/2015 Sunday -0.28 -0.32 14 %
23/2/2015 Monday 5.26 4.68 11 % 24/2/2015 Tuesday 4.48 4.23 6 % 25/2/2015 Wednesday 10.26 10.04 2 %
26/2/2015 Thursday 9.68 9.04 7 % 27/2/2015 Friday 8.56 8.42 2 %
28/2/2015 Saturday 2.09 1.74 17 %
Average 5.403 5.017 7 %
The simulation results for 23/02/2015 are presented in Fig. 3, 4, and 5. The difference between the energy provided by the PVS and that consumed by the building, as well as the SOC and RTP profiles, are shown in each figure.
Fig. 3 and 4 show the results using single charge/discharge rates for the PDA and the PSO algorithm, respectively. As can be seen from the SOC profiles of both figures, from 19:00 to 21:00, the RTP reached a peak price of approximately 35 cent/kWh, causing the BB to discharge and provide electricity for the building. Interestingly, during busy hours (8:30 to 9:30), the BB was discharged for the PSO algorithm while it was not used under the PDA. This can be explained by the fact that during this period of time, mode 4 was applied for the PDA due to the RTP being lower than average while building electricity demand was far greater than that provided by the PVS. As a result, the daily operating cost of the PDA was higher than that of the PSO algorithm.
Results of using multiple charge/discharge rates for the PSO algorithm are shown in Fig. 5. Compared to single rate results in Fig. 4, the variation of SOC for each interval was smoother due to the variety of charge/discharge rates. However, in both cases, during busy hours, the BB operated in the same way to reduce costs.
World Congress on Sustainable Technologies (WCST-2015)
Copyright © 2015 Technical Co-Sponsored by IEEE UK/RI Computer Chapter 143

Figure 3. 24-hour-ahead single charge/discharge rate schedule using PDA.
Figure 4. 24-hour-ahead single charge/discharge rate schedule using PSO.
Figure 5. 24-hour-ahead multiple charge/discharge rate schedule using PSO
V. CONCLUSION This paper introduces strategies to optimise daily operating
costs for a building with an integrated Micro-grid connected to the National Power Grid. The PDA and PSO algorithm were proposed to generate a charge/discharge rates schedule for the BB of a test building located at CIT. The results for a ten day period showed that the use of a single charge/discharge rate schedule for the PSO algorithm reduced the daily operating costs of the building by 23 % compared to the PDA. Results also demonstrated that the daily building operating costs were reduced by a further 7 % for the PSO algorithm when using multiple charge/discharge rates instead of single charge/discharge rates. Overall, the use of the PSO algorithm to schedule charge/discharge rates for the BB improved daily operating cost saving for the building. Further research will focus not only on operating cost but also the other cost such as maintenance and operation cost, replacement cost, and environmental cost for the building.
REFERENCES [1] Single Electricity Market Operator, [Online] Available:
“http://www.sem-o.com/Pages/default.aspx.” . [2] K. Ringland, “Optimal load scheduling for residential renewable energy
integration,” 2012 IEEE Third Int. Conf. Smart Grid Commun., pp. 516–521, Nov. 2012.
[3] N. Tutkun, “Minimization of operational cost for an off-grid renewable hybrid system to generate electricity in residential buildings through the SVM and the BCGA methods,” Energy Build., vol. 76, pp. 470–475, Jun. 2014.
[4] A. K. Bansal, R. Kumar, and R. A. Gupta, “Economic Analysis and Power Management of a Small Autonomous Hybrid Power System (SAHPS) Using Biogeography Based Optimization (BBO) Algorithm,” IEEE Trans. Smart Grid, vol. 4, no. 1, pp. 638–648, Mar. 2013.
[5] Y. Ma, P. Yang, Y. Wang, Z. Zhao, and Q. Zheng, “Optimal sizing and control strategy of islanded microgrid using PSO technique,” 2014 IEEE PES Asia-Pacific, Power Energy Eng. Conf., pp. 1–5, 2014.
[6] G. Liang, P. Liyuan, L. Ruihuan, Z. Fen, L. Jinhui, and W. Xin, “Study on economic operation for micro-grid based on scenario and PSO,” in 2014 International Conference on Power System Technology, 2014, no. Powercon, pp. 3152–3156.
[7] M. A. G. de Brito, L. Galotto, L. P. Sampaio, G. de A. e Melo, and C. A. Canesin, “Evaluation of the Main MPPT Techniques for Photovoltaic Applications,” IEEE Trans. Ind. Electron., vol. 60, no. 3, pp. 1156–1167, Mar. 2013.
[8] M. A. Green, “Solar cell fill factors: General graph and empirical expressions,” Solid. State. Electron., vol. 24, no. 8, pp. 788–789, Aug. 1981.
[9] N. Achaibou, M. Haddadi, and a. Malek, “Lead acid batteries simulation including experimental validation,” J. Power Sources, vol. 185, no. 2, pp. 1484–1491, Dec. 2008.
[10] P. Deane, J. Fitzgerald, L. M. Valeri, A. Tuohy, and D. Walsh, “Irish and British electricity prices : what recent history implies for future prices,” Econ. Energy Environ. Policy, vol. 4, no. 1, pp. 97–111, 2015.
[11] M. D. Murphy, M. J. O’Mahony, and J. Upton, “Comparison of control systems for the optimisation of ice storage in a dynamic real time electricity pricing environment,” Appl. Energy, vol. 149, pp. 392–403, 2015.
World Congress on Sustainable Technologies (WCST-2015)
Copyright © 2015 Technical Co-Sponsored by IEEE UK/RI Computer Chapter 144

Experimental and Numerical Simulation of Two Iranian Badgirs in the Persian Gulf,
City of Kong and Laft G. R. Dehghan Kamaragi a PARIS-EST UNIVERSITY
Paris, France [email protected]
B. Chanetz b ONERA (Aerospace Research)
Paris, France [email protected]
Abstract—Iranian wind towers “Badgir” works thanks to natural driving forces, such as differences in temperature between a building and its environment. By evaporation, convection and natural air currents, we can manage the internal thermal comfort of the local interior environment. The air movement is carried out by the process of pressure and extraction. This paper focuses on sustainable structure, Badgir and the computer simulation, experimentation and reconstruction of a wind towers in the city of Kong located in the Persian Gulf. The construction material of this Badgir is stone and adobe (earth clay, straw and water). This natural material has high heat storage capacity and help to evacuate hot air. The aerodynamic aspects are examined numerically by using CFD (Computation Fluid Dynamics). The calculated velocity and pressure fields are compared to measurements taken on the model installed in a wind tunnel.
Keywords: Natural ventilation, CFD simulation, Iranian wind tower, Badgir, Kong, Laft, Persian Gulf, sustainable buildings
I. INTRODUCTION Iranian wind towers are designed to introduce cool outside
air, driven by relatively high wind pressure. The internal partition allows the low pressure on the lee side of the tower to suck air from inside the building. These wind towers have generally four faces, but some of them are hexagon or octagon. The next pictures show the city of Laft.
Figure 1. The wind towers of the city of Laft
Figure 2. The wind towers of the city of Kong - The angle of Badgirs is inclined a few degrees to the prevailing wind
Through the narrow alleys, we can observe a Badgir refreshed with wet palm leaf. We also note the use of mechanical air conditioner under the Badgirs. The heart of the discussion is right here. Should we search a hybrid solution?
Figure 3. Narrow alleys are decorated with some mechanical air conditioners
Badgirs are directly related to a piece, called “Badgir’s room”. This piece plays a very important role in the right functioning of the tower. The lengths, widths and heights are carefully determined by the builders.
Figure 4. Proportion of towers
Given the weak wind in some areas of the Persian Gulf, many towers are built on the same plot. Sometimes, there is five Badgirs in the same house.
Figure 5. Location of Badgirs in different parts of the house
Figure 6. Operation of Badgir
World Congress on Sustainable Technologies (WCST-2015)
Copyright © 2015 Technical Co-Sponsored by IEEE UK/RI Computer Chapter 145

In fact, one duct receives and the others evacuate air, but it depends on the angle of arrival prevailing wind.
A. Badgir operation
Figure 7. How the Badgir works
Figure 8. How the hot air is evacuated
Figure 9. Badgir operation during the day and the night
Figure 10. The behavior of the sea wind during the day and the night
II. THE FIRST BADGIR WE EXAMINED IN KONG
Figure 11. Section and plan of the Badgir of Kong
Figure 12. Measurements under the badgir, in the room and on the top of the
duct (the outlet velocity in D and C is higher).
World Congress on Sustainable Technologies (WCST-2015)
Copyright © 2015 Technical Co-Sponsored by IEEE UK/RI Computer Chapter 146
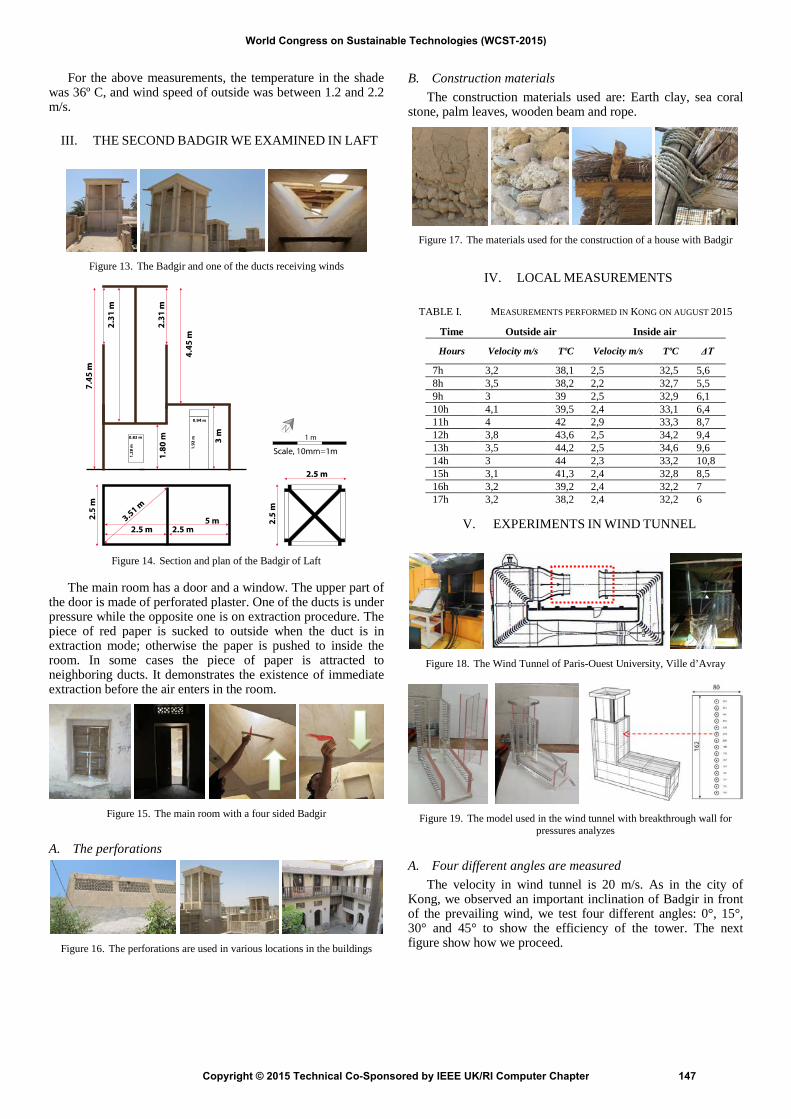
For the above measurements, the temperature in the shade was 36º C, and wind speed of outside was between 1.2 and 2.2 m/s.
III. THE SECOND BADGIR WE EXAMINED IN LAFT
Figure 13. The Badgir and one of the ducts receiving winds
Figure 14. Section and plan of the Badgir of Laft
The main room has a door and a window. The upper part of the door is made of perforated plaster. One of the ducts is under pressure while the opposite one is on extraction procedure. The piece of red paper is sucked to outside when the duct is in extraction mode; otherwise the paper is pushed to inside the room. In some cases the piece of paper is attracted to neighboring ducts. It demonstrates the existence of immediate extraction before the air enters in the room.
Figure 15. The main room with a four sided Badgir
A. The perforations
Figure 16. The perforations are used in various locations in the buildings
B. Construction materials The construction materials used are: Earth clay, sea coral
stone, palm leaves, wooden beam and rope.
Figure 17. The materials used for the construction of a house with Badgir
IV. LOCAL MEASUREMENTS
TABLE I. MEASUREMENTS PERFORMED IN KONG ON AUGUST 2015
Time Outside air Inside air
Hours Velocity m/s TºC Velocity m/s TºC ΔT
7h 3,2 38,1 2,5 32,5 5,6 8h 3,5 38,2 2,2 32,7 5,5 9h 3 39 2,5 32,9 6,1 10h 4,1 39,5 2,4 33,1 6,4 11h 4 42 2,9 33,3 8,7 12h 3,8 43,6 2,5 34,2 9,4 13h 3,5 44,2 2,5 34,6 9,6 14h 3 44 2,3 33,2 10,8 15h 3,1 41,3 2,4 32,8 8,5 16h 3,2 39,2 2,4 32,2 7 17h 3,2 38,2 2,4 32,2 6
V. EXPERIMENTS IN WIND TUNNEL
Figure 18. The Wind Tunnel of Paris-Ouest University, Ville d’Avray
Figure 19. The model used in the wind tunnel with breakthrough wall for
pressures analyzes
A. Four different angles are measured The velocity in wind tunnel is 20 m/s. As in the city of
Kong, we observed an important inclination of Badgir in front of the prevailing wind, we test four different angles: 0°, 15°, 30° and 45° to show the efficiency of the tower. The next figure show how we proceed.
World Congress on Sustainable Technologies (WCST-2015)
Copyright © 2015 Technical Co-Sponsored by IEEE UK/RI Computer Chapter 147

Figure 20. Different angles of the model in front of the prevailing wind
VI. EXPERIMENTAL RESULTS
A. Interpretation: When α=0°, the pressure drop is higher in B, C and D than
in A. The ventilation of the first model is carried out by all conduits. The A is working by sucking air from outside while the B, C and D are blowing air.
When α=30° the A and B are working by suction while C and D by blowing.
Figure 21. α=30°
VII. FLUENT MODELING The 3D drawing has been drawn after the model used for
wind tunnel.
Figure 22. 3D drawing and the domain of the wind tower
The wind speed for this experimentation on four different angles is 20m/s.
A. 0° Wind Angle
Figure 23. The velocity at B and D are very low
B. 30° Wind Angle
Figure 24. At 30º, the velocity in A and D is lower
Figure 25. At 30°, the velocity is superior in B and C. The A and D receive,
but B and C evacuate air
We observe that for 30° wind angle, the velocity vectors are smoother in B and D.
C. 45° Wind Angle
Figure 26. 45º wind angle
In fact, at 30°, one duct inhale and three other ducts of the Badgir exhale. That means three ducts allows the same portion of air evacuated to the outside. And we can conclude that the hot air is evacuated permanently at 30°.
Figure 27. The behavior of air in the ducts
Figure 28. At 30º, one duct inhale and three other ducts exhale
World Congress on Sustainable Technologies (WCST-2015)
Copyright © 2015 Technical Co-Sponsored by IEEE UK/RI Computer Chapter 148

Figure 29. Comparison of Fluent and wind tunnel
VIII. ASSUMPTIONS This part determines the air flow in a building equipped
with a Badgir where wind incident angle is 30º and the effects of finite temperature vary between inside walls and ceiling. Once the flow equation is solved, airflow rates and flow distributions are calculated. The numerical method employed in this study is based on 3D finite volume method. The flow field is analyzed by a simple algorithm. Algebra equation system will be solved by a line to line TDMA (Tri Diagonal Matrix Algorithm) method until convergence. The k-ε RNG model for viscosity is recommended for good results and also good simulation stability. Steady state conditions are assumed.
In this study, the effect of door and window locations on airflow distribution into the room, and air mass flow rate of doors and windows, has been investigated. The changes were recorded by displacing the door location from left to right (vice-versa) and the windows from up to down (vice-versa).
Figure 30. Impact of different places of the openings
TABLE II. DOOR AND WINDOW LOCATIONS FOR 9 STATES
Windows location Door location State Num.
Main place Moved to the left of the main place Equal to door width 1 1-1
Main place Main place 2 1-2
Upper than the main place Moved to the left of the main place Equal to door width 4 2-1
Upper than the main place Main place 5 2-2
Lower than the main place Moved to the left of the main place Equal to door width 7 3-1
TABLE III. MASS FLOW RATE RATIO OF DOOR AND WINDOWS ON WINDWARD FOR 9 STATES
NUM. STATE D/B % W/B % SUM %
1-1 1 14.53 19.6 34.13
1-2 2 20.7 19.6 40.3
2-1 4 14.09 20.66 34.75
2-2 5 22.33 19.9 42.23
3-1 7 14.68 18.5 33.18
As shown in the figure in bold letters, during this experience we found that, more windows are placed in the bottom area; the more speed there is at the output.
IX. CONCLUSIONS The aerodynamic aspects are examined numerically by
using CFD (Computational Fluid Dynamics). The calculated velocity and pressure fields are compared to measurements taken on the model installed in a wind tunnel. We measured important factors in these calculations as different wind speeds, temperatures or wind incident angles. We considered the humidity, building materials (earth clay), thickness of the walls and location openings. Following various tests, in Iran, then the wind tunnel tests, and then with Fluent, an angle of 32° remains the optimum angle for this Badgir experience. We observe that at 32° angle, one duct is blowing while three other ducts are evacuating air. Other important conclusion is that more windows are placed in the bottom, more speed there is at the point of evacuation.
REFERENCES [1] Dehghan Kamaragi, G.R, (2014), Thesis “Ventilation and cooling in the
traditional architecture of the Persian Gulf: Historic devices, modeling and performance evaluation. Thermal and aerodynamic performance of a wind tower”. Paris-Est University.
[2] Ghobadian, V., (1998). “Climatic Analysis of the Iranian Traditional Buildings”, Tehran: TehranUniversity.
[3] Montazeri, H., Montazeri, F., Azizian, R., Mostafavi, S., “Two-sided wind catcher performance evaluation using experimental, numerical and analytical modeling”, Renewable Energy, vol. 35, pp. 1424-1435, 2010.
[4] Roaf, S. (1990). “The significance of thermal thresholds in the performance of some traditional technologies”, Proceedings of the North Sun Conference, Reading, Pergamon.
World Congress on Sustainable Technologies (WCST-2015)
Copyright © 2015 Technical Co-Sponsored by IEEE UK/RI Computer Chapter 149

Performance Evaluation of the Electro-Coagulation Treatment Process for the Removal of Total Suspended
Solids and Metals from Water
Hariraj Singh Department of Environmental Science and Engineering,
Indian School of Mines, Dhanbad Dhanbad 826004, Jharkhand, India E-mail id:[email protected]
Brijesh Kumar Mishra Department of Environmental Science and Engineering,
Indian School of Mines, Dhanbad Dhanbad 826004, Jharkhand, India
E-mail id: [email protected]
Abstract- Globalization, industrialization, mining, and uncontrolled population growth have fostered a shortage of potable water. Thus, it has become imperative to understand an effective and reasonable water purification technique. A renewed interest in electrocoagulation has been spurred by the search for reliable water-treatment processes. This paper has elucidated a technical approach for getting rid of heavy metals and total suspended solids from water using an aluminum electrode. The effect of operational parameters, i.e. current density, inter-electrode distance, operating time, and pH, were studied and evaluated for maximum efficiency. The study corroborates the correlation between current density and removal efficiency. Neutral pH and a low electrode gap have been found to aid the efficacy of the electrocoagulation. The results shows a maximum TSS removal efficiency of 76.6 % at a current density of 5.3 mA/cm2 and contact time of 30 minutes. In the heavy metal remediation, 30 min of process time has exhibited extreme reduction rates of 99 %, 59.2%, and 45.8%, for Cu, Cr, and Zn, respectively. During the experiments, electrical conductivity and dissolved solids were found to fluctuate by 5-6 % of the original value. Moreover, kinetic study has also demonstrated for pollutants removal follows first and second order model.
Keywords- Current density; electro-coagulation; effluents; heavy metals; precipitation; synthetic water
I. INTRODUCTION
The explosive population increase and expansion of urban areas have exacerbated adverse impacts on water resources. Nowadays, Mining and industries have been found to produce significant contributions in accelerating extent of contamination in the surroundings. Mine water and Industrial effluents are known antecedent of heavy metals. Doubtless, it has deteriorated water quality by incorporating a high absorption of toxic metals. The repercussions of metallic contaminants like Pb, Cr, Zn and Cu have scrutinized its wide application and thus it has been recommended to treat it before discharging. Thus, there is an exigency to develop effective and economical water purification technique to curtail its deleterious effects.
The right of all people to access suitable water supplies must thus be seen as a global challenge, the solution of which is dependent on the formulation and implementation of sustainable water management strategies. To speak this
problem, technical approaches such as ion exchange chromatography, ultrafiltration, reverse osmosis and chemical precipitation have been broken. But each treatment method comes with their respective pros and cons. For example, Ion exchange chromatography is highly effective in removing certain charged contaminants, but it requires costly resin regeneration. Ultra filtration and reverse osmosis are clean processes, merely they are prohibitively expensive. Chemical precipitation is a simple procedure; it does get high volume of gunk.
Researchers have explored different innovative approaches to unfold eco-friendly heavy metals remediation. Studies have revealed Electrocoagulation as one of the efficient and cost effective technique for the removal of heavy metals. This technique relies on the principal of segregating heavy metals in the presence of electric current using suitable electrodes [1]. In this process, Iron is the most widely used electrode followed by aluminum. When aluminum is used as anodes, it produces aluminum hydroxide, Al(OH)3, upon oxidation in an electrolytic system [2].
The objective of the study was to examine the treatability of model water containing metals Copper, Chromium. Zinc and suspended solid by EC by employing monopolar aluminum electrodes using mixed metal solutions, and to explore the effects of varying operating parameters such as the applied current density, initial pH of solution, and contact time for heavy metal removal and suspended solids. The purpose of this work was to look into the possibility of heavy metals (copper, chromium and zinc) and suspended solid removal under different operational variables (electrode materials, current density, interelectrode distance and operating time) from the synthetic water solution with EC process.
II. MATERIALS AND METHODS
A. Reagents and Solutions Reagents were prepared using distilled demineralized
water from the Mili-Q water system. Titrisol Merck® standard solutions of 1000 mg/l of copper, chromium, and zinc were used and solutions of different concentrations were obtained by adequate dilutions. PH of the solution was adjusted by 0.1N HCl and 0.1N NaOH solutions prepared from AR grade Merck® chemicals.
World Congress on Sustainable Technologies (WCST-2015)
Copyright © 2015 Technical Co-Sponsored by IEEE UK/RI Computer Chapter 150
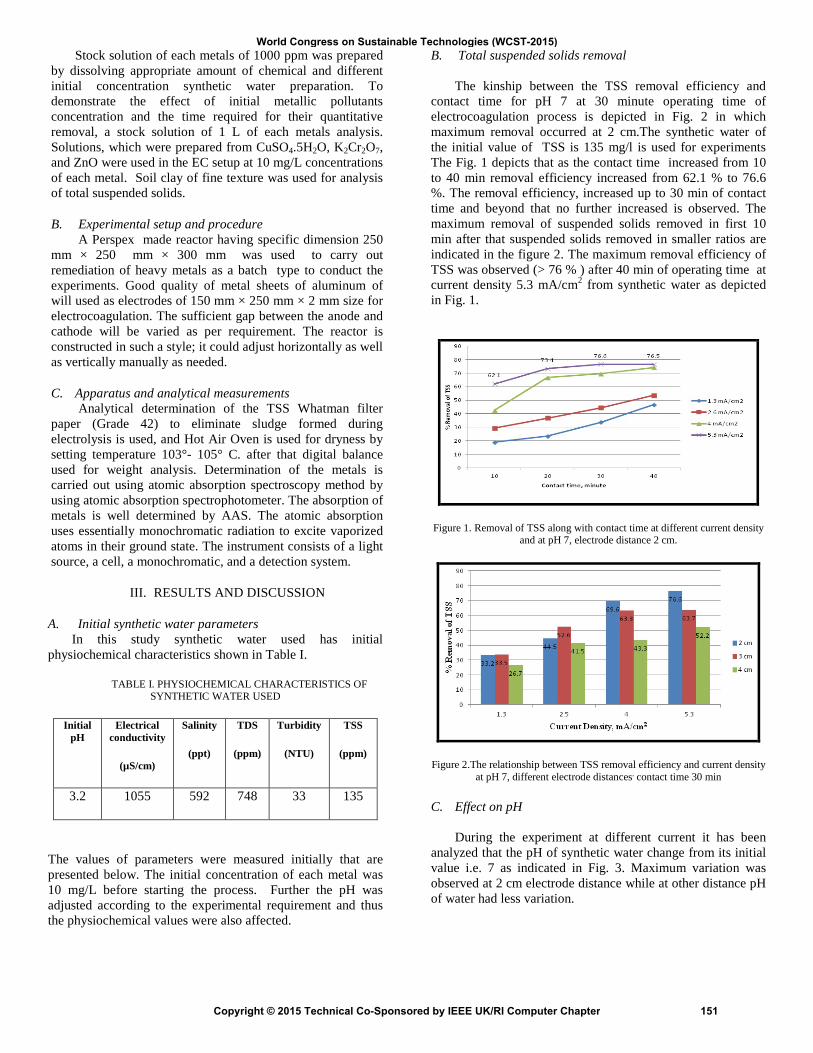
Stock solution of each metals of 1000 ppm was prepared by dissolving appropriate amount of chemical and different initial concentration synthetic water preparation. To demonstrate the effect of initial metallic pollutants concentration and the time required for their quantitative removal, a stock solution of 1 L of each metals analysis. Solutions, which were prepared from CuSO4.5H2O, K2Cr2O7, and ZnO were used in the EC setup at 10 mg/L concentrations of each metal. Soil clay of fine texture was used for analysis of total suspended solids.
B. Experimental setup and procedure A Perspex made reactor having specific dimension 250
mm × 250 mm × 300 mm was used to carry out remediation of heavy metals as a batch type to conduct the experiments. Good quality of metal sheets of aluminum of will used as electrodes of 150 mm × 250 mm × 2 mm size for electrocoagulation. The sufficient gap between the anode and cathode will be varied as per requirement. The reactor is constructed in such a style; it could adjust horizontally as well as vertically manually as needed.
C. Apparatus and analytical measurements Analytical determination of the TSS Whatman filter
paper (Grade 42) to eliminate sludge formed during electrolysis is used, and Hot Air Oven is used for dryness by setting temperature 103°- 105° C. after that digital balance used for weight analysis. Determination of the metals is carried out using atomic absorption spectroscopy method by using atomic absorption spectrophotometer. The absorption of metals is well determined by AAS. The atomic absorption uses essentially monochromatic radiation to excite vaporized atoms in their ground state. The instrument consists of a light source, a cell, a monochromatic, and a detection system.
III. RESULTS AND DISCUSSION
A. Initial synthetic water parameters In this study synthetic water used has initial
physiochemical characteristics shown in Table I.
TABLE I. PHYSIOCHEMICAL CHARACTERISTICS OF SYNTHETIC WATER USED
Initial pH
Electrical conductivity
(µS/cm)
Salinity
(ppt)
TDS
(ppm)
Turbidity
(NTU)
TSS
(ppm)
3.2 1055 592 748 33 135
The values of parameters were measured initially that are presented below. The initial concentration of each metal was 10 mg/L before starting the process. Further the pH was adjusted according to the experimental requirement and thus the physiochemical values were also affected.
B. Total suspended solids removal
The kinship between the TSS removal efficiency and contact time for pH 7 at 30 minute operating time of electrocoagulation process is depicted in Fig. 2 in which maximum removal occurred at 2 cm.The synthetic water of the initial value of TSS is 135 mg/l is used for experiments The Fig. 1 depicts that as the contact time increased from 10 to 40 min removal efficiency increased from 62.1 % to 76.6 %. The removal efficiency, increased up to 30 min of contact time and beyond that no further increased is observed. The maximum removal of suspended solids removed in first 10 min after that suspended solids removed in smaller ratios are indicated in the figure 2. The maximum removal efficiency of TSS was observed (> 76 % ) after 40 min of operating time at current density 5.3 mA/cm2 from synthetic water as depicted in Fig. 1.
Figure 1. Removal of TSS along with contact time at different current density and at pH 7, electrode distance 2 cm.
Figure 2.The relationship between TSS removal efficiency and current density at pH 7, different electrode distances, contact time 30 min
C. Effect on pH
During the experiment at different current it has been analyzed that the pH of synthetic water change from its initial value i.e. 7 as indicated in Fig. 3. Maximum variation was observed at 2 cm electrode distance while at other distance pH of water had less variation.
World Congress on Sustainable Technologies (WCST-2015)
Copyright © 2015 Technical Co-Sponsored by IEEE UK/RI Computer Chapter 151
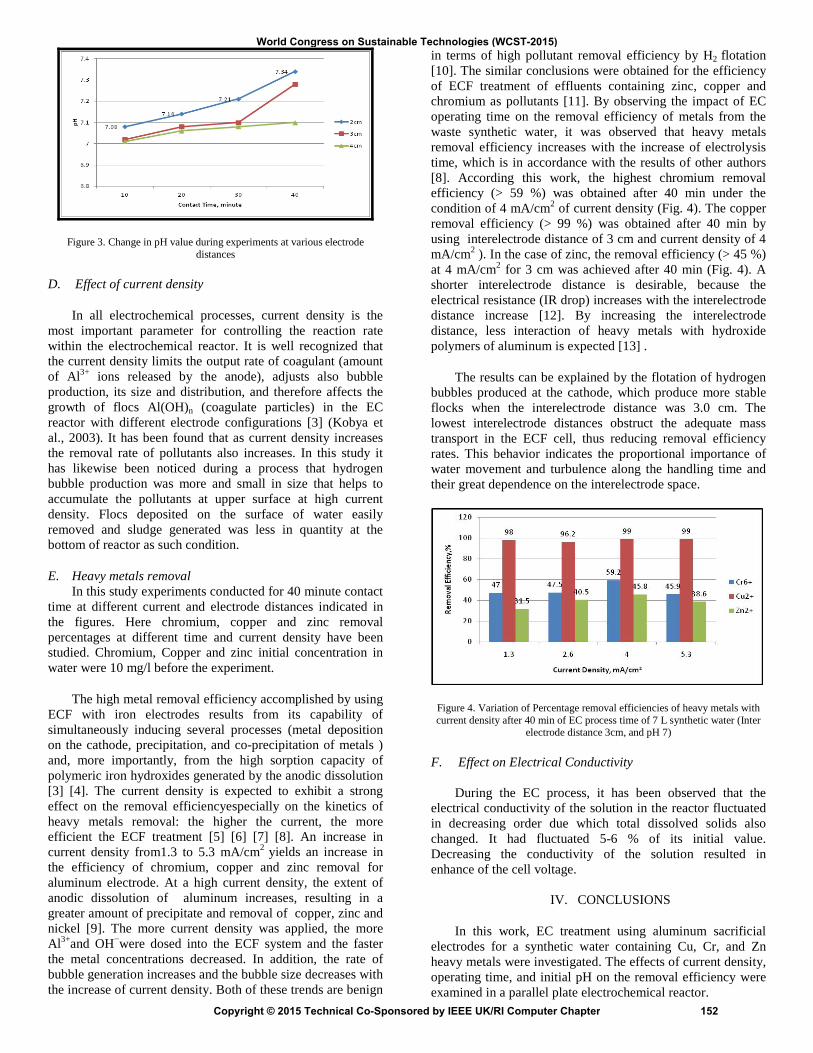
Figure 3. Change in pH value during experiments at various electrode distances
D. Effect of current density
In all electrochemical processes, current density is the most important parameter for controlling the reaction rate within the electrochemical reactor. It is well recognized that the current density limits the output rate of coagulant (amount of Al3+ ions released by the anode), adjusts also bubble production, its size and distribution, and therefore affects the growth of flocs Al(OH)n (coagulate particles) in the EC reactor with different electrode configurations [3] (Kobya et al., 2003). It has been found that as current density increases the removal rate of pollutants also increases. In this study it has likewise been noticed during a process that hydrogen bubble production was more and small in size that helps to accumulate the pollutants at upper surface at high current density. Flocs deposited on the surface of water easily removed and sludge generated was less in quantity at the bottom of reactor as such condition.
E. Heavy metals removal In this study experiments conducted for 40 minute contact
time at different current and electrode distances indicated in the figures. Here chromium, copper and zinc removal percentages at different time and current density have been studied. Chromium, Copper and zinc initial concentration in water were 10 mg/l before the experiment.
The high metal removal efficiency accomplished by using ECF with iron electrodes results from its capability of simultaneously inducing several processes (metal deposition on the cathode, precipitation, and co-precipitation of metals ) and, more importantly, from the high sorption capacity of polymeric iron hydroxides generated by the anodic dissolution [3] [4]. The current density is expected to exhibit a strong effect on the removal efficiencyespecially on the kinetics of heavy metals removal: the higher the current, the more efficient the ECF treatment [5] [6] [7] [8]. An increase in current density from1.3 to 5.3 mA/cm2 yields an increase in the efficiency of chromium, copper and zinc removal for aluminum electrode. At a high current density, the extent of anodic dissolution of aluminum increases, resulting in a greater amount of precipitate and removal of copper, zinc and nickel [9]. The more current density was applied, the more Al3+and OH−were dosed into the ECF system and the faster the metal concentrations decreased. In addition, the rate of bubble generation increases and the bubble size decreases with the increase of current density. Both of these trends are benign
in terms of high pollutant removal efficiency by H2 flotation
[10]. The similar conclusions were obtained for the efficiency of ECF treatment of effluents containing zinc, copper and chromium as pollutants [11]. By observing the impact of EC operating time on the removal efficiency of metals from the waste synthetic water, it was observed that heavy metals removal efficiency increases with the increase of electrolysis time, which is in accordance with the results of other authors [8]. According this work, the highest chromium removal efficiency (> 59 %) was obtained after 40 min under the condition of 4 mA/cm2 of current density (Fig. 4). The copper removal efficiency (> 99 %) was obtained after 40 min by using interelectrode distance of 3 cm and current density of 4 mA/cm2 ). In the case of zinc, the removal efficiency (> 45 %) at 4 mA/cm2 for 3 cm was achieved after 40 min (Fig. 4). A shorter interelectrode distance is desirable, because the electrical resistance (IR drop) increases with the interelectrode distance increase [12]. By increasing the interelectrode distance, less interaction of heavy metals with hydroxide polymers of aluminum is expected [13] .
The results can be explained by the flotation of hydrogen bubbles produced at the cathode, which produce more stable flocks when the interelectrode distance was 3.0 cm. The lowest interelectrode distances obstruct the adequate mass transport in the ECF cell, thus reducing removal efficiency rates. This behavior indicates the proportional importance of water movement and turbulence along the handling time and their great dependence on the interelectrode space.
Figure 4. Variation of Percentage removal efficiencies of heavy metals with current density after 40 min of EC process time of 7 L synthetic water (Inter
electrode distance 3cm, and pH 7)
F. Effect on Electrical Conductivity
During the EC process, it has been observed that the electrical conductivity of the solution in the reactor fluctuated in decreasing order due which total dissolved solids also changed. It had fluctuated 5-6 % of its initial value. Decreasing the conductivity of the solution resulted in enhance of the cell voltage.
IV. CONCLUSIONS
In this work, EC treatment using aluminum sacrificial electrodes for a synthetic water containing Cu, Cr, and Zn heavy metals were investigated. The effects of current density, operating time, and initial pH on the removal efficiency were examined in a parallel plate electrochemical reactor.
World Congress on Sustainable Technologies (WCST-2015)
Copyright © 2015 Technical Co-Sponsored by IEEE UK/RI Computer Chapter 152

In the study, at the current density of 4 mA/cm2 with a total energy consumption of 0.459 kWh/m3, more than 98% removal efficiency was obtained for Cu, 59.2 % for Cr and 45.8% for Zn.It has been observed that total suspended solids removal of set of synthetic water was higher 76.6 % at electrode distance 2cm and 5.3 mA/cm2 current density. Heavy metal, copper has been removed 99 % at current 4 mA/cm2 for 3 cm at contact time 40 minutes respectively. In respect of Chromium high efficiency 59.2 % was found at electrode distance 3cm, 4 mA/cm2 current density and time 40 minute. During experiments, it was observed that pH of water increased more at lower current, i.e. it changed from 7 to 7.34.
In this study concluded that current density required for efficient removal of heavy metals is lower at minimum time 30 min of process except zinc. Here it has been observed removal efficiency almost same for electrode distance 2 cm or 3cm and operating time 30 to 40 min.
Granting to the closing remarks, EC using monopolar aluminum electrodes is convenient and less power consumption for effective removal of heavy metals from synthetic water and achieves faster removal of pollutants in comparison to chemical coagulation, where several hours are needed and adsorption on activated carbon.
ACKNOWLEDGMENT
We would wish to get hold of this chance to convey our sincere gratitude to TEQIP -II for funding this research study. We are immensely grateful to Indian School of Mines for their unconditional support and encouragement.
REFERENCES
[1] K. Rajeshwar, J. Ibanez and G.M. Swain, 1994. Electrochemistry and the environment, J. Appl. Electrochem. 24, 1077–1091.
[2] M. Kobya, H. Hiz, E. Senturk, C. Aydiner, E. Demirbas, Treatment of potato chips manufacturing wastewater by electrocoagulation, Desalination 190 (2006) 201–211.
[3] N. Adhoum, L. Monser, N. Bellakhal, J.E. Belgaied, Treatment of electroplating wastewater containing Cu2+, Zn2+ and Cr (VI) by electrocoagulation, J. Hazard. Mater. 112 , 2004, pp. 207–213.
[4] N. Meunier, P. Drogui, C. Gourvenec, G. Mercier, R. Hausler and J. F. Blais, “Removal of metals in leachate from sewage sludge using electrochemical technology”, Environ. Technol. 25,2004, pp. 235–245.
[5] G. Chen, “Electrochemical Technologies in Wastewater Treatment, Separation and purification, 38, 2004, pp 11-41.
[6] P. K. Holt, G. W. Barton and C .A. Mitchell, “The future for electrocoagulation as a Localised water treatment technology”, Chemosphere, 59, 2005, pp. 355–367.
[7] O. T. Can, M. Kobya, E. Demirbas and M. Bayramoglu, “Treatment of the textile wastewater by combined electrocoagulation”, Chemosphere 62, 2006, pp. 181–187.
[8] G. Mouedhen, M. Feki, M. D. P. Wery and H. F. Ayedi, “Behavior of aluminum electrodes in electrocoagulation process”, J. Hazard. Mater. 150 (1), 2008, pp. 124–135.
[9] B. Merzouk, B. Gourich, A. Sekki, K. Madani and M. Chibane,
“Removal turbidity and separation of heavy metals using electrocoagulation-electroflotation technique a case study”. J. Hazard. Mater. 164, 2009, pp. 215–222.
[10] F. Akbal and S. Camci, “ Copper, chromium and nickel removal from metal plating wastewater by electrocoagulation”, Desalination, 269, 2011, pp. 214–222.
[11] I. Heidmann and W. Calmano, “ Removal of Zn (II), Cu (II), Ni (II), Ag (I) and Cr (VI) present in aqueous solutions by aluminium electrocoagulation”, J. Hazard. Mater. 152, 2008, pp. 934–941.
[12] E. Mohora, S. Roncevic, B. Dalmacija, J. Agbaba, M.Watson, E. Karlovic and M. Dalmacija, M. (2012) “Removal of natural organic matter and arsenic from water by electrocoagulation/flotation continuous flow reactor”, J. Hazard. Mater. 235, 2012, pp. 257-264.
[13] N. Modirshahla, M. A. Behnajadya, and S. A. Mohammadi, “Investigation of the effect of different electrodes and their connections on the removal efficiency of 4-nitrophenol from aqous solution by electrocoagulation”, J. hazard. Mater. 154, 2008, pp.778-786.
World Congress on Sustainable Technologies (WCST-2015)
Copyright © 2015 Technical Co-Sponsored by IEEE UK/RI Computer Chapter 153
Study on Impacts of Auto-Rickshaws on Fuel Consumption and Delay of Personal Vehicles
Prasenjit Adak, Suresh Pandian Elumalai, Ravi Sahu Department of Environmental Science and Engineering
Indian School of Mines Dhanbad, India
Abstract— Present study attempts to quantify the effect shared auto-rickshaws (SAs) assert on driving pattern of motorcycles (MCs) and passenger cars (PCs) in terms of fuel consumption and exhaust emission. A three day long SA strike was used to compare the driving pattern of MCs and PCs with that of a regular busy day. Driving cycles (DCs) for all three vehicle classes were generated using on-board measurement of speed profiles prior the strike. Similarly, DCs for MCs and PCs were generated during the strike. About 88% reduction in idle time period and 50% reduction in cruising period were observed for MCs during the strike. For PCs the reductions were about 71% and 36% respectively. Average speeds were increased by 42% and 23% for MCs and PCs respectively, which contributes in significant amount of fuel savings. Efficiency of a separate SA lane as an alternative way to improve the fuel consumption scenario was also evaluated in this study. It was seen that about 48% fuels can be saved by the SAs if a separate lane is used and if they follow strict rules about pick up and drop services.
Keywords- Shared auto-rickshaw; heterogeneous traffic; fuel consumption
I. INTRODUCTION Urbanization has become a common feature of modern
societies. Since the starting of 20th century, urbanization is accelerated worldwide. In 1950, 30% of the world’s population was urban. In 2014, 54 % of the world’s population was reported to reside in urban areas and it is projected to be 66% in 2050 [1]. As an obvious consequence of urbanization and technological advancement in motor industries, the number of public and private transport has increased drastically over few decades. Lack of sufficient road facilities in developing countries to accommodate large number of vehicle often causes traffic congestion in commercial and occupational areas. Most of the cities in developing countries like India experience heterogeneous traffic due to the lack of separate lanes for different vehicle classes. As a result driving patterns of public transports and private transports influence each other.
Shared auto-rickshaw (SA) is one of the major public transports in many cities in India. It gained popularity as a public transport due to its smaller size than bus, greater number and frequency, flexibility is route selection and better maneuvering capability. Due to the lack of proper regulation
and pre-defined stoppages, in many cities in India, SAs pick and drop passengers anywhere in the operating route depending on the availability of the passengers. Un-planned stopping behavior of SAs compels the following vehicles to reduce their speed or to remain in idle mode for some times which affects the fuel economy of the vehicles. Un-planned stopping behavior of Shared Auto-rickshaws (SAs) compels the following vehicles to reduce their speed or to remain in idle mode for some times which affects the fuel economy of the vehicles.
Fuel consumed by a vehicle is a function of time spent by that vehicle in different driving modes [2], [3] and [4]. In different driving modes, the engine power demands are different which cause the engine to consume different amount of fuel in each mode. Increased fuel consumption in highways and urban roadways not only contributes in wastage of non-renewable resource but also causes air pollution. In order to reduce fuel consumption and to control vehicular emission, it is immensely important to formulate strict rules and sustainable policies. Several work have been done for estimation of fuel consumption using modal distribution of travel time of urban buses [5], [6] and [7] but similar work using SA has not been done so far. Present study attempts to estimate the fuel consumed by SA as well as MC and PC in urban road network. In this study the driving characteristics of SAs, MCs and PCs in heterogeneous traffic were studied and real-world DCs were compared to the speed profiles of MCs, SAs and PCs in a modified road facility with a simulated SA lane. The effect of public transport on amount of fuel consumed by both public and private transports is also demonstrated and quantified in this study.
II. MATERIALS AND METHODS
A. Study Area Dhanbad city experiences a huge flow of daily traffic,
especially at occupational areas that are mostly located beside National Highway 32 (NH-32). NH-32 is the most important roadway of Dhanbad city. The study area and study route selected for this study are depicted in Fig. 1. 12 SA pickup and drop points were identified in the road segment under study.
World Congress on Sustainable Technologies (WCST-2015)
Copyright © 2015 Technical Co-Sponsored by IEEE UK/RI Computer Chapter 154

Figure 1: Map of study area and study route
B. Data Collection and Development Of DC For MC, SA and PC In this study, on-board measurement method was used to
collect speed profile data. Speed profiles of MCs, SAs and PCs were collected during the peak hours on non-strike days. On strike day the speed profiles of MCs and PCs were collected similarly. Collected speed profiles were preprocessed using the method described in Fincher et al. [8] which involves waiting time removal and exclusion of stuck speed blocks and false trips from the speed profiles. A custom made computer program written in AutoIt (a BASIC-like scripting language) to generate DCs of MCs, SAs and PCs from preprocessed speed profiles. Freeway speed of SA was recorded at nighttime to avoid the speed reduction due to traffic congestion and interaction of other vehicles. Average freeway speed was found to be 42 km/hr.
C. Development of Speed Profile of SAs in a Hypothetical SA Lane In order to develop the speed profile of SA on a
hypothetical separate SA lane, the geometry of the road segment under study was observed. 34 road curvatures in the entire stretch were identified. Radius of each curvature was calculated using chord-offset method. The chord length was taken as 100 feet as suggested in Carlson et al. [9]. Field measurement of middle offset was done for each curvature. Design speed was calculated on the basis of radius of each curvature and side friction co-efficient using the method described in IRC [10]. The curvatures were assumed not to be super-elevated. Side friction factor was assumed to be 0.15 as suggested in IRC [10]. Linear segments of the road stretch under study were assumed to have constant a speed same as free flow speed of SA in the road segment under study. As the passenger pick and drop action contributes in total delay and hence affects the overall speed profile of SA, 11 pick and drop stoppages in the study road stretch were identified. Average delay for passenger pick and drop at each SA stoppage was
assumed to be 30 second. Stopping delay at each of the pick and drop stoppages were introduced in the derived speed profile. As pick and drop process includes a deceleration and an acceleration phase, a linear interpolated simulation of acceleration and deceleration was incorporated in the speed profile. The acceleration and deceleration introduced, was derived from the real-world DC of SA.
D. Fuel Consumption Estimation A modal fuel consumption model [11] was used for fuel
consumption calculation for MC, SA and PC from their DCs. It calculates the second-wise fuel consumption in each of the four driving modes (idle mode, acceleration mode, deceleration mode and cruising mode) separately. Then the total fuel consumption is calculated by summing up the fuel consumption in individual driving modes for the entire travel time.
III. RESULTS AND DISCUSSION
A. Traffic Scenario Traffic parameters obtained from the analysis of the real-
world DCs of MC, SA and PC are tabulated in Table I. The obtained real world DCs of MC, SA and PC revealed that SA was slower moving vehicle class than MC and PC. Average acceleration of SA is less than that of PC and MC but average deceleration is greater than PC. It indicates a special pattern of movement which reflects the driver’s expectation to pick up passengers even after pre-defined extent of SA stoppages. Maximum speed of SA and value of mean length of driving periods was less than that of MC and PC which may be a result of driver’s habit to pick up passengers mid-way.
From generated DCs it can be observed that average and maximum speed on strike day was higher than that of ordinary days. As a result, total travel time on ordinary days was more. Because of less traffic congestion, number of idle period was also less on strike day. Fig. 2 and Fig. 3 show the proportion of time spent by MC in different driving modes in ordinary days and in a SA strike day. Idle mode of MC was significantly less on strike day. Proportion of cruising time for MC on strike day was found to be less than that of an ordinary day. Time spent in accelerating mode was observed to be higher on strike day than that of ordinary days. The speed profiles were found to differ from each other significantly. In ordinary days DC, it took 1384 second to cover the study route whereas in a SA strike day it took only 1222 second to cover the same distance.
Like MCs, PCs also experienced the reduction of average
and maximum speed on strike day. Reduction of idle and cruising period was seen (Fig. 4 and Fig. 5). Increment in total travel time and time spent in accelerating period was observed. Number of idle periods on strike day was found to be less on strike day compared to ordinary days. In ordinary day DC, PCs take 2829 second to cover the road segment under study whereas the same distance is covered in 2322 second in an SA strike day. Increment in maximum speed of PC was also observed in a SA strike day.
World Congress on Sustainable Technologies (WCST-2015)
Copyright © 2015 Technical Co-Sponsored by IEEE UK/RI Computer Chapter 155

TABLE I. COMPARISON OF TRAFFIC PARAMETERS AMONG DIFFERENT VEHICLE CLASSES
Parameters MC SA PC
Time duration 1750 3491 2829
Avg. speed including idle 27.6 3.9 17.7
Avg. speed excluding idle 28.2 4.3 18.1
Maximum speed 45.8 14.6 39.1
Mean length of driving periods 342.8 121.8 276.8
Avg. acceleration 0.3 0.1 0.2
Avg. deceleration -0.3 -0.2 -0.2
% time spent in idle mode 2 9 2
% time spent in acceleration mode 46 40 44
% time spent in deceleration mode 45 44 42
% time spent in cruising mode 7 7 12
Figure 2: Distribution of time spent by MC in different driving modes in
ordinary days
Figure 3: Distribution of time spent by MC in different driving modes in a
SA strike day
Figure 4: Distribution of time spent by PC in different driving modes in
ordinary days
Figure 5: Distribution of time spent by PC in different driving modes in a
SA strike day
B. Speed Profile of SAs in a Hypothetical SA Lane Speed profile of a SA in a hypothetical SA lane in Dhanbad
is presented in Fig. 6. Total 11 driving period was found in the entire study route. Although the curvature of the road was taken into consideration, it showed no effect in the final speed profile. As the free flow speed was less than the design speed in most of the curvatures, the vehicle could move easily with free flow speed in the curvature. For some of the curvature, although the design speed was less than the free flow speed, the SA was compelled to decelerate due to the presence of SA stoppage ahead. Thus it could not reach the design speed in any of the curvatures in the road segment under study.
Figure 6: Speed profiles of SA in a hypothetical SA lane
World Congress on Sustainable Technologies (WCST-2015)
Copyright © 2015 Technical Co-Sponsored by IEEE UK/RI Computer Chapter 156
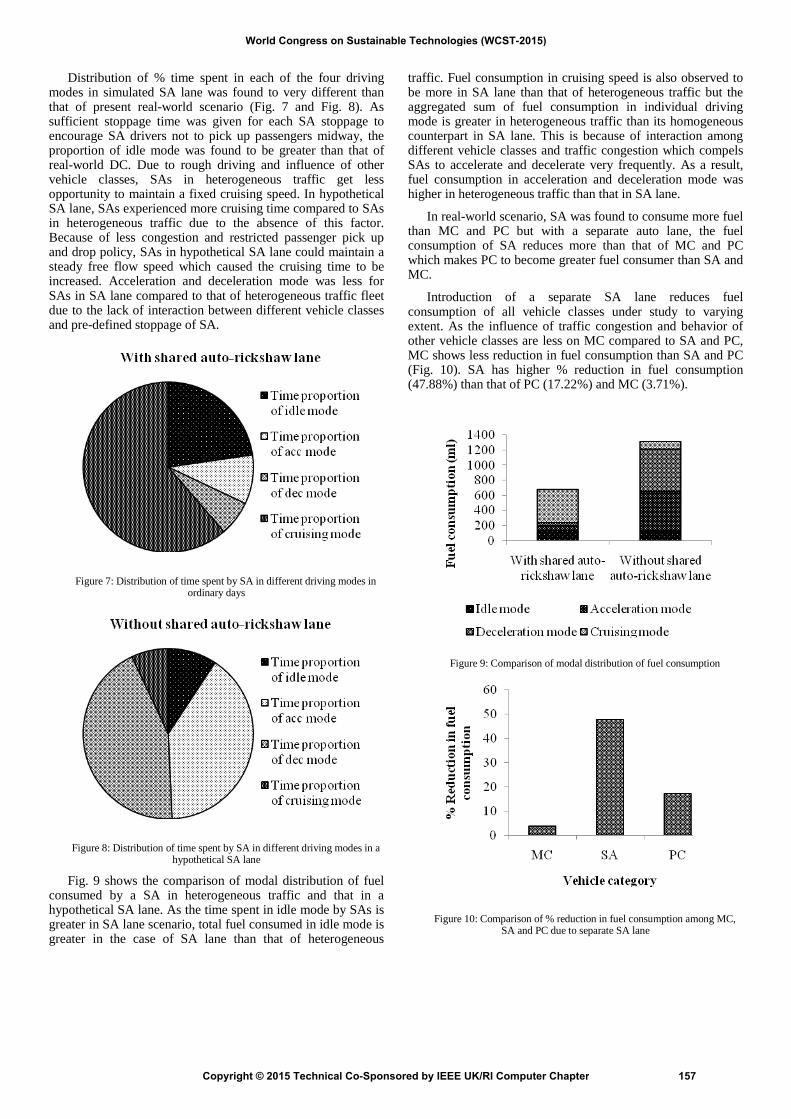
Distribution of % time spent in each of the four driving modes in simulated SA lane was found to very different than that of present real-world scenario (Fig. 7 and Fig. 8). As sufficient stoppage time was given for each SA stoppage to encourage SA drivers not to pick up passengers midway, the proportion of idle mode was found to be greater than that of real-world DC. Due to rough driving and influence of other vehicle classes, SAs in heterogeneous traffic get less opportunity to maintain a fixed cruising speed. In hypothetical SA lane, SAs experienced more cruising time compared to SAs in heterogeneous traffic due to the absence of this factor. Because of less congestion and restricted passenger pick up and drop policy, SAs in hypothetical SA lane could maintain a steady free flow speed which caused the cruising time to be increased. Acceleration and deceleration mode was less for SAs in SA lane compared to that of heterogeneous traffic fleet due to the lack of interaction between different vehicle classes and pre-defined stoppage of SA.
Figure 7: Distribution of time spent by SA in different driving modes in
ordinary days
Figure 8: Distribution of time spent by SA in different driving modes in a
hypothetical SA lane
Fig. 9 shows the comparison of modal distribution of fuel consumed by a SA in heterogeneous traffic and that in a hypothetical SA lane. As the time spent in idle mode by SAs is greater in SA lane scenario, total fuel consumed in idle mode is greater in the case of SA lane than that of heterogeneous
traffic. Fuel consumption in cruising speed is also observed to be more in SA lane than that of heterogeneous traffic but the aggregated sum of fuel consumption in individual driving mode is greater in heterogeneous traffic than its homogeneous counterpart in SA lane. This is because of interaction among different vehicle classes and traffic congestion which compels SAs to accelerate and decelerate very frequently. As a result, fuel consumption in acceleration and deceleration mode was higher in heterogeneous traffic than that in SA lane.
In real-world scenario, SA was found to consume more fuel than MC and PC but with a separate auto lane, the fuel consumption of SA reduces more than that of MC and PC which makes PC to become greater fuel consumer than SA and MC.
Introduction of a separate SA lane reduces fuel consumption of all vehicle classes under study to varying extent. As the influence of traffic congestion and behavior of other vehicle classes are less on MC compared to SA and PC, MC shows less reduction in fuel consumption than SA and PC (Fig. 10). SA has higher % reduction in fuel consumption (47.88%) than that of PC (17.22%) and MC (3.71%).
Figure 9: Comparison of modal distribution of fuel consumption
Figure 10: Comparison of % reduction in fuel consumption among MC,
SA and PC due to separate SA lane
World Congress on Sustainable Technologies (WCST-2015)
Copyright © 2015 Technical Co-Sponsored by IEEE UK/RI Computer Chapter 157

IV. CONCLUSION The results of present study shows that driving behavior
and occupational activities of SA affect the driving pattern of other vehicle classes in the fleet such as, MC and PC. This influence translates in fuel consumption scenario of the entire fleet. Absence of SA in traffic fleet significantly reduces fuel consumption of PC and MC. Fuel consumption in SA can be reduced many folds if a SA lane is constructed on the highway. This way the driving pattern of SA and vehicle classes other than SA do not hinder each other and traffic congestion is reduced. Location of pre-defined SA stoppages is also an important factor to determine fuel consumption of SA. Passengers pick and drop action in midway has a distinct effect on average speed, acceleration, deceleration and maximum speed of SA and hence it contributes in increased fuel consumption rate. As the hourly flow of different vehicles, width of the road and occurrence of different traffic facilities such as midblock section, roundabout, un-signalized intersection and signalized intersection also affect the speed profiles of the vehicles; further study is required in this aspect.
REFERENCES [1] United Nations, Department of Economic and Social Affairs, Population
Division. World Urbanization Prospects: The 2014 Revision, Highlights (ST/ESA/SER.A/352).
[2] D.Y.C. Leung, and D.J. Williams, “Modelling of motor vehicle fuel consumption and emissions using a power-based model,” Environ. Monit. Asses. 65, 2000, pp. 21–29.
[3] D. Schulz, T. Younglove, and M. Barth, “Statistical analysis and model validation of automobile emissions,” J.T. & S., 2000, pp. 29–38.
[4] M. Zalinger, T.L. Ahn, and S. Hausberger, “Improving an instantaneous emission model for passenger cars,” Proc. 14th Symposium Transport and Air Pollution 1, 1-3 June 2005. Graz, Austria (ISBN 3902465166), pp. 167–176.
[5] R. Penabaena-Niebles, V. Cantillo, and J.L. Moura, “Impact of transition between signal timing plans in social cost based in delay, fuel consumption and air emissions”, Transp. Res. D Transp. Environ. 41, 2015, pp. 445-456.
[6] H. Ma, H. Xie, D. Hung, and S. Xiong, “Effects of driving style on the fuel consumption of city buses under different road conditions and vehicle masses,” Transp. Res. D Transp. Environ. 41, 2015, pp. 205-216.
[7] Q. Yu, T. Li, and H. Li, “Improving urban bus emission and fuel consumption modeling by incorporating passenger load factor for real world driving,” Appl. Energ. 161, 2016, pp. 101–111.
[8] S. Fincher, C. Palacios, S. Kishan, D. Preusse, and H. Perez, “Modifying Link-Level Emissions Modeling Procedures for Applications within the MOVES Framework,” Publication Number: FHWA-HEP-11-006, Federal Highway Administration, September 2010.
[9] P. Carlson, M. Burris, K. Black, and E. Rose, “Comparison of radius-estimating techniques for horizontal curves,” T.R.R. Journal, 1918 , pp. 76–83.
[10] IRC: 73-1989, Geometric Design Standards for Rural (Non-Urban) Highways”, Indian Roads Congress, 1989, New Delhi.
[11] R., Akcelik, R.Smit, M. Besley, “Calibrating fuel consumption and emission models for modern vehicles,” IPENZ transportation group conference, March 2012, Rotorua, New Zealand.
World Congress on Sustainable Technologies (WCST-2015)
Copyright © 2015 Technical Co-Sponsored by IEEE UK/RI Computer Chapter 158

Copyright © WCST-2015 Published by Infonomics Society ISBN 978-1-908320-53-7 CFP1580P-USB
Many thanks for your participation!
We hope to see you at
World Congress on Sustainable Technologies (WCST-2016) www.wcst.org
Have a great trip back home!!!

Copyright © WCST-2015 Published by Infonomics Society ISBN 978-1-908320-53-7 CFP1580P-USB