Embed Size (px)
Citation preview
[email protected] www.risltd.com
WDO Study: Implications of Different Waste Feed Streams (Source-Separated Organics and Mixed Waste)
On Collection Options and Anaerobic Digestion Processing Facility Design, Equipment and Costs
Prepared for the City of Toronto Consultants: Allen Kani Associates with Enviros RIS Ltd.
Funding Provided by the Ontario Waste Diversion Organization (WDO)
December, 2001
WDO Study: Implications of Different Waste Feed Streams (Source Separated Organics and Mixed Waste) On Collection Requirements and Anaerobic Digestion Processing Facility Design, Equipment and Cost
December, 2001 Allen Kani and Enviros RIS Page 2
TABLE OF CONTENTS
1.0 INTRODUCTION 6 2.0 OVERVIEW OF ANAEROBIC DIGESTION 8
2.1 Introduction 8 2.2 Overview of North American and European AD Operations 8 2.3 AD Plants for Residential Waste in North America 9 2.4 General System Options 10 2.5 Approach to Cost Estimates 13 2.6 Waste Quantities to be Processed 13
3.0 SITING ISSUES 14
3.1 Overview 14 3.2 Siting Issues 14
3.2.1 Utilization of Methane Gas Production 14 3.2.2 Digestate and Leachate 15 3.2.3 Plant Size and Use Compatibility 16 3.2.4 Waste Collection and Transportation 16
3.3 Candidate Toronto Sites 16 3.3.1 Dufferin Transfer Station 17 3.3.2 Toronto Portlands Area 17 3.3.3 Other Sites 19
4.0 PROCESSING ISSUES AND COSTS 20
4.1 Conceptual Design and Equipment Needs 20 4.2 Processing Assumptions 21 4.3 Processing Capital Cost Estimates 21 4.4 Pre-Treatment Equipment 22
4.4.1 Assumptions about Contamination 22 4.4.2 Pre-Treatment Processing Equipment Capital Cost Estimates 24
4.5 Building Construction Costs 25 4.6 Summary of Estimated Capital Costs 25 4.7 Operation and Maintenance Costs 27
4.7.1 Key Assumptions 27 4.7.2 Residue Disposal Costs 28 4.7.3 Summary of O&M Cost Estimates 29
4.8 Summary of Annual Gross Processing Costs 31 4.8.1 Projected Diversion Estimates 32
5.0 COLLECTION ISSUES AND COSTS 33
5.1 Summary 33 5.2 Collection of Multi-Family Waste for Mixed Waste Processing 34 5.3 Collection of Single-Family Waste for Mixed Waste Processing 35 5.4 Collection of Single-Family SSO for Source Separated Processing 35 5.5 Other Costs 36
5.5.1 Households Containers 36 5.5.2 Promotion and Education 36
6.0 NET COST AND DIVERSION IMPACTS OF EACH SCENARIO 39
6.1 Markets, Diversion, and Gas Production Potential 39 6.2 Summary of Net Annual Cost Estimates 41 6.3 Integrated Assessment Considering Cost, Diversion and Gas Production 42
7.0 CONCLUSIONS AND RECOMMENDATIONS 44
WDO Study: Implications of Different Waste Feed Streams (Source Separated Organics and Mixed Waste) On Collection Requirements and Anaerobic Digestion Processing Facility Design, Equipment and Cost
December, 2001 Allen Kani and Enviros RIS Page 3
List of Tables
Table E-1 Summary of Estimated Costs, Diversion Impacts and Surplus Gas Production Potential of Different SSO and Mixed Waste Scenarios 4
Table 2-1 Summary of AD Plant Operating Characteristics 11 Table 2-2 Estimated Toronto Quantities by Waste Flow Scenario 13 Table 4-1 Assumed AD Plant Capacity Requirements per Waste Flow Scenario 21 Table 4-2 Estimated Capital Cost of Commercial Single-Stage Dry AD Systems 22 Table 4-3 Estimated Incremental Pre-Treatment Processing Equipment Costs for a Generic
50,000 tonne per year AD Mixed Waste Facility 24 Table 4-4 Estimated Building Costs by Waste Flow Scenario and Number of Plants 25 Table 4-5 Estimated Equipment and Building Capital Costs by Waste Flow Scenario 26 Table 4-6 Estimated Labour Costs of Mixed Waste Pre-Treatment 28 Table 4-7 Assumed Residue Generation in Generic AD Plants 28 Table 4-8 Estimated Waste Diversion, Residue Generation and Disposal Costs 29 Table 4-9 Estimated O&M Cost by Waste Flow Scenario and Plant Size 30 Table 4-10 Estimated Average Annual Gross Processing Costs 31 Table 4-11 Projected Residential Waste Diversion Rates by Waste Flow Scenario 32 Table 5-1 Summary of Incremental Annual Costs of SSO Implementation 34 Table 5-2 Typical Promotion and Education Timeline for Organics Program Roll-Out 37 Table 5-3 Preliminary Estimate Of Additional Staff Needed By Toronto To Roll Out SSO
Strategy 38 Table 6-1 Estimated Revenue from Sale of Surplus Gas and Compost 40 Table 6-2 Summary of Estimated Net Annual Costs by Waste Flow Scenario 42 Table 6-3 Estimated Diversion, Gas Production and Costs of Three Scenarios 43 Table 6-4 Annual and Per Household Costs of Three Scenarios 43
WDO Study: Implications of Different Waste Feed Streams (Source Separated Organics and Mixed Waste) On Collection Requirements and Anaerobic Digestion Processing Facility Design, Equipment and Cost
December, 2001 Allen Kani and Enviros RIS Page 4
EXECUTIVE SUMMARY
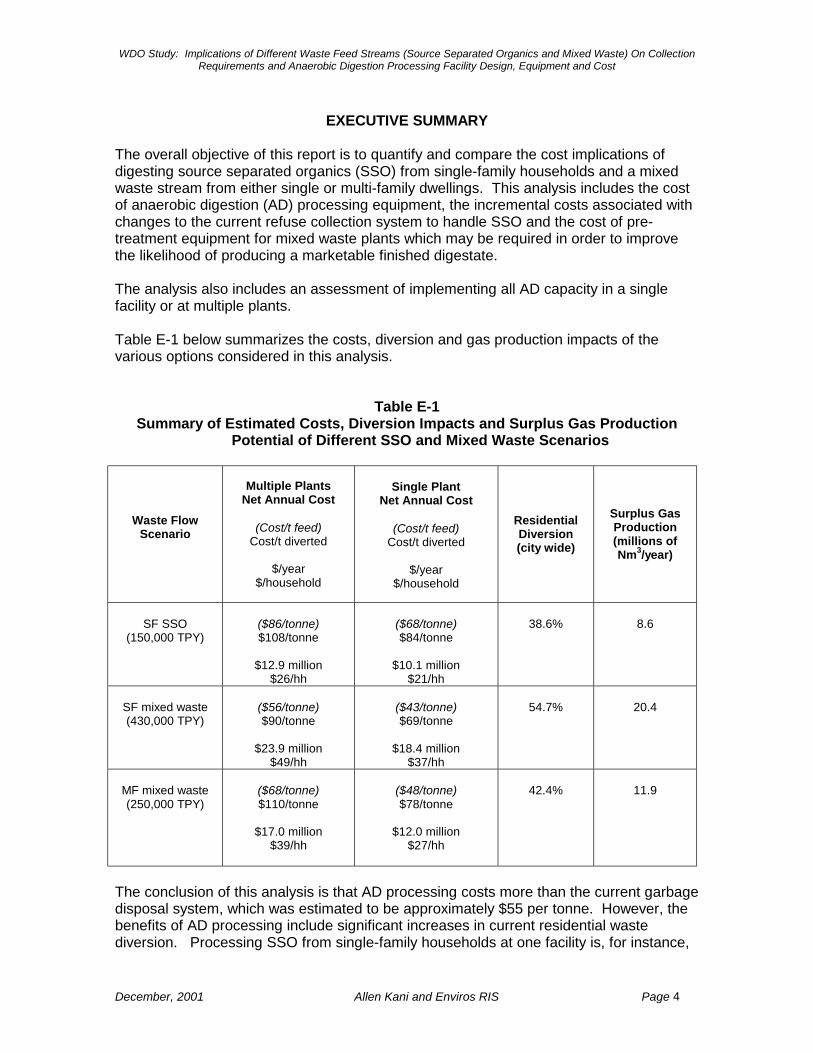
The overall objective of this report is to quantify and compare the cost implications of digesting source separated organics (SSO) from single-family households and a mixed waste stream from either single or multi-family dwellings. This analysis includes the cost of anaerobic digestion (AD) processing equipment, the incremental costs associated with changes to the current refuse collection system to handle SSO and the cost of pre-treatment equipment for mixed waste plants which may be required in order to improve the likelihood of producing a marketable finished digestate. The analysis also includes an assessment of implementing all AD capacity in a single facility or at multiple plants. Table E-1 below summarizes the costs, diversion and gas production impacts of the various options considered in this analysis.
Table E-1
Summary of Estimated Costs, Diversion Impacts and Surplus Gas Production Potential of Different SSO and Mixed Waste Scenarios
Waste Flow Scenario
Multiple Plants Net Annual Cost
(Cost/t feed)
Cost/t diverted
$/year $/household
Single Plant
Net Annual Cost
(Cost/t feed) Cost/t diverted
$/year
$/household
Residential Diversion (city wide)
Surplus Gas Production (millions of Nm3/year)
SF SSO
(150,000 TPY)
($86/tonne) $108/tonne
$12.9 million
$26/hh
($68/tonne) $84/tonne
$10.1 million
$21/hh
38.6%
8.6
SF mixed waste (430,000 TPY)
($56/tonne) $90/tonne
$23.9 million
$49/hh
($43/tonne) $69/tonne
$18.4 million
$37/hh
54.7%
20.4
MF mixed waste (250,000 TPY)
($68/tonne) $110/tonne
$17.0 million
$39/hh
($48/tonne) $78/tonne
$12.0 million
$27/hh
42.4%
11.9
The conclusion of this analysis is that AD processing costs more than the current garbage disposal system, which was estimated to be approximately $55 per tonne. However, the benefits of AD processing include significant increases in current residential waste diversion. Processing SSO from single-family households at one facility is, for instance,
WDO Study: Implications of Different Waste Feed Streams (Source Separated Organics and Mixed Waste) On Collection Requirements and Anaerobic Digestion Processing Facility Design, Equipment and Cost
December, 2001 Allen Kani and Enviros RIS Page 5
estimated to cost 25% more on a per tonne basis than the current disposal system for this sector but will increase city-wide diversion by almost 50% to 38.6%. Processing up to 250,000 tonnes per year of mixed waste from mutli-family dwellings at one central facility is probably viable, with costs that are approximately 10% lower than current per tonne disposal charges. Although implementation of this option could potentially increase diversion of Toronto’s residential waste to 42.4%, mixed waste options involve a relatively higher risk because of the uncertainty regarding this technology to produce a marketable product. Additional research is required to confirm that mixed waste AD processing is reliable. Processing most of the City residential garbage (multi-family and single family) in mixed waste facilities would be required to reach a 60% diversion target by 2006. Anaerobic digestion of SSO is considered likely to be successful technically, whereas there is less certainty that anaerobic digestion of mixed waste will meet city requirements. Mixed waste processing technology has, in general, had a poor track record in Europe and the US. Therefore, it is recommended that the results of the CCI Dufferin Demonstration project be carefully evaluated before this route is pursued. These results will be available in early 2003. Finding productive uses for the finished digestate from mixed waste processing is a daunting challenge, which would require a significant marketing effort. This is addressed in a separate report Toronto Compost Markets Study. If a mixed waste strategy is pursued for either single-family or multi-family waste, it can be fully implemented by late-2004 to mid-2005, depending on the number of plants involved. It is also recommended that City of Toronto work with other mixed waste processing plants in North America, particularly Conporec in Tracy, SUBBOR in Guelph and CCI in Newmarket to collect as much operational data as possible on AD plants processing both SSO and mixed waste in order to have sufficient proof of successful performance, particularly with mixed waste, before embarking on this riskier strategy.
WDO Study: Implications of Different Waste Feed Streams (Source Separated Organics and Mixed Waste) On Collection Requirements and Anaerobic Digestion Processing Facility Design, Equipment and Cost
December, 2001 Allen Kani and Enviros RIS Page 6
1.0 INTRODUCTION
The Waste Diversion Organization (WDO) provided the City of Toronto with funding to undertake technical assessments of two aspects of anaerobic digestion (AD) technologies, and how these might be used to increase diversion of organic waste within City of Toronto. The overall focus of this study is to quantify the collection and processing cost implications of different types of residential waste feedstock. AD plants designed to accept SSO generally cost less than facilities with similar production characteristics designed for mixed municipal waste because a lower capital investment is required for pre-treatment equipment (e.g. ferrous and non-ferrous separators, manual sorting stations, etc.). Although the capital cost of an AD plant designed for SSO may be less, a compatible collection system that reorganizes the waste handling practices of a large metropolitan municipality will generate significant cost impacts. Quantifying these collection and processing implications and estimating their net effect on the cost of various AD plant options is the principle task of this report. In addition to cost, scenarios were developed to estimate the impact of SSO and mixed municipal waste processing systems on other key decision criteria such as municipal waste diversion and methane gas yields. The second WDO-funded study - which is a separate though complementary project - was undertaken to develop an overall anaerobic digestion implementation strategy that examines various issues such as roll-out schedule, the number of required trucks and potential generation of methane gas. Interest in AD is based on this technology's potential capacity to reduce significantly the amount of waste that needs to be landfilled while generating marketable by-products. These include methane gas that can be utilized as a source of energy production, a compost-like digestate that can be used as a soil conditioner, and nutrient-rich liquid that can be used as fertilizer. Because of its potential to address a broad range of environmental policy goals, the City of Toronto is also interested in investigating a number of technical issues that underlie a scenario in which Enwave would utilize the anaerobically-produced methane gas to fuel a portion of its energy production requirements. Formerly known as the Toronto District Heating Corporation, Enwave is a private company that produces and distributes steam to 115 commercial and institutional buildings in the downtown core, and is developing a district cooling system. Enwave's distribution grid is bound by the following streets: Wellesley Street to the north, Lakeshore Blvd to the south, Church St. to the east and John St. to the west. Four additional studies are currently underway or are at the planning stages which relate to the goals and objectives of this report:
!"Enwave commissioned Acres International to undertake a study that examines the implementation of anaerobic digestion and its capacity to produce energy. Data from that project can be used to augment the information in this study as appropriate when available.
WDO Study: Implications of Different Waste Feed Streams (Source Separated Organics and Mixed Waste) On Collection Requirements and Anaerobic Digestion Processing Facility Design, Equipment and Cost
December, 2001 Allen Kani and Enviros RIS Page 7
!"The WDO provided the City of Toronto with funding to identify potential markets for finished compost. Results from the Toronto Compost Markets Study identify potential outlets for aerobically cured digestate from the AD process.
!"The WDO provided funding to City of Toronto to test loads of different materials at AD facilities recently constructed near Toronto. Processing of this material started on March 12, 2001 at the CCI facility in Newmarket. Results from these test runs will feed into the decision making process as the AD concept for Toronto waste is developed further
!"City of Toronto has requested funding from the FCM Green Enablement Fund to carry out a feasibility study on the overall concept of AD of Toronto SSO and mixed waste. The information contained in this report can feed into the overall feasibility assessment if it is funded and proceeds.
The balance of this report is structured as follows:
• Section 2 provides a brief description of anaerobic digestion technology and
the generic assumptions used in this report to estimate costs and diversion impacts.
• Section 3 describes various issues related to the siting of anaerobic digestion
plants.
• Section 4 examines the key issues and cost implications associated with various processing options.
• Section 5 examines collection issues and costs associated with different waste
feed streams (SSO and mixed waste)
• Section 6 summarizes the net cost implications and quantifies the waste diversion impacts and methane gas yield for each waste flow scenario
!"Section 7 presents conclusions and recommendations resulting from this
research.
WDO Study: Implications of Different Waste Feed Streams (Source Separated Organics and Mixed Waste) On Collection Requirements and Anaerobic Digestion Processing Facility Design, Equipment and Cost
December, 2001 Allen Kani and Enviros RIS Page 8
2.0 OVERVIEW OF ANAEROBIC DIGESTION 2.1 Introduction Anaerobic digestion is a biological process that uses microbes to convert organic material into three different end products. These products are: a) biogas that typically contains 55-65% methane gas and 35-45% carbon dioxide; b) a compost-like material called digestate; and c) a nutrient-rich liquid. The digestion of organic waste takes place two stages. In the first stage, generally referred to as hydrolysis and acidification, organic material is broken down by a group of microbes called acid formers. One of the end products of this stage is the production of fatty acids that serve as a food source for a different set of microbes. In the second stage, generally referred to as methanogenesis, a group of microbes called methane producers convert the acid produced in Stage 1 into simple products, which consist primarily of methane and carbon dioxide. 2.2 Overview of North American and European AD Operations Anaerobic digestion is not a new approach to waste management or energy production. The first attempt to collect and utilize methane gas produced from liquefied wastewater was recorded in 1885 in Exeter, England where methane was used to fuel lights in the area around the septic tank. Over the past 50 years, anaerobic digestion has been used extensively in North America to treat biosolids, though the capture and utilization of methane has not typically been part of that process, except at larger wastewater treatment facilities, where the costs of gas engines can be justified. According to industry analysts, there are approximately 150 AD plants around the world which process a variety of semi-solid waste streams, and 45-50 different manufacturers of digestion equipment. Very few AD plants in the US or Canada process residential waste. Europe is generally considered to be the international leader in commercial AD technology, though their combined experience with MSW processing is limited. Some estimates indicate that AD plants worldwide - the majority being in Europe - process a relatively modest 1,000,000 tonnes of municipal waste. To situate the current level of MSW AD processing experience in context, if the City of Toronto were to implement AD capacity to handle all single-family mixed waste (estimated to be 430,000 tonnes per year), the world's known MSW AD throughput would increase by almost 50%. There are approximately 95 farms in the US that utilize AD technology to treat animal waste.1 The capital cost of a farm-scale operation is estimated to be approximately $250,000 USD.
1 Phil Lusk, "Latest Progress in Anaerobic Digestion." Biocycle, July 1999.

WDO Study: Implications of Different Waste Feed Streams (Source Separated Organics and Mixed Waste) On Collection Requirements and Anaerobic Digestion Processing Facility Design, Equipment and Cost
December, 2001 Allen Kani and Enviros RIS Page 9
A study of European AD plants that process MSW or SSO was conducted in 1999.2 The study shows that:
• There are 53 plants in Europe. Most of these plants are in Germany (30) and Switzerland (9).
• The total processing capacity of all European AD plants where municipal waste represents at least 10% of the feedstock is approximately 900,000 tonnes per year.
• Over the past ten years, there has been a trend toward the construction of larger capacity plants. Since 1998, average plant processing capacity has been approximately 45,000 tonnes per year. In the 1980s, the average plant capacity was much smaller, generally at 10,000 tonnes/year or less, with a few notable exceptions.
• As of 2000, the cumulative plant capacity of mesophilic plants was approximately twice as large as that for thermophilic plants.
• Since 1993, there has been a trend towards dry AD plants. As of 2000, 60% of European plant capacity uses dry AD technology.
• The majority of European plants - approximately 90% - utilize one-stage technologies. The relatively higher capital cost and complex operating system of the two-stage system are two reasons why two-stage systems have been employed less often.
• A number of Japanese firms have entered into licensing agreements with European AD equipment manufacturers (e.g. Dranco and Kompogas).
2.3 AD Plants for Residential Waste in North America There are currently three AD plants in North America which process residential waste, all of which are located within one hour of Toronto. One plant is the recently completed Canada Compost Inc. facility in Newmarket, Ontario, which uses BTA technology to treat up to 150,000 tonnes/year of source separated organics, although the plant is testing loads of mixed waste at this time. Waste at this facility is loaded into a hydropulper where water is added. Light materials such as plastic are removed, and the slurry is introduced to a reactor where digestion takes place. The slurry from the reactor is dewatered and the digestate is trucked to a facility in the Niagara area for aerobic curing. A second BTA facility is currently under construction at the Dufferin Transfer Station in Toronto. When completed, this plant will have the capacity to process 15,000 tonnes/year of MSW, or 25,000 tonnes per year of SSO. The Dufferin plant is being used to test different approaches to Toronto waste. There is space available at the Dufferin Transfer Station to expand processing capacity to 165,000 tonnes per year of SSO or 100,000 tonnes per year of mixed waste. A two-stage SUBBOR plant is currently being commissioned in Guelph Ontario. The SUBBOR plant consists of two anaerobic digesters. After first stage digestion, residue material is subjected to elevated temperatures and pressures to break down some of the complex chemical bonds and to improve the digestibility of the material going into the 2 "Anaerobic Digestion of Solid Waste: State of the Art," L.DeBaere. Anaerobic Digestion of Solid Waste ll. Selected Proceedings of the 2nd International Symposium on Anaerobic Digestion of Solid Waste, IWA Publishing, 2000.
WDO Study: Implications of Different Waste Feed Streams (Source Separated Organics and Mixed Waste) On Collection Requirements and Anaerobic Digestion Processing Facility Design, Equipment and Cost
December, 2001 Allen Kani and Enviros RIS Page 10
second stage digester. This process reportedly increases gas yields to 50% above traditional gas yields of about 220 cubic metres per tonne of volatile solids3. The thermal processing step, called HTU, followed by a secondary stage of digestion results in an increased methane yield and higher conversion rate of available carbon to biogas, leaving a stable peat-like residue of reduced particle size. The co-benefits of HTU include pathogen elimination. Unsorted MSW is processed through a pre-treatment stage where materials are shredded. A magnetic and eddy current separator system recovers ferrous and non-ferrous metals. The waste is milled to a 2-inch particle size and conditioned with heat prior to introduction to a primary digester with a retention time of about 30 days. The secondary digester has a retention time of about 20 days. Residue from the secondary digester is processed by a combination of proprietary size and density separations and chemical extraction to yield a peat-like material along with recovered plastics, metals and inert materials.4 The plant is currently in the commissioning phase. US EPA and Environment Canada have provided support to the plant and will be assessing its performance. 2.4 General System Options Commercial anaerobic digestion systems vary according to a number of key design issues. These include:
• mode of feeding (e.g. the number of stages in the production of biogas) • substrate characteristics (e.g. concentration of solid material and homogeneity
of the feedstock) • mixing (e.g. the techniques used to mix organic material inside the reactor) • pumping (e.g. the techniques used to move material to an from the digestion
reactor), and • pre and post treatment (e.g. pulping, shredding, magnetic separation,
dewatering, aerobic treatment of digestate). Generally, commercial AD systems can be grouped into one of two different categories based on the how the incoming waste is prepared before it is loaded into the AD reactor. Dry systems mix the incoming waste with a relatively small amount of water. In many cases, the substrate is mixed to produce 15 to 40% total solids (TS). Examples of commercially available dry systems include Dranco, Kompogas and Valorga. Wet systems use a relatively higher percentage of water to produce a substrate with 10-15% TS. BTA and Wassa are two examples of wet processing technology. Other approaches to AD processing, such as batch loading, are regarded as experimental at this point in time and therefore have not been included as part of this analysis. Another method of categorizing AD technologies is based on the number of reactors that contain the digestion process. In single-stage systems both types of microbiological 3 Discussion Dr. Bruce Holbein, Eastern Power. 4 SUBBOR Anaerobic Digestion Process for Solid Organic Waste: Initial Results for Mixed MSW at Guelph, Canada Confirm Process Capabilities, presented by Hua-Wu Liu, Gregory Vogt and Bruce Holbein, Eastern Regional Conference of the Canadian Association of Waste Quality, Ottawa, Canada, November 17, 2000.
WDO Study: Implications of Different Waste Feed Streams (Source Separated Organics and Mixed Waste) On Collection Requirements and Anaerobic Digestion Processing Facility Design, Equipment and Cost
December, 2001 Allen Kani and Enviros RIS Page 11
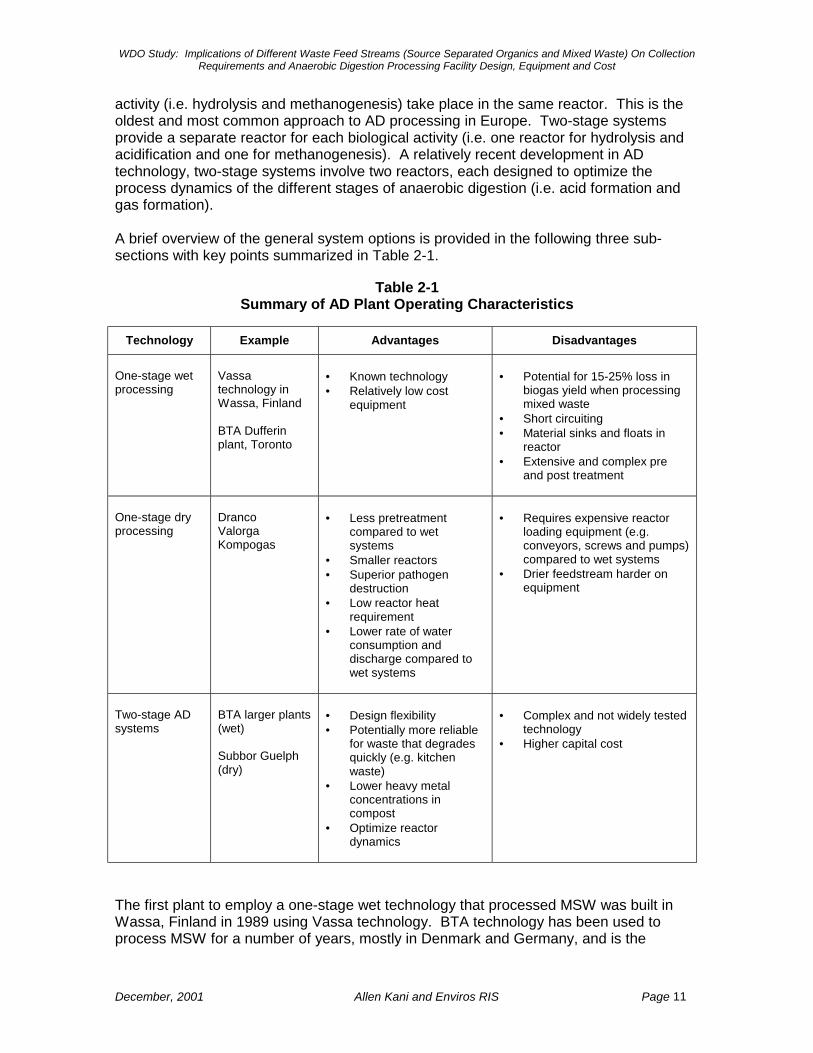
activity (i.e. hydrolysis and methanogenesis) take place in the same reactor. This is the oldest and most common approach to AD processing in Europe. Two-stage systems provide a separate reactor for each biological activity (i.e. one reactor for hydrolysis and acidification and one for methanogenesis). A relatively recent development in AD technology, two-stage systems involve two reactors, each designed to optimize the process dynamics of the different stages of anaerobic digestion (i.e. acid formation and gas formation). A brief overview of the general system options is provided in the following three sub-sections with key points summarized in Table 2-1.
Table 2-1 Summary of AD Plant Operating Characteristics
Technology Example Advantages Disadvantages
One-stage wet processing
Vassa technology in Wassa, Finland BTA Dufferin plant, Toronto
• Known technology • Relatively low cost
equipment
• Potential for 15-25% loss in
biogas yield when processing mixed waste
• Short circuiting • Material sinks and floats in
reactor • Extensive and complex pre
and post treatment
One-stage dry processing
Dranco Valorga Kompogas
• Less pretreatment
compared to wet systems
• Smaller reactors • Superior pathogen
destruction • Low reactor heat
requirement • Lower rate of water
consumption and discharge compared to wet systems
• Requires expensive reactor
loading equipment (e.g. conveyors, screws and pumps) compared to wet systems
• Drier feedstream harder on equipment
Two-stage AD systems
BTA larger plants (wet) Subbor Guelph (dry)
• Design flexibility • Potentially more reliable
for waste that degrades quickly (e.g. kitchen waste)
• Lower heavy metal concentrations in compost
• Optimize reactor dynamics
• Complex and not widely tested
technology • Higher capital cost
The first plant to employ a one-stage wet technology that processed MSW was built in Wassa, Finland in 1989 using Vassa technology. BTA technology has been used to process MSW for a number of years, mostly in Denmark and Germany, and is the
WDO Study: Implications of Different Waste Feed Streams (Source Separated Organics and Mixed Waste) On Collection Requirements and Anaerobic Digestion Processing Facility Design, Equipment and Cost
December, 2001 Allen Kani and Enviros RIS Page 12
technology for which Canada Composting Inc (CCI) of Newmarket, Ontario has the North American rights. Two BTA plants are located in the Toronto area. During the 1990s, new AD plant construction in Europe employed an even mix between wet and dry systems.. Companies that use dry AD technology include Dranco, Valorga and Kompogas. Each of these technologies appears to concentrate on specific markets.
!"Valorga has plants in France, and one large SSO plant in Tilburg, Netherlands. !"Dranco plants are located in Austria and Belgium. Dranco has 11 plants around
the world: 9 in Europe plus one each in Japan and Australia. The company is currently in the preliminary design stage of a 200,000 tonne per year complex in India.
!"Kompogas plants are mostly located in Switzerland and Germany. There are 18 AD plants worldwide which use Kompogas technology: 17 in Europe and 1 in Japan. Four of the 18 plants are operated by Kompogas company staff. Sixteen of the Kompogas plants process SSO waste while the remaining two process mixed waste.
Each technology has advantages and disadvantages in terms of plant footprint, energy and waste use and gas production. Selection of the most appropriate system for any given community will be influenced by local priorities (e.g. maximum diversion, lowest cost, energy production, etc.) as well as local conditions (e.g. availability of land, type of feedstock to be processed, etc.). The main advantages and disadvantages of a dry system compared to a wet operation are reported to be:
• Biogas yields compare favorably with wet system, and potentially could be higher because heavy material at the bottom of the tank or top layer foam are not removed before complete digestion.
• Despite differences in the level of treatment required for incoming waste, on balance, the capital costs for both systems are reported to be comparable.5 On the one hand, dry systems require more durable and hence more expensive loading and handling equipment compared to wet systems that pump highly diluted slurry into the reactor through a relatively simple centrifugal pump. On the other hand, the higher capital cost of handling equipment is partially offset by a relatively simple pre-treatment process that is less extensive than that required by a wet system (e.g. drums, shredding, etc). In addition, the capital cost of a dry system reactor could be lower than that for a wet system because the volume to be handled will be less in a dry system reactor due to a lower dilution rate.
• Dry systems consume and discharge significantly less water compared to systems that process a low total solids substrate.
• Depending on the dry system technology, there is a potential to utilize thermophilic temperatures that can result in a greater rate of pathogen destruction.
5 Luc Debaere, Dranco.
WDO Study: Implications of Different Waste Feed Streams (Source Separated Organics and Mixed Waste) On Collection Requirements and Anaerobic Digestion Processing Facility Design, Equipment and Cost
December, 2001 Allen Kani and Enviros RIS Page 13
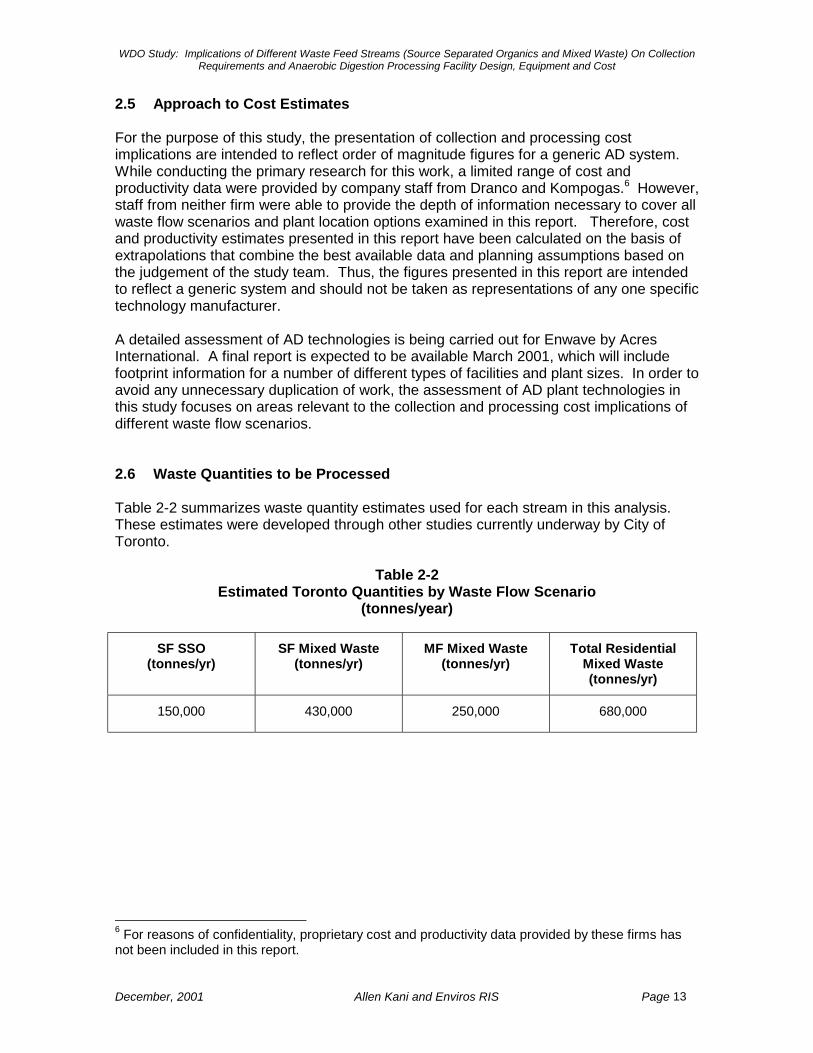
2.5 Approach to Cost Estimates For the purpose of this study, the presentation of collection and processing cost implications are intended to reflect order of magnitude figures for a generic AD system. While conducting the primary research for this work, a limited range of cost and productivity data were provided by company staff from Dranco and Kompogas.6 However, staff from neither firm were able to provide the depth of information necessary to cover all waste flow scenarios and plant location options examined in this report. Therefore, cost and productivity estimates presented in this report have been calculated on the basis of extrapolations that combine the best available data and planning assumptions based on the judgement of the study team. Thus, the figures presented in this report are intended to reflect a generic system and should not be taken as representations of any one specific technology manufacturer. A detailed assessment of AD technologies is being carried out for Enwave by Acres International. A final report is expected to be available March 2001, which will include footprint information for a number of different types of facilities and plant sizes. In order to avoid any unnecessary duplication of work, the assessment of AD plant technologies in this study focuses on areas relevant to the collection and processing cost implications of different waste flow scenarios. 2.6 Waste Quantities to be Processed Table 2-2 summarizes waste quantity estimates used for each stream in this analysis. These estimates were developed through other studies currently underway by City of Toronto.
Table 2-2
Estimated Toronto Quantities by Waste Flow Scenario (tonnes/year)
SF SSO (tonnes/yr)
SF Mixed Waste (tonnes/yr)
MF Mixed Waste (tonnes/yr)
Total Residential Mixed Waste (tonnes/yr)
150,000 430,000 250,000 680,000
6 For reasons of confidentiality, proprietary cost and productivity data provided by these firms has not been included in this report.
WDO Study: Implications of Different Waste Feed Streams (Source Separated Organics and Mixed Waste) On Collection Requirements and Anaerobic Digestion Processing Facility Design, Equipment and Cost
December, 2001 Allen Kani and Enviros RIS Page 14
3.0 SITING ISSUES 3.1 Overview The purpose of this chapter is to identify and summarize the main issues related to the siting of AD processing capacity. Five siting issues are described in general terms in Section 3.2. Section 3.3 examines three different possible locations using these criteria. For this assessment, we have assumed that City of Toronto has sufficient land holdings in the Portlands and downtown area which could provide adequate space to site one or more AD plants, or a number of modular 50,000-tonne per year sites in one location. Or, the City is able to procure the land it requires for these uses. In the assessment of collection cost implications, there are no significant cost differences if the AD plants are located within a few kilometers of each other. Should the City decide to proceed with further expansion of AD processing capacity, locating facilities will be a critical challenge due to competing land-use interests and impacts of technical, economic, social, and environmental issues. An analysis of these impacts and a thorough assessment of siting options would require further in-depth study. In the parallel AD project outlining a conceptual implementation strategy, it has been assumed that all work related to site selection and the approvals processes will require 18 months of detailed investigation and reporting. 3.2 Siting Issues 3.2.1 Utilization of Methane Gas Production The potential utilization of gas production from AD plants is, in part, constrained by location. If the overall policy goal is to feed energy into the Enwave grid, then all or a portion of future AD processing capacity would need to be located in the Portlands area. Should the purchaser of gas not be Enwave, the plants could be located throughout the city. Other possible purchasers could include the local electrical authority and Enbridge, the local distributor of natural gas. The production and collection of methane gas from AD plants represents a significant supply of renewable energy. Preliminary estimates indicate potential energy production in the order of 1,500 kWh per tonne of organic waste in the form of biogas. Under optimal conditions, this gas could be utilized to produce green power. Waste heat could be used to provide year-round thermal services to the AD facilities and the surplus could be exported off-site for other uses. Overall energy production and economics could be improved by scrubbing the biogas to produce a clean supply of methane, which could potentially be sold into the natural gas distribution system and high-efficiency, combined-cycle power plants (with 55% conversion to electricity). In addition, the scrubbed CO2 has commercial value as well as direct application in certain AD processing operations by providing carbon sequestration (ref. pg. 93, Proceedings ISADSW/99). Connections to the electrical system, to steam and/or hot water piping, biogas piping, and to natural gas lines may be possible and would require an extensive technical and economic review for optimal energy performance. For instance, methane extraction with pressurization into the existing gas distribution network allows considerable siting
WDO Study: Implications of Different Waste Feed Streams (Source Separated Organics and Mixed Waste) On Collection Requirements and Anaerobic Digestion Processing Facility Design, Equipment and Cost
December, 2001 Allen Kani and Enviros RIS Page 15
flexibility, but has rarely been employed due to economics-of-scale limitations. Further study is warranted to determine if the relative costs of site infrastructure and large centralized facilities render this option preferable. There is also a range of options that involve municipal utilization of gas production and provide opportunities for an integrated waste management and energy use plan. These opportunities, along with the related siting issue that accompany them, include the following:
• emergency power applications • conversion of collection and transfer vehicles to natural gas • noise and air emissions of the energy conversion plant • development planning for infrastructure opportunities.
3.2.2 Digestate and Leachate The other products of AD technology, digestate and leachate, will also affect plant location. These products are a function of both the generic process (wet or dry) and the specific technology (Dranco, Valorga, Kompogas, BTA, etc.). AD technology makes feasible soil enhancement and nutrient recycling through the process products. The sustainability of soil fertility is dependent on the processes developed to recover and return nutrients in a biologically appropriate form. For example, the application of artificial nitrogen fertilizer derived from natural gas results in the deterioration of soil health and water contamination. Further, greenhouse gases are created through the production and release of nitrous oxide during tillage. This harmful practice can be replaced, in part, by closing the biological nitrogen cycle and returning nitrogen bound in organic waste to the soil. The intrinsic pasteurization of pathogens in thermophilic processing, techniques of separating out contaminants, and post-AD treatment of digestate and leachate can render high-quality soil amendments. Compost stabilization and drying may be most economically carried out in open aerobic composting requiring a large land area and buffer for odour abatement. Alternatively, in-vessel processing will greatly reduce these constraints at higher capital cost. The third option of shipping in sealed containers to a rural site entails a higher handling cost. Some technologies produce a leachate that has high nutrient content. It may be trucked for field application, but this would require seasonal storage. For wet systems particularly, storage would necessitate concentrating the nutrients. On-site greenhouse horticulture could utilize the leachate year-round but area and land costs may be prohibitive. The site and technology selection should be evaluated for optimal soil benefit. Costs, revenues, relative environmental performance, and land use are factors to consider. The technologies and processes selected are related to siting. Wet systems will require an increased water supply and a more extensive dewatering function and wastewater treatment than dry systems. Use of existing water supply and wastewater treatment infrastructure will require impact assessment.
WDO Study: Implications of Different Waste Feed Streams (Source Separated Organics and Mixed Waste) On Collection Requirements and Anaerobic Digestion Processing Facility Design, Equipment and Cost
December, 2001 Allen Kani and Enviros RIS Page 16
3.2.3 Plant Size and Use Compatibility An absolute criterion is that the plant must fit the site. There is considerable variability in the footprint of AD technologies and plant design. Dry systems have much smaller volumes. Accelerated biological functioning reduces retention time. Composition of the digester feed also affects retention time, hence volume. Tall, vertical reactors reduce footprint but increase the visibility of the plant and are subject to local height restrictions. Besides space for the reactors, the large area requirements are typically for truck circulation and loading/unloading, pre- and post-processing equipment, material transfer, and setbacks. The larger the plant capacity, the smaller the footprint per quantity of waste. 3.2.4 Waste Collection and Transportation Site selection requires an assessment of current transportation infrastructure and capacity, traffic impacts, and compatibility with the overall municipal waste collection, diversion, and transfer system. Integration with existing waste handling facilities on the same site would seem the preferable choice in terms of existing C of A’s, co-collection and delivery of source-separated waste, and diversion of mixed-waste recyclables. It is, however, conceivable that separated organics could be transferred to an AD-specific site. There would be additional handling and trucking costs unless the sites were proximate enough to allow pumping. Collection from large areas requiring multiple transfer and processing sites favours separate AD plants at each site, particularly for mixed-waste collection. On the other hand, economics-of-scale and energy-use criteria support a centralized AD facility. Size of plant and available land may be the determining factors. The solution may be the creation of more than one plant at different sites but with some centralization of transfer of organics from the dispersed waste-processing facilities. The ultimate determination should be based on an analysis of the inventory of potential sites, consideration of the previous criteria, and the overall collection and diversion plan. Efficiencies of land-use may be achieved through integrating shipping and waste diversion operations and organizing material-handling optimally. In addition to the requisite land area, the site must also be compatible with adjacent land-use and planning objectives. Ideally, siting would be taken into consideration in the municipal planning process with the objective of achieving optimal fit. The development in the city of an industrial ecology that uses the products of waste diversion would be an appropriate land-use planning strategy. 3.3 Candidate Toronto Sites The most suitable sites in Toronto are waste processing and transfer stations or properties nearby, although there may be opportunities for new facility siting. The two areas examined in this study are the Dufferin Transfer Station, where construction of a pilot mixed-waste AD plant is underway, and the Port industrial area.
WDO Study: Implications of Different Waste Feed Streams (Source Separated Organics and Mixed Waste) On Collection Requirements and Anaerobic Digestion Processing Facility Design, Equipment and Cost
December, 2001 Allen Kani and Enviros RIS Page 17
3.3.1 Dufferin Transfer Station The City has currently contracted Canada Compost Inc. and Stone and Webster to construct a 25,000 T/yr mixed municipal waste AD plant to provide operating experience and assess gas production and compost quality. An expansion to 150,000 T/yr is being considered. Energy production proposed is a biogas engine generator with waste heat utilization for plant operations. Thermal customers have not been identified although there are two candidate district heating options within 2 km- York University main campus and the future Downsview Lands development. The industrial operations in the immediate vicinity may also present opportunities. The cost of steam or hot water conveyances may be prohibitive and summer loads are possibly low compared with a large-scale digester output. A more favourable option may be to transmit biogas or methane to onsite cogenerators, which, in the case of York University, already exist. The dewatered digestate, depending on demonstrated quality, is likely to be trucked to a compost finishing facility currently being used by CCI’s Newmarket plant where commercial production is undergoing testing. The future Downsview Park could potentially benefit from seasonal application of the nutrient-rich leachate. The site area is sufficient for 150,000 T/yr mixed-waste facility. Land use and surrounding industrial development is compatible. The current C of A for the Dufferin Transfer Station permits receiving 200 tonnes/day of blue box material and 600 tonnes/day of MSW with an additional 100 tonnes/day of special waste being applied for by the City. Without changes to transportation, it would be possible to support over 200,000 tonnes/yr of MSW AD processing. Additional tonnage would require a revised C of A. To maintain similar levels of truck traffic, larger transfer vehicles could be employed, hauling SSO or MSW from other transfer stations.
3.3.2 Toronto Portlands Area Initial considerations have been explored by Enwave to site a large-scale AD facility in the Port Industrial Area due to its proximity to the downtown district heating system. From an energy production standpoint, this area affords many opportunities. It is within 2 ½ km of the steam distribution system and close to the Ashbridges Bay Wastewater Treatment Plant, both having sizeable year-long steam demands. Other thermal demands in the area include Paperboard Industries, existing buildings and future development being planned by the Waterfront Redevelopment Initiative and the Toronto Olympics Bid. Potentially complementary cogeneration facilities are being explored, including a joint venture between Toronto Hydro Energy Services Inc. and Boralex on the Paperboard Industries property, and City of Toronto utilizing biogas from the AB Wastewater Treatment digesters either alone or in conjunction with the THESI/Boralex plant. One scenario under consideration, is to supply MSW AD gas to a common cogeneration plant. At a large enough scale, all of the biogas could be utilized in a combined cycle plant with high efficiency production of green power and full utilization of waste heat.
WDO Study: Implications of Different Waste Feed Streams (Source Separated Organics and Mixed Waste) On Collection Requirements and Anaerobic Digestion Processing Facility Design, Equipment and Cost
December, 2001 Allen Kani and Enviros RIS Page 18
Alternatively, Enwave may wish to pursue an independent supply of biogas strictly for steam production baseload with the prospect of stabilizing and reducing the cost of steam production. Biogas or scrubbed methane could be piped to existing steam plants. The most efficient use of the gas would be to generate the maximum electrical output and supply district hot water heating from engine and stack waste heat. This hot water supply could service the new development in the Portlands and along the waterfront as well as providing absorption cooling for chilled water distribution. The ultimate determination will depend on overall economics, timing, negotiations between benefiting parties, and the weight of the City’s environmental policies. Leachate and digestate treatment and disposition will depend on the technologies selected, their footprint, and the economics of producing marketable products. For SSO feed, there is a reasonable degree of confidence that finished compost which can meet Ontario Guidelines for Unrestricted Use can be generated with potentially sizeable revenue generation in the order of $20-$50/tonne of finished compost (about 40% of the incoming feedstream). Leachate may also have commercial value being applied to agricultural lands, City greenspace, or greenhouse horticulture as a nutrient rich liquid fertilizer. Otherwise, it may be conveyed to the Ashbridges Bay WTP. For mixed-waste feed, the prospects of producing compost that meets unrestricted use guidelines are less certain and will require field verification. If the compost cannot meet the standards for commercial utilization, it may still be possible to avoid landfill if approvable sites for soil amendment could be found. This issue is addressed in some detail in the Toronto Compost Markets Study, also partially funded by WDO, because of the importance of finding markets for all compost to ensure the sustainability of any organics strategy embarked on by Toronto. Leachate quality may likewise be compromised through the presence of heavy metals, requiring an assessment of conformance to the City’s Sewer-Use bylaw and may necessitate expensive pretreatment. Currently, there are large areas within the Portlands sufficient to accommodate aerobic curing of the digestate and productively utilizing the leachate provided contaminants can be mitigated. However, it is more likely that the aerobic curing phase would take place at a location some distance from the Portlands area, where land is less valuable. The available suitable land area is adequate to accommodate anaerobic digestion of all of the City’s organic waste. Dranco has the smallest footprint of the technologies investigated and have designed plants for 150,000 T/yr and 460,000 T/yr at 12,000 m2 and 20,000 m2 total footprint respectively. By comparison, the Commissioner’s Street Transfer Station occupies approximately 30,000 m2. One scenario would be to develop a new transfer station as an integrated waste diversion facility. Most of the Portland properties east of the Donway fall outside of the Waterfront redevelopment initiative and Olympic facilities. With due consideration to design aesthetics, such a plant would likely meet with approval. Initial discussions with the Toronto Olympic Bid Community indicated that its environmental merits would be viewed as consistent with the Bid’s vision and commitments. Other planning processes have supported the notion of applying principles of industrial ecology and locating green industries in this area. It would appear warranted that a study and public consultation on the siting of a large-scale anaerobic digestion facility in the Portlands be undertaken.
WDO Study: Implications of Different Waste Feed Streams (Source Separated Organics and Mixed Waste) On Collection Requirements and Anaerobic Digestion Processing Facility Design, Equipment and Cost
December, 2001 Allen Kani and Enviros RIS Page 19
Regarding waste collection and transportation, the investigation by Acres for Enwave has undertaken an evaluation. If waste from other collection sites in Toronto were transferred in large trucks, then much greater quantities could be supplied without increasing traffic flow. Transportation should not be a limitation for plant sizing in this area. 3.3.3 Other Sites
It may be feasible to locate AD sites throughout the City or the GTA. The two sites analyzed in this report were selected because they have already been identified by the City as good candidates. They are well matched to siting criteria. A Provincial Environmental Assessment may require an analysis of options so that a broader survey is warranted. Economics of scale favour centralization so that the focus should be on planning at least one major facility. The City’s 60% diversion goal by 2006 will necessarily entail the transformation of most of the organics into utilizable products. Increased fiber recycling, backyard composting, reduction efforts, and expanded aerobic composting of seasonal yardwaste will play a part. However, the bulk of diversion will necessarily entail the co-development of the collection system and large-scale organic processing facilities. If anaerobic digestion is deemed the most desirable option, then siting determination needs early resolution by the City in order to plan the collection system. A separate WDO funded study carried out by City of Toronto addresses the various aspects of an implementation strategy for AD of both SSO and mixed waste streams. The new collection system that would be required is discussed in some detail in this separate report.
WDO Study: Implications of Different Waste Feed Streams (Source Separated Organics and Mixed Waste) On Collection Requirements and Anaerobic Digestion Processing Facility Design, Equipment and Cost
December, 2001 Allen Kani and Enviros RIS Page 20
4.0 PROCESSING ISSUES AND COSTS The purpose of this section is two-fold. The first objective is to estimate at a conceptual level the cost of constructing AD capacity for three waste flow scenarios using a generic single-stage dry substrate AD technology. The second task is to identify the processing cost implications of handling either SSO or mixed waste. For the purposes of this report, the assessment of processing cost implications focused exclusively on the pre-treatment of incoming waste prior to reactor loading. 4.1 Conceptual Design and Equipment Needs In our analysis, implementation of an SSO program will generate significant new costs associated with the implementation of a new residential waste collection system that picks up source separated organics. This system option would also require an investment in new promotion and education activities in order to support behavioral changes in the household. In contrast, implementation a mixed waste program would not necessitate significant changes to the current collection system. However, the capital cost of a mixed waste option would be higher than that for a comparably-sized SSO program because of the need to maximize the removal of contaminates in order to improve the possibility of producing a marketable finished digestate. Discussions were held with a number of AD suppliers regarding future AD plants in Toronto. Sufficient information was provided by two suppliers (Dranco and Kompogas) to develop ballpark costs to a level of accuracy suitable for this assessment. Representatives from Dranco indicated that the recommended maximum plant size using a single AD reactor is 50,000 tonnes per year. If further capacity were required, additional plants could be built, or additional reactors could be constructed on the initial site with each reactor sharing the same auxiliary equipment and receiving area. A single plant with four 50,000 tonne per year reactors (with a combined annual capacity of 200,000 tonnes per year) is being planned in India. Typical equipment specifications provided by Dranco were as follows:
• The suggested minimum lot size for a 50,000 tonne per year facility is
approximately 10,000 square metres. This includes the footprint of the vertical reactor (approximately 400 square metres), office space, receiving and processing areas. MOE requirements, such as buffer land, are not included in this total.
• The maximum volume of a Dranco reactor is 3500 cubic metres. • The recommended maximum particle size for material fed into the reactor is 40
mm. Kompogas staff provided the following information regarding their AD system:
• The digestion technology is modular. Each module can process 10,000 tonnes per year.
• The modules are horizontal (as opposed to the vertical silos used by Dranco). Each module has a footprint of 2,000 square metres.
• Total solids concentration is between 20% and 35%
WDO Study: Implications of Different Waste Feed Streams (Source Separated Organics and Mixed Waste) On Collection Requirements and Anaerobic Digestion Processing Facility Design, Equipment and Cost
December, 2001 Allen Kani and Enviros RIS Page 21
• The equipment uses a plug flow system that ensures all material entering the reactor has the same retention time.
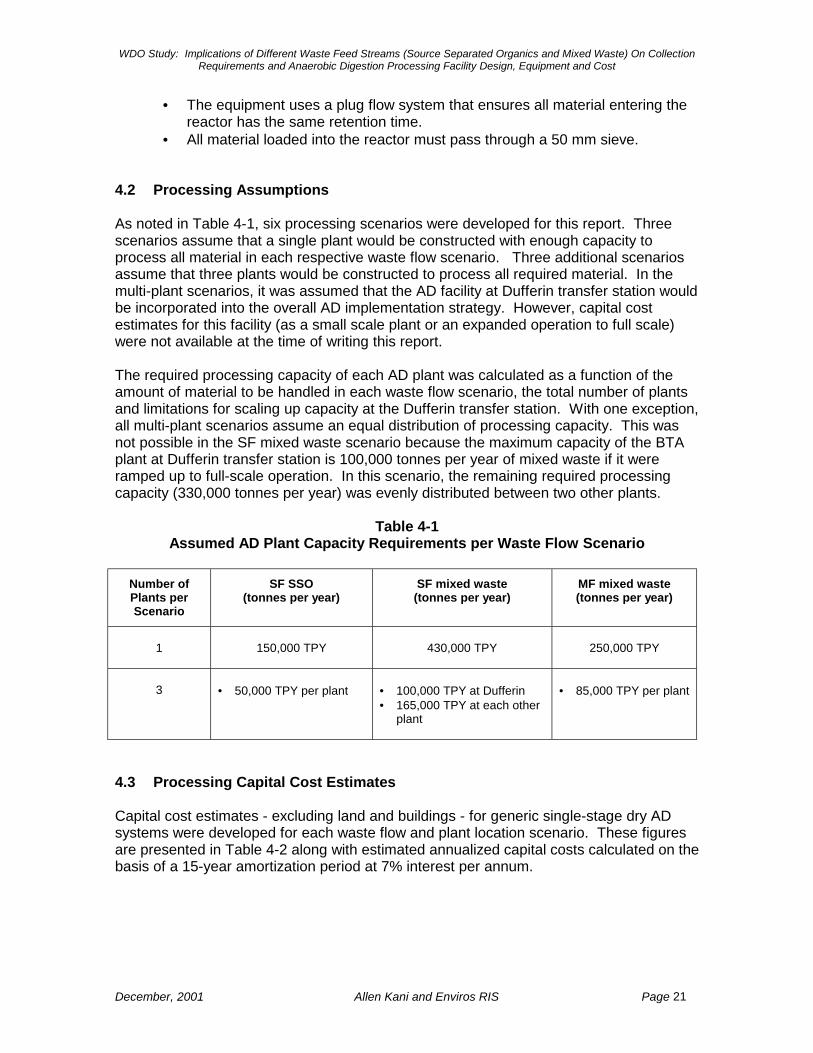
• All material loaded into the reactor must pass through a 50 mm sieve. 4.2 Processing Assumptions As noted in Table 4-1, six processing scenarios were developed for this report. Three scenarios assume that a single plant would be constructed with enough capacity to process all material in each respective waste flow scenario. Three additional scenarios assume that three plants would be constructed to process all required material. In the multi-plant scenarios, it was assumed that the AD facility at Dufferin transfer station would be incorporated into the overall AD implementation strategy. However, capital cost estimates for this facility (as a small scale plant or an expanded operation to full scale) were not available at the time of writing this report. The required processing capacity of each AD plant was calculated as a function of the amount of material to be handled in each waste flow scenario, the total number of plants and limitations for scaling up capacity at the Dufferin transfer station. With one exception, all multi-plant scenarios assume an equal distribution of processing capacity. This was not possible in the SF mixed waste scenario because the maximum capacity of the BTA plant at Dufferin transfer station is 100,000 tonnes per year of mixed waste if it were ramped up to full-scale operation. In this scenario, the remaining required processing capacity (330,000 tonnes per year) was evenly distributed between two other plants.
Table 4-1 Assumed AD Plant Capacity Requirements per Waste Flow Scenario
Number of Plants per Scenario
SF SSO (tonnes per year)
SF mixed waste (tonnes per year)
MF mixed waste (tonnes per year)
1
150,000 TPY
430,000 TPY
250,000 TPY
3
• 50,000 TPY per plant
• 100,000 TPY at Dufferin • 165,000 TPY at each other
plant
• 85,000 TPY per plant
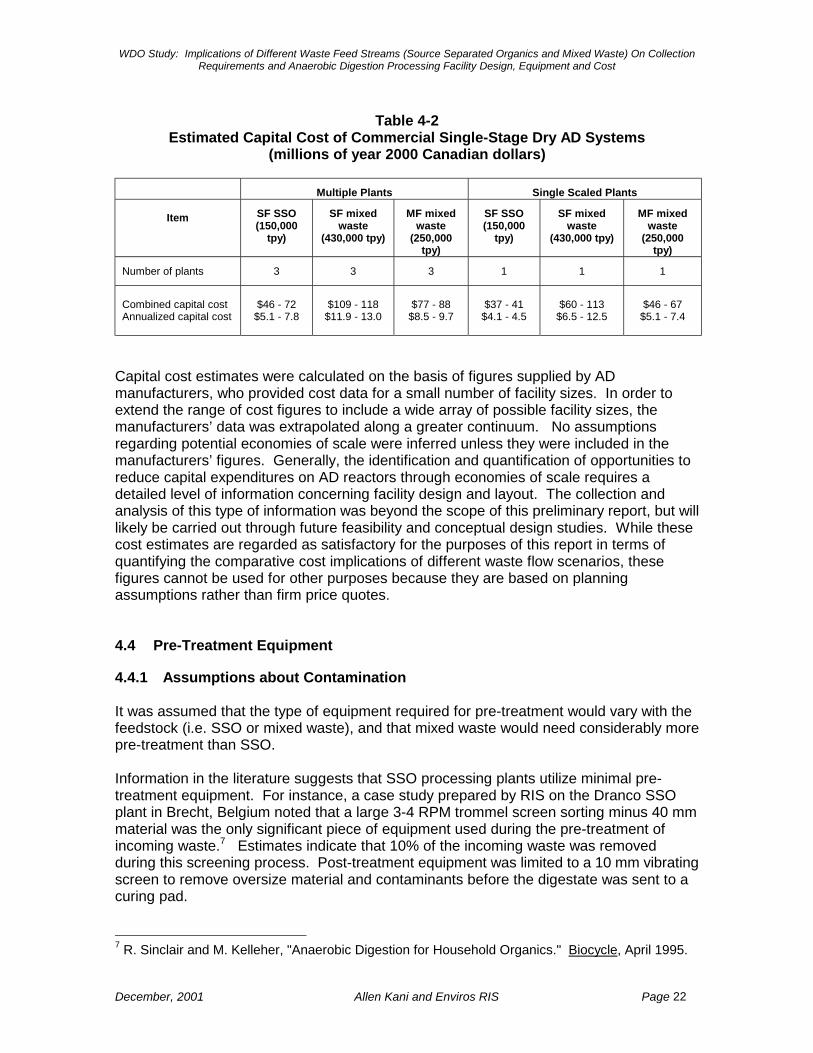
4.3 Processing Capital Cost Estimates Capital cost estimates - excluding land and buildings - for generic single-stage dry AD systems were developed for each waste flow and plant location scenario. These figures are presented in Table 4-2 along with estimated annualized capital costs calculated on the basis of a 15-year amortization period at 7% interest per annum.
WDO Study: Implications of Different Waste Feed Streams (Source Separated Organics and Mixed Waste) On Collection Requirements and Anaerobic Digestion Processing Facility Design, Equipment and Cost
December, 2001 Allen Kani and Enviros RIS Page 22
Table 4-2
Estimated Capital Cost of Commercial Single-Stage Dry AD Systems (millions of year 2000 Canadian dollars)
Multiple Plants Single Scaled Plants
Item SF SSO (150,000
tpy)
SF mixed waste
(430,000 tpy)
MF mixed waste
(250,000 tpy)
SF SSO (150,000
tpy)
SF mixed waste
(430,000 tpy)
MF mixed waste
(250,000 tpy)
Number of plants 3 3 3 1 1 1
Combined capital cost Annualized capital cost
$46 - 72
$5.1 - 7.8
$109 - 118
$11.9 - 13.0
$77 - 88
$8.5 - 9.7
$37 - 41
$4.1 - 4.5
$60 - 113
$6.5 - 12.5
$46 - 67
$5.1 - 7.4
Capital cost estimates were calculated on the basis of figures supplied by AD manufacturers, who provided cost data for a small number of facility sizes. In order to extend the range of cost figures to include a wide array of possible facility sizes, the manufacturers’ data was extrapolated along a greater continuum. No assumptions regarding potential economies of scale were inferred unless they were included in the manufacturers’ figures. Generally, the identification and quantification of opportunities to reduce capital expenditures on AD reactors through economies of scale requires a detailed level of information concerning facility design and layout. The collection and analysis of this type of information was beyond the scope of this preliminary report, but will likely be carried out through future feasibility and conceptual design studies. While these cost estimates are regarded as satisfactory for the purposes of this report in terms of quantifying the comparative cost implications of different waste flow scenarios, these figures cannot be used for other purposes because they are based on planning assumptions rather than firm price quotes. 4.4 Pre-Treatment Equipment 4.4.1 Assumptions about Contamination It was assumed that the type of equipment required for pre-treatment would vary with the feedstock (i.e. SSO or mixed waste), and that mixed waste would need considerably more pre-treatment than SSO. Information in the literature suggests that SSO processing plants utilize minimal pre-treatment equipment. For instance, a case study prepared by RIS on the Dranco SSO plant in Brecht, Belgium noted that a large 3-4 RPM trommel screen sorting minus 40 mm material was the only significant piece of equipment used during the pre-treatment of incoming waste.7 Estimates indicate that 10% of the incoming waste was removed during this screening process. Post-treatment equipment was limited to a 10 mm vibrating screen to remove oversize material and contaminants before the digestate was sent to a curing pad. 7 R. Sinclair and M. Kelleher, "Anaerobic Digestion for Household Organics." Biocycle, April 1995.
WDO Study: Implications of Different Waste Feed Streams (Source Separated Organics and Mixed Waste) On Collection Requirements and Anaerobic Digestion Processing Facility Design, Equipment and Cost
December, 2001 Allen Kani and Enviros RIS Page 23
Quality of the end product is another factor in determining the level of pre-treatment required for a mixed waste plant. Preliminary data from WDO funded research by City of Ottawa at the Conporec mixed waste processing and composting facility in Tracy, Quebec, suggests that aerobically composted mixed waste from multi-family dwellings does not meet Ontario's guidelines for unrestricted use because of high metal concentrations. Although there is a gap in published sources with regard to the source of metal contamination, preliminary data suggests that a number of household products contribute to this problem. Research, for instance, conducted by two Cornell University professors regarding contamination in finished compost attempted to quantify and trace the source of metal contamination in household waste.8 The study concluded that:
"Batteries, consumer electronics, ceramics, light bulbs, house dust and paint chips, lead foils such as wine bottle closures, used motor oils, plastics, and some glass and inks can all introduce metal contaminants into the solid waste stream. Batteries are a particularly significant source of metal contaminants. Even after 80% of lead-acid automobile batteries are recovered for recycling, the remaining 20% are estimated to contribute 66% of the lead in MSW in the U.S. Household batteries account for approximately 90% of the mercury, though that level is projected to decline greatly as manufacturers remove mercury from alkaline batteries. Nickel-cadmium batteries may be responsible for up to 52% of the cadmium. Another study has estimated that 27% of the lead and 9% of the cadmium are contributed by consumer electronic goods, including TVs, calculators, and stereos. Plastics are estimated to contribute approximately 30% of the cadmium as well as significant amounts of nickel and lead. Metals in plastics and some other fractions of the MSW stream can be difficult to recover because they are so widely dispersed."
Research recently completed by City of Toronto staff has identified the inks on plastic bags as another source of metal contamination. This is significant for both source separated and mixed waste programs because in both cases household residents would be expected to package odorous organic material in plastic grocery bags. Grocery bag inks as a possible source of metal contamination stresses the need for upfront processing (possibly both mechanical and manual) to remove all known sources of contamination prior to digestion. In order to create the possibility of producing a finished digestate that meets Ontario Interim Guidelines for Unrestricted Use, a high degree of mechanical separation appears to be an appropriate assumption for mixed waste plants. Furthermore, because mechanical separation is limited in its capacity to remove unwanted materials, manual sortation would also be required in order to remove materials that might otherwise not be
8 "Municipal Solid Waste Composting: Strategies for Separating Contaminants," Tom L. Richard and Peter B. Woodbury, Cornell University. Cornell Composting Resources: MSW Composting Fact Sheets. Fact Sheet # 3. Website: www.cals.cornell.edu/dept/compost/MSW.FactSheets/msw.fs3.html. Visited February 28, 2001.
WDO Study: Implications of Different Waste Feed Streams (Source Separated Organics and Mixed Waste) On Collection Requirements and Anaerobic Digestion Processing Facility Design, Equipment and Cost
December, 2001 Allen Kani and Enviros RIS Page 24
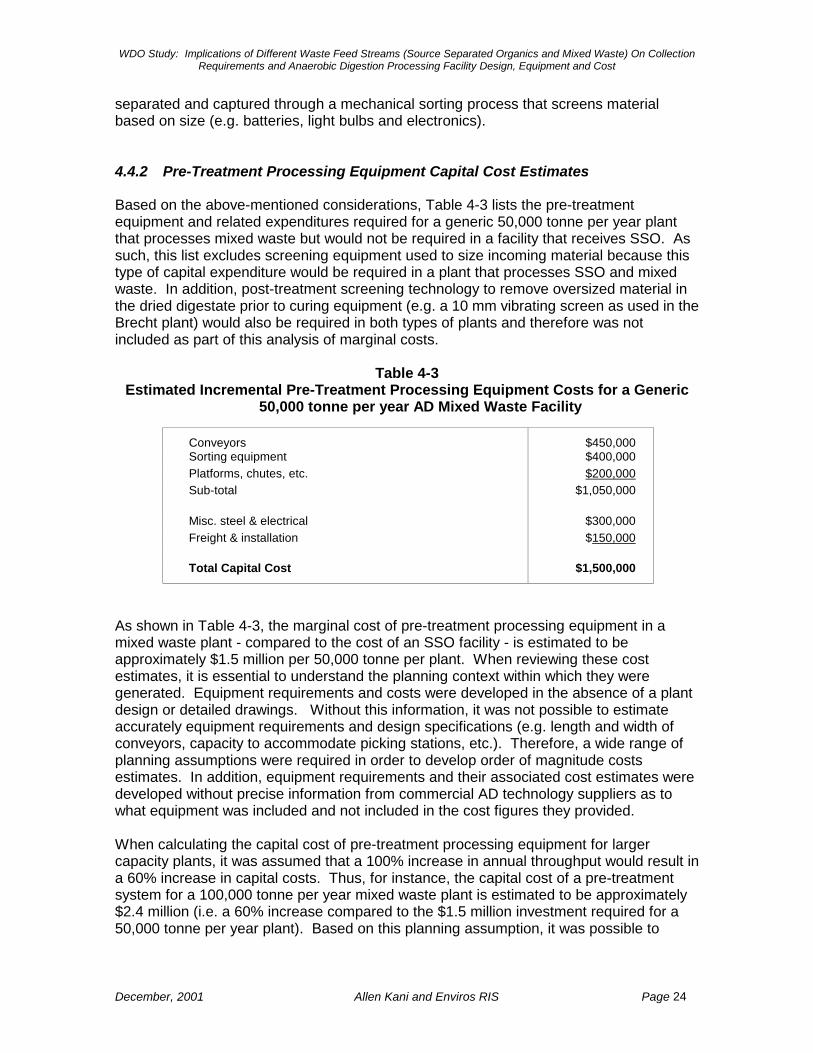
separated and captured through a mechanical sorting process that screens material based on size (e.g. batteries, light bulbs and electronics). 4.4.2 Pre-Treatment Processing Equipment Capital Cost Estimates Based on the above-mentioned considerations, Table 4-3 lists the pre-treatment equipment and related expenditures required for a generic 50,000 tonne per year plant that processes mixed waste but would not be required in a facility that receives SSO. As such, this list excludes screening equipment used to size incoming material because this type of capital expenditure would be required in a plant that processes SSO and mixed waste. In addition, post-treatment screening technology to remove oversized material in the dried digestate prior to curing equipment (e.g. a 10 mm vibrating screen as used in the Brecht plant) would also be required in both types of plants and therefore was not included as part of this analysis of marginal costs.
Table 4-3 Estimated Incremental Pre-Treatment Processing Equipment Costs for a Generic
50,000 tonne per year AD Mixed Waste Facility
Conveyors $450,000 Sorting equipment $400,000 Platforms, chutes, etc. $200,000 Sub-total $1,050,000
Misc. steel & electrical $300,000 Freight & installation $150,000
Total Capital Cost $1,500,000
As shown in Table 4-3, the marginal cost of pre-treatment processing equipment in a mixed waste plant - compared to the cost of an SSO facility - is estimated to be approximately $1.5 million per 50,000 tonne per plant. When reviewing these cost estimates, it is essential to understand the planning context within which they were generated. Equipment requirements and costs were developed in the absence of a plant design or detailed drawings. Without this information, it was not possible to estimate accurately equipment requirements and design specifications (e.g. length and width of conveyors, capacity to accommodate picking stations, etc.). Therefore, a wide range of planning assumptions were required in order to develop order of magnitude costs estimates. In addition, equipment requirements and their associated cost estimates were developed without precise information from commercial AD technology suppliers as to what equipment was included and not included in the cost figures they provided.
When calculating the capital cost of pre-treatment processing equipment for larger capacity plants, it was assumed that a 100% increase in annual throughput would result in a 60% increase in capital costs. Thus, for instance, the capital cost of a pre-treatment system for a 100,000 tonne per year mixed waste plant is estimated to be approximately $2.4 million (i.e. a 60% increase compared to the $1.5 million investment required for a 50,000 tonne per year plant). Based on this planning assumption, it was possible to
WDO Study: Implications of Different Waste Feed Streams (Source Separated Organics and Mixed Waste) On Collection Requirements and Anaerobic Digestion Processing Facility Design, Equipment and Cost
December, 2001 Allen Kani and Enviros RIS Page 25
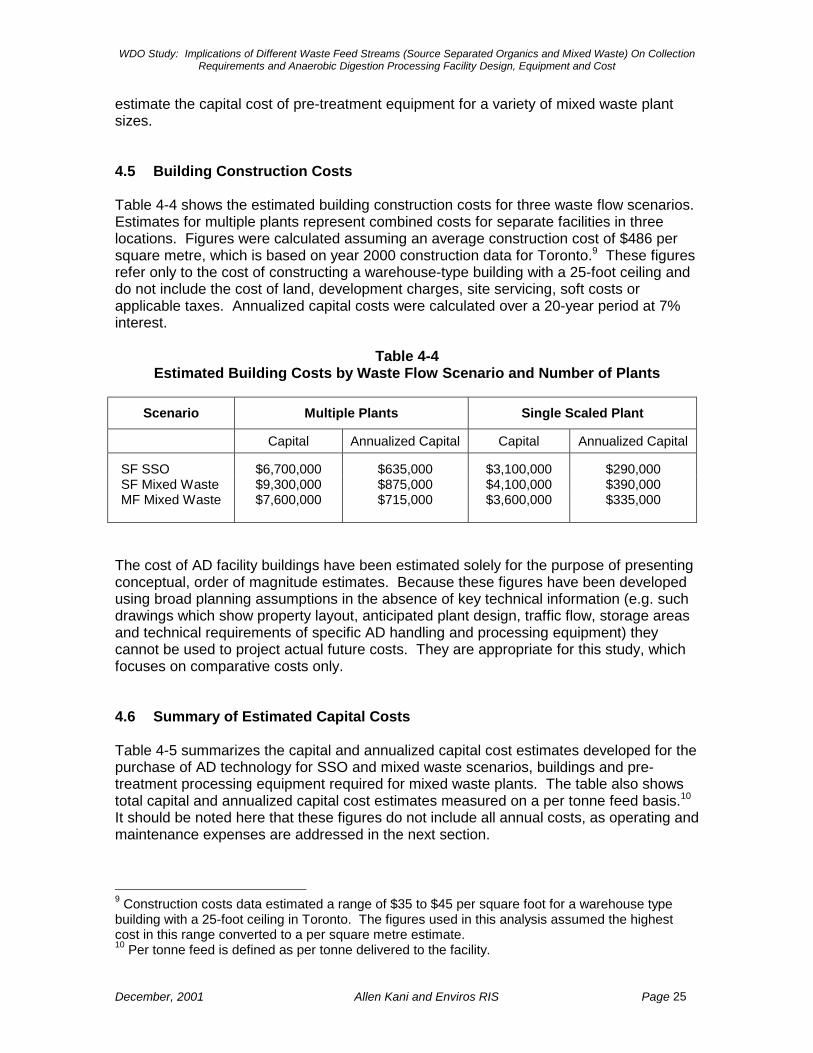
estimate the capital cost of pre-treatment equipment for a variety of mixed waste plant sizes. 4.5 Building Construction Costs Table 4-4 shows the estimated building construction costs for three waste flow scenarios. Estimates for multiple plants represent combined costs for separate facilities in three locations. Figures were calculated assuming an average construction cost of $486 per square metre, which is based on year 2000 construction data for Toronto.9 These figures refer only to the cost of constructing a warehouse-type building with a 25-foot ceiling and do not include the cost of land, development charges, site servicing, soft costs or applicable taxes. Annualized capital costs were calculated over a 20-year period at 7% interest.
Table 4-4
Estimated Building Costs by Waste Flow Scenario and Number of Plants
Scenario Multiple Plants Single Scaled Plant
Capital Annualized Capital Capital Annualized Capital
SF SSO $6,700,000 $635,000 $3,100,000 $290,000 SF Mixed Waste $9,300,000 $875,000 $4,100,000 $390,000 MF Mixed Waste $7,600,000 $715,000 $3,600,000 $335,000
The cost of AD facility buildings have been estimated solely for the purpose of presenting conceptual, order of magnitude estimates. Because these figures have been developed using broad planning assumptions in the absence of key technical information (e.g. such drawings which show property layout, anticipated plant design, traffic flow, storage areas and technical requirements of specific AD handling and processing equipment) they cannot be used to project actual future costs. They are appropriate for this study, which focuses on comparative costs only. 4.6 Summary of Estimated Capital Costs Table 4-5 summarizes the capital and annualized capital cost estimates developed for the purchase of AD technology for SSO and mixed waste scenarios, buildings and pre-treatment processing equipment required for mixed waste plants. The table also shows total capital and annualized capital cost estimates measured on a per tonne feed basis.10 It should be noted here that these figures do not include all annual costs, as operating and maintenance expenses are addressed in the next section.
9 Construction costs data estimated a range of $35 to $45 per square foot for a warehouse type building with a 25-foot ceiling in Toronto. The figures used in this analysis assumed the highest cost in this range converted to a per square metre estimate. 10 Per tonne feed is defined as per tonne delivered to the facility.
WDO Study: Implications of Different Waste Feed Streams (Source Separated Organics and Mixed Waste) On Collection Requirements and Anaerobic Digestion Processing Facility Design, Equipment and Cost
December, 2001 Allen Kani and Enviros RIS Page 26
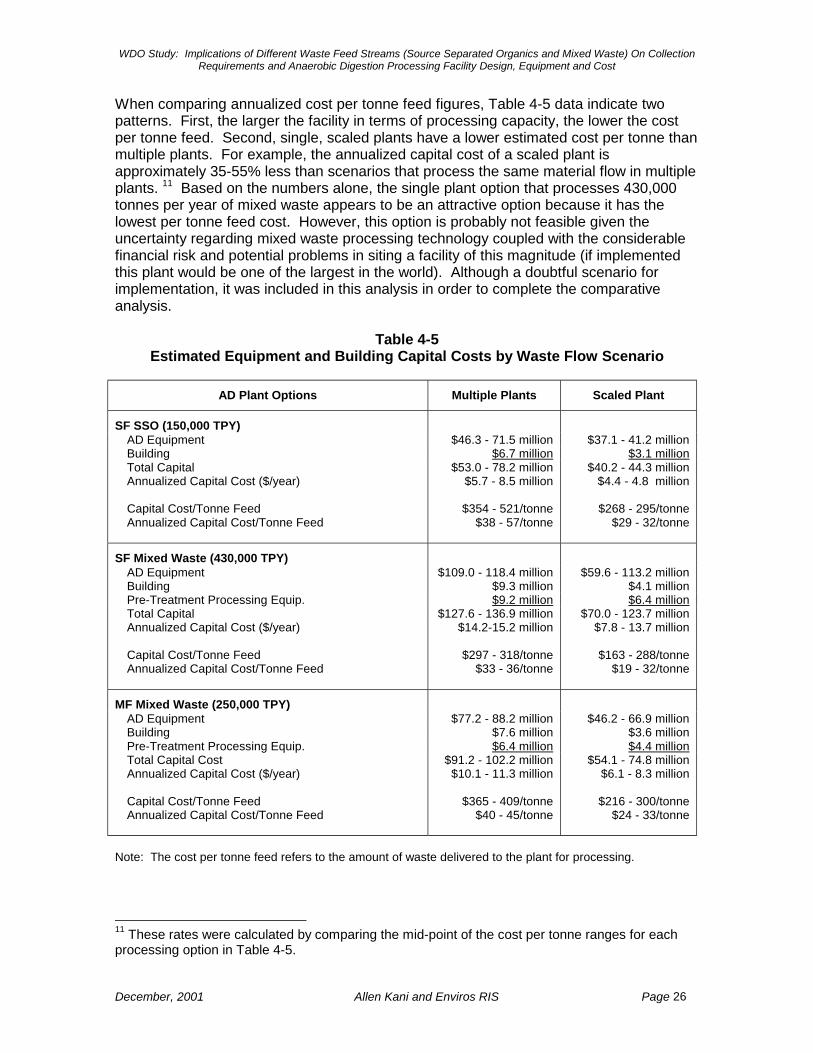
When comparing annualized cost per tonne feed figures, Table 4-5 data indicate two patterns. First, the larger the facility in terms of processing capacity, the lower the cost per tonne feed. Second, single, scaled plants have a lower estimated cost per tonne than multiple plants. For example, the annualized capital cost of a scaled plant is approximately 35-55% less than scenarios that process the same material flow in multiple plants. 11 Based on the numbers alone, the single plant option that processes 430,000 tonnes per year of mixed waste appears to be an attractive option because it has the lowest per tonne feed cost. However, this option is probably not feasible given the uncertainty regarding mixed waste processing technology coupled with the considerable financial risk and potential problems in siting a facility of this magnitude (if implemented this plant would be one of the largest in the world). Although a doubtful scenario for implementation, it was included in this analysis in order to complete the comparative analysis.
Table 4-5 Estimated Equipment and Building Capital Costs by Waste Flow Scenario
AD Plant Options Multiple Plants Scaled Plant
SF SSO (150,000 TPY) AD Equipment $46.3 - 71.5 million $37.1 - 41.2 million Building $6.7 million $3.1 million Total Capital Annualized Capital Cost ($/year) Capital Cost/Tonne Feed Annualized Capital Cost/Tonne Feed
$53.0 - 78.2 million $5.7 - 8.5 million
$354 - 521/tonne
$38 - 57/tonne
$40.2 - 44.3 million $4.4 - 4.8 million
$268 - 295/tonne
$29 - 32/tonne
SF Mixed Waste (430,000 TPY) AD Equipment $109.0 - 118.4 million $59.6 - 113.2 million Building $9.3 million $4.1 million Pre-Treatment Processing Equip. $9.2 million $6.4 million Total Capital $127.6 - 136.9 million $70.0 - 123.7 million Annualized Capital Cost ($/year) Capital Cost/Tonne Feed Annualized Capital Cost/Tonne Feed
$14.2-15.2 million
$297 - 318/tonne $33 - 36/tonne
$7.8 - 13.7 million
$163 - 288/tonne $19 - 32/tonne
MF Mixed Waste (250,000 TPY) AD Equipment $77.2 - 88.2 million $46.2 - 66.9 million Building $7.6 million $3.6 million Pre-Treatment Processing Equip. $6.4 million $4.4 million Total Capital Cost Annualized Capital Cost ($/year) Capital Cost/Tonne Feed Annualized Capital Cost/Tonne Feed
$91.2 - 102.2 million $10.1 - 11.3 million
$365 - 409/tonne
$40 - 45/tonne
$54.1 - 74.8 million $6.1 - 8.3 million
$216 - 300/tonne
$24 - 33/tonne
Note: The cost per tonne feed refers to the amount of waste delivered to the plant for processing.
11 These rates were calculated by comparing the mid-point of the cost per tonne ranges for each processing option in Table 4-5.
WDO Study: Implications of Different Waste Feed Streams (Source Separated Organics and Mixed Waste) On Collection Requirements and Anaerobic Digestion Processing Facility Design, Equipment and Cost
December, 2001 Allen Kani and Enviros RIS Page 27
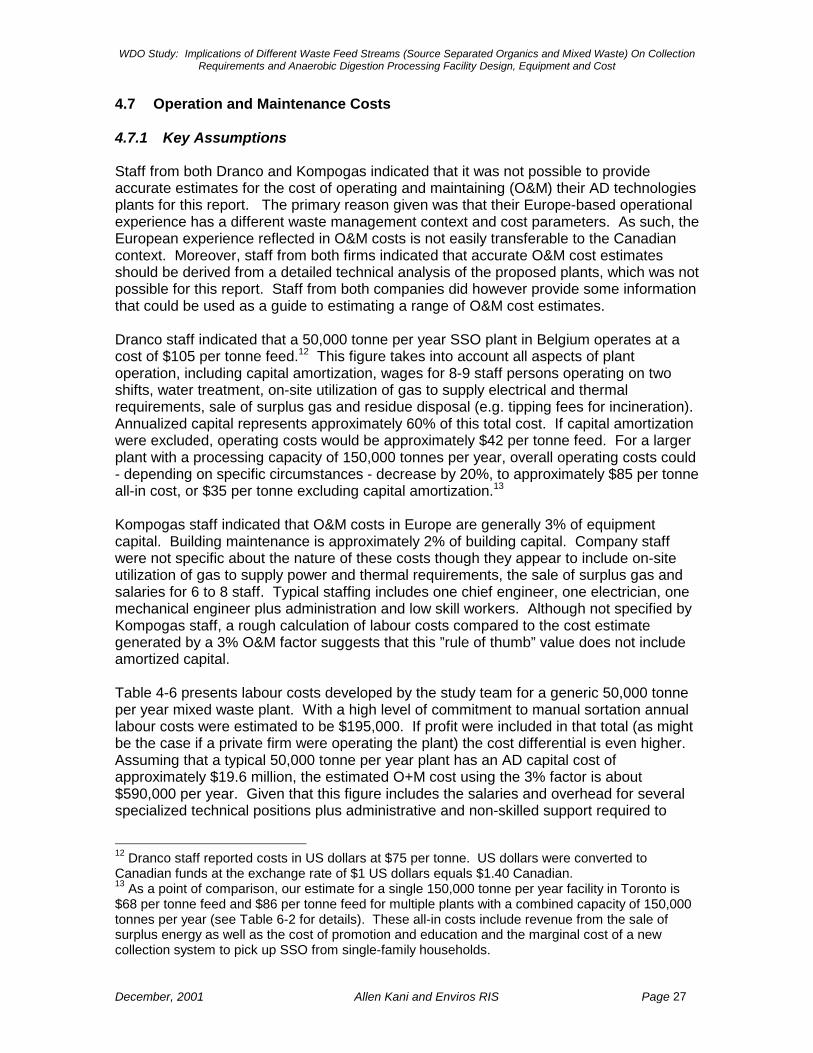
4.7 Operation and Maintenance Costs 4.7.1 Key Assumptions Staff from both Dranco and Kompogas indicated that it was not possible to provide accurate estimates for the cost of operating and maintaining (O&M) their AD technologies plants for this report. The primary reason given was that their Europe-based operational experience has a different waste management context and cost parameters. As such, the European experience reflected in O&M costs is not easily transferable to the Canadian context. Moreover, staff from both firms indicated that accurate O&M cost estimates should be derived from a detailed technical analysis of the proposed plants, which was not possible for this report. Staff from both companies did however provide some information that could be used as a guide to estimating a range of O&M cost estimates. Dranco staff indicated that a 50,000 tonne per year SSO plant in Belgium operates at a cost of $105 per tonne feed.12 This figure takes into account all aspects of plant operation, including capital amortization, wages for 8-9 staff persons operating on two shifts, water treatment, on-site utilization of gas to supply electrical and thermal requirements, sale of surplus gas and residue disposal (e.g. tipping fees for incineration). Annualized capital represents approximately 60% of this total cost. If capital amortization were excluded, operating costs would be approximately $42 per tonne feed. For a larger plant with a processing capacity of 150,000 tonnes per year, overall operating costs could - depending on specific circumstances - decrease by 20%, to approximately $85 per tonne all-in cost, or $35 per tonne excluding capital amortization.13 Kompogas staff indicated that O&M costs in Europe are generally 3% of equipment capital. Building maintenance is approximately 2% of building capital. Company staff were not specific about the nature of these costs though they appear to include on-site utilization of gas to supply power and thermal requirements, the sale of surplus gas and salaries for 6 to 8 staff. Typical staffing includes one chief engineer, one electrician, one mechanical engineer plus administration and low skill workers. Although not specified by Kompogas staff, a rough calculation of labour costs compared to the cost estimate generated by a 3% O&M factor suggests that this ”rule of thumb” value does not include amortized capital. Table 4-6 presents labour costs developed by the study team for a generic 50,000 tonne per year mixed waste plant. With a high level of commitment to manual sortation annual labour costs were estimated to be $195,000. If profit were included in that total (as might be the case if a private firm were operating the plant) the cost differential is even higher. Assuming that a typical 50,000 tonne per year plant has an AD capital cost of approximately $19.6 million, the estimated O+M cost using the 3% factor is about $590,000 per year. Given that this figure includes the salaries and overhead for several specialized technical positions plus administrative and non-skilled support required to
12 Dranco staff reported costs in US dollars at $75 per tonne. US dollars were converted to Canadian funds at the exchange rate of $1 US dollars equals $1.40 Canadian. 13 As a point of comparison, our estimate for a single 150,000 tonne per year facility in Toronto is $68 per tonne feed and $86 per tonne feed for multiple plants with a combined capacity of 150,000 tonnes per year (see Table 6-2 for details). These all-in costs include revenue from the sale of surplus energy as well as the cost of promotion and education and the marginal cost of a new collection system to pick up SSO from single-family households.
WDO Study: Implications of Different Waste Feed Streams (Source Separated Organics and Mixed Waste) On Collection Requirements and Anaerobic Digestion Processing Facility Design, Equipment and Cost
December, 2001 Allen Kani and Enviros RIS Page 28
operate an SSO plant, it has been assumed that the 3% O+M cost factor does not include the cost of labour for an extensive manual sorting system in a mixed waste facility. Therefore, the cost of manual sorting based on Table 4-6 figures has been assumed for the mixed waste options only. Labour costs for facilities larger than 50,000 tonnes per year were ramped up on the basis of the assumption that a 100% increase in annual throughput requires a 60% increase in labour costs.
Table 4-6 Estimated Labour Costs of Mixed Waste Pre-Treatment
Item O&M Cost Estimates
LABOUR Number of pickers 5 Picker annual salaries ($12/hr) $125,000 Supervisor (50% of plant manager) 25,000 OH and benefits (30%) 45,000 Annual labour cost per plant 195,000
PROFIT (15% of labour and maintenance sub-total) 30,000
Total Annual Costs $225,000
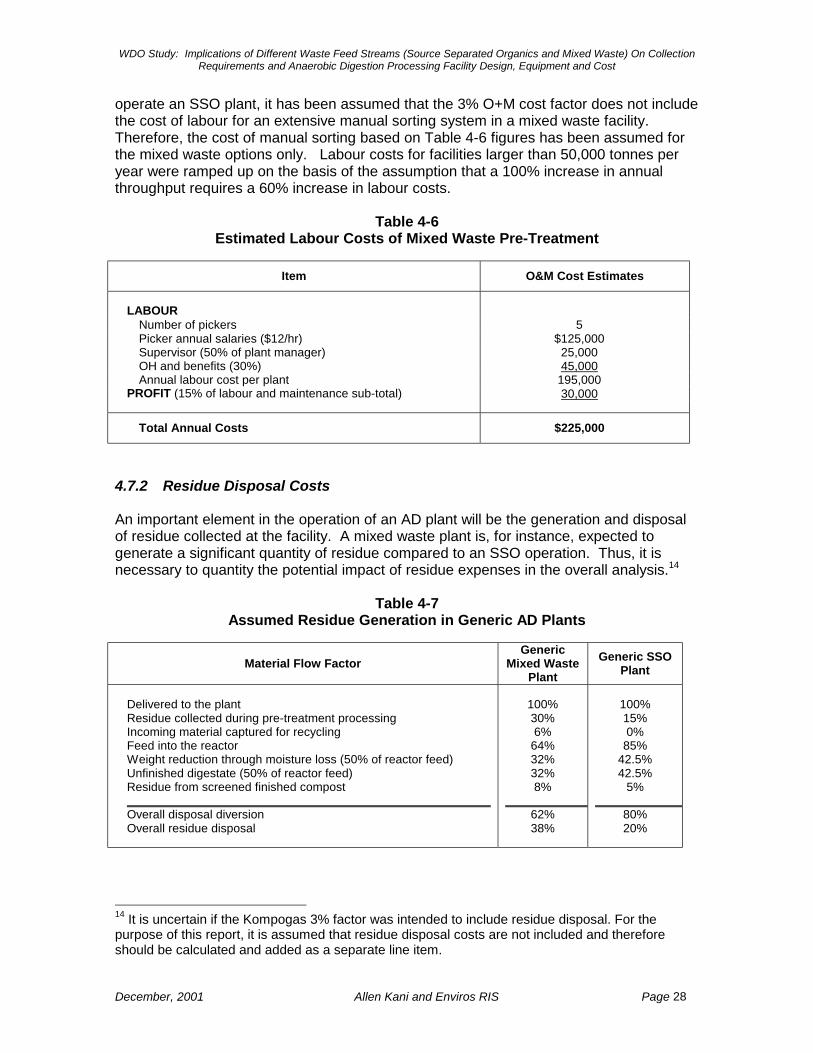
4.7.2 Residue Disposal Costs An important element in the operation of an AD plant will be the generation and disposal of residue collected at the facility. A mixed waste plant is, for instance, expected to generate a significant quantity of residue compared to an SSO operation. Thus, it is necessary to quantity the potential impact of residue expenses in the overall analysis.14
Table 4-7
Assumed Residue Generation in Generic AD Plants
Material Flow Factor Generic
Mixed Waste Plant
Generic SSO Plant
Delivered to the plant Residue collected during pre-treatment processing Incoming material captured for recycling Feed into the reactor Weight reduction through moisture loss (50% of reactor feed) Unfinished digestate (50% of reactor feed) Residue from screened finished compost
Overall disposal diversion Overall residue disposal
100% 30% 6%
64% 32% 32% 8%
62% 38%
100% 15% 0%
85% 42.5% 42.5%
5%
80% 20%
14 It is uncertain if the Kompogas 3% factor was intended to include residue disposal. For the purpose of this report, it is assumed that residue disposal costs are not included and therefore should be calculated and added as a separate line item.
WDO Study: Implications of Different Waste Feed Streams (Source Separated Organics and Mixed Waste) On Collection Requirements and Anaerobic Digestion Processing Facility Design, Equipment and Cost
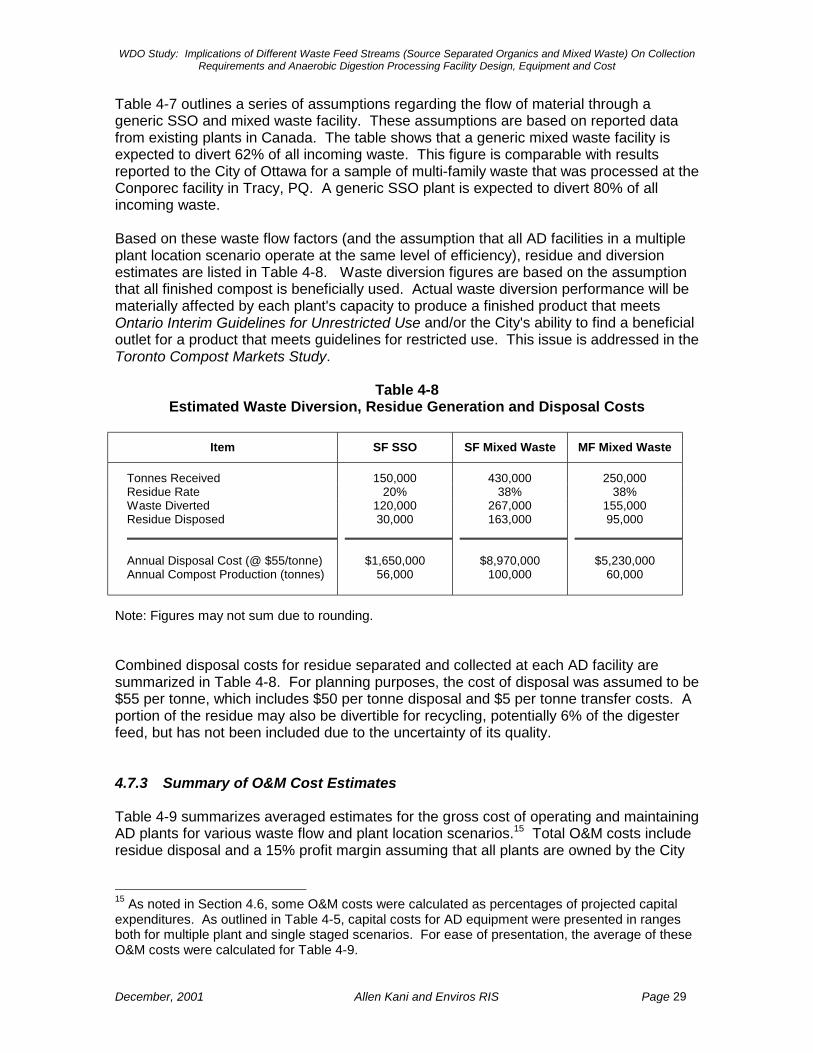
December, 2001 Allen Kani and Enviros RIS Page 29
Table 4-7 outlines a series of assumptions regarding the flow of material through a generic SSO and mixed waste facility. These assumptions are based on reported data from existing plants in Canada. The table shows that a generic mixed waste facility is expected to divert 62% of all incoming waste. This figure is comparable with results reported to the City of Ottawa for a sample of multi-family waste that was processed at the Conporec facility in Tracy, PQ. A generic SSO plant is expected to divert 80% of all incoming waste.
Based on these waste flow factors (and the assumption that all AD facilities in a multiple plant location scenario operate at the same level of efficiency), residue and diversion estimates are listed in Table 4-8. Waste diversion figures are based on the assumption that all finished compost is beneficially used. Actual waste diversion performance will be materially affected by each plant's capacity to produce a finished product that meets Ontario Interim Guidelines for Unrestricted Use and/or the City's ability to find a beneficial outlet for a product that meets guidelines for restricted use. This issue is addressed in the Toronto Compost Markets Study.
Table 4-8 Estimated Waste Diversion, Residue Generation and Disposal Costs
Item SF SSO SF Mixed Waste MF Mixed Waste
Tonnes Received 150,000 430,000 250,000 Residue Rate 20% 38% 38% Waste Diverted 120,000 267,000 155,000 Residue Disposed 30,000 163,000 95,000
Annual Disposal Cost (@ $55/tonne) Annual Compost Production (tonnes)
$1,650,000
56,000
$8,970,000
100,000
$5,230,000
60,000
Note: Figures may not sum due to rounding. Combined disposal costs for residue separated and collected at each AD facility are summarized in Table 4-8. For planning purposes, the cost of disposal was assumed to be $55 per tonne, which includes $50 per tonne disposal and $5 per tonne transfer costs. A portion of the residue may also be divertible for recycling, potentially 6% of the digester feed, but has not been included due to the uncertainty of its quality. 4.7.3 Summary of O&M Cost Estimates Table 4-9 summarizes averaged estimates for the gross cost of operating and maintaining AD plants for various waste flow and plant location scenarios.15 Total O&M costs include residue disposal and a 15% profit margin assuming that all plants are owned by the City
15 As noted in Section 4.6, some O&M costs were calculated as percentages of projected capital expenditures. As outlined in Table 4-5, capital costs for AD equipment were presented in ranges both for multiple plant and single staged scenarios. For ease of presentation, the average of these O&M costs were calculated for Table 4-9.
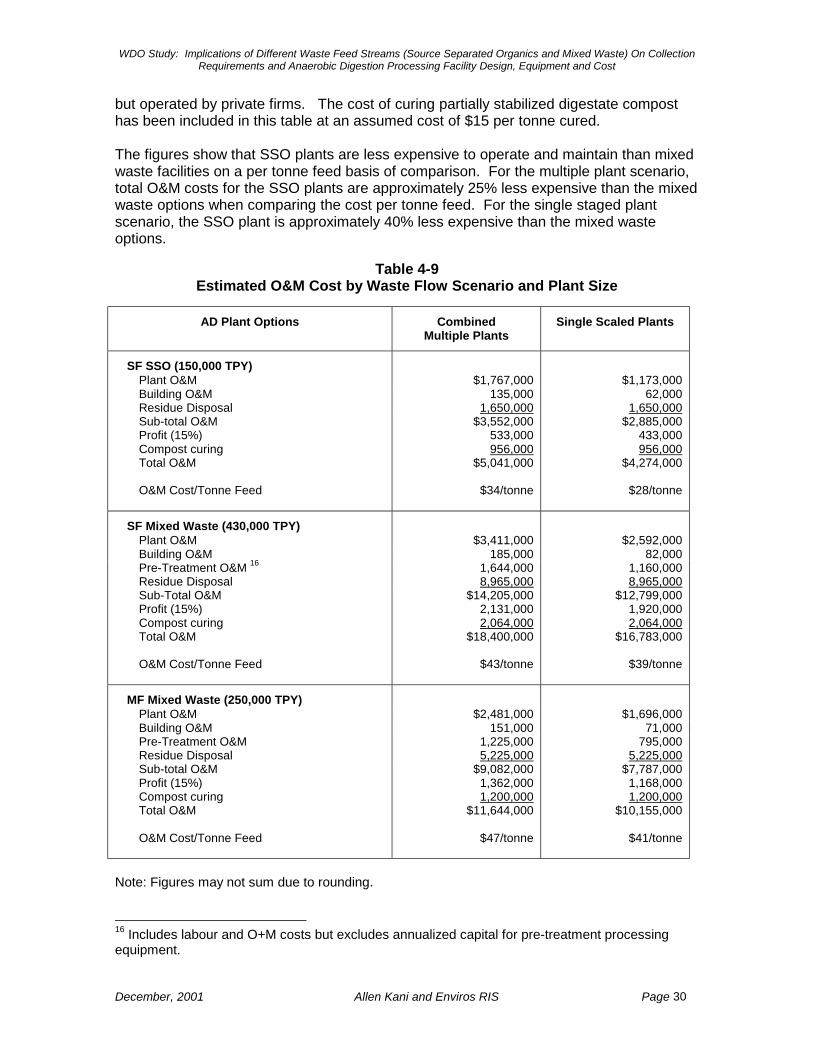
WDO Study: Implications of Different Waste Feed Streams (Source Separated Organics and Mixed Waste) On Collection Requirements and Anaerobic Digestion Processing Facility Design, Equipment and Cost
December, 2001 Allen Kani and Enviros RIS Page 30
but operated by private firms. The cost of curing partially stabilized digestate compost has been included in this table at an assumed cost of $15 per tonne cured. The figures show that SSO plants are less expensive to operate and maintain than mixed waste facilities on a per tonne feed basis of comparison. For the multiple plant scenario, total O&M costs for the SSO plants are approximately 25% less expensive than the mixed waste options when comparing the cost per tonne feed. For the single staged plant scenario, the SSO plant is approximately 40% less expensive than the mixed waste options.
Table 4-9
Estimated O&M Cost by Waste Flow Scenario and Plant Size
AD Plant Options Combined Multiple Plants
Single Scaled Plants
SF SSO (150,000 TPY) Plant O&M $1,767,000 $1,173,000 Building O&M Residue Disposal
135,000 1,650,000
62,000 1,650,000
Sub-total O&M Profit (15%) Compost curing Total O&M O&M Cost/Tonne Feed
$3,552,000 533,000 956,000
$5,041,000
$34/tonne
$2,885,000 433,000 956,000
$4,274,000
$28/tonne
SF Mixed Waste (430,000 TPY) Plant O&M $3,411,000 $2,592,000 Building O&M 185,000 82,000 Pre-Treatment O&M 16 Residue Disposal
1,644,000 8,965,000
1,160,000 8,965,000
Sub-Total O&M Profit (15%) Compost curing Total O&M O&M Cost/Tonne Feed
$14,205,000 2,131,000 2,064,000
$18,400,000
$43/tonne
$12,799,000 1,920,000 2,064,000
$16,783,000
$39/tonne
MF Mixed Waste (250,000 TPY) Plant O&M $2,481,000 $1,696,000 Building O&M 151,000 71,000 Pre-Treatment O&M Residue Disposal
1,225,000 5,225,000
795,000 5,225,000
Sub-total O&M Profit (15%) Compost curing Total O&M O&M Cost/Tonne Feed
$9,082,000 1,362,000 1,200,000
$11,644,000
$47/tonne
$7,787,000 1,168,000 1,200,000
$10,155,000
$41/tonne
Note: Figures may not sum due to rounding. 16 Includes labour and O+M costs but excludes annualized capital for pre-treatment processing equipment.
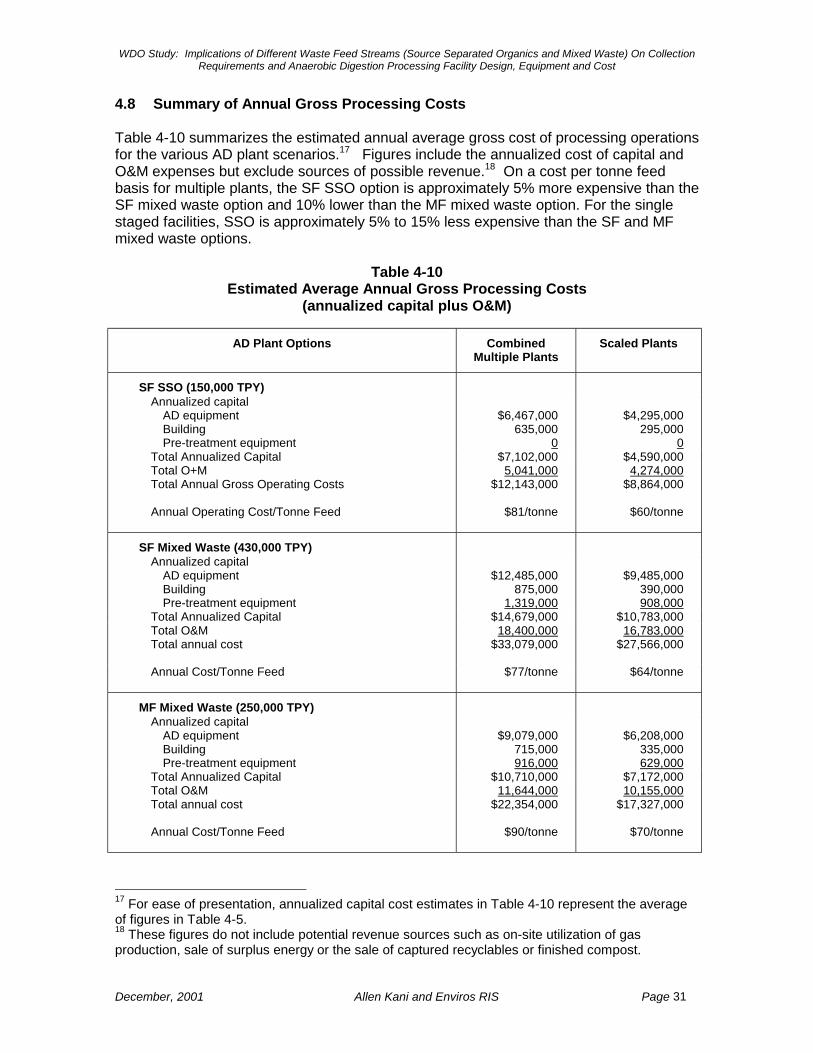
WDO Study: Implications of Different Waste Feed Streams (Source Separated Organics and Mixed Waste) On Collection Requirements and Anaerobic Digestion Processing Facility Design, Equipment and Cost
December, 2001 Allen Kani and Enviros RIS Page 31
4.8 Summary of Annual Gross Processing Costs Table 4-10 summarizes the estimated annual average gross cost of processing operations for the various AD plant scenarios.17 Figures include the annualized cost of capital and O&M expenses but exclude sources of possible revenue.18 On a cost per tonne feed basis for multiple plants, the SF SSO option is approximately 5% more expensive than the SF mixed waste option and 10% lower than the MF mixed waste option. For the single staged facilities, SSO is approximately 5% to 15% less expensive than the SF and MF mixed waste options.
Table 4-10
Estimated Average Annual Gross Processing Costs (annualized capital plus O&M)
AD Plant Options Combined Multiple Plants
Scaled Plants
SF SSO (150,000 TPY) Annualized capital
AD equipment Building Pre-treatment equipment
$6,467,000
635,000 0
$4,295,000
295,000 0
Total Annualized Capital $7,102,000 $4,590,000 Total O+M Total Annual Gross Operating Costs Annual Operating Cost/Tonne Feed
5,041,000 $12,143,000
$81/tonne
4,274,000 $8,864,000
$60/tonne
SF Mixed Waste (430,000 TPY) Annualized capital
AD equipment Building Pre-treatment equipment
$12,485,000
875,000 1,319,000
$9,485,000
390,000 908,000
Total Annualized Capital $14,679,000 $10,783,000 Total O&M 18,400,000 16,783,000 Total annual cost
$33,079,000 $27,566,000
Annual Cost/Tonne Feed
$77/tonne $64/tonne
MF Mixed Waste (250,000 TPY) Annualized capital
AD equipment Building Pre-treatment equipment
$9,079,000
715,000 916,000
$6,208,000
335,000 629,000
Total Annualized Capital $10,710,000 $7,172,000 Total O&M 11,644,000 10,155,000 Total annual cost Annual Cost/Tonne Feed
$22,354,000
$90/tonne
$17,327,000
$70/tonne
17 For ease of presentation, annualized capital cost estimates in Table 4-10 represent the average of figures in Table 4-5. 18 These figures do not include potential revenue sources such as on-site utilization of gas production, sale of surplus energy or the sale of captured recyclables or finished compost.
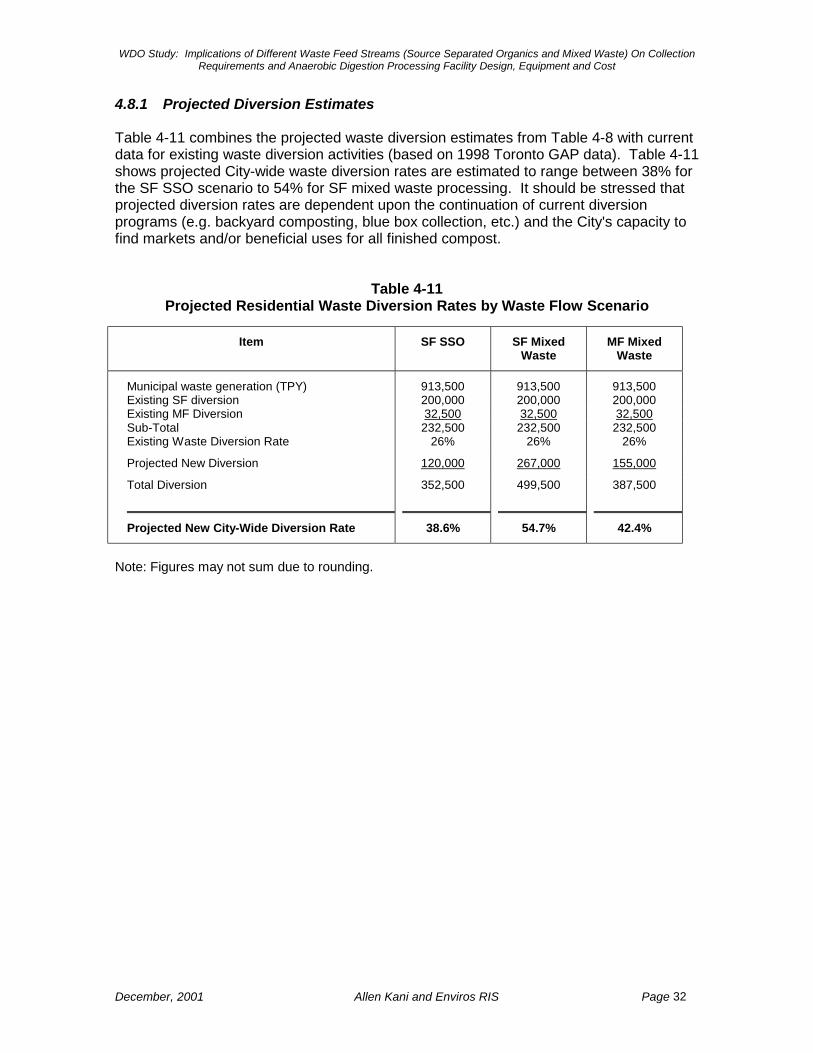
WDO Study: Implications of Different Waste Feed Streams (Source Separated Organics and Mixed Waste) On Collection Requirements and Anaerobic Digestion Processing Facility Design, Equipment and Cost
December, 2001 Allen Kani and Enviros RIS Page 32
4.8.1 Projected Diversion Estimates Table 4-11 combines the projected waste diversion estimates from Table 4-8 with current data for existing waste diversion activities (based on 1998 Toronto GAP data). Table 4-11 shows projected City-wide waste diversion rates are estimated to range between 38% for the SF SSO scenario to 54% for SF mixed waste processing. It should be stressed that projected diversion rates are dependent upon the continuation of current diversion programs (e.g. backyard composting, blue box collection, etc.) and the City's capacity to find markets and/or beneficial uses for all finished compost.
Table 4-11 Projected Residential Waste Diversion Rates by Waste Flow Scenario
Item SF SSO SF Mixed Waste
MF Mixed Waste
Municipal waste generation (TPY) 913,500 913,500 913,500 Existing SF diversion 200,000 200,000 200,000 Existing MF Diversion 32,500 32,500 32,500 Sub-Total 232,500 232,500 232,500 Existing Waste Diversion Rate 26% 26% 26%
Projected New Diversion 120,000 267,000 155,000
Total Diversion 352,500 499,500 387,500
Projected New City-Wide Diversion Rate 38.6% 54.7% 42.4%
Note: Figures may not sum due to rounding.
WDO Study: Implications of Different Waste Feed Streams (Source Separated Organics and Mixed Waste) On Collection Requirements and Anaerobic Digestion Processing Facility Design, Equipment and Cost
December, 2001 Allen Kani and Enviros RIS Page 33
5.0 COLLECTION ISSUES AND COSTS 5.1 Summary The purpose of this section is to review the City of Toronto's current residential waste collection system and identify the additional costs associated with the different waste flow scenarios. These estimates include waste collection from single family and multi-family buildings as well as transfer costs. Cost estimates are based on a variety of assumptions including the amount of material collected. To summarize, the following totals (developed through separate studies) have been assumed for each type of residential waste:
• Single family SSO - 150,000 tonnes per year • Single family mixed waste - 430,000 tonnes per year • Multi-family mixed waste - 250,000 tonnes per year
In order to calculate the cost implications of each waste flow scenario, Enviros RIS staff used a computer spreadsheet specifically designed to model the Toronto residential waste system. The ECAM model is a proprietary software program developed by Enviros RIS, which is customized to suit the needs of different clients and municipalities. It was first used to carry out a collection analysis for City of Ottawa, and has been customized for a number of different clients since that time (Region of Peel, etc.). It was recalibrated for use in the Toronto Integrated Resource Management (TIRM) project undertaken by MacViro and Enviros RIS, and is currently being updated to reflect new information on the Toronto collection system. For this project, the ECAM model was updated with new data in order to reflect recent changes to baseline conditions. These changes include 1999 GAP tonnages for generation, diversion and disposal plus updated information provided by City of Toronto staff regarding the number and type of collection vehicles as well as current labour costs. After entering the data, collection vehicle productivity and cost outputs were calibrated to correspond with municipal figures regarding the number of vehicles and overall system cost measured on a per tonne basis. Once recalibrated, the model was used to analyze alternative collection scenarios. All collection cost estimates have been based on the assumption that household carts would not be provided to single-family residents. For information purposes only, conceptual cost estimates associated with the purchase and door-to-door delivery of household containers were developed but have not been incorporated into the overall cost analysis. It should be stressed that the use of carts in a SF SSO program could impact the productivity of collection vehicles. These potential impacts have not been quantified not were they included in this analysis. In addition to collection cost changes, the implementation of a SF SSO is expected to require additional costs related to promotion and education (P&E). Table 5-1 summarizes the estimated marginal cost of implementing a SF SSO program relative to current system costs. The table shows that no new costs were calculated for waste flow scenarios that assume mixed waste processing, as the collection system would not be affected.
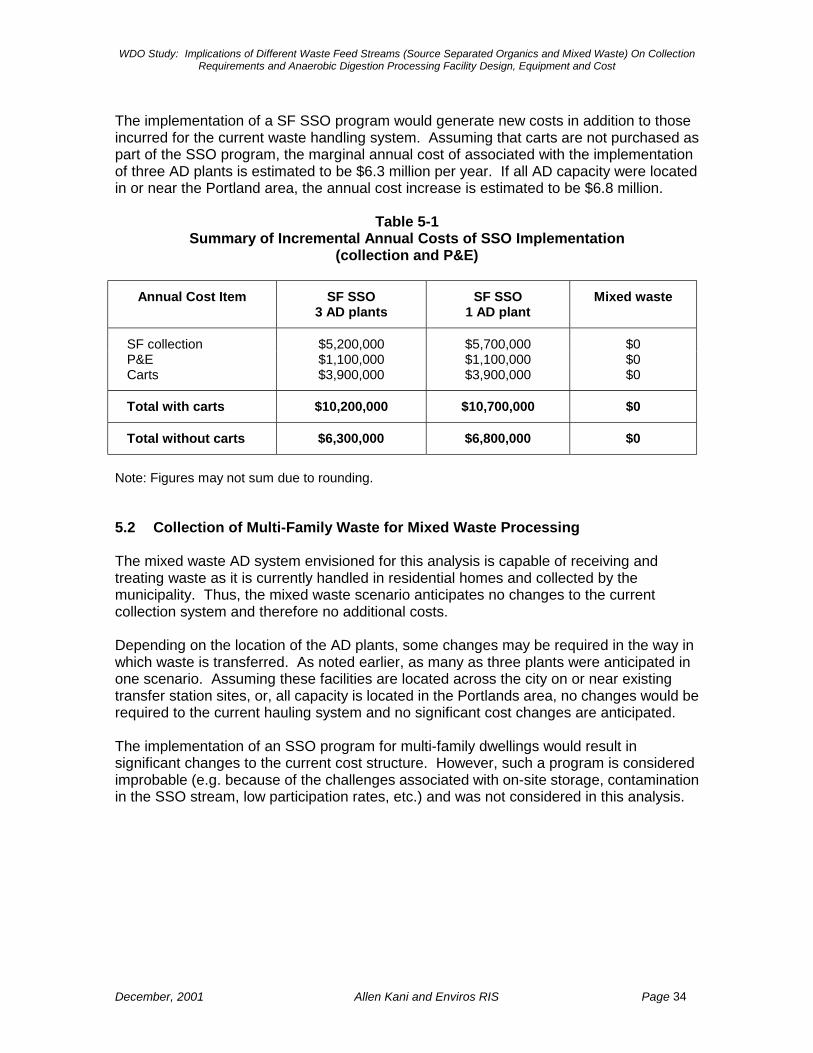
WDO Study: Implications of Different Waste Feed Streams (Source Separated Organics and Mixed Waste) On Collection Requirements and Anaerobic Digestion Processing Facility Design, Equipment and Cost
December, 2001 Allen Kani and Enviros RIS Page 34
The implementation of a SF SSO program would generate new costs in addition to those incurred for the current waste handling system. Assuming that carts are not purchased as part of the SSO program, the marginal annual cost of associated with the implementation of three AD plants is estimated to be $6.3 million per year. If all AD capacity were located in or near the Portland area, the annual cost increase is estimated to be $6.8 million.
Table 5-1
Summary of Incremental Annual Costs of SSO Implementation (collection and P&E)
Annual Cost Item SF SSO
3 AD plants SF SSO
1 AD plant Mixed waste
SF collection $5,200,000 $5,700,000 $0 P&E $1,100,000 $1,100,000 $0 Carts $3,900,000 $3,900,000 $0
Total with carts $10,200,000 $10,700,000 $0
Total without carts $6,300,000 $6,800,000 $0
Note: Figures may not sum due to rounding. 5.2 Collection of Multi-Family Waste for Mixed Waste Processing
The mixed waste AD system envisioned for this analysis is capable of receiving and treating waste as it is currently handled in residential homes and collected by the municipality. Thus, the mixed waste scenario anticipates no changes to the current collection system and therefore no additional costs. Depending on the location of the AD plants, some changes may be required in the way in which waste is transferred. As noted earlier, as many as three plants were anticipated in one scenario. Assuming these facilities are located across the city on or near existing transfer station sites, or, all capacity is located in the Portlands area, no changes would be required to the current hauling system and no significant cost changes are anticipated. The implementation of an SSO program for multi-family dwellings would result in significant changes to the current cost structure. However, such a program is considered improbable (e.g. because of the challenges associated with on-site storage, contamination in the SSO stream, low participation rates, etc.) and was not considered in this analysis.
WDO Study: Implications of Different Waste Feed Streams (Source Separated Organics and Mixed Waste) On Collection Requirements and Anaerobic Digestion Processing Facility Design, Equipment and Cost
December, 2001 Allen Kani and Enviros RIS Page 35
5.3 Collection of Single-Family Waste for Mixed Waste Processing In the multi-location AD plant scenario (i.e. one plant each in the Portlands, Dufferin Transfer Station and Scarborough Transfer Station), a savings of approximately $1.2 million per year is projected. Given the relatively modest scale of projected savings and a potential margin of error that must be assumed with the analytic tools used for this report (e.g. assumptions used to calculate collection productivity, the inherent inexactness of measuring system costs, etc.), it is reasonable to assume that no significant changes to the current collection and transfer system are expected with the implementation of the multi-plant single-family mixed waste processing scenario. In the second AD scenario, all single-family mixed waste is hauled to a central location in or near the Portlands area. In this scenario, the ECAM model projects an overall system savings of approximately $700,000 per year. For the reasons noted above, this relatively small variation in costs is not regarded as significant because it falls within a range that should be assumed for potential margin of error in the model and/or the raw data used to generate baseline cost and productivity assumptions. Therefore, a decision to implement a mixed waste AD operation for single-family households is not expected to result in significant changes to the current residential waste collection system. As such, no new collection costs or savings have been estimated for this scenario. 5.4 Collection of Single-Family SSO for Source Separated Processing Unlike the treatment of mixed waste, the implementation of an SSO program for single-family households would require changes to the current collection system. For the purposes of this analysis, the anticipated cost implications associated with one set of collection program options have been examined. This collection program assumes:
• The existing curbside recycling system remains unchanged. • Residents separate targeted household organics for separate collection (e.g.
food, yard waste during non-peak season and mixed paper - such as soiled tissue).
• Garbage and organics will be co-collected in a two-compartment side load vehicle. Once per week collection will be provided with a one-person crew.
• Current levels of diversion through existing BYC activity and grasscycling remain unchanged.
• Separate collection of yard waste during peak seasons (e.g. spring and fall) with centralized outdoor composting. The processing of peak season yard waste material at an AD plant has not been assumed in this analysis because spikes in seasonal generational can disrupt the organic loading rate of the digesters and therefore cause changes to the efficient routine of that operation. Also, woody yard wastes are not readily digestible
Based on current data and the program assumptions noted above, the marginal cost of an SSO program with three AD plants located is estimated to be $5.2 million per year. This scenario represents an approximate 10% increase in current cost estimates.
WDO Study: Implications of Different Waste Feed Streams (Source Separated Organics and Mixed Waste) On Collection Requirements and Anaerobic Digestion Processing Facility Design, Equipment and Cost
December, 2001 Allen Kani and Enviros RIS Page 36
If all SSO AD processing capacity were located in the Portlands area, the projected marginal cost is estimated to be approximately $5.7 million per year, representing an 11% increase in current collection and transfer cost estimates. 5.5 Other Costs The figures presented above do not include the cost of household containers, material processing, promotion or advertising. Preliminary estimates for these program features have been calculated and are presented below in order to provide the City with order of magnitude estimates. Further study will be required in order to develop a more definitive cost estimates. 5.5.1 Households Containers There is a wide range of container options that may be suitable for the collection and storage of organic waste in single-family households. These include 240 litre wheeled carts, 25 litre pails and plastic or kraft bags. The use of 240 litre carts appears to be most common in Canadian programs (e.g. Halifax, Caledon and East Prince, PEI). The cost of carts will vary depending on quantity and the method of delivery (e.g. contractor or municipal staff). For the purposes of this analysis, a purchase cost of $60 per cart has been assumed. There are approximately 450,000 single-family households in the city. At $60 per unit, the total capital cost is estimated to $29.7 million, including 10% spares. Amortized over 10 years (the length of one manufacture's warranty), the annualized capital cost of household carts is estimated to be approximately $3.9 million per year. 5.5.2 Promotion and Education The importance of promotion and education for the successful implementation of an SSO strategy cannot be overemphasized. Information recently collected by the AMRC on implementation of organics programs across Canada identified the following SSO project experience:
• Peel and Halifax paid at least three visits to each household to explain the program. This was followed up with consistent and intense promotion and education through a number of methods and media.
• Promotion and education material was distributed through utility bills, mail walks, etc. Public signs, web based information, hotlines, PSAs, radio and television and traditional print media were all used.
• Guelph recommended that at least six months be allowed for development of proper promotion and education material.
• An additional 3-5 months lead time prior to program launch is required to distribute information and make people aware that the program is changing
• After the program launch, on-going intensive promotion and education is also required. The AMRC has suggested the promotion and education timeline shown in Table 5-2.
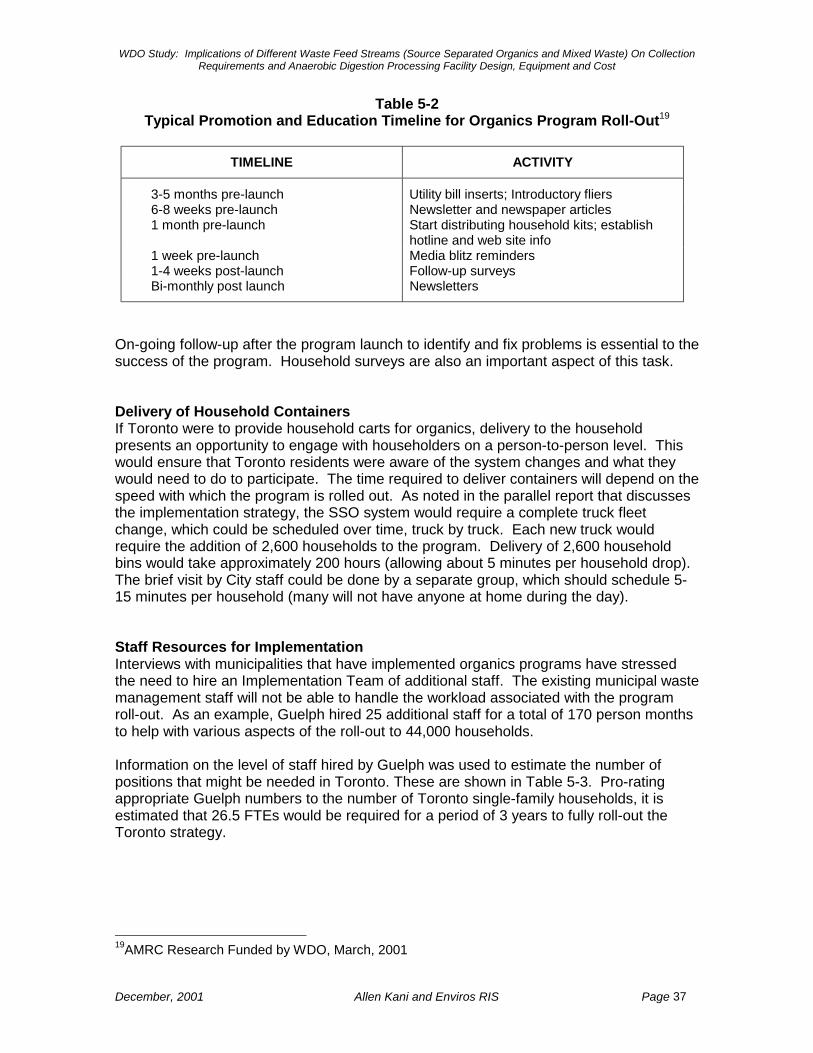
WDO Study: Implications of Different Waste Feed Streams (Source Separated Organics and Mixed Waste) On Collection Requirements and Anaerobic Digestion Processing Facility Design, Equipment and Cost
December, 2001 Allen Kani and Enviros RIS Page 37
Table 5-2 Typical Promotion and Education Timeline for Organics Program Roll-Out19
TIMELINE ACTIVITY
3-5 months pre-launch Utility bill inserts; Introductory fliers 6-8 weeks pre-launch Newsletter and newspaper articles 1 month pre-launch Start distributing household kits; establish
hotline and web site info 1 week pre-launch Media blitz reminders 1-4 weeks post-launch Follow-up surveys Bi-monthly post launch Newsletters
On-going follow-up after the program launch to identify and fix problems is essential to the success of the program. Household surveys are also an important aspect of this task. Delivery of Household Containers If Toronto were to provide household carts for organics, delivery to the household presents an opportunity to engage with householders on a person-to-person level. This would ensure that Toronto residents were aware of the system changes and what they would need to do to participate. The time required to deliver containers will depend on the speed with which the program is rolled out. As noted in the parallel report that discusses the implementation strategy, the SSO system would require a complete truck fleet change, which could be scheduled over time, truck by truck. Each new truck would require the addition of 2,600 households to the program. Delivery of 2,600 household bins would take approximately 200 hours (allowing about 5 minutes per household drop). The brief visit by City staff could be done by a separate group, which should schedule 5-15 minutes per household (many will not have anyone at home during the day). Staff Resources for Implementation Interviews with municipalities that have implemented organics programs have stressed the need to hire an Implementation Team of additional staff. The existing municipal waste management staff will not be able to handle the workload associated with the program roll-out. As an example, Guelph hired 25 additional staff for a total of 170 person months to help with various aspects of the roll-out to 44,000 households. Information on the level of staff hired by Guelph was used to estimate the number of positions that might be needed in Toronto. These are shown in Table 5-3. Pro-rating appropriate Guelph numbers to the number of Toronto single-family households, it is estimated that 26.5 FTEs would be required for a period of 3 years to fully roll-out the Toronto strategy.
19AMRC Research Funded by WDO, March, 2001
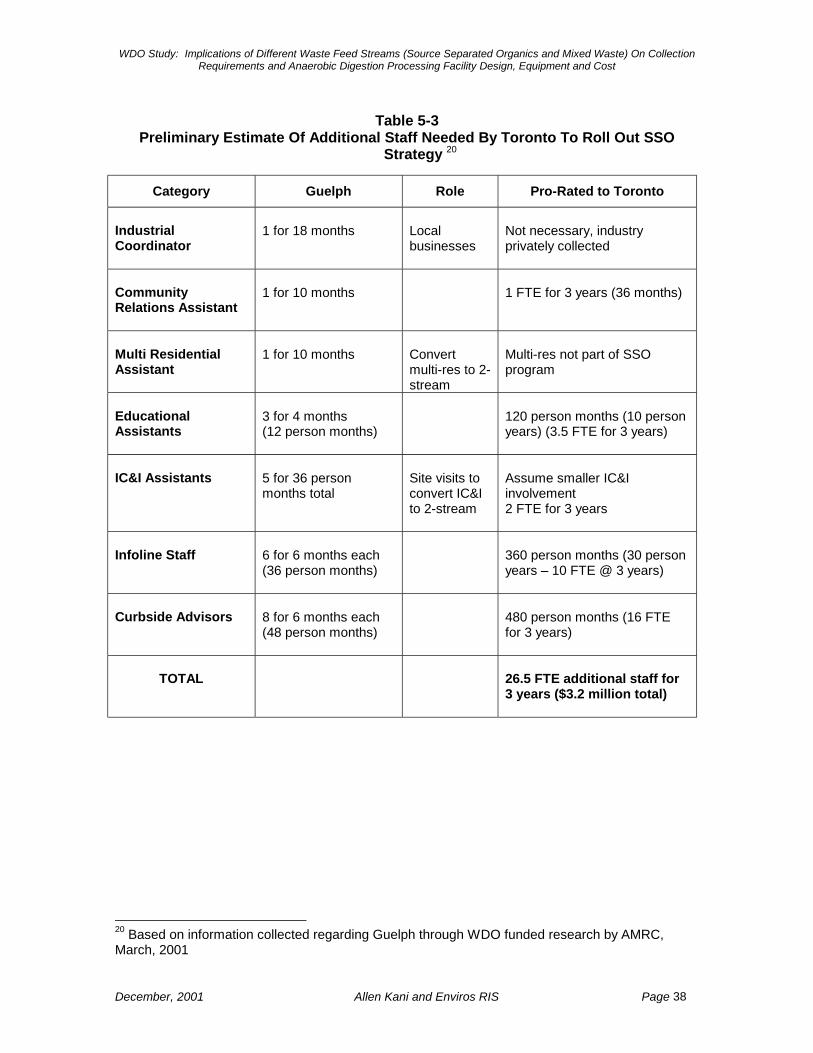
WDO Study: Implications of Different Waste Feed Streams (Source Separated Organics and Mixed Waste) On Collection Requirements and Anaerobic Digestion Processing Facility Design, Equipment and Cost
December, 2001 Allen Kani and Enviros RIS Page 38
Table 5-3
Preliminary Estimate Of Additional Staff Needed By Toronto To Roll Out SSO Strategy 20
Category Guelph Role Pro-Rated to Toronto
Industrial Coordinator
1 for 18 months
Local businesses
Not necessary, industry privately collected
Community Relations Assistant
1 for 10 months
1 FTE for 3 years (36 months)
Multi Residential Assistant
1 for 10 months
Convert multi-res to 2-stream
Multi-res not part of SSO program
Educational Assistants
3 for 4 months (12 person months)
120 person months (10 person years) (3.5 FTE for 3 years)
IC&I Assistants
5 for 36 person months total
Site visits to convert IC&I to 2-stream
Assume smaller IC&I involvement 2 FTE for 3 years
Infoline Staff
6 for 6 months each (36 person months)
360 person months (30 person years – 10 FTE @ 3 years)
Curbside Advisors
8 for 6 months each (48 person months)
480 person months (16 FTE for 3 years)
TOTAL
26.5 FTE additional staff for 3 years ($3.2 million total)
20 Based on information collected regarding Guelph through WDO funded research by AMRC, March, 2001
WDO Study: Implications of Different Waste Feed Streams (Source Separated Organics and Mixed Waste) On Collection Requirements and Anaerobic Digestion Processing Facility Design, Equipment and Cost
December, 2001 Allen Kani and Enviros RIS Page 39
6.0 NET COST AND DIVERSION IMPACTS OF EACH SCENARIO The selection of any approach to AD in Toronto will likely involve a trade-off between costs, waste diversion, gas production, and confidence that the system will actually work. These various issues are addressed in this section. 6.1 Markets, Diversion, and Gas Production Potential Overall determination of the cost of MSW diversion employing anaerobic digestion requires an evaluation of the potentially marketable diversion products.21 Table 6-1 quantifies typical quantities of gas production and compost along with estimated gross revenues that might be anticipated with a generic AD system for three different revenue packages. The first package assumes that all surplus methane gas is sold “as is” (i.e. does not require further cleaning) to an on-site purchaser for $0.45 per cubic metre. The second revenue package assumes the implementation of a combined cycle plant with emphasis on the production and sale of electrical power and a green power revenue of six cents per kWh while thermal power gross revenue is estimated to be $0.045 per cubic metre.22 The third package assumes a co-generation plant with relatively greater emphasis on the production of thermal power with the same revenue estimates outlined in the second package. Table 6-1 figures were developed using the following assumptions: 1. Gas production yields are based on supplier data of comparable outputs of existing
plants and take into account energy use by plant operations. SSO is assumed to be 60% food, 7% paper, 33% yard waste with a 10% rejection for the plant. Mixed residential waste with pre-diversion is assumed to consist of 25% paper, 30% food, 8% yard waste, 2% other with 10% recycled and 20% disposed.
2. The market value of the methane was estimated to be $0.28/m3, which is the
approximate retail value of natural gas at the time this report was written. A long-term energy supply, in light of recent gas price hikes, may indicate a higher evaluation. In addition, revenue estimates include avoided transmission costs which are estimated to be another $0.17 per cubic metre based on the assumption that the purchaser is located in close proximity to the point of generation.
3. As a fuel for cogeneration, there may be a revenue premium for green thermal power
sales and greenhouse gas credits. As shown in Table 6-1, revenue from the sale of green electricity has been estimated to be 6 cents per kWh. The value of thermal power has been estimated to be 4.5 cents per kWh, a price that excludes the capital cost of a co-generator. The value of finished digestate from an SSO plant assumes that pre-and post-treatment achieves Ontario Interim Guidelines for Unrestricted Use and a market value of $30/tonne as described in the Toronto Compost Markets Study. For mixed-waste options, the value is assumed to be $0/tonne. Actual revenue could be higher if AD facilities were able to produce compost that meets unrestricted use guidelines and meets the quality requirements of the premium market (e.g. landscapers and bagged compost sold through retail outlets).
21 No revenue was assumed from the sale of recyclable materials that may be separated from the incoming feed stream in mixed waste plants because of the uncertainty regarding the type of material and its quality. 22 This revenue estimate excludes annualized capital costs for thermal generation.
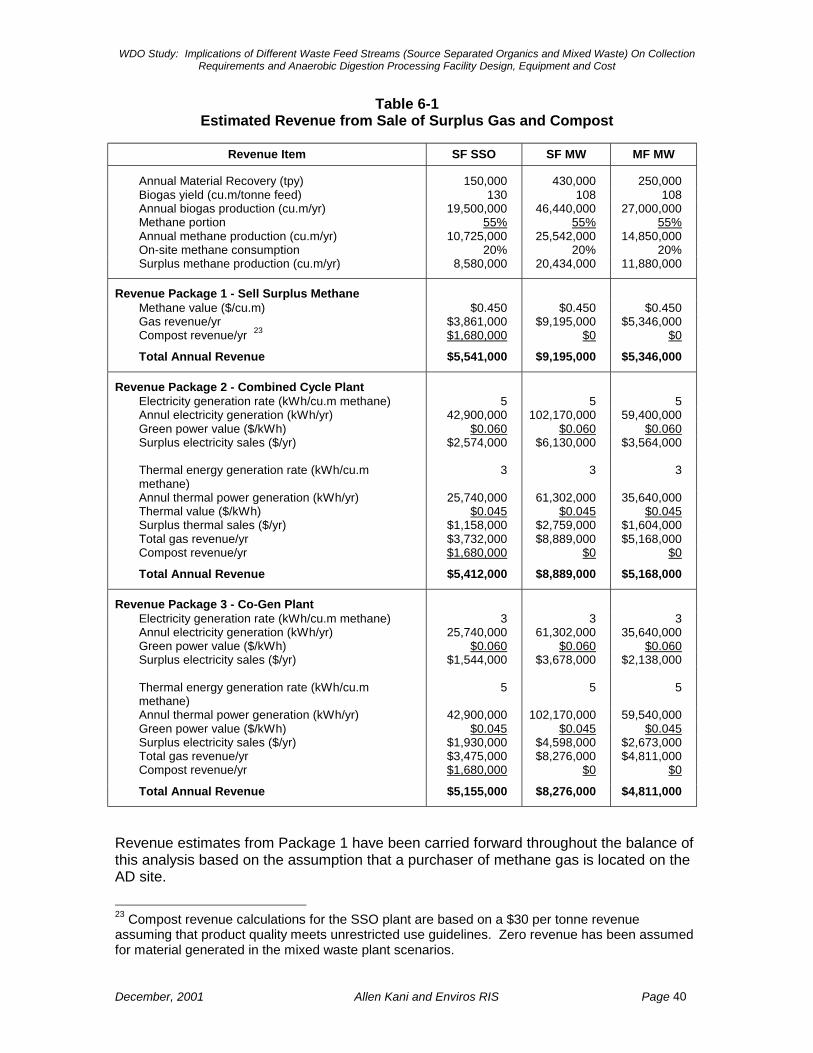
WDO Study: Implications of Different Waste Feed Streams (Source Separated Organics and Mixed Waste) On Collection Requirements and Anaerobic Digestion Processing Facility Design, Equipment and Cost
December, 2001 Allen Kani and Enviros RIS Page 40
Table 6-1 Estimated Revenue from Sale of Surplus Gas and Compost
Revenue Item SF SSO SF MW MF MW
Annual Material Recovery (tpy) 150,000 430,000 250,000 Biogas yield (cu.m/tonne feed) 130 108 108 Annual biogas production (cu.m/yr) 19,500,000 46,440,000 27,000,000 Methane portion 55% 55% 55% Annual methane production (cu.m/yr) 10,725,000 25,542,000 14,850,000 On-site methane consumption 20% 20% 20% Surplus methane production (cu.m/yr) 8,580,000 20,434,000 11,880,000
Revenue Package 1 - Sell Surplus Methane Methane value ($/cu.m) $0.450 $0.450 $0.450 Gas revenue/yr $3,861,000 $9,195,000 $5,346,000 Compost revenue/yr 23 $1,680,000 $0 $0
Total Annual Revenue $5,541,000 $9,195,000 $5,346,000
Revenue Package 2 - Combined Cycle Plant Electricity generation rate (kWh/cu.m methane) 5 5 5 Annul electricity generation (kWh/yr) 42,900,000 102,170,000 59,400,000 Green power value ($/kWh) $0.060 $0.060 $0.060 Surplus electricity sales ($/yr) $2,574,000 $6,130,000 $3,564,000 Thermal energy generation rate (kWh/cu.m methane)
3 3 3
Annul thermal power generation (kWh/yr) 25,740,000 61,302,000 35,640,000 Thermal value ($/kWh) $0.045 $0.045 $0.045 Surplus thermal sales ($/yr) $1,158,000 $2,759,000 $1,604,000 Total gas revenue/yr $3,732,000 $8,889,000 $5,168,000 Compost revenue/yr $1,680,000 $0 $0
Total Annual Revenue $5,412,000 $8,889,000 $5,168,000
Revenue Package 3 - Co-Gen Plant Electricity generation rate (kWh/cu.m methane) 3 3 3 Annul electricity generation (kWh/yr) 25,740,000 61,302,000 35,640,000 Green power value ($/kWh) $0.060 $0.060 $0.060 Surplus electricity sales ($/yr) $1,544,000 $3,678,000 $2,138,000 Thermal energy generation rate (kWh/cu.m methane)
5 5 5
Annul thermal power generation (kWh/yr) 42,900,000 102,170,000 59,540,000 Green power value ($/kWh) $0.045 $0.045 $0.045 Surplus electricity sales ($/yr) $1,930,000 $4,598,000 $2,673,000 Total gas revenue/yr $3,475,000 $8,276,000 $4,811,000 Compost revenue/yr $1,680,000 $0 $0
Total Annual Revenue $5,155,000 $8,276,000 $4,811,000
Revenue estimates from Package 1 have been carried forward throughout the balance of this analysis based on the assumption that a purchaser of methane gas is located on the AD site.
23 Compost revenue calculations for the SSO plant are based on a $30 per tonne revenue assuming that product quality meets unrestricted use guidelines. Zero revenue has been assumed for material generated in the mixed waste plant scenarios.
WDO Study: Implications of Different Waste Feed Streams (Source Separated Organics and Mixed Waste) On Collection Requirements and Anaerobic Digestion Processing Facility Design, Equipment and Cost
December, 2001 Allen Kani and Enviros RIS Page 41
6.2 Summary of Net Annual Cost Estimates Table 6-2 summarizes all cost and revenue estimates for each waste flow scenario developed in this report. The costs are difficult to compare, as the diversion achieved by each system is different. Also, a single plant is considered possible for some options (SSO and possibly MF mixed waste processing), but less practical for mixed waste processing of all single-family waste because of the large size of the plant involved (over 400,000 tonnes/year). The practicality of one facility versus multiple plants needs further assessment in future projects, but at this time some general conclusions can be drawn. Overall net annual costs for the 6 options considered vary from $10.1 million to $23.9 million per year. For SSO options, total costs vary from $10.1-$12.9 million per year, depending on whether one or multiple plants are used. In both scenarios, the increased collection costs remain roughly the same, therefore the variation is because of the capital cost of the plants. Because the tonnage handled by this option is relatively low, the capital costs of these facilities are comparatively low. As discussed throughout this text, bringing all SSO to one central plant is considered a viable option, therefore the cost of $10.1 million per year is a reasonable figure to use for comparative purposes. For MF mixed waste processing, total net annual costs vary from $12.0 million to $17.0 million per year. The considerable variation in annual costs is in part due to the higher capital costs of processing facilities that would be expected to handle large amounts of material. In the case of mixed waste processing of SF waste, annual costs vary from $18.4 to $23.9 million. These significant annual cost estimates are a reflection of the enormous processing capacity that would be required to handle 430,000 tonnes per year of mixed waste. Cost per tonne feed is not always considered a practical comparative parameter, as the number of tonnes to be processed is different in each option. Given that one of the overall objectives is to divert waste, the cost per tonne diverted should also be considered. Where multiple plants are used, costs per tonne diverted vary from $90-$110 for the three options. Where single plants are used (considered practical for SSO and MF mixed waste), the cost per tonne diverted is $78 per tonne for MF mixed waste and $84 per tonne for SSO. The conclusion of the analysis is that anaerobic digestion of SSO at one large central facility with a capacity of 150,000 tonnes per year appears to be cost competitive even when all of the additional costs associated with a new collection system are considered. This analysis is based on Table 6-2 figures indicating that a single plant processing SF SSO has the lowest net annual cost ($10.1 million) and the lowest capital investment (as per Table 4.5) of all the options considered. Although the projected diversion impact of the SSO system is comparatively low and the cost per tonne diverted is almost 10% higher than that for a single MF mixed waste facility, the relative weaknesses of the SF SSO system need to be viewed in relation to the risk associated with an unproven mixed waste processing technology. Mixed waste processing in general has had a poor track record in the US and in Europe over the last 20 years. Therefore, there is less certainty that this process will be successful in Toronto. It is therefore critical to evaluate the results from the Dufferin CCI plant and other AD facilities in the Toronto area that digest mixed waste prior to pursuing this route.
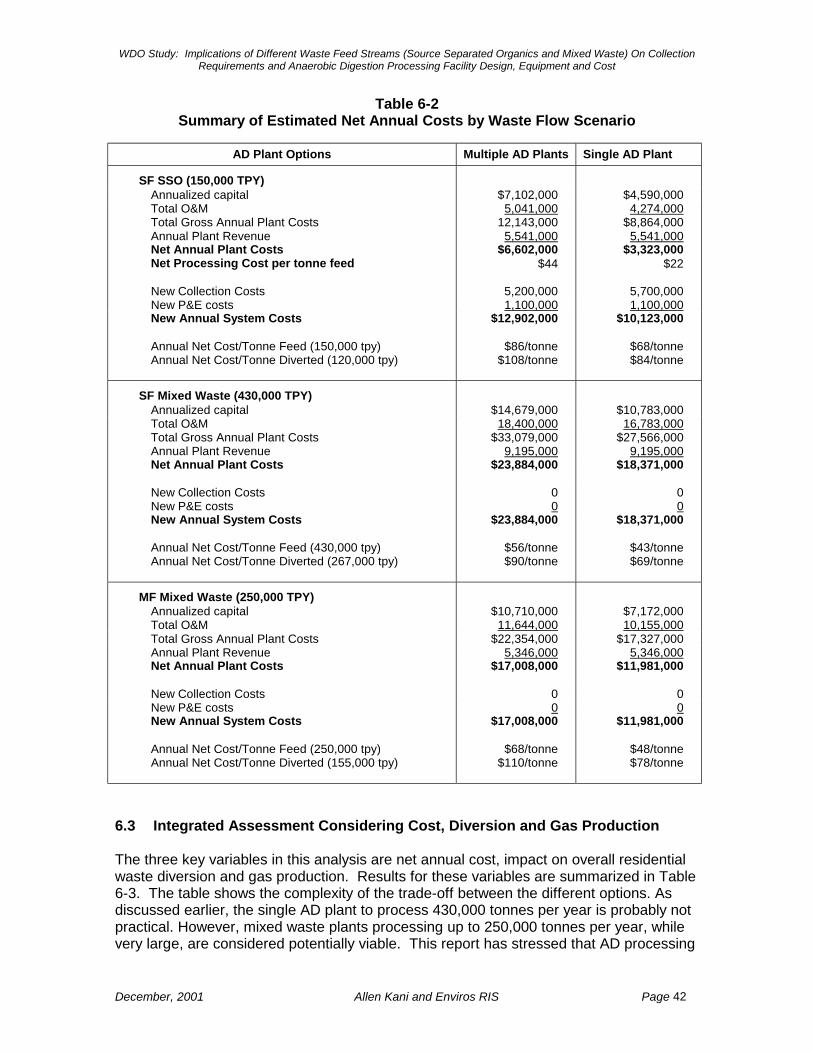
WDO Study: Implications of Different Waste Feed Streams (Source Separated Organics and Mixed Waste) On Collection Requirements and Anaerobic Digestion Processing Facility Design, Equipment and Cost
December, 2001 Allen Kani and Enviros RIS Page 42
Table 6-2 Summary of Estimated Net Annual Costs by Waste Flow Scenario
AD Plant Options Multiple AD Plants Single AD Plant
SF SSO (150,000 TPY) Annualized capital $7,102,000 $4,590,000 Total O&M 5,041,000 4,274,000 Total Gross Annual Plant Costs 12,143,000 $8,864,000 Annual Plant Revenue 5,541,000 5,541,000 Net Annual Plant Costs Net Processing Cost per tonne feed
$6,602,000 $44
$3,323,000 $22
New Collection Costs 5,200,000 5,700,000 New P&E costs 1,100,000 1,100,000 New Annual System Costs Annual Net Cost/Tonne Feed (150,000 tpy) Annual Net Cost/Tonne Diverted (120,000 tpy)
$12,902,000
$86/tonne $108/tonne
$10,123,000
$68/tonne $84/tonne
SF Mixed Waste (430,000 TPY) Annualized capital $14,679,000 $10,783,000 Total O&M 18,400,000 16,783,000 Total Gross Annual Plant Costs $33,079,000 $27,566,000 Annual Plant Revenue 9,195,000 9,195,000 Net Annual Plant Costs
$23,884,000 $18,371,000
New Collection Costs 0 0 New P&E costs 0 0 New Annual System Costs Annual Net Cost/Tonne Feed (430,000 tpy) Annual Net Cost/Tonne Diverted (267,000 tpy)
$23,884,000
$56/tonne $90/tonne
$18,371,000
$43/tonne $69/tonne
MF Mixed Waste (250,000 TPY) Annualized capital $10,710,000 $7,172,000 Total O&M 11,644,000 10,155,000 Total Gross Annual Plant Costs $22,354,000 $17,327,000 Annual Plant Revenue 5,346,000 5,346,000 Net Annual Plant Costs
$17,008,000 $11,981,000
New Collection Costs 0 0 New P&E costs 0 0 New Annual System Costs Annual Net Cost/Tonne Feed (250,000 tpy) Annual Net Cost/Tonne Diverted (155,000 tpy)
$17,008,000
$68/tonne $110/tonne
$11,981,000
$48/tonne $78/tonne
6.3 Integrated Assessment Considering Cost, Diversion and Gas Production The three key variables in this analysis are net annual cost, impact on overall residential waste diversion and gas production. Results for these variables are summarized in Table 6-3. The table shows the complexity of the trade-off between the different options. As discussed earlier, the single AD plant to process 430,000 tonnes per year is probably not practical. However, mixed waste plants processing up to 250,000 tonnes per year, while very large, are considered potentially viable. This report has stressed that AD processing
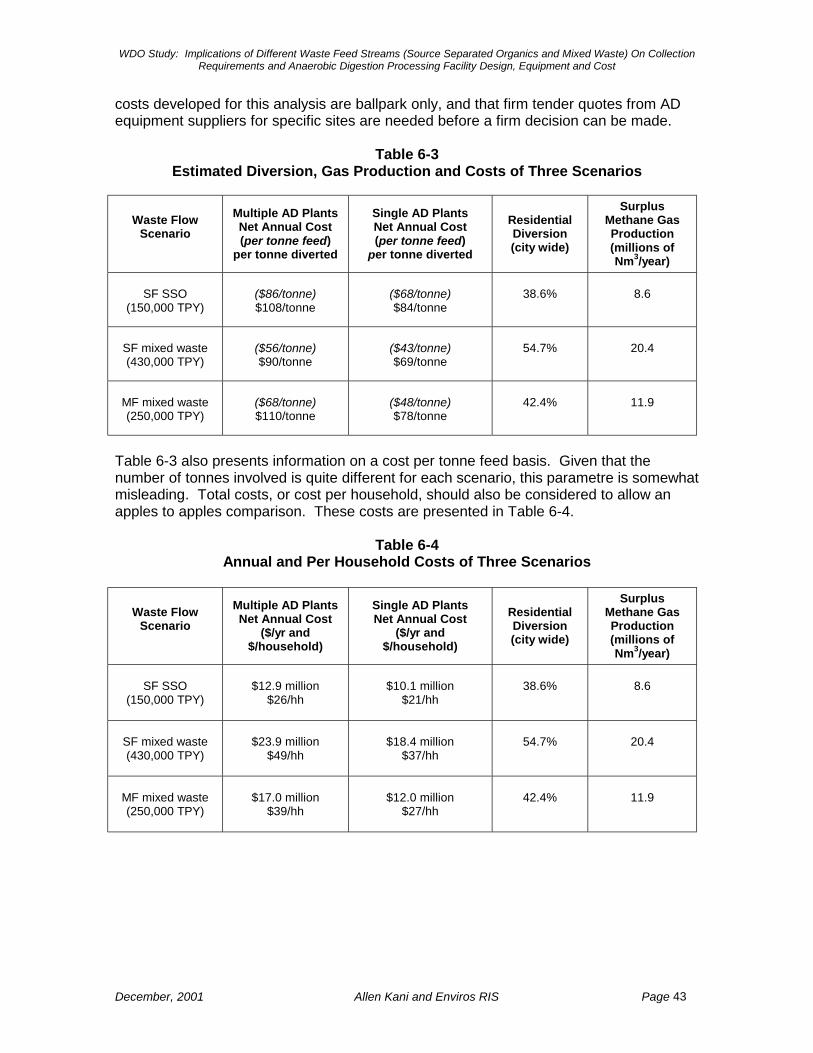
WDO Study: Implications of Different Waste Feed Streams (Source Separated Organics and Mixed Waste) On Collection Requirements and Anaerobic Digestion Processing Facility Design, Equipment and Cost
December, 2001 Allen Kani and Enviros RIS Page 43
costs developed for this analysis are ballpark only, and that firm tender quotes from AD equipment suppliers for specific sites are needed before a firm decision can be made.
Table 6-3 Estimated Diversion, Gas Production and Costs of Three Scenarios
Waste Flow Scenario
Multiple AD Plants Net Annual Cost (per tonne feed)
per tonne diverted
Single AD Plants Net Annual Cost (per tonne feed)
per tonne diverted
Residential Diversion (city wide)
Surplus Methane Gas Production (millions of Nm3/year)
SF SSO
(150,000 TPY)
($86/tonne) $108/tonne
($68/tonne) $84/tonne
38.6%
8.6
SF mixed waste (430,000 TPY)
($56/tonne) $90/tonne
($43/tonne) $69/tonne
54.7%
20.4
MF mixed waste (250,000 TPY)
($68/tonne) $110/tonne
($48/tonne) $78/tonne
42.4%
11.9
Table 6-3 also presents information on a cost per tonne feed basis. Given that the number of tonnes involved is quite different for each scenario, this parametre is somewhat misleading. Total costs, or cost per household, should also be considered to allow an apples to apples comparison. These costs are presented in Table 6-4.
Table 6-4 Annual and Per Household Costs of Three Scenarios
Waste Flow Scenario
Multiple AD Plants Net Annual Cost
($/yr and $/household)
Single AD Plants Net Annual Cost
($/yr and $/household)
Residential Diversion (city wide)
Surplus Methane Gas Production (millions of Nm3/year)
SF SSO
(150,000 TPY)
$12.9 million
$26/hh
$10.1 million
$21/hh
38.6%
8.6
SF mixed waste (430,000 TPY)
$23.9 million
$49/hh
$18.4 million
$37/hh
54.7%
20.4
MF mixed waste (250,000 TPY)
$17.0 million
$39/hh
$12.0 million
$27/hh
42.4%
11.9
WDO Study: Implications of Different Waste Feed Streams (Source Separated Organics and Mixed Waste) On Collection Requirements and Anaerobic Digestion Processing Facility Design, Equipment and Cost
December, 2001 Allen Kani and Enviros RIS Page 44
7.0 CONCLUSIONS AND RECOMMENDATIONS
The overall objective of this report is to quantify and compare the cost implications of digesting source separated organics from single-family households and a mixed waste stream from either single or multi-family dwellings. A second objective is to assess whether the incremental processing costs saved at an SSO AD facility could justifiy the increased collection costs. The analysis includes an assessment of implementing all AD capacity in a single facility or at multiple plants. The conclusion of the analysis is that anaerobic digestion of SSO at one large central facility with a capacity of 150,000 tonnes per year appears to be cost competitive. It offers the lowest annual cost measured in absolute dollars. The cost per diverted tonne is approximately 10% higher than that for a single mixed waste plant designed to process material from MF residents, though the marginally higher cost should be balanced against the potentially higher risk associated with mixed waste processing. The SF SSO option is expected to increase diversion of residential waste to 38.6%. It was also concluded that processing of up to 250,000 tonnes/year of mixed waste at one central facility is probably viable. This option would increase diversion of residential waste to 42.4%, but performance of the system involves some uncertainty, and additional research is required to confirm that this system is reliable. If a mixed waste strategy is pursued for either single family or multi-family waste, it can be fully implemented by late-2004 to mid-2005, depending on the number of plants involved. This technology has had a poor track record in Europe and the US, therefore it is recommended that results of the CCI Dufferin Demonstration project be evaluated carefully before this route is pursued. These will be available in early 2003. It is also recommended that City of Toronto work with other mixed waste processing plants in North America, particularly Conporec in Tracy, SUBBOR in Guelph and CCI in Newmarket to collect as much operational data as possible on these plants, in order to have sufficient proof of successful performance before embarking on this riskier strategy.


![Annual Report 2018 MT - europarl.europa.eu · .817(67 ,o nrgl l wd 0 ¥led j «doo 0hpeul wdo 3duodphqw (zurshz ilu uljzdug wdo ,qwhuhvvl )lqdq]mduml x wdo .rqiolwwl wd ,qwhuhvvl](https://img.pdfslide.net/doc/110x75/5e45a82172a83e0b0251caf6/annual-report-2018-mt-81767-o-nrgl-l-wd-0-led-j-doo-0hpeul-wdo-3duodphqw.jpg)