Embed Size (px)
Citation preview
Turning Grant Data Into Meaningful Outcomes
We are a 501(c)3 health collaborative serving Union, Wallowa and Baker Counties, a frontier region in
Northeast Oregon.
Our mission is to increase access to and quality of integrated health care for all Northeast Oregon
residents by identifying system gaps, facilitating community developed solutions, and advocating for
heath policy change.
Northeast Oregon Network
We act as a resource for developing health and wellness
capacity by providing
assessment, facilitation, coordination and implementation
services to local and state wide partners.
What do we do?
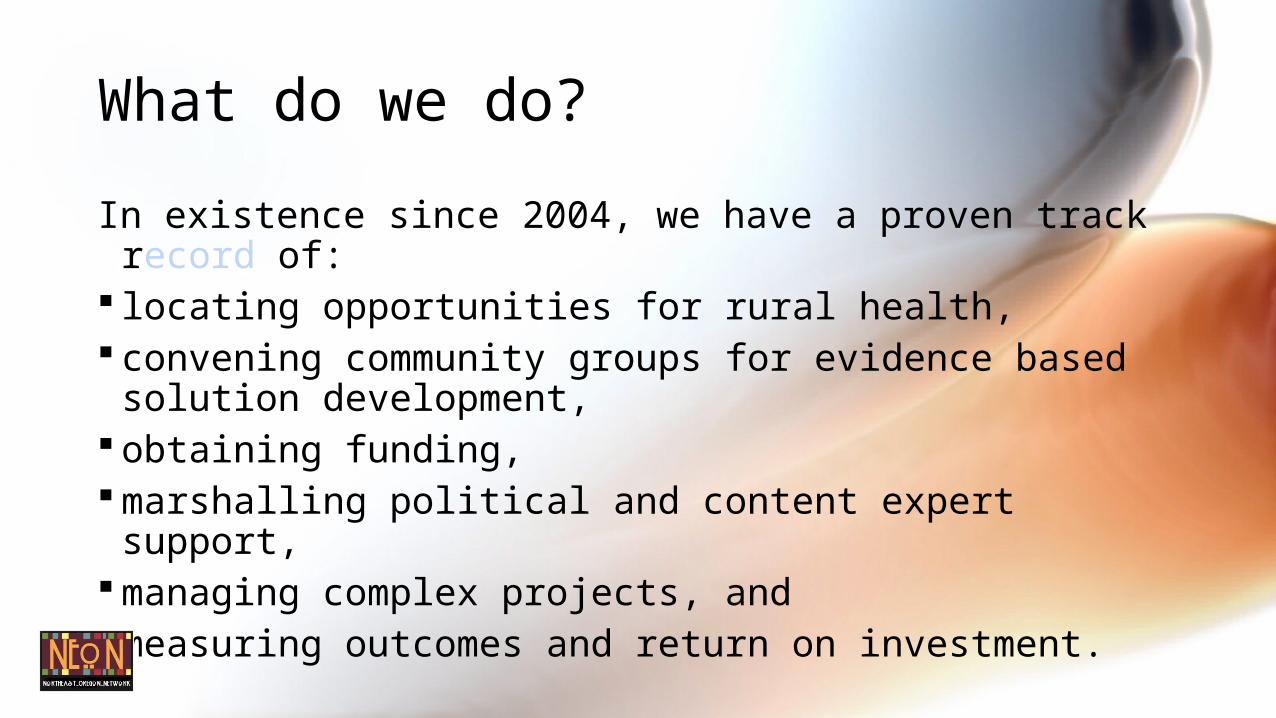
In existence since 2004, we have a proven track record of:
locating opportunities for rural health, convening community groups for evidence based
solution development, obtaining funding, marshalling political and content expert support, managing complex projects, and measuring outcomes and return on investment.
What do we do?
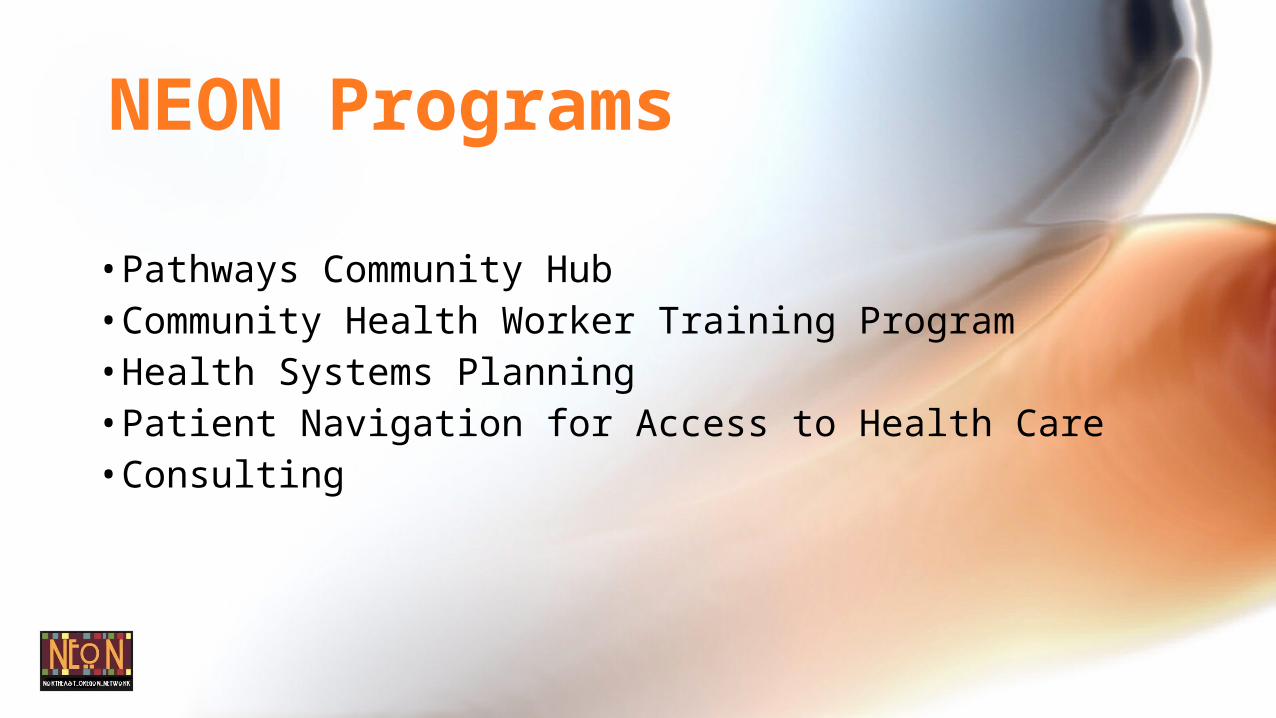
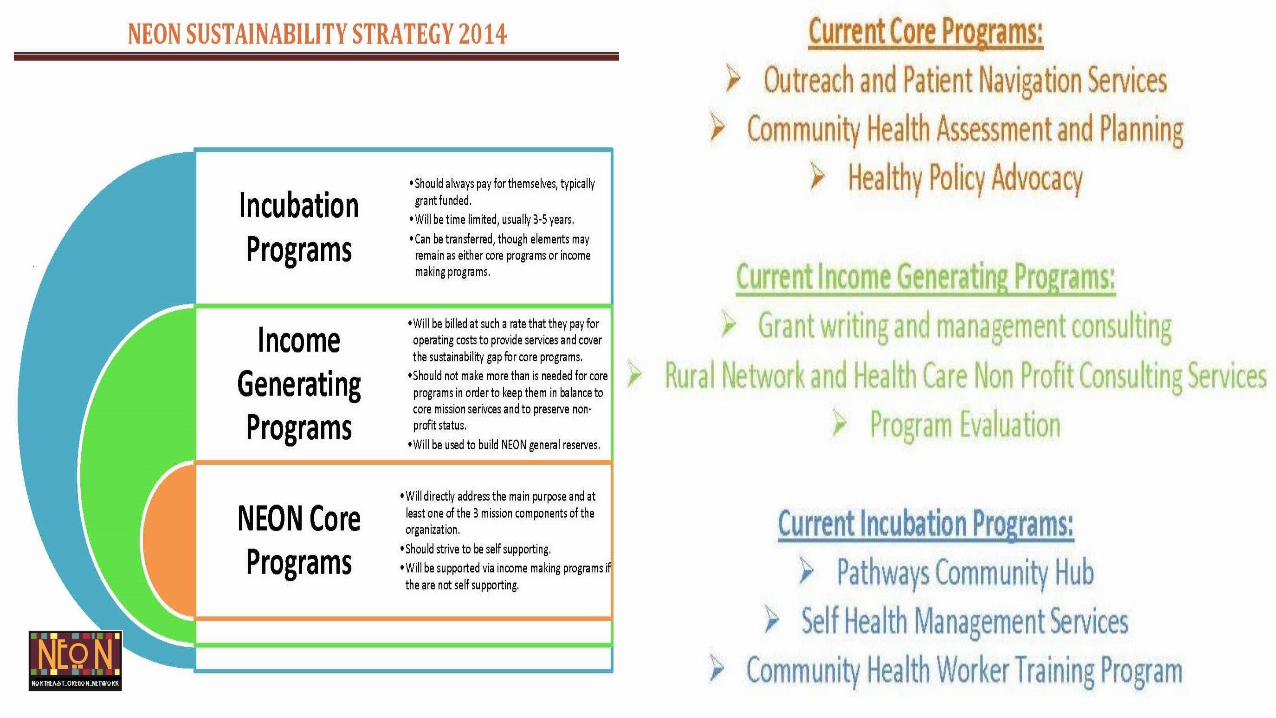
• Pathways Community Hub• Community Health Worker Training Program• Health Systems Planning• Patient Navigation for Access to Health Care• Consulting
NEON Programs
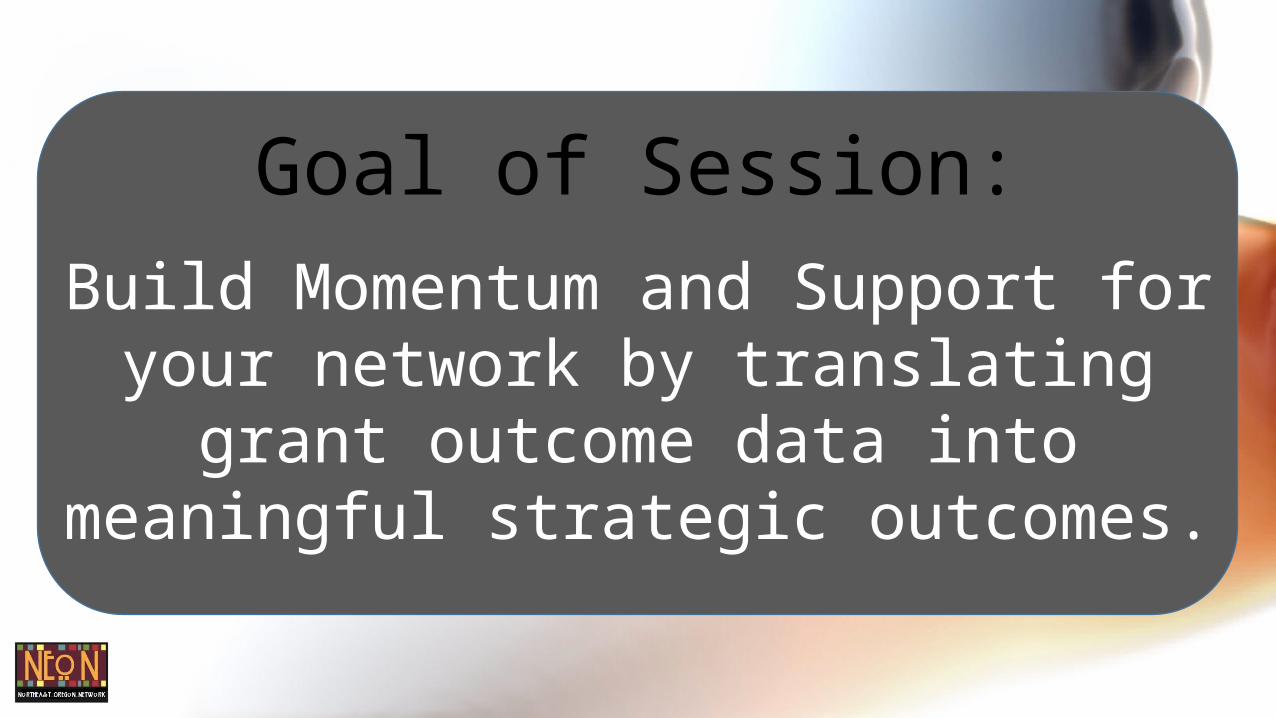
Goal of Session:Build Momentum and Support for your network by translating grant
outcome data into meaningful strategic outcomes.
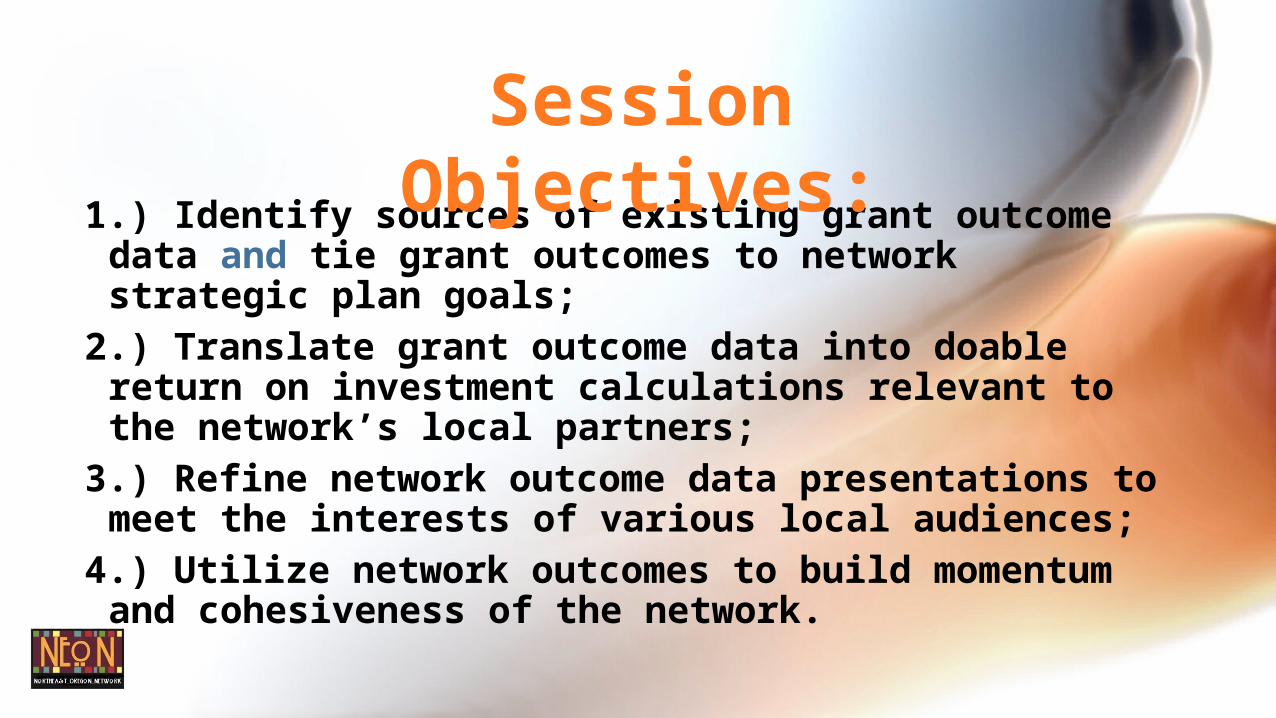
1.) Identify sources of existing grant outcome data and tie grant outcomes to network strategic plan goals;
2.) Translate grant outcome data into doable return on investment calculations relevant to the network’s local partners;
3.) Refine network outcome data presentations to meet the interests of various local audiences;
4.) Utilize network outcomes to build momentum and cohesiveness of the network.
Session Objectives:
•Where are you from?
•What do you Measure?
• How do you use it?
Dinamica
Step 1:
A Good Plan……..
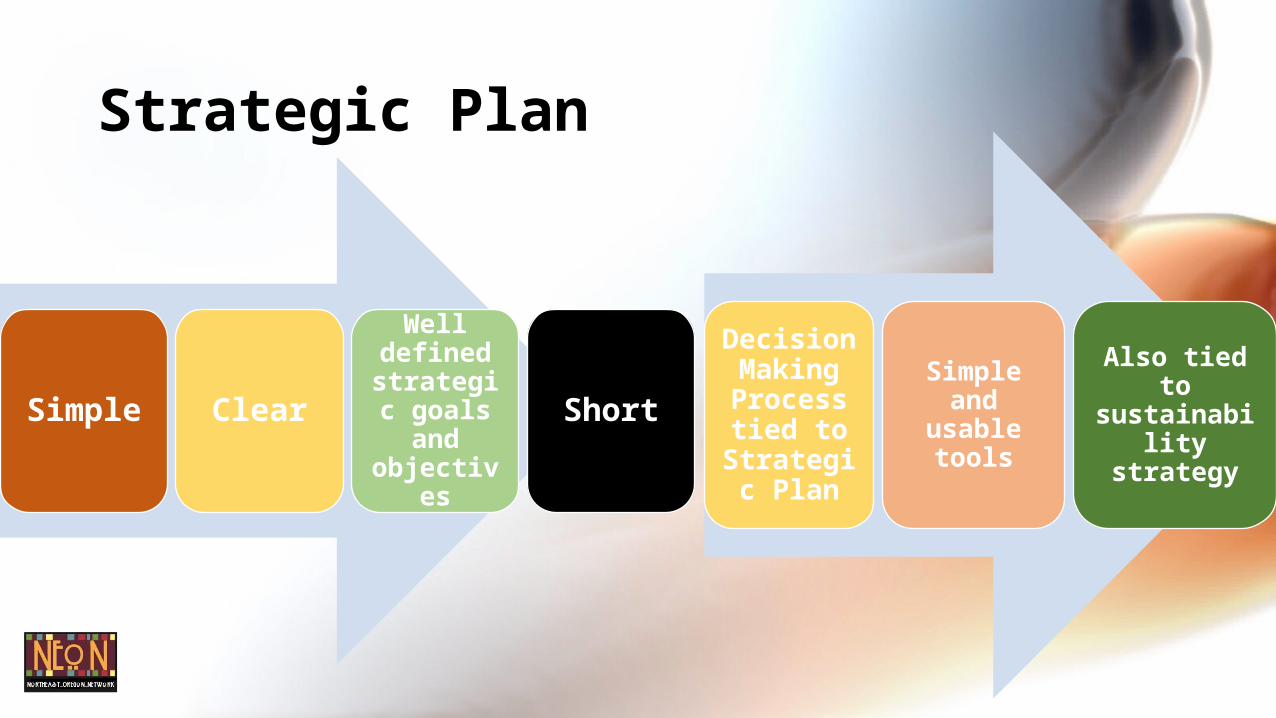
Strategic Plan
Simple Clear
Well defined
strategic goals and objective
s
Short
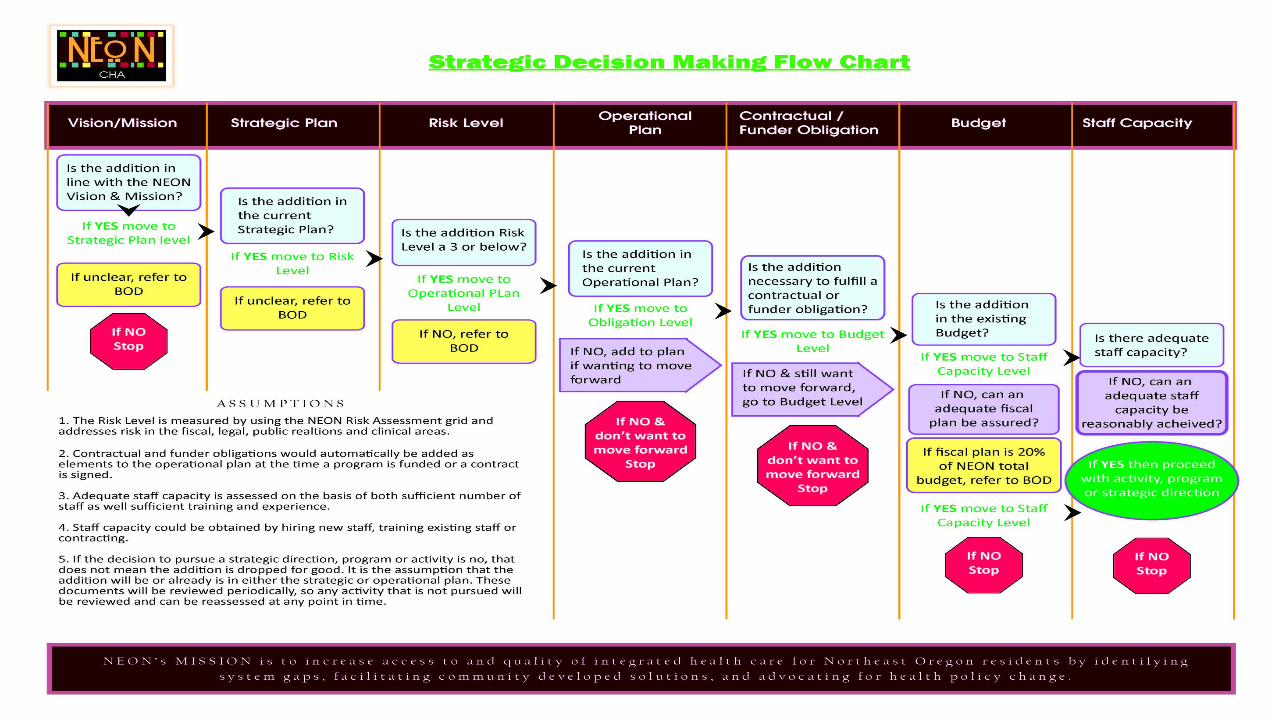
Decision Making Process tied to
Strategic Plan
Simple and usable
tools
Also tied to sustainability strategy

Step 2:Pick the audience, Pick the message……….
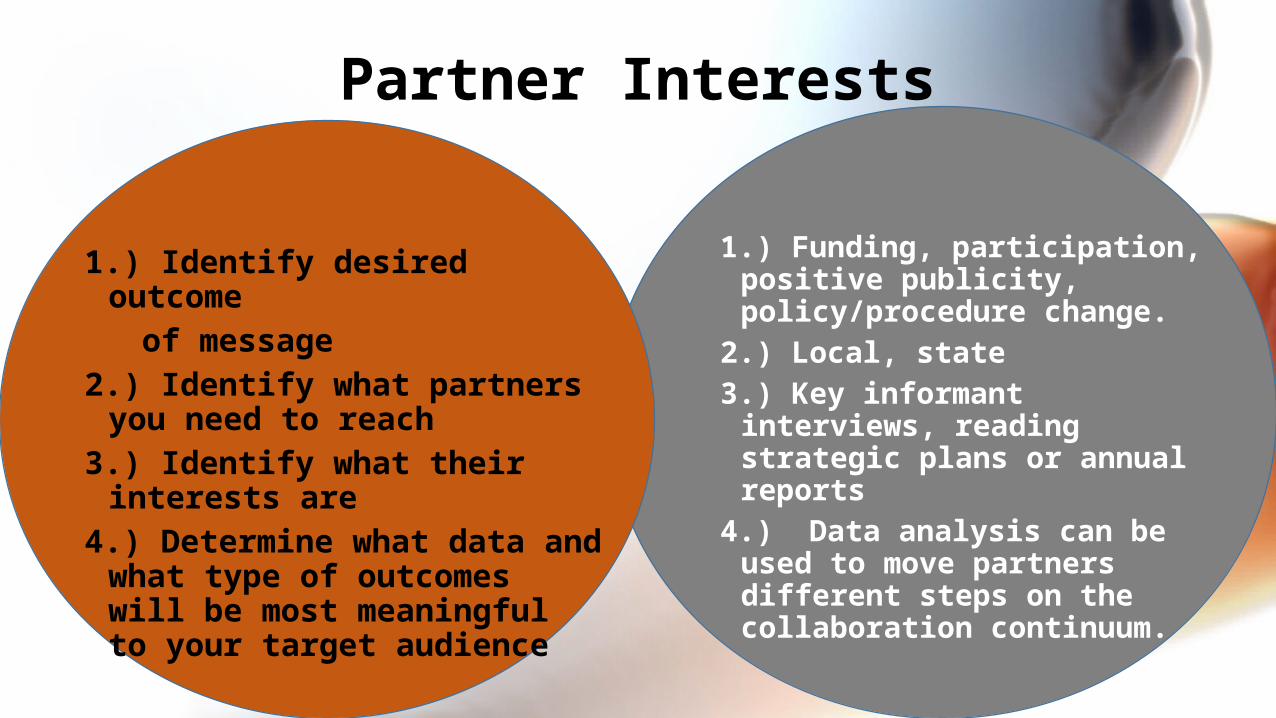
1.) Funding, participation, positive publicity, policy/procedure change.
2.) Local, state3.) Key informant interviews, reading strategic plans or annual reports
4.) Data analysis can be used to move partners different steps on the collaboration continuum.
1.) Identify desired outcome of message2.) Identify what partners
you need to reach3.) Identify what their
interests are4.) Determine what data and
what type of outcomes will be most meaningful to your target audience
Partner Interests
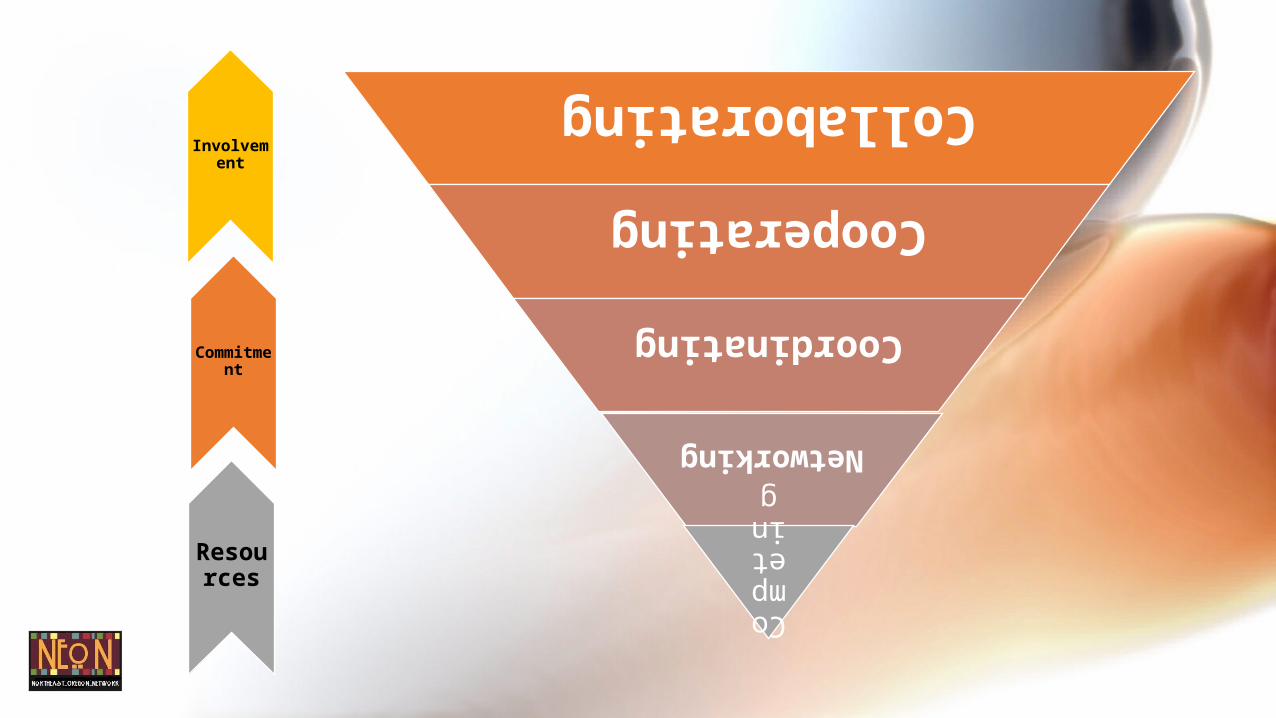
Collaborating
Cooperating
Coordinating
Networking
Competing
Commitment
Resources
Involvement
Step 3:Choose Your Measure……….
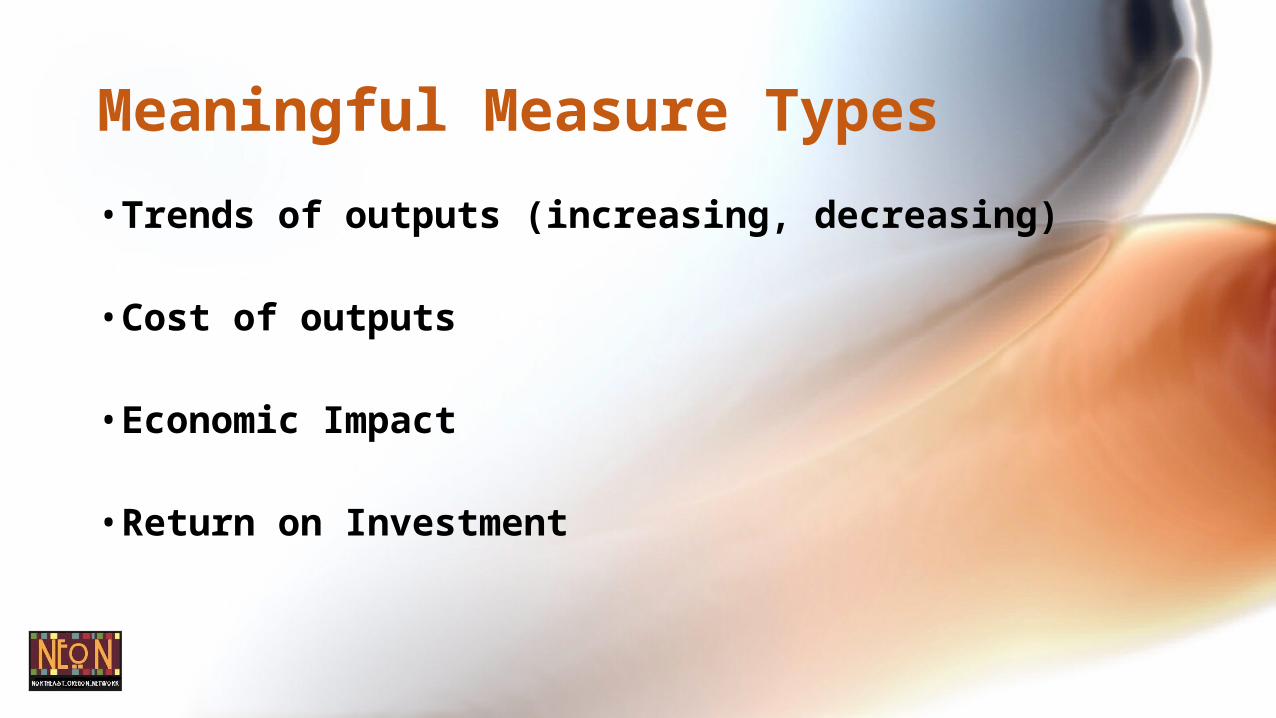
• Trends of outputs (increasing, decreasing)
• Cost of outputs
• Economic Impact
• Return on Investment
Meaningful Measure Types
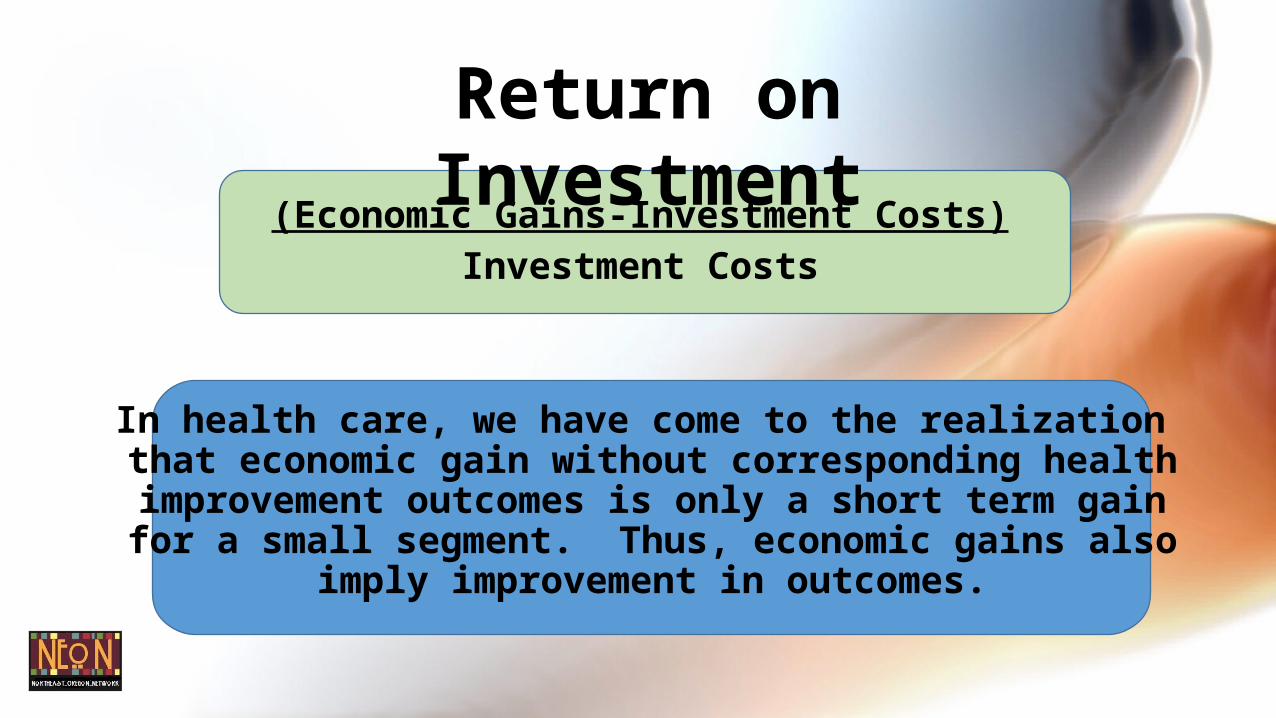
(Economic Gains-Investment Costs)Investment Costs
In health care, we have come to the realization that economic gain without corresponding health improvement outcomes is only a short term gain for a small segment. Thus, economic gains also
imply improvement in outcomes.
Return on Investment
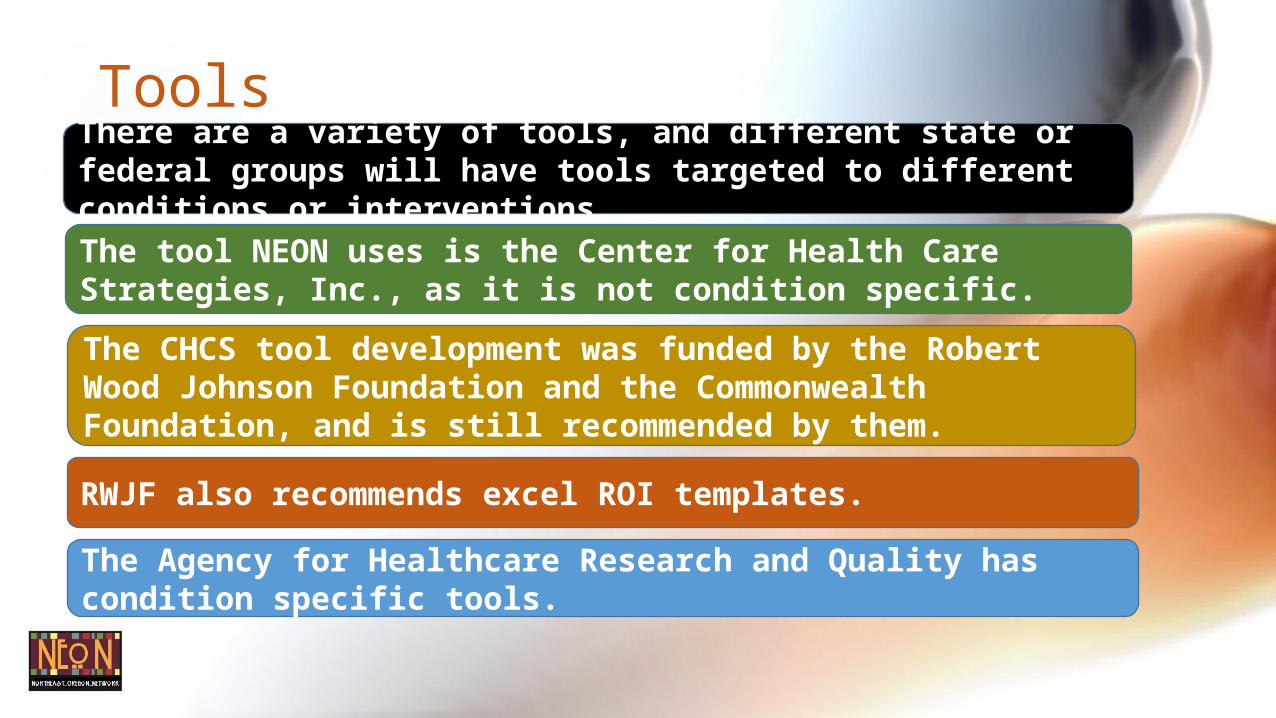
ToolsThere are a variety of tools, and different state or federal groups will have tools targeted to different conditions or interventions.The tool NEON uses is the Center for Health Care Strategies, Inc., as it is not condition specific.
The CHCS tool development was funded by the Robert Wood Johnson Foundation and the Commonwealth Foundation, and is still recommended by them.
RWJF also recommends excel ROI templates.
The Agency for Healthcare Research and Quality has condition specific tools.
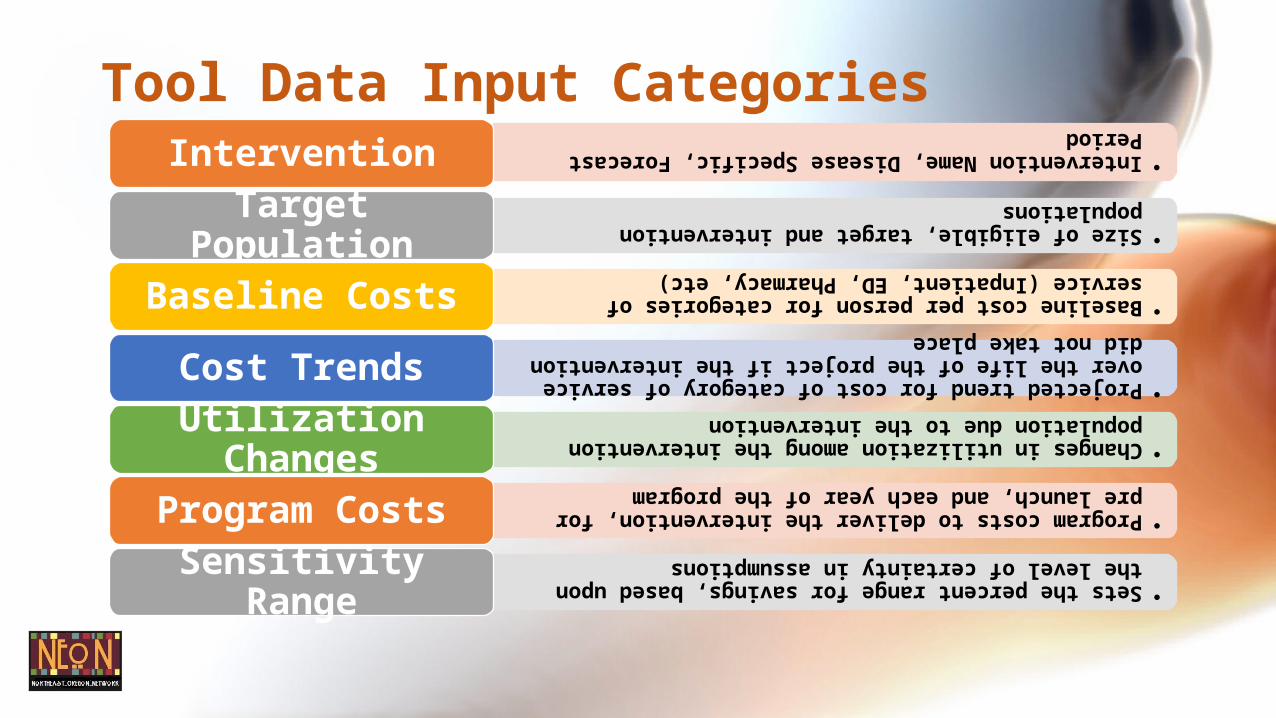
Tool Data Input Categories
•Intervention Name, Disease Specific, Forecast Period
Intervention
•Size of eligible, target and intervention populations
Target Population
•Baseline cost per person for categories of service (Inpatient, ED, Pharmacy, etc)
Baseline Costs
•Projected trend for cost of category of service over the life of the project if the intervention did not take place
Cost Trends
•Changes in utilization among the intervention population due to the intervention
Utilization Changes
•Program costs to deliver the intervention, for pre launch, and each year of the program
Program Costs
•Sets the percent range for savings, based upon the level of certainty in assumptions
Sensitivity Range
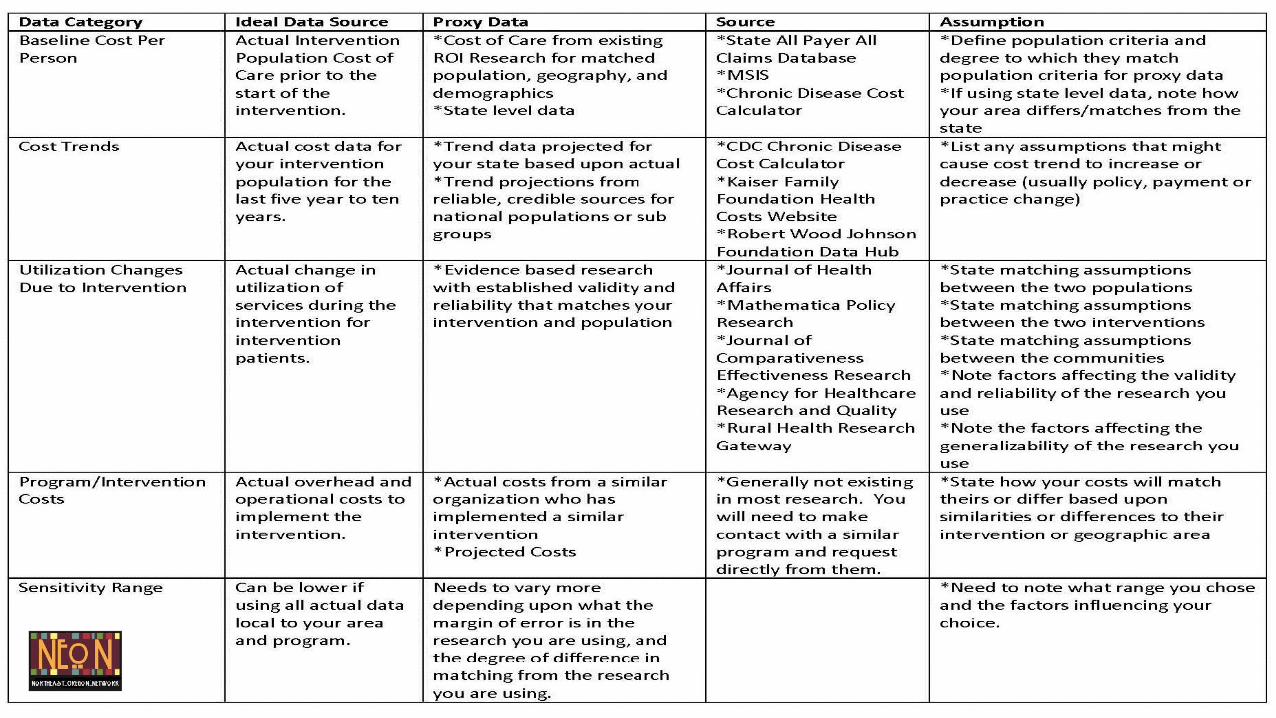

Be very careful to state your assumptions clearly and openly.
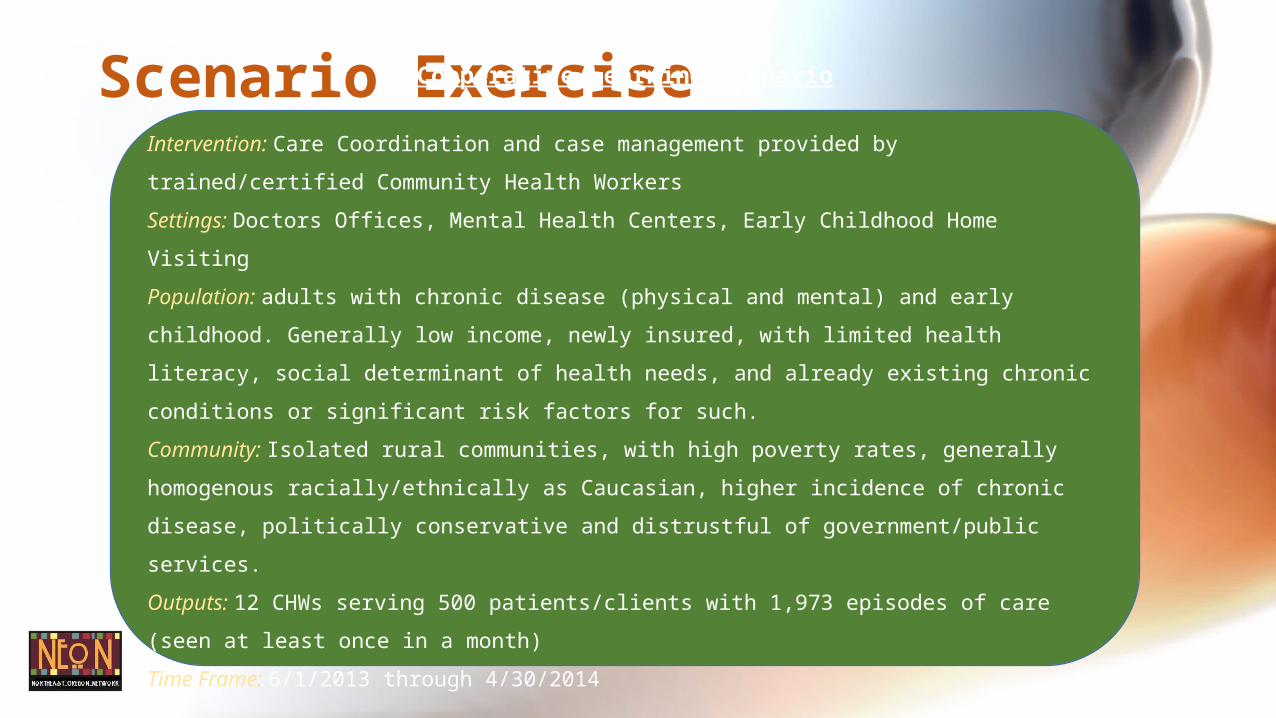
Scenario ExerciseCooperative Learning Scenario
Intervention: Care Coordination and case management provided by trained/certified
Community Health Workers
Settings: Doctors Offices, Mental Health Centers, Early Childhood Home Visiting
Population: adults with chronic disease (physical and mental) and early childhood.
Generally low income, newly insured, with limited health literacy, social determinant of
health needs, and already existing chronic conditions or significant risk factors for such.
Community: Isolated rural communities, with high poverty rates, generally homogenous
racially/ethnically as Caucasian, higher incidence of chronic disease, politically
conservative and distrustful of government/public services.
Outputs: 12 CHWs serving 500 patients/clients with 1,973 episodes of care (seen at least
once in a month)
Time Frame: 6/1/2013 through 4/30/2014
Anticipated ChallengesWhat You Want to Use
Scenario Exercise Review

Resources Available Upon Request
• Sample Evaluation Plans
• Sample Economic Impact Reports
• Brochures about NEON and our consulting services
• Lisa [email protected]
www.neonoregon.org
Contact Us
More Information