Embed Size (px)
Citation preview


We delivered record performance in fiscal 2021, with significant market share gains and strong profitability, driving superior shareholder value.
Twelve months ended August 31, 2021
$50.5BAn increase of 11% in local currency and 14% in U.S. dollars from fiscal 2020
Revenues
$ 9.16A 16% increase from fiscal 2020. Excluding gains on an investment of $0.36 in fiscal 2021 and $0.43 in fiscal 2020, adjusted EPS of $8.80 increased 18% from fiscal 2020
Diluted earnings per share
$59.3BRecord bookings, an increase of 17% in local currency and 20% in U.S. dollars
New bookings
Free cash flow
$ 8.4BDefined as operating cash flow of $9.0 billion net of property and equipment additions of $580 million
15.1% Operating margin
An expansion of 40 basis points from fiscal 2020
Cash returned to shareholders
$ 5.9BDefined as cash dividends of $2.24 billion plus share repurchases of $3.70 billion

Creating Value in Fiscal 2021In fiscal 2021, we delivered both outstanding financial results and 360° value beyond our financials in the most unprecedented and uncertain period our market has ever experienced.
Our results reflect the dedication and hard work of our now more than 600,000 talented people, who are focused on creating value that matters for all our stakeholders—clients, each other, shareholders, partners and communities—despite the ongoing and sometimes extreme challenges of the COVID-19 pandemic.
1

We had a truly extraordinary year—as reflected in our outstanding financial results and in the 360° value we delivered beyond our financials for our clients, people, shareholders, partners and communities.
Julie Sweet
2

In addition to record revenues, new bookings and profitability, we celebrated more than 120,000 promotions and delivered over 31 million training hours for our team. We added approximately 118,000 people to our global workforce, creating significant employment opportunities in our communities, and donated $54 million in COVID-19 surge relief. We are now 46% women, on track to achieve our goal of gender parity by 2025, and we are honored to hold the number one position with our largest ecosystem partners. We are now using 50% renewable electricity in our offices and centers around the world, on our way to our goal of 100% in 2023.
We measure our success on how well we create 360° value for all stakeholders. We believe this commitment, along with our innovative mindset and culture of shared success, is directly linked to the trust of our clients and partners and our ability to attract great people. Together, we are helping our clients, which are among the world’s leading companies and governments, navigate a changing world and transform their organizations to thrive.
I am confident in our ability to continue to meet the urgency of the challenges and opportunities ahead for our clients and deliver on the promise of technology and human ingenuity for all. We are excited for the new fiscal year and new opportunities to lead and create value for our clients, each other and the world.
$1.1B in R&D
$4.2B in acquisitions
$900M in learning and development
Investing in our business and our people
3

Creating 360° Value
In fiscal 2021, we reached revenues of $50.5 billion—a significant milestone that represents 11% growth in local currency and the addition of $6.2 billion in revenue for the year. We gained significant market share, expanding our operating margin 40 basis points while investing significantly in our business and our people, and returned $5.9 billion to shareholders.
Importantly, we delivered on our financial commitments by creating value that matters for all of our stakeholders—beginning with the needs of our clients, which include more than three-quarters of the FORTUNE Global 500. Of our top 100 clients, 98 have been with us for more than 10 years. Seventy-two of our clients had bookings greater than $100 million. We ended fiscal 2021 with 229 Diamond clients, our largest client relationships. We are helping many of them achieve simultaneous and accelerated change, which we call compressed transformation.
In line with our long-standing partnership with the UN Global Compact and advancement of the UN Sustainable Development Goals, we will expand the reporting we have been doing for more than a decade based on the Global Reporting Initiative and Carbon Disclosure Project. We will include disclosure against three additional environmental, social and governance (ESG) frameworks: Sustainability Accounting Standards Board (SASB), Task Force on Climate-Related Financial Disclosure (TCFD) and the World Economic Forum International Business Council (WEF IBC) metrics. In December, we will present our first-ever integrated 360° Value Report to more fully describe the value we created in all directions.
120,000+promotions
31M+ training hours
(+43%)
4

Technology is the single biggest driver of change in companies today, and as a technology powerhouse, we are well prepared to help our clients navigate their futures. Clients are turning to us as the trusted partner of choice to help them transform and achieve their own goals.
For example, Shiseido, a leading global beauty company headquartered in Japan, launched a fundamental business transformation aiming to become a global leader in premium skin beauty by 2030, under their strategy “WIN 2023 and Beyond.” We are partnering with them to accelerate digital transformation and create personalized and seamless customer experiences by bringing together our capabilities and expertise in Interactive, cloud, artificial intelligence (AI), analytics and automation, while at the same time helping employees gain high- level digital skills.
Clients value the depth and breadth of the knowledge and experience our integrated global teams bring to their entire enterprise—across Strategy and Consulting, Interactive, Technology and Operations—and industry and functional expertise.
Delivering on the Promise of Technology and Human Ingenuity
The power of this unique combination is in full view, for example, at Halliburton, a leader in providing products and services to the energy industry. We are helping them move to the cloud and digitally transform their supply chain and manufacturing functions, leveraging our SynOps platform, which we already use as part of Halliburton’s digital transformation of their finance and accounting function.
Our clients also value our continuous innovation mindset and count on us to anticipate and invest ahead of their needs so they can continue to lead in their industries.
As an example, we have been investing in cloud for a decade. When we saw a year ago that the pandemic would accelerate our clients’ move to the cloud, we created Accenture Cloud First to connect all of our capabilities—from migration, to cloud-native development, data, AI, industry, talent and change. In fiscal 2021, this move helped drive the growth in our overall cloud revenue from $12 billion to $18 billion.
Our clients include more than three-quarters of the FORTUNE Global 500, and of our top 100 clients, 98 have been with us for 10+ years
5

Our cloud capabilities have become critical to our clients’ success. Our strategic collaboration with Takeda, a global biopharmaceutical leader, will modernize their technology platforms while creating tangible business value. This entails moving 80% of applications to the cloud, accelerating data services, enabling innovation, and equipping employees with new skills and ways of working, while reducing their carbon footprint and contributing to their goal of increasing plasma collection and manufacturing by 2024 utilizing these new capabilities.
Additionally, we have been investing in digital experience capabilities for more than a decade in Accenture Interactive. Today, it has grown to $12.5 billion in revenue and continues to set a new standard for customer experience, connection, sales and marketing. It sits at the intersection of data, creativity and technology, and is tied to the ever-changing needs of customers. By combining our Interactive and Operations services,
together with AI-powered insights from our SynOps platform, we are helping Jaguar Land Rover transform their global marketing model to deliver a more personalized customer experience.
As we create 360° value through the things we build and nurture, we also create value by helping protect our clients. The digital threat landscape continues to evolve, and we continue to broaden our existing capabilities in Security, now $4.4 billion in revenue, to meet the expanding needs of our clients.
During the year, Accenture Federal Services acquired Novetta, an advanced analytics company serving U.S. Federal organizations. It further demonstrates what’s possible with analytics, machine learning, cyber and cloud engineering to transform how defense, intelligence and law enforcement organizations use data to better meet their missions and empower their workforces.
275,000+Accelerating equality for all
women representing 46% of our workforce, on track to meet our goal of gender parity by 2025; and making progress against our race and ethnicity goals in the U.S., the U.K. and South Africa
6

Committed to net-zero emissions by 2025 and already powering our offices and centers globally with
50% renewable electricity
7

60% 50%Leading from the top with a diverse Board of Directors
are racially and ethnically diverse
are women
8

Overall, we continued to invest at an even higher level than ever before. In fiscal 2021, we invested $4.2 billion in acquisitions, $900 million in learning and professional development, and $1.1 billion in R&D in assets, platforms and industry solutions, to extend our capabilities in new technologies including blockchain, robotics, 5G, quantum computing and Edge computing. Our portfolio of patents and pending patent applications has grown to more than 8,200.
The combination of our own innovation and that of our ecosystem partners allows us to amplify and accelerate our scale and speed in a way that supercharges the value we deliver to our clients and all of our stakeholders.
Our continued success is possible because of our people. We are guided by our belief that people want to work for companies that create value and lead with values. We offer a strong employee value proposition through vibrant career paths. We have an unwavering commitment to inclusion and diversity, and a true culture of equality, both of which are core to our values as a company and critical to our success and growth. We are proud to rank among the top three companies on the Refinitiv Diversity & Inclusion Index for the fourth consecutive year.
We continued making substantial impacts in the communities where our clients and our people live and work. In addition to providing $54 million in COVID-19 surge relief, we supported organizations on the front lines, from UNICEF’s COVID-19 Response Efforts to the World Health Organization’s COVID-19 Solidarity Response Fund. We also supported local relief efforts in our communities with significant challenges, including Africa, Brazil, India and the Philippines.
Beyond tackling COVID-19, we work together with our partners in a number of important areas. We are proud to report that our Skills to Succeed initiative has equipped more than 5.5 million people since 2009 with the skills to make substantive improvements to their lives. This includes a recent grant to help Upwardly Global assist 1,400 Afghan refugees and Special Immigrant Visa holders in finding long-term employment aligned with their capabilities. We continue nearly two decades of work through Accenture Development Partnerships, applying the talents of our people, capabilities and experience to improve lives by addressing complex social, economic and environmental issues around the world. As an example, we are reimagining access to health care through artificial intelligence, defining innovative opportunities and shaping the roadmap to AI maturity for low-income countries.
152,000
Supporting our people’s well-being and productivity with our many Thrive Global programs—Thriving Together, Thrive Reset and Thriving Mind—which have collectively been completed by over
of our people
9
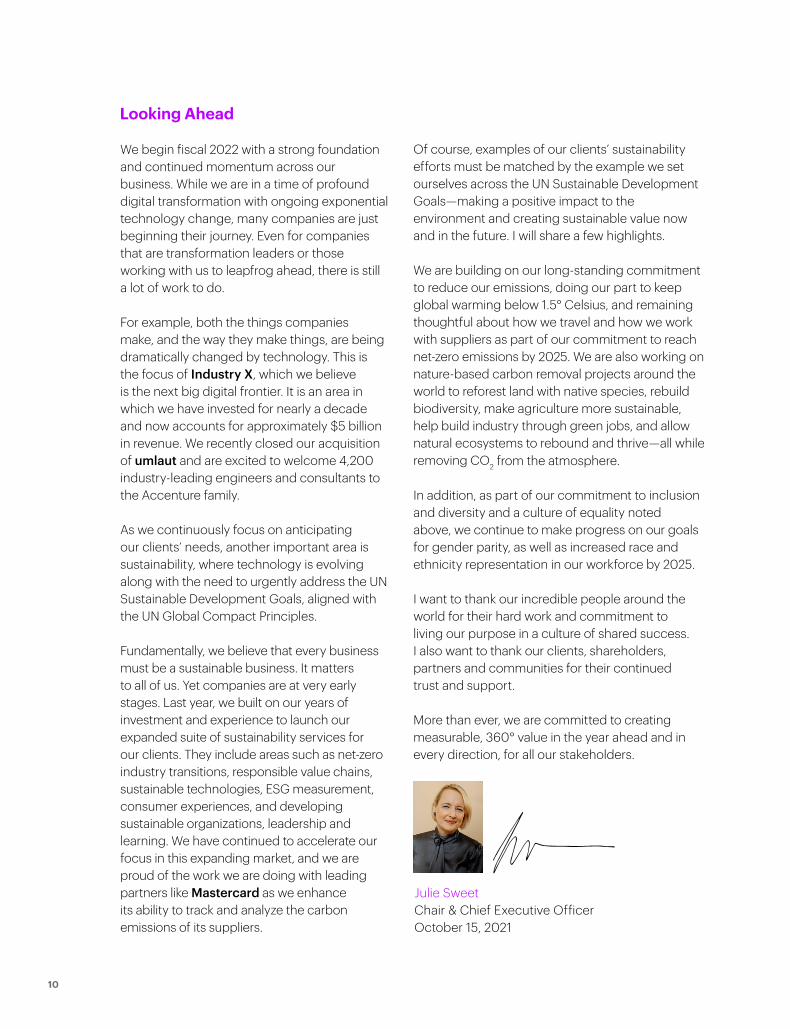
Looking Ahead
We begin fiscal 2022 with a strong foundation and continued momentum across our business. While we are in a time of profound digital transformation with ongoing exponential technology change, many companies are just beginning their journey. Even for companies that are transformation leaders or those working with us to leapfrog ahead, there is still a lot of work to do.
For example, both the things companies make, and the way they make things, are being dramatically changed by technology. This is the focus of Industry X, which we believe is the next big digital frontier. It is an area in which we have invested for nearly a decade and now accounts for approximately $5 billion in revenue. We recently closed our acquisition of umlaut and are excited to welcome 4,200 industry-leading engineers and consultants to the Accenture family.
As we continuously focus on anticipating our clients’ needs, another important area is sustainability, where technology is evolving along with the need to urgently address the UN Sustainable Development Goals, aligned with the UN Global Compact Principles.
Fundamentally, we believe that every business must be a sustainable business. It matters to all of us. Yet companies are at very early stages. Last year, we built on our years of investment and experience to launch our expanded suite of sustainability services for our clients. They include areas such as net-zero industry transitions, responsible value chains, sustainable technologies, ESG measurement, consumer experiences, and developing sustainable organizations, leadership and learning. We have continued to accelerate our focus in this expanding market, and we are proud of the work we are doing with leading partners like Mastercard as we enhance its ability to track and analyze the carbon emissions of its suppliers.
Of course, examples of our clients’ sustainability efforts must be matched by the example we set ourselves across the UN Sustainable Development Goals—making a positive impact to the environment and creating sustainable value now and in the future. I will share a few highlights.
We are building on our long-standing commitment to reduce our emissions, doing our part to keep global warming below 1.5° Celsius, and remaining thoughtful about how we travel and how we work with suppliers as part of our commitment to reach net-zero emissions by 2025. We are also working on nature-based carbon removal projects around the world to reforest land with native species, rebuild biodiversity, make agriculture more sustainable, help build industry through green jobs, and allow natural ecosystems to rebound and thrive—all while removing CO2 from the atmosphere.
In addition, as part of our commitment to inclusion and diversity and a culture of equality noted above, we continue to make progress on our goals for gender parity, as well as increased race and ethnicity representation in our workforce by 2025.
I want to thank our incredible people around the world for their hard work and commitment to living our purpose in a culture of shared success. I also want to thank our clients, shareholders, partners and communities for their continued trust and support.
More than ever, we are committed to creating measurable, 360° value in the year ahead and in every direction, for all our stakeholders.
Julie Sweet Chair & Chief Executive Officer October 15, 2021
10

20172016 2018 2019 2020 2021
$0
$50
$100
$150
$200
$250
$300
$350
$400
S&P 500 Index S&P 500 Information Technology Sector IndexAccenture
August 31, 2016– August 31, 2021
Accenture vs. S&P 500 Stock Index and S&P 500 Information Technology Sector Index
The performance graph to the right shows the cumulative total shareholder return on our Class A shares for the period starting on August 31, 2016, and ending on August 31, 2021, which was the end of fiscal 2021. This is compared with the cumulative total returns over the same period of the S&P 500 Stock Index and the S&P 500 Information Technology Sector Index. The graph assumes that, on August 31, 2016, $100 was invested in our Class A shares and $100 was invested in each of the other two indices, with dividends reinvested on the ex-dividend date without payment of any commissions. The performance shown in the graph represents past performance and should not be considered an indication of future performance.
Comparison of Cumulative Total Return
Indexed Prices as of August 31
Accenture $100 $116 $153 $182 $224 $319
S&P 500 Index $100 $116 $139 $143 $175 $229
S&P 500 IT Sector Index $100 $131 $174 $186 $293 $380
2016 2017 2018 2019 2020 2021
11

Awards & RecognitionBloomberg Gender-Equality Index4 consecutive years
Disability:IN and American Association of People with Disabilities Disability Equality Index5 consecutive years
Human Rights Campaign Corporate Equality IndexIn Chile, Mexico and U.S.
Refinitiv Diversity & Inclusion IndexAmong Top 3 for 4 consecutive years
FORTUNE Great Place to Work Best Companies to Work For In Japan, Mexico, U.K. and U.S. and No. 8 on
GPTW Best Large Workplaces for Women in Brazil
Business Today India’s Coolest WorkplacesAmong Top 10 for 10 consecutive years
Women's Career Index (FKi) in GermanyNo. 1, marking 4 consecutive years on list
Randstad Employer Brand Survey in Greater China 4 consecutive years
Nikkei Top 100 Companies for Women in Japan No. 1, highest result in 5 consecutive years
Asia Responsible Enterprise Awards in PhilippinesRecognized in Investment in People category, marking 2 consecutive years on list
FORTUNE World's Most Admired Companies No. 1 in our industry for 8 years, marking 19 consecutive years on list
Ethisphere World’s Most Ethical Companies14 consecutive years
Fast Company World Changing Ideas Awards 2 years
Interbrand Best Global Brands No. 31, marking 19 consecutive years on list
Forbes Global 2000 No. 169, marking 18 consecutive years on list
FORTUNE Global 500 No. 258, marking 20 consecutive years on list
Dow Jones Sustainability Index North America and FTSE4Good Global IndexSince 2005
CDP Climate Change A List 6 years
3BL Media 100 Best Corporate Citizens No. 7, marking 13 consecutive years on list
12

99%Building a strong ethical culture
completion rates on Ethics & Compliance training including anticorruption courses
13

$54M
Making a meaningful difference in our communities—donated
in COVID-surge relief and supporting vaccination programs worldwide
14

$54M
Stock listing
Accenture plc Class A ordinary shares are traded on the New York Stock Exchange under the symbol ACN.
Available information
Our website address is accenture.com. We use our website as a channel of distribution for company information. We make available free of charge on the Investor Relations section of our website (investor.accenture.com) our Annual Report on Form 10-K, Quarterly Reports on Form 10-Q, Current Reports on Form 8-K and all amendments to those reports as soon as reasonably practicable after such material is electronically filed with or furnished to the Securities and Exchange Commission (the “SEC”) pursuant to Section 13(a) or 15(d) of the Securities Exchange Act of 1934 (the “Exchange Act”). We also make available through our website other reports filed with or furnished to the SEC under the Exchange Act, including our proxy statements and reports filed by officers and directors under Section 16(a) of the Exchange Act, as well as our Code of Business Ethics. Financial and other material information regarding Accenture is routinely posted on and accessible at investor.accenture.com. We do not intend for information contained in this letter or on our website to be part of the Annual Report on Form 10-K. This letter and our Annual Report on Form 10-K for the fiscal year ended August 31, 2021, together constitute Accenture’s annual report to security holders for purposes of Rule 14a-3(b) of the Exchange Act.
Trademark references
Rights to trademarks referenced herein, other than Accenture trademarks, belong to their respective owners. We disclaim proprietary interest in the marks and names of others.
Forward-looking statements and certain factors that may affect our business
We have included in this letter “forward-looking statements” within the meaning of Section 27A of the Securities Act of 1933 and Section 21E of the Exchange Act relating to our operations, results of operations and other matters that are based on our current expectations, estimates, assumptions and projections. Words such as “will,” “plan,” “believe” and similar expressions are used to identify these forward-looking statements. These statements are not guarantees of future performance and involve risks, uncertainties and assumptions that are difficult to predict.
Forward-looking statements are based upon assumptions as to future events that may not prove to be accurate. Actual outcomes and results may differ materially from what is expressed or forecast in these forward-looking statements. Risks, uncertainties and other factors that might cause such differences, some of which could be material, include, but are not limited to, the factors discussed in our Annual Report on Form 10-K and Quarterly Reports on Form 10-Q (available through the Investor Relations section of our website at investor.accenture.com) under the sections entitled “Risk Factors.” Our forward-looking statements speak only as of the date of this letter or as of the date they are made, and we undertake no obligation to update
them, notwithstanding any historical practice of doing so. Forward-looking and other statements in this document may also address our corporate responsibility progress, plans and goals (including environmental matters), and the inclusion of such statements is not an indication that these contents are necessarily material to investors or required to be disclosed in the Company’s filings with the Securities and Exchange Commission. In addition, historical, current and forward-looking sustainability-related statements may be based on standards for measuring progress that are still developing, internal controls and processes that continue to evolve, and assumptions that are subject to change in the future.
Reconciliation of non-GAAP measures
This letter contains certain non-GAAP (Generally Accepted Accounting Principles) measures that our management believes provide our shareholders with additional insights into Accenture’s results of operations. The non-GAAP measures in this letter are supplemental in nature. They should not be considered in isolation or as alternatives to net income as indicators of company performance, to cash flows from operating activities as measures of liquidity, or to other financial information prepared in accordance with GAAP. Reconciliations of this non-GAAP financial information to Accenture’s financial statements as prepared under GAAP are included in this report.
All amounts throughout this letter are stated in U.S. dollars, except where noted. Revenues for Strategic Priorities, including Cloud, Interactive, Industry X and Security, overlap so revenues for the same client arrangement may be included in multiple Strategic Priorities.
15

UNITED STATES SECURITIES AND EXCHANGE COMMISSIONWashington, D.C. 20549
FORM 10-K
☑ Annual Report Pursuant to Section 13 or 15(d) of the Securities Exchange Act of 1934
For the fiscal year ended August 31, 2021Commission File Number: 001-34448
Accenture plc (Exact name of registrant as specified in its charter)
Ireland 98-0627530(State or other jurisdiction ofincorporation or organization)
(I.R.S. Employer Identification No.)
1 Grand Canal Square,Grand Canal Harbour,
Dublin 2, Ireland (Address of principal executive offices)
(353) (1) 646-2000 (Registrant’s telephone number, including area code)
Securities registered pursuant to Section 12(b) of the Act:
Title of each class Trading Symbol(s) Name of each exchange on which registered
Class A ordinary shares, par value $0.0000225 per share ACN New York Stock Exchange
Securities registered pursuant to Section 12(g) of the Act: NoneIndicate by check mark if the registrant is a well-known seasoned issuer, as defined in Rule 405 of the Securities Act. Yes ☑ No ☐Indicate by check mark if the registrant is not required to file reports pursuant to Section 13 or Section 15(d) of the Securities Exchange Act of 1934. Yes ☐ No ☑Indicate by check mark whether the registrant (1) has filed all reports required to be filed by Section 13 or 15(d) of the Securities Exchange Act of 1934 during the preceding 12 months (or for such shorter period that the registrant was required to file such reports), and (2) has been subject to such filing requirements for the past 90 days. Yes ☑ No ☐Indicate by check mark whether the registrant has submitted electronically every Interactive Data File required to be submitted pursuant to Rule 405 of Regulation S-T (§232.405 of this chapter) during the preceding 12 months (or for such shorter period that the registrant was required to submit such files). Yes ☑ No ☐Indicate by check mark whether the registrant is a large accelerated filer, an accelerated filer, a non-accelerated filer, smaller reporting company, or an emerging growth company. See the definitions of “large accelerated filer,” “accelerated filer,” “smaller reporting company,” and “emerging growth company” in Rule 12b-2 of the Exchange Act.
Large accelerated filer ☑ Accelerated filer ☐ Non-accelerated filer ☐
Smaller reporting company ☐ Emerging growth company ☐
If an emerging growth company, indicate by check mark if the Registrant has elected not to use the extended transition period for complying with any new or revised financial accounting standards provided pursuant to Section 13(a) of the Exchange Act. ☐Indicate by check mark whether the registrant has filed a report on and attestation to its management’s assessment of the effectiveness of its internal control over financial reporting under Section 404(b) of the Sarbanes-Oxley Act (15 U.S.C. 7262(b)) by the registered public accounting firm that prepared or issued its audit report. ☑ Indicate by check mark whether the registrant is a shell company (as defined in Rule 12b-2 of the Act). Yes ☐ No ☑The aggregate market value of the common equity of the registrant held by non-affiliates of the registrant on February 26, 2021 was approximately $159,483,888,262 based on the closing price of the registrant’s Class A ordinary shares, par value $0.0000225 per share, reported on the New York Stock Exchange on such date of $250.90 per share and on the par value of the registrant’s Class X ordinary shares, par value $0.0000225 per share.The number of shares of the registrant’s Class A ordinary shares, par value $0.0000225 per share, outstanding as of October 1, 2021 was 656,739,486 (which number includes 25,098,784 issued shares held by the registrant). The number of shares of the registrant’s Class X ordinary shares, par value $0.0000225 per share, outstanding as of October 1, 2021 was 512,655.
DOCUMENTS INCORPORATED BY REFERENCEPortions of the definitive proxy statement to be filed with the Securities and Exchange Commission pursuant to Regulation 14A relating to the registrant’s Annual General Meeting of Shareholders, to be held on January 26, 2022, will be incorporated by reference in this Form 10-K in response to Items 10, 11, 12, 13 and 14 of Part III. The definitive proxy statement will be filed with the SEC not later than 120 days after the registrant’s fiscal year ended August 31, 2021.
Table of Contents

Table of Contents
Page
Part I
Item 1. Business 2
Item 1A. Risk Factors 12
Item 1B. Unresolved Staff Comments 26
Item 2. Properties 26
Item 3. Legal Proceedings 26
Item 4. Mine Safety Disclosures 26
Part IIItem 5. Market for Registrant’s Common Equity, Related Shareholder Matters and Issuer Purchases of Equity Securities 27
Item 6. [Reserved] 28
Item 7. Management’s Discussion and Analysis of Financial Condition and Results of Operations 29
Item 7A. Quantitative and Qualitative Disclosures about Market Risk 39
Item 8. Financial Statements and Supplementary Data 40
Item 9. Changes in and Disagreements With Accountants on Accounting and Financial Disclosure 40
Item 9A. Controls and Procedures 40
Item 9B. Other Information 41
Item 9C. Disclosure Regarding Foreign Jurisdictions that Prevent Inspections 41
Part III
Item 10. Directors, Executive Officers and Corporate Governance 42
Item 11. Executive Compensation 42
Item 12. Security Ownership of Certain Beneficial Owners and Management and Related Shareholder Matters 43
Item 13. Certain Relationships and Related Transactions, and Director Independence 43
Item 14. Principal Accountant Fees and Services 44
Part IV
Item 15. Exhibits, Financial Statement Schedules 45
Item 16. Form 10-K Summary 47
Signatures 48
Table of Contents

Part I
Disclosure Regarding Forward-Looking StatementsThis Annual Report on Form 10-K contains forward-looking statements within the meaning of Section 27A of the Securities Act of 1933 and Section 21E of the Securities Exchange Act of 1934 (the “Exchange Act”) relating to our operations, results of operations and other matters that are based on our current expectations, estimates, assumptions and projections. Words such as “may,” “will,” “should,” “likely,” “anticipates,” “expects,” “intends,” “plans,” “projects,” “believes,” “estimates,” “positioned,” “outlook” and similar expressions are used to identify these forward-looking statements. These statements are not guarantees of future performance and involve risks, uncertainties and assumptions that are difficult to predict. Forward-looking statements are based upon assumptions as to future events that may not prove to be accurate. Actual outcomes and results may differ materially from what is expressed or forecast in these forward-looking statements. Risks, uncertainties and other factors that might cause such differences, some of which could be material, include, but are not limited to, the factors discussed below under the section entitled “Risk Factors.” Our forward-looking statements speak only as of the date of this report or as of the date they are made, and we undertake no obligation to update them, notwithstanding any historical practice of doing so. Forward-looking and other statements in this document may also address our corporate responsibility progress, plans, and goals (including environmental matters), and the inclusion of such statements is not an indication that these contents are necessarily material to investors or required to be disclosed in the Company’s filings with the Securities and Exchange Commission. In addition, historical, current, and forward-looking sustainability-related statements may be based on standards for measuring progress that are still developing, internal controls and processes that continue to evolve, and assumptions that are subject to change in the future.
Available InformationOur website address is www.accenture.com. We use our website as a channel of distribution for company information. We make available free of charge on the Investor Relations section of our website (http://investor.accenture.com) our Annual Report on Form 10-K, Quarterly Reports on Form 10-Q, Current Reports on Form 8-K and all amendments to those reports as soon as reasonably practicable after such material is electronically filed with or furnished to the Securities and Exchange Commission (the “SEC”) pursuant to Section 13(a) or 15(d) of the Exchange Act. We also make available through our website other reports filed with or furnished to the SEC under the Exchange Act, including our proxy statements and reports filed by officers and directors under Section 16(a) of the Exchange Act, as well as our Code of Business Ethics. Financial and other material information regarding us is routinely posted on and accessible at http://investor.accenture.com. We do not intend for information contained in our website to be part of this Annual Report on Form 10-K.
The SEC maintains an Internet site (http://www.sec.gov) that contains reports, proxy and information statements and other information regarding issuers that file electronically with the SEC. Any materials we file with the SEC are available on such Internet site.
In this Annual Report on Form 10-K, we use the terms “Accenture,” “we,” the “Company,” “our” and “us” to refer to Accenture plc and its subsidiaries. All references to years, unless otherwise noted, refer to our fiscal year, which ends on August 31.
Table of Contents
ACCENTURE 2021 FORM 10-K Part I 1

Item 1. Business
Overview Accenture is a leading global professional services company that helps clients build their digital core, transform their operations, and accelerate revenue growth—creating tangible value across their enterprises at speed and scale. We are uniquely able to create these outcomes because of our broad range of services in strategy and consulting, interactive, technology and operations, with digital capabilities across all of these services. We combine unmatched industry experience and specialized capabilities, together with our culture of innovation and shared success to serve clients in more than 120 countries.
We serve clients in three geographic markets: North America, Europe and Growth Markets (Asia Pacific, Latin America, Africa and the Middle East). Our geographic markets bring together capabilities from across the organization in Strategy & Consulting, Interactive, Technology and Operations—infusing digital skills and industry and functional expertise throughout—to deliver value to our clients.
Our revenues for fiscal 2021 were
$50.5 billion, and we employed more than
624,000 people as of August 31, 2021. Our revenues are derived primarily from Forbes Global 2000 companies, governments and government agencies. We have long-term relationships and have partnered with
98 of our top 100 clients in fiscal 2021 for
> 10 years.
We manage our business through the three geographic markets and go to market by industry, leveraging our deep expertise across our five industry groups—Communications, Media & Technology, Financial Services, Health & Public Service, Products and Resources. Our integrated service teams meet client needs rapidly and at scale, leveraging our network of more than 100 innovation hubs, our technology expertise and ecosystem relationships, and our global delivery capabilities.
During fiscal 2021, we continued to make significant investments—in strategic acquisitions, in research and development (R&D) in our assets, platforms and industry and functional solutions, and in attracting, retaining and developing people. These investments help us to further enhance our differentiation and competitiveness in the marketplace. Our disciplined acquisition strategy, which is an engine to fuel organic growth, is focused on scaling our business in high-growth areas; adding skills and capabilities in new areas; and deepening our industry and functional expertise. In fiscal 2021, we invested $4.2 billion across 46 strategic acquisitions, $1.1 billion in R&D, and $900 million in learning and professional development. At year-end, we had more than 8,200 patents and pending patent applications worldwide.
Table of Contents
ACCENTURE 2021 FORM 10-K Item 1. Business 2

Our StrategyThe core of our growth strategy is delivering 360° value to our clients, our people, our shareholders, our partners and communities. Our strategy defines the areas in which we will drive growth, build differentiation via 360° value and enable our business to create that value every day.
Technology is the single biggest driver of change in companies today. We help our clients use technology to build their digital core to drive enterprise-wide transformation—such as moving them to the cloud, leveraging data and artificial intelligence, and embedding security and sustainability across the enterprise; by transforming their operations—such as through our Operations services and Industry X; and by accelerating their revenue growth—such as through creating new and meaningful experiences through Interactive.
We leverage our scale and global footprint, innovation capabilities, and strong ecosystem partnerships, together with our assets and platforms including MyWizard, MyNav and SynOps, to consistently deliver tangible value for our clients.
We believe our clients need our focus on 360° value, which we define as delivering the financial business case and unique value a client may be seeking, and striving to partner with our clients through our Sustainability Value Promise to achieve greater progress on inclusion and diversity, reskill and upskill our clients’ employees, help our clients achieve their sustainability goals, and create meaningful experiences, both with Accenture and for the customers and employees of our clients.
Key enablers of our growth strategy include: Our People—As a talent- and innovation-led organization, across our entire business our people have highly specialized skills that drive our differentiation and competitiveness. We care deeply for our people, and are committed to a culture of shared success, to investing in our people to provide them with boundaryless opportunities to learn and grow in their careers through their work experience and continued development, training and reskilling, and to helping them achieve their aspirations both professionally and personally. We have an unwavering commitment to inclusion and diversity;
Our Commitment—We are a purpose-driven company, committed to delivering on the promise of technology and human ingenuity by continuously innovating and developing leading-edge ideas and leveraging emerging technologies in anticipation of our clients’ needs. Our culture is underpinned by our core values and Code of Business Ethics, which are key drivers of the trust our clients and partners place in us; and
Our Foundation—Our growth model, which leverages our global sales and client experience, enables us to be close to our clients, people and partners to scale efficiently. Our enduring shareholder value creation model also is a key element of the foundation that enables us to execute on our growth strategy through the financial value it creates.
Geographic MarketsOur geographic markets, North America, Europe and Growth Markets, bring together integrated service teams, which typically consist of industry and functional experts, technology and capability specialists and professionals with local market knowledge and experience, to meet client needs. The geographic markets have primary responsibility for building and sustaining long-term client relationships; bringing together our expertise and collaborating with the other parts of our business to sell and deliver our full range of services and capabilities; ensuring client satisfaction; and achieving revenue and profitability objectives.
While we serve clients in locally relevant ways, our global footprint and scale in every major country give us the ability to leverage our experience and people from around the world to accelerate outcomes for our clients.
Our three geographic markets are our reporting segments. The percent of our revenues represented by each market is shown at right.
Percent of Fiscal 2021 Revenue
20% —GrowthMarkets
33% —Europe
47% —NorthAmerica
Table of Contents
ACCENTURE 2021 FORM 10-K Item 1. Business 3
ServicesStrategy & Consulting Strategy & Consulting works with C-suite executives and boards of the world’s leading organizations, helping them accelerate their digital transformation to enhance competitiveness, grow profitability and deliver sustainable stakeholder value. We use our deep industry and functional expertise underpinned by technology, data, analytics, artificial intelligence, and innovation to help clients capture more growth and solve a diverse set of business challenges, including identifying and developing new markets, products and services; improving sales and customer experience; optimizing cost structures; maximizing human performance; harnessing data to improve decision-making; mitigating risk and enhancing security; implementing modern change management programs; shaping and delivering value from large-scale cloud migrations; building more resilient supply chains; and digitizing manufacturing and operations with smart, connected products and platforms.
InteractiveInteractive combines creativity and technology to deliver meaningful experiences that drive sustainable growth and value for our clients. Our capabilities span ideation to execution: growth, product and culture design; technology and experience platforms; creative, media and marketing strategy; and campaign, content and channel orchestration. With strong client relationships and deep industry and function expertise, we are uniquely positioned to design, build, communicate and run experiences, reimagining the entire journey for customers, employees, patients and citizens alike. We embed this focus on experience across our services.
TechnologyTechnology provides innovative and comprehensive services and solutions that span cloud; systems integration and application management; security; intelligent platform services; infrastructure services; software engineering services; data and artificial intelligence; and global delivery through our Advanced Technology Centers. We continuously innovate our services, capabilities and platforms through early adoption of new technologies such as blockchain, robotics, 5G, quantum computing and Edge computing. We provide a powerful range of capabilities that addresses the challenges faced by organizations today, including how to manage change and develop new growth opportunities.
Technology also includes the innovation and R&D activities in our Labs and our investments in emerging technologies through Accenture Ventures. Our innovation hubs around the world help clients innovate at unmatched speed, scope and scale. We have strong relationships with the world’s leading technology companies, as well as emerging start-ups, which enable us to enhance our service offerings, augment our capabilities and deliver distinctive business value to our clients. Our strong ecosystem relationships provide a significant competitive advantage, and we are a key partner of a broad range of technology providers, including Adobe, Alibaba, Amazon Web Services, Blue Yonder, Cisco, Dell, Google, HPE, IBM RedHat, Microsoft, Oracle, Pegasystems, Salesforce, SAP, ServiceNow, VMWare, Workday and many others. We push the boundaries of what technology can enable and help clients get the most value and best capabilities out of platforms.
OperationsWe operate business processes on behalf of clients for specific enterprise functions, including finance and accounting, sourcing and procurement, supply chain, marketing and sales, as well as industry-specific services, such as platform trust and safety, banking, insurance and health services. We help organizations to reinvent themselves through intelligent operations, enabled by SynOps, our human-machine platform, powered by data and analytics, artificial intelligence, digital technology and exceptional people to provide tangible business outcomes at speed and scale, including improved productivity and customer experiences as well as sustained long-term growth.
Table of Contents
ACCENTURE 2021 FORM 10-K Item 1. Business 4

Industry Groups One of our competitive advantages is the depth and breadth of our industry expertise. Our industry focus gives us an understanding of industry evolution, business issues and new and emerging technologies, enabling us to deliver innovative solutions tailored to each client. It also allows us to bring cross-industry insights to our clients to accelerate value creation. Our industry experience and capabilities are organized in the following five industry groups.
Communications, Media & Technology FY21 Revenues of $10.3B
Communications & Media High Tech Software & Platforms
Clients Served
Wireline, wireless, broadcast, entertainment, print, publishing, cable and satellite communications service providers
Enterprise technology, network equipment, semiconductor, consumer technology, aerospace & defense, and medical equipment companies
Cloud-based enterprise and consumer software companies; and social, commerce, content, advertising and gaming platform companies
Percent of Group’s FY21 Revenue
43% 20% 37%
Financial Services FY21 Revenues of $9.9B
Banking & Capital Markets Insurance
Clients Served
Retail and commercial banks, mortgage lenders, payment providers, corporate and investment banks, private equity firms, market infrastructure providers, wealth and asset management firms, broker/dealers, depositories, exchanges, clearing and settlement organizations, and other diversified financial enterprises
Property and casualty, life and annuities and group benefits insurers, reinsurance firms and insurance brokers
Percent of Group’s FY21 Revenue
69% 31%
Health & Public Service FY21 Revenues of $9.5B
Health Public Service
Clients Served
Healthcare providers, such as hospitals, public health systems, policy-making authorities, health insurers (payers), and industry organizations and associations
Defense departments and military forces; public safety authorities; justice departments; human and social services agencies; educational institutions; non-profit organizations; cities; and postal, customs, revenue and tax agencies
Percent of Group’s FY21 Revenue
34% 66%
Our work with clients in the U.S. federal government is delivered through Accenture Federal Services, a U.S. company and a wholly owned subsidiary of Accenture LLP, and represented approximately 32% of our Health & Public Service industry group’s revenues and 13% of our North America revenues in fiscal 2021.
Table of Contents
ACCENTURE 2021 FORM 10-K Item 1. Business 5

Products FY21 Revenues of $14.0B
Consumer Goods, Retail & Travel Services Industrial Life Sciences
Clients Served
Food and beverage, household goods, personal care, tobacco, fashion/apparel, agribusiness and consumer health companies; supermarkets, hardline retailers, mass-merchandise discounters, department stores and specialty retailers; aviation; and hospitality and travel services companies
Industrial & electrical equipment manufacturers and industrial suppliers; and construction, heavy equipment, consumer durables, engineering services, real estate, business services, freight & logistics, and automotive and public transportation companies
Biopharmaceutical, medical technology, and biotechnology companies and distributors
Percent of Group’s FY21 Revenue
51% 25% 23%
Amounts do not total due to rounding.
Resources FY21 Revenues of $6.9B
Chemicals & Natural Resources Energy Utilities
Clients Served
Petrochemicals, specialty chemicals, polymers and plastics, gases and agricultural chemicals companies, as well as the metals, mining, forest products and building materials industries
Companies in the oil and gas industry, including upstream, midstream, downstream, oilfield services, clean energy and energy trading companies
Electric, gas and water utilities; new energy providers
Percent of Group’s FY21 Revenue
28% 24% 47%
Amounts do not total due to rounding.
PeopleOverviewWe are a talent- and innovation-led organization with over 624,000 people as of August 31, 2021, whose skills and specialization are a significant source of competitive differentiation. We serve clients at any given time in more than 120 countries, with offices and operations in 50 countries. The majority of our people are in India, the Philippines and the U.S. We have a culture of shared success, which is defined as success for our clients, our people, our shareholders, our partners and our communities. That culture is built upon four tangible building blocks—our beliefs, our behaviors, the way we develop and reward our people and the way we do business.
Our Beliefs and Behaviors Our leadership essentials set the standard for what we expect of all our people:
• always do the right thing, in every decision and action;
• lead with excellence, confidence and humility, as demonstrated by being a learner, building great teams and being naturally collaborative;
• exemplify client-centricity and a commitment to client value creation;
• act as a true partner, to each other, our clients, our ecosystem and our communities;
• care deeply for all our people to help them achieve their aspirations professionally and personally;
Table of Contents
ACCENTURE 2021 FORM 10-K Item 1. Business 6

• live our unwavering commitment to inclusion, diversity and equality, as demonstrated by personal impact and overall results;
• have the courage to change and the ability to bring our people along the journey; and
• actively innovate—looking across Accenture, at what we are doing for clients and externally to partners, competitors, start-ups, clients, academia and analysts—to learn, respectfully challenge our assumptions and apply the innovation, and cultivate and reward our people for doing the same.
Listening to the voices of our people provides the input to ensure that they have the tools and resources to do their jobs and the right learning opportunities, and that they experience a positive, respectful and inclusive work environment. We do this on an ongoing basis across various channels, including surveys and forums. One of our surveys, our Conduct Counts Survey, which measures how our people experience our culture, shows that 87% of our global respondents believe they can work to their potential because they are in an environment where they are treated with respect and in an appropriate manner.
Our commitment to inclusion and diversity unleashes innovation and we believe creates an environment where all of our people have an opportunity to feel they belong, advance and thrive. In connection with our priorities around inclusion and diversity, we set goals, share them publicly, collect data to continuously improve and hold our leaders accountable. We now have more than 275,000 women, representing 46% of our workforce, which is tracking well against our goal of 50% by 2025. And, after achieving our goal of 25% women managing directors by the end of fiscal year 2020, we set a new goal of 30% by 2025. We are also making progress against our 2025 race and ethnicity goals in the U.S., the U.K, and South Africa, which we announced in 2020.
Through the entire talent lifecycle, we are committed to being inclusive and diverse—from discovering, to hiring, to developing and advancing our people. This commitment extends to equal pay. Pay equity at Accenture means that our people receive pay that is fair and consistent when considering similarity of work, location and tenure at career level. We conduct an annual pay equity review, and our last review was conducted in February 2021. As of February 1, 2021, we have dollar-for-dollar, 100% pay equity for women compared to men in every country where we operate. By race and ethnicity, we likewise have dollar-for-dollar, 100% pay equity in countries where we collect this data (the U.S., the U.K. and South Africa).
The Way We Develop and Reward Our People We invested $900 million in continuous learning and development so our people remain highly relevant. With our digital learning platform, Accenture Connected Learning, we delivered over 31 million training hours, an increase of 43% compared with fiscal 2020, with an average of approximately 60 hours of training per person.
We promoted more than 120,000 people in fiscal 2021. In addition, we paid a one-time bonus to all of our people below managing director to recognize their contributions and dedication to our clients during the COVID-19 pandemic.
We balance our supply of skills with changes in client demand. We do this through adjusting hiring and managing our attrition (both voluntary and involuntary). In fiscal 2021, we increased our workforce by approximately 118,000 people. For fiscal 2021, attrition, excluding involuntary terminations, was 14%, up from 12% in fiscal 2020. For the fourth quarter of fiscal 2021, annualized attrition, excluding involuntary terminations, was 19% up from 17% in the third quarter of fiscal 2021.
Accenture’s total rewards consist of cash compensation, equity and a wide range of benefits. Our total rewards program is designed to recognize our people’s skills, contributions and career progression. Base salary, bonus and equity are tailored to the market where our people work and live. Certain rewards, like equity and bonuses, are opportunities for our people to share in the overall success of our company. As our people advance in their careers, they have greater opportunities to be rewarded.
The Way We Do BusinessAt Accenture, our people care deeply about doing the right thing. Together, we have proven that we can succeed—providing value to our clients and shareholders and opportunities for our people—while being a powerful force for good. Our shared commitment to operating with the highest ethical standards and making a positive difference in everything we do is what makes Accenture special. We believe in transparency, that transparency builds trust, and that we must earn the trust of our clients, our people, our partners and our communities each and every day.
Our Code of Business Ethics is organized into six fundamental behaviors: Make Your Conduct Count; Comply with Laws; Deliver for Our Clients; Protect People, Information and Our Business; Run Our Business Responsibly; and Be a Good Corporate Citizen. It applies to all our people—regardless of their title or location. With our Code of Business Ethics, we want to help our people make ethical behavior a natural part of what we do every day—with each other, our clients, our partners and our communities.
Our Health, Safety and Well-BeingWe are committed to creating a place where people can be successful both professionally and personally. We take a holistic view of well-being—including physical, mental, emotional and financial well-being—providing specially defined programs and
Table of Contents
ACCENTURE 2021 FORM 10-K Item 1. Business 7

practices to support this holistic view.
In FY21, as it relates to COVID-19, we have supported our people with the expansion of critical programs, including, in many counties, 24/7 telemedicine, care-at-home services, proctored distance learning for school-aged children, virtual childcare, enhanced insurance coverage, mental health support and testing and vaccination services. The pandemic has negatively affected many people’s mental health around the globe. We used new digital tools and initiatives to help employees cope with the demands and stresses of the compounding crises, and to strengthen their mental resilience. Those programs include access to in-person and virtual counseling and support, to digital tools like Calm and Wysa, to our Mental Health Ally program and to our many Thrive Global programs—Thriving Together, Thrive Reset and Thriving Mind—which have collectively been completed by over 152,000 of our people and bring science-based solutions to lower stress, enhance well-being and productivity, and build resilience and belonging.
To promote health and safety and to reduce the risk of COVID-19 transmission, we actively connected our people and their families to effective testing in multiple ways—home testing kits, in office testing, and through pharmacies close to where they live. We have administered vaccinations in ten countries, including the U.S., India and the Philippines, through Accenture-hosted or organized onsite events and clinics. We have also provided paid time off for all our people to receive their full vaccine course, as well as their eligible dependents.
Environmental SustainabilityFor more than a decade, we have continually set challenging environmental goals for ourselves, innovating our approach to environmental sustainability and making strategic investments. In alignment with the Paris Climate Agreement, we’ve pledged to do our part to keep global warming below 1.5° Celsius by joining the more than 400 companies that have signed the UN Global Compact’s Business Ambition for 1.5° Pledge to date. We have also pledged to achieve net-zero emissions by 2025, move to zero waste and plan for water risk.
As a professional services company, the most significant aspects of our environmental footprint are the greenhouse gas emissions related to electricity used in our locations and travel. To meet our commitment to achieve net-zero emissions by 2025:
• we plan to meet our office energy needs with 100% renewable electricity by 2023—in September 2021, we announced that we had reached 50% renewable electricity—and equip our people to make climate smart travel decisions;
• we will require 90% of our key suppliers to disclose their environmental targets and actions being taken to reduce emissions by 2025; and
• to address remaining emissions, we are investing in nature-based carbon removal solutions that will directly remove carbon from the atmosphere.
To move towards zero waste, we will reuse or recycle 100% of our e-waste, such as computers and servers, as well as all of our office furniture, by 2025, and post-pandemic we have committed to eliminating single-use plastics in our locations.
To plan for water risk, we are developing plans to reduce the impact of flooding, drought and water scarcity on our business and our people in high-risk areas.
Global Delivery CapabilityA key differentiator is our global delivery capability, powered by the world’s largest network of Advanced Technology and Intelligent Operations Centers. This allows us to bring the right people at the right time to our clients from anywhere in the world—both in physical and virtual working environments—a capability that is particularly crucial as business needs and conditions change rapidly. Our global approach provides scalable innovation; standardized processes, methods and tools; automation and artificial intelligence; industry expertise and specialized capabilities; cost advantages; foreign language fluency; proximity to clients; and time zone advantages—to deliver high-quality solutions. Emphasizing quality, productivity, reduced risk, speed to market and predictability, our global delivery model supports all parts of our business to provide clients with price-competitive services and solutions.
Innovation and Intellectual Property We are committed to developing leading-edge ideas and leveraging emerging technologies and we see innovation as a source of competitive advantage. We use our investment in R&D—on which we spent $1.1 billion, $871 million, and $800 million in fiscal 2021, 2020 and 2019, respectively—to help clients address new realities in the marketplace and to face the future with confidence.
Table of Contents
ACCENTURE 2021 FORM 10-K Item 1. Business 8
Our innovation experts work with clients across the world to imagine their future, build and co-create innovative business strategies and technology solutions, and then scale those solutions to sustain innovation. We harness our unique intellectual property to deliver these innovation services.
We leverage patent, trade secret and copyright laws as well as contractual arrangements and confidentiality procedures to protect the intellectual property in our innovative services and solutions. These include our proprietary platforms, software, reusable knowledge capital, and other innovations. We also have policies to respect the intellectual property rights of third parties, such as our clients, partners, vendors and others. As of August 31, 2021, we had a portfolio of more than 8,200 patents and pending patent applications worldwide.
We believe our combination of people, assets and capabilities, including our global network of more than 100 innovation hubs, makes Accenture one of the leading strategic innovation partners for our clients. We have deep expertise in innovation consulting including strategy, culture change and building new business models through to long-term technology innovation, which creates the products and markets of the future.
This is all supported by our Innovation Architecture, which includes Accenture Research, Accenture Ventures and Accenture Labs as well as our Studios, Innovation Centers and Delivery Centers. Our research and thought leadership teams help identify market, technology and industry trends. Accenture Ventures partners with and invests in growth-stage companies that create innovative enterprise technologies. Accenture Labs incubate and prototype new concepts through applied research and development projects. Within this, the Technology Incubation Group incubates and applies emerging technology innovation to business architectures, including blockchain, extended reality and quantum.
To protect Accenture’s brands, we rely on intellectual property laws and trademark registrations held around the world. Trademarks appearing in this report are the trademarks or registered trademarks of Accenture Global Services Limited, Accenture Global Solutions Limited, or third parties, as applicable.
CompetitionAccenture operates in a highly competitive and rapidly changing global marketplace. We compete with a variety of organizations that offer services and solutions competitive with those we offer—but we believe no other company offers the full range of services at scale that Accenture does, which uniquely positions us in a highly competitive market. Our clients typically retain us on a non-exclusive basis.
Our competitors include large multinational IT service providers, including the services arms of large global technology providers; off-shore IT service providers in lower-cost locations, particularly in India; accounting firms and consultancies that provide consulting and other IT services and solutions; solution or service providers that compete with us in a specific geographic market, industry or service area, including advertising agencies, engineering services providers and technology start-ups; and in-house IT departments of large corporations that use their own resources rather than engage an outside firm.
We believe Accenture competes successfully in the marketplace because:
• We are focused on delivering 360° value, which we define as the financial business case and unique value a client may be seeking, and striving to partner with our clients to achieve greater progress on inclusion and diversity, reskill our clients’ employees, help our clients achieve their sustainability goals, and create meaningful experiences, both with Accenture and for the customers and employees of our clients;
• We are a trusted partner with long-term client relationships and a proven track record for delivering on large, complex programs that drive tangible value;
• We provide a broad range of services with our unique approach to bring integrated service teams at scale and have a significant presence in every major geographic market, enabling us to leverage our global expertise in a local context and deliver tangible value;
• We have deep industry and cross-industry expertise, which enable us to accelerate value as clients transform their products, customer experiences and business operations;
• Our industry-leading Innovation Architecture—including Accenture Research, Accenture Ventures and Accenture Labs as well as our Studios, Innovation Centers and Delivery Centers—reflects our commitment to continuous innovation and enables us to rapidly identify, incubate, and scale emerging technology solutions for our clients;
• The breadth and scale of our technology capabilities, combined with our strong relationships with our technology ecosystem partners, enable us to help clients transform and re-platform in a sustainable way at speed; and
• Our goal is to recruit the most talented people in our markets, and we have an unwavering commitment to inclusion and diversity, which creates an environment that unleashes innovation, and a world-class learning organization that helps us continuously invest in the development of our people.
Table of Contents
ACCENTURE 2021 FORM 10-K Item 1. Business 9

Information About Our Executive Officers Our executive officers as of October 15, 2021 are as follows:
Gianfranco Casati, 62, became our chief executive officer—Growth Markets in January 2014. From September 2006 to January 2014, he served as our group chief executive—Products. From April 2002 to September 2006, Mr. Casati was managing director of the Products Europe operating unit. He also served as our country managing director for Italy and as chairman of our geographic council in its IGEM (Italy, Greece, emerging markets) region, supervising our offices in Italy, Greece and several Eastern European countries. Mr. Casati has been with Accenture for 37 years.
Richard P. Clark, 60, became our chief transformation officer, business enablement in September 2021 and has served as our chief accounting officer since September 2013. Mr. Clark also served as our corporate controller from September 2010 to September 2021. Prior to that, Mr. Clark served as our senior managing director of investor relations from September 2006 to September 2010. Previously, he served as our finance director—Communications, Media & Technology from July 2001 to September 2006, and as our finance director—Resources from 1998 to July 2001. Mr. Clark has been with Accenture for 38 years.
Jo Deblaere, 59, became our chief operating officer in September 2009. Mr. Deblaere also served as our chief executive—Europe from January 2014 to February 2020. From September 2006 to September 2009, Mr. Deblaere served as our chief operating officer—Outsourcing. Prior to that, from September 2005 to September 2006, he led our global network of business process outsourcing delivery centers. From September 2000 to September 2005, he had overall responsibility for work with public-sector clients in Western Europe. Mr. Deblaere has been with Accenture for 36 years.
Jimmy Etheredge, 58, became our chief executive officer—North America in September 2019. From December 2016 to September 2019, Mr. Etheredge served as senior managing director—U.S. Southeast, responsible for our business in 10 states, including the key markets of Atlanta, Charlotte and Washington, D.C. Previously, he served as senior managing director—Products in North America from 2011 until December 2016. Mr. Etheredge has been with Accenture for 36 years.
KC McClure, 56, became our chief financial officer in January 2019. From June 2018 to January 2019, she served as managing director—Finance Operations, where she led our finance operations across the entirety of our businesses. From December 2016 to May 2018, she served as our finance director—Communications, Media & Technology. Prior to assuming that role, she served as our head of investor relations from September 2010 to November 2016, and from March 2002 to August 2010, she served as our finance director—Health & Public Service. Ms. McClure has been with Accenture for 33 years.
Jean-Marc Ollagnier, 59, became our chief executive officer—Europe in March 2020. From March 2011 to March 2020, Mr. Ollagnier served as our group chief executive—Resources. From September 2006 to March 2011, Mr. Ollagnier led Resources in Europe, Latin America, the Middle East and Africa. Previously, he served as our global managing director—Financial Services Solutions group and as our geographic unit managing director—Gallia. Mr. Ollagnier has been with Accenture for 35 years.
Table of Contents
ACCENTURE 2021 FORM 10-K Item 1. Business 10

Ellyn J. Shook, 58, became our chief leadership officer in December 2015 and has also served as our chief human resources officer since March 2014. From 2012 to March 2014, Ms. Shook was our senior managing director—Human Resources and head of our Human Resources Centers of Expertise. From 2004 to 2011, she served as the global human resources lead for career management, performance management, total rewards, employee engagement and mergers and acquisitions. Ms. Shook has been with Accenture for 33 years.
Julie Sweet, 54, became chair of our Board of Directors in September 2021 and has served as our chief executive officer since September 2019. From June 2015 to September 2019, she served as our chief executive officer—North America. From March 2010 to June 2015, she served as our general counsel, secretary and chief compliance officer. Prior to joining Accenture in 2010, Ms. Sweet was a partner for 10 years in the law firm Cravath, Swaine & Moore LLP, which she joined as an associate in 1992. Ms. Sweet has been with Accenture for 11 years and has served as a director since September 2019.
Joel Unruch, 43, became our general counsel in September 2019 and has served as our corporate secretary since June 2015. Mr. Unruch also served as our chief compliance officer from September 2019 to January 2020. Mr. Unruch joined Accenture in 2011 as our assistant general counsel and assistant secretary and also oversaw ventures & acquisitions and alliances & ecosystems practices for our legal group. Prior to joining Accenture, Mr. Unruch was corporate counsel at Amazon.com and previously an associate in the corporate department of the law firm Cravath, Swaine & Moore LLP. Mr. Unruch has been with Accenture for 10 years.
Organizational Structure Accenture plc was incorporated in Ireland on June 10, 2009 as a public limited company. We operate our business through subsidiaries of Accenture plc.
The Consolidated Financial Statements reflect the ownership interests in Accenture Canada Holdings Inc. held by certain current and former members of Accenture Leadership as noncontrolling interests. The noncontrolling ownership interests percentage was less than 1% as of August 31, 2021. “Accenture Leadership” is comprised of members of our global management committee (our primary management and leadership team, which consists of approximately 50 of our most senior leaders), senior managing directors and managing directors.
Table of Contents
ACCENTURE 2021 FORM 10-K Item 1. Business 11

Item 1A. Risk Factors
In addition to the other information set forth in this report, you should carefully consider the following factors which could materially adversely affect our business, financial condition, results of operations (including revenues and profitability) and/or stock price. Our business is also subject to general risks and uncertainties that may broadly affect companies, including us. Additional risks and uncertainties not currently known to us or that we currently deem to be immaterial also could materially adversely affect our business, financial condition, results of operations and/or stock price. Risks in this section are grouped in the following categories: (1) Business Risks; (2) Financial Risks; (3) Operational Risks; and (4) Legal and Regulatory Risks. Many risks affect more than one category, and the risks are not in order of significance or probability of occurrence because they have been grouped by categories.
Business RisksThe COVID-19 pandemic has impacted our business and operations, and the extent to which it will continue to do so and its impact on our future financial results are uncertain.The COVID-19 pandemic and the actions taken by governments, businesses and individuals in response to the pandemic have adversely impacted our operations and could in the future materially adversely impact our business, operations and financial results.
The extent to which the coronavirus pandemic will continue to impact our business, operations and financial results will depend on numerous evolving factors that are difficult to accurately predict, including: the duration and scope of the pandemic; the emergence and virulence of new variants, which may cause and impact the severity of additional outbreaks; how quickly and to what extent normal economic activity resumes; the availability and effectiveness of vaccines and treatments for COVID-19 globally; vaccination against COVID-19 as a condition of employment, as we have required in the U.S., or as a condition of entry to our or our clients’ offices; government, business and individuals’ actions in response to the pandemic; the impact on our ability to innovate; and the effect on our clients and client demand for our services and solutions.
The closures of our and our clients’ offices, and restrictions inhibiting our people’s ability to access those offices, disrupted our business and operations and may do so again in the future. In addition, our employees continue to face challenges in their well-being, given the additional financial, family and health burdens that many employees have experienced and could continue to experience because of the pandemic that may negatively impact our people’s mental and physical health, engagement and retention.
Any of these events could cause, contribute to or magnify the other risks and uncertainties enumerated below and could materially adversely affect our business, financial condition, results of operations and/or stock price.
Our results of operations have been, and may in the future be, adversely affected by volatile, negative or uncertain economic and political conditions and the effects of these conditions on our clients’ businesses and levels of business activity. Global macroeconomic and geopolitical conditions affect our clients’ businesses and the markets they serve. Volatile, negative and uncertain economic and political conditions have in the past undermined and could in the future undermine business confidence in our significant markets and other markets, which are increasingly interdependent, causing our clients to reduce or defer their spending on new initiatives and technologies, and resulting in clients reducing, delaying or eliminating spending under existing contracts with us, which negatively affects our business. Growth in the markets we serve could be at a slow rate, or could stagnate or contract, in each case, for an extended period of time. Because we operate globally and have significant businesses in many markets, an economic slowdown in any of those markets could adversely affect our results of operations.
Ongoing economic and political volatility and uncertainty and changing demand patterns affect our business in a number of other ways, including making it more difficult to accurately forecast client demand and effectively build our revenue and resource plans, particularly in consulting. Economic and political volatility and uncertainty is particularly challenging because
Table of Contents
ACCENTURE 2021 FORM 10-K Item 1A. Risk Factors 12

it may take some time for the effects and changes in demand patterns resulting from these and other factors to manifest themselves in our business and results of operations. Changing demand patterns from economic and political volatility and uncertainty, including as a result of the COVID-19 pandemic, changes in global trade policies, increasing geopolitical tensions and trends such as populism and economic nationalism and their impact on us, our clients and the industries we serve, could continue to have a significant negative impact on our results of operations.
Our business depends on generating and maintaining ongoing, profitable client demand for our services and solutions, including through the adaptation and expansion of our services and solutions in response to ongoing changes in technology and offerings, and a significant reduction in such demand or an inability to respond to the evolving technological environment could materially affect our results of operations. Our revenue and profitability depend on the demand for our services and solutions with favorable margins, which could be negatively affected by numerous factors, many of which are beyond our control and unrelated to our work product. As described above, volatile, negative or uncertain global economic and political conditions and lower growth or contraction in the markets we serve have adversely affected and could in the future adversely affect client demand for our services and solutions. Our success depends, in part, on our ability to continue to develop and implement services and solutions that anticipate and respond to rapid and continuing changes in technology and offerings to serve the evolving needs of our clients. Examples of areas of significant change include digital-, cloud- and security-related offerings, which are continually evolving, as well as developments in areas such as artificial intelligence, augmented reality, automation, blockchain, Internet of Things, quantum and Edge computing, infrastructure and network engineering, intelligent connected products, digital engineering and manufacturing, and as-a-service solutions. As we expand our services and solutions into these new areas, we may be exposed to operational, legal, regulatory, ethical, technological and other risks specific to such new areas, which may negatively affect our reputation and demand for our services and solutions.
Technological developments may materially affect the cost and use of technology by our clients and, in the case of cloud and as-a-service solutions, could affect the nature of how we generate revenue. Some of these technological developments have reduced and replaced some of our historical services and solutions and may continue to do so in the future. This has caused, and may in the future cause, clients to delay spending under existing contracts and engagements and to delay entering into new contracts while they evaluate new technologies. Such technological developments and spending delays can negatively impact our results of operations if we are unable to introduce new pricing or commercial models that reflect the value of these technological developments or if the pace and level of spending on new technologies are not sufficient to make up any shortfall.
Developments in the industries we serve, which may be rapid, also could shift demand to new services and solutions. If, as a result of new technologies or changes in the industries we serve, our clients demand new services and solutions, we may be less competitive in these new areas or need to make significant investment to meet that demand. Our growth strategy focuses on responding to these types of developments by driving innovation that will enable us to expand our business into new growth areas. If we do not sufficiently invest in new technology and adapt to industry developments, or evolve and expand our business at sufficient speed and scale, or if we do not make the right strategic investments to respond to these developments and successfully drive innovation, our services and solutions, our results of operations, and our ability to develop and maintain a competitive advantage and to execute on our growth strategy could be adversely affected.
We operate in a rapidly evolving environment in which there currently are, and we expect will continue to be, new technology entrants. New services or technologies offered by competitors or new entrants may make our offerings less differentiated or less competitive when compared to other alternatives, which may adversely affect our results of operations. In addition, companies in the industries we serve sometimes seek to achieve economies of scale and other synergies by combining with or acquiring other companies. If one of our current clients merges or consolidates with a company that relies on another provider for the services and solutions we offer, we may lose work from that client or lose the opportunity to gain additional work if we are not successful in generating new opportunities from the merger or consolidation. In a particular geographic market, service or industry group, a small number of clients have contributed, or may, in the future contribute, a significant portion of the revenues of such geographic market, service or industry group, and any decision by such a client to delay, reduce, or eliminate spending on our services and solutions could have a disproportionate impact on the results of operations in the relevant geographic market, service or industry group.
Many of our consulting contracts are less than 12 months in duration, and these contracts typically permit a client to terminate the agreement with as little as 30 days’ notice. Longer-term, larger and more complex contracts, such as the majority of our outsourcing contracts, generally require a longer notice period for termination and often include an early termination charge to be paid to us, but this charge might not be sufficient to cover our costs or make up for anticipated ongoing revenues and profits lost upon termination of the contract. Many of our contracts allow clients to terminate, delay, reduce or eliminate spending on the services and solutions we provide. Additionally, a client could choose not to retain us for additional stages of a project, try to renegotiate the terms of its contract or cancel or delay additional planned work. When contracts are terminated or not renewed, we lose the anticipated revenues, and it may take significant time to replace the
Table of Contents
ACCENTURE 2021 FORM 10-K Item 1A. Risk Factors 13
level of revenues lost. Consequently, our results of operations in subsequent periods could be materially lower than expected. The specific business or financial condition of a client, changes in management and changes in a client’s strategy are also all factors that can result in terminations, cancellations or delays.
If we are unable to keep our supply of skills and resources in balance with client demand around the world and attract and retain professionals with strong leadership skills, our business, the utilization rate of our professionals and our results of operations may be materially adversely affected. Our success is dependent, in large part, on our ability to keep our supply of market-leading skills and capabilities in balance with client demand around the world and our ability to attract and retain personnel with the knowledge and skills to lead our business globally. We must hire or reskill, retain and motivate appropriate numbers of talented people with diverse skills in order to serve clients across the globe, respond quickly to rapid and ongoing changes in demand, technology, industry and the macroeconomic environment, and continuously innovate to grow our business. For example, if we are unable to hire or retrain our employees to keep pace with the rapid and continuous changes in technology and the industries we serve, we may not be able to innovate and deliver new services and solutions to fulfill client demand. There is competition for scarce talent with market-leading skills and capabilities in new technologies, and our competitors have directly targeted our employees with these highly sought-after skills and will likely continue to do so. As a result, we may be unable to cost-effectively hire and retain employees with these market-leading skills, which may cause us to incur increased costs, or be unable to fulfill client demand for our services and solutions.
We are particularly dependent on retaining members of Accenture Leadership with critical capabilities. If we are unable to do so, our ability to innovate, generate new business opportunities and effectively lead large and complex transformations and client relationships could be jeopardized. We depend on identifying, developing and retaining top talent to innovate and lead our businesses. This includes developing talent and leadership capabilities in emerging markets, where the depth of skilled employees may be limited. Our ability to expand in our key markets depends, in large part, on our ability to attract, develop, retain and integrate both leaders for the local business and people with critical capabilities.
Similarly, our profitability depends on our ability to effectively source and staff people with the right mix of skills and experience to perform services for our clients, including our ability to transition employees to new assignments on a timely basis. The costs associated with recruiting and training employees are significant. If we are unable to effectively deploy our employees globally and remotely on a timely basis to fulfill the needs of our clients, our profitability could suffer. If our utilization rate is too low, our profitability and the engagement of our employees could suffer. If the utilization rate of our professionals is too high, it could have an adverse effect on employee engagement and attrition, the quality of the work performed as well as our ability to staff projects.
Our equity-based incentive compensation plans are designed to reward high-performing individuals for their contributions and provide incentives for them to remain with us. If the anticipated value of such incentives does not materialize because of volatility or lack of positive performance in our stock price, or if our total compensation package is not viewed as being competitive, our ability to attract and retain the personnel we need could be adversely affected. In addition, if we do not obtain the shareholder approval needed to continue granting equity awards under our share plans in the amounts we believe are necessary, our ability to attract and retain personnel could be negatively affected.
There is a risk that at certain points in time, we may have more personnel than we need in certain skill sets or geographies or at compensation levels that are not aligned with skill sets. In these situations, we have engaged, and may in the future engage, in actions to rebalance our resources, including reducing the rate of new hires and increasing involuntary terminations as a means to keep our supply of skills and resources in balance with client demand. At certain times and in certain geographical regions, we will find it difficult to hire and retain a sufficient number of employees with the skills or backgrounds to meet current and/or future demand. In these cases, we might need to redeploy existing personnel or increase our reliance on subcontractors to fill certain labor needs, and if not done effectively, our profitability could be negatively impacted. Additionally, as demand for our services and solutions has escalated at a high rate, to hire and retain people with the skills necessary to meet demand we have and may continue to adjust compensation, which puts upward pressure on our costs and may adversely affect our profitability if we are unable to recover these increased costs. If we are not successful in these initiatives, our results of operations could be adversely affected.
We face legal, reputational and financial risks from any failure to protect client and/or Accenture data from security incidents or cyberattacks. We are dependent on information technology networks and systems to securely process, transmit and store electronic information and to communicate among our locations around the world and with our people, clients, alliance partners and vendors. As the breadth and complexity of this infrastructure continues to grow, including as a result of the increasing reliance on, and use of, mobile technologies, social media and cloud-based services, and as more of our employees are working remotely during the coronavirus pandemic, the risk of security incidents and cyberattacks has increased. Such incidents could lead to shutdowns or disruptions of or damage to our systems and those of our clients, alliance partners and
Table of Contents
ACCENTURE 2021 FORM 10-K Item 1A. Risk Factors 14

vendors, and unauthorized disclosure of sensitive or confidential information, including personal data and proprietary business information. In the past, we have experienced, and in the future, we may again experience, data security incidents resulting from unauthorized access to our and our service providers’ systems and unauthorized acquisition of our data and our clients’ data including: inadvertent disclosure, misconfiguration of systems, phishing ransomware or malware attacks. For example, as previously reported, during the fourth quarter of fiscal 2021, we identified irregular activity in one of our environments, which included the extraction of proprietary information by a third party, some of which was made available to the public by the third party. In addition, our clients have experienced, and may in the future experience, breaches of systems and cloud-based services enabled by or provided by us. To date these incidents have not had a material impact on our or our clients’ operations; however, there is no assurance that such impacts will not be material in the future, and such incidents have in the past and may in the future have the impacts discussed below.
In providing services and solutions to clients, we often manage, utilize and store sensitive or confidential client or Accenture data, including personal data and proprietary information, and we expect these activities to increase, including through the use of artificial intelligence, the Internet of Things and analytics. Unauthorized disclosure of, denial of access to, or other incidents involving sensitive or confidential client, vendor, alliance partner or Accenture data, whether through systems failure, employee negligence, fraud, misappropriation, or cybersecurity, ransomware or malware attacks, or other intentional or unintentional acts, could damage our reputation and our competitive positioning in the marketplace, disrupt our or our clients’ business, cause us to lose clients and result in significant financial exposure and legal liability. Similarly, unauthorized access to or through, denial of access to, or other incidents involving, our software and IT supply chain or software-as-a-service providers, our or our service providers’ information systems or those we develop for our clients, whether by our employees or third parties, including a cyberattack by computer programmers, hackers, members of organized crime and/or state-sponsored organizations, who continuously develop and deploy viruses, ransomware, malware or other malicious software programs or social engineering attacks, has and could in the future result in negative publicity, significant remediation costs, legal liability, damage to our reputation and government sanctions and could have a material adverse effect on our results of operations — see risk factor below entitled “Our business could be materially adversely affected if we incur legal liability.” Cybersecurity threats are constantly expanding and evolving, becoming increasingly sophisticated and complex, increasing the difficulty of detecting and defending against them and maintaining effective security measures and protocols.
We are subject to numerous laws and regulations designed to protect this information, such as the European Union’s General Data Protection Regulation (“GDPR”), the United Kingdom’s GDPR, the California Consumer Privacy Act (and its successor the California Privacy Rights Act that will go into effect on January 1, 2023), as well as various other U.S. federal and state laws governing the protection of privacy, health or other personally identifiable information and data privacy and cybersecurity laws in other regions. These laws and regulations continue to evolve, are increasing in complexity and number and increasingly conflict among the various countries in which we operate, which has resulted in greater compliance risk and cost for us. Various privacy laws impose compliance obligations regarding the handling of personal data, including the cross-border transfer of data, and significant financial penalties for noncompliance. For example, failure to comply with the GDPR may lead to regulatory enforcement actions, which can result in monetary penalties of up to 4% of worldwide revenue, orders to discontinue certain data processing operations, civil lawsuits, or reputational damage. If any person, including any of our employees, negligently disregards or intentionally breaches our established controls with respect to client, third-party or Accenture data, or otherwise mismanages or misappropriates that data, we could be subject to significant litigation, monetary damages, regulatory enforcement actions, fines and/or criminal prosecution in one or more jurisdictions. These monetary damages might not be subject to a contractual limit of liability or an exclusion of consequential or indirect damages and could be significant. In addition, our liability insurance, which includes cyber insurance, might not be sufficient in type or amount to cover us against claims related to security incidents, cyberattacks and other related incidents.
The markets in which we operate are highly competitive, and we might not be able to compete effectively. The markets in which we offer our services and solutions are highly competitive. Our competitors include:
• large multinational IT service providers, including the services arms of large global technology providers;
• off-shore IT service providers in lower-cost locations, particularly in India;
• accounting firms and consultancies that provide consulting and other IT services and solutions;
• solution or service providers that compete with us in a specific geographic market, industry or service area, including advertising agencies, engineering services providers and technology start-ups and other companies that can scale rapidly to focus on or disrupt certain markets and provide new or alternative products, services or delivery models; and
• in-house IT departments of large corporations that use their own resources, rather than engage an outside firm.
Some competitors may have greater financial, marketing or other resources than we do and, therefore, may be better able to compete for new work and skilled professionals, may be able to innovate and provide new services and solutions faster than
Table of Contents
ACCENTURE 2021 FORM 10-K Item 1A. Risk Factors 15

we can or may be able to anticipate the need for services and solutions before we do. Our competitors may also team together to create competing offerings.
Even if we have potential offerings that address marketplace or client needs, competitors may be more successful at selling similar services they offer, including to companies that are our clients. Some competitors are more established in certain markets, and may make executing our growth strategy to expand in these markets more challenging. Additionally, competitors may also offer more aggressive contractual terms, which may affect our ability to win work. Our future performance is largely dependent on our ability to compete successfully and expand in the markets we currently serve. If we are unable to compete successfully, we could lose market share and clients to competitors, which could materially adversely affect our results of operations.
In addition, we may face greater competition due to consolidation of companies in the technology sector through strategic mergers, acquisitions or teaming arrangements. Consolidation activity may result in new competitors with greater scale, a broader footprint or offerings that are more attractive than ours. The technology companies described above, including many of our alliance partners, are increasingly able to offer services related to their software, platform, cloud migration and other solutions, or are developing software, platform, cloud migration and other solutions that require integration services to a lesser extent. These more integrated services and solutions may represent more attractive alternatives to clients than some of our services and solutions, which may materially adversely affect our competitive position and our results of operations.
Our ability to attract and retain business and employees may depend on our reputation in the marketplace.We believe the Accenture brand name and our reputation are important corporate assets that help distinguish our services and solutions from those of competitors and also contribute to our efforts to recruit and retain talented employees. However, our corporate reputation is susceptible to material damage by events such as disputes with clients or competitors, cybersecurity incidents or service outages, internal control deficiencies, delivery failures, compliance violations, government investigations or legal proceedings. We may also experience reputational damage from employees, advocacy groups, regulators, investors and other stakeholders that disagree with the services and solutions that we offer, or the clients that we serve. Similarly, our reputation could be damaged by actions or statements of current or former clients, directors, employees, competitors, vendors, alliance partners, joint venture partners, adversaries in legal proceedings, legislators or government regulators, as well as members of the investment community or the media, including social media influencers.
Our brand and reputation are also associated with our public commitments to various corporate environmental, social and governance (ESG) initiatives, including our goals for sustainability and inclusion and diversity. Our disclosures on these matters and any failure to achieve our commitments, could harm our reputation and adversely affect our client relationships or our recruitment and retention efforts. In addition, positions we take or do not take on social issues may be unpopular with some of our employees or with our clients or potential clients, which may in the future impact our ability to attract or retain employees or clients. We also may choose not to conduct business with potential clients or discontinue or not expand business with existing clients due to these positions.
There is a risk that negative or inaccurate information about Accenture, even if based on rumor or misunderstanding, could adversely affect our business. Damage to our reputation could be difficult, expensive and time-consuming to repair, could make potential or existing clients reluctant to select us for new engagements or could negatively impact our relationships with alliance partners, resulting in a loss of business, and could adversely affect our recruitment and retention efforts. Damage to our reputation could also reduce the value and effectiveness of the Accenture brand name and could reduce investor confidence in us, materially adversely affecting our share price.
If we do not successfully manage and develop our relationships with key alliance partners or if we fail to anticipate and establish new alliances in new technologies, our results of operations could be adversely affected.We have alliances with companies whose capabilities complement our own. A very significant portion of our revenue and services and solutions are based on technology or software provided by a few major alliance partners. See “Business—Services.”
The business that we conduct through these alliances could decrease or fail to grow for a variety of reasons. The priorities and objectives of our alliance partners may differ from ours, and our alliance partners are not prohibited from competing with us or forming closer or preferred arrangements with our competitors. In addition, some of our alliance partners are also large clients or suppliers of technology to us. The decisions we make vis-à-vis an alliance partner may impact our ongoing alliance relationship. In addition, our alliance partners could experience reduced demand for their technology or software, including, for example, in response to changes in technology, which could lessen related demand for our services and solutions.
We must anticipate and respond to continuous changes in technology and develop alliance relationships with new providers of relevant technology. We must secure meaningful alliances with these providers early in their life cycle so that we can develop the right number of certified people with skills in new technologies. If we are unable to maintain our relationships with
Table of Contents
ACCENTURE 2021 FORM 10-K Item 1A. Risk Factors 16

current partners and identify new and emerging providers of relevant technology to expand our network of alliance partners, we may not be able to differentiate our services or compete effectively in the market.
If we do not obtain the expected benefits from our alliance relationships for any reason, we may be less competitive, our ability to offer attractive solutions to our clients may be negatively affected, and our results of operations could be adversely affected.
Financial RisksOur profitability could materially suffer if we are unable to obtain favorable pricing for our services and solutions, if we are unable to remain competitive, if our cost-management strategies are unsuccessful or if we experience delivery inefficiencies or fail to satisfy certain agreed-upon targets or specific service levels. Our profitability is highly dependent on a variety of factors and could be materially impacted by any of the following:
Our results of operations could materially suffer if we are not able to obtain sufficient pricing to meet our profitability expectations. If we are not able to obtain favorable pricing for our services and solutions, our revenues and profitability could materially suffer. The rates we are able to charge for our services and solutions are affected by a number of factors, including:
• general economic and political conditions;
• our clients’ desire to reduce their costs;
• the competitive environment in our industry;
• our ability to accurately estimate our service delivery costs, upon which our pricing is sometimes determined, including our ability to estimate the impact of inflation and foreign exchange on our service delivery costs over long-term contracts; and
• the procurement practices of clients and their use of third-party advisors.
Our profitability could suffer if we are not able to remain competitive. The competitive environment in our industry affects our ability to secure new contracts at our target economics in a number of ways, any of which could have a material negative impact on our results of operations. The less we are able to differentiate our services and solutions and/or clearly convey the value of our services and solutions, the more risk we have in winning new work in sufficient volumes and at our target pricing and overall economics. In addition, the introduction of new services or products by competitors could reduce our ability to obtain favorable pricing and impact our overall economics for the services or solutions we offer. Competitors may be willing, at times, to take on more risk or price contracts lower than us in an effort to enter the market or increase market share.
Our profitability could suffer if our cost-management strategies are unsuccessful, and we may not be able to improve our profitability. Our ability to improve or maintain our profitability is dependent on our being able to successfully manage our costs, including taking actions to reduce certain costs. Our cost management strategies include maintaining appropriate alignment between the demand for our services and solutions and the workforce needed to deliver them. If we are not effective in managing our operating costs in response to changes in demand or pricing, or if we are unable to cost-effectively hire and retain personnel with the knowledge and skills necessary to deliver our services and solutions, particularly in areas of new technologies and offerings and in the right geographic locations, we may incur increased costs, which could reduce our ability to continue to invest in our business in an amount necessary to achieve our planned rates of growth and our desired levels of profitability.
If we do not accurately anticipate the cost, risk and complexity of performing our work or if third parties upon whom we rely do not meet their commitments, then our contracts could have delivery inefficiencies and be less profitable than expected or unprofitable. Our contract profitability is highly dependent on our forecasts regarding the effort and cost necessary to deliver our services and solutions, which are based on available data and could turn out to be materially inaccurate. If we do not accurately estimate the effort, costs or timing for meeting our contractual commitments and/or completing engagements to a client’s satisfaction, our contracts could yield lower profit margins than planned or be unprofitable. Moreover, many of our contracts include clauses that tie our ultimate compensation to the achievement of agreed-upon performance standards or milestones. If we fail to satisfy these measures, it could significantly reduce or eliminate our fees under the contracts, increase the cost to us of meeting performance standards or milestones, delay expected payments or subject us to potential damage claims under the contract terms, any of which could significantly affect our profitability. We also have a number of contracts in which a portion of our compensation depends on performance measures such as cost-savings, revenue enhancement, benefits produced, business goals attained and adherence to schedule. These goals can be complex and may depend on our clients’ actual levels of business activity or may be based on
Table of Contents
ACCENTURE 2021 FORM 10-K Item 1A. Risk Factors 17

assumptions that are later determined not to be achievable or accurate and could negatively impact our profit margins if not achieved. Similarly, if we experience unanticipated delivery difficulties due to our management, the failure of third parties or our clients to meet their commitments, or for any other reason, our contracts could yield lower profit margins than planned or be unprofitable. We are increasingly entering into contracts for large, complex client engagements to transform our clients’ businesses. These deals may involve transforming a client’s business, transitioning it to the cloud and updating their technology, while operating portions of their business, all in a compressed timeframe. The scale and complexity of these compressed transformational projects present risks in execution. In particular, large and complex arrangements often require that we utilize subcontractors or that our services and solutions incorporate or coordinate with the software, systems or infrastructure requirements of other vendors and service providers, including companies with which we have alliances. Our profitability depends on the ability of these subcontractors, vendors and service providers to deliver their products and services in a timely manner and in accordance with the project requirements, as well as on our effective oversight of their performance. In some cases, these subcontractors are small firms, and they might not have the resources or experience to successfully integrate their services or products with large-scale engagements or enterprises. Some of this work involves new technologies, which may not work as intended or may take more effort to implement than initially predicted. In addition, certain client work requires the use of unique and complex structures and alliances, some of which require us to assume responsibility for the performance of third parties whom we do not control. Any of these factors could adversely affect our ability to perform and subject us to additional liabilities, which could have a material adverse effect on our relationships with clients and on our results of operations.
Changes in our level of taxes, as well as audits, investigations and tax proceedings, or changes in tax laws or in their interpretation or enforcement, could have a material adverse effect on our effective tax rate, results of operations, cash flows and financial condition. We are subject to taxes in numerous jurisdictions. We calculate and provide for taxes in each tax jurisdiction in which we operate. Tax accounting often involves complex matters and requires our judgment to determine our worldwide provision for income taxes and other tax liabilities. We are subject to ongoing audits, investigations and tax proceedings in various jurisdictions. Tax authorities have disagreed, and may in the future disagree, with our judgments, and are taking increasingly aggressive positions opposing the judgments we make, including with respect to our intercompany transactions. We regularly assess the likely outcomes of our audits, investigations and tax proceedings to determine the appropriateness of our tax liabilities. However, our judgments might not be sustained as a result of these audits, investigations and tax proceedings, and the amounts ultimately paid could be materially different from the amounts previously recorded.
In addition, our effective tax rate in the future could be adversely affected by challenges to our intercompany transactions, changes in the valuation of deferred tax assets and liabilities, changes in tax laws or in their interpretation or enforcement, changes in the mix of earnings in countries with differing statutory tax rates, the expiration of current tax benefits, and changes in accounting principles, including the U.S. generally accepted accounting principles. Tax rates and policies in the jurisdictions in which we operate may change materially as a result of shifting economic, social and political conditions. In addition, changes in tax laws, treaties or regulations, or their interpretation or enforcement, have become more unpredictable and may become more stringent, which could materially adversely affect our tax position. A number of countries where we do business, including the United States and many countries in the European Union, have implemented, and are considering implementing, changes in relevant tax, accounting and other laws, regulations and interpretations.
The overall tax environment remains highly uncertain and increasingly complex. The European Commission has been conducting investigations, focusing on whether local country tax rulings or tax legislation provides preferential tax treatment that violates European Union state aid rules. Countries around the world are also considering changes in their tax laws and regulations. In the U.S., various proposals to raise corporate income taxes are under active consideration. Individual countries across the globe and the European Union have either enacted or plan to enact digital taxes to impose incremental taxes on companies based on where ultimate users are located. The Organization for Economic Co-operation and Development (“OECD”), a global coalition of member countries, proposed a two-pillar plan to reform international taxation. The proposals aim to ensure a fairer distribution of profits among countries and to impose a floor on tax competition through the introduction of a global minimum tax. There remains significant uncertainty around whether the various proposals will ultimately be enacted and, if enacted, the extent of their impact. Some of the proposals, if enacted, could have a material adverse effect on our effective tax rate, results of operations, cash flows and financial condition.
Although we expect to be able to rely on the tax treaty between the United States and Ireland, legislative or diplomatic action could be taken, or the treaty may be amended in such a way, that would prevent us from being able to rely on such treaty. Our inability to rely on the treaty would subject us to increased taxation or significant additional expense. In addition, congressional proposals could change the definition of a U.S. person for U.S. federal income tax purposes, which could also subject us to increased taxation. In addition, we could be materially adversely affected by future changes in tax law or policy (or in their interpretation or enforcement) in Ireland or other jurisdictions where we operate, including their treaties with Ireland or the United States. These changes could be exacerbated by economic, budget or other challenges facing Ireland or these other jurisdictions as a result of the ongoing COVID-19 pandemic, environmental or social concerns, or other matters.
Table of Contents
ACCENTURE 2021 FORM 10-K Item 1A. Risk Factors 18

Our results of operations could be materially adversely affected by fluctuations in foreign currency exchange rates. Although we report our results of operations in U.S. dollars, a majority of our revenues is denominated in currencies other than the U.S. dollar. Unfavorable fluctuations in foreign currency exchange rates have had an adverse effect, and could in the future have a material adverse effect, on our results of operations.
Because our consolidated financial statements are presented in U.S. dollars, we must translate revenues, expenses and income, as well as assets and liabilities, into U.S. dollars at exchange rates in effect during or at the end of each reporting period. Therefore, changes in the value of the U.S. dollar against other currencies will affect our revenues, operating income and the value of balance-sheet items, including intercompany payables and receivables, originally denominated in other currencies. These changes cause our growth stated in U.S. dollars to be higher or lower than our growth in local currency when compared against other periods. Our currency hedging programs, which are designed to partially offset the impact on consolidated earnings related to the changes in value of certain balance sheet items, might not be successful. Additionally, some transactions and balances may be denominated in currencies for which there is no available market to hedge.
As we continue to leverage our global delivery model, more of our expenses are incurred in currencies other than those in which we bill for the related services. An increase in the value of certain currencies, such as the Indian rupee or Philippine peso, against the currencies in which our revenue is recorded could increase costs for delivery of services at off-shore sites by increasing labor and other costs that are denominated in local currency. Our contractual provisions or cost management efforts might not be able to offset their impact, and our currency hedging activities, which are designed to partially offset this impact, might not be successful. This could result in a decrease in the profitability of our contracts that are utilizing delivery center resources. In addition, our currency hedging activities are themselves subject to risk. These include risks related to counterparty performance under hedging contracts, risks related to ineffective hedges and risks related to currency fluctuations. We also face risks that extreme economic conditions, political instability, or hostilities or disasters of the type described below could impact or perhaps eliminate the underlying exposures that we are hedging. Such an event could lead to losses being recognized on the currency hedges then in place that are not offset by anticipated changes in the underlying hedged exposure.
Changes to accounting standards or in the estimates and assumptions we make in connection with the preparation of our consolidated financial statements could adversely affect our financial results. Our financial statements have been prepared in accordance with U.S. generally accepted accounting principles. It is possible that changes in accounting standards could have a material adverse effect on our results of operations and financial position. The application of generally accepted accounting principles requires us to make estimates and assumptions about certain items and future events that affect our reported financial condition, and our accompanying disclosure with respect to, among other things, revenue recognition and income taxes. Our most critical accounting estimates are described in Management’s Discussion and Analysis of Financial Condition and Results of Operations under “Critical Accounting Policies and Estimates.” We base our estimates on historical experience, contractual commitments and various other assumptions that we believe to be reasonable under the circumstances and at the time they are made. These estimates and assumptions involve the use of judgment and are subject to significant uncertainties, some of which are beyond our control. If our estimates, or the assumptions underlying such estimates, are not correct, actual results may differ materially from our estimates, and we may need to, among other things, adjust revenues or accrue additional costs that could adversely affect our results of operations.
We might be unable to access additional capital on favorable terms or at all. If we raise equity capital, it may dilute our shareholders’ ownership interest in us. We might choose to raise additional funds through public or private debt or equity financings in order to:
• facilitate purchases, redemptions and exchanges of shares and pay dividends;
• acquire complementary businesses or technologies;
• take advantage of opportunities, including more rapid expansion;
• develop new services and solutions and respond to competitive pressures; and
• support general working capital purposes.
Any additional capital raised through the sale of equity would dilute shareholders’ ownership percentage in us. Furthermore, any additional financing or refinancing we need might not be available on terms favorable to us, or at all.
Table of Contents
ACCENTURE 2021 FORM 10-K Item 1A. Risk Factors 19

Operational RisksAs a result of our geographically diverse operations and our growth strategy to continue to expand in our key markets around the world, we are more susceptible to certain risks.We have offices and operations in more than 200 cities in 50 countries around the world. One aspect of our growth strategy is to continue to expand in our key markets around the world. Our growth strategy might not be successful. If we are unable to manage the risks of our global operations and growth strategy, including pandemics, international hostilities, terrorist activities, natural disasters, security or data incidents and the concentration of our global delivery capability in India and the Philippines, our results of operations and ability to grow could be materially adversely affected. In addition, emerging markets generally involve greater financial and operational risks, such as those described below, than our more mature markets. Negative or uncertain political climates in countries or geographies where we operate could also adversely affect us.
Pandemics, international hostilities, terrorist activities, natural disasters, and infrastructure disruptions could prevent us from effectively serving our clients and thus significantly adversely affect our results of operations. Health emergencies or pandemics, including COVID-19; acts of terrorist violence; political and social unrest; regional and international hostilities and international responses to these hostilities; natural disasters, volcanic eruptions, sea level rise, floods, droughts, wildfires and storms, occurrences of which may increase in frequency and severity as a result of climate change; or the threat of or perceived potential for these events; and other acts of god have had and could in the future have significantly negative impacts on us. These events could adversely affect our clients’ levels of business activity and precipitate sudden and significant changes in regional and global economic conditions and cycles. These events also pose significant risks to our people and to physical facilities and operations around the world, whether the facilities are ours or those of our alliance partners, suppliers or clients. By disrupting communications and travel and increasing the difficulty of obtaining and retaining highly skilled and qualified personnel, these types of events impact our ability to deliver our services and solutions to our clients. Extended disruptions of electricity, other public utilities or network or cloud services at our facilities or in the areas where our people are working remotely, as well as physical infrastructure damage to, system failures at, cyberattacks on, or security incidents involving, our facilities or systems, or those of our alliance partners, suppliers or clients, could also adversely affect our ability to conduct our business and serve our clients. If any of these circumstances occurs, we have a greater risk that interruptions in communications with our clients and other Accenture locations and personnel, and any down-time in important processes we operate for clients, could result in a material adverse effect on our results of operations and our reputation in the marketplace.
We are unable to protect our people, facilities and systems, and those of our alliance partners, suppliers and clients, against all such occurrences. Our business continuity and disaster recovery plans may not be effective, particularly if catastrophic events occur where large numbers of our people are located, or simultaneously affect our people in multiple locations around the world. We generally do not have insurance for losses and interruptions caused by terrorist attacks, conflicts and wars. If these disruptions prevent us from effectively serving our clients, our results of operations could be significantly adversely affected.
Our global delivery capability is concentrated in India and the Philippines, which has and may continue to expose us to operational risks. Our business model is dependent on our global delivery capability. While our delivery centers are located throughout the world, we have based large portions of our delivery capability in India and the Philippines, where we have the largest and second largest number of our people located, respectively. Concentrating our global delivery capability in these locations presents a number of operational risks, including those discussed in this risk factor, many of which are beyond our control and which have been and may in the future be exacerbated by COVID-19. For example, there was a considerable increase in new COVID-19 cases in India during the third quarter of fiscal 2021 and in the Philippines during the fourth quarter of fiscal 2021. Our ability to deliver services to our clients was not materially impacted as we initiated business continuity procedures and took actions to support our people and their families. However, pandemics are unpredictable and we might not be as successful in mitigating these operational risks in the future.
If we are unable to manage the organizational challenges associated with our size, we might be unable to achieve our business objectives.As of August 31, 2021, we had more than 624,000 employees worldwide. Our size and scale present significant management and organizational challenges. As our organization grows and evolves, it might become increasingly difficult to maintain effective standards across a large enterprise and effectively institutionalize our knowledge or to effectively change the strategy, operations or culture of our Company in a timely manner. It might also become more difficult to maintain our culture, effectively manage and monitor our personnel and operations and effectively communicate our core values, policies and procedures, strategies and goals, particularly given our world-wide operations, rate of new hires, and the significant percentage of our employees who have the option to work remotely or who have been required to work remotely because of COVID-19 pandemic related restrictions. The size and scope of our operations increase the possibility that we will have employees who engage in unlawful or fraudulent activity, or otherwise expose us to unacceptable business risks, despite our efforts to train them and maintain internal controls to prevent such instances. For example, employee misconduct could
Table of Contents
ACCENTURE 2021 FORM 10-K Item 1A. Risk Factors 20
involve the improper use of sensitive or confidential information entrusted to us, or obtained inappropriately, or the failure to comply with legislation or regulations regarding the protection of sensitive or confidential information, including personal data and proprietary information. Furthermore, the inappropriate use of social networking sites by our employees could result in breaches of confidentiality, unauthorized disclosure of non-public company information or damage to our reputation. If we do not continue to develop and implement the right processes and tools to manage our enterprise and instill our culture and core values into all of our employees, our ability to compete successfully and achieve our business objectives could be impaired. In addition, from time to time, we have made, and may continue to make, changes to our operating model, including how we are organized, as the needs and size of our business change, and if we do not successfully implement the changes, our business and results of operation may be negatively impacted.
We might not be successful at acquiring, investing in or integrating businesses, entering into joint ventures or divesting businesses.We expect to continue pursuing strategic acquisitions, investments and joint ventures to enhance or add to our skills and capabilities or offerings of services and solutions, or to enable us to expand in certain geographic and other markets. We have increased and may again in the future increase the amount of capital invested in such opportunities. These acquisitions and other transactions and investments involve challenges and risks, such as that we may not succeed in completing targeted transactions, including as a result of the market becoming increasingly competitive, or achieve desired results of operations.
Furthermore, we face risks in successfully integrating any businesses we might acquire, and these risks may be magnified by the size and number of transactions we have executed. Ongoing business may be disrupted, and our management’s attention may be diverted by acquisition, investment, transition or integration activities. In addition, we might need to dedicate additional management and other resources, and our organizational structure could make it difficult for us to efficiently integrate acquired businesses into our ongoing operations and assimilate and retain employees of those businesses into our culture and operations. The loss of key executives, employees, customers, suppliers, vendors and other business partners of businesses we acquire may adversely impact the value of the assets, operations or businesses. Furthermore, acquisitions or joint ventures may result in significant costs and expenses, including those related to retention payments, equity compensation, severance pay, early retirement costs, intangible asset amortization and asset impairment charges, enhancing controls, procedures and policies including those related to financial reporting, disclosure, and cyber and information security, assumed litigation and other liabilities, and legal, accounting and financial advisory fees, which could negatively affect our profitability as these costs and expenses grow along with the increased capital invested in such acquisitions and joint ventures. We may have difficulties as a result of entering into new markets where we have limited or no direct prior experience or where competitors may have stronger market positions.
We might fail to realize the expected benefits or strategic objectives of any acquisition, investment or joint venture we undertake. We might not achieve our expected return on investment or may lose money. We may be adversely impacted by liabilities that we assume from a company we acquire or in which we invest, including from that company’s known and unknown obligations, intellectual property or other assets, terminated employees, current or former clients or other third parties. In addition, we may fail to identify or adequately assess the magnitude of certain liabilities, shortcomings or other circumstances prior to acquiring, investing in or partnering with a company, including potential exposure to regulatory sanctions or liabilities resulting from an acquisition target’s previous activities, or from an acquisition’s controls related to financial reporting, disclosure, and cyber and information security environment. The number of transactions we execute annually may increase this risk. If any of these circumstances occurs, they could result in unexpected regulatory or legal exposure, including litigation with new or existing clients, unfavorable accounting treatment, unexpected increases in taxes or other adverse effects on our relationships with clients and our business. In addition, we have a lesser degree of control over the business operations of the joint ventures and businesses in which we have made minority investments or in which we have acquired less than 100% of the equity. This lesser degree of control may expose us to additional reputational, financial, legal, compliance or operational risks. Litigation, indemnification claims and other unforeseen claims and liabilities may arise from the acquisition or operation of acquired businesses. For example, we may face litigation or other claims as a result of certain terms and conditions of the acquisition agreement, such as earnout payments or closing working capital adjustments. Alternatively, shareholder litigation may arise as a result of proposed acquisitions. If we are unable to complete the number and kind of investments for which we plan, or if we are inefficient or unsuccessful at integrating acquired businesses into our operations, we may not be able to achieve our planned rates of growth or improve our market share, profitability or competitive position in specific markets or services.
We also periodically evaluate, and have engaged in, the disposition of assets and businesses. Divestitures could involve difficulties in the separation of operations, services, products and personnel, the diversion of management’s attention, the disruption of our business and the potential loss of key employees. After reaching an agreement with a buyer for the disposition of a business, the transaction may be subject to the satisfaction of pre-closing conditions, including obtaining necessary regulatory and government approvals, which, if not satisfied or obtained, may prevent us from completing the transaction. Divestitures may also involve continued financial involvement in or liability with respect to the divested assets and businesses, such as indemnities or other financial obligations, in which the performance of the divested assets or
Table of Contents
ACCENTURE 2021 FORM 10-K Item 1A. Risk Factors 21

businesses could impact our results of operations. Any divestiture we undertake could adversely affect our results of operations.
Legal and Regulatory RisksOur business could be materially adversely affected if we incur legal liability.We are subject to, and may become a party to, a variety of litigation or other claims and suits that arise from time to time in the ordinary course of our business. Our business is subject to the risk of litigation involving current and former employees, clients, alliance partners, subcontractors, suppliers, competitors, shareholders, government agencies or others through private actions, class actions, whistleblower claims, administrative proceedings, regulatory actions or other litigation. Regardless of the merits of the claims, the cost to defend current and future litigation may be significant, and such matters can be time-consuming and divert management’s attention and resources. The results of litigation and other legal proceedings are inherently uncertain, and adverse judgments or settlements in some or all of these legal disputes may result in materially adverse monetary damages, fines, penalties or injunctive relief against us. Any claims or litigation, even if fully indemnified or insured, could damage our reputation and make it more difficult to compete effectively or to obtain adequate insurance in the future.
We could be subject to significant legal liability and litigation expense if we fail to meet our contractual obligations, contribute to internal control or other deficiencies of a client or otherwise breach obligations to third parties, including clients, alliance partners, employees and former employees, and other parties with whom we conduct business, or if our subcontractors breach or dispute the terms of our agreements with them and impede our ability to meet our obligations to our clients. For example, by taking over the operation of certain portions of our clients’ businesses, including functions and systems that are critical to the core businesses of our clients, by contributing to the design, development and/or engineering of client products, or by providing various operational technology solutions, we may be exposed to additional and evolving operational, regulatory, reputational or other risks specific to these areas, including risks related to data security. A failure of a client’s system based on our services or solutions could also subject us to a claim for significant damages that could materially adversely affect our results of operations. In order to remain competitive, we increasingly enter into agreements based on our clients’ contract terms after conducting an assessment of the risk of doing so, which may expose us to additional risk. In addition, the contracting practices of competitors, along with the demands of increasingly sophisticated clients, may cause contract terms and conditions that are unfavorable to us to become new standards in the industry. We may commit to providing services or solutions that we are unable to deliver or whose delivery may reduce our profitability or cause us financial loss. If we cannot or do not meet our contractual obligations and if our potential liability is not adequately limited through the terms of our agreements, liability limitations are not enforced or a third party alleges fraud or other wrongdoing to prevent us from relying upon those contractual protections, we might face significant legal liability and litigation expense and our results of operations could be materially adversely affected. Moreover, as we expand our services and solutions into new areas, we may be exposed to additional and evolving risks specific to these new areas.
In addition, we engage in platform trust and safety services on behalf of clients, including content moderation, which could have a negative impact on our employees due to the nature of the materials they review. We have been subject to media coverage regarding our provision of these services as well as litigation related to the provision of these services, which may result in adverse judgments or settlements or government inquiries and investigations.
While we maintain insurance for certain potential liabilities, such insurance does not cover all types and amounts of potential liabilities and is subject to various exclusions as well as caps on amounts recoverable. Even if we believe a claim is covered by insurance, insurers may dispute our entitlement to recovery for a variety of potential reasons, which may affect the timing and, if they prevail, the amount of our recovery.
Our global operations expose us to numerous and sometimes conflicting legal and regulatory requirements, and violation of these regulations could harm our business.We are subject to numerous, and sometimes conflicting, legal regimes on matters as diverse as anticorruption, import/export controls, content requirements, trade restrictions, tariffs, taxation, sanctions, immigration, internal and disclosure control obligations, securities regulation, including ESG initiatives, anti-competition, anti-money-laundering, data privacy and protection, government compliance, wage-and-hour standards, employment and labor relations and human rights. The global nature of our operations, including emerging markets where legal systems may be less developed or understood by us, and the diverse nature of our operations across a number of regulated industries, further increase the difficulty of compliance. Compliance with diverse legal requirements is costly, time-consuming and requires significant resources. Violations of one or more of these regulations in the conduct of our business could result in significant fines, enforcement actions or criminal sanctions against us and/or our employees, prohibitions on doing business and damage to our reputation. Violations of these regulations in connection with the performance of our obligations to our clients also could result in liability for significant monetary damages, fines, enforcement actions and/or criminal prosecution or sanctions, unfavorable publicity and other reputational damage and restrictions on our ability to effectively carry out our contractual obligations and thereby expose us
Table of Contents
ACCENTURE 2021 FORM 10-K Item 1A. Risk Factors 22

to potential claims from our clients. Due to the varying degrees of development of the legal systems of the countries in which we operate, local laws may not be well developed or provide sufficiently clear guidance and may be insufficient to protect our rights.
In particular, in many parts of the world, including countries in which we operate and/or seek to expand, practices in the local business community might not conform to international business standards and could violate anticorruption laws, or regulations, including the U.S. Foreign Corrupt Practices Act and the U.K. Bribery Act 2010. Our employees, subcontractors, vendors, agents, alliance or joint venture partners, the companies we acquire and their employees, subcontractors, vendors and agents, and other third parties with which we associate, could take actions that violate policies or procedures designed to promote legal and regulatory compliance or applicable anticorruption laws or regulations. Violations of these laws or regulations by us, our employees or any of these third parties could subject us to criminal or civil enforcement actions (whether or not we participated or knew about the actions leading to the violations), including fines or penalties, disgorgement of profits and suspension or disqualification from work, including U.S. federal contracting, any of which could materially adversely affect our business, including our results of operations and our reputation.
Changes in laws and regulations could also mandate significant and costly changes to the way we implement our services and solutions or could impose additional taxes on our services and solutions. For example, changes in laws and regulations to limit using off-shore resources in connection with our work or to penalize companies that use off-shore resources, which have been proposed from time to time in various jurisdictions, could adversely affect our results of operations. Such changes may result in contracts being terminated or work being transferred onshore, resulting in greater costs to us, and could have a negative impact on our ability to obtain future work from government clients.
Our work with government clients exposes us to additional risks inherent in the government contracting environment.Our clients include national, provincial, state and local governmental entities. Our government work carries various risks inherent in the government contracting process. These risks include, but are not limited to, the following:
• Government entities, particularly in the United States, often reserve the right to audit our contract costs and conduct inquiries and investigations of our business practices and compliance with government contract requirements. U.S. government agencies, including the Defense Contract Audit Agency, routinely audit our contract costs, including allocated indirect costs, for compliance with the Cost Accounting Standards and the Federal Acquisition Regulation. These agencies also conduct reviews and investigations and make inquiries regarding our accounting, information technology and other systems in connection with our performance and business practices with respect to our government contracts. Negative findings from existing and future audits, investigations or inquiries, or failure to comply with applicable IT security or supply chain requirements, could affect our future sales and profitability by preventing us, by operation of law or in practice, from receiving new government contracts for some period of time. In addition, if the U.S. government concludes that certain costs are not reimbursable, have not been properly determined or are based on outdated estimates of our work, then we will not be allowed to bill for such costs, may have to refund money that has already been paid to us or could be required to retroactively and prospectively adjust previously agreed to billing or pricing rates for our work. Negative findings from existing and future audits of our business systems, including our accounting system, may result in the U.S. government preventing us from billing, at least temporarily, a percentage of our costs. As a result of prior negative findings in connection with audits, investigations and inquiries, we have from time to time experienced some of the adverse consequences described above and may in the future experience further adverse consequences, which could materially adversely affect our future results of operations.
• If a government client discovers improper or illegal activities in the course of audits or investigations, we may become subject to various civil and criminal penalties, including those under the civil U.S. False Claims Act, and administrative sanctions, which may include termination of contracts, forfeiture of profits, suspension of payments, fines and suspensions or debarment from doing business with other agencies of that government. The inherent limitations of internal controls may not prevent or detect all improper or illegal activities.
• U.S. government contracting regulations impose strict compliance and disclosure obligations. Disclosure is required if certain company personnel have knowledge of “credible evidence” of a violation of federal criminal laws involving fraud, conflict of interest, bribery or improper gratuity, a violation of the civil U.S. False Claims Act or receipt of a significant overpayment from the government. Failure to make required disclosures could be a basis for suspension and/or debarment from federal government contracting in addition to breach of the specific contract and could also impact contracting beyond the U.S. federal level. Reported matters also could lead to audits or investigations and other civil, criminal or administrative sanctions.
• Government contracts are subject to heightened reputational and contractual risks compared to contracts with commercial clients. For example, government contracts and the proceedings surrounding them are often subject to more extensive scrutiny and publicity. Negative publicity, including an allegation of improper or illegal activity, regardless of its accuracy, may adversely affect our reputation.
Table of Contents
ACCENTURE 2021 FORM 10-K Item 1A. Risk Factors 23

• Terms and conditions of government contracts also tend to be more onerous and are often more difficult to negotiate. For example, these contracts often contain high or unlimited liability for breaches and feature less favorable payment terms and sometimes require us to take on liability for the performance of third parties.
• Government entities typically fund projects through appropriated monies. While these projects are often planned and executed as multi-year projects, government entities usually reserve the right to change the scope of or terminate these projects for lack of approved funding and/or at their convenience. Changes in government or political developments, including budget deficits, shortfalls or uncertainties, government spending reductions or other debt constraints could result in our projects being reduced in price or scope or terminated altogether, which also could limit our recovery of incurred costs, reimbursable expenses and profits on work completed prior to the termination. Furthermore, if insufficient funding is appropriated to the government entity to cover termination costs, we may not be able to fully recover our investments.
• Political and economic factors such as pending elections, the outcome of recent elections, changes in leadership among key executive or legislative decision makers, revisions to governmental tax or other policies and reduced tax revenues can affect the number and terms of new government contracts signed or the speed at which new contracts are signed, decrease future levels of spending and authorizations for programs that we bid, shift spending priorities to programs in areas for which we do not provide services and/or lead to changes in enforcement or how compliance with relevant rules or laws is assessed.
• Our ability to work for the U.S. government is impacted by the fact that we are an Irish company. We elected to enter into a proxy agreement with the U.S. Department of Defense that enhances the ability of our U.S. federal government contracting subsidiary to perform certain work for the U.S. government. The proxy agreement regulates the management and operation of, and limits the control we can exercise over, this subsidiary. In addition, legislative and executive proposals remain under consideration or could be proposed in the future, which, if enacted, could place additional limitations on or even prohibit our eligibility to be awarded state or federal government contracts in the United States or could include requirements that would otherwise affect our results of operations. Various U.S. federal and state legislative proposals have been introduced and/or enacted in recent years that deny government contracts to certain U.S. companies that reincorporate or have reincorporated outside the United States. While Accenture was not a U.S. company that reincorporated outside the United States, it is possible that these contract bans and other legislative proposals could be applied in a way that negatively affects Accenture.
The occurrences or conditions described above could affect not only our business with the particular government entities involved, but also our business with other entities of the same or other governmental bodies or with certain commercial clients, and could have a material adverse effect on our business or our results of operations.
If we are unable to protect or enforce our intellectual property rights, or if our services or solutions infringe upon the intellectual property rights of others or we lose our ability to utilize the intellectual property of others, our business could be adversely affected. Our success depends, in part, upon our ability to obtain intellectual property protection for our proprietary platforms, methodologies, processes, software and other solutions. Existing laws of the various countries in which we provide services or solutions may offer only limited intellectual property protection of our services or solutions, and the protection in some countries may be very limited. We rely upon a combination of confidentiality policies and procedures, nondisclosure and other contractual arrangements, and patent, trade secret, copyright and trademark laws to protect our intellectual property rights. These laws are subject to change at any time and could further limit our ability to obtain or maintain intellectual property protection. There is uncertainty concerning the scope of patent and other intellectual property protection for software and business methods, which are fields in which we rely on intellectual property laws to protect our rights. Even where we obtain intellectual property protection, our intellectual property rights may not prevent or deter competitors, former employees, or other third parties from reverse engineering our solutions or proprietary methodologies and processes or independently developing services or solutions similar to or duplicative of ours. Further, the steps we take in this regard might not be adequate to prevent or deter infringement or other misappropriation of our intellectual property by competitors, former employees or other third parties, and we might not be able to detect unauthorized use of, or take appropriate and timely steps to enforce, our intellectual property rights. Enforcing our rights might also require considerable time, money and oversight, and we may not be successful in enforcing our rights.
In addition, we cannot be sure that our services and solutions, including, for example, our software solutions, or the solutions of others that we offer to our clients, do not infringe on the intellectual property rights of third parties (including competitors as well as non-practicing holders of intellectual property assets), and these third parties could claim that we or our clients are infringing upon their intellectual property rights. Furthermore, although we have established policies and procedures to respect the intellectual property rights of third parties and that prohibit the unauthorized use of intellectual property, we may not be aware if our employees have misappropriated and/or misused intellectual property, and their actions could result in claims of intellectual property misappropriation and/or infringement from third parties. These claims could harm our reputation, cause us to incur substantial costs or prevent us from offering some services or solutions in the future. Any related proceedings could require us to expend significant resources over an extended period of time. In most of our
Table of Contents
ACCENTURE 2021 FORM 10-K Item 1A. Risk Factors 24

contracts, we agree to indemnify our clients for expenses and liabilities resulting from claimed infringements of the intellectual property rights of third parties. In some instances, the amount of these indemnities could be greater than the revenues we receive from the client. Any claims or litigation in this area could be time-consuming and costly, damage our reputation and/or require us to incur additional costs to obtain the right to continue to offer a service or solution to our clients. If we cannot secure this right at all or on reasonable terms, or we are unable to implement in a cost-effective manner alternative technology, our results of operations could be materially adversely affected. The risk of infringement claims against us may increase as we expand our industry software solutions and continue to develop and license our software to multiple clients. Any infringement action brought against us or our clients could be costly to defend or lead to an expensive settlement or judgment against us.
Further, we rely on third-party software and other intellectual property in providing some of our services and solutions. If we lose our ability to continue using any such software or intellectual property for any reason, including because it is found to infringe the rights of others, we will need to obtain substitutes or seek alternative means of obtaining the technology necessary to continue to provide such services and solutions. Our inability to replace such software or intellectual property effectively or in a timely and cost-effective manner could materially adversely affect our results of operations.
Our results of operations and share price could be adversely affected if we are unable to maintain effective internal controls. The accuracy of our financial reporting is dependent on the effectiveness of our internal controls. We are required to provide a report from management to our shareholders on our internal control over financial reporting that includes an assessment of the effectiveness of these controls. Internal control over financial reporting has inherent limitations, including human error, the possibility that controls could be circumvented or become inadequate because of changed conditions, and fraud. Because of these inherent limitations, internal control over financial reporting might not prevent or detect all misstatements or fraud. If we cannot maintain and execute adequate internal control over financial reporting or implement required new or improved controls that provide reasonable assurance of the reliability of the financial reporting and preparation of our financial statements for external use, we could suffer harm to our reputation, incur incremental compliance costs, fail to meet our public reporting requirements on a timely basis, be unable to properly report on our business and our results of operations, or be required to restate our financial statements, and our results of operations, our share price and our ability to obtain new business could be materially adversely affected.
We are incorporated in Ireland and Irish law differs from the laws in effect in the United States and might afford less protection to our shareholders. We may also be subject to criticism and negative publicity related to our incorporation in Ireland.Irish law differs from the laws in effect in the United States and our shareholders could have more difficulty protecting their interests than would shareholders of a corporation incorporated in a jurisdiction of the United States. The United States currently does not have a treaty with Ireland providing for the reciprocal recognition and enforcement of judgments in civil and commercial matters. As such, there is some uncertainty as to whether the courts of Ireland would recognize or enforce judgments of U.S. courts obtained against us or our directors or officers based on U.S. federal or state civil liability laws, including the civil liability provisions of the U.S. federal or state securities laws, or hear actions against us or those persons based on those laws.
As an Irish company, we are governed by the Companies Act. The Companies Act differs in some significant, and possibly material, respects from laws applicable to U.S. corporations and shareholders under various state corporation laws, including the provisions relating to interested directors, mergers and acquisitions, takeovers, shareholder lawsuits and indemnification of directors.
Under Irish law, the duties of directors and officers of a company are generally owed to the company only. Shareholders of Irish companies do not generally have rights to take action against directors or officers of the company under Irish law, and may only do so in limited circumstances. Directors of an Irish company must, in exercising their powers and performing their duties, act with due care and skill, honestly and in good faith with a view to the best interests of the company. Directors have a duty not to put themselves in a position in which their duties to the company and their personal interests might conflict and also are under a duty to disclose any personal interest in any contract or arrangement with the company or any of its subsidiaries. If a director or officer of an Irish company is found to have breached his or her duties to that company, he or she could be held personally liable to the company in respect of that breach of duty.
Under Irish law, we must have authority from our shareholders to issue any shares, including shares that are part of the company’s authorized but unissued share capital. In addition, unless otherwise authorized by its shareholders, when an Irish company issues shares for cash to new shareholders, it is required first to offer those shares on the same or more favorable terms to existing shareholders on a pro-rata basis. If we are unable to obtain these authorizations from our shareholders, or are otherwise limited by the terms of our authorizations, our ability to issue shares under our equity compensation plans and, if applicable, to facilitate funding acquisitions or otherwise raise capital could be adversely affected.
Table of Contents
ACCENTURE 2021 FORM 10-K Item 1A. Risk Factors 25

Some companies that conduct substantial business in the United States but that have a parent domiciled in certain other jurisdictions have been criticized as improperly avoiding U.S. taxes or creating an unfair competitive advantage over U.S. companies. Accenture never conducted business under a U.S. parent company and pays U.S. taxes on all of its U.S. operations. Nonetheless, we could be subject to criticism in connection with our incorporation in Ireland.
Item 1B. Unresolved Staff Comments
None.
Item 2. Properties
We have major offices in the world’s leading business centers, including Boston, Chicago, New York, San Francisco, Dublin, Frankfurt, London, Madrid, Milan, Paris, Rome, Bangalore, Beijing, Manila, Mumbai, Sao Paolo, Shanghai, Singapore, Sydney and Tokyo, among others. In total, we have offices and operations in more than 200 cities in 50 countries around the world. We do not own any material real property. Substantially all of our office space is leased under long-term leases with varying expiration dates. We believe that our facilities are adequate to meet our needs in the near future.
Item 3. Legal Proceedings
The information set forth under “Legal Contingencies” in Note 15 (Commitments and Contingencies) to our Consolidated Financial Statements under Part II, Item 8, “Financial Statements and Supplementary Data,” is incorporated herein by reference.
Item 4. Mine Safety Disclosures
Not applicable.
Table of Contents
ACCENTURE 2021 FORM 10-K Item 1A. Risk Factors 26
Part IIItem 5. Market for Registrant’s Common Equity, Related Shareholder Matters and Issuer Purchases of Equity Securities
Accenture plc Class A ordinary shares are traded on the New York Stock Exchange under the symbol “ACN.” The New York Stock Exchange is the principal United States market for these shares. As of October 1, 2021, there were 350 holders of record of Accenture plc Class A ordinary shares.
There is no trading market for Accenture plc Class X ordinary shares. As of October 1, 2021, there were 15 holders of record of Accenture plc Class X ordinary shares.
DividendsFor information about our dividend activity during fiscal 2021, see Note 14 (Shareholders’ Equity) to our Consolidated Financial Statements under Item 8, “Financial Statements and Supplementary Data.”
On September 22, 2021, the Board of Directors of Accenture plc declared a quarterly cash dividend of $0.97 per share on our Class A ordinary shares for shareholders of record at the close of business on October 14, 2021, payable on November 15, 2021. For the remainder of fiscal 2022, we expect to declare additional quarterly dividends in December 2021 and March and June 2022, to be paid in February, May and August 2022, respectively, subject to the approval of the Board of Directors.
In certain circumstances, as an Irish tax resident company, we may be required to deduct Irish dividend withholding tax (“DWT”) (currently at the rate of 25%) from dividends paid to our shareholders. Shareholders resident in “relevant territories” (including countries that are European Union member states (other than Ireland), the United States and other countries with which Ireland has a tax treaty) may be exempted from Irish DWT. However, shareholders residing in other countries will generally be subject to Irish DWT.
Recent Sales of Unregistered SecuritiesNone.
Table of Contents
ACCENTURE 2021 FORM 10-K Part II 27

Purchases of Accenture plc Class A Ordinary SharesThe following table provides information relating to our purchases of Accenture plc Class A ordinary shares during the fourth quarter of fiscal 2021. For year-to-date information on all of our share purchases, redemptions and exchanges and further discussion of our share purchase activity, see “Management’s Discussion and Analysis of Financial Condition and Results of Operations—Liquidity and Capital Resources—Share Purchases and Redemptions.”
Period
Total Number ofShares
Purchased
AveragePrice Paid
per Share (1)
Total Number ofShares Purchased as
Part of PubliclyAnnounced Plans or
Programs (2)
Approximate Dollar Valueof Shares that May Yet Be
Purchased Under the Plans orPrograms (3)
(in millions of U.S. dollars)June 1, 2021 — June 30, 2021 1,178,674 $ 285.52 1,163,612 $ 3,847 July 1, 2021 — July 31, 2021 911,716 311.54 874,611 3,573 August 1, 2021 — August 31, 2021 896,540 325.97 876,889 3,286 Total (4) 2,986,930 $ 305.60 2,915,112
(1) Average price paid per share reflects the total cash outlay for the period, divided by the number of shares acquired, including those acquired by purchase or redemption for cash and any acquired by means of employee forfeiture.
(2) Since August 2001, the Board of Directors of Accenture plc has authorized and periodically confirmed a publicly announced open-market share purchase program for acquiring Accenture plc Class A ordinary shares. During the fourth quarter of fiscal 2021, we purchased 2,915,112 Accenture plc Class A ordinary shares under this program for an aggregate price of $891 million. The open-market purchase program does not have an expiration date.
(3) As of August 31, 2021, our aggregate available authorization for share purchases and redemptions was $3,286 million, which management has the discretion to use for either our publicly announced open-market share purchase program or our other share purchase programs. Since August 2001 and as of August 31, 2021, the Board of Directors of Accenture plc has authorized an aggregate of $40.1 billion for share purchases and redemptions by Accenture plc and Accenture Canada Holdings Inc. On September 22, 2021, the Board of Directors of Accenture plc approved $3,000 million in additional share repurchase authority, bringing Accenture’s total outstanding authority to $6,286 million.
(4) During the fourth quarter of fiscal 2021, Accenture purchased 71,818 Accenture plc Class A ordinary shares in transactions unrelated to publicly announced share plans or programs. These transactions consisted of acquisitions of Accenture plc Class A ordinary shares primarily via share withholding for payroll tax obligations due from employees and former employees in connection with the delivery of Accenture plc Class A ordinary shares under our various employee equity share plans. These purchases of shares in connection with employee share plans do not affect our aggregate available authorization for our publicly announced open-market share purchase and our other share purchase programs.
Item 6. [Reserved]
Table of Contents
ACCENTURE 2021 FORM 10-K Item 5. Market for Registrant’s Common Equity, Related Shareholder Matters and Issuer Purchases of Equity Securities 28

Item 7. Management’s Discussion and Analysis of Financial Condition and Results of Operations
The following discussion and analysis should be read in conjunction with our Consolidated Financial Statements and related Notes included elsewhere in this Annual Report on Form 10-K. This discussion and analysis also contains forward-looking statements and should also be read in conjunction with the disclosures and information contained in “Disclosure Regarding Forward-Looking Statements” and “Risk Factors” in this Annual Report on Form 10-K.
We use the terms “Accenture,” “we,” the “Company,” “our” and “us” in this report to refer to Accenture plc and its subsidiaries. All references to years, unless otherwise noted, refer to our fiscal year, which ends on August 31. For example, a reference to “fiscal 2021” means the 12-month period that ended on August 31, 2021. All references to quarters, unless otherwise noted, refer to the quarters of our fiscal year.
We use the term “in local currency” so that certain financial results may be viewed without the impact of foreign currency exchange rate fluctuations, thereby facilitating period-to-period comparisons of business performance. Financial results “in local currency” are calculated by restating current period activity into U.S. dollars using the comparable prior-year period’s foreign currency exchange rates. This approach is used for all results where the functional currency is not the U.S. dollar.
Overview Accenture plc is a leading global professional services company, providing a broad range of services in strategy and consulting, interactive, technology and operations. We serve clients in three geographic markets: North America, Europe and Growth Markets (Asia Pacific, Latin America, Africa and the Middle East). We help our clients build their digital core, transform their operations, and accelerate revenue growth—creating tangible value across their enterprises at speed and scale.
Highlights from fiscal 2021 compared with fiscal 2020 included:
• Revenues of $50.5 billion, representing 14% growth in U.S. dollars and 11% growth in local currency;
• New bookings of $59.3 billion, an increase of 20% in U.S. dollars;
• Operating margin of 15.1%, a 40 basis point expansion from fiscal 2020;
• R&D spend of $1.1 billion; and
• Cash returned to shareholders of $5.9 billion, including share purchases of $3.7 billion and dividends of $2.2 billion.
In fiscal 2021, the COVID-19 pandemic continued to impact our business operations and financial results. We saw strong demand across our business in the second half of the year as customers accelerated their digital transformation. Revenues for the second half of fiscal 2021 grew 22% in U.S. dollars and 18% in local currency compared to the same period in fiscal 2020.
Summary of Results Revenues for fiscal 2021 increased 14% in U.S. dollars and 11% in local currency compared to fiscal 2020. This included the impact of a decline in reimbursable travel costs, which reduced revenues approximately 1%. During fiscal 2021, revenue growth in local currency was very strong in North America and Growth Markets and strong in Europe. We experienced local currency revenue growth that was very strong in Health & Public Service, Communications, Media & Technology, Financial Services and Products and slight in Resources. Revenue growth in local currency was very strong in outsourcing and strong in consulting during fiscal 2021. The business environment remained competitive. In many areas, our pricing, which we define as the contract profitability or margin on the work that we sell, was lower.
In our consulting business, revenues for fiscal 2021 increased 13% in U.S. dollars and 9% in local currency compared to fiscal 2020. This included the impact of a decline in reimbursable travel costs, which reduced consulting revenues
Table of Contents
ACCENTURE 2021 FORM 10-K Item 7. Management's Discussion and Analysis of Financial Condition and Results of Operations 29

approximately 2%. Consulting revenue growth in local currency in fiscal 2021 was led by very strong growth in Growth Markets and strong growth in North America and Europe. Our consulting revenue continues to be driven by helping our clients accelerate their digital transformation, including moving to the cloud, embedding security across the enterprise and adopting new technologies. In addition, clients continue to be focused on initiatives designed to deliver cost savings and operational efficiency, as well as projects to accelerate growth and improve customer experiences.
In our outsourcing business, revenues for fiscal 2021 increased 15% in U.S. dollars and 13% in local currency compared to fiscal 2020. Outsourcing revenue growth in local currency in fiscal 2021 was led by very strong growth in North America and Growth Markets and strong growth in Europe. We continue to experience growing demand to assist clients with application modernization and maintenance, cloud enablement and managed security services. In addition, clients continue to be focused on transforming their operations through data and analytics, automation and artificial intelligence to drive productivity and operational cost savings.
As we are a global company, our revenues are denominated in multiple currencies and may be significantly affected by currency exchange rate fluctuations. The majority of our revenues are denominated in currencies other than the U.S. dollar, including the Euro, Japanese yen, and U.K. pound. There continues to be volatility in foreign currency exchange rates. Unfavorable fluctuations in foreign currency exchange rates have had and could in the future have a material effect on our financial results. If the U.S. dollar weakens against other currencies, resulting in favorable currency translation, our revenues, revenue growth and results of operations in U.S. dollars may be higher. If the U.S. dollar strengthens against other currencies, resulting in unfavorable currency translation, our revenues, revenue growth and results of operations in U.S. dollars may be lower. The U.S. dollar weakened against various currencies during fiscal 2021, resulting in favorable currency translation and U.S. dollar revenue growth that was approximately 3% higher than our revenue growth in local currency for the year. Assuming that exchange rates stay within recent ranges, we estimate that our fiscal 2022 revenue growth in U.S. dollars will be approximately 0.5% lower than our revenue growth in local currency.
The primary categories of operating expenses include Cost of services, Sales and marketing and General and administrative costs. Cost of services is primarily driven by the cost of client-service personnel, which consists mainly of compensation, subcontractor and other personnel costs, and non-payroll costs on outsourcing contracts. Cost of services includes a variety of activities such as: contract delivery; recruiting and training; software development; and integration of acquisitions. Sales and marketing costs are driven primarily by: compensation costs for business development activities; marketing- and advertising-related activities; and certain acquisition-related costs. General and administrative costs primarily include costs for non-client-facing personnel, information systems, office space and certain acquisition-related costs.
Utilization for fiscal 2021 was 93%, up from 90% in fiscal 2020. We hire to meet current and projected future demand. We proactively plan and manage the size and composition of our workforce and take actions as needed to address changes in the anticipated demand for our services and solutions, given that compensation costs are the most significant portion of our operating expenses. Our workforce, the majority of which serves our clients, increased to approximately 624,000 as of August 31, 2021, compared to 506,000 as of August 31, 2020. The year-over-year increase in our workforce reflects an overall increase in demand for our services and solutions, as well as people added in connection with acquisitions. For fiscal 2021, attrition, excluding involuntary terminations, was 14%, up from 12% in fiscal 2020. For the fourth quarter of fiscal 2021, annualized attrition, excluding involuntary terminations, was 19%, up from 17% in the third quarter of fiscal 2021. We evaluate voluntary attrition, adjust levels of new hiring and use involuntary terminations as means to keep our supply of skills and resources in balance with changes in client demand. In addition, we adjust compensation in certain skill sets and geographies in order to attract and retain appropriate numbers of qualified employees. For the majority of our personnel, compensation increases become effective December 1st of each fiscal year. We strive to adjust pricing and/or the mix of people to reduce the impact of compensation increases on our margin. Our ability to grow our revenues and maintain or increase our margin could be adversely affected if we are unable to: keep our supply of skills and resources in balance with changes in the types or amounts of services and solutions clients are demanding; recover increases in compensation; deploy our employees globally on a timely basis; manage attrition; and/or effectively assimilate and utilize new employees.
Gross margin (Revenues less Cost of services as a percentage of Revenues) for fiscal 2021 was 32.4%, compared with 31.5% for fiscal 2020. The increase in gross margin for fiscal 2021 was due to lower non-payroll costs, primarily for travel, partially offset by an increase in labor costs, including a one-time bonus for all employees below the managing director level in the second quarter of fiscal 2021.
Sales and marketing and General and administrative costs as a percentage of revenues were 17.3% for fiscal 2021, compared with 16.8% for fiscal 2020. For fiscal 2021 compared to fiscal 2020, Sales and marketing costs as a percentage of revenues increased 10 basis points and General and administrative costs as a percentage of revenues increased 40 basis points, primarily due to higher non-payroll costs.
Operating margin (Operating income as a percentage of revenues) for fiscal 2021 was 15.1%, compared with 14.7% for fiscal 2020.
Table of Contents
ACCENTURE 2021 FORM 10-K Item 7. Management's Discussion and Analysis of Financial Condition and Results of Operations 30

During fiscal 2021 and 2020, we recorded gains of $271 million and $332 million and related tax expense of $41 million and $52 million, respectively, related to our investment in Duck Creek Technologies. For additional information, see Note 1 (Summary of Significant Accounting Policies) to our Consolidated Financial Statements under Item 8, “Financial Statements and Supplementary Data.”
The effective tax rates for fiscal 2021 and 2020 were 22.8% and 23.5%, respectively. Absent the investment gains and related tax expense, our effective tax rates for fiscal 2021 and 2020 would have been 23.1% and 23.9%, respectively.
Diluted earnings per share were $9.16 for fiscal 2021, compared with $7.89 for fiscal 2020. The $230 million and $280 million gains on an investment, net of taxes, increased diluted earnings per share by $0.36 and $0.43 in fiscal 2021 and 2020, respectively. Excluding the impact of these gains, diluted earnings per share would have been $8.80 and $7.46 for fiscal 2021 and 2020, respectively.
We have presented our effective tax rate and diluted earnings per share excluding the impact of gains related to an investment in fiscal 2021 and 2020, as we believe doing so facilitates understanding as to the impact of these items and our performance in comparison to the prior period.
Our operating income and diluted earnings per share are affected by currency exchange rate fluctuations on revenues and costs. Most of our costs are incurred in the same currency as the related revenues. Where practical, we seek to manage foreign currency exposure for costs not incurred in the same currency as the related revenues, such as the costs associated with our global delivery model, by using currency protection provisions in our customer contracts and through our hedging programs. We seek to manage our costs, taking into consideration the residual positive and negative effects of changes in foreign exchange rates on those costs. For more information on our hedging programs, see Note 9 (Financial Instruments) to our Consolidated Financial Statements under Item 8, “Financial Statements and Supplementary Data.”
BookingsNew bookings for fiscal 2021 were $59.3 billion, with consulting bookings of $30.6 billion and outsourcing bookings of $28.7 billion, compared to $49.6 billion in fiscal 2020, with consulting bookings of $25.8 billion and outsourcing bookings of $23.7 billion.
We provide information regarding our new bookings, which include new contracts, including those acquired through acquisitions, as well as renewals, extensions and changes to existing contracts, because we believe doing so provides useful trend information regarding changes in the volume of our new business over time. New bookings can vary significantly quarter to quarter depending in part on the timing of the signing of a small number of large outsourcing contracts. The types of services and solutions clients are demanding and the pace and level of their spending may impact the conversion of new bookings to revenues. For example, outsourcing bookings, which are typically for multi-year contracts, generally convert to revenue over a longer period of time compared to consulting bookings.
Information regarding our new bookings is not comparable to, nor should it be substituted for, an analysis of our revenues over time. New bookings involve estimates and judgments. There are no third-party standards or requirements governing the calculation of bookings. We do not update our new bookings for material subsequent terminations or reductions related to bookings originally recorded in prior fiscal years. New bookings are recorded using then-existing foreign currency exchange rates and are not subsequently adjusted for foreign currency exchange rate fluctuations.
The majority of our contracts are terminable by the client on short notice with little or no termination penalties, and some without notice. Only the non-cancelable portion of these contracts is included in our remaining performance obligations disclosed in Note 2 (Revenues) to our Consolidated Financial Statements under Item 8, "Financial Statements and Supplementary Data." Accordingly, a significant portion of what we consider contract bookings is not included in our remaining performance obligations.
Table of Contents
ACCENTURE 2021 FORM 10-K Item 7. Management's Discussion and Analysis of Financial Condition and Results of Operations 31

Critical Accounting Policies and Estimates The preparation of our Consolidated Financial Statements in conformity with U.S. generally accepted accounting principles requires us to make estimates and assumptions that affect the reported amounts of assets and liabilities and disclosure of contingent assets and liabilities at the date of the Consolidated Financial Statements and the reported amounts of revenues and expenses. We continually evaluate our estimates, judgments and assumptions based on available information and experience. Because the use of estimates is inherent in the financial reporting process, actual results could differ from those estimates. Certain of our accounting policies require higher degrees of judgment than others in their application. These include certain aspects of accounting for revenue recognition and income taxes.
Revenue Recognition Determining the method and amount of revenue to recognize requires us to make judgments and estimates. Specifically, complex arrangements with nonstandard terms and conditions may require contract interpretation to determine the appropriate accounting, including whether promised goods and services specified in an arrangement are distinct performance obligations and should be accounted for separately. Other judgments include determining whether performance obligations are satisfied over time or at a point in time and the selection of the method to measure progress towards completion.
We measure progress towards completion for technology integration consulting services using costs incurred to date relative to total estimated costs at completion. Revenues, including estimated fees, are recorded proportionally as costs are incurred. The amount of revenue recognized for these contracts in a period is dependent on our ability to estimate total contract costs. We continually evaluate our estimates of total contract costs based on available information and experience.
Additionally, the nature of our contracts gives rise to several types of variable consideration, including incentive fees. Many contracts include incentives or penalties related to costs incurred, benefits produced or adherence to schedules that may increase the variability in revenues and margins earned on such contracts. We conduct reviews prior to signing such contracts to evaluate whether these incentives are reasonably achievable. Our estimates are monitored over the lives of our contracts and are based on an assessment of our anticipated performance, historical experience and other information available at the time.
For additional information, see Note 2 (Revenues) to our Consolidated Financial Statements under Item 8, “Financial Statements and Supplementary Data.”
Income Taxes Determining the consolidated provision for income tax expense, income tax liabilities and deferred tax assets and liabilities involves judgment. Deferred tax assets and liabilities, measured using enacted tax rates, are recognized for the future tax consequences of temporary differences between the tax and financial statement bases of assets and liabilities. As a global company, we calculate and provide for income taxes in each of the tax jurisdictions in which we operate. This involves estimating current tax exposures in each jurisdiction as well as making judgments regarding the recoverability of deferred tax assets. Tax exposures can involve complex issues and may require an extended period to resolve. In assessing the realizability of deferred tax assets, we consider whether it is more likely than not that some portion or all of the deferred tax assets will not be realized and adjust the valuation allowances accordingly. Factors considered in making this determination include the period of expiration of the tax asset, planned use of the tax asset, tax planning strategies and historical and projected taxable income as well as tax liabilities for the tax jurisdiction in which the tax asset is located. Valuation allowances will be subject to change in each future reporting period as a result of changes in one or more of these factors. Changes in the geographic mix or estimated level of annual income before taxes can affect the overall effective tax rate.
We apply an estimated annual effective tax rate to our quarterly operating results to determine the interim provision for income tax expense. A change in judgment that impacts the measurement of a tax position taken in a prior year is recognized as a discrete item in the interim period in which the change occurs. In the event there is a significant unusual or infrequent item recognized in our quarterly operating results, the tax attributable to that item is recorded in the interim period in which it occurs. We release stranded tax effects from Accumulated other comprehensive loss using the specific identification approach for our defined benefit plans and the portfolio approach for other items.
No taxes have been provided on undistributed foreign earnings that are planned to be indefinitely reinvested. If future events, including material changes in estimates of cash, working capital and long-term investment requirements, necessitate that these earnings be distributed, an additional provision for taxes may apply, which could materially affect our future effective tax rate. We currently do not foresee any event that would require us to distribute these indefinitely reinvested earnings. For additional information, see Note 11 (Income Taxes) to our Consolidated Financial Statements under Item 8, “Financial Statements and Supplementary Data.”
Table of Contents
ACCENTURE 2021 FORM 10-K Item 7. Management's Discussion and Analysis of Financial Condition and Results of Operations 32

As a matter of course, we are regularly audited by various taxing authorities, and sometimes these audits result in proposed assessments where the ultimate resolution may result in us owing additional taxes. We establish tax liabilities or reduce tax assets when, despite our belief that our tax return positions are appropriate and supportable under local tax law, we believe we may not succeed in realizing the tax benefit of certain positions if challenged. In evaluating a tax position, we determine whether it is more likely than not that the position will be sustained upon examination, including resolution of any related appeals or litigation processes, based on the technical merits of the position. Our estimate of the ultimate tax liability contains assumptions based on past experiences, judgments about potential actions by taxing jurisdictions as well as judgments about the likely outcome of issues that have been raised by taxing jurisdictions. The tax position is measured at the largest amount of benefit that is greater than 50 percent likely of being realized upon settlement. We evaluate tax positions each quarter and adjust the related tax liabilities or assets in light of changing facts and circumstances, such as the progress of a tax audit or the expiration of a statute of limitations. We believe the estimates and assumptions used to support our evaluation of tax positions are reasonable. However, final determinations of prior-year tax liabilities, either by settlement with tax authorities or expiration of statutes of limitations, could be materially different from estimates reflected in assets and liabilities and historical income tax provisions. The outcome of these final determinations could have a material effect on our income tax provision, net income, or cash flows in the period in which that determination is made. We believe our tax positions comply with applicable tax law and that we have adequately accounted for these positions.
Revenues by Segment/Geographic Market Effective March 1, 2020, we began managing our business under a new growth model through our three geographic markets, North America, Europe and Growth Markets, which became our reportable segments in the third quarter of fiscal 2020. Prior to this change, our reportable segments were our five industry groups, Communications, Media & Technology, Financial Services, Health & Public Service, Products and Resources.
In addition to reporting revenues by geographic market, we also report revenues by two types of work: consulting and outsourcing, which represent the services sold by our geographic markets. Consulting revenues, which include strategy, management and technology consulting and technology integration consulting, reflect a finite, distinct project or set of projects with a defined outcome and typically a defined set of specific deliverables. Outsourcing revenues typically reflect ongoing, repeatable services or capabilities provided to transition, run and/or manage operations of client systems or business functions.
From time to time, our geographic markets work together to sell and implement certain contracts. The resulting revenues and costs from these contracts may be apportioned among the participating geographic markets. Generally, operating expenses for each geographic market have similar characteristics and are subject to the same factors, pressures and challenges. However, the economic environment and its effects on the industries served by our geographic markets affect revenues and operating expenses within our geographic markets to differing degrees. The mix between consulting and outsourcing is not uniform among our geographic markets. Local currency fluctuations also tend to affect our geographic markets differently, depending on the geographic concentrations and locations of their businesses.
While we provide discussion about our results of operations below, we cannot measure how much of our revenue growth in a particular period is attributable to changes in price or volume. Management does not track standard measures of unit or rate volume. Instead, our measures of volume and price are extremely complex, as each of our services contracts is unique, reflecting a customized mix of specific services that does not fit into standard comparability measurements. Revenue for our services is a function of the nature of each service to be provided, the skills required and the outcome sought, as well as estimated cost, risk, contract terms and other factors.
Table of Contents
ACCENTURE 2021 FORM 10-K Item 7. Management's Discussion and Analysis of Financial Condition and Results of Operations 33
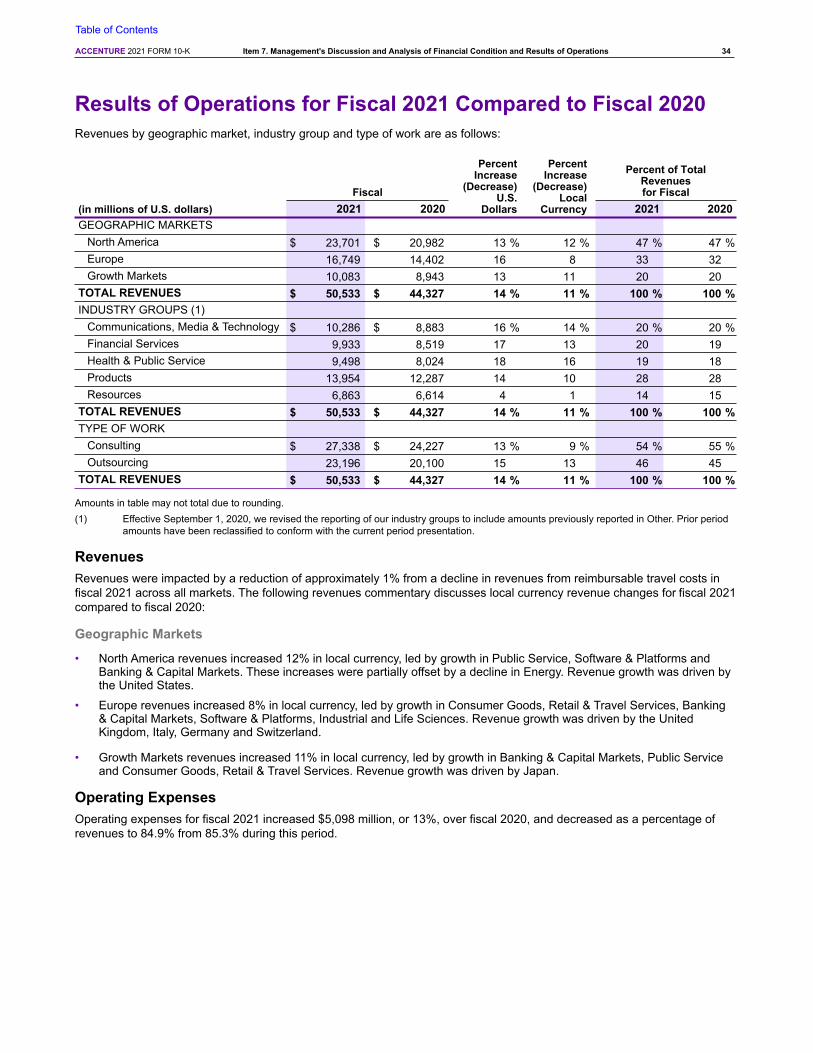
Results of Operations for Fiscal 2021 Compared to Fiscal 2020 Revenues by geographic market, industry group and type of work are as follows:
Fiscal
PercentIncrease
(Decrease)U.S.
Dollars
PercentIncrease
(Decrease)Local
Currency
Percent of TotalRevenues for Fiscal
(in millions of U.S. dollars) 2021 2020 2021 2020GEOGRAPHIC MARKETS
North America $ 23,701 $ 20,982 13 % 12 % 47 % 47 %Europe 16,749 14,402 16 8 33 32 Growth Markets 10,083 8,943 13 11 20 20
TOTAL REVENUES $ 50,533 $ 44,327 14 % 11 % 100 % 100 %INDUSTRY GROUPS (1)
Communications, Media & Technology $ 10,286 $ 8,883 16 % 14 % 20 % 20 %Financial Services 9,933 8,519 17 13 20 19 Health & Public Service 9,498 8,024 18 16 19 18 Products 13,954 12,287 14 10 28 28 Resources 6,863 6,614 4 1 14 15
TOTAL REVENUES $ 50,533 $ 44,327 14 % 11 % 100 % 100 %TYPE OF WORK
Consulting $ 27,338 $ 24,227 13 % 9 % 54 % 55 %Outsourcing 23,196 20,100 15 13 46 45
TOTAL REVENUES $ 50,533 $ 44,327 14 % 11 % 100 % 100 %
Amounts in table may not total due to rounding.(1) Effective September 1, 2020, we revised the reporting of our industry groups to include amounts previously reported in Other. Prior period
amounts have been reclassified to conform with the current period presentation.
Revenues Revenues were impacted by a reduction of approximately 1% from a decline in revenues from reimbursable travel costs in fiscal 2021 across all markets. The following revenues commentary discusses local currency revenue changes for fiscal 2021 compared to fiscal 2020:
Geographic Markets
• North America revenues increased 12% in local currency, led by growth in Public Service, Software & Platforms and Banking & Capital Markets. These increases were partially offset by a decline in Energy. Revenue growth was driven by the United States.
• Europe revenues increased 8% in local currency, led by growth in Consumer Goods, Retail & Travel Services, Banking & Capital Markets, Software & Platforms, Industrial and Life Sciences. Revenue growth was driven by the United Kingdom, Italy, Germany and Switzerland.
• Growth Markets revenues increased 11% in local currency, led by growth in Banking & Capital Markets, Public Service and Consumer Goods, Retail & Travel Services. Revenue growth was driven by Japan.
Operating Expenses Operating expenses for fiscal 2021 increased $5,098 million, or 13%, over fiscal 2020, and decreased as a percentage of revenues to 84.9% from 85.3% during this period.
Table of Contents
ACCENTURE 2021 FORM 10-K Item 7. Management's Discussion and Analysis of Financial Condition and Results of Operations 34

Operating expenses by category are as follows:
Fiscal
(in millions of U.S. dollars) 2021 2020Increase
(Decrease)Operating Expenses $ 42,912 84.9 % $ 37,813 85.3 % $ 5,098 Cost of services 34,169 67.6 30,351 68.5 3,818 Sales and marketing 5,288 10.5 4,626 10.4 662 General and administrative costs 3,454 6.8 2,837 6.4 618
Amounts in table may not total due to rounding.
Cost of Services
Cost of services for fiscal 2021 increased $3,818 million, or 13%, over fiscal 2020, and decreased as a percentage of revenues to 67.6% from 68.5% during this period. Gross margin for fiscal 2021 increased to 32.4% from 31.5% in fiscal 2020. The increase in gross margin for fiscal 2021 was primarily due to lower non-payroll costs, primarily for travel, partially offset by an increase in labor costs, including a one-time bonus for all employees below the managing director level in the second quarter of fiscal 2021.
Sales and Marketing
Sales and marketing expense for fiscal 2021 increased $662 million, or 14%, over fiscal 2020, and increased as a percentage of revenues to 10.5% from 10.4% during this period.
General and Administrative Costs
General and administrative costs for fiscal 2021 increased $618 million, or 22%, over fiscal 2020, and increased as a percentage of revenues to 6.8% from 6.4% during this period. The increase as a percentage of revenues was primarily due to higher non-payroll costs.
Operating Income and Operating Margin Operating income for fiscal 2021 increased $1,108 million, or 17%, over fiscal 2020. Operating margin for fiscal 2021 was 15.1%, compared with 14.7% for fiscal 2020.
Operating income and operating margin for each of the geographic markets are as follows:
Fiscal 2021 2020
(in millions of U.S. dollars)Operating
IncomeOperating
MarginOperating
IncomeOperating
MarginIncrease
(Decrease)North America $ 3,908 16 % $ 3,170 15 % $ 738 Europe 2,236 13 1,799 12 437 Growth Markets 1,477 15 1,545 17 (67) TOTAL $ 7,622 15.1 % $ 6,514 14.7 % $ 1,108
Amounts in table may not total due to rounding.
We estimate that the aggregate percentage impact of foreign currency exchange rates on our operating income during fiscal 2021 was similar to that disclosed for revenue for each geographic market. The reduction in travel costs during fiscal 2021 had a favorable impact on operating income. In addition, during fiscal 2021 each geographic market’s operating income was unfavorably impacted by higher labor costs, including a one-time bonus in the second quarter of fiscal 2021 equal to one week of base pay for all employees below the managing director level. The commentary below provides insight into other factors affecting geographic market performance and operating income for fiscal 2021 compared with fiscal 2020:
• North America operating income increased primarily due to revenue growth, higher consulting contract profitability and lower sales and marketing costs as a percentage of revenues.
• Europe operating income increased primarily due to revenue growth and higher contract profitability.
• Growth Markets operating income decreased as revenue growth was offset by lower contract profitability and higher sales and marketing costs as a percentage of revenues.
Table of Contents
ACCENTURE 2021 FORM 10-K Item 7. Management's Discussion and Analysis of Financial Condition and Results of Operations 35

Other Income (Expense), netOther income (expense), net primarily consists of foreign currency gains and losses, non-operating components of pension expense, as well as gains and losses associated with our investments. During fiscal 2021, other income (expense) decreased $59 million from fiscal 2020, primarily due to lower gains on investments, including lower gains related to our investment in Duck Creek Technologies, partially offset by lower foreign currency losses. For additional information on investments, see Note 1 (Summary of Significant Accounting Policies) to our Consolidated Financial Statements under Item 8, “Financial Statements and Supplementary Data.”
Income Tax Expense The effective tax rate for fiscal 2021 was 22.8%, compared with 23.5% for fiscal 2020. Absent the $271 million and $332 million gains on an investment and related $41 million and $52 million in tax expense, our effective tax rates for fiscal 2021 and fiscal 2020 would have been 23.1% and 23.9%, respectively. The lower effective tax rate for fiscal 2021 was primarily due to changes in the geographic distribution of earnings. For additional information, see Note 11 (Income Taxes) to our Consolidated Financial Statements under Item 8, “Financial Statements and Supplementary Data.”
Net Income Attributable to Noncontrolling Interests Net income attributable to noncontrolling interests reflects the income earned or expense incurred attributable to the equity interest that some current and former members of Accenture Leadership and their permitted transferees have in our Accenture Canada Holdings Inc. subsidiary. See “Business—Organizational Structure.” Noncontrolling interests also includes amounts primarily attributable to noncontrolling shareholders in our Avanade Inc. subsidiary. Net income attributable to Accenture plc represents the income attributable to the shareholders of Accenture plc.
Earnings Per Share Diluted earnings per share were $9.16 for fiscal 2021, compared with $7.89 for fiscal 2020. The $230 million and $280 million gains on an investment, net of taxes, increased diluted earnings per share by $0.36 and $0.43 in fiscal 2021 and 2020, respectively. Excluding the impact of these gains, diluted earnings per share would have been $8.80 and $7.46 for fiscal 2021 and 2020, respectively. For information regarding our earnings per share calculations, see Note 3 (Earnings Per Share) to our Consolidated Financial Statements under Item 8, “Financial Statements and Supplementary Data.”
The increase in diluted earnings per share is due to the following factors:
Earnings Per Share Fiscal 2021FY20 As Reported $ 7.89 Revenue and operating results 1.30 Lower effective tax rate 0.09 Lower share count 0.03 Net Income attributable to noncontrolling interests (0.01) Non-operating income (0.07) Lower gains on an investment, net of tax (0.07) FY21 As Reported $ 9.16
Results of Operations for Fiscal 2020 Compared to Fiscal 2019Our Annual Report on Form 10-K for the fiscal year ended August 31, 2020 includes a discussion and analysis of our financial condition and results of operations for the year ended August 31, 2019 in Item 7 of Part II, “Management’s Discussion and Analysis of Financial Condition and Results of Operations.”
Table of Contents
ACCENTURE 2021 FORM 10-K Item 7. Management's Discussion and Analysis of Financial Condition and Results of Operations 36

Liquidity and Capital Resources Our primary sources of liquidity are cash flows from operations, available cash reserves and debt capacity available under various credit facilities. We could raise additional funds through other public or private debt or equity financings. We may use our available or additional funds to, among other things:
• facilitate purchases, redemptions and exchanges of shares and pay dividends;
• acquire complementary businesses or technologies;
• take advantage of opportunities, including more rapid expansion; or
• develop new services and solutions.
As of August 31, 2021, Cash and cash equivalents were $8.2 billion, compared with $8.4 billion as of August 31, 2020.
Cash flows from operating, investing and financing activities, as reflected in our Consolidated Cash Flows Statements, are summarized in the following table:
FiscalChange(in millions of U.S. dollars) 2021 2020
Net cash provided by (used in):Operating activities $ 8,975 $ 8,215 $ 760 Investing activities (4,310) (1,895) (2,415) Financing activities (4,926) (4,049) (877)
Effect of exchange rate changes on cash and cash equivalents 14 17 (3) Net increase (decrease) in cash and cash equivalents $ (247) $ 2,288 $ (2,536)
Amounts in table may not total due to rounding.
Operating activities: The $760 million increase in operating cash flows was due to higher net income, partially offset by changes in operating assets and liabilities.
Investing activities: The $2,415 million increase in cash used was due to higher spending on business acquisitions and investments, partially offset by increased proceeds from investments. For additional information, see Note 6 (Business Combinations) to our Consolidated Financial Statements under Item 8, “Financial Statements and Supplementary Data.”
Financing activities: The $877 million increase in cash used was primarily due to an increase in the net purchases of shares as well as an increase in cash dividends paid, partially offset by an increase in net proceeds from share issuances. For additional information, see Note 14 (Shareholders’ Equity) to our Consolidated Financial Statements under Item 8, “Financial Statements and Supplementary Data.”
We believe that our current and longer-term working capital, investments and other general corporate funding requirements will be satisfied for the next twelve months and thereafter through cash flows from operations and, to the extent necessary, from our borrowing facilities and future financial market activities.
Substantially all of our cash is held in jurisdictions where there are no regulatory restrictions or material tax effects on the free flow of funds. In addition, domestic cash inflows for our Irish parent, principally dividend distributions from lower-tier subsidiaries, have been sufficient to meet our historic cash requirements, and we expect this to continue into the future.
Borrowing Facilities
See Note 10 (Borrowings and Indebtedness) and Note 8 (Leases) to our Consolidated Financial Statements under Item 8, “Financial Statements and Supplementary Data.”
Share Purchases and Redemptions We intend to continue to use a significant portion of cash generated from operations for share repurchases during fiscal 2022. The number of shares ultimately repurchased under our open-market share purchase program may vary depending on numerous factors, including, without limitation, share price and other market conditions, our ongoing capital allocation planning, the levels of cash and debt balances, other demands for cash, such as acquisition activity, general economic and/or business conditions, and board and management discretion. Additionally, as these factors may change over the course of the year, the amount of share repurchase activity during any particular period cannot be predicted and may fluctuate from time to time. Share repurchases may be made from time to time through open-market purchases, in respect of purchases and redemptions of Accenture Canada Holdings Inc. exchangeable shares, through the use of Rule 10b5-1 plans and/or by
Table of Contents
ACCENTURE 2021 FORM 10-K Item 7. Management's Discussion and Analysis of Financial Condition and Results of Operations 37

other means. The repurchase program may be accelerated, suspended, delayed or discontinued at any time, without notice. For additional information, see Note 14 (Shareholders’ Equity) to our Consolidated Financial Statements under Item 8, “Financial Statements and Supplementary Data.”
Subsequent EventsSee Note 14 (Shareholders’ Equity) to our Consolidated Financial Statements under Item 8, “Financial Statements and Supplementary Data.”
Off-Balance Sheet Arrangements In the normal course of business and in conjunction with some client engagements, we have entered into contractual arrangements through which we may be obligated to indemnify clients with respect to certain matters. To date, we have not been required to make any significant payment under any of these arrangements. For further discussion of these transactions, see Note 15 (Commitments and Contingencies) to our Consolidated Financial Statements under Item 8, “Financial Statements and Supplementary Data.”
New Accounting Pronouncements See Note 1 (Summary of Significant Accounting Policies) to our Consolidated Financial Statements under Item 8, “Financial Statements and Supplementary Data.”
Table of Contents
ACCENTURE 2021 FORM 10-K Item 7. Management's Discussion and Analysis of Financial Condition and Results of Operations 38

Item 7A. Quantitative and Qualitative Disclosures About Market Risk
All of our market risk sensitive instruments were entered into for purposes other than trading.
Foreign Currency Risk We are exposed to foreign currency risk in the ordinary course of business. We hedge material cash flow exposures when feasible using forward contracts. These instruments are subject to fluctuations in foreign currency exchange rates and credit risk. Credit risk is managed through careful selection and ongoing evaluation of the financial institutions utilized as counterparties.
Certain of these hedge positions are undesignated hedges of balance sheet exposures such as intercompany loans and typically have maturities of less than one year. These hedges, the most significant of which are U.S. dollar/Japanese yen, U.S. dollar/Euro, U.S. dollar/U.K. pound and U.S. dollar/Indian rupee, are intended to offset remeasurement of the underlying assets and liabilities. Changes in the fair value of these derivatives are recorded in Other income (expense), net in the Consolidated Income Statements. Additionally, we have hedge positions that are designated cash flow hedges of certain intercompany charges relating to our global delivery model. These hedges, the most significant of which are U.S. dollar/Indian rupee, U.S. dollar/Philippine peso, U.K. pound/Indian rupee and Euro/Indian rupee, typically have maturities not exceeding three years and are intended to partially offset the impact of foreign currency movements on future costs relating to our global delivery resources. For additional information, see Note 9 (Financial Instruments) to our Consolidated Financial Statements under Item 8, “Financial Statements and Supplementary Data.”
For designated cash flow hedges, gains and losses currently recorded in Accumulated other comprehensive loss are expected to be reclassified into earnings at the time when certain anticipated intercompany charges are accrued as Cost of services. As of August 31, 2021, it was anticipated that approximately $104 million of net gains, net of tax, currently recorded in Accumulated other comprehensive loss will be reclassified into Cost of services within the next 12 months.
We use sensitivity analysis to determine the effects that market foreign currency exchange rate fluctuations may have on the fair value of our hedge portfolio. The sensitivity of the hedge portfolio is computed based on the market value of future cash flows as affected by changes in exchange rates. This sensitivity analysis represents the hypothetical changes in value of the hedge position and does not reflect the offsetting gain or loss on the underlying exposure. A 10% change in the levels of foreign currency exchange rates against the U.S. dollar (or other base currency of the hedge if not a U.S. dollar hedge) with all other variables held constant would have resulted in a change in the fair value of our hedge instruments of approximately $469 million and $592 million as of August 31, 2021 and 2020, respectively.
Interest Rate Risk The interest rate risk associated with our borrowing and investing activities as of August 31, 2021 is not material in relation to our consolidated financial position, results of operations or cash flows. While we may do so in the future, we have not used derivative financial instruments to alter the interest rate characteristics of our investment holdings or debt instruments.
Equity Investment RiskOur non-marketable and marketable equity securities are subject to a wide variety of market-related risks that could substantially reduce or increase the fair value of our investments.
Our non-marketable equity securities are investments in privately held companies which are often in a start-up or development stage, which is inherently risky. The technologies or products these companies have under development are typically in the early stages and may never materialize, which could result in a loss of a substantial part of our investment in these companies. The evaluations of privately held companies are based on information that we request from these companies, which is not subject to the same disclosure regulations as U.S. publicly traded companies, and as such, the basis for these evaluations is subject to the timing and accuracy of the data received from these companies. We have minimal exposure on our long-term investments in privately held companies as these investments were not material in relation to our consolidated financial position, results of operations or cash flows as of August 31, 2021.
Table of Contents
ACCENTURE 2021 FORM 10-K Item 6A. Quantitative and Qualitative Disclosures About Market Risk 39

We record our marketable equity securities not accounted for under the equity method at fair value based on readily determinable market values.
The carrying values of our investments accounted for under the equity method generally do not fluctuate based on market price changes; however, these investments could be impaired if the carrying value exceeds the fair value.
Item 8. Financial Statements and Supplementary Data
See the Index to Consolidated Financial Statements and financial statements commencing on page F-1, which are incorporated herein by reference.
Item 9. Changes in and Disagreements With Accountants on Accounting and Financial Disclosure
None.
Item 9A. Controls and Procedures
Evaluation of Disclosure Controls and ProceduresOur management, with the participation of our principal executive officer and our principal financial officer, has evaluated the effectiveness of our disclosure controls and procedures (as defined in Rule 13a-15(e) under the Exchange Act) as of the end of the period covered by this report. Any controls and procedures, no matter how well designed and operated, can provide only reasonable assurance of achieving the desired control objectives. Based on that evaluation, the principal executive officer and the principal financial officer of Accenture plc have concluded that, as of the end of the period covered by this report, our disclosure controls and procedures were effective at the reasonable assurance level.
Management’s Annual Report on Internal Control over Financial ReportingOur management is responsible for establishing and maintaining adequate internal control over financial reporting to provide reasonable assurance regarding the reliability of our financial reporting and the preparation of financial statements for external purposes in accordance with generally accepted accounting principles. Internal control over financial reporting includes those policies and procedures that:
i. pertain to the maintenance of records that in reasonable detail accurately and fairly reflect the transactions and dispositions of our assets;
Table of Contents
ACCENTURE 2021 FORM 10-K Item 6A. Quantitative and Qualitative Disclosures About Market Risk 40

ii. provide reasonable assurance that the transactions are recorded as necessary to permit preparation of financial statements in accordance with generally accepted accounting principles, and that our receipts and expenditures are being made only in accordance with authorizations of management and our Board of Directors; and
iii. provide reasonable assurance regarding prevention or timely detection of unauthorized acquisition, use or disposition of our assets that could have a material effect on our financial statements.
Due to its inherent limitations, internal control over financial reporting may not prevent or detect misstatements. Also, projections of any evaluation of effectiveness to future periods are subject to the risk that controls may become inadequate due to changes in conditions, or that the degree of compliance with the policies or procedures may deteriorate.
Under the supervision and with the participation of our management, including our principal executive officer and principal financial officer, we conducted an evaluation of the effectiveness of our internal control over financial reporting using the criteria set forth by the Committee of Sponsoring Organizations of the Treadway Commission (COSO) in Internal Control—Integrated Framework (2013). Based on its evaluation, our management concluded that our internal control over financial reporting was effective as of the end of the fiscal year covered by this Annual Report on Form 10-K.
KPMG LLP, an independent registered public accounting firm, has audited the Consolidated Financial Statements included in this Annual Report on Form 10-K and, as part of their audit, has issued its attestation report, included herein, on the effectiveness of our internal control over financial reporting. See “Report of Independent Registered Public Accounting Firm” on page F-2.
Changes in Internal Control over Financial ReportingThere has been no change in our internal control over financial reporting that occurred during the fourth quarter of fiscal 2021 that has materially affected, or is reasonably likely to materially affect, our internal control over financial reporting.
Item 9B. Other Information
None.
Item 9C. Disclosure Regarding Foreign Jurisdictions that Prevent Inspections
None.
Table of Contents
ACCENTURE 2021 FORM 10-K Item 8A. Controls and Procedures 41

Part IIIItem 10. Directors, Executive Officers and Corporate Governance
There have been no material changes to the procedures by which security holders may recommend nominees to our Board of Directors from those described in the proxy statement for our 2021 Annual General Meeting of Shareholders filed with the SEC on December 10, 2020.
Information about our executive officers is contained in the discussion entitled “Information about our Executive Officers” in Part I of this Form 10-K. The remaining information called for by Item 10 will be included in the sections captioned “Appointment of Directors,” “Corporate Governance” and “Beneficial Ownership” included in the definitive proxy statement relating to the 2022 Annual General Meeting of Shareholders of Accenture plc to be held on January 26, 2022 and is incorporated herein by reference. Accenture plc will file such definitive proxy statement with the SEC pursuant to Regulation 14A not later than 120 days after the end of our 2021 fiscal year covered by this Form 10-K.
Item 11. Executive Compensation
The information called for by Item 11 will be included in the sections captioned “Executive Compensation” and “Director Compensation” included in the definitive proxy statement relating to the 2022 Annual General Meeting of Shareholders of Accenture plc to be held on January 26, 2022 and is incorporated herein by reference. Accenture plc will file such definitive proxy statement with the SEC pursuant to Regulation 14A not later than 120 days after the end of our 2021 fiscal year covered by this Form 10-K.
Table of Contents
ACCENTURE 2021 FORM 10-K Part III 42

Item 12. Security Ownership of Certain Beneficial Owners and Management and Related Shareholder Matters
Securities Authorized for Issuance under Equity Compensation PlansThe following table sets forth, as of August 31, 2021, certain information related to our compensation plans under which Accenture plc Class A ordinary shares may be issued.
Plan Category
Number of Shares to be Issued Upon Exercise
of Outstanding Options, Warrants and Rights
Weighted-Average Exercise Price of
Outstanding Options, Warrants and Rights (3)
Number of Shares Remaining Available for Future Issuance Under Equity Compensation Plans (Excluding Securities
Reflected in 1st Column)Equity compensation plans approved by shareholders:
2001 Share Incentive Plan 14,362 (1) $ — — Amended and Restated 2010 Share Incentive Plan 16,639,608 (2) — 19,465,854 Amended and Restated 2010 Employee Share Purchase Plan — N/A 20,557,490
Equity compensation plans not approved by shareholders — N/A — Total 16,653,970 40,023,344
(1) Consists of 14,362 restricted share units.(2) Consists of 16,639,608 restricted share units, with performance-based awards assuming maximum performance.(3) Restricted share units have no exercise price.
The remaining information called for by Item 12 will be included in the section captioned “Beneficial Ownership” included in the definitive proxy statement relating to the 2022 Annual General Meeting of Shareholders of Accenture plc to be held on January 26, 2022 and is incorporated herein by reference. Accenture plc will file such definitive proxy statement with the SEC pursuant to Regulation 14A not later than 120 days after the end of our 2021 fiscal year covered by this Form 10-K.
Item 13. Certain Relationships and Related Transactions, and Director Independence
The information called for by Item 13 will be included in the section captioned “Corporate Governance” included in the definitive proxy statement relating to the 2022 Annual General Meeting of Shareholders of Accenture plc to be held on January 26, 2022 and is incorporated herein by reference. Accenture plc will file such definitive proxy statement with the SEC pursuant to Regulation 14A not later than 120 days after the end of our 2021 fiscal year covered by this Form 10-K.
Table of Contents
ACCENTURE 2021 FORM 10-K Item 11. Security Ownership of Certain Beneficial Owners and Management and Related Shareholder Matters 43

Item 14. Principal Accountant Fees And Services
The information called for by Item 14 will be included in the section captioned “Audit” included in the definitive proxy statement relating to the 2022 Annual General Meeting of Shareholders of Accenture plc to be held on January 26, 2022 and is incorporated herein by reference. Accenture plc will file such definitive proxy statement with the SEC pursuant to Regulation 14A not later than 120 days after the end of our 2021 fiscal year covered by this Form 10-K.
Table of Contents
ACCENTURE 2021 FORM 10-K Item 13. Principal Accountant Fees And Services 44
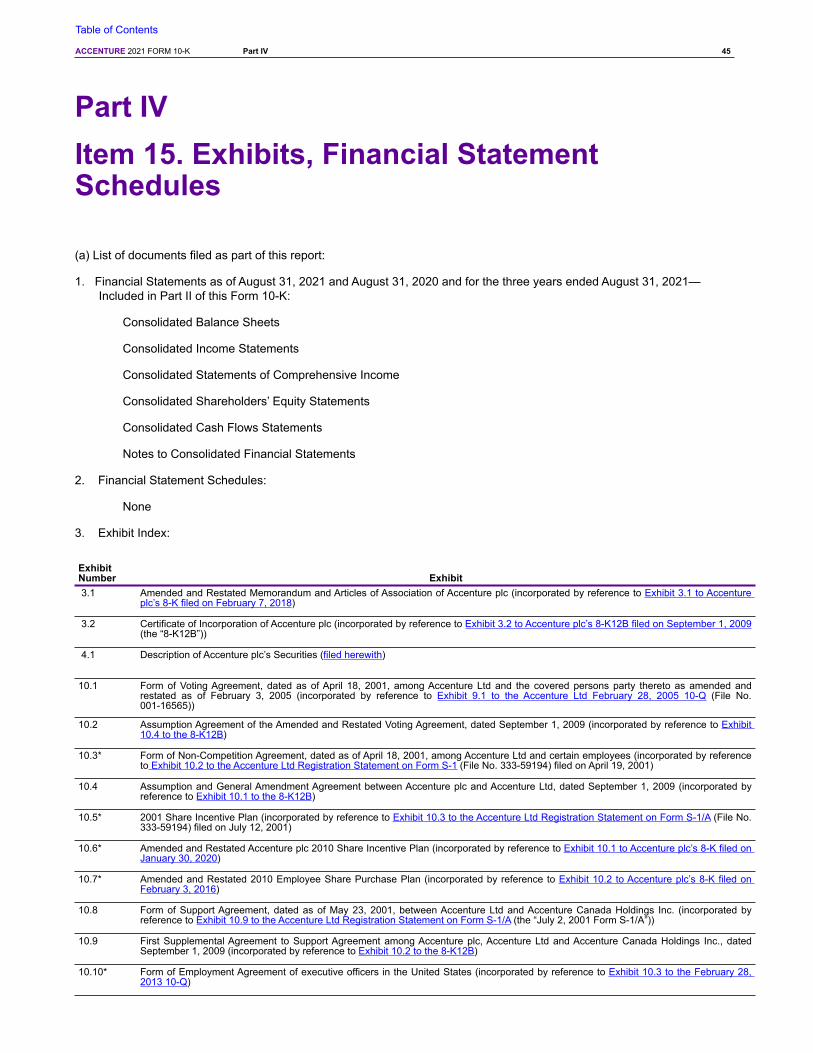
Part IVItem 15. Exhibits, Financial Statement Schedules
(a) List of documents filed as part of this report:
1. Financial Statements as of August 31, 2021 and August 31, 2020 and for the three years ended August 31, 2021—Included in Part II of this Form 10-K:
Consolidated Balance Sheets
Consolidated Income Statements
Consolidated Statements of Comprehensive Income
Consolidated Shareholders’ Equity Statements
Consolidated Cash Flows Statements
Notes to Consolidated Financial Statements
2. Financial Statement Schedules:
None
3. Exhibit Index:
ExhibitNumber Exhibit3.1 Amended and Restated Memorandum and Articles of Association of Accenture plc (incorporated by reference to Exhibit 3.1 to Accenture
plc’s 8-K filed on February 7, 2018)
3.2 Certificate of Incorporation of Accenture plc (incorporated by reference to Exhibit 3.2 to Accenture plc’s 8-K12B filed on September 1, 2009 (the “8-K12B”))
4.1 Description of Accenture plc’s Securities (filed herewith)
10.1 Form of Voting Agreement, dated as of April 18, 2001, among Accenture Ltd and the covered persons party thereto as amended and restated as of February 3, 2005 (incorporated by reference to Exhibit 9.1 to the Accenture Ltd February 28, 2005 10-Q (File No. 001-16565))
10.2 Assumption Agreement of the Amended and Restated Voting Agreement, dated September 1, 2009 (incorporated by reference to Exhibit 10.4 to the 8-K12B)
10.3* Form of Non-Competition Agreement, dated as of April 18, 2001, among Accenture Ltd and certain employees (incorporated by reference to Exhibit 10.2 to the Accenture Ltd Registration Statement on Form S-1 (File No. 333-59194) filed on April 19, 2001)
10.4 Assumption and General Amendment Agreement between Accenture plc and Accenture Ltd, dated September 1, 2009 (incorporated by reference to Exhibit 10.1 to the 8-K12B)
10.5* 2001 Share Incentive Plan (incorporated by reference to Exhibit 10.3 to the Accenture Ltd Registration Statement on Form S-1/A (File No. 333-59194) filed on July 12, 2001)
10.6* Amended and Restated Accenture plc 2010 Share Incentive Plan (incorporated by reference to Exhibit 10.1 to Accenture plc’s 8-K filed on January 30, 2020)
10.7* Amended and Restated 2010 Employee Share Purchase Plan (incorporated by reference to Exhibit 10.2 to Accenture plc’s 8-K filed on February 3, 2016)
10.8 Form of Support Agreement, dated as of May 23, 2001, between Accenture Ltd and Accenture Canada Holdings Inc. (incorporated by reference to Exhibit 10.9 to the Accenture Ltd Registration Statement on Form S-1/A (the “July 2, 2001 Form S-1/A”))
10.9 First Supplemental Agreement to Support Agreement among Accenture plc, Accenture Ltd and Accenture Canada Holdings Inc., dated September 1, 2009 (incorporated by reference to Exhibit 10.2 to the 8-K12B)
10.10* Form of Employment Agreement of executive officers in the United States (incorporated by reference to Exhibit 10.3 to the February 28, 2013 10-Q)
Table of Contents
ACCENTURE 2021 FORM 10-K Part IV 45

10.11* Form of Employment Agreement of executive officers in Singapore (incorporated by reference to Exhibit 10.17 to the August 31, 2015 10-K)
10.12* 2012 Employment Contract between Accenture SAS and Jean-Marc Ollagnier, together with 2017 Addendum (incorporated by reference to Exhibit 10.1 to the November 30, 2020 10-Q)
10.13 Form of Articles of Association of Accenture Canada Holdings Inc. (incorporated by reference to Exhibit 10.11 to the July 2, 2001 Form S-1/A)
10.14 Articles of Amendment to Articles of Association of Accenture Canada Holdings Inc. (incorporated by reference to Exhibit 10.21 to the August 31, 2013 10-K)
10.15 Form of Exchange Trust Agreement by and between Accenture Ltd and Accenture Canada Holdings Inc. and CIBC Mellon Trust Company, made as of May 23, 2001 (incorporated by reference to Exhibit 10.12 to the July 2, 2001 Form S-1/A)
10.16 First Supplemental Agreement to Exchange Trust Agreement among Accenture plc, Accenture Ltd, Accenture Canada Holdings Inc. and Accenture Inc., dated September 1, 2009 (incorporated by reference to Exhibit 10.3 to the 8-K12B)
10.17* 2015 Sub-plan for Restricted Share Units Granted in France (incorporated by reference to Exhibit 10.2 to the November 30, 2020 10-Q)
10.18* Form of Director Restricted Share Unit Agreement pursuant to the Amended and Restated Accenture plc 2010 Share Incentive Plan (incorporated by reference to Exhibit 10.1 to the February 28, 2021 10-Q)
10.19* Form of Key Executive Performance-Based Award Restricted Share Unit Agreement pursuant to the Amended and Restated Accenture plc 2010 Share Incentive Plan (incorporated by reference to Exhibit 10.2 to the February 28, 2019 10-Q)
10.20* Form of Key Executive Performance-Based Award Restricted Share Unit Agreement pursuant to the Amended and Restated Accenture plc 2010 Share Incentive Plan (incorporated by reference to Exhibit 10.2 to the February 29, 2020 10-Q)
10.21* Form of Key Executive Performance-Based Award Restricted Share Unit Agreement pursuant to the Amended and Restated Accenture plc 2010 Share Incentive Plan (incorporated by reference to Exhibit 10.2 to the February 28, 2021 10-Q)
10.22* Form of Fiscal 2019 Key Executive Performance-Based Award Restricted Share Unit Agreement in France (incorporated by reference to Exhibit 10.3 to the November 30, 2020 10-Q)
10.23* Form of Fiscal 2020 Key Executive Performance-Based Award Restricted Share Unit Agreement in France (incorporated by reference to Exhibit 10.4 to the November 30, 2020 10-Q)
10.24* Form of Fiscal 2021 Key Executive Performance-Based Award Restricted Share Unit Agreement in France (incorporated by reference to Exhibit 10.6 to the February 28, 2021 10-Q)
10.25* Form of Accenture Leadership Performance Equity Award Restricted Share Unit Agreement pursuant to the Amended and Restated Accenture plc 2010 Share Incentive Plan (incorporated by reference to Exhibit 10.3 to the February 28, 2019 10-Q)
10.26* Form of Accenture Leadership Performance Equity Award Restricted Share Unit Agreement pursuant to the Amended and Restated Accenture plc 2010 Share Incentive Plan (incorporated by reference to Exhibit 10.3 to the February 29, 2020 10-Q)
10.27* Form of Accenture Leadership Performance Equity Award Restricted Share Unit Agreement pursuant to the Amended and Restated Accenture plc 2010 Share Incentive Plan (incorporated by reference to Exhibit 10.3 to the February 28, 2021 10-Q)
10.28* Form of Fiscal 2021 Accenture Leadership Performance Equity Award Restricted Share Unit Agreement in France (incorporated by reference to Exhibit 10.7 to the February 28, 2021 10-Q)
10.29* Form of Voluntary Equity Investment Program Matching Grant Restricted Share Unit Agreement pursuant to the Amended and Restated Accenture plc 2010 Share Incentive Plan (incorporated by reference to Exhibit 10.4 to the February 29, 2020 10-Q)
10.30* Form of Voluntary Equity Investment Program Matching Grant Restricted Share Unit Agreement pursuant to the Amended and Restated Accenture plc 2010 Share Incentive Plan (incorporated by reference to Exhibit 10.4 to the February 28, 2021 10-Q)
10.31* Form of Fiscal 2021 Voluntary Equity Investment Program Matching Grant Restricted Share Unit Agreement in France (incorporated by reference to Exhibit 10.8 to the February 28, 2021 10-Q)
10.32* Form of CEO Discretionary Grant Restricted Share Unit Agreement pursuant to the Amended and Restated Accenture plc 2010 Share Incentive Plan (incorporated by reference to Exhibit 10.5 to the February 29, 2020 10-Q)
10.33* Form of CEO Discretionary Grant Restricted Share Unit Agreement pursuant to the Amended and Restated Accenture plc 2010 Share Incentive Plan (incorporated by reference to Exhibit 10.5 to the February 28, 2021 10-Q)
10.34* Form of Next Generation Leadership Performance-Based Award Restricted Share Unit Agreement pursuant to the Amended and Restated Accenture plc 2010 Share Incentive Plan (incorporated by reference to Exhibit 10.6 to the February 29, 2020 10-Q)
10.35* Form of Next Generation Leadership Performance-Based Award Restricted Share Unit Agreement in France (incorporated by reference to Exhibit 10.6 to the November 30, 2020 10-Q)
10.36* Accenture LLP Leadership Separation Benefits Plan (incorporated by reference to Exhibit 10.28 to the August 31, 2020 10-K)
10.37* Description of Global Annual Bonus Plan (incorporated by reference to Exhibit 10.31 to the August 31, 2017 10-K)
10.38* Form of Indemnification Agreement, between Accenture Inc. and the indemnitee party thereto (incorporated by reference to Exhibit 10.28 to the August 31, 2018 10-K)
21.1 Subsidiaries of the Registrant (filed herewith)
Table of Contents
ACCENTURE 2021 FORM 10-K 46
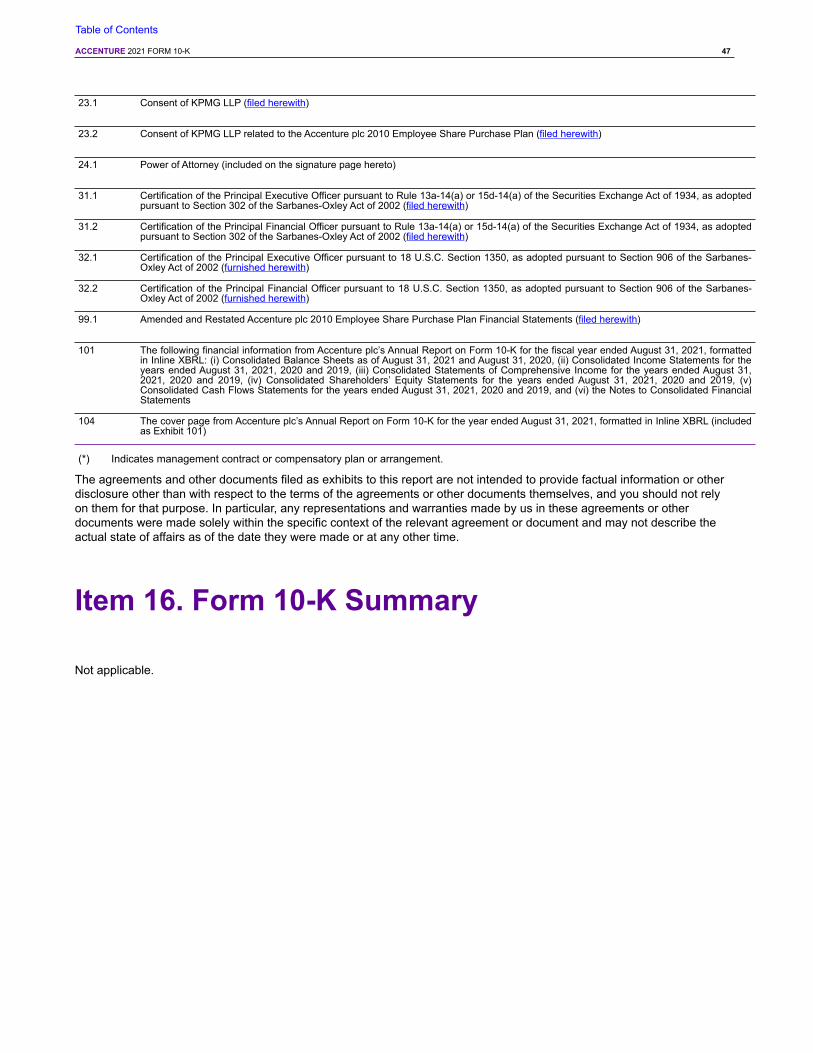
23.1 Consent of KPMG LLP (filed herewith)
23.2 Consent of KPMG LLP related to the Accenture plc 2010 Employee Share Purchase Plan (filed herewith)
24.1 Power of Attorney (included on the signature page hereto)
31.1 Certification of the Principal Executive Officer pursuant to Rule 13a-14(a) or 15d-14(a) of the Securities Exchange Act of 1934, as adopted pursuant to Section 302 of the Sarbanes-Oxley Act of 2002 (filed herewith)
31.2 Certification of the Principal Financial Officer pursuant to Rule 13a-14(a) or 15d-14(a) of the Securities Exchange Act of 1934, as adopted pursuant to Section 302 of the Sarbanes-Oxley Act of 2002 (filed herewith)
32.1 Certification of the Principal Executive Officer pursuant to 18 U.S.C. Section 1350, as adopted pursuant to Section 906 of the Sarbanes-Oxley Act of 2002 (furnished herewith)
32.2 Certification of the Principal Financial Officer pursuant to 18 U.S.C. Section 1350, as adopted pursuant to Section 906 of the Sarbanes-Oxley Act of 2002 (furnished herewith)
99.1 Amended and Restated Accenture plc 2010 Employee Share Purchase Plan Financial Statements (filed herewith)
101 The following financial information from Accenture plc’s Annual Report on Form 10-K for the fiscal year ended August 31, 2021, formatted in Inline XBRL: (i) Consolidated Balance Sheets as of August 31, 2021 and August 31, 2020, (ii) Consolidated Income Statements for the years ended August 31, 2021, 2020 and 2019, (iii) Consolidated Statements of Comprehensive Income for the years ended August 31, 2021, 2020 and 2019, (iv) Consolidated Shareholders’ Equity Statements for the years ended August 31, 2021, 2020 and 2019, (v) Consolidated Cash Flows Statements for the years ended August 31, 2021, 2020 and 2019, and (vi) the Notes to Consolidated Financial Statements
104 The cover page from Accenture plc’s Annual Report on Form 10-K for the year ended August 31, 2021, formatted in Inline XBRL (included as Exhibit 101)
(*) Indicates management contract or compensatory plan or arrangement.
The agreements and other documents filed as exhibits to this report are not intended to provide factual information or other disclosure other than with respect to the terms of the agreements or other documents themselves, and you should not rely on them for that purpose. In particular, any representations and warranties made by us in these agreements or other documents were made solely within the specific context of the relevant agreement or document and may not describe the actual state of affairs as of the date they were made or at any other time.
Item 16. Form 10-K Summary
Not applicable.
Table of Contents
ACCENTURE 2021 FORM 10-K 47

SignaturesPursuant to the requirements of Section 13 or 15(d) of the Securities Exchange Act of 1934, the registrant has duly caused this report to be signed on its behalf on October 15, 2021 by the undersigned, thereunto duly authorized.
ACCENTURE PLC
By: /s/ JULIE SWEET
Name: Julie SweetTitle: Chief Executive Officer
Power of AttorneyKNOW ALL PERSONS BY THESE PRESENTS, that each person whose signature appears below hereby constitutes and appoints Julie Sweet, KC McClure and Joel Unruch, and each of them, as his or her true and lawful attorneys-in-fact and agents, with power to act with or without the others and with full power of substitution and resubstitution, to do any and all acts and things and to execute any and all instruments which said attorneys and agents and each of them may deem necessary or desirable to enable the registrant to comply with the U.S. Securities Exchange Act of 1934, as amended, and any rules, regulations and requirements of the U.S. Securities and Exchange Commission thereunder in connection with the registrant’s Annual Report on Form 10-K for the fiscal year ended August 31, 2021 (the “Annual Report”), including specifically, but without limiting the generality of the foregoing, power and authority to sign the name of the registrant and the name of the undersigned, individually and in his or her capacity as a director or officer of the registrant, to the Annual Report as filed with the U.S. Securities and Exchange Commission, to any and all amendments thereto, and to any and all instruments or documents filed as part thereof or in connection therewith; and each of the undersigned hereby ratifies and confirms all that said attorneys and agents and each of them shall do or cause to be done by virtue hereof.
Pursuant to the requirements of the Securities Exchange Act of 1934, this report has been signed below on October 15, 2021 by the following persons on behalf of the registrant and in the capacities indicated.
Signature Title
/s/ JULIE SWEET Chief Executive Officer, Chair of the Board and Director
Julie Sweet (principal executive officer)
/s/ KC MCCLURE Chief Financial Officer
KC McClure (principal financial officer)
/s/ RICHARD P. CLARK Chief Accounting Officer
Richard P. Clark (principal accounting officer)
/s/ GILLES C. PÉLISSON Lead Director
Gilles C. Pélisson
/s/ JAIME ARDILA Director
Jaime Ardila
Table of Contents
ACCENTURE 2021 FORM 10-K Signatures 48

/s/ NANCY MCKINSTRY Director
Nancy McKinstry
/s/ BETH E. MOONEY Director
Beth E. Mooney
/s/ PAULA A. PRICE Director
Paula A. Price
/s/ VENKATA S.M. RENDUCHINTALA Director
Venkata S.M. Renduchintala
/s/ ARUN SARIN Director
Arun Sarin
/s/ FRANK K. TANG Director
Frank K. Tang
/s/ TRACEY T. TRAVIS Director
Tracey T. Travis
Table of Contents
ACCENTURE 2021 FORM 10-K Signatures 49
Accenture Plc
Index To Consolidated Financial Statements
Page
Report of Independent Registered Public Accounting Firm F-2
Consolidated Financial Statements as of August 31, 2021 and 2020 and for the years ended August 31, 2021, 2020 and 2019:
Consolidated Balance Sheets F-5
Consolidated Income Statements F-6
Consolidated Statements of Comprehensive Income F-7
Consolidated Shareholders’ Equity Statements F-8
Consolidated Cash Flows Statements F-11
Notes to Consolidated Financial Statements F-12
Table of Contents
ACCENTURE 2021 FORM 10-K Index To Consolidated Financial Statements F-1
1

Report of Independent Registered Public Accounting FirmTo the Shareholders and Board of Directors
Accenture plc:
Opinions on the Consolidated Financial Statements and Internal Control Over Financial Reporting
We have audited the accompanying consolidated balance sheets of Accenture plc and subsidiaries (the Company) as of August 31, 2021 and 2020, the related consolidated statements of income, comprehensive income, shareholders’ equity, and cash flows for each of the years in the three-year period ended August 31, 2021, and the related notes (collectively, the consolidated financial statements). We also have audited the Company’s internal control over financial reporting as of August 31, 2021, based on criteria established in Internal Control – Integrated Framework (2013) issued by the Committee of Sponsoring Organizations of the Treadway Commission.
In our opinion, the consolidated financial statements referred to above present fairly, in all material respects, the financial position of the Company as of August 31, 2021 and 2020, and the results of its operations and its cash flows for each of the years in the three-year period ended August 31, 2021, in conformity with U.S. generally accepted accounting principles. Also in our opinion, the Company maintained, in all material respects, effective internal control over financial reporting as of August 31, 2021 based on criteria established in Internal Control – Integrated Framework (2013) issued by the Committee of Sponsoring Organizations of the Treadway Commission.
Change in Accounting Principle
As discussed in Note 8 to the consolidated financial statements, the Company changed its method of accounting for leases effective September 1, 2019 due to the adoption of Accounting Standards Update (ASU) No. 2016-02, Leases, and related updates, which established Accounting Standards Codification Topic 842, Leases.
Basis for Opinions
The Company’s management is responsible for these consolidated financial statements, for maintaining effective internal control over financial reporting, and for its assessment of the effectiveness of internal control over financial reporting, included in the accompanying Management’s Annual Report on Internal Control over Financial Reporting. Our responsibility is to express an opinion on the Company’s consolidated financial statements and an opinion on the Company’s internal control over financial reporting based on our audits. We are a public accounting firm registered with the Public Company Accounting Oversight Board (United States) (PCAOB) and are required to be independent with respect to the Company in accordance with the U.S. federal securities laws and the applicable rules and regulations of the Securities and Exchange Commission and the PCAOB.
We conducted our audits in accordance with the standards of the PCAOB. Those standards require that we plan and perform the audits to obtain reasonable assurance about whether the consolidated financial statements are free of material misstatement, whether due to error or fraud, and whether effective internal control over financial reporting was maintained in all material respects.
Our audits of the consolidated financial statements included performing procedures to assess the risks of material misstatement of the consolidated financial statements, whether due to error or fraud, and performing procedures that respond to those risks. Such procedures included examining, on a test basis, evidence regarding the amounts and disclosures in the consolidated financial statements. Our audits also included evaluating the accounting principles used and significant estimates made by management, as well as evaluating the overall presentation of the consolidated financial statements. Our audit of internal control over financial reporting included obtaining an understanding of internal control over financial reporting, assessing the risk that a material weakness exists, and testing and evaluating the design and operating effectiveness of internal control based on the assessed risk. Our audits also included performing such other procedures as we considered necessary in the circumstances. We believe that our audits provide a reasonable basis for our opinions.
Definition and Limitations of Internal Control over Financial Reporting
A company’s internal control over financial reporting is a process designed to provide reasonable assurance regarding the reliability of financial reporting and the preparation of financial statements for external purposes in accordance with generally accepted accounting principles. A company’s internal control over financial reporting includes those policies and procedures that (1) pertain to the maintenance of records that, in reasonable detail, accurately and fairly reflect the transactions and dispositions of the assets of the company; (2) provide reasonable assurance that transactions are recorded as necessary to permit preparation of financial statements in accordance with generally accepted accounting principles, and that receipts and expenditures of the company are being made only in accordance with authorizations of management and directors of the
Table of Contents
ACCENTURE 2021 FORM 10-K Report of Independent Registered Public Accounting Firm F-2

company; and (3) provide reasonable assurance regarding prevention or timely detection of unauthorized acquisition, use, or disposition of the company’s assets that could have a material effect on the financial statements.
Because of its inherent limitations, internal control over financial reporting may not prevent or detect misstatements. Also, projections of any evaluation of effectiveness to future periods are subject to the risk that controls may become inadequate because of changes in conditions, or that the degree of compliance with the policies or procedures may deteriorate.
Critical Audit Matters
The critical audit matters communicated below are matters arising from the current period audit of the consolidated financial statements that were communicated or required to be communicated to the audit committee and that: (1) relate to accounts or disclosures that are material to the consolidated financial statements and (2) involved our especially challenging, subjective, or complex judgments. The communication of critical audit matters does not alter in any way our opinion on the consolidated financial statements, taken as a whole, and we are not, by communicating the critical audit matters below, providing separate opinions on the critical audit matters or on the accounts or disclosures to which they relate.
Estimated costs to complete certain technology integration consulting services contracts
As discussed in Notes 1 and 2 to the consolidated financial statements, revenues from contracts for technology integration consulting services where the Company designs, builds, and implements new or enhanced system applications and related processes for its clients are recognized over time since control of the system is transferred continuously to the client. Generally, revenue is recognized using costs incurred to date relative to total estimated costs at completion to measure progress toward satisfying the Company’s performance obligations, which typically occurs over time periods ranging from six months to two years.
We identified the evaluation of estimated costs to complete certain technology integration consulting services contracts as a critical audit matter. Subjective auditor judgment was required to evaluate the estimate of costs to complete the contracts.
The following are the primary procedures we performed to address this critical audit matter. We evaluated the design and tested the operating effectiveness of certain internal controls over the Company’s process for estimating costs to complete technology integration consulting services contracts, including controls over the estimate of costs to complete the contracts. We tested the estimated costs to complete for certain technology integration consulting services contracts by evaluating:
• the scope of the work and timing of delivery for consistency with the underlying contractual terms;
• the estimated costs to complete in relation to progress toward satisfying the Company’s performance obligations, based on internal and customer-facing information;
• changes to estimated costs, if any, including the amount and timing of the change based on internal information or contractual changes; and
• actual costs incurred subsequent to the balance sheet date to assess if they were consistent with the estimate for that time period.
We evaluated the Company’s ability to estimate costs by comparing estimates developed at contract inception to actual costs ultimately incurred to satisfy the performance obligation.
Unrecognized tax benefits
As discussed in Note 11 to the consolidated financial statements, the Company has $1,344 million of unrecognized tax benefits as of August 31, 2021. As discussed in Note 1 to the consolidated financial statements, the Company recognizes tax positions when it believes such positions are more likely than not of being sustained if challenged. Recognized tax positions are measured at the largest amount of benefit greater than 50 percent likely of being realized. The Company uses estimates and assumptions in determining the amount of unrecognized tax benefits.
We identified the evaluation of the Company’s unrecognized tax benefits related to transfer pricing and certain other intercompany transactions as a critical audit matter. Complex auditor judgment was required in evaluating the Company’s interpretation of tax law and its analysis of the recognition and measurement of its tax positions.
The following are the primary procedures we performed to address this critical audit matter. We evaluated the design and tested the operating effectiveness of certain internal controls over the Company’s unrecognized tax benefits process, including controls over transfer pricing and certain other intercompany transactions. We involved tax and transfer pricing professionals with specialized skills and knowledge, who assisted in:
Table of Contents
ACCENTURE 2021 FORM 10-K Report of Independent Registered Public Accounting Firm F-3

• evaluating the Company’s interpretation of tax laws and income tax consequences of intercompany transactions, including internal restructurings and intra-entity transfers of assets;
• assessing transfer pricing studies for compliance with applicable laws and regulations;
• analyzing the Company’s tax positions, including the methodology over the measurement of unrecognized tax benefits related to transfer pricing;
• evaluating the Company’s determination of unrecognized tax benefits, including the associated effect in other jurisdictions; and
• inspecting settlements with applicable taxing authorities.
In addition, we evaluated the Company’s ability to estimate its unrecognized tax benefits by comparing historical unrecognized tax benefits to actual results upon the conclusion of examinations by applicable taxing authorities.
/s/ KPMG LLP
We have served as the Company’s auditor since 2002.
Chicago, IllinoisOctober 15, 2021
Table of Contents
ACCENTURE 2021 FORM 10-K Report of Independent Registered Public Accounting Firm F-4

Consolidated Balance SheetsAugust 31, 2021 and 2020
August 31,2021
August 31,2020
ASSETSCURRENT ASSETS:
Cash and cash equivalents $ 8,168,174 $ 8,415,330 Short-term investments 4,294 94,309 Receivables and contract assets 9,728,212 7,846,892 Other current assets 1,765,831 1,393,225
Total current assets 19,666,511 17,749,756 NON-CURRENT ASSETS:
Contract assets 38,334 43,257 Investments 329,526 324,514 Property and equipment, net 1,639,105 1,545,568 Lease assets 3,182,519 3,183,346 Goodwill 11,125,861 7,709,820 Deferred contract costs 731,445 723,168 Deferred tax assets 4,007,130 4,153,146 Other non-current assets 2,455,412 1,646,018
Total non-current assets 23,509,332 19,328,837 TOTAL ASSETS $ 43,175,843 $ 37,078,593 LIABILITIES AND SHAREHOLDERS’ EQUITYCURRENT LIABILITIES:
Current portion of long-term debt and bank borrowings $ 12,080 $ 7,820 Accounts payable 2,274,057 1,349,874 Deferred revenues 4,229,177 3,636,741 Accrued payroll and related benefits 6,747,853 5,083,950 Income taxes payable 423,400 453,542 Lease liabilities 744,164 756,057 Accrued consumption taxes 609,553 662,409 Other accrued liabilities 668,583 712,197
Total current liabilities 15,708,867 12,662,590 NON-CURRENT LIABILITIES:
Long-term debt 53,473 54,052 Deferred revenues 700,080 690,931 Retirement obligation 2,016,021 1,859,444 Deferred tax liabilities 243,636 179,703 Income taxes payable 1,105,896 930,695 Lease liabilities 2,696,917 2,667,584 Other non-current liabilities 553,839 534,421
Total non-current liabilities 7,369,862 6,916,830 COMMITMENTS AND CONTINGENCIESSHAREHOLDERS’ EQUITY:
Ordinary shares, par value 1.00 euros per share, 40,000 shares authorized and issued as of August 31, 2021 and August 31, 2020 57 57 Class A ordinary shares, par value $0.0000225 per share, 20,000,000,000 shares authorized, 656,590,625 and 658,548,895 shares issued as of August 31, 2021 and August 31, 2020, respectively 15 15 Class X ordinary shares, par value $0.0000225 per share, 1,000,000,000 shares authorized, 512,655 and 527,509 shares issued and outstanding as of August 31, 2021 and August 31, 2020, respectively — — Restricted share units 1,750,784 1,585,302 Additional paid-in capital 8,617,838 7,167,227 Treasury shares, at cost: Ordinary, 40,000 shares as of August 31, 2021 and August 31, 2020; Class A ordinary, 24,504,666 and 24,383,369 shares as of August 31, 2021 and August 31, 2020, respectively (3,408,491) (2,565,761) Retained earnings 13,988,748 12,375,533 Accumulated other comprehensive loss (1,419,497) (1,561,837)
Total Accenture plc shareholders’ equity 19,529,454 17,000,536 Noncontrolling interests 567,660 498,637
Total shareholders’ equity 20,097,114 17,499,173 TOTAL LIABILITIES AND SHAREHOLDERS’ EQUITY $ 43,175,843 $ 37,078,593
The accompanying Notes are an integral part of these Consolidated Financial Statements.
Table of ContentsConsolidated Financial Statements(In thousands of U.S. dollars, except share and per share amounts)ACCENTURE 2021 FORM 10-K F-5

Consolidated Income StatementsFor the Years Ended August 31, 2021, 2020 and 2019
2021 2020 2019REVENUES:
Revenues $ 50,533,389 $ 44,327,039 $ 43,215,013 OPERATING EXPENSES:
Cost of services 34,169,261 30,350,881 29,900,325 Sales and marketing 5,288,237 4,625,929 4,447,456 General and administrative costs 3,454,362 2,836,585 2,562,158
Total operating expenses 42,911,860 37,813,395 36,909,939 OPERATING INCOME 7,621,529 6,513,644 6,305,074 Interest income 33,365 69,331 87,508 Interest expense (59,492) (33,071) (22,963) Other income (expense), net 165,714 224,427 (117,822) INCOME BEFORE INCOME TAXES 7,761,116 6,774,331 6,251,797 Income tax expense 1,770,571 1,589,018 1,405,556 NET INCOME 5,990,545 5,185,313 4,846,241 Net income attributable to noncontrolling interests in Accenture Canada Holdings Inc. (6,539) (6,325) (6,694) Net income attributable to noncontrolling interests – other (77,197) (71,149) (60,435) NET INCOME ATTRIBUTABLE TO ACCENTURE PLC $ 5,906,809 $ 5,107,839 $ 4,779,112 Weighted average Class A ordinary shares:Basic 634,745,073 636,299,913 638,098,125 Diluted 645,909,042 647,797,003 650,204,873 Earnings per Class A ordinary share:Basic $ 9.31 $ 8.03 $ 7.49 Diluted $ 9.16 $ 7.89 $ 7.36 Cash dividends per share $ 3.52 $ 3.20 $ 2.92
The accompanying Notes are an integral part of these Consolidated Financial Statements.
Table of ContentsConsolidated Financial Statements(In thousands of U.S. dollars, except share and per share amounts)ACCENTURE 2021 FORM 10-K F-6
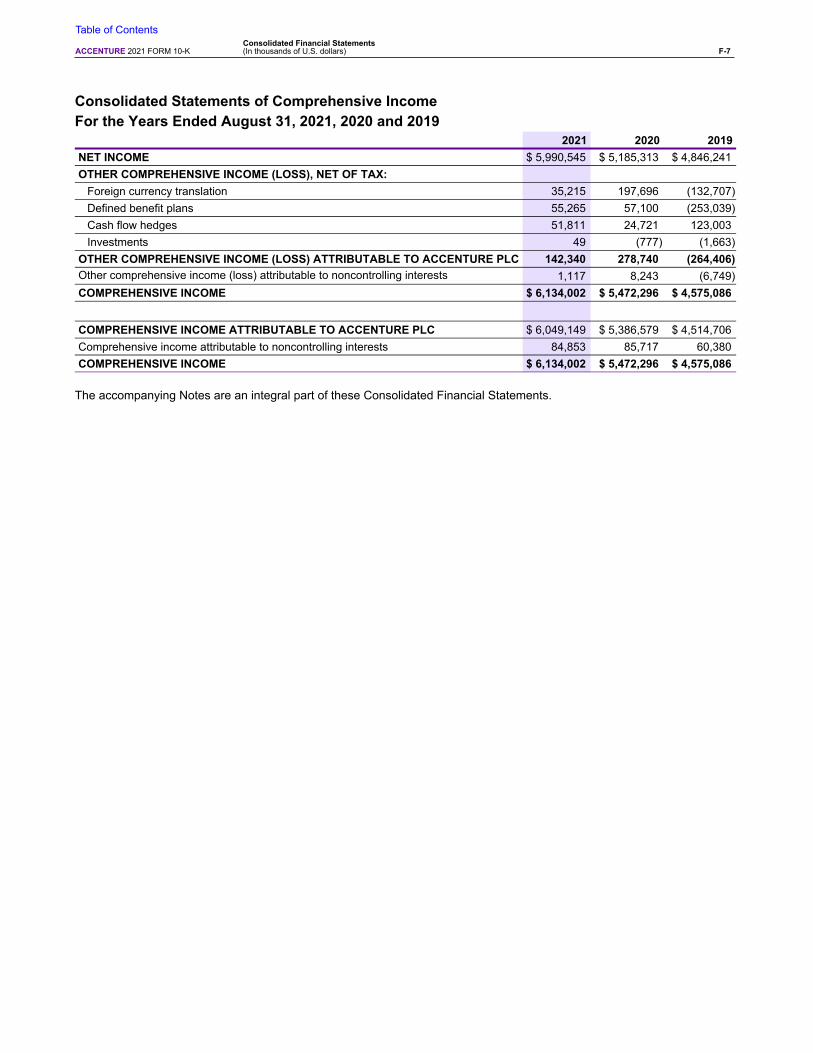
Consolidated Statements of Comprehensive IncomeFor the Years Ended August 31, 2021, 2020 and 2019
2021 2020 2019NET INCOME $ 5,990,545 $ 5,185,313 $ 4,846,241 OTHER COMPREHENSIVE INCOME (LOSS), NET OF TAX:
Foreign currency translation 35,215 197,696 (132,707) Defined benefit plans 55,265 57,100 (253,039) Cash flow hedges 51,811 24,721 123,003 Investments 49 (777) (1,663)
OTHER COMPREHENSIVE INCOME (LOSS) ATTRIBUTABLE TO ACCENTURE PLC 142,340 278,740 (264,406) Other comprehensive income (loss) attributable to noncontrolling interests 1,117 8,243 (6,749) COMPREHENSIVE INCOME $ 6,134,002 $ 5,472,296 $ 4,575,086
COMPREHENSIVE INCOME ATTRIBUTABLE TO ACCENTURE PLC $ 6,049,149 $ 5,386,579 $ 4,514,706 Comprehensive income attributable to noncontrolling interests 84,853 85,717 60,380 COMPREHENSIVE INCOME $ 6,134,002 $ 5,472,296 $ 4,575,086
The accompanying Notes are an integral part of these Consolidated Financial Statements.
Table of ContentsConsolidated Financial Statements(In thousands of U.S. dollars)ACCENTURE 2021 FORM 10-K F-7

Table of ContentsConsolidated Financial Statements(In thousands of U.S. dollars and share amounts)ACCENTURE 2021 FORM 10-K F-8
Consolidated Shareholders’ Equity StatementsFor the Years Ended August 31, 2021, 2020 and 2019
Balance as of August 31, 2018 $ 57 40 $ 15 663,328 $ — 656 $ 1,234,623 $ 4,870,764 $ (2,116,948) (24,333) $ 7,952,413 $ (1,576,171) $ 10,364,753 $ 359,835 $ 10,724,588
Cumulative effect adjustment 2,134,818 2,134,818 3,158 2,137,976
Net income 4,779,112 4,779,112 67,129 4,846,241
Other comprehensive income (loss)
(264,406) (264,406) (6,749) (271,155)
Purchases of Class A shares 3,302 (2,669,336) (16,431) (2,666,034) (3,302) (2,669,336) Cancellation of treasury shares (17,599) (326,092) 2,745,321 17,599 (2,419,229) — —
Share-based compensation expense
1,023,794 69,459 1,093,253 1,093,253
Purchases/redemptions of Accenture Canada Holdings Inc. exchangeable shares and Class X shares
(47) (21,768) (21,768) (10) (21,778)
Issuances of Class A ordinary shares for employee share programs
9,010 (903,526) 1,219,600 652,587 4,160 (121,250) 847,411 1,034 848,445
Dividends 57,012 (1,918,737) (1,861,725) (2,628) (1,864,353)
Other, net (10,817) 14,411 3,594 216 3,810
Balance as of August 31, 2019 $ 57 40 $ 15 654,739 $ — 609 $ 1,411,903 $ 5,804,448 $ (1,388,376) (19,005) $ 10,421,538 $ (1,840,577) $ 14,409,008 $ 418,683 $ 14,827,691
OrdinaryShares
Class AOrdinaryShares
Class XOrdinaryShares Restricted
Share Units
Additional Paid-in Capital
Treasury Shares Accumulated Other
Comprehensive Loss
Total Accenture plc Shareholders’
EquityNoncontrolling
Interests
Total Shareholders’
Equity $No.
Shares $No.
Shares $No.
Shares $No.
SharesRetained Earnings
The accompanying Notes are an integral part of these Consolidated Financial Statements.
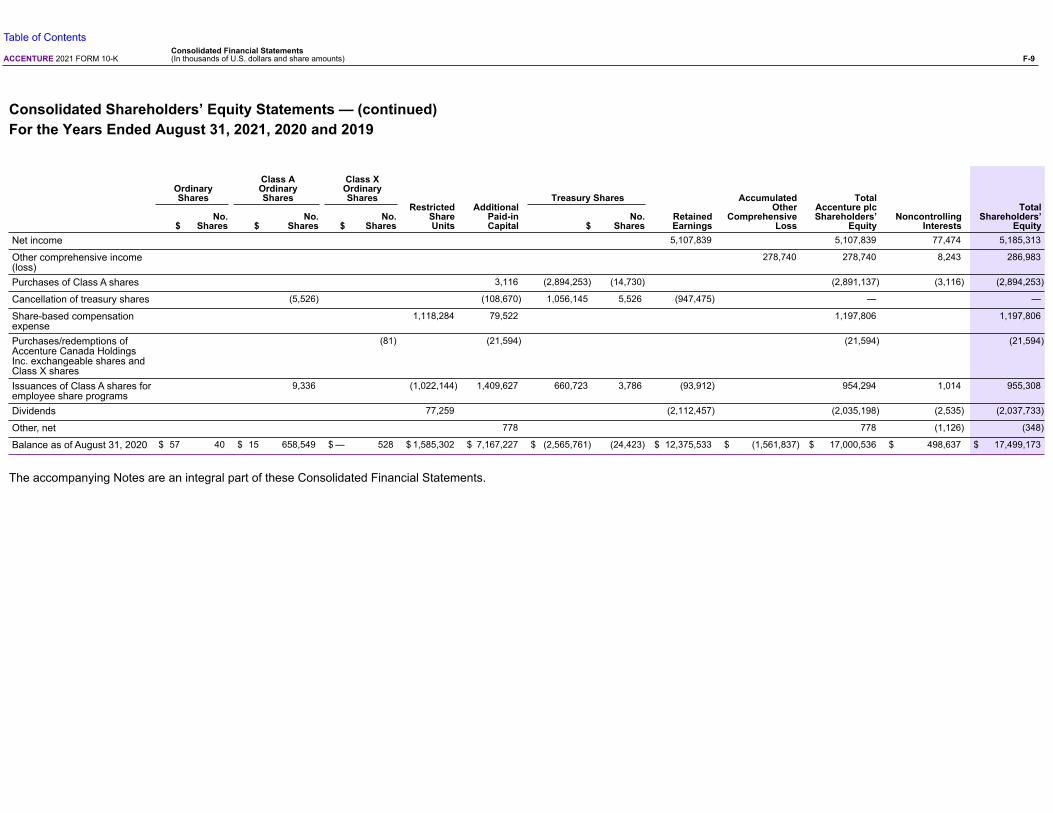
Table of ContentsConsolidated Financial Statements(In thousands of U.S. dollars and share amounts)ACCENTURE 2021 FORM 10-K F-9
Consolidated Shareholders’ Equity Statements — (continued)For the Years Ended August 31, 2021, 2020 and 2019
Net income 5,107,839 5,107,839 77,474 5,185,313
Other comprehensive income (loss)
278,740 278,740 8,243 286,983
Purchases of Class A shares 3,116 (2,894,253) (14,730) (2,891,137) (3,116) (2,894,253)
Cancellation of treasury shares (5,526) (108,670) 1,056,145 5,526 (947,475) — —
Share-based compensation expense
1,118,284 79,522 1,197,806 1,197,806
Purchases/redemptions of Accenture Canada Holdings Inc. exchangeable shares and Class X shares
(81) (21,594) (21,594) (21,594)
Issuances of Class A shares for employee share programs
9,336 (1,022,144) 1,409,627 660,723 3,786 (93,912) 954,294 1,014 955,308
Dividends 77,259 (2,112,457) (2,035,198) (2,535) (2,037,733)
Other, net 778 778 (1,126) (348)
Balance as of August 31, 2020 $ 57 40 $ 15 658,549 $ — 528 $ 1,585,302 $ 7,167,227 $ (2,565,761) (24,423) $ 12,375,533 $ (1,561,837) $ 17,000,536 $ 498,637 $ 17,499,173
OrdinaryShares
Class AOrdinaryShares
Class XOrdinaryShares
Restricted Share Units
Additional Paid-in Capital
Treasury Shares Accumulated Other
Comprehensive Loss
Total Accenture plc Shareholders’
EquityNoncontrolling
Interests
Total Shareholders’
Equity $No.
Shares $No.
Shares $No.
Shares $No.
SharesRetained Earnings
The accompanying Notes are an integral part of these Consolidated Financial Statements.

Table of ContentsConsolidated Financial Statements(In thousands of U.S. dollars and share amounts)ACCENTURE 2021 FORM 10-K F-10
Consolidated Shareholders’ Equity Statements — (continued)For the Years Ended August 31, 2021, 2020 and 2019
Net income 5,906,809 5,906,809 83,736 5,990,545
Other comprehensive income (loss)
142,340 142,340 1,117 143,457
Purchases of Class A shares 3,622 (3,693,747) (13,957) (3,690,125) (3,622) (3,693,747)
Cancellation of treasury shares (10,263) (255,809) 2,105,666 10,263 (1,849,857) — —
Share-based compensation expense
1,253,679 89,272 1,342,951 1,342,951
Purchases/redemptions of Accenture Canada Holdings Inc. exchangeable shares and Class X shares
(15) (9,377) (9,377) (9,377)
Issuances of Class A shares for employee share programs
8,305 (1,176,967) 1,617,702 745,351 3,572 (121,343) 1,064,743 1,032 1,065,775
Dividends 88,770 (2,322,394) (2,233,624) (2,470) (2,236,094)
Other, net 5,201 5,201 (10,770) (5,569)
Balance as of August 31, 2021 $ 57 40 $ 15 656,591 $ — 513 $ 1,750,784 $ 8,617,838 $ (3,408,491) (24,545) $ 13,988,748 $ (1,419,497) $ 19,529,454 $ 567,660 $ 20,097,114
OrdinaryShares
Class AOrdinaryShares
Class XOrdinaryShares
Restricted Share Units
Additional Paid-in Capital
Treasury Shares Accumulated Other
Comprehensive Loss
Total Accenture plc Shareholders’
EquityNoncontrolling
Interests
Total Shareholders’
Equity $No.
Shares $No.
Shares $No.
Shares $No.
SharesRetained Earnings
The accompanying Notes are an integral part of these Consolidated Financial Statements.

Consolidated Cash Flows StatementsFor the Years Ended August 31, 2021, 2020 and 2019
2021 2020 2019CASH FLOWS FROM OPERATING ACTIVITIES:
Net income $ 5,990,545 $ 5,185,313 $ 4,846,241 Adjustments to reconcile Net income to Net cash provided by (used in) operating activities—
Depreciation, amortization and other 1,891,242 1,773,124 892,760 Share-based compensation expense 1,342,951 1,197,806 1,093,253 Deferred tax expense (benefit) 60,930 170,951 (96,360) Other, net (342,849) (243,867) (87,522) Change in assets and liabilities, net of acquisitions—
Receivables and contract assets, current and non-current (1,471,613) 721,500 (526,297) Other current and non-current assets (591,836) (503,482) (489,817) Accounts payable 825,472 (359,682) 177,186 Deferred revenues, current and non-current 554,830 236,207 258,067 Accrued payroll and related benefits 1,445,010 (7,845) 386,930 Income taxes payable, current and non-current 111,795 55,198 (162,916) Other current and non-current liabilities (841,329) (10,071) 335,428
Net cash provided by (used in) operating activities 8,975,148 8,215,152 6,626,953 CASH FLOWS FROM INVESTING ACTIVITIES:
Purchases of property and equipment (580,132) (599,132) (599,009) Purchases of businesses and investments, net of cash acquired (4,171,123) (1,531,599) (1,193,071) Proceeds from sales of businesses and investments 413,553 230,393 27,951 Other investing, net 27,936 5,819 8,553
Net cash provided by (used in) investing activities (4,309,766) (1,894,519) (1,755,576) CASH FLOWS FROM FINANCING ACTIVITIES:
Proceeds from issuance of shares 1,065,775 955,308 848,445 Purchases of shares (3,703,124) (2,915,847) (2,691,114) Proceeds from (repayments of) long-term debt, net (7,798) (6,719) (4,772) Cash dividends paid (2,236,094) (2,037,733) (1,864,353) Other, net (45,096) (44,101) (55,377)
Net cash provided by (used in) financing activities (4,926,337) (4,049,092) (3,767,171) Effect of exchange rate changes on cash and cash equivalents 13,799 16,936 (38,713)
NET INCREASE (DECREASE) IN CASH AND CASH EQUIVALENTS (247,156) 2,288,477 1,065,493 CASH AND CASH EQUIVALENTS, beginning of period 8,415,330 6,126,853 5,061,360 CASH AND CASH EQUIVALENTS, end of period $ 8,168,174 $ 8,415,330 $ 6,126,853 SUPPLEMENTAL CASH FLOW INFORMATION:
Interest paid $ 36,132 $ 28,493 $ 22,624 Income taxes paid, net $ 1,566,753 $ 1,360,030 $ 1,587,273
The accompanying Notes are an integral part of these Consolidated Financial Statements.
Table of ContentsConsolidated Financial Statements(In thousands of U.S. dollars)ACCENTURE 2021 FORM 10-K F-11

1. Summary of Significant Accounting Policies
Description of Business Accenture plc is a leading global professional services company, providing a broad range of services in strategy and consulting, interactive, technology and operations. We serve clients in three geographic markets: North America, Europe and Growth Markets (Asia Pacific, Latin America, Africa and the Middle East). We help our clients build their digital core, transform their operations, and accelerate revenue growth—creating tangible value across their enterprises at speed and scale.
Basis of Presentation The Consolidated Financial Statements include the accounts of Accenture plc, an Irish company, and our controlled subsidiary companies. Accenture plc is an Irish public limited company, which operates its business through its subsidiaries.
The shares of Accenture Canada Holdings Inc. held by persons other than us are treated as a noncontrolling interest in the Consolidated Financial Statements. The noncontrolling interests percentage was less than 1% as of August 31, 2021 and 2020, respectively.
All references to years, unless otherwise noted, refer to our fiscal year, which ends on August 31. For example, a reference to “fiscal 2021” means the 12-month period that ended on August 31, 2021. All references to quarters, unless otherwise noted, refer to the quarters of our fiscal year.
The preparation of the Consolidated Financial Statements in conformity with U.S. generally accepted accounting principles requires management to make estimates and assumptions that affect amounts reported in the Consolidated Financial Statements and accompanying disclosures. Although these estimates are based on management’s best knowledge of current events and actions that we may undertake in the future, actual results may be different from those estimates.
Revenue Recognition We account for revenue in accordance with FASB ASU No. 2014-09, Revenue from Contracts with Customers (Topic 606).
Performance Obligations A performance obligation is a promise in a contract to transfer a distinct good or service to the client and is the unit of accounting in Topic 606. A contract’s transaction price is allocated to each distinct performance obligation and recognized as revenue when, or as, the performance obligation is satisfied. For contracts with multiple performance obligations, we allocate the contract’s transaction price to each performance obligation based on the relative standalone selling price. The primary method used to estimate standalone selling price is the expected cost plus a margin approach, under which we forecast our expected costs of satisfying a performance obligation and then add an appropriate margin for that distinct good or service based on margins for similar services sold on a standalone basis. While determining relative standalone selling price and identifying separate performance obligations require judgment, generally relative standalone selling prices and the separate performance obligations are readily identifiable as we sell those performance obligations unaccompanied by other performance obligations. Contract modifications are routine in the performance of our contracts. Contracts are often modified to account for changes in the contract specifications, requirements or duration. If a contract modification results in the addition of performance obligations priced at a standalone selling price or if the post-modification services are distinct from the services provided prior to the modification, the modification is accounted for separately. If the modified services are not distinct, they are accounted for as part of the existing contract.
Our revenues are derived from contracts for outsourcing services, technology integration consulting services and non-technology integration consulting services. These contracts have different terms based on the scope, performance obligations and complexity of the engagement, which frequently require us to make judgments and estimates in recognizing revenues. We have many types of contracts, including time-and-materials contracts, fixed-price contracts, fee-per-transaction contracts and contracts with multiple fee types.
The nature of our contracts gives rise to several types of variable consideration, including incentive fees. Many contracts include incentives or penalties related to costs incurred, benefits produced or adherence to schedules that may increase the variability in revenues and margins earned on such contracts. These variable amounts generally are awarded or refunded
Table of ContentsNotes To Consolidated Financial Statements(In thousands of U.S. dollars, except share and per share amounts or as otherwise disclosed)ACCENTURE 2021 FORM 10-K F-12

upon achievement of or failure to achieve certain performance metrics, milestones or cost targets and can be based upon client discretion. We include these variable fees in the estimated transaction price when there is a basis to reasonably estimate the amount of the fee and it is not probable a significant reversal of revenue will occur. These estimates reflect the expected value of the variable fee and are based on an assessment of our anticipated performance, historical experience and other information available at the time.
Our performance obligations are satisfied over time as work progresses or at a point in time. The majority of our revenues are recognized over time based on the extent of progress towards satisfying our performance obligations. The selection of the method to measure progress towards completion requires judgment and is based on the contract and the nature of the services to be provided.
Outsourcing Contracts Our outsourcing contracts typically span several years. Revenues are generally recognized on outsourcing contracts over time because our clients benefit from the services as they are performed. Outsourcing contracts require us to provide a series of distinct services each period over the contract term. Revenues from unit-priced contracts are recognized as transactions are processed. When contractual billings represent an amount that corresponds directly with the value provided to the client (e.g., time-and-materials contracts), revenues are recognized as amounts become billable in accordance with contract terms.
Technology Integration Consulting ServicesRevenues from contracts for technology integration consulting services where we design/redesign, build and implement new or enhanced systems and related processes for our clients are recognized over time as control of the system is transferred continuously to the client. Contracts for technology integration consulting services generally span six months to two years. Generally, revenue, including estimated fees, is recognized using costs incurred to date relative to total estimated costs at completion to measure progress toward satisfying our performance obligations. Incurred cost represents work performed, which corresponds with, and thereby best depicts, the transfer of control to the client.
Non-Technology Integration Consulting Services Our contracts for non-technology integration consulting services are typically less than a year in duration. Revenues are generally recognized over time as our clients benefit from the services as they are performed, or the contract, for which the related services lack an alternative use, includes termination provisions enabling payment for performance completed to date. When contractual billings represent an amount that corresponds directly with the value provided to the client (e.g., time-and-materials contracts), revenues are recognized as amounts become billable in accordance with contract terms. Revenues from fixed-price contracts are generally recognized using costs incurred to date relative to total estimated costs at completion to measure progress toward satisfying our performance obligations. Incurred cost represents work performed, which corresponds with, and thereby best depicts, the transfer of control to the client. For non-technology integration consulting contracts which do not qualify to recognize revenue over time, we recognize revenues at a point in time when the client obtains control of the promised good or service.
Contract Estimates Estimates of total contract revenues and costs are continuously monitored over the lives of our contracts, and recorded revenues and cost estimates are subject to revision as the contract progresses. If at any time the estimate of contract profitability indicates an anticipated loss on a technology integration consulting contract, we recognize the loss in the quarter it first becomes probable and reasonably estimable.
Contract Balances The timing of revenue recognition, billings and cash collections results in Receivables, Contract assets, and Deferred revenues (Contract liabilities) on our Consolidated Balance Sheet. Amounts are billed as work progresses in accordance with agreed-upon contractual terms, either at periodic intervals (e.g., monthly or quarterly) or upon achievement of contractual milestones. Our receivables are rights to consideration that are conditional only upon the passage of time as compared to our contract assets, which are rights to consideration conditional upon additional factors. When we bill or receive payments from our clients before revenue is recognized, we record Contract liabilities. Contract assets and liabilities are reported on our Consolidated Balance Sheet on a contract-by-contract basis at the end of each reporting period.
For some outsourcing contracts, we receive payments for transition or set-up activities, which are deferred and recognized as revenue as the services are provided. These advance payments are typically not a significant financing component because they are used to meet working capital demands in the early stages of a contract and to protect us from the other party failing to complete its obligations under the contract. We elected the practical expedient to report revenues net of any revenue-based taxes assessed by governmental authorities that are imposed on and concurrent with specific revenue-producing transactions.
Table of ContentsNotes To Consolidated Financial Statements — (continued)(In thousands of U.S. dollars, except share and per share amounts or as otherwise disclosed)ACCENTURE 2021 FORM 10-K F-13

Employee Share-Based Compensation Arrangements Share-based compensation expense is recognized over the requisite service period for awards of equity instruments to employees based on the grant date fair value of those awards expected to ultimately vest. Forfeitures are estimated on the date of grant and revised if actual or expected forfeiture activity differs materially from original estimates.
Income Taxes We calculate and provide for income taxes in each of the tax jurisdictions in which we operate. Deferred tax assets and liabilities, measured using enacted tax rates, are recognized for the future tax consequences of temporary differences between the tax and financial statement bases of assets and liabilities. A valuation allowance reduces the deferred tax assets to the amount that is more likely than not to be realized. We establish liabilities or reduce assets when we believe tax positions are not more likely than not of being sustained if challenged. Recognized tax positions are measured at the largest amount of benefit greater than 50 percent likely of being realized. Each fiscal quarter, we evaluate tax positions and adjust the related tax assets and liabilities in light of changing facts and circumstances. We release stranded tax effects from Accumulated other comprehensive loss using the specific identification approach for our defined benefit plans and the portfolio approach for other items.
Translation of Non-U.S. Currency Amounts Assets and liabilities of non-U.S. subsidiaries whose functional currency is not the U.S. dollar are translated into U.S. dollars at fiscal year-end exchange rates. Revenue and expense items are translated at average foreign currency exchange rates prevailing during the fiscal year. Translation adjustments are included in Accumulated other comprehensive loss. Gains and losses arising from intercompany foreign currency transactions that are of a long-term investment nature are reported in the same manner as translation adjustments.
Cash and Cash Equivalents Cash and cash equivalents consist of all cash balances and liquid investments with original maturities of three months or less, including certificates of deposit and time deposits. As a result of certain subsidiaries’ cash management systems, checks issued but not presented to the banks for payment may create negative book cash balances. Such negative balances are classified as Current portion of long term debt and bank borrowings.
Allowance for Credit Losses—Client Receivables and Contract Assets We record our client receivables at their face amounts less allowances. The allowance represents our estimate of expected credit losses based on historical experience, current economic conditions and certain forward-looking information. As of August 31, 2021 and 2020, total allowances recorded for credit losses recorded for client receivables and contract assets was $32,206 and $40,277, respectively. The change in the allowance is primarily due to immaterial write-offs and changes in gross client receivables and contract assets.
Concentrations of Credit Risk Our financial instruments, consisting primarily of cash and cash equivalents, foreign currency exchange rate instruments and client receivables, are exposed to concentrations of credit risk. We place our cash and cash equivalents and foreign exchange instruments with highly-rated financial institutions, limit the amount of credit exposure with any one financial institution and conduct ongoing evaluations of the credit worthiness of the financial institutions with which we do business. Client receivables are dispersed across many different industries and countries; therefore, concentrations of credit risk are limited.
InvestmentsAll available-for-sale securities and liquid investments with an original maturity greater than three months but less than one year are considered to be Short-term investments. Non-current investments consist of equity securities in publicly-traded and privately-held companies and are accounted for using either the equity or fair value measurement alternative method of accounting (for investments without readily determinable fair values). Investments are periodically assessed for other-than-
Table of ContentsNotes To Consolidated Financial Statements — (continued)(In thousands of U.S. dollars, except share and per share amounts or as otherwise disclosed)ACCENTURE 2021 FORM 10-K F-14

temporary impairment. If an investment is deemed to have experienced an other-than-temporary decline below its basis, we reduce the carrying amount of the investment to its estimated fair value.
Our non-current investments are as follows:
August 31, 2021 August 31, 2020Equity method investments $ 184,157 $ 240,446 Investments without readily determinable fair values 145,369 84,068 Total non-current investments $ 329,526 $ 324,514
For investments in which we can exercise significant influence but do not control, we use the equity method of accounting. Equity method investments are initially recorded at cost and our proportionate share of gains and losses of the investee are included as a component of other income (expense), net. Our equity method investments consist primarily of an investment in Duck Creek Technologies. As of August 31, 2021, the carrying amount of our investment was $162,775, and the estimated fair value of our approximately 16% ownership was $854,823. We account for the investment under the equity method because we have the ability to influence operations through the combination of our voting power and through other factors, such as representation on the board and our business relationship.
For equity securities without a readily determinable fair value, we use the fair value measurement alternative and measure the securities at cost less impairment, if any, plus or minus observable price changes in orderly transactions for an identical or similar investment of the same issuer.
Depreciation and Amortization See table below for summary of depreciation on fixed assets, deferred transition amortization, intangible assets amortization and operating lease cost for fiscal 2021 and 2020, respectively.
Fiscal 2021 2020Depreciation $ 512,051 $ 482,054 Amortization—Deferred transition 297,216 300,680 Amortization—Intangible assets 312,706 239,664 Operating lease cost 765,232 749,233 Other 4,037 1,493 Total depreciation, amortization and other $ 1,891,242 $ 1,773,124
Property and Equipment Property and equipment is stated at cost, net of accumulated depreciation. Depreciation of property and equipment is computed on a straight-line basis over the following estimated useful lives:
Computers, related equipment and software 2 to 7 yearsFurniture and fixtures 5 to 10 yearsLeasehold improvements Lesser of lease term or 15 years
Goodwill
Goodwill represents the excess of the purchase price of an acquired entity over the fair value of net assets acquired. We review the recoverability of goodwill by operating segment annually, or more frequently when indicators of impairment exist. Based on the results of our annual impairment analysis, we determined that no impairment existed as of August 31, 2021 or 2020, as each reportable segment’s estimated fair value substantially exceeded its carrying value.
Long-Lived Assets Long-lived assets, including deferred contract costs and identifiable intangible assets, are reviewed for impairment whenever events or changes in circumstances indicate that the carrying amount of an asset or group of assets may not be recoverable.
Table of ContentsNotes To Consolidated Financial Statements — (continued)(In thousands of U.S. dollars, except share and per share amounts or as otherwise disclosed)ACCENTURE 2021 FORM 10-K F-15

Recoverability of long-lived assets or groups of assets is assessed based on a comparison of the carrying amount to the estimated future net cash flows. If estimated future undiscounted net cash flows are less than the carrying amount, the asset is considered impaired and a loss is recorded equal to the amount required to reduce the carrying amount to fair value.
Intangible assets with finite lives are generally amortized using the straight-line method over their estimated economic useful lives, ranging from one to fifteen years.
Operating Expenses Selected components of operating expenses are as follows:
Fiscal 2021 2020 2019Research and development costs $ 1,118,320 $ 870,611 $ 799,734 Advertising costs (1) 171,883 57,658 85,521 Provision for (release of) doubtful accounts (2) 6,199 147 974
(1) Advertising costs are expensed as incurred. (2) For additional information, see “Allowance for Credit Losses - Client Receivables and Contract Assets.”
Recently Adopted Accounting Pronouncements Financial Accounting Standards Board (“FASB”) Accounting Standards Update (“ASU”) No. 2016-13 (“Topic 326”) On September 1, 2020, we adopted FASB ASU No. 2016-13, Financial Instruments-Credit Losses (Topic 326): Measurement of Credit Losses on Financial Instruments, which amends guidance on recognition and measurement of credit losses and related disclosures. The amendments replace the existing incurred loss impairment model with a methodology to measure and recognize lifetime expected credit losses for all in-scope financial assets, including accounts receivable and contract assets. The adoption did not have an impact on our Consolidated Financial Statements.
Table of ContentsNotes To Consolidated Financial Statements — (continued)(In thousands of U.S. dollars, except share and per share amounts or as otherwise disclosed)ACCENTURE 2021 FORM 10-K F-16

2. Revenues
Disaggregation of Revenue See Note 16 (Segment Reporting) to these Consolidated Financial Statements for our disaggregated revenues.
Remaining Performance Obligations We had remaining performance obligations of approximately $23 billion and $20 billion as of August 31, 2021 and 2020, respectively. Our remaining performance obligations represent the amount of transaction price for which work has not been performed and revenue has not been recognized. The majority of our contracts are terminable by the client on short notice with little or no termination penalties, and some without notice. Under Topic 606, only the non-cancelable portion of these contracts is included in our performance obligations. Additionally, our performance obligations only include variable consideration if we assess it is probable that a significant reversal of cumulative revenue recognized will not occur when the uncertainty is resolved. Based on the terms of our contracts, a significant portion of what we consider contract bookings is not included in our remaining performance obligations. We expect to recognize approximately 70% of our remaining performance obligations as of August 31, 2021 as revenue in fiscal 2022, an additional 14% in fiscal 2023, and the balance thereafter.
Contract Estimates Adjustments in contract estimates related to performance obligations satisfied or partially satisfied in prior periods were immaterial for both fiscal 2021 and 2020.
Contract Balances Deferred transition revenues were $700,080 and $690,931 as of August 31, 2021 and 2020, respectively, and are included in Non-current deferred revenues. Costs related to these activities are also deferred and are expensed as the services are provided. Generally, deferred amounts are protected in the event of early termination of the contract and are monitored regularly for impairment. Impairment losses are recorded when projected remaining undiscounted operating cash flows of the related contract are not sufficient to recover the carrying amount of contract assets. Deferred transition costs were $731,445 and $723,168 as of August 31, 2021 and 2020, respectively, and are included in Deferred contract costs. Deferred transition amortization expense for fiscal 2021, 2020 and 2019 was $297,216, $300,680 and $274,814, respectively.
The following table provides information about the balances of our Receivables, Contract assets and Contract liabilities (Deferred revenues):
As of August 31, 2021 As of August 31, 2020Receivables, net of allowance $ 8,796,992 $ 7,192,110 Contract assets (current) 931,220 654,782 Receivables and contract assets (current) 9,728,212 7,846,892 Contract assets (non-current) 38,334 43,257 Deferred revenues (current) 4,229,177 3,636,741 Deferred revenues (non-current) 700,080 690,931
Changes in the contract asset and liability balances during fiscal 2021, were a result of normal business activity and not materially impacted by any other factors.
Revenues recognized during fiscal 2021 that were included in Deferred revenues as of August 31, 2020 were $3.3 billion. Revenues recognized during fiscal 2020 that were included in Deferred revenues as of August 31, 2019 were $2.8 billion.
Table of ContentsNotes To Consolidated Financial Statements — (continued)(In thousands of U.S. dollars, except share and per share amounts or as otherwise disclosed)ACCENTURE 2021 FORM 10-K F-17

3. Earnings Per Share
Basic and diluted earnings per share are calculated as follows:
Fiscal 2021 2020 2019Basic Earnings per share
Net income attributable to Accenture plc $ 5,906,809 $ 5,107,839 $ 4,779,112 Basic weighted average Class A ordinary shares 634,745,073 636,299,913 638,098,125
Basic earnings per share $ 9.31 $ 8.03 $ 7.49 Diluted Earnings per share
Net income attributable to Accenture plc $ 5,906,809 $ 5,107,839 $ 4,779,112 Net income attributable to noncontrolling interests in Accenture Canada Holdings Inc. (1) 6,539 6,325 6,694 Net income for diluted earnings per share calculation $ 5,913,348 $ 5,114,164 $ 4,785,806 Basic weighted average Class A ordinary shares 634,745,073 636,299,913 638,098,125 Class A ordinary shares issuable upon redemption/exchange of noncontrolling interests (1) 702,567 787,429 892,654 Diluted effect of employee compensation related to Class A ordinary shares 10,344,620 10,599,773 11,111,679 Diluted effect of share purchase plans related to Class A ordinary shares 116,782 109,888 102,415 Diluted weighted average Class A ordinary shares 645,909,042 647,797,003 650,204,873
Diluted earnings per share $ 9.16 $ 7.89 $ 7.36
(1) Diluted earnings per share assumes the exchange of all Accenture Canada Holdings Inc. exchangeable shares for Accenture plc Class A ordinary shares on a one-for-one basis. The income effect does not take into account “Net income attributable to noncontrolling interests - other,” since those shares are not redeemable or exchangeable for Accenture plc Class A ordinary shares.
Table of ContentsNotes To Consolidated Financial Statements — (continued)(In thousands of U.S. dollars, except share and per share amounts or as otherwise disclosed)ACCENTURE 2021 FORM 10-K F-18
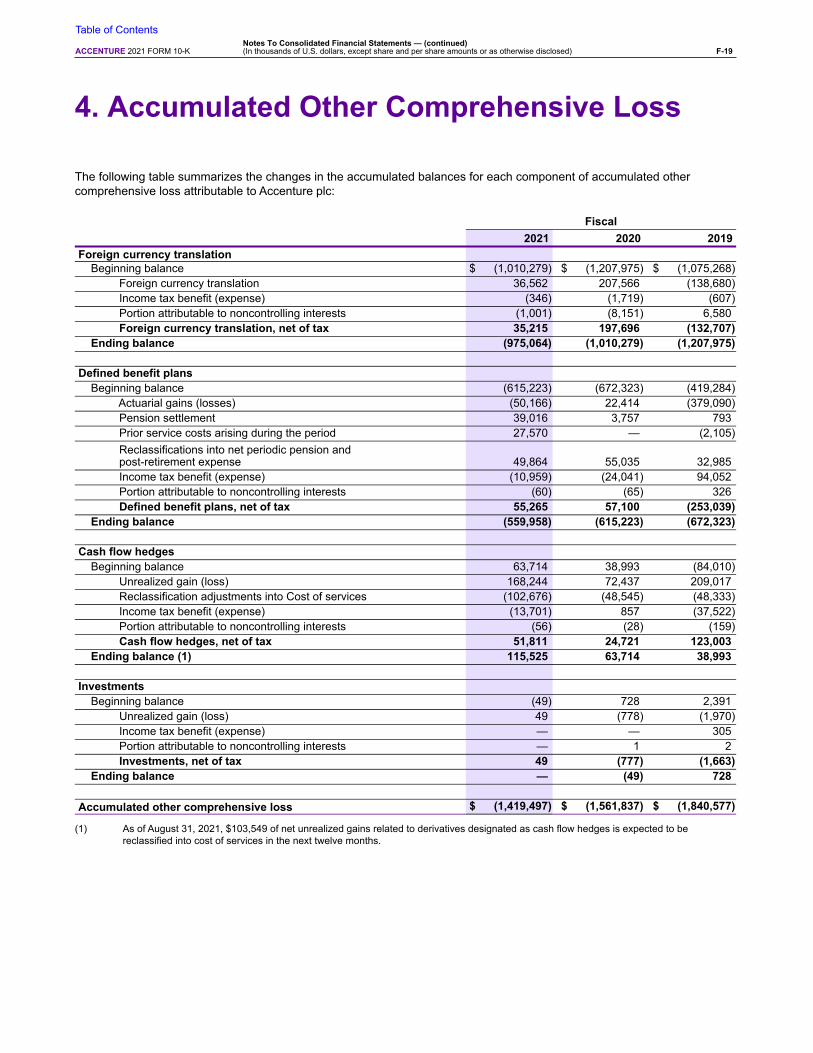
4. Accumulated Other Comprehensive Loss
The following table summarizes the changes in the accumulated balances for each component of accumulated other comprehensive loss attributable to Accenture plc:
Fiscal2021 2020 2019
Foreign currency translation Beginning balance $ (1,010,279) $ (1,207,975) $ (1,075,268) Foreign currency translation 36,562 207,566 (138,680) Income tax benefit (expense) (346) (1,719) (607) Portion attributable to noncontrolling interests (1,001) (8,151) 6,580 Foreign currency translation, net of tax 35,215 197,696 (132,707) Ending balance (975,064) (1,010,279) (1,207,975)
Defined benefit plans Beginning balance (615,223) (672,323) (419,284) Actuarial gains (losses) (50,166) 22,414 (379,090) Pension settlement 39,016 3,757 793 Prior service costs arising during the period 27,570 — (2,105) Reclassifications into net periodic pension and post-retirement expense 49,864 55,035 32,985 Income tax benefit (expense) (10,959) (24,041) 94,052 Portion attributable to noncontrolling interests (60) (65) 326 Defined benefit plans, net of tax 55,265 57,100 (253,039) Ending balance (559,958) (615,223) (672,323)
Cash flow hedges Beginning balance 63,714 38,993 (84,010) Unrealized gain (loss) 168,244 72,437 209,017 Reclassification adjustments into Cost of services (102,676) (48,545) (48,333) Income tax benefit (expense) (13,701) 857 (37,522) Portion attributable to noncontrolling interests (56) (28) (159) Cash flow hedges, net of tax 51,811 24,721 123,003 Ending balance (1) 115,525 63,714 38,993
Investments Beginning balance (49) 728 2,391 Unrealized gain (loss) 49 (778) (1,970) Income tax benefit (expense) — — 305 Portion attributable to noncontrolling interests — 1 2 Investments, net of tax 49 (777) (1,663) Ending balance — (49) 728
Accumulated other comprehensive loss $ (1,419,497) $ (1,561,837) $ (1,840,577)
(1) As of August 31, 2021, $103,549 of net unrealized gains related to derivatives designated as cash flow hedges is expected to be reclassified into cost of services in the next twelve months.
Table of ContentsNotes To Consolidated Financial Statements — (continued)(In thousands of U.S. dollars, except share and per share amounts or as otherwise disclosed)ACCENTURE 2021 FORM 10-K F-19
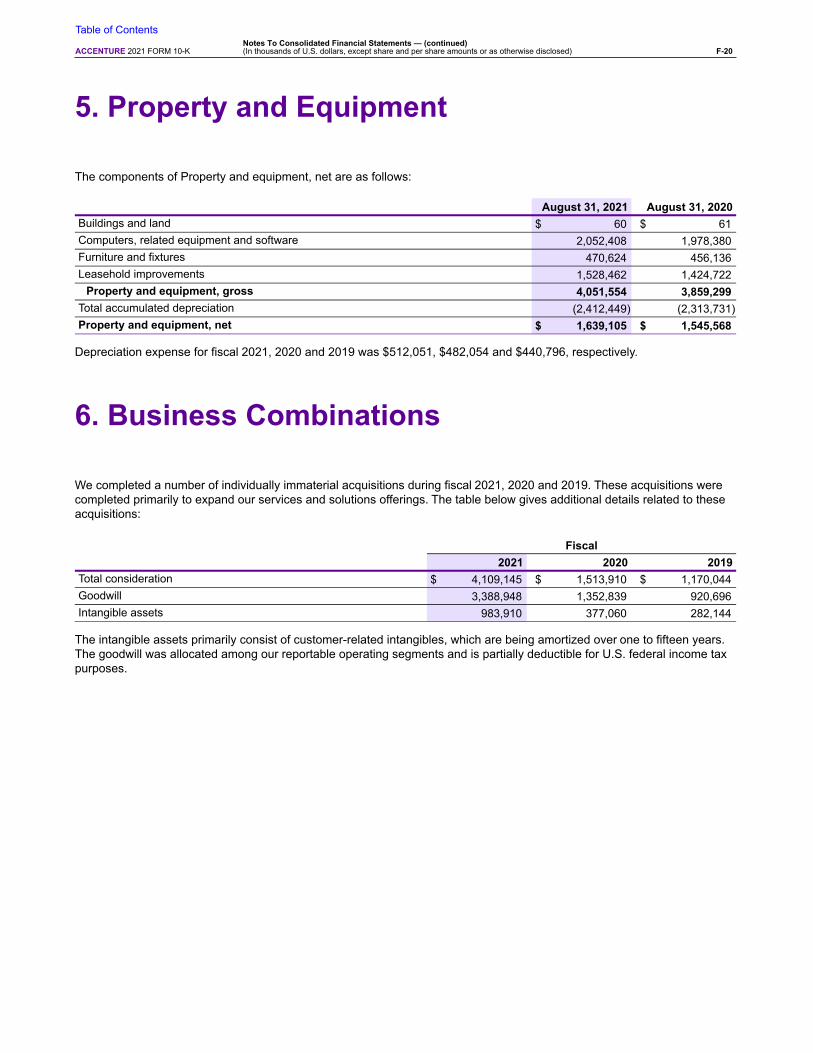
5. Property and Equipment
The components of Property and equipment, net are as follows:
August 31, 2021 August 31, 2020Buildings and land $ 60 $ 61 Computers, related equipment and software 2,052,408 1,978,380 Furniture and fixtures 470,624 456,136 Leasehold improvements 1,528,462 1,424,722
Property and equipment, gross 4,051,554 3,859,299 Total accumulated depreciation (2,412,449) (2,313,731) Property and equipment, net $ 1,639,105 $ 1,545,568
Depreciation expense for fiscal 2021, 2020 and 2019 was $512,051, $482,054 and $440,796, respectively.
6. Business Combinations
We completed a number of individually immaterial acquisitions during fiscal 2021, 2020 and 2019. These acquisitions were completed primarily to expand our services and solutions offerings. The table below gives additional details related to these acquisitions:
Fiscal2021 2020 2019
Total consideration $ 4,109,145 $ 1,513,910 $ 1,170,044 Goodwill 3,388,948 1,352,839 920,696 Intangible assets 983,910 377,060 282,144
The intangible assets primarily consist of customer-related intangibles, which are being amortized over one to fifteen years. The goodwill was allocated among our reportable operating segments and is partially deductible for U.S. federal income tax purposes.
Table of ContentsNotes To Consolidated Financial Statements — (continued)(In thousands of U.S. dollars, except share and per share amounts or as otherwise disclosed)ACCENTURE 2021 FORM 10-K F-20

7. Goodwill and Intangible Assets
Goodwill
The changes in the carrying amount of goodwill by reportable operating segment are as follows:
August 31,2019
Additions/Adjustments
ForeignCurrency
TranslationAugust 31,
2020Additions/
Adjustments
ForeignCurrency
TranslationAugust 31,
2021GEOGRAPHIC MARKETSNorth America $ 3,973,356 $ 628,458 $ 2,627 $ 4,604,441 $ 2,010,303 $ 3,454 $ 6,618,198 Europe 1,569,223 420,413 148,452 2,138,088 1,179,932 11,726 3,329,746 Growth Markets 662,971 289,598 14,722 967,291 205,469 5,157 1,177,917 Total $ 6,205,550 $ 1,338,469 $ 165,801 $ 7,709,820 $ 3,395,704 $ 20,337 $ 11,125,861
Goodwill includes immaterial adjustments related to prior period acquisitions.
Intangible Assets Our definite-lived intangible assets by major asset class are as follows:
August 31, 2020 August 31, 2021
Intangible Asset Class
Gross Carrying Amount
Accumulated Amortization
Net Carrying Amount
Gross Carrying Amount
Accumulated Amortization
Net Carrying Amount
Customer-related $ 1,319,332 $ (495,367) $ 823,965 $ 2,068,156 $ (654,460) $ 1,413,696
Technology 150,765 (55,543) 95,222 250,481 (54,391) 196,090
Patents 129,295 (66,954) 62,341 126,202 (66,650) 59,552
Other 82,676 (34,986) 47,690 70,407 (28,807) 41,600
Total $ 1,682,068 $ (652,850) $ 1,029,218 $ 2,515,246 $ (804,308) $ 1,710,938
Total amortization related to our intangible assets was $312,706, $239,664 and $177,150 for fiscal 2021, 2020 and 2019, respectively. Estimated future amortization related to intangible assets held as of August 31, 2021 is as follows:
Fiscal Year Estimated Amortization2022 $ 352,776 2023 286,589 2024 260,069 2025 237,270 2026 191,099 Thereafter 383,135 Total $ 1,710,938
Table of ContentsNotes To Consolidated Financial Statements — (continued)(In thousands of U.S. dollars, except share and per share amounts or as otherwise disclosed)ACCENTURE 2021 FORM 10-K F-21

8. Leases
On September 1, 2019, we adopted FASB ASU No. 2016-02, Leases, and related updates (“Topic 842”) using the effective date method. Prior period amounts were not adjusted. The primary impact of adoption is the requirement for lessees to recognize assets and liabilities on the balance sheet for the rights and obligations created by both operating and finance leases. Enhanced quantitative and qualitative disclosures about leasing arrangements are also required. We elected the package of practical expedients which does not require reassessment of prior conclusions related to identifying leases, lease classification or initial direct costs. We also elected the practical expedient to combine lease and non-lease components, accounting for the combined components as a single lease component, for our office real estate and automobile leases. The standard did not have a material impact on our Consolidated Income Statement.
As a lessee, substantially all of our lease obligation is for office real estate. Our significant judgments used in determining our lease obligation include whether a contract is or contains a lease and the determination of the discount rate used to calculate the lease liability. We elected the practical expedient not to separate lease and associated non-lease components, accounting for them as a single combined lease component, for our office real estate and automobile leases.
Our leases may include the option to extend or terminate before the end of the contractual term and are often non-cancelable or cancelable only by the payment of penalties. Our lease assets and liabilities include these options in the lease term when it is reasonably certain that they will be exercised. In certain cases, we sublease excess office real estate to third-party tenants.
Lease assets and liabilities recognized at the lease commencement date are determined predominantly as the present value of the payments due over the lease term. Since we cannot determine the implicit rate in our leases, we use our incremental borrowing rate on that date to calculate the present value. Our incremental borrowing rate approximates the rate at which we could borrow, on a secured basis for a similar term, an amount equal to our lease payments in a similar economic environment.
When we are the lessee, all leases are recognized as lease liabilities and associated lease assets on the Consolidated Balance Sheet. Lease liabilities represent our obligation to make payments arising from the lease. Lease assets represent our right to use an underlying asset for the lease term and may also include advance payments, initial direct costs, or lease incentives. Payments that depend upon an index or rate, such as the Consumer Price Index (CPI), are included in the recognition of lease assets and liabilities at the commencement-date rate. Other variable payments, such as common area maintenance, property and other taxes, utilities and insurance that are based on the lessor’s cost, are recognized in the Consolidated Income Statement in the period incurred.
As of August 31, 2021 and 2020, we had no material finance leases. Operating lease expense is recorded on a straight-line basis over the lease term. Lease costs are as follows:
Fiscal 2021 2020Operating lease cost $ 765,232 $ 749,233 Variable lease cost 176,426 181,612 Sublease income (23,717) (27,192)
$ 917,941 $ 903,653
Supplemental information related to operating lease transactions is as follows:
Fiscal2021 2020
Lease liability payments $ 753,167 $ 725,892 Lease assets obtained in exchange for liabilities 599,866 592,026
As of August 31, 2021 and 2020, our operating leases had a weighted average remaining lease term of 7.3 years and a weighted average discount rate of 3.9% and 4.2%, respectively.
Table of ContentsNotes To Consolidated Financial Statements — (continued)(In thousands of U.S. dollars, except share and per share amounts or as otherwise disclosed)ACCENTURE 2021 FORM 10-K F-22

The following maturity analysis presents future undiscounted cash outflows (inflows) for operating leases as of August 31, 2021:
Lease Payments
Sublease Receipts
2022 $ 757,020 $ (13,029) 2023 667,204 (12,088) 2024 558,848 (10,787) 2025 448,858 (8,288) 2026 335,658 (7,269) Thereafter 1,144,549 (19,895) Total lease payments (receipts) $ 3,912,137 $ (71,356) Less interest (471,056) Total lease liabilities $ 3,441,081
As of August 31, 2021, we have entered into leases that have not yet commenced with future lease payments of $282 million that are not reflected in the table above. These leases are primarily related to office real estate and will commence in fiscal 2022 with lease terms of up to 16 years.
Table of ContentsNotes To Consolidated Financial Statements — (continued)(In thousands of U.S. dollars, except share and per share amounts or as otherwise disclosed)ACCENTURE 2021 FORM 10-K F-23

9. Financial Instruments
Derivatives In the normal course of business, we use derivative financial instruments to manage foreign currency exchange rate risk. Derivative transactions are governed by a uniform set of policies and procedures covering areas such as authorization, counterparty exposure and hedging practices. Positions are monitored using techniques such as market value and sensitivity analyses. We do not enter into derivative transactions for trading purposes. We classify cash flows from our derivative programs as cash flows from operating activities in the Consolidated Cash Flows Statements.
Certain derivatives give rise to credit risks from the possible non-performance by counterparties. Credit risk is generally limited to the fair value of those contracts that are favorable to us, and the maximum amount of loss due to credit risk, based on the gross fair value of our derivative financial instruments that are in an asset position, was $211,988 as of August 31, 2021.
We utilize standard counterparty master agreements containing provisions for the netting of certain foreign currency transaction obligations and for set-off of certain obligations in the event of an insolvency of one of the parties to the transaction. These provisions may reduce our potential overall loss resulting from the insolvency of a counterparty and reduce a counterparty’s potential overall loss resulting from our insolvency. Additionally, these agreements contain early termination provisions triggered by adverse changes in a counterparty’s credit rating, thereby enabling us to accelerate settlement of a transaction prior to its contractual maturity and potentially decrease our realized loss on an open transaction. Similarly, a decrement in our credit rating could trigger a counterparty’s early termination rights, thereby enabling a counterparty to accelerate settlement of a transaction prior to its contractual maturity and potentially increase our realized loss on an open transaction. The aggregate fair value of our derivative instruments with credit-risk-related contingent features that were in a liability position as of August 31, 2021 was $18,066.
Our derivative financial instruments consist of deliverable and non-deliverable foreign currency forward contracts. Fair values for derivative financial instruments are based on prices computed using third-party valuation models and are classified as Level 2 in accordance with the three-level hierarchy of fair value measurements. All of the significant inputs to the third-party valuation models are observable in active markets. Inputs include current market-based parameters such as forward rates and yield curves. For additional information related to the three-level hierarchy of fair value measurements, see Note 12 (Retirement and Profit Sharing Plans) to these Consolidated Financial Statements.
Cash Flow Hedges Certain of our subsidiaries are exposed to currency risk through their use of our global delivery resources. To mitigate this risk, we use foreign currency forward contracts to hedge the foreign exchange risk of the forecasted intercompany expenses denominated in foreign currencies for up to three years in the future. We have designated these derivatives as cash flow hedges. As of August 31, 2021 and 2020, we held no derivatives that were designated as fair value or net investment hedges.
In order for a derivative to qualify for hedge accounting, the derivative must be formally designated as a fair value, cash flow or net investment hedge by documenting the relationship between the derivative and the hedged item. The documentation includes a description of the hedging instrument, the hedged item, the risk being hedged, our risk management objective and strategy for undertaking the hedge, the method for assessing the effectiveness of the hedge and the method for measuring hedge ineffectiveness. Additionally, the hedge relationship must be expected to be highly effective at offsetting changes in either the fair value or cash flows of the hedged item at both inception of the hedge and on an ongoing basis.
For a cash flow hedge, the effective portion of the change in estimated fair value of a hedging instrument is recorded in Accumulated other comprehensive loss as a separate component of Shareholders’ Equity and is reclassified into Cost of services in the Consolidated Income Statements during the period in which the hedged transaction is recognized. The amounts related to derivatives designated as cash flow hedges that were reclassified into Cost of services were net gains of $102,676, $48,545 and $48,333 during fiscal 2021, 2020 and 2019, respectively. The ineffective portion of the change in fair value of a cash flow hedge is recognized immediately in Other income (expense), net in the Consolidated Income Statements and for fiscal 2021, 2020 and 2019, was not material. In addition, we did not discontinue any cash flow hedges during fiscal 2021, 2020 or 2019.
Table of ContentsNotes To Consolidated Financial Statements — (continued)(In thousands of U.S. dollars, except share and per share amounts or as otherwise disclosed)ACCENTURE 2021 FORM 10-K F-24

Other Derivatives We also use foreign currency forward contracts, which have not been designated as hedges, to hedge balance sheet exposures, such as intercompany loans. These instruments are generally short-term in nature, with typical maturities of less than one year, and are subject to fluctuations in foreign exchange rates. Realized gains or losses and changes in the estimated fair value of these derivatives were net gains of $15,370, and $111,623 for fiscal 2021 and 2020, respectively, and a net loss of $112,113 for fiscal 2019. Gains and losses on these contracts are recorded in Other income (expense), net in the Consolidated Income Statements and are offset by gains and losses on the related hedged items.
Fair Value of Derivative Instruments The notional and fair values of all derivative instruments are as follows:
August 31, 2021 August 31, 2020Assets
Cash Flow HedgesOther current assets $ 109,416 $ 75,871 Other non-current assets 70,250 50,914
Other DerivativesOther current assets 32,322 27,964
Total assets $ 211,988 $ 154,749 Liabilities
Cash Flow HedgesOther accrued liabilities $ 5,867 $ 13,614 Other non-current liabilities 8,585 13,576
Other DerivativesOther accrued liabilities 3,614 11,828
Total liabilities $ 18,066 $ 39,018 Total fair value $ 193,922 $ 115,731 Total notional value $ 10,045,903 $ 9,600,691
We utilize standard counterparty master agreements containing provisions for the netting of certain foreign currency transaction obligations and for the set-off of certain obligations in the event of an insolvency of one of the parties to the transaction. In the Consolidated Balance Sheets, we record derivative assets and liabilities at gross fair value. The potential effect of netting derivative assets against liabilities under the counterparty master agreements is as follows:
August 31, 2021 August 31, 2020Net derivative assets $ 193,936 $ 129,520 Net derivative liabilities 14 13,789 Total fair value $ 193,922 $ 115,731
Table of ContentsNotes To Consolidated Financial Statements — (continued)(In thousands of U.S. dollars, except share and per share amounts or as otherwise disclosed)ACCENTURE 2021 FORM 10-K F-25
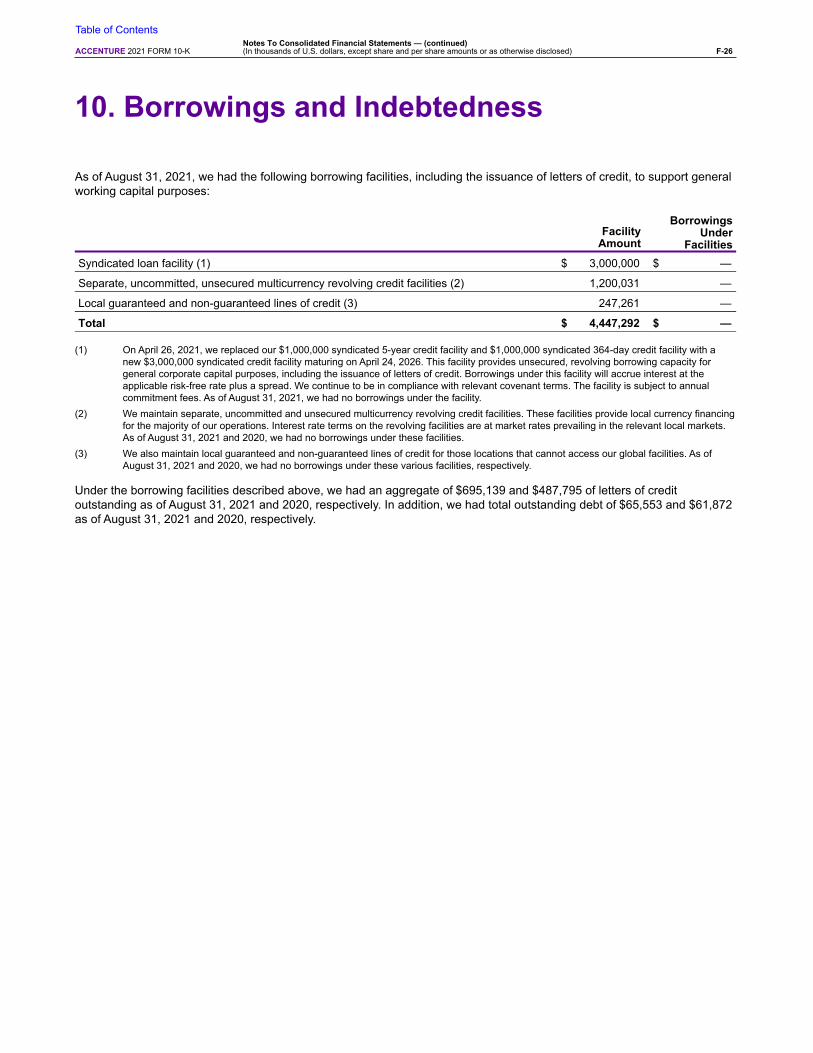
10. Borrowings and Indebtedness
As of August 31, 2021, we had the following borrowing facilities, including the issuance of letters of credit, to support general working capital purposes:
FacilityAmount
BorrowingsUnder
FacilitiesSyndicated loan facility (1) $ 3,000,000 $ —
Separate, uncommitted, unsecured multicurrency revolving credit facilities (2) 1,200,031 —
Local guaranteed and non-guaranteed lines of credit (3) 247,261 —
Total $ 4,447,292 $ —
(1) On April 26, 2021, we replaced our $1,000,000 syndicated 5-year credit facility and $1,000,000 syndicated 364-day credit facility with a new $3,000,000 syndicated credit facility maturing on April 24, 2026. This facility provides unsecured, revolving borrowing capacity for general corporate capital purposes, including the issuance of letters of credit. Borrowings under this facility will accrue interest at the applicable risk-free rate plus a spread. We continue to be in compliance with relevant covenant terms. The facility is subject to annual commitment fees. As of August 31, 2021, we had no borrowings under the facility.
(2) We maintain separate, uncommitted and unsecured multicurrency revolving credit facilities. These facilities provide local currency financing for the majority of our operations. Interest rate terms on the revolving facilities are at market rates prevailing in the relevant local markets. As of August 31, 2021 and 2020, we had no borrowings under these facilities.
(3) We also maintain local guaranteed and non-guaranteed lines of credit for those locations that cannot access our global facilities. As of August 31, 2021 and 2020, we had no borrowings under these various facilities, respectively.
Under the borrowing facilities described above, we had an aggregate of $695,139 and $487,795 of letters of credit outstanding as of August 31, 2021 and 2020, respectively. In addition, we had total outstanding debt of $65,553 and $61,872 as of August 31, 2021 and 2020, respectively.
Table of ContentsNotes To Consolidated Financial Statements — (continued)(In thousands of U.S. dollars, except share and per share amounts or as otherwise disclosed)ACCENTURE 2021 FORM 10-K F-26

11. Income Taxes
Fiscal 2021 2020 2019Current taxes
U.S. federal $ 218,064 $ 99,280 $ 159,578 U.S. state and local 95,662 26,425 86,113 Non-U.S. 1,395,915 1,292,362 1,256,225
Total current tax expense 1,709,641 1,418,067 1,501,916 Deferred taxes
U.S. federal 7,767 21,532 (143,217) U.S. state and local (5,400) 8,525 (39,588) Non-U.S. 58,563 140,894 86,445
Total deferred tax (benefit) expense 60,930 170,951 (96,360) Total $ 1,770,571 $ 1,589,018 $ 1,405,556
The components of Income before income taxes are as follows:
Fiscal 2021 2020 2019U.S. sources $ 1,597,820 $ 1,352,968 $ 853,173 Non-U.S. sources 6,163,296 5,421,363 5,398,624 Total $ 7,761,116 $ 6,774,331 $ 6,251,797
The reconciliation of the U.S. federal statutory income tax rate to our effective income tax rate is as follows:
Fiscal 2021 2020 (2) 2019 (2)U.S. federal statutory income tax rate 21.0 % 21.0 % 21.0 %U.S. state and local taxes, net 1.2 1.2 1.0 Non-U.S. operations taxed at other rates 1.1 1.2 1.6 Final determinations (1) (1.7) (1.9) (3.4) Other net activity in unrecognized tax benefits 2.8 2.4 3.2 Excess tax benefits from share based payments (2.1) (1.9) (1.2) Other, net 0.5 1.5 0.3 Effective income tax rate 22.8 % 23.5 % 22.5 %
(1) Final determinations include final agreements with tax authorities and expirations of statutes of limitations. (2) Prior period amounts have been reclassified to conform with the current period presentation.
As of August 31, 2021, we had not recognized a deferred tax liability on approximately $1,900,000 of undistributed earnings for certain foreign subsidiaries, because these earnings are intended to be indefinitely reinvested. If such earnings were distributed, some countries may impose additional taxes. The unrecognized deferred tax liability (the amount payable if distributed) is approximately $100,000.
Portions of our operations are subject to reduced tax rates or are free of tax under various tax holidays which expire between fiscal 2022 and 2031. The income tax benefits attributable to the tax status of these subsidiaries were estimated to be approximately $37,000, $38,000 and $95,000 in fiscal 2021, 2020 and 2019, respectively.
The revaluation of deferred tax assets and liabilities due to enacted changes in tax laws and tax rates did not have a material impact on our effective tax rate in fiscal 2021, 2020, or 2019.
Table of ContentsNotes To Consolidated Financial Statements — (continued)(In thousands of U.S. dollars, except share and per share amounts or as otherwise disclosed)ACCENTURE 2021 FORM 10-K F-27

The components of our deferred tax assets and liabilities included the following:
August 31, 2021 August 31, 2020 (1)Deferred tax assets
Pensions $ 474,934 $ 443,231 Revenue recognition 120,990 115,287 Compensation and benefits 726,430 574,349 Share-based compensation 355,157 334,061 Tax credit carryforwards 915,382 659,835 Net operating loss carryforwards 196,611 159,506 Deferred amortization deductions 857,441 828,098 Indirect effects of unrecognized tax benefits 285,768 279,105 Licenses and other intangibles 1,533,152 1,752,612 Leases 704,200 729,787 Other 305,575 280,883 Total deferred tax assets 6,475,640 6,156,754
Valuation allowance (1,001,245) (757,799) Deferred tax assets, net of valuation allowance 5,474,395 5,398,955
Deferred tax liabilitiesInvestments in subsidiaries (142,635) (169,752) Intangibles (480,588) (298,181) Leases (648,419) (669,005) Property and equipment (92,271) (56,218) Other (346,988) (232,356) Total deferred tax liabilities (1,710,901) (1,425,512)
Net deferred tax assets $ 3,763,494 $ 3,973,443
(1) Prior period amounts have been reclassified to conform with the current period presentation.
We recorded valuation allowances of $1,001,245 and $757,799 as of August 31, 2021 and 2020, respectively, against deferred tax assets principally associated with certain tax credit and tax net operating loss carryforwards, as we believe it is more likely than not that these assets will not be realized. For all other deferred tax assets, we believe it is more likely than not that the results of future operations will generate sufficient taxable income to realize these deferred tax assets. During fiscal 2021 and 2020, we recorded net increases of $243,446 and $151,034 in the valuation allowance, respectively, primarily related to valuation allowances on certain tax credit carryforwards, as we believe it is more likely than not that these assets will not be realized.
We had tax credit carryforwards as of August 31, 2021 of $915,382, of which $25,858 will expire between 2022 and 2031, $52 will expire between 2032 and 2041, and $889,472 has an indefinite carryforward period. We had net operating loss carryforwards as of August 31, 2021 of $903,589. Of this amount, $86,729 expires between 2022 and 2031, $100,270 expires between 2032 and 2041, and $716,590 has an indefinite carryforward period.
As of August 31, 2021, we had $1,344,460 of unrecognized tax benefits, of which $1,028,090, if recognized, would favorably affect our effective tax rate. As of August 31, 2020, we had $1,238,945 of unrecognized tax benefits, of which $934,183, if recognized, would favorably affect our effective tax rate. The remaining unrecognized tax benefits as of August 31, 2021 and 2020 of $316,370 and $304,762, respectively, represent items recorded as offsetting tax benefits associated with the correlative effects of potential transfer pricing adjustments, state income taxes and timing adjustments.
Table of ContentsNotes To Consolidated Financial Statements — (continued)(In thousands of U.S. dollars, except share and per share amounts or as otherwise disclosed)ACCENTURE 2021 FORM 10-K F-28

A reconciliation of the beginning and ending amounts of unrecognized tax benefits is as follows:
Fiscal 2021 2020Balance, beginning of year $ 1,238,945 $ 1,233,014
Additions for tax positions related to the current year 187,741 168,938 Additions for tax positions related to prior years 115,518 58,977 Reductions for tax positions related to prior years (133,349) (177,812) Statute of limitations expirations (62,614) (51,477) Settlements with tax authorities (3,374) (11,602) Foreign currency translation 1,593 18,907
Balance, end of year $ 1,344,460 $ 1,238,945
For the year ended August 31, 2021, some of the additions for tax positions related to prior years are for items that had no net impact to the consolidated financial statements.
We recognize interest and penalties related to unrecognized tax benefits in our Income tax expense. During fiscal 2021, 2020 and 2019, we recognized expense of $35,285, $21,140 and $8,645 in interest and penalties, respectively. Accrued interest and penalties related to unrecognized tax benefits of $166,846 ($151,184, net of tax benefits) and $129,597 ($118,533, net of tax benefits) were reflected on our Consolidated Balance Sheets as of August 31, 2021 and 2020, respectively.
We have participated in the U.S. Internal Revenue Service (“IRS”) Compliance Assurance Process (“CAP”) program since fiscal 2016. CAP tax years are examined by the IRS on a contemporaneous basis so that most issues are resolved prior to filing the tax return. We are currently under audit in numerous state and non-U.S. tax jurisdictions. However, with limited exceptions, we are no longer subject to income tax audits by those taxing authorities for years before 2014. Although the outcome of tax audits is always uncertain and could result in significant cash tax payments, we do not believe the outcome of these audits will have a material adverse effect on our consolidated financial position or results of operations. We believe that it is reasonably possible that our unrecognized tax benefits could decrease by approximately $300,000 or increase by approximately $420,000 in the next 12 months as a result of settlements, lapses of statutes of limitations, tax audit activity and other adjustments. The majority of these amounts relate to transfer pricing matters in both U.S. and non-U.S. tax jurisdictions.
Table of ContentsNotes To Consolidated Financial Statements — (continued)(In thousands of U.S. dollars, except share and per share amounts or as otherwise disclosed)ACCENTURE 2021 FORM 10-K F-29

12. Retirement and Profit Sharing Plans
Defined Benefit Pension and Postretirement Plans In the United States and certain other countries, we maintain and administer defined benefit retirement plans and postretirement medical plans for certain current, retired and resigned employees. In addition, our U.S. defined benefit pension plans include a frozen plan for former pre-incorporation partners, which is unfunded. Benefits under the employee retirement plans are primarily based on years of service and compensation during the years immediately preceding retirement or termination of participation in the plan. The defined benefit pension disclosures include our U.S. and material non-U.S. defined benefit pension plans.
Assumptions
The weighted-average assumptions used to determine the defined benefit pension obligations as of August 31 and the net periodic pension expense are as follows:
Pension Plans Postretirement Plans
August 31,
2021August 31,
2020August 31,
2019August 31,
2021August 31,
2020August 31,
2019
U.S.
Plans
Non-U.S.
PlansU.S.
Plans
Non-U.S.
PlansU.S.
Plans
Non-U.S.
Plans
U.S. and Non-U.S.
Plans
U.S. and Non-U.S.
Plans
U.S. and Non-U.S.
PlansDiscount rate for determining projected benefit obligation 2.50 % 2.41 % 2.50 % 2.27 % 3.00 % 2.24 % 2.53 % 2.51 % 3.00 %Discount rate for determining net periodic pension expense 2.50 % 2.27 % 3.00 % 2.24 % 4.00 % 3.29 % 2.51 % 3.00 % 3.98 %Long term rate of return on plan assets 3.50 % 2.63 % 4.25 % 2.81 % 4.25 % 3.02 % 3.06 % 3.45 % 3.18 %Rate of increase in future compensation for determining projected benefit obligation 2.09 % 4.48 % 2.21 % 4.04 % 2.23 % 4.02 % N/A N/A N/ARate of increase in future compensation for determining net periodic pension expense 2.21 % 4.04 % 2.23 % 4.02 % 2.23 % 3.67 % N/A N/A N/AInterest crediting rate for determining projected benefit obligation N/A 0.77 % N/A 0.68 % N/A 0.69 % N/A N/A N/AInterest crediting rate for determining net periodic pension expense N/A 0.68 % N/A 0.69 % N/A 1.47 % N/A N/A N/A
We utilize a full yield curve approach to estimate the service and interest cost components by applying specific spot rates along the yield curve used in the determination of the benefit obligation to the relevant projected cash flows. This approach provides a correlation between projected benefit cash flows and the corresponding yield curve spot rates and provides a precise measurement of service and interest costs. The discount rate assumptions are based on the expected duration of the benefit payments for each of our defined benefit pension and postretirement plans as of the annual measurement date and are subject to change each year.
The expected long-term rate of return on plan assets should, over time, approximate the actual long-term returns on defined benefit pension and postretirement plan assets and is based on historical returns and the future expectations for returns for each asset class, as well as the target asset allocation of the asset portfolio.
Assumed U.S. Health Care Cost Trend Our U.S. postretirement plan assumed annual rate of increase in the per capita cost of health care benefits is 6.2% for the plan year ending August 31, 2022. The rate is assumed to decrease on a straight-line basis to 4.0% for the plan year ending August 31, 2046 and remain at that level thereafter.
Table of ContentsNotes To Consolidated Financial Statements — (continued)(In thousands of U.S. dollars, except share and per share amounts or as otherwise disclosed)ACCENTURE 2021 FORM 10-K F-30

Pension and Postretirement Expense Pension expense for fiscal 2021, 2020 and 2019 was $169,471, $168,367 and $137,030, respectively. Postretirement expense for fiscal 2021, 2020 and 2019 was not material to our Consolidated Financial Statements. The service cost component of pension and postretirement expense is included in operating expenses while the other components of net benefit cost are included in Other income (expense), net.
Benefit Obligation, Plan Assets and Funded Status The changes in the benefit obligations, plan assets and funded status of our pension and postretirement benefit plans for fiscal 2021 and 2020 are as follows:
Pension Plans Postretirement Plans
August 31,
2021August 31,
2020August 31,
2021August 31,
2020
U.S. PlansNon-
U.S. Plans U.S. PlansNon-
U.S. Plans
U.S. and Non-U.S.
Plans
U.S. and Non-U.S.
PlansReconciliation of benefit obligationBenefit obligation, beginning of year $ 408,266 $ 2,357,405 $ 383,557 $ 2,166,377 $ 649,328 $ 576,596
Service cost 2,579 113,882 3,080 108,871 25,307 22,142 Interest cost 7,628 47,692 9,771 44,395 13,775 15,647 Participant contributions — 13,241 — 12,521 — — Acquisitions/divestitures/transfers — 117,422 — 14 — — Amendments — (21,356) — — (6,214) — Curtailment — (1,381) — — — — Pension settlement — (211,506) — (188) — — Actuarial (gain) loss 3,731 45,063 26,495 (12,278) 60,095 46,630 Benefits paid (15,876) (124,531) (14,637) (94,136) (9,357) (12,115) Exchange rate impact — 1,189 — 131,829 1,337 428
Benefit obligation, end of year $ 406,328 $ 2,337,120 $ 408,266 $ 2,357,405 $ 734,271 $ 649,328 Reconciliation of fair value of plan assetsFair value of plan assets, beginning of year $ 281,189 $ 1,355,707 $ 257,280 $ 1,214,062 $ 31,826 $ 31,920
Actual return on plan assets 5,481 88,056 27,911 46,815 481 2,079 Acquisitions/divestitures/transfers — 94,635 — — — — Employer contributions 20,858 97,217 10,635 88,068 9,600 9,942 Participant contributions — 13,241 — 12,521 — — Pension settlement — (211,506) — — — — Benefits paid (15,876) (124,531) (14,637) (94,136) (9,357) (12,115) Exchange rate impact — 13,440 — 89,049 — — Other — — — (672) — —
Fair value of plan assets, end of year $ 291,652 $ 1,326,259 $ 281,189 $ 1,355,707 $ 32,550 $ 31,826 Funded status, end of year $ (114,676) $ (1,010,861) $ (127,077) $ (1,001,698) $ (701,721) $ (617,502) Amounts recognized in the Consolidated Balance Sheets
Non-current assets $ 9,543 $ 166,478 $ 3,232 $ 67,341 $ — $ — Current liabilities (10,651) (53,097) (10,213) (42,990) (1,266) (1,169) Non-current liabilities (113,568) (1,124,242) (120,096) (1,026,049) (700,455) (616,333)
Funded status, end of year $ (114,676) $ (1,010,861) $ (127,077) $ (1,001,698) $ (701,721) $ (617,502)
Table of ContentsNotes To Consolidated Financial Statements — (continued)(In thousands of U.S. dollars, except share and per share amounts or as otherwise disclosed)ACCENTURE 2021 FORM 10-K F-31

Accumulated Other Comprehensive Loss The pre-tax accumulated net loss and prior service (credit) cost recognized in Accumulated other comprehensive loss as of August 31, 2021 and 2020 is as follows:
Pension Plans Postretirement Plans
August 31,
2021August 31,
2020August 31,
2021August 31,
2020
U.S. PlansNon-U.S.
Plans U.S. PlansNon-U.S.
Plans
U.S. and Non-U.S.
Plans
U.S. and Non-U.S.
PlansNet loss $ 109,433 $ 525,172 $ 108,796 $ 605,635 $ 208,784 $ 160,067 Prior service (credit) cost — (2,704) — 20,056 7,080 15,114 Accumulated other comprehensive loss, pre-tax $ 109,433 $ 522,468 $ 108,796 $ 625,691 $ 215,864 $ 175,181
Funded Status for Defined Benefit Plans The accumulated benefit obligation for defined benefit pension plans as of August 31, 2021 and 2020 is as follows:
August 31,
2021August 31,
2020
U.S. PlansNon-U.S.
Plans U.S. PlansNon-U.S.
PlansAccumulated benefit obligation $ 401,527 $ 1,989,178 $ 401,822 $ 2,135,566
The following information is provided for defined benefit pension plans and postretirement plans with projected benefit obligations in excess of plan assets and for defined benefit pension plans with accumulated benefit obligations in excess of plan assets as of August 31, 2021 and 2020:
Pension Plans Postretirement Plans
August 31,
2021August 31,
2020August 31,
2021August 31,
2020
U.S. PlansNon-U.S.
Plans U.S. PlansNon-U.S.
Plans
U.S. and Non-U.S.
Plans
U.S. and Non-U.S.
PlansProjected benefit obligation in excess of plan assetsProjected benefit obligation $ 124,219 $ 1,716,981 $ 130,309 $ 1,644,895 $ 734,271 $ 649,328 Fair value of plan assets — 539,641 — 575,857 32,550 31,826
August 31,
2021August 31,
2020
U.S. PlansNon-U.S.
Plans U.S. PlansNon-U.S.
PlansAccumulated benefit obligation in excess of plan assetsAccumulated benefit obligation $ 124,219 $ 1,321,965 $ 130,309 $ 1,438,234 Fair value of plan assets — 379,567 — 575,857
Investment Strategies U.S. Pension PlansThe overall investment objective of the defined benefit pension plans is to match the duration of the plans’ assets to the plans’ liabilities while managing risk in order to meet current defined benefit pension obligations. The plans’ future prospects, their current financial conditions, our current funding levels and other relevant factors suggest that the plans can tolerate some interim fluctuations in market value and rates of return in order to achieve long-term objectives without undue risk to the plans’ ability to meet their current benefit obligations. We recognize that asset allocation of the defined benefit pension plans’ assets is an important factor in determining long-term performance. Actual asset allocations at any point in time may
Table of ContentsNotes To Consolidated Financial Statements — (continued)(In thousands of U.S. dollars, except share and per share amounts or as otherwise disclosed)ACCENTURE 2021 FORM 10-K F-32

vary from the target asset allocations and will be dictated by current and anticipated market conditions, required cash flows and investment decisions of the investment committee and the pension plans’ investment funds and managers. Ranges are established to provide flexibility for the asset allocation to vary around the targets without the need for immediate rebalancing.
Non-U.S. Pension Plans Plan assets in non-U.S. defined benefit pension plans conform to the investment policies and procedures of each plan and to relevant legislation. The pension committee or trustee of each plan regularly, but at least annually, reviews the investment policy and the performance of the investment managers. In certain countries, the trustee is also required to consult with us. Asset allocation decisions are made to provide risk adjusted returns that align with the overall investment strategy for each plan. Generally, the investment return objective of each plan is to achieve a total annualized rate of return that exceeds inflation over the long term by an amount based on the target asset allocation mix of that plan. In certain countries, plan assets are invested in funds that are required to hold a majority of assets in bonds, with a smaller proportion in equities. Also, certain plan assets are entirely invested in contracts held with the plan insurer, which determines the strategy. Defined benefit pension plans in certain countries are unfunded.
Risk Management Plan investments are exposed to risks including market, interest rate and operating risk. In order to mitigate significant concentrations of these risks, the assets are invested in a diversified portfolio primarily consisting of fixed income instruments and equities. To minimize asset volatility relative to the liabilities, plan assets allocated to debt securities appropriately match the duration of individual plan liabilities. Equities are diversified between U.S. and non-U.S. index funds and are intended to achieve long term capital appreciation. Plan asset allocation and investment managers’ guidelines are reviewed on a regular basis.
Plan Assets Our target allocation for fiscal 2022 and weighted-average plan assets allocations as of August 31, 2021 and 2020 by asset category for defined benefit pension plans are as follows:
2022 TargetAllocation 2021 2020
U.S.
PlansNon-U.S.
PlansU.S.
PlansNon-U.S.
PlansU.S.
PlansNon-U.S.
PlansAsset CategoryEquity securities — % 25 % — % 21 % — % 19 %Debt securities 100 51 98 51 96 59 Cash and short-term investments — 4 2 4 4 2 Insurance contracts — 13 — 16 — 16 Other — 7 — 8 — 4 Total 100 % 100 % 100 % 100 % 100 % 100 %
Fair Value Measurements Fair value is the price that would be received upon sale of an asset or paid upon transfer of a liability in an orderly transaction between market participants at the measurement date and in the principal or most advantageous market for that asset or liability. The fair value should be calculated based on assumptions that market participants would use in pricing the asset or liability, not on assumptions specific to the entity.
The three-level hierarchy of fair value measurements is based on whether the inputs to those measurements are observable or unobservable. Observable inputs reflect market data obtained from independent sources, while unobservable inputs reflect our market assumptions. The fair-value hierarchy requires the use of observable market data when available and consists of the following levels:
• Level 1—Quoted prices for identical instruments in active markets;
• Level 2—Quoted prices for similar instruments in active markets; quoted prices for identical or similar instruments in markets that are not active; and model-derived valuations in which all significant inputs are observable in active markets; and
• Level 3—Valuations derived from valuation techniques in which one or more significant inputs are unobservable.
Table of ContentsNotes To Consolidated Financial Statements — (continued)(In thousands of U.S. dollars, except share and per share amounts or as otherwise disclosed)ACCENTURE 2021 FORM 10-K F-33

The fair values of defined benefit pension and postretirement plan assets as of August 31, 2021 are as follows:
Non-U.S. Plans Level 1 Level 2 Level 3 Total
EquityMutual fund equity securities $ — $ 273,541 $ — $ 273,541
Fixed IncomeNon-U.S. government debt securities 183,891 — — 183,891 Non-U.S. corporate debt securities 15,624 — — 15,624 Mutual fund debt securities — 484,182 — 484,182
Cash and short-term investments 48,825 — — 48,825 Insurance contracts — 79,227 130,934 210,161 Other — 110,035 — 110,035
Total $ 248,340 $ 946,985 $ 130,934 $ 1,326,259
The level 3 assets are primarily invested in an insurance buy-in contract in a Non-U.S. plan. The fair value of the assets is set to an actuarially calculated present value of the underlying liabilities.
The U.S. Plans have $324,202 in Level 2 assets, primarily made up of U.S. corporate debt securities of $204,650 and U.S. government, state and local debt securities of $67,373.
The following table provides a reconciliation of the beginning and ending balances of Level 3 assets for fiscal 2021:
Level 3 Assets Fiscal 2021Beginning balance $ 140,305
Changes in fair value (9,371) Ending Balance $ 130,934
The fair values of defined benefit pension and postretirement plan assets as of August 31, 2020 are as follows:
Non-U.S. Plans Level 1 Level 2 Level 3 Total
EquityMutual fund equity securities $ — $ 259,776 $ — $ 259,776
Fixed IncomeNon-U.S. government debt securities 163,602 — — 163,602 Non-U.S. corporate debt securities 20,639 — — 20,639 Mutual fund debt securities — 611,028 — 611,028
Cash and short-term investments 13,858 14,509 — 28,367 Insurance contracts — 79,575 140,305 219,880 Other — 52,415 — 52,415
Total $ 198,099 $ 1,017,303 $ 140,305 $ 1,355,707
The level 3 assets are primarily invested in an insurance buy-in contract in a Non-U.S. plan. The fair value of the assets is set to an actuarially calculated present value of the underlying liabilities.
The U.S. Plans have $313,015 in Level 2 assets, primarily made up of U.S. corporate debt securities of $185,981 and U.S. government, state and local debt securities of $75,583.
The following table provides a reconciliation of the beginning and ending balances of Level 3 assets for fiscal 2020:
Level 3 Assets Fiscal 2020Beginning balance $ 133,421
Changes in fair value 6,884 Ending Balance $ 140,305
Table of ContentsNotes To Consolidated Financial Statements — (continued)(In thousands of U.S. dollars, except share and per share amounts or as otherwise disclosed)ACCENTURE 2021 FORM 10-K F-34

Expected Contributions Generally, annual contributions are made at such times and in amounts as required by law and may, from time to time, exceed minimum funding requirements. We estimate we will pay approximately $124,621 in fiscal 2022 related to contributions to our U.S. and non-U.S. defined benefit pension plans and benefit payments related to the unfunded frozen plan for former pre-incorporation partners. We have not determined whether we will make additional voluntary contributions for our defined benefit pension plans. Our postretirement plan contributions in fiscal 2022 are not expected to be material to our Consolidated Financial Statements.
Estimated Future Benefit Payments Benefit payments for defined benefit pension plans and postretirement plans, which reflect expected future service, as appropriate, are expected to be paid as follows:
Pension PlansPostretirement
Plans
U.S. PlansNon-U.S.
PlansU.S. and Non-
U.S. Plans2022 $ 16,114 $ 122,740 $ 13,372 2023 16,940 124,082 14,536 2024 17,746 120,748 15,959 2025 18,604 128,567 17,396 2026 19,350 126,114 19,058 2027-2031 105,408 644,379 124,117
Defined Contribution Plans In the United States and certain other countries, we maintain and administer defined contribution plans for certain current, retired and resigned employees. Total expenses recorded for defined contribution plans were $646,519, $557,888 and $530,501 in fiscal 2021, 2020 and 2019, respectively.
Table of ContentsNotes To Consolidated Financial Statements — (continued)(In thousands of U.S. dollars, except share and per share amounts or as otherwise disclosed)ACCENTURE 2021 FORM 10-K F-35

13. Share-Based Compensation
Share Incentive Plans The Amended and Restated Accenture plc 2010 Share Incentive Plan, as amended and approved by our shareholders in 2020 (the “Amended 2010 SIP”), is administered by the Compensation Committee of the Board of Directors of Accenture and provides for the grant of nonqualified share options, incentive stock options, restricted share units and other share-based awards. A maximum of 114,000,000 Accenture plc Class A ordinary shares are currently authorized for awards under the Amended 2010 SIP. As of August 31, 2021, there were 19,465,854 shares available for future grants. Accenture plc Class A ordinary shares covered by awards that terminate, lapse or are cancelled may again be used to satisfy awards under the Amended 2010 SIP. We issue new Accenture plc Class A ordinary shares and shares from treasury for shares delivered under the Amended 2010 SIP.
A summary of information with respect to share-based compensation is as follows:
Fiscal 2021 2020 2019Total share-based compensation expense included in Net income $ 1,342,951 $ 1,197,806 $ 1,093,253 Income tax benefit related to share-based compensation included in Net income 486,980 430,290 356,062
Restricted Share Units Under the Amended 2010 SIP, participants may be, and previously under the predecessor 2001 Share Incentive Plan were, granted restricted share units, each of which represent an unfunded, unsecured right to receive an Accenture plc Class A ordinary share on the date specified in the participant’s award agreement. The fair value of the awards is based on our stock price on the date of grant. The restricted share units granted under these plans are subject to cliff or graded vesting, generally ranging from two to five years. For awards with graded vesting, compensation expense is recognized over the vesting term of each separately vesting portion. Compensation expense is recognized on a straight-line basis for awards with cliff vesting. Restricted share unit activity during fiscal 2021 is as follows:
Number of RestrictedShare Units
Weighted AverageGrant-Date Fair Value
Nonvested balance as of August 31, 2020 17,739,931 $ 164.62 Granted (1) 6,862,406 263.83 Vested (2) (7,225,755) 160.05 Forfeited (1,141,197) 183.47
Nonvested balance as of August 31, 2021 16,235,385 $ 207.26
(1) The weighted average grant-date fair value for restricted share units granted for fiscal 2021, 2020 and 2019 was $263.83, $206.05 and $144.52, respectively.
(2) The total grant-date fair value of restricted share units vested for fiscal 2021, 2020 and 2019 was $1,156,501, $1,066,622 and $914,206, respectively.
As of August 31, 2021, there was $1,267,761 of total unrecognized restricted share unit compensation expense related to nonvested awards, which is expected to be recognized over a weighted average period of 1.2 years. As of August 31, 2021, there were 418,585 restricted share units vested but not yet delivered as Accenture plc Class A ordinary shares.
Table of ContentsNotes To Consolidated Financial Statements — (continued)(In thousands of U.S. dollars, except share and per share amounts or as otherwise disclosed)ACCENTURE 2021 FORM 10-K F-36
Employee Share Purchase Plan 2010 ESPP The Amended and Restated Accenture plc 2010 Employee Share Purchase Plan (the “2010 ESPP”) is a nonqualified plan that provides eligible employees of Accenture plc and its designated affiliates with an opportunity to purchase Accenture plc Class A ordinary shares through payroll deductions. Under the 2010 ESPP, eligible employees may purchase Accenture plc Class A ordinary shares through the Employee Share Purchase Plan (the “ESPP”) or the Voluntary Equity Investment Program (the “VEIP”). Under the ESPP, eligible employees may elect to contribute 1% to 10% of their eligible compensation during each semi-annual offering period (up to $7.5 per offering period) to purchase Accenture plc Class A ordinary shares at a discount. Under the VEIP, eligible members of Accenture Leadership may elect to contribute up to 30% of their eligible compensation towards the monthly purchase of Accenture plc Class A ordinary shares at fair market value. At the end of the VEIP program year, Accenture Leadership participants who did not withdraw from the program will be granted restricted share units under the Amended 2010 SIP equal to 50% of the number of shares purchased during that year and held by the participant as of the grant date.
A maximum of 90,000,000 Accenture plc Class A ordinary shares may be issued under the 2010 ESPP. As of August 31, 2021, we had issued 69,442,510 Accenture plc Class A ordinary shares under the 2010 ESPP. We issued 4,486,288, 5,410,497 and 5,433,817 shares to employees in fiscal 2021, 2020 and 2019, respectively, under the 2010 ESPP.
Table of ContentsNotes To Consolidated Financial Statements — (continued)(In thousands of U.S. dollars, except share and per share amounts or as otherwise disclosed)ACCENTURE 2021 FORM 10-K F-37
14. Shareholders’ Equity
Accenture plc Ordinary Shares We have 40,000 authorized ordinary shares, par value €1 per share. Each ordinary share of Accenture plc entitles its holder to receive payments upon a liquidation of Accenture plc; however a holder of an ordinary share is not entitled to vote on matters submitted to a vote of shareholders of Accenture plc or to receive dividends.
Class A Ordinary Shares An Accenture plc Class A ordinary share entitles its holder to one vote per share, and holders of those shares do not have cumulative voting rights. Each Class A ordinary share entitles its holder to a pro rata part of any dividend at the times and in the amounts, if any, which Accenture plc’s Board of Directors from time to time determines to declare, subject to any preferred dividend rights attaching to any preferred shares. Each Class A ordinary share is entitled on a winding-up of Accenture plc to be paid a pro rata part of the value of the assets of Accenture plc remaining after payment of its liabilities, subject to any preferred rights on liquidation attaching to any preferred shares.
Class X Ordinary Shares Most of our pre-incorporation partners who received Accenture Canada Holdings Inc. exchangeable shares in connection with our transition to a corporate structure received a corresponding number of Accenture plc Class X ordinary shares. An Accenture plc Class X ordinary share entitles its holder to one vote per share, and holders of those shares do not have cumulative voting rights. A Class X ordinary share does not entitle its holder to receive dividends, and holders of those shares are not entitled to be paid any amount upon a winding-up of Accenture plc. Accenture plc may redeem, at its option, any Class X ordinary share for a redemption price equal to the par value of the Class X ordinary share. Accenture plc has separately agreed with the original holders of Accenture Canada Holdings Inc. exchangeable shares not to redeem any Class X ordinary share of such holder if the redemption would reduce the number of Class X ordinary shares held by that holder to a number that is less than the number of Accenture Canada Holdings Inc. exchangeable shares owned by that holder, as the case may be. Accenture plc will redeem Class X ordinary shares upon the redemption or exchange of Accenture Canada Holdings Inc. exchangeable shares so that the aggregate number of Class X ordinary shares outstanding at any time does not exceed the aggregate number of Accenture Canada Holdings Inc. exchangeable shares outstanding. Class X ordinary shares are not transferable without the consent of Accenture plc.
Equity of Subsidiaries Redeemable or Exchangeable for Accenture plc Class A Ordinary Shares Accenture Canada Holdings Inc. Exchangeable Shares Pre-incorporation partners resident in Canada and New Zealand received Accenture Canada Holdings Inc. exchangeable shares in connection with our transition to a corporate structure. Holders of Accenture Canada Holdings Inc. exchangeable shares may exchange their shares for Accenture plc Class A ordinary shares at any time on a one-for-one basis. We may, at our option, satisfy this exchange with cash at a price per share generally equal to the market price of an Accenture plc Class A ordinary share at the time of the exchange. Each exchangeable share of Accenture Canada Holdings Inc. entitles its holder to receive distributions equal to any distributions to which an Accenture plc Class A ordinary share entitles its holder.
Share Purchases and Redemptions The Board of Directors of Accenture plc has authorized funding for our publicly announced open-market share purchase program for acquiring Accenture plc Class A ordinary shares and for purchases and redemptions of Accenture plc Class A ordinary shares and Accenture Canada Holdings Inc. exchangeable shares held by current and former members of Accenture Leadership and their permitted transferees. As of August 31, 2021, our aggregate available authorization was $3,286,216 for our publicly announced open-market share purchase and these other share purchase programs.
Table of ContentsNotes To Consolidated Financial Statements — (continued)(In thousands of U.S. dollars, except share and per share amounts or as otherwise disclosed)ACCENTURE 2021 FORM 10-K F-38

Our share purchase activity during fiscal 2021 is as follows:
Accenture plc Class AOrdinary Shares
Accenture CanadaHoldings Inc. Exchangeable Shares
Shares Amount Shares AmountOpen-market share purchases (1) 11,299,959 $ 3,019,169 — $ — Other share purchase programs — — 34,213 9,377 Other purchases (2) 2,656,764 674,578 — — Total 13,956,723 $ 3,693,747 34,213 $ 9,377
(1) We conduct a publicly announced open-market share purchase program for Accenture plc Class A ordinary shares. These shares are held as treasury shares by Accenture plc and may be utilized to provide for select employee benefits, such as equity awards to our employees.
(2) During fiscal 2021, as authorized under our various employee equity share plans, we acquired Accenture plc Class A ordinary shares primarily via share withholding for payroll tax obligations due from employees and former employees in connection with the delivery of Accenture plc Class A ordinary shares under those plans. These purchases of shares in connection with employee share plans do not affect our aggregate available authorization for our publicly announced open-market share purchase and the other share purchase programs.
Cancellation of Treasury SharesDuring fiscal 2021, we cancelled 10,262,593 Accenture plc Class A ordinary shares that were held as treasury shares and had an aggregate cost of $2,105,666. The effect of the cancellation of these treasury shares was recognized in Class A ordinary shares and Additional paid-in capital with the residual recorded in Retained earnings. There was no effect on total shareholders’ equity as a result of this cancellation.
Dividends Our dividend activity during fiscal 2021 is as follows:
Dividend Per
Share
Accenture plc Class AOrdinary Shares
Accenture CanadaHoldings Inc. Exchangeable Shares Total Cash
OutlayDividend Payment Date Record Date Cash Outlay Record Date Cash OutlayNovember 13, 2020 $ 0.88 October 13, 2020 $ 557,419 October 9, 2020 $ 633 $ 558,052 February 12, 2021 0.88 January 14, 2021 560,425 January 12, 2021 617 561,042 May 14, 2021 0.88 April 15, 2021 558,455 April 13, 2021 615 559,070 August 13, 2021 0.88 July 15, 2021 557,325 July 13, 2021 605 557,930 Total Dividends $ 2,233,624 $ 2,470 $ 2,236,094
The payment of cash dividends includes the net effect of $88,770 of additional restricted stock units being issued as a part of our share plans, which resulted in 312,815 restricted share units being issued.
Subsequent EventsOn September 22, 2021, the Board of Directors of Accenture plc declared a quarterly cash dividend of $0.97 per share on our Class A ordinary shares for shareholders of record at the close of business on October 14, 2021, payable on November 15, 2021. The payment of the cash dividend will result in the issuance of an immaterial number of additional restricted share units to holders of restricted share units.
On September 22, 2021, the Board of Directors of Accenture plc approved $3,000,000 in additional share repurchase authority, bringing Accenture’s total outstanding authority to $6,286,216.
Table of ContentsNotes To Consolidated Financial Statements — (continued)(In thousands of U.S. dollars, except share and per share amounts or as otherwise disclosed)ACCENTURE 2021 FORM 10-K F-39

15. Commitments and Contingencies
Indemnifications and Guarantees In the normal course of business and in conjunction with certain client engagements, we have entered into contractual arrangements through which we may be obligated to indemnify clients with respect to certain matters. These arrangements with clients can include provisions whereby we have joint and several liability in relation to the performance of certain contractual obligations along with third parties also providing services and products for a specific project. In addition, our consulting arrangements may include warranty provisions that our solutions will substantially operate in accordance with the applicable system requirements. Indemnification provisions are also included in arrangements under which we agree to hold the indemnified party harmless with respect to third-party claims related to such matters as title to assets sold or licensed or certain intellectual property rights.
Typically, we have contractual recourse against third parties for certain payments we made in connection with arrangements where third-party nonperformance has given rise to the client’s claim. Payments we made under any of the arrangements described above are generally conditioned on the client making a claim, which may be disputed by us typically under dispute resolution procedures specified in the particular arrangement. The limitations of liability under these arrangements may be expressly limited or may not be expressly specified in terms of time and/or amount.
As of August 31, 2021 and 2020, our aggregate potential liability to our clients for expressly limited guarantees involving the performance of third parties was approximately $885,000 and $832,000, respectively, of which all but approximately $78,000 and $87,000, respectively, may be recovered from the other third parties if we are obligated to make payments to the indemnified parties as a consequence of a performance default by the other third parties. For arrangements with unspecified limitations, we cannot reasonably estimate the aggregate maximum potential liability, as it is inherently difficult to predict the maximum potential amount of such payments, due to the conditional nature and unique facts of each particular arrangement.
To date, we have not been required to make any significant payment under any of the arrangements described above. We have assessed the current status of performance/payment risk related to arrangements with limited guarantees, warranty obligations, unspecified limitations and/or indemnification provisions and believe that any potential payments would be immaterial to the Consolidated Financial Statements.
Legal ContingenciesAs of August 31, 2021, we or our present personnel had been named as a defendant in various litigation matters. We and/or our personnel also from time to time are involved in investigations by various regulatory or legal authorities concerning matters arising in the course of our business around the world. Based on the present status of these matters, including the putative class action lawsuit discussed below, management believes the range of reasonably possible losses in addition to amounts accrued, net of insurance recoveries, will not have a material effect on our results of operations or financial condition.
On July 24, 2019, Accenture was named in a putative class action lawsuit filed by consumers of Marriott International, Inc. (“Marriott”) in the U.S. District Court for the District of Maryland. The complaint alleges negligence by us, and seeks monetary damages, costs and attorneys’ fees and other related relief, relating to a data security incident involving unauthorized access to the reservations database of Starwood Worldwide Resorts, Inc. (“Starwood”), which was acquired by Marriott on September 23, 2016. Since 2009, we have provided certain IT infrastructure outsourcing services to Starwood. On October 27, 2020, the court issued an order largely denying Accenture’s motion to dismiss the claims against us. We continue to believe the lawsuit is without merit and we will vigorously defend it. At present, we do not believe any losses from this matter will have a material effect on our results of operations or financial condition.
Table of ContentsNotes To Consolidated Financial Statements — (continued)(In thousands of U.S. dollars, except share and per share amounts or as otherwise disclosed)ACCENTURE 2021 FORM 10-K F-40

16. Segment Reporting
Operating segments are components of an enterprise where separate financial information is available and is evaluated regularly by the chief operating decision maker, or decision-making group, in deciding how to allocate resources and in assessing performance.
Our chief operating decision makers are our Chief Executive Officer and Chief Financial Officer. Our operating segments are managed separately because each operating segment represents a strategic business unit providing consulting and outsourcing services to clients across different industries.
Our three reportable segments are our geographic markets, which are North America, Europe and Growth Markets. Amounts are attributed to geographic markets based on where clients are located. Information regarding our geographic markets is as follows:
Fiscal 2021 North America Europe Growth Markets TotalRevenues $ 23,701,341 $ 16,749,484 $ 10,082,564 $ 50,533,389 Depreciation and amortization (1) 379,105 403,802 344,656 1,127,563 Operating income 3,907,883 2,236,462 1,477,184 7,621,529 Net assets as of August 31 (2) 1,859,445 2,860,604 848,684 5,568,733 Property & equipment, net 537,392 455,862 645,851 1,639,105 Fiscal 2020Revenues $ 20,982,253 $ 14,402,142 $ 8,942,644 $ 44,327,039 Depreciation and amortization (1) 348,761 341,245 332,393 1,022,399 Operating income 3,169,648 1,799,431 1,544,565 6,513,644 Net assets as of August 31 (2) 2,585,659 1,079,904 620,083 4,285,646 Property & equipment, net 499,976 389,968 655,624 1,545,568 Fiscal 2019Revenues (3) $ 19,986,136 $ 14,695,749 $ 8,533,128 $ 43,215,013 Depreciation and amortization (1) 303,762 294,902 294,096 892,760 Operating income 3,107,437 2,013,245 1,184,392 6,305,074 Net assets as of August 31 (2) 2,923,320 1,355,827 814,358 5,093,505 Property & equipment, net 395,782 354,491 640,893 1,391,166
(1) Amounts include depreciation on property and equipment and amortization of intangible assets and deferred contract costs controlled by each reportable segment, as well as an allocation for amounts they do not directly control.
(2) We do not allocate total assets by reportable segment. Reportable segment assets directly attributable to a reportable segment and provided to the chief operating decision makers include receivables and current and non-current contract assets, deferred contract costs and current and non-current deferred revenues.
(3) Effective September 1, 2019 we revised the reporting of our geographic markets for the movement of one country from Growth Markets to Europe. Prior period amounts have been reclassified to conform with the current period presentation.
The accounting policies of the reportable segments are the same as those described in Note 1 (Summary of Significant Accounting Policies) to these Consolidated Financial Statements.
Our business in the United States represented 45%, 45% and 44% of our consolidated revenues during fiscal 2021, 2020 and 2019, respectively. No other country individually comprised 10% or more of our consolidated revenues during these periods. Business in Ireland, our country of domicile, represented approximately 2% of our consolidated revenues during fiscal 2021 and 1% during fiscal 2020 and 2019.
Table of ContentsNotes To Consolidated Financial Statements — (continued)(In thousands of U.S. dollars, except share and per share amounts or as otherwise disclosed)ACCENTURE 2021 FORM 10-K F-41

We conduct business in Ireland and in the following countries that hold 10% or more of our total consolidated Property and equipment, net:
August 31, 2021 August 31, 2020 August 31, 2019United States 27 % 27 % 26 %India 17 18 18 Ireland 7 7 7
Revenues by industry group and type of work are as follows:
Fiscal 2021 2020 2019 INDUSTRY GROUPS (1)Communications, Media & Technology $ 10,285,549 $ 8,883,264 $ 8,757,338 Financial Services 9,932,523 8,518,894 8,494,630 Health & Public Service 9,498,234 8,023,651 7,161,657 Products 13,954,337 12,287,050 12,026,239 Resources 6,862,746 6,614,180 6,775,149 Total $ 50,533,389 $ 44,327,039 $ 43,215,013 TYPE OF WORKConsulting $ 27,337,699 $ 24,227,024 $ 24,177,428 Outsourcing 23,195,690 20,100,015 19,037,585 Total $ 50,533,389 $ 44,327,039 $ 43,215,013
(1) Effective September 1, 2020, we revised the reporting of our industry groups to include amounts previously reported in Other. Prior period amounts have been reclassified to conform with the current period presentation.
Table of ContentsNotes To Consolidated Financial Statements — (continued)(In thousands of U.S. dollars, except share and per share amounts or as otherwise disclosed)ACCENTURE 2021 FORM 10-K F-42

17. Quarterly Data (unaudited)
Fiscal 2021First
QuarterSecondQuarter
ThirdQuarter
FourthQuarter Annual
Revenues $ 11,762,185 $ 12,088,125 $ 13,263,795 $ 13,419,284 $ 50,533,389 Cost of services 7,863,889 8,492,893 8,859,411 8,953,068 34,169,261 Operating income 1,890,669 1,653,515 2,118,656 1,958,689 7,621,529 Net income 1,522,057 1,461,493 1,569,572 1,437,423 5,990,545 Net income attributable to Accenture plc 1,500,276 1,440,859 1,549,426 1,416,248 5,906,809 Weighted average Class A ordinary shares:
—Basic 634,271,482 635,993,980 635,203,753 633,546,144 634,745,073 —Diluted 646,879,735 646,321,916 645,454,021 645,287,973 645,909,042
Earnings per Class A ordinary share:—Basic $ 2.37 $ 2.27 $ 2.44 $ 2.24 $ 9.31 —Diluted $ 2.32 $ 2.23 $ 2.40 $ 2.20 $ 9.16
Fiscal 2020First
QuarterSecondQuarter
ThirdQuarter
FourthQuarter Annual
Revenues $ 11,358,958 $ 11,141,505 $ 10,991,305 $ 10,835,271 $ 44,327,039 Cost of services 7,711,199 7,782,334 7,462,617 7,394,731 30,350,881 Operating income 1,767,263 1,488,945 1,712,733 1,544,703 6,513,644 Net income 1,375,168 1,252,082 1,252,639 1,305,424 5,185,313 Net income attributable to Accenture plc 1,356,968 1,234,740 1,228,202 1,287,929 5,107,839 Weighted average Class A ordinary shares:
—Basic 635,722,309 637,485,626 636,146,240 635,887,742 636,299,913 —Diluted 649,389,444 648,833,880 645,607,914 647,867,307 647,797,003
Earnings per Class A ordinary share:—Basic $ 2.13 $ 1.94 $ 1.93 $ 2.03 $ 8.03 —Diluted $ 2.09 $ 1.91 $ 1.90 $ 1.99 $ 7.89
Table of ContentsNotes To Consolidated Financial Statements — (continued)(In thousands of U.S. dollars, except share and per share amounts or as otherwise disclosed)ACCENTURE 2021 FORM 10-K F-43