Embed Size (px)
Citation preview
We Don’t Need No Education:Reconstruction and Conflict across Afghanistan
Travers Barclay ChildVrije Universiteit Amsterdam & Tinbergen Institute
(November 4th, 2016)
Abstract
Field interviews conducted by the author in Afghanistan suggest current theories
linking conflict to development do not adequately account for ideological drivers of
resistance. We present a model demonstrating how reconstruction/development led by a
foreign occupier can exacerbate violence through popular discontent, if projects are
ideologically controversial. We test the model using detailed data on military-led
reconstruction and public opinion from NATO, and a US-Government violence log
covering Afghanistan from 2005 until 2009. We find projects in the health sector
successfully alleviate violence, whereas those in the education sector actually provoke
conflict. The destabilizing effects of education projects are strongest in conservative
areas, where public opinion polls suggest education projects breed antipathy towards
international forces. Further underscoring the role of local perceptions, project-driven
violence appears to be homegrown, rather than sourced externally. Our findings do not
support competing theories; are not driven by reverse causation; and are robust when
considering many sources of endogeneity.
JEL classification: O21, H56, N4
Keywords: Reconstruction, Development, Insurgency, Conflict
The author (email: [email protected]) would like to acknowledge helpful comments and advice received
at various stages of work on this paper. In particular, he thanks Remco Oostendorp, Chris Elbers, Peter
Lanjouw, David Scoones, Alessandro Tarozzi, Marta Reynal-Querol, Jacob Shapiro, Philip Eles, Ruben
Enikolopov, Maria Petrova, Raul Caruso, Joel Hillison, Martin Ravallion, Pascaline Dupas, Paolo Pinotti,
Lorenzo Casaburi, Nan Tian, Arturas Juodis, Stephan Jagau, and Simas Kucinskas. The author appreciates
moral/logistical and data support in Afghanistan from Bette Dam and Mohammad Afzal, respectively. Gratitude
is extended to interview respondents in Kabul for their time and sincerity. The author also thanks seminar
participants at NATO Communications and Information Agency, European Bank for Reconstruction and
Development, Universitat Pompeu Fabra, University of Victoria, Vrije Universiteit Amsterdam, Tinbergen
Institute, NEUDC-Northeast Universities Development Consortium, BREAD-CEPR-PODER Conference on
Development Economics, PODER Summer School at the University of Cape Town, CSAE Conference, Jan
Tinbergen European Peace Science Conference, Peace Science Society (International), Western Economic
Association International, and Midwest Political Science Association Conference. This work was supported
financially by the Marie Curie Actions Initial Training Network - PODER; and by the Netherlands Organisation
for Scientific Research - NWO. Travel support was also provided by the Network of European Peace Scientists.
1

“We’re invariably going to get it wrong. Let’s be honest, it’s almost impossible to
avoid unintended consequences of our work here. I think that’s a really important
premise.” (major reconstruction donor, field interview 2013)
“Education can be the cause of violence in some Southern provinces... If there is
no school, no teacher, no education, they will not target that village!” (Afghan
NGO, field interview 2013)
More than a decade of Western engagement in Afghanistan and Iraq has brought not even
a semblance of peace and security to either country. The ongoing conflicts have collectively
claimed the lives of over 180,000 civilians and over 8,000 foreign troops, and casualty rates are
not in systematic decline.1 In conjunction with military force operations, a major cornerstone of
both interventions has been reconstruction activity. To this end, the US Government alone has
doled out over USD 80 billion in Iraq (SIGIR 2013), and over USD 100 billion in Afghanistan
(SIGAR 2014). This endeavour is guided by the ‘hearts and minds’ credo, which maintains
that development improves community cooperation in the fight against rebels, and provides
alternative economic opportunities for would-be insurgents.2 But to this end, the effort has met
little apparent success. As of 2015, ISIS controlled numerous population centers in Iraq (CFR
2015), and the Taliban governed significant portions of Afghanistan (TLWJ 2015). Between
2003 and 2007, attacks on coalition forces exhibited an accompanying rise with the upward
trend in reconstruction work carried out in both countries, and yet reconstruction proceeded
unabated thereafter (ACSP; FPDS; GTD).
In recent years, occupation forces have re-engaged in Iraq, and progressively withdrawn
from Afghanistan. As international security forces draw down in Afghanistan, reconstruction
and aid programs follow suit. Internationally funded development spending has constituted a
considerable share of total Afghan economic activity in recent years, so many fear its
contraction will have unwanted security ramifications. Importantly though, it is debatable
whether reconstruction work was ever helpful to stability in the first place.
Government officials, political pundits, think tank analysts, military personnel, and many
academics maintain Western intervenors have learned much from their experiences. The
importance of community involvement, cultural sensitivity, and intel-based combat tactics are
often discussed in this respect. Western governments have long been aware of these, at least
since military engagements in Malaya and in Vietnam (Gentile 2013). Yet there is scant
1Number of civilian deaths is aggregated across https://www.iraqbodycount.org and UNAMA (2016). Foreign
troop deaths are calculated from http://icasualties.org.2In fact, the U.S. Army Marine Corps Counterinsurgency Field Manual explicitly incorporates reconstruction
work as a mainstay of COIN strategy. Civil Security, Civil Control, Essential Services, Governance, and Economic
and Infrastructure Development comprise the Stability pillar of COIN strategy (see Figure 1-1, U.S. Army,
emphasis added).
2

empirical evidence that soft counterinsurgency (i.e. reconstruction) has become effective at
inducing stability. To date, in the public domain there exist very few evidence-based
assessments of reconstruction efforts (Zyck 2011). Raw data on US project outlays in Iraq are
available for analysis only by researchers pre-authorized by US-military. Data on
NATO-country reconstruction spending in Afghanistan is unclassified, but the required
clearance is prohibitive (data used herein was physically procured from an extant, official
hardcopy source in Kabul). Military data on violence in both Afghanistan and Iraq is
classified. The limited body of research on this topic supports military and government
rhetoric asserting reconstruction enhances stability. The work presented in this paper explores
instead the antithesis - reconstruction can foment violence.
The greater reconstruction effort is comprised of projects carried out in a number of sectors
including agriculture, health, education, security, and transport, amongst others. We postulate
that local communities welcome the involvement of foreign military forces in some spheres of
development activity, but oppose it in other, more controversial areas. Some projects have an
ideological charge - they change institutions reflecting cultural, social, or political sensitivities.
These types of projects may evoke popular resistance, which can manifest as either material,
informational, or participatory support for the insurgency. Other projects are ideologically
neutral, whose benefits are universally accepted. Those types of projects are more readily
welcomed, and are therefore more likely to mitigate conflict in the manner typically conceived
from the hearts and minds perspective. By consequence of these opposing forces, we expect
security to ebb and flow in response to the overarching character of the reconstruction effort.
We formalize our theory by building a model of reconstruction spending, insurgency, and
community preferences, from which we derive testable implications. To operationalize our
model’s predictions, we conjecture that security and education are two controversial sectors,
whereas health interventions are welcomed by local communities. This intuition is reinforced
by field interviews conducted by the author with key reconstruction stakeholders in Kabul, in
November 2013. This fieldwork comprised 21 unstructured on-site interviews with major
government donors (9); private companies in receipt of reconstruction contracts (3); local
NGOs (2); foreign NGOs (2); local research organizations (2); journalists (2); and a special
forces operative (1). The material gleaned from the recorded interviews is used to support the
theoretical foundation of our formal theory, to guide our analysis, and to interpret our
findings.3
The bulk of this paper lies in our empirical analysis for Afghanistan. We merge together a
variety of unique datasets, including: reconstruction and development data from the NATO C3
Agency’s Afghanistan Country Stability Picture; public opinion data from the NATO
3The specific identities of interviewees is withheld; we cite them instead in general terms (e.g. Foreign
Company M 2013; Afghan NGO J 2013). Some exact identities may be available, however, upon request.
3

Communications and Information Agency’s Afghanistan Nationwide Quarterly Research;
violence data from the National Counterterrorism Center’s Worldwide Incidents Tracking
System, and the US Department of Homeland Security’s Global Terrorism Database; and
district characteristics from the Afghanistan Central Statistics Organization’s National Risk
and Vulnerability Assessments. The combined panel data covers 398 districts across
Afghanistan, from 2005 until 2009.
We measure the impact on violence of military-led Provincial Reconstruction Team (PRT)
projects. Health projects appear to improve stability; education projects have the opposite
effect. The findings are economically significant. Specifically, in an average-sized district of
63,000 inhabitants, a one-standard-deviation increase in the number of health projects
(corresponding to 1.6 projects/month) led to a reduction in expected violence by one-third
(from an average of 1 incident per 5 months). On the other hand, a one-standard-deviation
increase in education programming (1.4 projects/month) is associated with a 20% escalation
in violent incidents. We find these effects to be exacerbated in the South of the country, where
conservatism is most pronounced. Across the South, we also provide evidence that education
programming breeds popular antipathy towards the international forces (ISAF). Moreover, our
spatial analysis suggests project-fuelled violence is sourced within-district, rather than
attracting Taliban from outside. This lends credence to our theoretical interpretation
highlighting the importance of local community preferences. By contrast, we are unable to
provide evidence in support of other prevailing theories linking conflict to development (such
as opportunity cost or rent seeking models) in the short- to medium-run. We demonstrate our
findings are not explained by reverse causation or missing data; and we rule out civil society
development aid and time invariant district characteristics as confounding factors. In the
Appendix we employ instrumental variables by exploiting PRT command shifts as a source of
exogenous sectoral spending. Our results are also robust to this alternative identification
strategy.4
We formally introduce the possibility that foreign-led development can be opposed on
ideological grounds. This constitutes a sharp theoretical departure from a literature which
consistently characterizes insurgent activity as a financial decision. Guided by theory, we
evaluate differential effects across reconstruction sectors. Another contribution lies in our use
of quarterly public opinion polls conducted across Afghanistan. We are the first to analyze
such dynamic public opinion data in a conflict zone. Finally, we contribute to identification by
discussing the presence of, and potential confound arising from, other independent
development programs. This is an outstanding concern in both observational studies, and
studies based on interventions where treatment was randomly assigned at the time of
4In the appendix we also show our results are not driven by any individual region, nor by female-oriented
projects. Further, significant differences do not exist between the impact of construction- and service-type projects.
4
implementation. By virtue of our database, which ostensibly covers all military and civil
reconstruction and development activities, we are able to account for such complications.
1 LITERATURE
The large theoretical literature on civil conflict (surveyed by Blattman and Miguel 2010)
attributes violence almost exclusively to economic motives. Opportunity cost models portray
conflict as an economic activity. The more attractive are employment options in the licit
sector, the more likely are insurgents to defect from paid rebellion. Reconstruction and
development projects increase the payoff and prevalence of formal sector work, and would
thus be expected to increase stability. While this theoretical characterization of violent
political resistance is readily embraced by economists, the empirical evidence for economic
drivers of conflict is highly contested. Collier and Hoeffler (2004) present cross-sectional
country level evidence that conflict negatively correlates with economic aggregates; the result
was overturned by Djankov and Reynal-Querol (2010), however, by introducing country fixed
effects. Some micro-level studies have supported opportunity cost models of rebellion
(Iyengar, Monten, & Hanson 2011; Dube & Vargas 2013), but many others have cast doubt on
their external validity (Krueger & Maleckova 2003; Berrebi 2007; Berman, Callen, Felter, &
Shapiro 2011).
Rent seeking models - a separate theoretical camp - consider violence as a competition over
resources. The greater is the economic value of the territory being contested, the stronger is the
incentive to gain control over that territory, and therefore the more intense the conflict will be.
In this framework, reconstruction/development programming could actually spur violence as it
increases the rents associated with victory in a conflict. Some recent empirical studies support
the reduced form relationship between development spending and violence predicted in this
framework (Dube & Vargas 2012; Nunn & Qian 2013; Crost, Felter, & Johnston 2014). These
studies do not, however, test the causal channel driving those results.
As distinct from the above characterizations, an ‘information-centric’ theory has been
formalized for specific application to the context of post-conflict reconstruction. Berman,
Shapiro, and Felter (BSF 2011) suggest reconstruction efforts mitigate violence by winning
over the hearts of community members with public goods. In exchange for development
projects, the populace shares information with the government in the fight against insurgents,
thereby enabling it to more effectively quell insurgency.
BSF (2011) provide evidence that Commander’s Emergency Response Program (CERP)
spending mitigates violence in Iraq, but the effect is concentrated in a period of increased
troop strength (and statistically insignificant in the remaining sample years). The paper does
not test whether community-provided information is more forthcoming in face of increased
5

reconstruction spending, or whether information indeed tempers the effectiveness of
counterinsurgency.5 Chou (2012), Child (2014), and Adams (2015) all replicate the analysis of
BSF (2011) for Afghanistan, examining separate time periods by use of different data sources.
The impact of CERP programming on violence in Afghanistan is statistically
indistinguishable from zero in the first two replication studies. Adams (2015) provides some
evidence that small CERP projects reduce violence while large projects actually increase
violence. Sexton (2015) suggests CERP activity generally exacerbates violence in districts not
fully controlled by international forces. The findings offer support for a theory which casts
insurgency as a strategic response to the entrenchment of control by international/government
forces. Still other work suggests National Solidarity Program (NSP) spending in Afghanistan
improves community perceptions of government, and translates into reduced violence (Beath,
Christia, & Enikolopov 2016).6 Importantly, the NSP is of an altogether different nature than
the CERP; while NSP is locally administered, the CERP is carried out by foreign
commanders. From our theoretical perspective, this difference can reconcile the divergent
outcomes we observe across these programming efforts.
To be sure, the state of empirical work on this topic is largely divided, failing to provide
general support for any existing theory of violence. A flurry of evidence alternately supporting
and refuting existing theoretical work has left this vein of inquiry in a state of uncertainty. We
suggest the empirical link between violence and development (and reconstruction in particular)
is unresolved because the accompanying theory has not acknowledged ideological drivers of
conflict. In what follows, we set out to help remedy this deficiency.
2 THEORETICAL FOUNDATION
We introduce a general theoretical framework in which reconstruction affects violence
through community perceptions. From our model we derive testable implications. Community
members are the support upon which rebellion rests. The size of the insurgency in equilibrium
therefore depends on how ideologically controversial the reconstruction effort is perceived to
be. Not all spending is equivalent in the view of the community. A foreign built police station
may elicit an ideological opposition amongst the populace that a road construction project
would not. Depending on how mismatched are an occupier’s objectives with preferences of
community members, occupiers choose equilibrium spending patterns that engender
resistance to a greater or lesser degree. Violent equilibria are feasible because, pragmatically,
the occupier pursues overarching political and economic goals through the reconstruction
5Berman, Felter, Shapiro, and Troland (2013) provide evidence for complementarity between military control
and service provision in reducing violence.6The effect on violence is reversed, however, in two districts near the Pakistan border.
6

effort, which are only indirectly related to security of the host nation.
This theoretical framework characterizes insurgency as a response to reconstruction
programming. But importantly - by adopting this perspective, we by no means refute the
existence of other drivers of conflict, which can be independent of government and occupier
actions. To the contrary, we acknowledge sectarian strife, warlordism, ethnic tensions, and
even economic greed are in many cases stronger determinants of insurgency in both Iraq and
Afghanistan than the explanation we proffer here. However, the margin on which the occupier
can influence outcomes in this context is arguably restricted to military posturing and
reconstruction. Given the invocation of ‘hearts and minds’ doctrine to justify the latter (to the
tune of USD 100 billion for the US in Afghanistan), we endeavour to explore the validity of
that approach. Therefore, we theoretically abstract from conflict drivers which may be
considered exogenous as we discuss the marginal impact reconstruction can have on violence.
In what follows, we present the theoretical motivation for our formal model by substantiating
its foundational assertions with material gleaned from field interviews conducted by the author
in Kabul, Afghanistan (November 2013), as well as empirical evidence drawn from the
literature.
2.1 Ideological controversy
The first critical assumption of our theory is that reconstruction activities can be unwelcome by
some community members on ideological grounds. Intercepted correspondence between high-
level al-Qaeda members reveals their opposition to Western-led development (CTC 2007a). A
Taliban night letter, for example, warned Afghans against opening schools, and working with
foreign companies (CTC 2009). Some Taliban opposed PRT projects on face value, because
they are seen as ideologically driven (Research Organization C 2013); and any project tied to
the military carries potential to elicit conflict (Donor D 2013). But also across the broader
community, reconstruction work can be ill-perceived. Bohnke, Koehler, and Zurcher (2010)
indicate development aid in northeast Afghanistan, from 2007-2009, is negatively correlated
with approval of foreign forces, and congruence with Western values.7 Moreover, Bohnke
and Zurcher (2013) show that development projects have (if any) a negative effect on Afghan
attitudes towards foreigners. In sum, evidence suggests reconstruction and development can be
perceived as ideological, and can generate unfavourable views towards foreign forces and the
intervention.
Our model is further premised on the notion that reconstruction work is perceived
differently across sectors. Records of al-Qaeda correspondence reflect sensitivity to foreign
involvement in the oil industry (CTC 2007c; CTC 2006), in the media (CTC 2007b), and in
7The same analysis suggests development aid from 2005-2007 had no impact on how foreign forces are
perceived, and is positively correlated with Western values.
7

education (CTC 1999). The magazine Jihad stated “among the most dangerous things that the
West introduced in order to put an end to Islam in the long-term are the curriculums that
concentrated on demolishing the language, the religion and Islamic history” (CTC 2007b, 2).
Many field interviews by the author with reconstruction stakeholders in Kabul support the
notion that security and education programming can be particularly controversial (Afghan
Company 2013; Donor E 2013; Journalist F 2013; Donor G 2013; Donor H 2013).8 Regarding
education, curriculum design is a common point of contention and negotiation between
insurgents and the international community (Foreign NGO I 2013; Research Organization C
2013). Frictions are exacerbated when education projects become associated with military, as
one local NGO contends - three of their staff were killed after a successful project in the South
was monitored by armoured vehicles (Afghan NGO J 2013). We do not contend education or
security development is controversial in its own right, but can become controversial when
perceived to be undertaken by an occupying force. Field interviews substantiate the notion
that projects tied to foreign military face resistance on that basis (Foreign Company P 2013;
Journalist F 2013). By contrast, health programming provides immediate concrete benefits
(Foreign NGO K 2013), and is far more innocuous from an ideological perspective (Journalist
F 2013; Donor G 2013; Donor H 2013). Interview respondents generally agree that health
projects provide basic services that even Taliban members appreciate for their families, and
for themselves (Afghan NGO J 2013). Such projects are not overly controversial, regardless
of implementing agent.
So according to the above, community members (including extreme elements) are
discerning in their perceptions among different types of development projects. Education
seems to be particularly controversial (and potentially also security), whereas health is widely
appreciated. Interviews conducted by Jackson and Giustozzi (2012) support this conclusion
by suggesting health clinics (among other projects) are well received, while education can be
controversial (depending on whether the project is oriented towards girls, and whether foreign
teachers are involved).
2.2 Occupier self-interest
If it is true that certain types of foreign-led development are controversial, but others are not,
then why should the occupier insist on programming in sensitive sectors? Because the
occupier has its own aims regarding reconstruction spending, and these are shaped by political
and economics considerations at home. Government donors face enormous pressure to expend
resources as a metric for success, and so local sensitivities are secondary concerns in this
pursuit (Donor G 2013; Donor E 2013). This problem is especially pronounced in the projects
8It should be noted, however, that some respondents claimed reconstruction unambiguously improves security
(Special Forces 2013; Donor A 2013; Donor B 2013).
8

of PRTs (Foreign NGO I 2013). The allocation of funds across program sectors is a domestic
political decision made in consultation with parliamentarians at home, and based more on
national priorities (Donor L 2013; Donor H 2013) or global poverty solutions (Donor L 2013;
Donor E 2013) than on local preferences. That reconstruction and development is not purely
an altruistic pursuit is well understood by private contractors (Afghan Company 2013; Foreign
Company M 2013), and by Afghans themselves (Donor N 2013). As one official of a major
Western donor candidly admitted:
Every project here is hugely political. It’s all part of a big political process. There
are many, many projects around the country which I’m sure have a strong economic
justification for doing them. And maybe a strong social justification for doing
them. But overriding all of that are strong political reasons for doing them (Donor
E 2013).
The above sentiment is shared by a host of other development stakeholders on the ground
(Afghan NGO J 2013; Journalist F 2013; Donor G 2013).
2.3 Community-supported insurgency
A final theoretical assumption is that community discontent can lead to violent resistance.
That insurgents appear partly motivated by ideological grievances (CTC 1999) supports this
assumption. But many interview respondents further suggest the broader community can also
mobilize in response to reconstruction-related grievances (Afghan NGO O 2013; Foreign
NGO I 2013; Journalist F 2013; Donor H 2013; Donor A 2013). If readers are skeptical that
insurgents are drawn from the community itself, they can imagine community members
simply support the insurgency instead. Such support could manifest as material or labour
contributions, but could also be as benign as withholding information from the government
and international forces. Joining the side of the occupier, in this case, would entail
withdrawing support from insurgents by preventing them from entering one’s village, from
planting IEDs, etc (Special Forces 2013). This characterization can be reconciled with the
information-centric theory of BSF (2011), with the important qualification that some types of
reconstruction projects deter the community from co-operating with the government.
3 MODEL
Our work builds on a fully parameterized model sketched in Child and Scoones (2015).
Reconstruction and insurgency is a one shot game played between two types of agents: a
single occupier, and a continuum of community members. All possible reconstruction output
9

falls into one of two ‘sectors’ - g or b. The occupier seeks to maximize utility through its
allocation of reconstruction spending across these two sectors. Each community member
either supports the insurgency or co-operates with the occupier, depending on their relative
distaste for the mix of reconstruction projects chosen by the occupier. As above, ‘supporting
the insurgency’ implies a contribution to violence which reduces reconstruction output. The
occupier moves first in anticipation of the reaction of the community; individual community
members then choose whether or not to resist reconstruction by supporting the insurgency.
The combination of occupier spending and community resistance determines the level of
reconstruction output and payoffs, and the game ends.
3.1 Preferences & Technology
Utility of the occupier in our model, V (g, b), depends positively on reconstruction output in
both sectors, but exhibits decreasing marginal returns (hence Vg > 0, Vb > 0, Vgg < 0, and
Vbb < 0). Utility of all community members i, U i(g, b;αi), depends positively on provision of
sector g projects (U ig > 0), and negatively on the presence of sector b activities (U i
b < 0), to an
extent determined by the preference parameter αi. So there is a tension between occupier and
community preferences, and the notation g and b is used as a shorthand for ‘good’ and ‘bad’ in
accordance with the community’s perception of the reconstruction effort. Community member
utility exhibits decreasing marginal returns to both the good and the bad (hence U igg < 0 and
U ibb < 0). In this sense, the bad sector is similar to a pollutant whose marginal damage becomes
more severe at high levels of output. For simplicity, marginal utility of the good also declines
with greater output of the bad (i.e. U igb ≤ 0), implying it becomes difficult to appreciate
beneficial projects in the presence of ever more controversial reconstruction activities. Later we
demonstrate an equilibrium based on a parameterization which relaxes this condition. Lastly,
the individual parameter αi positively affects the marginal utility derived from reconstruction
(in particular, U ibαi
> 0, and U igαi≥ 0), and is drawn from a distribution such that αi ∈ [0,∞).9
The occupier faces convex reconstruction costs C(G,B), such that CG > 0, CB ≥ 0,
CGG ≥ 0, CBB ≥ 0, and CGB ≥ 0. G is sector g spending, and B is sector b spending; both
of which ultimately translate into output. The output g(G,R) depends on sector-spending and
the level of community resistance in R, such that gG > 0 and gR < 0. We impose gGG ≤0, implying constant or decreasing marginal returns; and gRG < 0, implying the resistance
becomes absolutely more destructive in the presence of greater reconstruction spending. The
conditions on output b(B,R) are defined analogously. The level of resistanceR is calculated as
9One class of admissible utility functions adequately fulfilling these criteria are U i = αif(g, b)− h(b), where
f is positive, concave, and increasing in both its parameters, and h is positive, convex, and increasing. For
example, U i = αi√gb − b2, or U i = αi[ln g + ln b] − b2. Alternatively, the following class is also admissible:
U i = f(g, b)− (1/αi)h(b), under the same conditions.
10

a population share, based on the individual participation decisions ri which will be discussed
in what follows.
3.2 Equilibrium
An equilibrium is a utility maximizing choice by the occupier of a spending bundle (G∗, B∗);
and a utility maximizing decision by each community member whether to resist
reconstruction, characterized by a threshold value α∗i in the set of community members.
Community members observe the spending allocation of the occupier before deciding whether
to support the resistance; the occupier knows this and chooses an allocation with rational
expectations of the coming level of resistance. The equilibrium obtained is a Stackelberg
(subgame perfect Nash) equilibrium. To solve the model, we first calculate the response of
community members to a given reconstruction spending: this determines R as a function of B
and G. Using this and the output functions, we characterize the occupier’s optimization
problem. From this, the occupier chooses the optimal spending mix, which ultimately depends
on its preferences, community preferences, and the relationship between output and violence.
3.2.1 Resistance
Substituting the output functions into the community member utility function, we can express
U i(g(G,R), b(B,R);αi). We can then determine the impact of the insurgency on individual
utility through the total derivative:
dU i
dR=∂U i
∂g(g(G,R), b(B,R);αi)
∂g
∂R(G,R) +
∂U i
∂b(g(G,R), b(B,R);αi)
∂b
∂R(B,R) (1)
where the first term on the right-hand side is negative, and the second term is positive. The
sign of dU i/dR indicates whether community member i would perceive himself to be better
or worse off with a marginal increase in the size of the insurgency. By setting dU i
dR= 0, we
can extract the identity of the marginal insurgent (MI), described by α∗i (herefrom α∗), who
is just indifferent between a larger and smaller insurgency. It is straightforward to show the
marginal benefit of insurgency (dU i/dR) is monotonically decreasing in αi,10 and so it follows
that the MI - α∗ - is unique (if it exists, for a given R). Therefore, all community members
for whom αi > α∗ will not support the insurgency, and those for whom αi < α∗ will support
the insurgency. Thus, each individual’s binary decision regarding whether to participate in the
insurgency can be described by the assignment rule:
ri =
1 if αi < α∗ ⇔ dU i/dR > 0
0 if αi ≥ α∗ ⇔ dU i/dR ≤ 0
10Note that R is not a function of the individual αi parameter.
11

The total share of insurgency can then be calculated by integrating the individual participation
decisions over the entire population distribution:11
R =
∫ +∞
0
ri(αi; g, b)f(αi)dαi = F (α∗)
where f(·) is the density function pertaining to the distribution of αi. In Appendix A we prove
the solution above exists and is unique under some additional assumptions. It is worth
mentioning that the model can also be solved in discrete form. In that case, R =∑N
i=1 ri/N ,
where N is the finite population measure. Under this discrete framework the individual
contribution to insurgency is positive and measurable. We can then solve the model by
eliciting the MI instead from the micro-founded condition: dU i
dri= ∂U i
∂g∂g∂R
dRdri
+ ∂U i
∂b∂b∂R
dRdri
= 0,
which yields an analogous outcome since dRdri
= 1N> 0.12 Having established that the two
formulations are qualitatively equivalent, we proceed under the simpler and more elegant
continuous framework.
Our primary concern is how the insurgency responds to sector-specific outlays. To see this,
we first calculate the rate of change in the returns to insurgency with respect to spending on
the bad sector. Because the MI alone contributes zero mass to the total size of insurgency, we
examine the instantaneous rate of change in incentives for the MI, fixing the existing level of
insurgency.13 Using equation 1, we evaluate
d
dB
(dU i
dR
)= U i
bbRB + U ibbbBbR + U i
gbbBgR > 0 (2)
The first term on the right-hand-side is positive because the resistance is able to destroy more
of the public bad (in an absolute sense), the more widespread it becomes (bRB
< 0). The
second and third terms capture second-order effects on marginal utility. The second term is
positive because marginal destruction of sector b output yields greater utility benefit under
comparatively higher levels of output (U ibb < 0). The third term is positive or zero, depending
on whether additional output in b negatively influences the benefits derived from g (U igb ≤
0). In sum, the individual returns to insurgency are higher (for the MI, and for all i of the
community in fact) in response to larger injections of B spending. Accordingly, it must be true
that the marginal insurgent faces positive returns to insurgency with an incremental increase in
B, and therefore supports the insurgency. For the allocation with comparatively larger B, the
11R =∫ +∞0
ri(αi;G,B)f(αi)dαi =∫ α∗
0ri(αi;G,B)f(αi)dαi +
∫ +∞α∗ ri(αi;G,B)f(αi)dαi =∫ α∗
0(1)f(αi)dαi +
∫ +∞α∗ (0)f(αi)dαi = F (α∗)
12Through this alternative framework, we could also account for participation costs to insurgency which, until
now, have been assumed to be zero. The introduction of such costs would simply reduce the size of the insurgency
in equilibrium, without affecting the tradeoffs central to our analysis.13Imagine we take an injection to B sufficiently small to just suade the MI. In this case it is obvious the MI
takes the prevailing level of R as given.
12

new marginal insurgent (α∗∗) lies somewhere further to the right on the distribution of αi (i.e.
α∗∗ > α∗), and the insurgency is larger since R = F (α∗∗) > F (α∗).
Hypothesis I: For a fixed level of spending in the good sector, and fixed community member
preferences, an increase in outlays to the controversial sector will lead to growth of the
resistance. Ceteris paribus, ∆R/∆B > 0.
By contrast, the change in incentives arising from an injection of G takes the form
d
dG
(dU i
dR
)= U i
ggRG + U igggGgR + U i
bggGbR
The first term on the right-hand-side is negative because absolute collateral damage (or
intentional destruction) of public goods increases when they are more plentiful (gRG
< 0). The
second term is positive, capturing the decline in valuation of marginal public goods subject to
ruin by the insurgency. The third term is either zero or positive, depending on whether the
removal of public bads becomes more attractive in the presence of public goods. Together the
terms imply, surprisingly, that spending on G need not actually reduce the incentives for
insurgency. In case the latter two terms dominate, a counterintuitive result emerges in which
more public goods fuel resistance. Ultimately, the direction of the total effect will depend on
the valuation of public goods, their diminishing returns, and the technology of insurgency.
Based on our fieldwork (see 2.1) and analytical results (of 3.2.4 and Appendix A), we strongly
suspect the destructive effect captured in the first term will dominate the subsequent effects
stemming from changes to individual marginal returns. In those cases G has the intuitive,
countereffect to B. The MI would strictly prefer not to join the insurgency following a
marginal increase in G, leading to a reduction in insurgency. Therefore, we formulate a
hypothesis for empirical testing.
Hypothesis II: For a fixed level of spending in the bad sector, and fixed community member
preferences, an increase in outlays to the beneficial sector will lead to a decline in resistance.
Ceteris paribus, ∆R/∆G < 0.
Let us now consider Hypothesis I in more depth. Given a change in sector B spending,
the response in terms of insurgency is determined by two factors: (i) the population density at
(and to the right of) the decision margin (f(α∗)); and (ii) the breadth of the adverse reaction
(∂α∗/∂B). Hence we can approximate dR/dB ≈ f(α∗)∂α∗
∂B, where ∂α∗/∂B is ultimately a
composite function of G and B, and depends on the functional forms of b, g, f(·), and the U i.
Precisely,dR
dB=
∫ α∗+ ∂α∗∂B
α∗f(αi)dαi = F
(α∗ +
∂α∗
∂B
)− F (α∗)
13

Diagrammatically, the relationship above is depicted in Figure 1. From here we can see the
distribution of ideological preferences is paramount in determining the community response
dR/dB. This feature of our model enables interesting comparisons across local contexts.
Our focus is on the controversial nature of projects. Our field interviews suggest the
friction between community preferences and development programming is stronger in some
communities than in others. It is therefore instructive to compare outcomes across
communities with different perceptions regarding the controversial nature of programming.
Let us consider two communities, which differ according to their ideological preferences. Let
the preference (αi) distribution in conservative community c constitute a leftward shift of its
counterpart in moderate community m (with first-order stochastic dominance), implying a
greater concentration of ideologically sensitive community members in c. Further, let the
preference distribution be unimodal. So long as there is a higher level of violence in c than in
m, and so long as the MI (the most liberal insurgent) in c is more ideologically extreme than
both his modal community counterpart, and the MI in m, then the violent backlash from B
will be more severe in c than in m.
Hypothesis III: Ceteris paribus, the violent backlash in response to controversial projects will
be more severe, the more antagonistic are the underlying ideological preferences of the
community. Consider two communities (denoted by subscripts c and m) where the preference
distributions differ by a constant, such that
fc(αi) = fm(αi + s) ∀ αi , where s > 0 (so that Fm(αi) < Fc(αi) ∀ αi). If the following
conditions (i)-(iv) hold, then fc(α∗c) > fm(α∗m) and (∂α∗/∂B)c > (∂α∗/∂B)m, implying
(dR/dB)c > (dR/dB)m.
(i) fm is unimodal
(ii) Rc > Rm
(iii) α∗c < arg maxαi
fc(αi)
(iv) α∗c < α∗m
It is noteworthy that conditions (i)-(iv) above are not controversial, and can be expected to
hold in practice. By imposing some additional structure, in Appendix A we analytically derive
Hypotheses I through III.
3.2.2 Public Opinion
Whether an individual supports the insurgency depends on whether he/she serves to benefit
from the undoing of foreign-led reconstruction activities. In our model, decisions regarding
support and participation are one and the same. The binary indicator, ri, can be interpreted
14

either as violent resistance, or as informational assistance towards insurgents (and away from
international forces). Practically, a decisive political position must precede any material
contribution to the conflict. In our theory, public opinion is the underlying mechanism by
which reconstruction efforts translate into peace or violence. As such, we expect public
antipathy towards international forces to dictate the strength of the insurgency. Let A be a
measure of this antipathy, whereby A =∫ +∞0
ai(αi;G,B)f(αi)dαi, and the individual ai are
as follows:
ai =
1 if dU i/dR > 0
0 if dU i/dR ≤ 0
Under this transparent formulation, we can recharacterize ri = ai, and by extension R = A.
The intermediate role of public opinion as the underlying mechanism is now explicit14, even if
the derivation of R has become consequently trivial (redundant). Nevertheless, this one-to-one
theoretical correspondence between ai and ri enables us to reformulate our three hypotheses in
terms of opinion shares, rather than insurgency size. So for completeness, we propose:
Hypothesis Ia: For a fixed level of spending in the good sector, and fixed community member
preferences, an increase in outlays to the controversial sector will lead to greater antipathy
towards international forces. Ceteris paribus, ∆A/∆B > 0.
Hypothesis IIa: For a fixed level of spending in the bad sector, and fixed community member
preferences, an increase in outlays to the beneficial sector will lead to a decline in antipathy
towards international forces. Ceteris paribus, ∆A/∆G < 0.
Hypothesis IIIa: Ceteris paribus, the public opinion response to controversial projects will
be larger, the more antagonistic are the underlying ideological preferences of the community.
Consider two districts, denoted by subscripts c and m. If the following conditions (i)-(iv) hold,
then (dA/dB)c > (dA/dB)m.
(i) fc(αi) = fm(αi + s) ∀ αi , where s > 0 (so that Fm(αi) < Fc(αi) ∀ αi)
(ii) fm is unimodal
(iii) Rc > Rm
(iv) α∗c < arg maxαi
fc(αi)
14The distinction between the underlying ideological preference parameter αi and the decision outcome ai is
important. The individual decision derives from his/her preferences, following a personalized evaluation of the
reconstruction effort.
15

3.2.3 Project Choice
We now turn back to the occupier whose problem, given its preferences and technology, can be
summarized as
maxG,B
Π = V (g(G,R(G,B; f(·))), b(B,R(G,B; f(·))))− C(G,B)
This implies the following first-order conditions:
VbbB = CB − (VggR + VbbR)RB (3)
VggG + (VggR + VbbR)RG = CG (4)
The left-hand sides of equations 3 and 4 capture the marginal benefits of increased outlays B
and G, respectively; the right-hand side captures the associated marginal costs. The costs of
investment in sector b are two-fold, consisting of a direct cost (CB) and the indirect cost of
greater resistance, which dampens output across both sectors. By contrast, the benefits of
investment in sector g are two-fold, consisting of the direct benefit (VggG), and the indirect
growth in output across sectors resulting from improved stability. The occupier therefore
accounts for these differences as it allocates spending. Depending on the occupier’s
preferences and technology, and on community preferences, an equilibrium is reached in
which some combination of G∗, B∗, and R(α∗) prevails. The concavity of the occupier’s
utility function with respect to spending,15 in combination with the convexity of the cost
function, ensures that G offsets cannot endlessly compensate for damages incurred by B.16 If
we impose the Inada conditions on V , the equilibrium is contained within a limited set of
feasible allocation bundles.
3.2.4 Parameterization
To visually exemplify our model’s results, we now adopt a specific parameterization. For
didactic purposes, we choose the following:
V = g1/4b3/4
U i = αi√gb− b2; αi ∼ U(0, 1)
g = G(1−R); b = B(1−R)
C = (G+B)/5
15Because V is concave in g and b, and these latter are concave in their respective spending inputs G and B, V
is concave in G and B.16Interestingly, equations 3 and 4 combine to yield the joint condition: [VbbB − CB ]RG = [VggG
− CG]RB .
BecauseRG < 0 andRB > 0, it must be that either VbbB −CB < 0, or VggG−CG < 0. In equilibrium, the latter
will hold true, demonstrating the occupier overspends on G to leverage against damage arising from B outlays.
16

From this specification, two items are particularly noteworthy: (i) the occupier has a relatively
strong preference for sector b output, and (ii)U igb > 0. We present a utility function fulfilling the
latter to demonstrate our results are not contingent on the potentially controversial condition:
U igb ≤ 0.
Given the parameterization above, we can generate the level of resistance for each allocation
bundle, and also map the corresponding value function for the occupier. Figure 2a depicts a
surface (with level curves) reflecting the level of resistance (R) for various choices of spending
(G,B) by the occupier. As expected, violence is increasing in outlays to the bad sector (B),
and decreasing in outlays to the good sector (G). There is no violence at all when B = 0, and
maximal violence when G = 0, which are both intuitive results. Next, in Figure 2b we depict
the occupier’s value function (Π). The function takes a negative slope as spending extends in
a single direction from the origin, reflecting the constant cost of outlays. Some combination
of outlays does generate positive value, however, and in equilibrium we see greater devotion
to G than B, despite the occupier’s direct preference for the latter (i). Because spending on B
entails a negative externality on the efficiency of both sectors by increasing violence, its output
is relatively restricted in the optimum allocation.
4 DATA
Our primary unit of observation is the district-month. We follow the 2005 Afghan Ministry of
the Interior administrative designation of 398 districts spanning 34 provinces. Our sample
period runs from January 2005 until September 2009. Hence, our sample contains a total of
22,686 observations. Reconstruction volumes for a district-month are calculated as the mean
number of projects in progress. Alternatively put, it is the amount of projects completed in
that month, with each project weighted by its total duration (measured in fractions of
months).17 Violence levels are obtained by summing up all incidents over the respective
period. Reconstruction volumes are lagged one period in order to ensure we measure the
impact of recent (not future) development on violence. Both violence and reconstruction
variables are expressed in per-capita terms. For descriptive purposes, and for ease of
comparison, we scale these measures to the average-sized district (63,000 inhabitants).
District population data is for 2011/12, and obtained from the Central Statistics Organization
17Other authors (BSF) have previously weighted projects by dollar value rather than project length. We choose
the latter for two reasons. Our theory places community perceptions at the heart of resistance. Perceptions are
driven by the presence of ongoing projects (e.g. appearance of foreign contractors), and not necessarily their
financial value. Technically, cost data is only available for a subset of projects. However, project duration is a
strong positive correlate of cost (also when controlling for sector). Replicating our central analysis using dollar-
weighted metrics yields no obvious contradictions with the results presented here, but the explanatory power of
each statistical model is considerably reduced.
17

(CSO) of the Islamic Republic of Afghanistan.
4.1 Reconstruction projects
Reconstruction data comes from NATO C3 Agency’s Afghanistan Country Stability Picture
(ACSP). The ACSP is ostensibly a comprehensive database on reconstruction and
development projects across Afghanistan from 2002 to September 2009. It is developed for
use by NATO, the Government of the Islamic Republic of Afghanistan, and civilian actors.
The database covers all projects funded by the Provincial Reconstruction Teams (PRTs),
USAID, the Combined Security Transition Command (CSTC-A), and a host of other foreign
donors including the World Bank, the World Health Organization, and numerous United
Nations agencies. The ACSP contains detailed project information, including cost, timing,
location, and sector classification.
While the ACSP falls short of providing complete coverage of all reconstruction programs,
PRT data is particularly well documented. From 2002 to 2009, the ACSP contains data on
22,351 PRT projects accounting for at least $1.8 billion in expenditures (included among these
is the CERP, which comprises more than one third of PRT projects in the ACSP). A map of
the spatial distribution of mean PRT projects across all districts is presented in Figure 3.18 The
left panel of Figure 4 depicts the level of PRT projects in our sample, across all provinces
over time, and scaled by population. Including all donors, the ACSP database contains a total
of 118,322 projects, amounting to $28.2 billion, at minimum. A considerable share (73%) of
all projects are not coded with accurate dates in the ACSP. Of the PRT-led projects, 54% are
missing the start date, the end date, or both. Throughout the analysis, projects with missing
dates are dropped from our sample. Accordingly, we are left with 31,486 projects in total, of
which 10,357 are PRT-led.19 We have no reason to believe this measurement error will bias our
results, but we address this concern in section 6.3. To foreshadow: our results remain intact
when incorporating partial data for an additional 3,969 PRT projects.
Total reconstruction spending is disaggregated according to sector. Sector groups are
based on the Afghanistan Standard Industrial Classification of Activities (ASIC) maintained
by the Afghanistan Information Management Services (AIMS). Project examples under each
ASIC sector are offered in Table 1. Descriptive statistics of reconstruction volumes (as well as
violence, district characteristics, and public opinion) are presented in Table 2.
18Mean PRT projects for a given district is calculated as the average of the district-month means over the sample
period.19Over half the ACSP database consists of projects funded by either Afghanistan’s Ministry for Rural
Rehabilitation and Development (MRRD), or the Ministry of Finance (MOF). MRRD data do not contain project
end dates, while MOF data are not geographically coded at the district level. As such, domestically funded
reconstruction projects do not form part of our analysis.
18

4.2 Violence
Throughout the analysis our dependent variable is violence, which we measure primarily
through the Worldwide Incidents Tracking System (WITS).20 The WITS is a US government
database assembled by National Counterterrorism Center analysts. Data are gleaned manually
from open media sources, including local media in foreign languages where linguistic
capabilities permit. The WITS catalogues all publicly known, premeditated, politically
motivated violence directed at police, military, government, and civilians ‘outside of war-like
settings’, but including ambushes, suicide attacks, and IEDs. The data cover incidents in
Afghanistan from 2005 until August 2009, and has been geo-coded by the Empirical Studies
of Conflict Project at Princeton University. Using the ESRI World Gazetteer and digital
mapping software, we district-locate 3,222 incidents included in the WITS.
WITS data are supplemented with violence data from the Global Terrorism Database (GTD)
managed by the US Department of Homeland Security’s START Center at the University of
Maryland. The GTD covers terrorist attacks across Afghanistan from 2001 until 2011. A
terrorist attack is defined by the GTD as ‘the threatened or actual use of illegal force and
violence by a non-state actor to attain a political, economic, religious, or social goal through
fear, coercion, or intimidation’. Although the GTD covers a longer time horizon, its coverage
is more sparse - we were able to district-locate only 1,428 incidents over our sample period
(corresponding to that of the WITS).
Because there is significant overlap between the two sources of violence data, we merge
the databases to avoid double counting. Specifically, for any day in which the WITS does not
report an attack, we employ GTD data. When both databases report violence on the same day,
we draw on the source reporting the larger number of incidents. In line with related research,
our measure of violence does not capture actions initiated by the state, such as police raids or
counterinsurgency operations. Moreover, in keeping with the previous focus on government-
targeted attacks, the vast majority of incidents in the WITS and the GTD involve non-civilian
casualties (often exclusively). A monthly time-series of per capita violent incidents by province
is offered in the right panel of Figure 4. The spatial distribution of violence, averaged across
the sample period, is reflected in Figure 5.21
20WITS data have previously been used by Krueger and Maleckova (2009). See Wigle (2010) for full
introduction to the WITS database.21US military SIGACTs (significant activities) data contained within the International Distributed Unified
Reporting Environment (INDURE) offers more comprehensive coverage of violent incidents in Afghanistan. But
in recent years the SIGACTs data has been made prohibitively difficult to access by unauthorized personnel.
19
4.3 District characteristics
To understand the spatial distribution of reconstruction spending and violence, we construct
district characteristics by invoking National Risk and Vulnerability Assessment (NRVA)
national survey data. The NRVA was carried out by the CSO to assess welfare levels across
the country, to improve development practices, and to facilitate research efforts by government
and international actors. We use two waves of the survey: the first was conducted from June to
August of 2005; the second was carried out between August 2007 and July 2008. Both
surveys are statistically representative to the provincial level, but district sample sizes are
conveniently large, such that the data yield reasonable approximations for district-level
inference. NRVA 2005 surveyed 392 districts, 2597 PSUs (villages), 30,822 households, and
385,519 individuals. NRVA 2007/8 surveyed 395 districts, 2572 PSUs, 20,576 households,
and 152,284 individuals.
Both waves of the NRVA data consist, for each PSU, of two community-level surveys
(filled out by both male and female shuras), as well as male and female household
questionnaires (completed by household heads and other members). The data cover a wide
range of issues including access to services, infrastructure, governance, public opinion, health,
education, income, agriculture, housing, women’s rights, and more. The amount of time
elapsed between survey waves (between two and three years) is likely too large to make
dynamic inferences attributing either violence or interim reconstruction activities to changes
in community characteristics. As such, we construct district characteristics only to explore the
spatial (cross-sectional) distribution of reconstruction programming and violence. Because we
want to pool the two periods for cross-sectional analysis,22 we need comparable indicators
across survey waves for each field of interest. Some survey questions are immediately
comparable across waves, and others are less comparable. District characteristics for which
the NRVA does not provide a consistent measure across waves are instead approximated by
way of principal component analysis (PCA).
For each such field of interest, we start by determining all relevant survey questions from
the four aforementioned questionnaires. For each district, we calculate the average response
to each of these questions, disregarding household sampling weights as they were devised to
ensure representativity at the province level. From this collection of district-level responses to
all relevant questions, we extract the first principal component and use it to compute a district-
level indicator for that field of interest. In particular, we use the percentile rank of a district’s
first principal component score (vis-a-vis other districts’ scores) as the district characteristic
indicator. In this way, from NRVA data we are able to obtain district-wave measures regarding
22Neither our theory nor qualitative data guides us in making predictions regarding how or whether the logic
of project allocation changes over time. We therefore have no reason to analyze our two available time periods
separately.
20

level of education, religiosity, women’s rights, and access to health services. From NRVA
survey questions which are consistent across waves (upon which PCA is not necessary), we
compute district-wave characteristics on development programming preferences, hunger, road
access (remoteness), and the presence of government-commissioned community development
councils (CDCs) which administer (non-PRT) aid.23
4.4 Public opinion
Data on public opinion towards international forces are taken from the Afghanistan
Nationwide Quarterly Research (ANQAR) surveys which, as their name implies, were
conducted every three months across the country, from March 2008 until the present. The
interviews were carried out for NATO by the Afghan Center for Socio-Economic and Opinion
Research (ACSOR). The surveys collected information on demographics, and opinions
regarding: security, security personnel, government, anti-government elements, foreign forces,
and development. For this paper we select a narrow subset of survey questions to best assess
the impact of reconstruction projects on public sentiment towards the international forces.
We gained exclusive access to the first six waves of the ANQAR survey, all of which have
a sample size of more than 8500 households. Interviews were proportionally distributed across
districts according to CSO population data. Within each district, settlements were selected
randomly, and 10 households were interviewed per settlement, using random walks and kish
grids to select respondents. Where security, transportation, or weather rendered a district
inaccessible by survey teams, intercept interviews were conducted instead with residents of
the target district travelling in neighbouring districts. Full detail regarding sampling design
and methodology of the ANQAR surveys is described in the quarterly methods reports.
5 ANALYSIS
5.1 Spatial allocation
To begin our analysis, in Table 3 we investigate the determinants of violence and project
outlays, by exploring their spatial distribution with respect to district characteristics (see again
Figures 2 and 4). To this effect, we stack two cross-sections corresponding to the NRVA
survey waves, yielding 777 district-wave observations. We then estimate the following
23Due to censorship, we are unable to access district data on troop movements, which could alleviate potential
bias from the omitted variable of hard counterinsurgency. But since we measure the impact of sector-specific
projects, rather than total reconstruction, this bias is not of major concern. This is particularly true when comparing
service sectors (such as health and education) which require similar levels of security in order to be carried out.
21

statistical model using OLS:
Yiw = Xiwβ + γw + εiw
where the outcome Yiw varies across columns, from (per capita) violence to measures of (per
capita) reconstruction projects; and Xiw is a vector capturing a host of characteristics in district
i, gleaned from the NRVA wave w, as described in 4.3.
Column 1 of Table 3 indicates that violence is more pronounced in districts with less
women’s rights; greater food security; greater road access; no CDC; and less population.
Column 2 demonstrates that reconstruction projects overall are allocated somewhat similarly.
PRT projects (per capita) are less plentiful in remote and populous districts, and in districts
with greater food scarcity. PRT projects are, however, positively correlated with the presence
of a CDC. In column 3 we see education projects in particular are strongly correlated with
CDC presence. In light of the negative correlation between CDCs and violence (found here in
column 1, and demonstrated by Beath, Christia, and Enikolopov 2016), and result suggesting
education increases violence may be understated, subject to confound from this separate
realm of development programming. That both violence and reconstruction are targeted at
similar districts reflects a need to control for location when attempting to identify causal
effects. It could prove problematic for our analysis, however, if violence and reconstruction
programming were correlated with third time-varying factors, and if the correlation between
those factors and programming differed across sectors. Columns 3-5, which examine the
spatial allocation of sector-specific projects, suggest this is not the case. In fact, there are very
few significant determinants of individual sector programming, and there are none whose
direction of correlation significantly changes across sectors. This allays our concerns
regarding adverse project selection on omitted local characteristics correlated with violence.
The spatial distribution of sector-specific mean PRT projects is mapped in Figure 5. Notice no
obvious regional specializations prevail.
5.2 General PRT
Prior to testing our theory, we first follow previous authors by imposing homogeneous effects
across reconstruction sectors. In column 1 of Table 4, we start by pooling all observations.
But conflict intensity across Afghanistan is highly seasonal, with the Taliban announcing the
beginning of the ‘spring offensive’ around April-May each year. If, for any reason, education
projects are carried out in the spring/summer, and health projects in the down-season, this
could lead us to erroneously attribute (lack of) violence to education (health) programming,
in the absence of seasonal controls. For this we incorporate (57) month-specific dummies
into our model to fully condition our effects on nationwide trends. We therefore estimate
the cross-sectional relationship between monthly reconstruction work (lagged) and violence,
22

clustering errors at the province level. Mean projects are significantly positively correlated
with violence in this setting. The incidence of greater violence in areas more concentrated with
reconstruction spending, however, may simply reflect the spatial selection of projects reflected
in Table 3. Furthermore, because reconstruction is viewed as a tool for peace, projects may be
set where their benefits are most needed - in volatile regions. To address this concern, we use a
first-difference approach in column 2:
∆Vit = β∆Rit−1 + γt + ∆εit (5)
By estimating the above equation, we evaluate the change in violence (∆V) stemming from a
within-district change of PRT outlays (∆R). Districts are indexed by i, and months are indexed
by t. Now the amount of projects becomes an insignificant determinant of violence, suggesting
reconstruction programming may be endogenous with respect to the average (expected) level
of conflict. But PRT projects are now negatively correlated with violence (p-value 0.12), which
is broadly in line with BSF (2011). It is therefore possible reconstruction programming does
mitigate violence in Afghanistan, although this would be a generous interpretation of our results
at this stage. To ascertain whether certain types of projects are successful in that regard (and
others less so), we turn to a more disaggregated analysis.
5.3 Sector-wise PRT
Our central aim is to determine whether reconstruction projects in different sectors have
differential impacts on violence. Based on field interviews and qualitative evidence, we have
classified three ASIC sectors into our theoretical groupings b and g. There are ten other
sectors into which PRT projects may fall (see Table 1), but we do not develop clear predictions
regarding how programming in those sectors is likely to affect conflict. For ease of reporting,
and to avoid attributing economic meaning to potentially spurious correlations, we have
refrained from analyzing those sectors individually. We nevertheless control for their
combined volume in the analysis that follows, but suppress that coefficient result. Regarding
the sectors we do analyze, we consider education and security to comprise the ideologically
controversial sector b. Health projects, on the other hand, fall into sector g. This classification
may be perceived as results-driven, but importantly - the foregoing predictions were not
retroactively adjusted for consistency with the empirical results herein. Any doubts may be
alleviated with reference to Child and Scoones (2010), which predates the ACSP and ANQAR
data release to the author.
In Table 5 we disaggregate PRT projects into three mutually exclusive sectors, plus the
catch-all ‘residual’ sector (suppressed). In this way we allow for heterogeneous effects across
the education, health, and security sectors. We report cross-sectional results in column 1, which
are purely correlational as noted in the preceding subsection. Once we account for selection on
23

time invariant unobservable characteristics by first-differencing (see equation 5, with R now a
vector), the results of column 2 provide compelling evidence that the effect of reconstruction
programming varies by sector. As per Hypothesis I, education projects lead to an uptake in
subsequent violence. As per Hypothesis II, health projects are indeed effective at improving
stability. For an average sized district, one-standard-deviation increase in education (health)
programming leads to an escalation (reduction) in expected violence by approximately one-fifth
(one-third). Security programming appears to reduce violence, contrary to our first hypothesis.
But after all, the direct goal of security projects is to reduce violence, so these projects are likely
to have a material impact on security, separate from the indirect effect we postulate here (that
which manifests through ideological sentiment). We therefore interpret the effect of security
programming as evidence for the success of hard, rather than soft, counterinsurgency.
By removing district effects through first-differencing, we overcome endogeneity from
selection based on fixed community characteristics (such as predisposition for violence). A
dynamic source of endogeneity may still run through violence though, if decisions regarding
project outlays are made on a continual basis, and related to the contemporaneous state of
instability. To exclude the possibility that our result is a byproduct of dynamic selection on
time-varying conflict, we include lagged violence as a control variable in column 3. The
magnitudes of the PRT coefficients change very little, suggesting dynamic selection is not a
major concern.24
One caveat is in order in that the first-difference estimator of column 3 may retain the so-
called Nickell bias, as lagged violence correlates with the error term by construction (Nickell
1981). To overcome this difficulty, we adopt the Anderson-Hsiao (1982) 2SLS-IV estimator in
Table B1, and demonstrate our results are essentially unchanged under this correction.25 This
is perhaps unsurprising since the Nickell bias is concentrated on the estimated effect of lagged
violence, while we are interested in the effects of PRT spending. Simulation findings by Judson
and Owen (1999) suggest bias in the latter are relatively small. We include lagged violence in
part to reduce variance in the error term, thereby sharpening precision for our coefficients of
interest. To the extent that lagged violence is correlated with our reconstruction variables, the
Nickell bias would be reflected also in coefficients for the latter. It is therefore reassuring
24Including further lags of violence does not reduce the explanatory power of reconstruction variables, nor
meaningfully change their effect sizes.25This 2SLS-IV estimator invokes higher-order lags of differenced violence as instruments for the first lagged
difference, thereby breaking the structural correspondence between our endogenous variable and the error term.
Under this correction, our coefficients of interest (for PRT projects) remain very similar. In columns 2 and 3 we
are able to easily reject the hypothesis that our instruments are weak, by comparing the Kleibergen-Paap rk Wald
F-stat to critical values (from Stock and Yogo 2005) approximately two orders of magnitude smaller. The highly
significant negative coefficient on the lagged difference of violence (in columns 1 and 4) is mechanical. It is an
artifact of mean-reversion in a data process characterized by intermittent violence at the district level.
24

that the contemporaneous correlation coefficient between violence and reconstruction is only
−0.002, 0.003, and −0.011, for education, health, and security, respectively. Importantly, none
of these correlations are significant - the corresponding p-values are 0.74, 0.71, and 0.11.
Next, in column 4 we additionally allow for district-specific trends in violence (spanning
the sample period). Under the scenario in which certain districts are increasingly conflicted
over the sample period, whilst undergoing more intensive education programming for other
reasons, we might wrongfully attribute the former development to the latter. By including
district-specific trend terms, we account for such possibilities. Our results remain practically
identical. Because district trends do not add explanatory power, whilst lagged violence does
improve model fit, we opt for column 3 as our (parsimonious) full specification:
∆Vit = ∆Rit−1β + ∆γt + θ∆Vit−1 + ∆εit (6)
where i is a district index, t the month index, V is violent incidents, R is a vector of
reconstruction volumes (mean concurrent projects), and ∆ is the difference operator. This
identification strategy closely follows BSF (2011), except we aggregate observations to the
district-month, rather than the district-half year.
In our full specification of column 3, we are able to rule out selection on fixed district-
level characteristics, recent district-level violence, and contemporaneous nation-wide violence.
Figure B1 presents added variable plots (based on equation 6) to demonstrate our results are
not driven by a handful of outliers. Still, a remaining concern is that time varying district-
level variables could influence both reconstruction outlays and violence. We do control for the
overarching volume of reconstruction work, however, so the concern here is restricted to time
varying covariates which influence both violent outcomes and the project mix (as opposed to its
level). In particular, one concern is that education projects are targeted at areas with increasing
propensity for violence, and health projects are targeted at districts which are becoming more
safe. To the extent that past violence predicts present violence, controlling for lagged violence
and district trends should address this concern. We find it unlikely that further sources of
endogeneity can explain differential effects across programming sectors. Nevertheless, in the
subsequent section (and Appendix C) we undertake a host of robustness exercises (including
an instrumental variables analysis). Unless otherwise noted, for the remainder of the analysis
we employ the full specification expressed in equation 6.
6 ROBUSTNESS
6.1 Reverse causality
One potential concern with the results of Table 5 relates to the direction of causation. Does
reconstruction work affect violence, or vice versa? Field interviews conducted by the author,
25

and previous fieldwork by country-experts (Adams 2014; Sexton 2015) suggest realistic
concerns regarding within-district reverse causality at low levels of temporal aggregation are
limited, even if we assume projects are selected purely with short-run violence-reduction in
mind. A combination of bureaucratic rigidity, idiosyncratic preferences of commanders,
logistical limitations, and limited foresight effectively renders project outlays sufficiently
random with respect to contemporaneous and imminent violence. This is especially true once
results are conditioned on district, month, and trends in recent violence (as in Table 5).
Furthermore, the sectoral composition of programming is broadly predetermined (Donor L
2013; Donor D 2013), can be legislatively mandated as the consequence of
lobbying/negotation by various government branches (Donor Q 2013), and can altogether
exclude security as a selection criterion (Donor L 2013). In effect, the preponderance of
evidence in support of our second theoretical assumption from section 2.2 exactly suggests
that short-run violence-reduction is unlikely to be either the only, nor the largest, determinant
of project selection. Nevertheless, we address concerns related to reverse causality in what
follows.
Importantly, it can be shown that reconstruction programming in education, health, and
security Granger-causes violence. The converse is not true, which is evident in Panel A of
Table 6. In this panel, we effectively re-estimate equation 6, but now with reconstruction
projects as the outcome, and (lagged) violence as the predictor. The first column tests the effect
of the preceding month’s violence on the current volume of PRT projects. Dynamic selection of
programming on the basis of recent violence does not seem to be widespread. Next, in columns
2, 3, and 4, we test whether education, health, or security projects (respectively) are targeted
differentially according to this principle. None of the sectors exhibit patterns consistent with the
notion that recent violence determines project outlays. In fact, the signs of the sector-specific
coefficients suggest, if anything, education projects are steered away from increasingly violent
districts, with health (and security) spending geared towards those districts.
It could still be the case, however, that PRTs assess more distant (i.e. historical) patterns
of violence when deciding on project allocation, and that these histories also affect the current
state of conflict. To address this possibility, we aggregate up to six-month blocks, and rerun our
tests in Panel B. Still no evidence suggests reconstruction generally follows violent half-years,
as indicated by the null result in column 1. Columns 2 to 4 again provide no evidence for the
existence of strategic sector-specific outlays. Violence then (neither recent nor medium-term)
does not appear to determine the timing of reconstruction programming.
As a final check on reverse causality, we consider the possibility that sector-specific
programs are allocated on the basis of expected (if not recent) violence. To verify this, we
extract predicted violence from a simple forecasting model, and test whether next period’s
expected violence is a determinant of contemporaneous project outlays. For this purpose, we
26

project violence on the basis of all significant lags (three, in a level equation), the time period,
and district fixed effects. The correlation between our predicted violence measure and real
outcomes is 0.31. In Panel C, the predicted value for violence is forward-lagged, and included
as a regressor to estimate its impact on contemporaneous project outlays. We find the
coefficient on expected violence to be insignificant in most cases. In columns 1-3, the
coefficient on predicted violence actually points in a direction opposite from that which
supports a story of selection-driven results. Panel C therefore strengthens our causal
interpretation of the results in Table 5. Remarkably, even if we condition the paper’s key
results (Table 5) additionally on predicted contemporaneous violence, our results still remain
significant. We therefore conclude our results are not the consequence of differential
sector-specific programming based on trends or expectations of violence.
6.2 Confounding aid
Even if we are able to fully account for the security situation, we are still faced with an
important omitted variable which may confound our estimation. Development aid from
non-military donors exceeds reconstruction aid in Afghanistan by a factor of nearly
five-to-one (by project count, see Table 2). Insofar as civil aid programming is selective on the
basis of local security (or some related characteristic), and PRTs coordinate with civil donors,
then a selection problem persists. Related work examining the impact of single reconstruction
or development programming efforts has failed to account for the slew of development agents
active in conflict areas (BSF 2011; Crost, Felter, & Johnston 2014; Iyengar, Monten, &
Hanson, 2011; Berman et al. 2011; Nunn & Qian 2013; Beath, Christia, & Enikolopov 2016).
We contend this is an extremely important potential source of confounding bias, and therefore
control for non-PRT programming in Table 7. Column 1 controls for projects funded by
USAID - the largest donor in Afghanistan. Column 2 includes all other civil donors, including
various UN agencies, development banks, IFIs, international NGOs, and so on. Column 3, for
completeness, includes the Combined Security Transition Command - a multinational effort to
train Afghan security forces. All our sector-specific results on PRT programming from Table 5
are robust to the inclusion of development aid controls. Interestingly, civil aid concentrated in
our sectors of interest does not have a significant effect on violent outcomes. Education
projects funded and administered by non-military development actors are not destabilizing,
nor do health and security projects appear to alleviate conflict. This finding suggests military
programming has a unique relationship with violence, which supports our theoretical
contention that ideological perceptions are important when development is seen to be carried
out by an occupying force. The finding was also anticipated by interview respondents who
suggested that aid projects funded or implemented by established civil society actors are
unlikely to elicit adverse security responses (Foreign Company P 2013; Donor N 2013; Donor
27

G 2013).
6.3 Missing data
Admittedly, there are concerns regarding reconstruction project data accuracy. Although the
ACSP self-identifies as an exhaustive list of all reconstruction and development activities in
Afghanistan from 2002 to 2009, it is doubtful all projects were individually coded into the
database by the responsible agents. That said, we have no reason to suspect miscoding is
systematically related to violence and reconstruction programming in a way that would bias
our results. In particular, it would be required that education projects are more likely to be
included in the database when (unanticipated) conflict is on the immediate horizon, and that
health projects are more likely to be included prior to sudden improvements in stability.
However unlikely such miscoding practices must be to explain the differential effects we
observe across programming sectors, in what follows we address missing data issues. At any
rate, we feel this research question is too important to remain unexplored, so we elect to
undertake the most rigorous analysis possible with the best data available (notwithstanding its
limitations).
As mentioned in section 4.1, the majority of projects in the ACSP are missing data on
either the start date, the end date, or both. But because the bulk of our analysis is based on first
differences in project volumes, it is still possible to partially incorporate much of the project
data we have thus far excluded. That is, our identification has been leveraged off the timing
and location of project commencements and project completions. Missing data for the start
(end) date of a project does not preclude us from incorporating the end (start) date of that
project into our analysis. Of course, these partial data may be less reliable than complete
project data, and including data subject to classical measurement error can attenuate our
coefficient estimates. On the other hand, excluding these data amounts to systematic
underreporting of project volumes at best, leading to overstated effect sizes. At worst, this
could result in directional bias if data-coding errors are systematically associated with
imminent violence, and differentially-so across sectors. We thus re-run our main analysis
including all available partial project data.
When we incorporate projects for which we have only the start date or the end date, our
database coverage expands considerably. The amount of projects increases from 31,486 to
36,947; PRT projects in particular increase from 10,357 to 14,326. Impressively (given the
difference in sample size), the results obtained from this expanded database qualitatively match
those presented in the main analysis. In Tables B2, B3, and B4, we reproduce Tables 2, 5, and 7,
respectively. The descriptive statistics in Table B2 closely resemble the corresponding figures
in Table 2. In Tables B3 and B4, the coefficients on PRT projects are smaller than in Tables 5
and 7, respectively. This potentially reflects attenuation bias from (classical) measurement error
28

in the revised sample, systematic under-representation of projects in the main sample, or both.
In fact, one might treat the two corresponding estimates as bounds on the true parameter values.
Because all coefficients shrink in absolute value, there is little reason to believe directional bias
could explain our differential results across sectors.
7 MECHANISM
7.1 Community perceptions theory
7.1.1 Local conservatism
So far we have presented evidence supporting Hypotheses I and II of our theory, which are
premised on the notion that reconstruction work impacts violence through popular
perceptions. In particular we have demonstrated that education programming leads to uptakes
in violence, while health programming improves stability (security-sector effects do not
correspond to our expectation). Hypothesis III suggests the adverse impact of
education-sector spending will be greater in areas where controversial projects are most highly
contested. Next, we test this hypothesis, offering further support for our favoured mechanism
linking reconstruction to conflict.
To the extent that education programming by a foreign military is perceived negatively on
ideological grounds, we expect this sentiment to be strongest in conservative areas.
Reconstruction stakeholders have expressed that the geographical breadth of certain projects is
limited, and this may be due to heightened controversy associated with those projects in
insecure areas (Foreign Company M 2013; Donor G 2013; Foreign Company P 2013). With
reference to the Southern provinces in particular, one local NGO acknowledged education can
actually be the cause of violence (Afghan NGO J 2013). To operationalize an empirical test
for Hypothesis III, we must first arrive at a local measure of underlying conservatism. The
South of Afghanistan is the birthplace of the Taliban, and is understood to be the most
conservative part of the country. However, geographical location alone is not the only proxy
for conservatism. As discussed earlier, we build measures of religiosity and women’s rights,
based on responses to the NRVA surveys. By combining responses across both survey waves,
we generate two additional district-level measures of conservatism (beyond the regional
indicator). A fourth measure comes from ethnicity data collected over the universe of ANQAR
surveys. We use the district-share of Pashtun, due to that group’s historical ties to the Taliban,
and to their well-known conservative norms with respect to women’s rights and Islam.
Table 8 tests whether the unintended consequences of education programming are stronger
in conservative districts. Across columns, we alternately interact all reconstruction measures
with our various proxies for conservatism. Column 1 of Table 8 reports the effects on violence
29

of sector-specific PRT programming in the South (in the provinces of Helmand, Kandahar,
Uruzgan, and Zabul), and for all areas outside the South. The coefficient magnitude and
statistical significance for education projects in the South suggests they are much more
destabilizing than in the rest of the country. That is, education and health projects have the
expected effect across the country generally, but in the South education is even more inciteful
than elsewhere. This result is expected from our third hypothesis. Admittedly, security
programming again does not comply to expectations. It appears security projects are more
effective in the South (consistent with our earlier reference to hard, rather than soft,
counterinsurgency).
In column 2 we test the difference between effect sizes in areas with high religiosity, and
those with low religiosity. We are not able to provide evidence for heterogeneous effects of
education programming across this measure of conservatism. The results of column 2 may
suggest, however, the peace-inducing effects of health programming are concentrated in
conservative areas. Column 3 tests for heterogeneity across the level of women’s rights. While
there are no statistical differences to report, coefficient signs and magnitudes suggest effects
are stronger in conservative districts. Lastly, we test for differences based on the population
share of Pashtun. Our interpretation of column 4 is the same as that for column 3. In sum, we
can suggest the effects of education programming are stronger in conservative areas (albeit the
same is true of security projects). While the evidence is not overwhelming, the heterogeneity
is most strongly captured by a simple Southern region indicator, rather than our more nuanced
(and continuous) measures of cultural conservatism. But the concept of conservatism is, after
all, complex and multidimensional. Strict adherence to traditional norms of education can be
pervasive across the South, and yet need not be captured by other notions of conservatism. Of
course there exist potential confounds with the Southern indicator, which are not easily
incorporated into our study, and lack theoretical basis for inclusion. These include, for
example, differences in the organizational structure of non-governmental powerbrokers
(Giustozzi & Ullah 2006; Thruelsen 2010), and in PRT development models (Abbaszadeh et
al. 2008; Eronen 2008).
7.1.2 Popular antipathy
Thus far, we have conducted reduced form tests of the impact of reconstruction on violence,
but without a direct empirical test of the causal mechanism. Our theory suggests the effect runs
through public opinion, which plays an intermediary role in our model (see 3.2.2). Specifically,
we have contended that controversial projects will generate unfavourable views towards the
reconstruction effort and occupation at large; and projects deemed acceptable will generate
goodwill. Balancing these offsets, each community member in our model arrives at an overall
assessment which determines his/her level of support for the insurgency. So to test this causal
30

pathway of our theory, we next invoke public opinion data from the ANQAR surveys.
In particular, we analyze community responses to the four questions capturing individual
assessment of the international forces. These include: (1) ‘How would you rate your opinion
of ISAF in Afghanistan?’; (2) ‘Should ISAF/international forces deal less with, or implement
more, reconstruction and development in Afghanistan?’; (3) ‘Do foreign forces respect the
religion and traditions of Afghans?’; and (4) ‘Even if you haven’t seen or heard any
information or video, audio and print materials communicated by the foreign forces, how
trustworthy do you think their messaging is?’. We code the responses to each of these as
ordered categorical variables, increasing in antipathy towards the international forces. We then
analyze the impact of sector-specific reconstruction on these measures of antipathy, to
ascertain whether our reduced form results are ultimately borne of (or at least consistent with)
this intermediate causal pathway. In effect, we are testing Hypotheses Ia, IIa, and IIIa. Due to
our formal theoretical equivalence between antipathy and insurgency, we now estimate the
public opinion analogue to our earlier specification, with observations necessarily aggregated
to the 3-month quarter (due to survey frequency). We also use fixed effects instead of
first-differencing, because the public opinion data constitute a broken panel (from inconsistent
inclusion of both survey questions and sampled districts). The model we estimate is thus:
Ait = αi + Rit−1β + γt + εit
where Ait is the average antipathy towards international forces in district i for quarter t.
Included in the vector R are the project sectors of interest, together with their interactions with
a conservative indicator, and also the residual level of projects. Results from the restricted
model in which projects carry homogeneous effects across all districts are not significant, but
arguably less theoretically compelling in light of findings from the preceding subsection. As
such, we focus our discussion on the results of tests permitting heterogeneous effects in the
South - our measure of conservatism with clearest relevance.
The columns of Table 9 are numbered in accordance with the above-mentioned questions
whose answers serve as the corresponding outcome variables. Regarding Hypothesis Ia, we
find some evidence that controversial spending breeds antipathy in general (in districts outside
of the South). The coefficients on education and security projects are generally positive, but
the corresponding p-values are typically above acceptable thresholds. By contrast, our data
reject Hypothesis IIa (there is little evidence to suggest health projects boost approval ratings of
international forces, measured in this way). Focusing on columns 1 and 2, we see that education
projects lead to significant reductions in approval ratings for international forces in the South,
offering convincing evidence in support of Hypothesis IIIa. Following a one-standard-deviation
increase in education projects, average opinions of ISAF deteriorate by a half-point out of
four (equivalent to half the district population changing from an assessment of ‘fair’ to ‘bad’).
31

The same increase in education spending would push a quarter of the population to suggest
ISAF should deal less with (rather than implement more) reconstruction and development. By
contrast, our results suggest opinions regarding the respectfulness and trustworthiness of ISAF
may be unchanged following reconstruction activity. Perhaps those measures (in columns 3
and 4) are best thought of as fixed underlying ideological preferences, whereas the overall
assessments (in columns 1 and 2) may be fluid, tending towards antipathy in the presence of
controversial reconstruction spending.
7.1.3 Homegrown insurgency
We argue resistance is community-based, and popular antipathy is a necessary condition for
violence. We characterize communities as the source of their own insurgency (regardless of
whether the latter involves local Taliban). Though less appealing, our theory also
accommodates an interpretation suggesting local communities simply permit the entrance of
outside Taliban activities, when those communities are displeased. Our theory is not
consistent with the notion that outside Taliban selectively attack districts with education
projects, regardless of community preferences. To gauge the importance of imported violence
to our results, we adopt a spatial approach to examine patterns of violence displacement.
Under a scenario in which education projects attract outside Taliban, we should detect some
displacement of insurgent activity around our attacks of interest. Specifically, resources must
be sourced from the surrounding area if outside Taliban wish to selectively target a project.
As such, a project-fuelled incident of violence should be met with a commensurate decline in
violence elsewhere. Given the regional nature of Taliban control structures, and given the quick
timing of incidents under study (within a month of project inception/completion), we expect
resources to be sourced nearby. We therefore examine whether a spike in local reconstruction-
fuelled violence is accompanied by a lull in insurgent activity in neighbouring districts.
To conduct this test, we first isolate violence predicted by reconstruction spending, district
and time effects, and recent trends in violence (from equation 6). We then net out all variation
driven by the latter three determinants, leaving only variation in violence predicted by
reconstruction spending. If outside Taliban are the source of these particular incidents, their
occurence should negatively correlate with violence in the neighbouring districts. We
therefore estimate
Vt = α + βMVt + γt + θVt−1 + εt
where all variables are vectors with an element for each district, and M is the adjacency matrix
reflecting district borders.26 The above is a fixed effects specification, with all violence
26Notice the reflection problem would arise if the left- and right-hand side violence vectors were equivalent.
Using actual (rather than project-predicted) violence as the outcome would test the spatial correlation of all types
of violence, which is much less revealing of our mechanism. But unsurprisingly, such a test indicates significant
32

expressed in gross (not per-capita) terms, to ease interpretation. Likewise, the binary matrix Mis not row-standardized. Strictly in terms of resources, one may therefore expect β = −1, for
instance, if one project-fuelled attack at home requires the resources of exactly one foregone
attack next door (in any adjacent district). In column 1 of Table 10, however, we are unable to
detect a statistically or economically significant effect (though the coefficient estimate is
negative). This result does not suggest education-fuelled violence is sourced from outside the
district-proper. But of course, for many reasons we typically expect conflict to positively
cluster in space. So in an effort to filter out this tendency, in column 2 we re-conduct our test
including region-month dummies. We thus check whether reconstruction-fuelled conflict is
enabled by neighbourhood displacement of attacks, fixing the region-month average.27 Again,
the data do not suggest education projects are simply displacing insurgent activity, rather than
fomenting new sources of resistance. Our preferred interpretation of a homegrown insurgency
appears to hold sway against those espousing Taliban outsiders as the source of all violence.
7.2 Competing theories
This paper argues the relationship between reconstruction and conflict is largely influenced by
how foreign-led programming is ideologically perceived by recipient communities.
Competing theories would suggest that relationship is instead characterized by whether
reconstruction generates economic opportunities, or increases the attractiveness of economic
control. In this section we test whether our data supports such extant theories linking conflict
to development. We show the data in Afghanistan is inconsistent with alternative explanations.
Furthermore, our results are robust to accounting for these alternative explanations. Lastly, in
response to numerous comments/requests, in Appendix D we explore two additional
interpretations which neither support nor refute our theory, but nevertheless elucidate
underlying mechanisms.
As previously discussed, opportunity cost models of conflict suggest rebellion is
essentially a career choice. As outside economic options become more attractive, the
opportunity cost of resistance increases, and insurgents are inclined to stop conducting
violence in favour of more fruitful economic pursuits. Should this characterization of
insurgency hold sway in Afghanistan, general economic development should be accompanied
by a decline in the level of violence (under the assumption that reconstruction and
development translates into local economic opportunities). In the first column of Table 10 we
test the impact of all development and reconstruction projects on violence, since all sources
positive spatial clustering of violence.27If we include contemporaneous spatial effects at a lower level of aggregation (the province, for example),
a significant negative β will eventually result mechanically. Conditional on the within-group average, an above
average value for one subgroup necessarily implies below average values for the other.
33

and sectors of programming could imply improvements to local economic conditions. The
effect of general development on violence is actually positive, while our sector-specific results
remain intact. Next, in column 2, we restrict our focus to projects designed explicitly to
improve economic opportunities within the community. As described in Table 1, ‘commerce
and industry’ type projects include job training programs, development of bazaar
infrastructure, skills workshops, and other similar efforts. These projects enhance local career
options in the licit sector, thereby increasing the opportunity cost of rebellion. Still,
development and reconstruction programming of this type does not significantly reduce the
prevailing level of violence, and our earlier results are maintained.
A second theoretical camp in the economics of conflict literature equates violence with rent-
seeking. In this framework, rebels conduct violence in an effort to gain control over resources.
Therefore, reconstruction and development could exacerbate or initiate conflict insofar as the
‘prize’ of victory is enhanced. In the context of post-conflict reconstruction, large infrastructure
works are high-value projects. Investments in agriculture, energy, and water infrastructure all
increase the productive capacity of a region. Such projects are therefore likely to yield higher
rents to those in control, than would otherwise be the case in the absence of those developments.
Columns 3 through 5 test the response of conflict to investments in high-value projects. In line
with a resource competition model, we do not differentiate between military reconstruction and
civil aid. Only agriculture (neither energy, nor water) projects increase the incidence of violence
as a rent-seeking explanation would predict. At the same time, these results consistently support
our own explanation of violence.
In sum, neither opportunity cost nor resource competition explanations for violence are
strongly supported by our data. However, those competing theories may be perceived to
explain the relationship between development and conflict over a time horizon longer than a
few months. As such, we also test the theories when aggregating data to 6-month intervals.
With longer temporal units, the results provide even less evidence in support of either
opportunity cost or resource competition theories. To conserve space, the outcomes of these
tests are stored in Table B5 of the appendix.
Finally, the information-centric theory of BSF (2011) suggests reconstruction can reduce
violence insofar as it is conditional. Desirable projects are used as a carrot to induce
community members to share information about insurgents, thereby enabling the government
authority to capture or kill them. Empirical tests in BSF (2011) have focused on projects in the
Commander’s Emergency Response Program (CERP). Funding under this program is doled
out by U.S. commanders on the ground, and is therefore thought to fulfill the conditionality
requirement critical to this theory. Small projects are expected to be most effective at
leveraging community support, because their financing is less constrained by bureaucratic
oversight. Three replication studies have empirically examined the impact of the CERP in
34

Afghanistan (Chou 2013; Child 2014; Adams 2015). Using the approach of BSF (2011), none
of the studies were able to convincingly support the information-centric theory. Taken as a
whole, the evidence does not suggest the CERP (neither small nor large projects) has been
effective in Afghanistan. To conserve space and avoid repetition, we do not re-present those
findings here.
8 CONCLUSION
Employing unique data on reconstruction, development, public opinion, and violence across
Afghanistan from 2005 to 2009, we evaluate the success of reconstruction programming.
Motivated by the author’s own theoretical work and field interviews conducted in Kabul, we
explore the possibility that certain types of reconstruction projects are controversial on
ideological grounds, and can therefore exacerbate conflict. To test this hypothesis, we adopt a
first-differences framework in which we control for contemporary trends in violence, civil
sector development, and time-invariant district characteristics. Our findings suggest
military-led education projects exacerbate local conflict, whereas health projects attenuate
violence. The adverse effects of education programming are most pronounced in the
conservative South. Strengthening our theoretical interpretation, those projects are also found
to fuel antipathy towards international forces. Moreover, reconstruction-borne insurgency
appears to be homegrown, rather than sourced externally. Importantly, our data do not support
alternative theories linking conflict to development.
Skeptics of this work express identification-related grievances. We have addressed the
possibility of reverse causation, and we have also dealt with selection on time-invariant
unobservables down to the district level. Any remaining (time-varying) omitted factor must, at
once, drive violence and differentially influence reconstruction programming across sectors. It
is worth repeating that because we are interested in the composition rather than the amount of
projects, most intuitive concerns regarding endogeneity are not applicable once we control for
the overall level of reconstruction activity. To enhance identification, our central analysis
could have exploited a policy discontinuity or natural experiment, akin to our IV approach in
Appendix C.2. But we feel the practical case for endogeneity is limited, given our existing
identification strategy, and given realities on the ground. As such, we feel it is not worth
sacrificing general results (across 398 districts over 57 months) in favour of marginally more
convincing identification based on a highly local subsample. To us the choice is obvious;
especially since reservations regarding external validity are enhanced in our application, given
the idiosyncrasies of conflict and development across the highly volatile landscape of
Afghanistan over the past decade of insurgency.
Throughout the analysis we have attempted to practice the utmost transparency. We do not
35

explore nor report results for many sectors of reconstruction because we have no theoretical
prior regarding their effects. We acknowledge that significance levels are merely probabilistic
statements, and so we refrain from specification searching across development sectors to avoid
being subsequently compelled to retroactively attribute economic meaning to potentially
spurious correlations. Our theoretical priors regarding projects in health, education, and
security were established in earlier work (Child & Scoones 2010). Because of this, we report
results on security projects, even though they do not conform to our theoretical expectations.28
Given data availability and resource constraints, we undertake the analysis best suited to our
research question. So although we provide our own interpretation of the results herein, we
leave it to readers to ultimately decide on the strength of our evidence (by openly
acknowledging the limitations of our results).
An open question left mostly unexplored here (for lack of theoretical guidance) is whether
the effects we measure are heterogeneous. In section 7.1.1 we explore heterogeneity along
various dimensions of conservatism, but presumably there are many other covariates which
could conceivably bear on the effectiveness of reconstruction programming. If heterogeneity
implies a complete reversal of the effect for certain subpopulations, and if heterogeneity derives
from a characteristic upon which sector-specific programming is differentially selected, then
our results are less general than thought. However, from Table 3 we would argue this is not
a major empirical concern. But although we suggest heterogeneity is unlikely to unravel our
sector-based results, it remains nevertheless an important and outstanding empirical issue. Our
paper has demonstrated heterogeneous impacts of projects across sectors, and across regions.
An alternative analysis could embrace heterogeneity more generally (and atheoretically), by
employing a machine-learning algorithm for model selection (e.g. lasso or ridge regression;
random forests).
Lastly, this paper explores one possible connection between reconstruction work and
violence. We by no means suggest ideological perceptions are the only factor bearing on the
success of programming. To the contrary, field interviews by the author suggest there are
plenty of reasons why reconstruction, and development more generally, can fail to produce
peace, and even inflame local tensions. These include, but are not limited to: the level of
corruption/leakage associated with development programming; relative programming levels in
comparison to neighboring districts; and elite capture of reconstruction contracts in
communities with fractionalized power distributions. It is important for our identification that
these local conditions are orthogonal to the sector-mix (but not necessarily the overall level) of
projects. Based on our reading and field experience, we have no reason to believe otherwise.
Going forward, however, these alternative channels through which reconstruction and
28We neither explore nor report on a fourth sector discussed by Child and Scoones (2010) - emergency
assistance, because it is obviously wrought with confounding bias.
36

development can affect conflict remain unexplored. There is a rich body of anecdotal evidence
contained within our field interviews, which will motivate exciting new empirical work in this
area.
37

References
Abbaszadeh, N., Crow, M., El-Khoury, M., Gandomi, J., Kuwayama, D., MacPherson, C.,
Nutting, M., Parker, N., and T. Weiss. January 2008. “Provincial Reconstruction Teams:
Lessons and Recommendations.” Woodrow Wilson School Graduate Policy Workshop Final
Report.
Adams, G. 2014. “Conflict of Interest: Military-Led Development Insights from Afghanistan for
Warfighters, Development Practitioners, and Policy Makers.” MPAID dissertation. John F.
Kennedy School of Government, Harvard University.
Adams, G. 2015. “Honing the Proper Edge: CERP and the Two-Sided Potential of Military-Led
Development in Afghanistan.” Economics of Peace and Security Journal 10(2): 53-60.
Anderson, P. June 9, 2005. “Afghanistan’s first woman governor.” BBC News, Bamiyan.
Available at http://news.bbc.co.uk/2/hi/south asia/4610311.stm
Anderson, T.W., and C. Hsiao. 1982. “Formulation and Estimation of Dynamic Models Using
Panel Data.” Journal of Econometrics 18: 47-82.
Baker, P.H. August, 2005. “Lessons from the January Elections.” Fund for Peace Iraq Conflict
Report 4. Retrieved from
http://www.fundforpeace.org/web/images/pdf/iraq-report04abridged.pdf
Bamyan Ski Club (BSC). Afghan Ski Challenge. Available at http://www.afghanskichallenge.com
Barnett, M., Fang, S., and C. Zurcher. 2014. “Compromised Peacebuilding.” International Studies
Quarterly 58: 608-620. doi: 10.1111/isqu.12137.
Barron, P., Diprose, D., and M. Woolcock. 2007. “Local Conflict and Development Projects in
Indonesia: Part of the Problem or Part of a Solution?” World Bank Policy Research WP 4212.
Beath, A., Christia, F., and R. Enikolopov. 2016. “Winning Hearts and Minds through
Development: Evidence from a Field Experiment in Afghanistan.” MIT Political Science
Department Research Paper No. 2011-14.
Berman, E., and D.D. Laitin. 2008. “Religion, Terrorism, and Public Goods: Testing the Club
Model.” Journal of Public Economics 92: 1942-1967.
doi:10.1016/j.jpubeco.2008.03.007.
Berman, E., Callen, M., Felter, J.H., and J.N. Shapiro. 2011. “Do Working Men Rebel?
Insurgency and Unemployment in Afghanistan, Iraq, and the Philippines.” Journal of
Conflict Resolution 55: 496-528. doi:10.1177/0022002710393920.
Berman, E., Felter, J., Shapiro, J.N., and E. Troland. 2013. “Modest, Secure, and Informed:
Successful Development in Conflict Zones.” American Economic Review 103(3): 512-517.
doi:10.1257/aer.103.3.512.
Berman, E., Shapiro, J.N., and J.H. Felter. 2011. “Can Hearts and Minds be Bought? The
Economics of Counterinsurgency in Iraq.” Journal of Political Economy 119(4): 766-819.
doi:10.1086/661983.
38

Berrebi, C. 2007. “Evidence about the Link between Education, Poverty and Terrorism among
Palestinians.” Peace Economics, Peace Science and Public Policy 13(1). doi:10.2202/1554-
8597.1101.
Blattman, C., and E. Miguel. 2010. “Civil War.” Journal of Economic Literature 48(1): 3-57.
doi:10.1257/jel.48.1.3.
Blomberg, S.B., Hess, G.D., and A. Weerapana. 2004. “An Economic Model of Terrorism.”
Conflict Management and Peace Science 21(1): 17-28.
doi:10.1080/07388940490433882.
Blosser, A. May 6, 2008. “Afghanistan: Korengal Engagement.” DIPNOTE: U.S. Department of
State Official Blog. Available at
http://blogs.state.gov/stories/2008/05/06/afghanistan-korengal-engagement
Bohnke, J., Koehler, J., and C. Zurcher. 2010. “Assessing the Impact of Development Cooperation
in North East Afghanistan 2005–2009.” Final Report. Unpublished evaluation report. Bonn:
Bundesministerium fur wirtschaftliche Zusammenarbeit und Entwicklung.
Bohnke, J.R., and C. Zurcher. 2013. “Aid, Minds and Hearts: The Impact of Aid in Conflict
Zones.” Conflict Management and Peace Science 30(5): 411-432.
doi:10.1177/0738894213499486.
Bonebrake, C. March 8, 2013. “Bamyan: A province in the eye of a storm.” 115th Mobile
Public Affairs Detachment. Defense Video & Imagery Distribution System. Available from
http://www.dvidshub.net/news/103139/bamyan-province-eye-storm#.VE9i2vnF950
Bueno de Mesquita, E. 2005. “Conciliation, Counterterrorism, and Patterns of Terrorist Violence.”
International Organization 59(1): 145-176.
doi:10.1017/S0020818305050022.
Bueno de Mesquita, E., and E.S. Dickson. 2007. “The Propaganda of the Deed: Terrorism,
Counterterrorism, and Mobilization.” American Journal of Political Science 51: 364-381.
Child, T.B., and D. Scoones. 2010. “Community Preferences, Insurgency and the Success of
Reconstruction Spending.” WEAI 85th Annual Conference Paper. mimeo.
Child, T.B., and D. Scoones. 2015. “Community Preferences, Insurgency and the Success of
Reconstruction Spending.” Defence and Peace Economics. doi:
10.1080/10242694.2015.1050802.
Child, T.B. 2014. “Hearts and Minds Cannot be Bought: Ineffective Reconstruction in
Afghanistan.” The Economics of Peace and Security Journal 9(2): 43-49.
doi:10.15355/epsj.9.2.43.
Chou, T. 2012. “Does Development Assistance Reduce Violence? Evidence from Afghanistan.”
The Economics of Peace and Security Journal 7(2): 5-13. doi:10.15355/epsj.7.2.5.
Collier, P., and A. Hoeffler. 2004. “Greed and Grievance in Civil War.” Oxford Economic Papers
56: 563-595. doi:10.1093/oep/gpf064.
39

Combating Terrorism Center (CTC). 1999. Handwritten letter from ‘Abd Al-Rauf Bin Al-Habib
Bin Yousef Al-Jiddi, addressed to his brothers at large. Retrieved from
https://www.ctc.usma.edu/programs-resources/harmony-program
Combating Terrorism Center (CTC). Release date: February 14, 2006. “Letter to Mullah
Mohammed Omar from bin Laden.” CTC’s Harmony Document Database. Retrieved from
http://www.ctc.usma.edu/wp-content/uploads/-2010/08/AFGP-2002-600321-Trans.pdf
Combating Terrorism Center (CTC). Release date: October 2, 2007(a). “Bin Laden and Farouq
Letters.” CTC’s Harmony Document Database. Retrieved from http://www.ctc.usma.edu/wp-
content/uploads/2010/08/AFGP-2002-800073-Trans-Meta1.pdf
Combating Terrorism Center (CTC). Release date: October 2, 2007(b). “Characteristics of Jihad
Magazine.” CTC’s Harmony Document Database. Retrieved from
http://www.ctc.usma.edu/wp-content/uploads/2010/08/AFGP-2002-600142-Trans-Meta.pdf
Combating Terrorism Center (CTC). Release date: October 2, 2007(c). “Declaration of Jihad
Against the Americans.” CTC’s Harmony Document Database. Retrieved from
http://www.ctc.usma.edu/wp-content/uploads/2010/08/AFGP-2002-003676-Trans-Meta.pdf
Combating Terrorism Center (CTC). 2009. Taliban night letter for the people of Paktika province.
Retrieved from https://www.ctc.usma.edu/programs-resources/harmony-program
Council on Foreign Relations (CFR). 2015. “Iraq and Syria: ISIL’s Reduced Operating Areas as
of April 2015.” [Pentagon Map]. Retrieved from http://www.cfr.org/havens-for-
terrorism/pentagon-map-islamic-state-operations-iraq-syria/p36463
Crost, B., Felter, J., and P.B. Johnston. 2014. “Aid Under Fire: Development Projects and Civil
Conflict.” American Economic Review 104(6): 1833-1856. doi:10.1257/aer.104.6.1833.
Djankov, S., and M. Reynal-Querol. 2010. “Poverty and Civil War: Revisiting the Evidence.” The
Review of Economics and Statistics 92(4): 1035-1041.
Dorn, B. 2006. “New Zealand Civil-Military Affairs Experience in Afghanistan.” Australian Army
Journal 3(3): 163-177.
Dube, O., and J.F. Vargas. 2013. “Commodity Price Shocks and Civil Conflict: Evidence from
Colombia.” Review of Economic Studies 80(4): 1384-1421. doi:10.1093/restud/rdt009.
Eckstein, H. 1965. “On the Etiology of Internal Wars.” History and Theory 4(2): 133-163.
Eronen, O. 2008. “PRT Models in Afghanistan: Approaches to Civil-Military Integration.” CMC
Finland Civilian Crisis Management Studies 1(5/2008).
Fearon, J.D. 2006. “Ethnic Mobilization and Ethnic Violence.” In The Oxford Handbook of
Political Economy, edited by B.R. Weingast and D.A. Wittman, 852-68. Oxford and New
York: Oxford University Press.
Fearon, J.D. 2008. “Economic Development, Insurgency, and Civil War.” In Institutions and
Economic Performance, edited by E. Helpman, 292-328. Cambridge: Harvard University
Press.
40

Federal Procurement Data System (FPDS). [Data]. Retrieved from http://www.fpds.gov
Fishstein, P., and A. Wilder. 2012. “Winning Hearts and Minds? Examining the Relationship
between Aid and Security in Afghanistan.” Feinstein International Center, Tufts University,
Medford, MA.
Frey, B.S., and S. Luechinger. 2003. “How to Fight Terrorism: Alternatives to Deterrence.”
Defence and Peace Economics 14(4): 237-249.
doi:10.1080/1024269032000052923.
Giustozzi, A., and N. Ullah. 2006. “‘Tribes’ and Warlords in Southern Afghanistan, 1980-2005.”
Working Paper no. 7, Crisis States Research Centre, LSE.
Hopkins, D.J., and G. King. 2010. “A Method of Automated Nonparametric Content Analysis for
Social Science.” American Journal of Political Science 54(1): 229-247.
ISAF. 2009. “ISAF Expansion.” Information bulletin. Retrieved from
http://www.nato.int/isaf/placemats archive/2009-01-12-ISAF-Placemat.pdf
Iyengar, R., Monten, J., and M. Hanson. 2011. “Building Peace: The Impact of Aid on the
Labour Market for Insurgents.” NBER Working Paper No. 17297. Available at
http://www.nber.org/papers/w17297.pdf
Jackson, A., and A. Giustozzi. 2012. “Talking to the Other Side: Humanitarian Engagement
with the Taliban in Afghanistan.” Humanitarian Policy Group Working Paper. Available at
http://www.odi.org/sites/odi.org.uk/files/odi-assets/publications-opinion-files/7968.pdf
Johannes, JD. August 8, 2009. “To Watangatu.” Outside The Wire Blog. Available at
http://outsidethewire.com/content/view/357/
Krueger, A.B., and J. Maleckova. 2003. “Education, Poverty and Terrorism: Is there a Causal
Connection?” The Journal of Economic Perspectives 17(4): 119-144.
Maloney, S.M. 2005. “From Kabul to Konduz: Lessons for Canadian Reconstruction of
Afghanistan.” Policy Options May 2005: 57-62.
Metcalfe, V., Giffen, A., and S. Elhawary. 2011. “UN Integration and Humanitarian Space: An
Independent Study Commissioned by the UN Integration Steering Group.” HPG/Stimson
Center Commissioned Report.
National Consortium for the Study of Terrorism and Responses to Terrorism (START). Global
Terrorism Database (GTD) [Data file]. Available from http://www.start.umd.edu/gtd
National Counterterrorism Center (NCTC). Worldwide Incidents Tracking System (WITS) [Data
file]. Available from https://esoc-edit.princeton.edu
NATO C3 Agency. Afghanistan Country Stability Picture (ACSP) [Data]. Retrieved from
http://gis.nc3a.nato.int/ACSP
NATO-ISAF. March 16 2006. “UK Forces Handover Command of Mazar-e-Sharif PRT to
Swedish Control.” Release #2006-016. Retrieved from
http://www.nato.int/ISAF/docu/pressreleases/2006/Release 16Mar06 016.htm
41

Nickell, S. 1981. “Biases in Dynamic Models with Fixed Effects.” Econometrica 49(6): 1417-
1426.
Nunn, N., and N. Qian. 2014. “U.S. Food Aid and Civil Conflict.” American Economic Review
104(6): 1630-1666. doi:10.1257/aer.104.6.1630.
Scoones, D. 2013. “Winning Hearts and Minds: Public Goods Provision in the Shadow of
Insurgency.” Peace Economics, Peace Science and Public Policy 19(1): 17–31.
Sexton, R. 2015. “Aid as a Tool against Insurgency: Evidence from Contested and Controlled
Territory in Afghanistan.” Working Paper. Available from
http://www.renardsexton.com/research
Siqueira, K., and T. Sandler. 2006. “Terrorists Versus the Government: Strategic Interaction,
Support, and Sponsorship.” Journal of Conflict Resolution 50: 878-898.
doi:10.1177/0022002706293469.
[SIGAR] Special Inspector General for Afghanistan Reconstruction. January 30, 2014. Quarterly
Report to the United States Congress. Retrieved from http://www.sigar.mil
[SIGIR] Special Inspector General for Iraq Reconstruction. September 9, 2013. Final Report to
the United States Congress. Retrieved from http://www.sigir.mil
Stapleton, B.J. 2003. “The Provincial Reconstruction Team Plan in Afghanistan: A New
Direction?” Conference paper. Retrieved from LSE Research Online.
Stock, J.H., and M. Yogo. 2005. “Testing for Weak Instruments in Linear IV Regression.” In
Identification and Inference for Econometric Models, edited by D.W.K. Andrews, 80-108.
New York: Cambridge University Press.
The Long War Journal (TLWJ). “Map of Taliban Controlled and Contested Districts in
Afghanistan, From June 2014 to Present.” [Map]. Retrieved from
http://www.longwarjournal.org/map-of-taliban-controlled-and-contested-districts-in-
afghanistan-from-june-2014-to-present
Thruelsen, P.D. 2010. “The Taliban in Southern Afghanistan: A Localised Insurgency with a
Local Objective.” Small Wars & Insurgencies 21(2): 259-276.
UNESCO. “Cultural Landscape and Archaeological Remains of the Bamiyan Valley.” World
Heritage List. Available at http://whc.unesco.org/en/list/208
[UNAMA] United Nations Assistance Mission in Afghanistan. July, 2016. Afghanistan Midyear
Report 2016: Protection of Civilians in Armed Conflict.
United States Army. 2006. Counterinsurgency: Field Manual 3-24. Washington: Government
Printing Office.
World Public Opinion. September 27, 2006. “The Iraqi Public on the US Presence and the Future
of Iraq.” Program on International Policy Attitudes. Retrieved from
http://www.worldpublicopinion.org
Zurcher, C. 2012. “Conflict, State Fragility and Aid Effectiveness: Insights from Afghanistan.”
42

Conflict, Security & Development 12(5): 461-480. doi:10.1080/14678802.2012.744180.
Zyck, S.A. June 2011. “Measuring the Development Impact of Provincial Reconstruction Teams.”
Civil-Military Fusion Centre Monthly Report on Afghanistan.
43
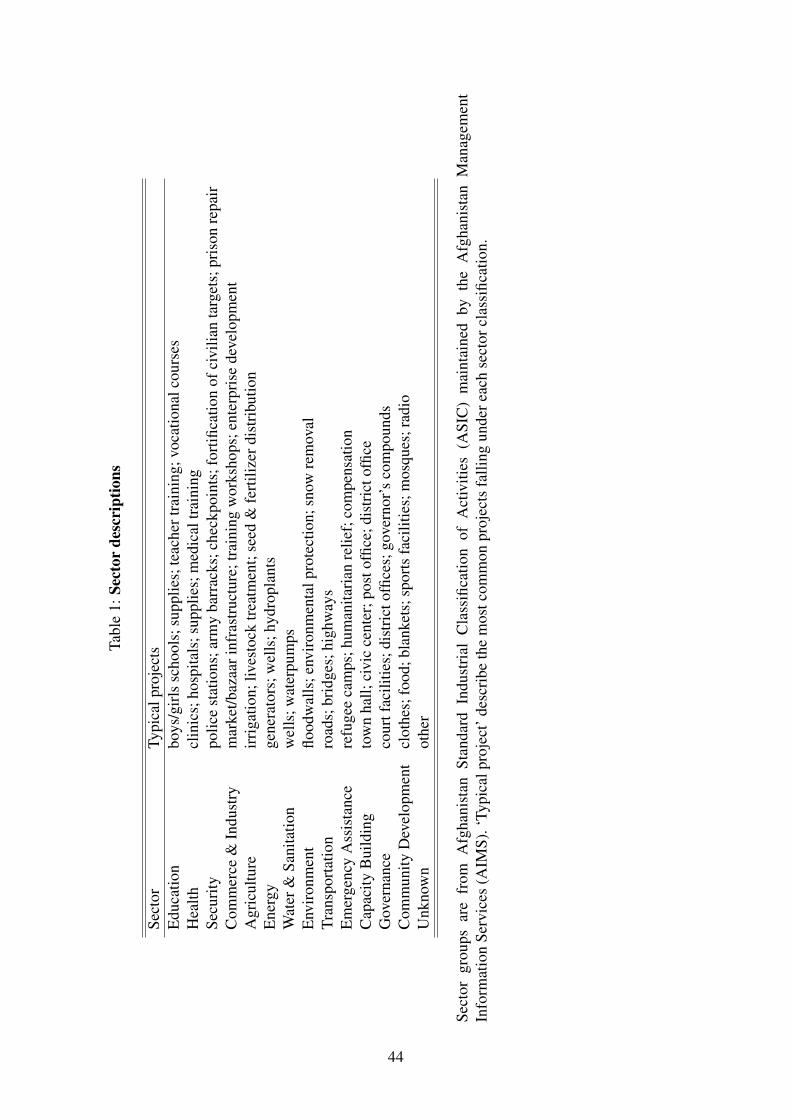
Tabl
e1:
Sect
orde
scri
ptio
ns
Sect
orTy
pica
lpro
ject
sE
duca
tion
boys
/gir
lssc
hool
s;su
pplie
s;te
ache
rtra
inin
g;vo
catio
nalc
ours
esH
ealth
clin
ics;
hosp
itals
;sup
plie
s;m
edic
altr
aini
ngSe
curi
typo
lice
stat
ions
;arm
yba
rrac
ks;c
heck
poin
ts;f
ortifi
catio
nof
civi
lian
targ
ets;
pris
onre
pair
Com
mer
ce&
Indu
stry
mar
ket/b
azaa
rinf
rast
ruct
ure;
trai
ning
wor
ksho
ps;e
nter
pris
ede
velo
pmen
tA
gric
ultu
reir
riga
tion;
lives
tock
trea
tmen
t;se
ed&
fert
ilize
rdis
trib
utio
nE
nerg
yge
nera
tors
;wel
ls;h
ydro
plan
tsW
ater
&Sa
nita
tion
wel
ls;w
ater
pum
psE
nvir
onm
ent
flood
wal
ls;e
nvir
onm
enta
lpro
tect
ion;
snow
rem
oval
Tran
spor
tatio
nro
ads;
brid
ges;
high
way
sE
mer
genc
yA
ssis
tanc
ere
fuge
eca
mps
;hum
anita
rian
relie
f;co
mpe
nsat
ion
Cap
acity
Bui
ldin
gto
wn
hall;
civi
cce
nter
;pos
toffi
ce;d
istr
icto
ffice
Gov
erna
nce
cour
tfac
ilitie
s;di
stri
ctof
fices
;gov
erno
r’s
com
poun
dsC
omm
unity
Dev
elop
men
tcl
othe
s;fo
od;b
lank
ets;
spor
tsfa
cilit
ies;
mos
ques
;rad
ioU
nkno
wn
othe
r
Sect
orgr
oups
are
from
Afg
hani
stan
Stan
dard
Indu
stri
alC
lass
ifica
tion
ofA
ctiv
ities
(ASI
C)
mai
ntai
ned
byth
eA
fgha
nist
anM
anag
emen
tIn
form
atio
nSe
rvic
es(A
IMS)
.‘Ty
pica
lpro
ject
’des
crib
eth
em
ostc
omm
onpr
ojec
tsfa
lling
unde
reac
hse
ctor
clas
sific
atio
n.
44

Tabl
e2:
Des
crip
tive
stat
istic
s
Lev
els
Diff
eren
ces
NM
ean
SDM
inM
axM
ean
SDM
inM
axV
iole
nce
2268
60.
200.
80
340.
0015
1.06
-26
34R
econ
stru
ctio
n&
Dev
elop
men
t:PR
Tpr
ojec
ts22
686
2.22
6.9
034
20.
0225
2.58
-118
143
Edu
catio
n(P
RT
)22
686
0.37
1.4
062
0.00
280.
84-4
156
Hea
lth(P
RT
)22
686
0.19
1.6
096
0.00
200.
65-3
941
Secu
rity
(PR
T)
2268
60.
070.
50
130.
0002
0.24
-97
Aid
proj
ects
2268
611
.75
30.6
013
03-0
.229
711
.50
-112
266
5E
duca
tion
(Aid
)22
686
5.60
18.8
022
80.
0073
2.35
-107
85H
ealth
(Aid
)22
686
7.66
5.2
065
-0.0
552
1.50
-42
53Se
curi
ty(A
id)
2268
60.
761.
90
320.
0180
0.51
-17
31C
omm
erce
(All)
2268
60.
331.
00
42-0
.007
60.
47-2
730
Agr
icul
ture
(All)
2268
62.
4921
.00
1288
-0.0
488
10.2
9-1
120
665
Ene
rgy
(All)
2268
60.
463.
00
145
-0.0
002
1.30
-67
77W
ater
(All)
2268
60.
618.
30
383
-0.1
129
4.03
-313
16
[Tab
le2
cont
inue
son
next
page
...]
45

[...Table 2 continued from previous page]
N Mean SD Min MaxDistrict Characteristics:Education preference 777 0.39 0.34 0 1Health preference 777 0.40 0.35 0 1Security preference 777 0.07 0.20 0 1Hunger 777 1.86 0.86 0 4.37Road access 777 0.84 0.94 0 4.97CDC presence 777 0.51 0.43 0 1Population (thousands) 777 63.0 170.3 2 3289Public Opinion:Opinion 1435 3.11 0.68 1.0 5.0R&D 498 1.19 0.17 1.0 2.0Respect 957 2.90 0.58 1.0 4.0Trust 1204 2.76 0.57 1.1 4.0
Sample includes 398 districts across Afghanistan, and spans 57 months. Data are gleaned fromthe ACSP, WITS, GTD, NRVA, and ANQAR. Violence data are measured as incidents peraverage district population (per 63,000 inhabitants). Reconstruction and development (R&D)data are measured in terms of mean concurrent projects per average district population. Unit ofobservation for violence and R&D data is the district-month. Projects in unmentioned sectorsare tallied in the appropriate total project subcategories (either ‘PRT projects’ or ‘Aid projects’).Unit of observation for district characteristics and public opinion data is the district-surveywave.
46
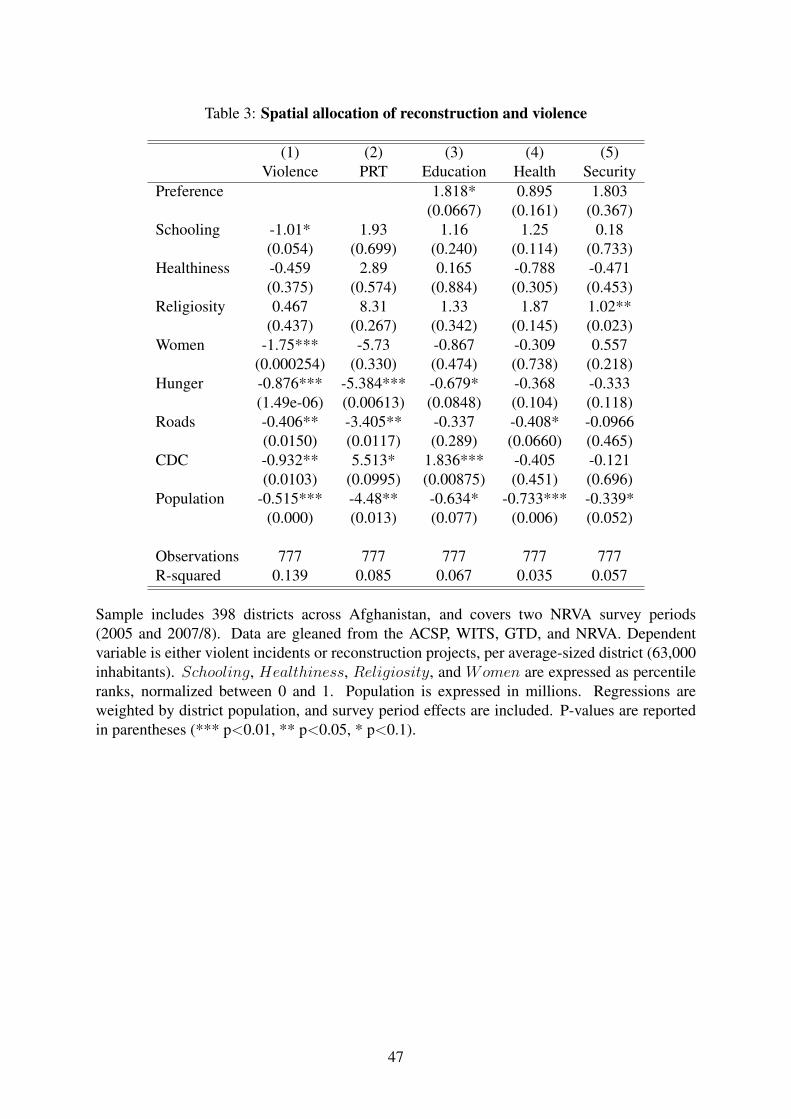
Table 3: Spatial allocation of reconstruction and violence
(1) (2) (3) (4) (5)Violence PRT Education Health Security
Preference 1.818* 0.895 1.803(0.0667) (0.161) (0.367)
Schooling -1.01* 1.93 1.16 1.25 0.18(0.054) (0.699) (0.240) (0.114) (0.733)
Healthiness -0.459 2.89 0.165 -0.788 -0.471(0.375) (0.574) (0.884) (0.305) (0.453)
Religiosity 0.467 8.31 1.33 1.87 1.02**(0.437) (0.267) (0.342) (0.145) (0.023)
Women -1.75*** -5.73 -0.867 -0.309 0.557(0.000254) (0.330) (0.474) (0.738) (0.218)
Hunger -0.876*** -5.384*** -0.679* -0.368 -0.333(1.49e-06) (0.00613) (0.0848) (0.104) (0.118)
Roads -0.406** -3.405** -0.337 -0.408* -0.0966(0.0150) (0.0117) (0.289) (0.0660) (0.465)
CDC -0.932** 5.513* 1.836*** -0.405 -0.121(0.0103) (0.0995) (0.00875) (0.451) (0.696)
Population -0.515*** -4.48** -0.634* -0.733*** -0.339*(0.000) (0.013) (0.077) (0.006) (0.052)
Observations 777 777 777 777 777R-squared 0.139 0.085 0.067 0.035 0.057
Sample includes 398 districts across Afghanistan, and covers two NRVA survey periods(2005 and 2007/8). Data are gleaned from the ACSP, WITS, GTD, and NRVA. Dependentvariable is either violent incidents or reconstruction projects, per average-sized district (63,000inhabitants). Schooling, Healthiness, Religiosity, and Women are expressed as percentileranks, normalized between 0 and 1. Population is expressed in millions. Regressions areweighted by district population, and survey period effects are included. P-values are reportedin parentheses (*** p<0.01, ** p<0.05, * p<0.1).
47

Table 4: Impact of reconstruction
(1) (2)
Time controls Y YFirst differences Y
PRT 0.0133** -0.00500(0.025) (0.118)
Observations 22,288 21,890R-squared 0.033 0.012
Sample includes 398 districts across Afghanistan, and spans 57 months. Data are gleaned fromthe ACSP, WITS, and GTD. Dependent variable is violent incidents per capita. Reconstructionvariable is lagged one period. Regressions are weighted by district population, and standarderrors are clustered by province. P-values are reported in parentheses (*** p<0.01, ** p<0.05,* p<0.1).
48

Table 5: Sector-specific impact of reconstruction
(1) (2) (3) (4)
First differences Y Y YPre-existing trend Y YDistrict-specific trend Y
Education 0.0179 0.0243** 0.0286*** 0.0286***(0.234) (0.012) (0.008) (0.008)
Health 0.0560 -0.0585** -0.0416* -0.0419*(0.100) (0.024) (0.070) (0.071)
Security 0.0509 -0.0295* -0.0433* -0.0433*(0.328) (0.077) (0.066) (0.069)
Observations 22,288 21,890 21,890 21,890R-squared 0.036 0.012 0.262 0.263
Sample includes 398 districts across Afghanistan, and spans 57 months. Data are gleanedfrom the ACSP, WITS, and GTD. Dependent variable is change in violent incidents per capita.Reconstruction variables are lagged one period. All specifications include controls for timeperiod and residual PRT (reconstruction projects in sectors not explicitly reported in table).Regressions are weighted by district population, and standard errors are clustered by province.P-values are reported in parentheses (*** p<0.01, ** p<0.05, * p<0.1).
49

Table 6: Reverse causality
(1) (2) (3) (4)PRT Education Health Security
Panel A: 1 month intervalsViolence 0.00646 -0.00830 0.00563 0.00282
(0.641) (0.173) (0.132) (0.251)
Observations 21,890 21,890 21,890 21,890R-squared 0.017 0.008 0.006 0.006Panel B: 6 month intervalsViolence 0.0201 -0.0156 -0.00185 0.00688
(0.641) (0.309) (0.797) (0.124)
Observations 1,617 1,617 1,617 1,617R-squared 0.117 0.053 0.032 0.036Panel C: predicted violenceViolence -0.389 -0.0939 0.0929** 0.0113
(0.214) (0.386) (0.016) (0.653)
Observations 21,094 21,094 21,094 21,094R-squared 0.017 0.009 0.006 0.006
Sample includes 398 districts across Afghanistan, and spans 57 months (9 half-years). Data aregleaned from the ACSP, WITS, and GTD. Dependent variable is change in mean concurrentdaily projects per capita. All specifications are first-differenced. Violence variable is laggedone period. Time controls, and residual PRT (reconstruction projects in sectors not explicitlyreported in table) are controlled for in all specifications. Regressions are weighted by districtpopulation, and standard errors are clustered by province. P-values are reported in parentheses(*** p<0.01, ** p<0.05, * p<0.1).
50

Table 7: Civil aid donors
(1) (2) (3) (4)USAID Other CSTCA Aid
Education (PRT) 0.0287*** 0.0286*** 0.0285*** 0.0286***(0.007) (0.007) (0.008) (0.007)
Health (PRT) -0.0417* -0.0420* -0.0423* -0.0425*(0.069) (0.068) (0.066) (0.066)
Security (PRT) -0.0454* -0.0432* -0.0431* -0.0451*(0.067) (0.068) (0.066) (0.069)
Education (Aid) -0.00152 -0.0111 -0.00186(0.141) (0.346) (0.110)
Health (Aid) 0.00650 0.00320 0.00260(0.416) (0.198) (0.153)
Security (Aid) -0.0216 -0.0108 -0.0138 -0.0124(0.488) (0.451) (0.343) (0.144)
Observations 21,890 21,890 21,890 21,890R-squared 0.262 0.262 0.262 0.262
Sample includes 398 districts across Afghanistan, and spans 57 months. Data are gleanedfrom the ACSP, WITS, GTD. Dependent variable is change in violent incidents per capita. Allspecifications are first-differenced. Reconstruction and aid variables are lagged one period.Time controls, pre-existing trends, civil aid project volumes, and residual PRT (reconstructionprojects in sectors not explicitly reported in table) are controlled for in all specifications.Regressions are weighted by district population, and standard errors are clustered by province.P-values are reported in parentheses (*** p<0.01, ** p<0.05, * p<0.1).
51

Table 8: Local conservatism
(1) (2) (3) (4)South Religion Women Pashtun
Education 0.0209** 0.0278 0.00563 0.0174(0.033) (0.242) (0.825) (0.126)
Health -0.0259* 0.0428 -0.0249 -0.0154(0.095) (0.287) (0.658) (0.494)
Security -0.00826 -0.000228 0.0447 0.00224(0.699) (0.994) (0.185) (0.916)
Conservatism*Education 0.0912*** -0.00187 0.0370 0.0220(0.006) (0.965) (0.357) (0.344)
Conservatism*Health -0.111 -0.163* -0.0413 -0.0444(0.268) (0.099) (0.711) (0.387)
Conservatism*Security -0.0800*** -0.0728 -0.191*** -0.0805**(0.010) (0.156) (0.005) (0.026)
Observations 21,890 20,955 20,955 21,890R-squared 0.263 0.262 0.262 0.263
Sample includes 398 districts across Afghanistan, and spans 57 months. Data are gleanedfrom the ACSP, WITS, GTD, NRVA, and ANQAR. Dependent variable is change in violentincidents per capita. All specifications are first-differenced. Reconstruction variables arelagged one period. Time controls, pre-existing trends, civil aid project volumes, and residualPRT (reconstruction projects in sectors not explicitly reported in table) are controlled for inall specifications. Regressions are weighted by district population, and standard errors areclustered by province. P-values are reported in parentheses (*** p<0.01, ** p<0.05, * p<0.1).
52

Table 9: Popular antipathy
(1) (2) (3) (4)Opinion R&D Respect Trust
Education 0.0253 0.0274* 0.00960 0.0245(0.253) (0.065) (0.725) (0.364)
Health 0.00616 0.0417 0.0146 -0.0377(0.893) (0.390) (0.784) (0.355)
Security 0.202 -0.123 0.188* 0.00520(0.162) (0.142) (0.055) (0.949)
South*Education 0.330** 0.181** 0.0467 -0.0365(0.011) (0.025) (0.601) (0.668)
South*Health 0.288 -0.262 0.126 0.176(0.135) (0.218) (0.422) (0.269)
South*Security -0.221 0.217* -0.445** -0.00271(0.332) (0.071) (0.010) (0.987)
Observations 1,435 498 957 1,204R-squared 0.080 0.033 0.016 0.040Number of district 365 322 343 353
Sample includes 398 districts across Afghanistan, and spans 6 quarters. Data are gleaned fromthe ANQAR, ACSP, WITS, and GTD. Dependent variable is antipathy towards internationalforces. All specifications include district fixed effects. Reconstruction variables are laggedone period. Time controls and residual PRT (reconstruction projects in sectors not explicitlyreported in table) are controlled for in all specifications. Regressions are weighted by districtpopulation, and standard errors are clustered by province. P-values are reported in parentheses(*** p<0.01, ** p<0.05, * p<0.1).
53

Table 10: Displacement of violence
(1) (2)
District effects Y YPre-existing trend Y YTime effects YRegion × Time effects Y
Neighbours -0.192 -0.105(0.230) (0.268)
Observations 22,288 22,288R-squared 0.700 0.825
Sample includes 398 districts across Afghanistan, and spans 57 months. Data are gleaned fromthe ACSP, WITS, and GTD. Dependent variable is predicted number of attacks. Neighboursis the total number of attacks in surrounding districts. All specifications include fixed effects,time controls, and pre-existing trends. Regressions are weighted by district population, andstandard errors are clustered by province. P-values are reported in parentheses (*** p<0.01,** p<0.05, * p<0.1).
54

Table 11: Competing explanations
(1) (2) (3) (4) (5)Opp Cost Opp Cost Rent Rent Rent
Aid+PRT 0.000508***(0.001)
Commerce -0.0174(0.472)
Agriculture 0.00277***(0.010)
Energy 0.00364(0.253)
Water -0.00355**(0.0210)
Education 0.0281*** 0.0287*** 0.0286*** 0.0286*** 0.0285***(0.008) (0.008) (0.007) (0.008) (0.008)
Health -0.0424* -0.0413* -0.0416* -0.0416* -0.0416*(0.066) (0.074) (0.069) (0.069) (0.070)
Security -0.0458* -0.0451* -0.0457* -0.0453* -0.0460*(0.066) (0.070) (0.065) (0.069) (0.064)
Observations 21,890 21,890 21,890 21,890 21,890R-squared 0.262 0.262 0.263 0.262 0.263
Sample includes 398 districts across Afghanistan, and spans 57 months. Data are gleaned fromthe ACSP, WITS, and GTD. Dependent variable is change in violent incidents per capita. Allspecifications are first-differenced. Reconstruction and aid variables are lagged one period.Time controls, pre-existing trends, civil aid project volumes, and residual PRT (reconstructionprojects in sectors not explicitly reported in table) are controlled for in all specifications.Regressions are weighted by district population, and standard errors are clustered by province.P-values are reported in parentheses (*** p<0.01, ** p<0.05, * p<0.1).
55

Figure 1: Community preferences and the impact of controversial reconstruction
Upper panel of figure depicts a probability density function for ideological preferences (αi) ofa conservative community (denoted by c, in black), and of a moderate community (denoted bym, in grey). Bottom panel depicts corresponding cumulative density functions, whose heightsindicate the overall level of insurgency (R). An injection of controversial reconstruction Bshifts the marginal insurgent (α∗) to the right, leading to an expansion of the insurgency. Thesize of the effect is larger for conservative communities than for moderate ones.
56

Figu
re2:
Size
ofin
surg
ency
and
occu
pier
payo
ffs
(a)
Res
ista
nce
(b)
Occ
upie
rpay
offs
Lef
tpan
elof
figur
ede
pict
sle
velc
urve
sof
insu
rgen
cysi
ze(R
)fo
rva
riou
sal
loca
tions
ofsp
endi
ng.
Rig
htpa
neld
epic
tsle
velc
urve
sof
occu
pier
utili
ty(V
)for
the
sam
eal
loca
tions
.Out
com
esar
eba
sed
onpa
ram
eter
izat
ion
ofm
odel
give
nin
sect
ion
3.2.
4.
57

Figu
re3:
Spat
iald
istr
ibut
ion
ofPR
Tpr
ojec
ts
Map
refle
cts
aver
age
rate
ofPr
ovin
cial
Rec
onst
ruct
ion
Team
(PR
T)
proj
ects
unde
rway
,per
mon
th,c
alcu
late
dac
ross
57m
onth
sfo
r39
8di
stri
cts.
The
mea
sure
isex
pres
sed
inpe
rcap
itate
rms,
and
scal
edto
the
aver
age
dist
rict
popu
latio
n.Fo
rcom
pari
son,
anav
erag
esi
zedi
stri
ctis
expe
cted
tow
itnes
s2.
22PR
Tpr
ojec
tspe
rmon
th.T
hera
nges
prov
ided
inth
ele
gend
are
base
don
quar
tiles
.Dat
aar
egl
eane
dfr
omth
eA
CSP
.
58

Figu
re4:
Mon
thly
vari
atio
nin
reco
nstr
uctio
nan
dvi
olen
ce
Lef
tpan
elof
figur
ede
pict
sm
onth
lyvo
lum
esof
per-
capi
taPR
Tpr
ojec
tsac
ross
34pr
ovin
ces.
Rig
htpa
nelr
eflec
tsth
ein
cide
nce
ofvi
olen
ce,a
tthe
sam
ele
velo
fagg
rega
tion.
Dat
aar
egl
eane
dfr
omth
eA
CSP
,WIT
S,an
dG
TD
.
59

Figu
re5:
Spat
iald
istr
ibut
ion
ofV
iole
nce
Map
refle
cts
aver
age
rate
ofvi
olen
tinc
iden
tspe
rm
onth
,cal
cula
ted
acro
ss57
mon
ths
for
398
dist
rict
s.T
hem
easu
reis
expr
esse
din
per
capi
tate
rms,
and
scal
edto
the
aver
age
dist
rict
popu
latio
n.Fo
rco
mpa
riso
n,an
aver
age
size
dist
rict
isex
pect
edto
incu
r0.
20in
cide
nts
per
mon
th.
The
rang
espr
ovid
edin
the
lege
ndar
eba
sed
onqu
artil
es.D
ata
are
glea
ned
from
the
WIT
San
dG
TD
.
60

Figure 6: Spatial distribution of PRT sectors
Map reflects average rate of Provincial Reconstruction Team (PRT) projects underway, permonth, calculated across 57 months for 398 districts. The measure is expressed in per capitaterms, and scaled to the average district population. For comparison, an average size district isexpected to witness, per month: 0.37 education projects, 0.19 health projects, and 0.07 securityprojects. The ranges provided in the legend are based on quartiles. Data are gleaned from theACSP.
61

APPENDIX A: FORMAL SOLUTIONS
In this mathematical appendix, we impose additional properties to prove uniqueness and
existence of the equilibrium, and formally derive Hypotheses I through III.
Properties
Property 1: Separability and symmetry of the production functions.
g(G,R) = g(G, 0)h(R) ≡ g(G)h(R)
b(B,R) = b(B, 0)h(R) ≡ b(B)h(R)
where h′(R) < 0
Property 2: Linear homogeneity of the community member utility function.
U i(λg, λb;αi) = λU i(g, b;αi) =⇒
∂U i
∂g(λg, λb;αi) = ∂U i
∂g(g, b;αi)
∂U i
∂b(λg, λb;αi) = ∂U i
∂b(g, b;αi)
Property 3: Limit conditions on marginal utilities of extreme community members.29
limαi→−∞
U ib → −∞ lim
αi→+∞U ib → 0
limαi→−∞
U ig → C1 > 0 lim
αi→+∞U ig → C2 > 0
Uniqueness and existence
Given the properties above, we can now proceed with our proofs. Take the first-order condition
(FOC) of U i(g, b;αi) = U i(g(G)h(R), b(B)h(R);αi) with respect to R for individual i.
dU i
dR=∂U i
∂g(g(G)h(R), b(B)h(R);αi)gh
′ +∂U i
∂b(g(G)h(R), b(B)h(R);αi)bh
′ = 0 (FOC)
=⇒∂U i
∂g(g(G)h(R), b(B)h(R);αi)g +
∂U i
∂b(g(G)h(R), b(B)h(R);αi)b = 0 (from Property 1)
=⇒∂U i
∂g(g(G), b(B);αi)g +
∂U i
∂b(g(G), b(B);αi)b = 0 (from Property 2)
=⇒H(G,B;α∗) = 0 (implicit function)
Now for uniqueness, we differentiate H with respect to αi: Hαi = U igαig + U i
bαib. Recall
Ugαi ≥ 0 and Ubαi > 0, by assumption. Then it is clear that Hαi > 0. Since Hαi = ddαi
dU i
dR,
then ddαi
dU i
dR> 0, implying there is at most one α∗ fulfilling the FOC for a given expenditure
bundle (G,B). Hence, R∗(α∗(G,B)) is unique.
29We could also substitute limαi→+∞ U ig → +∞.
62

But does α∗ exist?
limαi→0
dU i/dR = limαi→0
U igg + U i
b b −→ −∞
limαi→+∞
dU i/dR = limαi→+∞
U igg + U i
b b −→ C3 > 0
Since dU i/dR spans the interval (−∞, C3), there exists an α∗ for which the FOC is satisfied,
conditional on H being continuous and differentiable with respect to αi.
Hypotheses
Our first hypothesis is ∆R/∆B > 0, which follows directly from α∗B > 0. In order to establish
the latter, we make use of the implicit function theorem (i.e. ∂α∗/∂B = −HB/Hα∗).
Hα∗ = U∗gα∗ g + U∗bα∗ b
HB = U∗gbb′g + U∗bbb
′b+ U∗b b′ = b′(U∗gbg + U∗bbb) + U∗b b
′
Note: By the property of homotheticity, U∗g g + U∗b b = U∗. So the following obtains:
d
db(U∗g g + U∗b b) =
d
db(U∗) =⇒ U∗gbg + U∗bbb+ U∗b = U∗b
=⇒ U∗gbg + U∗bbb = 0 =⇒ U∗gbgh+ U∗bbbh = 0
=⇒ U∗gbg + U∗bbb = 0
So, HB = U∗b b′, and we can express
α∗B =−HB
Hα∗=
−U∗b b′
U∗gαg + U∗bαb> 0 (A1)
Following analogous logical steps, we can also derive Hypotheis II (∆R/∆G < 0) under
Properties 1-3.
HG = U∗ggg′g + U∗bgg
′b+ U∗g g′ = U∗g g
′
α∗G =−U∗g g′
U∗gαg + U∗bαb< 0
Our third hypothesis requires further elaboration. Consider two communities (denoted by
subscripts c and m) where the preference distributions differ by a constant, such that
fc(αi) = fm(αi + s) ∀ αi , where s > 0 (so that Fm(αi) < Fc(αi) ∀ αi). A given
(G0, B0) bundle yields α∗c and α∗m. If the following conditions (i)-(iii) hold, then
fc(α∗c) > fm(α∗m).
(i) fm is unimodal
(ii) Rc > Rm
(iii) α∗c < arg maxαi
fc(αi)
(iv) α∗c < α∗m
63

Since dR/dB ≈ f(α∗)(∂α∗/∂B), we now compare α∗B across communities. To clarify
notation we substitute the asterisk for the community index, to reflect that (G0, B0) will
generate different MIs in each community. We begin by comparing denominators from
equation A1. Given (G0, B0), under Rc > Rm (condition (ii)), it follows that gc < gm and
bc < bm. By Property 1, gc = Dgm and bc = Dbm, where 0 < D < 1. By Property 2,
U ig(gc, bc) = U i
g(Dgc, Dbc) = U ig(gm, bm); likewise U i
b(gc, bc) = U ib(gm, bm). If we impose
Ugαα = 0, then U igα = U j
gα ∀ i, j. So under the constraint Ugαα = Ubαα = 0, the following is
true: U cgα = Um
gα and U cbα = Um
bα. Because g and b are independent of R, gc = gm and bc = bm.
We thus confirm under these conditions: U cgαg + U c
bαb = Umgαg + Um
bαb.
We now turn to the numerator of equation A1. Since bc = bm, it is clear that b′c = b′m.
Finally, given U ibα > 0, under condition (iv), it follows that U c
b < Umb . Thus, under Properties
1-3, conditions (i)-(iv), and Ugαα = Ubαα = 0, the following holds true: αcB > αmB , and
(dR/dB)c > (dR/dB)m.
64

APPENDIX B: ADDITIONAL TABLES AND FIGURES
Table B1: Anderson-Hsiao 2SLS-IV
(1) (2) (3) (4)OLS IV (L2) IV (L2,L3) IV (L3,L4)
Education 0.0286*** 0.0240*** 0.0247*** 0.0285***(0.008) (0.008) (0.007) (0.005)
Health -0.0416* -0.0585** -0.0575** -0.0419*(0.070) (0.015) (0.016) (0.050)
Security -0.0433* -0.0328** -0.0349** -0.0490**(0.066) (0.047) (0.041) (0.021)
Violence (Lag) -0.515*** 0.007 -0.025 -0.498**(0.000) (0.766) (0.242) (0.043)
Observations 21,890 21,492 21,094 20,696Kleibergen-Paap rk Wald F-stat 4941 1637 3.97
Sample includes 398 districts across Afghanistan, and spans 57 months. Data are gleaned fromthe ACSP, WITS, and GTD. Dependent variable is change in violent incidents per capita. Allspecifications are first-differenced. Reconstruction variables are lagged one period. Column1 replicates column 3 of Table 5. In columns 2, 3, and 4, we instrument for lagged violencewith, respectively: the second lag; the second and third lags; and, the third and fourth lagsof violence. Time controls and residual PRT (reconstruction projects in sectors not explicitlyreported in table) are controlled for in all specifications. Regressions are weighted by districtpopulation, and standard errors are clustered by province. P-values are reported in parentheses(*** p<0.01, ** p<0.05, * p<0.1).
65

Table B2: Descriptive statistics (extended sample)
N Mean SD Min MaxPRT projects 22288 0.0275 2.97 -118 143Education (PRT) 22288 0.0060 0.93 -41 56Health (PRT) 22288 -0.0018 0.68 -39 41Security (PRT) 22288 0.0070 0.42 -9 24Aid projects 22288 -0.1580 11.65 -1122 665Education (Aid) 22288 0.0078 2.36 -107 85Health (Aid) 22288 -0.0552 1.50 -42 53Security (Aid) 22288 0.0353 0.66 -17 31Commerce (All) 22288 -0.0065 0.48 -27 30Agriculture (All) 22288 -0.0285 10.43 -1120 665Energy (All) 22288 -0.0048 1.32 -67 77Water (All) 22288 -0.1071 4.04 -313 16
All values are expressed in terms of first-differences. Sample includes 398 districts acrossAfghanistan, and spans 57 months. Data are gleaned from the ACSP, WITS, GTD, NRVA,and ANQAR. Violence data are measured as incidents per average district population (63,000inhabitants). Reconstruction and development (R&D) data are measured in terms of meanconcurrent projects per average district population. Unit of observation for violence and R&Ddata is the district-month. Projects in unmentioned sectors are tallied in the appropriate totalproject subcategories (either ‘PRT projects’ or ‘Aid projects’). Unit of observation for districtcharacteristics and public opinion data is the district-survey wave.
66

Table B3: Sector-specific impact of reconstruction (extended sample)
(1) (2) (3)
First differences Y Y YPre-existing trend Y YDistrict-specific trend Y
Education 0.019** 0.020** 0.020**(0.020) (0.037) (0.040)
Health -0.051** -0.038** -0.038**(0.022) (0.037) (0.040)
Security -0.018 -0.023* -0.024*(0.138) (0.082) (0.079)
Observations 21,890 21,890 21,890R-squared 0.012 0.262 0.263
Sample includes 398 districts across Afghanistan, and spans 57 months. Data are gleanedfrom the ACSP, WITS, and GTD. Dependent variable is change in violent incidents per capita.All specifications are first-differenced. Reconstruction variables are lagged one period. Allspecifications include controls for time period and residual PRT (reconstruction projects insectors not explicitly reported in table). Regressions are weighted by district population, andstandard errors are clustered by province. P-values are reported in parentheses (*** p<0.01,** p<0.05, * p<0.1).
67

Table B4: Civil aid donors (extended sample)
(1) (2) (3) (4)USAID Other CSTCA Aid
Education (PRT) 0.0195** 0.0196** 0.0194** 0.0195**(0.0366) (0.0356) (0.0388) (0.0373)
Health (PRT) -0.0377** -0.0379** -0.0374** -0.0378**(0.0361) (0.0355) (0.0381) (0.0361)
Security (PRT) -0.0240* -0.0233* -0.0235* -0.0240*(0.0814) (0.0840) (0.0808) (0.0825)
Education (Aid) -0.00154 -0.0107 -0.00185(0.128) (0.355) (0.104)
Health (Aid) 0.00567 0.00317 0.00207(0.477) (0.176) (0.226)
Security (Aid) -0.0207 -0.00991 0.00801 0.000109(0.498) (0.522) (0.678) (0.991)
Observations 21,890 21,890 21,890 21,890R-squared 0.262 0.262 0.262 0.262
Sample includes 398 districts across Afghanistan, and spans 57 months. Data are gleaned fromthe ACSP, WITS, and GTD. Dependent variable is change in violent incidents per capita. Allspecifications are first-differenced. Reconstruction and aid variables are lagged one period.Time controls, pre-existing trends, civil aid project volumes, and residual PRT (reconstructionprojects in sectors not explicitly reported in table) are controlled for in all specifications.Regressions are weighted by district population, and standard errors are clustered by province.P-values are reported in parentheses (*** p<0.01, ** p<0.05, * p<0.1).
68

Table B5: Competing explanations (half-year units)
(1) (2) (3) (4) (5)Opp Cost Opp Cost Rent Rent Rent
Aid+PRT 0.00102(0.402)
Commerce -0.176(0.155)
Agriculture 0.00110(0.392)
Energy -0.00777(0.726)
Water -0.0109(0.252)
Education -0.0395 -0.0353 -0.0382 -0.0373 -0.0373(0.710) (0.739) (0.719) (0.726) (0.726)
Health -0.0775 -0.0762 -0.0760 -0.0707 -0.0701(0.640) (0.645) (0.647) (0.676) (0.675)
Security -0.215 -0.188 -0.214 -0.205 -0.205(0.369) (0.426) (0.370) (0.389) (0.389)
Observations 1,617 1,617 1,617 1,617 1,617R-squared 0.251 0.252 0.251 0.251 0.252
Sample includes 398 districts across Afghanistan, and spans 54 months. Data are gleaned fromthe ACSP, WITS, and GTD. Dependent variable is change in violent incidents per capita. Allspecifications are first-differenced. Reconstruction and aid variables are lagged one period.Time controls, pre-existing trends, civil aid project volumes, and residual PRT (reconstructionprojects in sectors not explicitly reported in table) are controlled for in all specifications.Regressions are weighted by district population, and standard errors are clustered by province.P-values are reported in parentheses (*** p<0.01, ** p<0.05, * p<0.1).
69

Figu
reB
1:Pa
rtia
lreg
ress
ion
plot
s
Figu
rede
pict
sad
ded-
vari
able
plot
sfo
rpar
tialr
egre
ssio
nsba
sed
oneq
uatio
n5.
Une
xpla
ined
resi
dual
s(a
long
both
axes
)are
win
sori
zed
atth
e0.
1%le
veli
nth
isgr
aph,
tom
agni
fyth
eco
rere
latio
nshi
pof
inte
rest
.Sa
mpl
ein
clud
es39
8di
stri
cts
acro
ssA
fgha
nist
an,a
ndsp
ans
57m
onth
s.D
ata
are
glea
ned
from
the
AC
SP,W
ITS,
and
GT
D.
70

APPENDIX C: ADDITIONAL ROBUSTNESS CHECKS
C.1 Regional political drivers
The dynamics of power vary immensely across Afghanistan. The central government enjoys
relative strength and stability in Kabul and other urban areas, whereas the distribution of
power is more diffuse in the Afghan hinterland (particularly in contested areas, which
comprise at least one third of the country). In Southern Afghanistan, the central government
holds the least authority. Across much of the country, in fact, government authority is
effectively inexistent outside of city centers. Given this political heterogeneity, one obvious
question is whether the effects we observe are driven by differential power structures. If health
projects are disproportionately channeled to areas falling under strict government control,
whereas education programming is carried out in areas increasingly isolated from the state,
then this could explain our results. From Table 3, however, there is no indication that either
type of programming is disproportionately channeled towards more or less populated areas.
Still, we do not have precise spatial data on effective government control (population is
merely a proxy). So in order to better ensure our results are not driven by regional
particularities (i.e. disparities in wealth, governmental control, etc.), we alternately exclude
various ISAF Regional Command regions and urban centers from our tests. When doing so,
we yield similar results.30 It is apparent our general findings are not driven by particularities of
urban areas, the South, or any other region. Results are stored in Table C1.
C.2 PRT command shifts
In total, there have been 26 PRTs established across Afghanistan. Among these, transfers of
command have taken place on 30 separate occasions. The Americans are responsible for
initially operating most PRT bases in the country, particularly at the beginning of the
occupation. As early as June 2003, however, the command of some PRTs was handed over to
coalition partner countries (as NATO took the military lead from the smaller US-led coalition
Operation Enduring Freedom in Kabul).
We consider the establishment of PRT bases and handover periods as a source of project
variation which is not driven by local conflict. Decisions regarding PRT command are
negotiated at the highest level of authority (Eronen 2008; Stapleton 2003), months or years in
advance of changes on the ground (NATO-ISAF 2006; Maloney 2005).31 Conveniently for our
analysis, experts have noted the style of PRT management is country specific. The
30We consider urban centers to compromise the 5% most populated districts. For robustness, we alternate oururban indicator to denote the 10% and 20% most populated districts, and find similar results.
31Maloney (2005) even states the NATO expansion plan entailed the construction of (or replacement of OEFPRTs with) NATO ISAF PRTs in a counterclockwise fashion around the country. See ISAF (2009) for post-rolloutconfirmation.
71

organizational structure, development focus, and funding sources can vary across models
(Eronen 2008). Because coordination between PRTs was limited, handovers of control
implied real changes to operational focus (Stapleton 2003). The sectoral shifts in
programming which accompany handovers therefore reflect individual nation proclivities,
rather than real-time adjustments to future security. Even if project selection is normally
tailored to local conditions, such nuanced expertise is unlikely to obtain at the beginning of a
PRT command.
Consequent to the above, the handover of a PRT implies a structural break in the level and
composition of reconstruction programming. That break is arguably exogenous with respect to
contemporaneous local conflict, which implies its validity for use as an instrument. Throughout
our sample period there are 19 instances of PRT establishment or handover, enabling us to
define 16 instruments corresponding to the entry/exit of various coalition members into/from
PRT management. Selective targeting of management teams by insurgents would constitute a
violation of the exclusion restriction. It is therefore worth noting PRT bases are distinct from
combat-tasked military outposts, and rarely bear the burden of attack in our data.
The breakpoints associated with command shifts are evident through (unreported) graphical
inspection. Their timing, however, does not perfectly coincide with dates reported in official
documents or media. Therefore, we define 6-month transition windows centered around the
publicly reported date of transition. So each of our 16 dummy variables indicates (for each
observation) whether that district-month is subject to the corresponding transition type. These
transition windows capture immediate shifts during the month of handover, wind-down effects
in the months preceding the handover, and scale-ups (or further scale-downs) which occurred
in the months subsequent to handover.32
Before reporting 2SLS-IV results, we present OLS counterparts for comparison. We adopt a
parsimonious specification here, so as not to limit the residual variation available for identifying
our LATE. Relative to the full specification of equation 6, we drop the following controls: time
period effects; lagged violence; and total (residual) PRT projects. Because our instrument
is aggregated to the province (sometimes broader) 6-month level, we feel this parsimony is
justified to retain sufficient variation in predicted PRT programming. At any rate, the OLS
results in Panel A of Table C2 are practically equivalent to those reported earlier (in Table 5).
In Panel B we instrument for the number of projects with the incidence of transition in or
out of PRT management for various countries. When doing so, the estimated impact of PRT
programming remains qualitatively intact for education and health (columns 1, 2, and 4), but
not for security (columns 3 and 4). The results strengthen our causal interpretation offered
32Around dates of establishment, the window enables comparison between programming inception, and theimmediately preceding period which is void of PRT programming, but often replete with other civic aid projects.By exploiting both PRT handovers and the establishment of bases, we use (arguably) exogenous variation in sectorprogramming along both the intensive and extensive margins.
72

thus far, but it should be noted we cannot exclude the possibility our instruments are weak. In
Panel C we report small Cragg-Donald Wald F statistics, which fall far short of the appropriate
critical values reported in Stock and Yogo (2005). On the other hand, Hansen J statistic p-
values indicate we cannot reject that the overidentifying restrictions, and by implication–our
instruments, are valid. Moreover, the Hausman test (p-value) results indicate we cannot reject
that PRT spending is exogenous, since the estimated effects are not systematically different,
whether measured using the instrumented or unfiltered variation. As such, we may revert back
to Table 3 for (arguably) causal estimates of the impact of PRT programming.
73

Tabl
eC
1:R
egio
nald
rive
rs
(1)
(2)
(3)
(4)
(5)
(6)
/Kab
ul/U
rban
/Sou
th/E
ast
/Nor
th/W
est
Edu
catio
n0.
0275
**0.
0287
***
0.02
03**
0.03
40**
0.03
47**
*0.
0298
**(0
.013
)(0
.008
)(0
.042
)(0
.029
)(0
.006
)(0
.013
)H
ealth
-0.0
395
-0.0
406*
-0.0
261*
-0.0
876*
-0.0
473*
-0.0
319
(0.1
04)
(0.0
84)
(0.0
90)
(0.0
55)
(0.0
61)
(0.1
88)
Secu
rity
-0.0
465*
-0.0
538*
*-0
.008
46-0
.038
4-0
.054
1*-0
.066
5***
(0.0
78)
(0.0
25)
(0.6
95)
(0.1
84)
(0.0
57)
(0.0
03)
Obs
erva
tions
21,0
6520
,845
18,6
4513
,145
15,2
3519
,470
R-s
quar
ed0.
264
0.26
70.
246
0.28
50.
264
0.26
3
Sam
ple
incl
udes
398
dist
rict
sac
ross
Afg
hani
stan
,and
span
s57
mon
ths.
Dat
aar
egl
eane
dfr
omth
eA
CSP
,WIT
S,an
dG
TD
.Dep
ende
ntva
riab
leis
chan
gein
viol
enti
ncid
ents
perc
apita
.All
spec
ifica
tions
are
first
-diff
eren
ced.
Eac
hco
lum
nex
clud
esob
serv
atio
nspe
rtai
ning
toth
ere
gion
liste
din
the
corr
espo
ndin
ghe
ader
.R
econ
stru
ctio
nva
riab
les
are
lagg
edon
epe
riod
.Ti
me
cont
rols
,pre
-exi
stin
gtr
ends
,civ
ilai
dpr
ojec
tvol
umes
,and
resi
dual
PRT
(rec
onst
ruct
ion
proj
ects
inse
ctor
sno
texp
licitl
yre
port
edin
tabl
e)ar
eco
ntro
lled
for
inal
lspe
cific
atio
ns.
Reg
ress
ions
are
wei
ghte
dby
dist
rict
popu
latio
n,an
dst
anda
rder
rors
are
clus
tere
dby
prov
ince
.P-v
alue
sar
ere
port
edin
pare
nthe
ses
(***
p<0.
01,*
*p<
0.05
,*p<
0.1)
.
74

Table C2: PRT command shifts
(1) (2) (3) (4)Panel A: OLSEducation 0.0170 0.0217**
(0.110) (0.029)Health -0.0600** -0.0613**
(0.027) (0.021)Security -0.0371** -0.0347**
(0.033) (0.037)Observations 21,890 21,890 21,890 21,890Panel B: 2SLS-IVEducation 0.114* 0.147**
(0.071) (0.011)Health -0.302* -0.415***
(0.097) (0.003)Security 0.172 0.122**
(0.203) (0.038)Observations 21,890 21,890 21,890 21,890Panel C: DiagnosticsCragg-Donald Wald F statistic 0.71 0.30 0.86 0.27Hansen J statistic (p-value) 0.36 0.40 0.42 0.36Hausman test (p-value) 0.71 0.96 0.74 0.98
Sample includes 398 districts across Afghanistan, and spans 57 months. Data are gleanedfrom the ACSP, WITS, GTD, and media. Dependent variable is change in violent incidentsper capita. Reconstruction variables are lagged one period, and instrumented in Panel B withPRT command shifts. Regressions are weighted by district population, and standard errors areclustered by province. P-values are reported in parentheses (*** p<0.01, ** p<0.05, * p<0.1).
75

APPENDIX D: EXTENSIONS
D.1 Hardware vs. software
It is worth distinguishing between the quantity of institutions, and their quality. Some projects
(the ‘hardware’) bolster the stock of physical infrastructure, whereas others (the ‘software’)
refine the associated human capital inputs. One may conjure reasons for why either hardware or
software should disproportionately affect violence if the channel is public opinion. Regarding
hardware, building a clinic or a school achieves a tangible, visual impression of progress. Public
recognition of software in the form of medical or educational training could be slower, even
if those projects carry greater real impact (Foreign NGO K 2013; Donor B 2013). Security
problems associated with reconstruction typically arise in the construction phase (Foreign NGO
I 2013), suggesting the material presence of foreign-led development may elicit more adversity
than affinity for hardware projects irrespective of sector. Both education and health projects
(relative to security, transportation, or energy, for example) consist largely of human capital
improvements. As such, it is very unlikely that human capital is confounded with health, for
instance, and physical capital with education. That is, our differential findings across sectors
are unlikely to be driven by differences in human/physical capital inputs. Nevertheless, the
distinction is interesting to explore, particularly if it sheds light on which type of programming
affects conflict within the education and health sectors.33
To distinguish between ‘hardware’ and ‘software’-oriented programming, we adopt a basic
automated content analysis method. In particular, we use a dictionary method to classify
projects based on keyword detection.34 Within each project description stored in the ACSP,
our algorithm identifies designated keywords associated with either hardware or
software-oriented programming, and scores the project by running a tally. Our decision rule
for classification is simply the following: If a project description contains more keywords
associated with hardware than with software, then the project is deemed hardware (and vice
versa).35 In the case of a tie, no category is assigned and the project is grouped in a third
residual category. This algorithm is then manually verified to the satisfaction of the author. Of
the 22,351 PRT projects in total, 5,135 are classified as software, and 11,447 are classified as
33This appendix constitutes deeper explorative analysis of our findings. The empirical tests conducted hereinare not motivated by qualitative evidence or formal theory, so for brevity and parsimony we refrain from discussingsecurity-sector projects.
34More sophisticated classification schemes such as the nonparametric approach of Hopkins and King (2010),or various supervised learning methods, are neither necessary nor appropriate for this particular application. Thisis partly because project descriptions are very brief, and so ‘training’ would be somewhat futile in this setting(while it is straightforward to simply select keywords directly).
35Our hardware-associated (root) keywords are the following: ‘construct’, ‘repair’, ‘refurb’, ‘restor’, ‘replace’,‘replenish’, ‘renovate’, ‘procure’, ‘equip’, ‘suppl’, ‘furni’, ‘install’, ‘purchase’, ‘water’, ‘well’, ‘wall’, ‘build’,and ‘new’. Our software-associated (root) keywords are comprised of: ‘service’, ‘train’, ‘support’, ‘program’,‘develop’, ‘workshop’, ‘skill’, ‘teach’, ‘assist’, and ‘course’.
76

hardware. Of all 4,009 education-oriented PRT projects, 732 are classified as software, and
2,221 as hardware. Among 1,877 PRT health projects, 618 are deemed software, and 855 as
hardware. The remaining projects generally lack sufficient detail to be classified even by
manual coders. But of course, some project descriptions are just sufficiently unique that our
keywords do not identify them with either of our dichotomous (and somewhat exhaustive)
categories.
Column 1 of Table D1 estimates a parsimonious specification, examining the impact of
hardware and software-linked projects within each sector, without accounting for the broader
picture of reconstruction and development. Column 2 additionally controls for all remaining
(and mutually exclusive) PRT project categories, as well as aid more generally. In full, the
results demonstrate the impact of both education and health programming is more precisely
estimated for the subset of hardware-oriented projects. Also reported are Wald tests for equality
of coefficients between hardware and software within each sector. The estimated effect sizes
do not significantly differ between hardware and software programming for either sector. It
is thus difficult to attribute our findings to hardware alone. Nevertheless, we feel such an
interpretation would not be inconsistent with our theory which places perceptions at the heart
of community response to foreign-led development. Particularly since we examine month-on-
month changes, from our theoretical perspective it would be surprising if software carried the
stronger immediate impact.
D.2 Gender sensitivity
Our theory is premised on the notion that certain reconstruction projects are ill-perceived
through a local (read, traditional) lens, whereas others are relatively innocuous or even
welcomed. Gender-oriented programming is a common point of controversy cited by media
and laypersons alike. According to Jackson and Giustozzi (2012), certain segments of Afghan
society strongly oppose female education, for instance. Training workshops for integration of
females into the local labour market, or women’s rights seminars may also elicit local
opposition, particularly in conservative areas.
We therefore want to ascertain whether the positive effect of education programming on
violence is actually driven by the introduction of girls’ schools, as some readers might
imagine. A number of major stakeholders have, after all, asserted that local problems
surrounding education programming are likely to be gender-related (Donor E 2013; Foreign
NGO I 2013; Research Organization C 2013). If this assertion is true, then our findings are
driven less by the abrasiveness of one sector over another on ideological grounds, and more by
one specific traditional friction. While the adverse effects of reconstruction programming in
that case would still ultimately derive from public opinion, the explanation would perhaps be
less compelling as a more narrow subset of the community may be responsible for violent
77

resistance. In such a case, one would expect gender-specific programming in general
(particularly programming aimed at the empowerment of women) to positively affect the
incidence of conflict.
To test whether this alternative explanation for our results has merit, we test whether female-
oriented projects have a positive impact on violence. But first, to identify such projects, we
apply the automated content analysis method described in the foregoing section. Through
project descriptions in the ACSP, we search for any of the following keywords: ‘female’, ‘girl’,
‘woman’, ‘women’, ‘maternal’, and ‘gender’. All projects containing any such keywords are
classified as being female-oriented. Manual inspection verifies the accuracy of this algorithm.
Of the 22,351 PRT projects in total, 1,084 contain this explicit gender-focus (630 of which
fall into either the education or health sectors). Given this new variable, we simply construct
a project volume measure for female-oriented projects, in the same manner as we constructed
sector-specific flows.
In column 1 of Table D2 we run a parsimonious specification, examining the impact of
female-oriented programming (across all sectors) on violence. While the point estimate is
positive, it is not statistically significant. Next, in column 2 we control for all residual (and
mutually exclusive) PRT spending categories, as well as civic aid projects. Although the
precision of the estimate improves, it remains insignificant. In the following two columns we
focus on female-oriented projects within the education and health sectors, to ascertain whether
these drive our previous results. While it does not appear that female-oriented programming in
education incites violence, the evidence rather (albeit, weakly) suggests that female-oriented
health projects may elicit popular resistance. In sum, however, we cannot make strong claims
regarding any special role of gender sensitivity in the link between reconstruction and conflict.
78

Table D1: Hardware vs. software
(1) (2)
Residual PRT YAid Y
Education (Hardware) 0.0253*** 0.0276***(0.008) (0.004)
Education (Software) 0.0362 0.0389(0.141) (0.106)
Health (Hardware) -0.0567* -0.0521*(0.073) (0.092)
Health (Software) -0.0734 -0.0699(0.111) (0.131)
Education 0.0231(0.509)
Health 0.00926(0.758)
Security -0.0454*(0.066)
Observations 21,890 21,890R-squared 0.262 0.262Wald test p-values (H0 : Hardware = Software)Education (0.685) (0.677)Health (0.703) (0.679)
Sample includes 398 districts across Afghanistan, and spans 57 months. Data are gleanedfrom the ACSP, WITS, and GTD. Dependent variable is change in violent incidents percapita. Reconstruction variables are lagged one period. Time controls and pre-existingtrends are controlled for in both specifications. Civil aid project volumes, and residual PRT(reconstruction projects in categories not explicitly reported in table) are controlled for incolumn 2. Regressions are weighted by district population, and standard errors are clustered byprovince. P-values are reported in parentheses (*** p<0.01, ** p<0.05, * p<0.1).
79

Table D2: Female-oriented programming
(1) (2) (3) (4)
Residual PRT Y YAid Y Y
Female 0.0295 0.0334(0.223) (0.172)
Female (Education) 0.00330 -0.00299(0.911) (0.920)
Female (Health) 0.140 0.154*(0.123) (0.093)
Education 0.0350***(0.003)
Health -0.0484**(0.043)
Observations 21,890 21,890 21,890 21,890R-squared 0.262 0.262 0.262 0.263
Sample includes 398 districts across Afghanistan, and spans 57 months. Data are gleanedfrom the ACSP, WITS, and GTD. Dependent variable is change in violent incidents per capita.Reconstruction variables are lagged one period. Time controls and pre-existing trends arecontrolled for in all specifications. Civil aid project volumes, and residual PRT (reconstructionprojects in categories not explicitly reported in table) are controlled for in columns 2 and 4.Regressions are weighted by district population, and standard errors are clustered by province.P-values are reported in parentheses (*** p<0.01, ** p<0.05, * p<0.1).
80


![Marry Poppins Conflict Calendar - Brightstone Productions · 2020-01-31 · Marry Poppins Conflict Calendar Read ALL notes below before filling out conflict calendar. [ ] Check](https://img.pdfslide.net/doc/110x75/5ee39e3cad6a402d666d5cb2/marry-poppins-coniict-calendar-brightstone-productions-2020-01-31-marry-poppins.jpg)


![Index [assets.cambridge.org]assets.cambridge.org/97811070/26537/index/... · executive-legislative conflict, 11–12 judicial-elected branch conflict, 12–13 national-subnational](https://img.pdfslide.net/doc/110x75/600dea734d2ae436a803c479/index-executive-legislative-coniict-11a12-judicial-elected-branch-coniict.jpg)