Embed Size (px)
Citation preview

COMPREHENSIVE ANNUAL FINANCIAL REPORT FOR YEAR ENDED DECEMBER 31, 2012
movingwe keep the region ®
Chairman’s Letter. . . . . . . . . . . . . . . . . . . . . . . . . . . . . . . . . . . . . . . . . . . . . . . . . . . . . . . . . . . . . . . . . . . . . . . . . . . . . . . . . . . . . .
Board of Commissioners . . . . . . . . . . . . . . . . . . . . . . . . . . . . . . . . . . . . . . . . . . . . . . . . . . . . . . . . . . . . . . . . . . . . . . . . . . . . .
Organizational Chart . . . . . . . . . . . . . . . . .. . . . . . . . . . . . . . . . . . . . . . . . . . . . . . . . . . . . . . . . . . . . . . . . . . . . . . . . . . . . . . . . .
Officers and Executive Staff . . . . . . . . . . . . . . . . . . . . . . . . . . . . . . . . . . . . . . . . . . . . . . . . . . . . . . . . . . . . . . . . . . . . . . . . . .
Facilities. . . . . . . . . . . . . . . . . . . . . . . . . . . . . . . . . . . . . . . . . . . . . . . . . . . . . . . . . . . . . . . . . . . . . . . . . . . . . . . . . . . . . . . . . . . . . . . . .
Report of the Chief Executive Officer. . . . . . . . . . . . . . . . . . . . . . . . . . . . . . . . . . . . . . . . . . . . . . . . . . . . . . . . . . . . . .Letter of Transmittal... . . . . . . . . . . . . . . . . . . . . . . . . . . . . . . . . . . . . . . . . . . . . . . . . . . . . . . . . . . . . . . . . . . . . . . . . . . . . . .
346679
17
FINANCIAL SECTION
INTRODUCTORY SECTION
STATISTICAL SECTION (Unaudited)
Independent Auditor’s Report . . . . . . . . . . . . . . . . . . . . . . . . . . . . . . . . . . . . . . . . . . . . . . . . . . . . . . . . . . . . . . . . . . . . . .
Management’s Discussion and Analysis (Unaudited). . . . . . . . . . . . . . . . . . . . . . . . . . . . . . . . . . . . . . . . . . . .
Combined Financial Statements: Combined Statements of Net Position. . . . . . . . . . . . . . . . . . . . . . . . . . . . . . . . . . . . . . . . . . . . . . . . . . . . . . . . .
Combined Statements of Revenues, Expenses and Changes in Net Position . . . . . . . . . . . .
Combined Statements of Cash Flows . . . . . . . . . . . . . . . . . . . . . . . . . . . . . . . . . . . . . . . . . . . . . . . . . . . . . . . . . .
Notes to Combined Financial Statements . . . . . . . . . . . . . . . . . . . . . . . . . . . . . . . . . . . . . . . . . . . . . . . . . . . .
Required Supplementary Information (Unaudited): Schedule of Funding Progress for Health Benefits Plan. . . . . . . . . . . . . . . . . . . . . . . . . . . . . . . . . . . . .
Notes to Required Supplementary Information . . . . . . . . . . . . . . . . . . . . . . . . . . . . . . . . . . . . . . . . . . . . . .
Supplementary Information: Combined Supplemental Schedule of Net Position Information by Fund . . . . . . . . . . . . . . .
Combined Supplemental Schedule of Changes in Fund Net Position Information by Fund. . . . . . . . . . . . . . . . . . . . . . . . . . . . . . . . . . . . . . . . . . . . . . . .
Supplemental Schedule of Net Position Information for Bond and Project Funds . . . . . Supplemental Schedule of Changes in Net Position Information for Bond and Project Funds. . . . . . . . . . . . . . . . . . . . . . . . . . . . . . . . . . . . . . . . . . . . . . . . . . . . . . . . . . . . . . . . . . .
2325
34363840
8585
86
8889
90
Prepared by the Office of the Chief Financial Officer
Financial Trends: Net Position. . . . . . . . . . . . . . . . . . . . . . . . . . . . . . . . . . . . . . . . . . . . . . . . . . . . . .
Changes in Net Position. . . . . . . . . . . . . . . . . . . . . . . . . . . . . . . . . . . .. . .
Revenue Capacity Data: Schedule of Major Revenues by Source . . . . . . . . . . . . . . . . . . . .
Schedule of Toll Revenue by Bridge.. . . . . . . . . . . . . . . . . . . . . . . .
Schedule of Bridge Cash Toll Rates . . . . . . . . . . . . . . . . . . . . . . . ..
Schedule of Bridge Traffic By Vehicle Classification . .. . . .
Schedule of Bridge Traffic By Bridge .. . . . . . . . . . . . . . . . . . . . . . .
Schedule of PATCO Transit System Operating Revenues... Schedule of PATCO Passenger Fares . . . . . . . . . . . . . . . . . . . . . . .
Schedule of PATCO Transit System Ridership . . . . . . . . . . . .
Debt Capacity: Schedule of Debt Service Coverage. . . . . . . . . . . . . . . . . . . . . . . . . .
Schedule of Funded Debt . . . . . . . . . . . . . . . . . . . . . . . . . . . . . . . . . . . .
Schedule of Ratio of Debt per Customer....... . . . . . . . . . . . . .
97
97
97
97
989899999999
Demographic and Economic Data: Schedule of Economic Statistics for the Pennsylvania Port District . . . . . . . . . . . . . . . . . . . . . . . .
Schedule of Top Ten Employers in the Pennsylvania Port District. . . . . . . . . . . . . . . . . . . . . . . .Schedule of Economic Statistics for the New Jersey Port District . . . . . . . . . . . . . . . . . . . . . . . . . .
Schedule of Top Ten Employers in the New Jersey Port District . . . . . . . . . . . . . . . . . . . . . . . . . .
Operating Information: Schedule of Bridge Operating Revenues. . . . . . . . . .
Schedule of General Expenses By Function. . . . . .
Schedule of Operating Statistics . . . . . . . . . . . . . . . . . . . .
Schedule of Full-Time Authority Employees... . . Schedule of Capital Expenditures . . . . . . . . . . . . . . . . .
Schedule of Bridge and PATCO Operations . . . .
9393
9494949595959595
969696
TABLE OF CONTENTSCertificate ofAchievementfor Excellencein FinancialReporting
Presented to
Delaware River Port AuthorityFor its Comprehensive Annual
Financial Reportfor the Fiscal Year Ended
December 31, 2011
A Certificate of Achievement for Excellencein Financial Reporting is presented by the
Government Finance Officers Association of the United States and Canada to government units and public employee retirement systems whose
comprehensive annual financial reports (CAFRs) achieve the highest standards in government
accounting and financial reporting.
President
Executive Director
For the twentieth consecutive year the Delaware River Port Authority
was awarded the Certificate of Achievement for
Excellence in Financial Reportingby the Government Finance Officers Association of the United States and Canada for its 2011 Comprehensive
Annual Financial Report.
3DRPA 2012 ANNUAL REPORT
INTRODUCTORY SECTION
CHAIRMAN’S LETTER
July 26, 2013
To Our Customers and Bondholders:
In August 2012, Pennsylvania Gov. Tom Corbett announced his intention to step down as chairman of the Board of Commissioners. After just 18 months on the board, the governor had achieved his strategic goal of returning the DRPA to its original core mission: Providing safe, reliable, customer-friendly transportation to the people of southeastern Pennsylvania and southern New Jersey.
Under Gov. Corbett’s leadership, the board also presided over tactical successes that benefitted our bridge users and rail passengers. Authority finances were stabilized, monthly debt service costs were reduced, a comprehensive management audit was commissioned and major capital improvement projects at PATCO and on the Walt Whitman Bridge moved forward. The board also appointed the first inspector general in DRPA history and committed the authority to operating more transparently and in accordance with a comprehensive set of reform resolutions.
Our 2013 operating budget reflected a reduction in expenditures of 6.3 percent that should help preserve the current bridge-toll and rail-fare structures for the foreseeable future. As a reflection of our improved financial discipline, Standard & Poor’s in late-2012 revised its outlook for all outstanding DRPA bonds from “stable” to “positive,” while Moody’s changed its outlook from “negative” to “stable.”
The DRPA now possesses every tool it needs to become one of the most efficient, customer-focused and respected transportation agencies in the country. Under my chairmanship, the board will wield those tools to build a progressively improving DRPA, with its sole mission being safe and reliable interstate transportation. We will continue to pursue management efficiencies, act transparently and, most importantly, add value on our customers’ terms, not our own.
Sincerely,
David F. Simon, Chairman
Delaware River Port Authority of Pennsylvania and New Jersey

4 DRPA 2012 ANNUAL REPORT
HonorableChris ChristieGovernorState of New Jersey
HonorableTom CorbettGovernorCommonwealth of Pennsylvania
GOVERNORS
BOARD OF COMMISSIONERS
Joann BELLGovernment Relations Executive Pugliese Associates
David F. SIMONChairmanExecutive Vice President and Chief Legal Offi cerJefferson Health System
Joanna CRUZAttorney Kerns, Pearlstine, Onorato & Hladik
WalterD’ALESSIOVice ChairmanNorthMarq Capital
Hon. Robert M. MCCORDState TreasurerCommonwealth of Pennsylvania
William R. SASSOBoard ChairmanStradley Ronon Stevens & Young
Hon. Jack WAGNER Auditor GeneralCommonwealth of Pennsylvania
Andrew J.REILLYAttorney Swartz Campbell
PENNSYLVANIA
INTRODUCTORY SECTION

5DRPA 2012 ANNUAL REPORT
INTRODUCTORY SECTION
Jeffrey L. NASHVice ChairmanFreeholder, Camden County Board of Chosen Freeholders
Denise Y. MASONVice PresidentHSBC Bank USA
E. Frank DIANTONIOPresident, Construction & General Laborers Union Local 172
Charles FENTRESSRetired Police SergeantDelaware River Port Authority
Albert F. FRATTALIBusiness ManagerReinforced Iron Workers Local 405
Tamarisk L. JONESDirector of Health and Senior ServicesGloucester County
Richard SWEENEYFinancial Secretary, Business RepresentativeIronworkers #399
Ricardo V. TAYLOR, JR.School AdministratorPennsauken Township
NEW JERSEY
6
INTRODUCTORY SECTION
DRPA 2012 ANNUAL REPORT
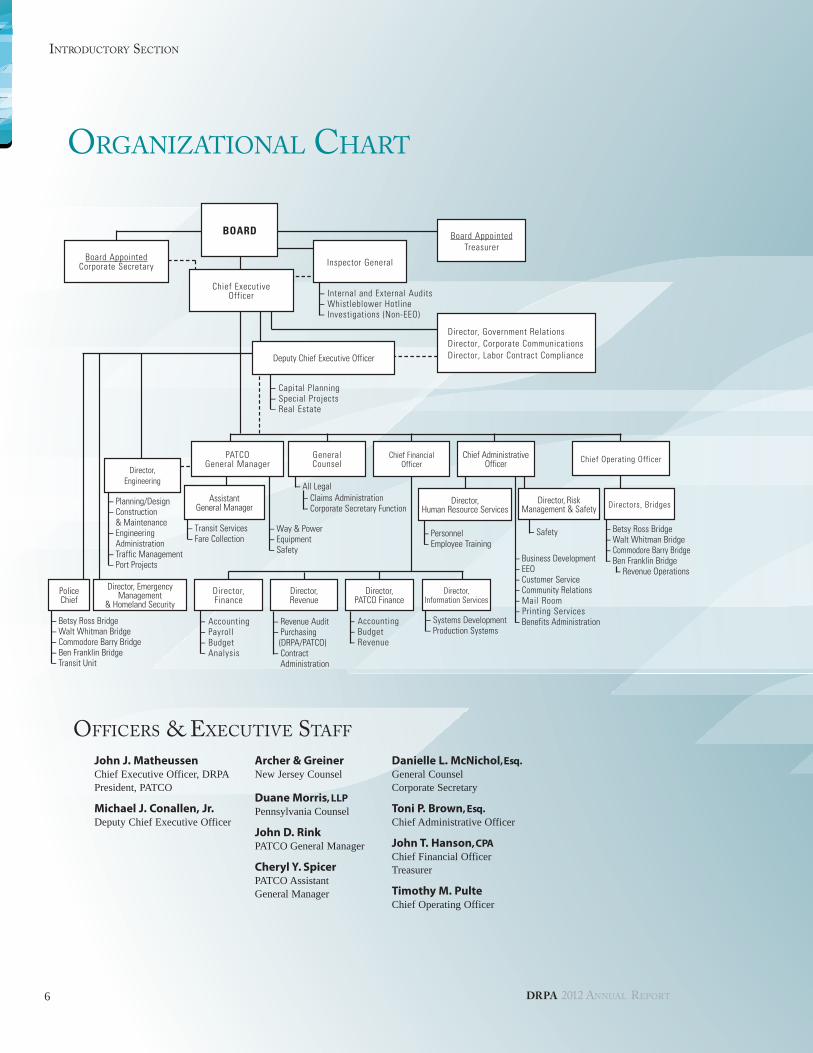
ORGANIZATIONAL CHART
John J. MatheussenChief Executive Officer, DRPAPresident, PATCO
Michael J. Conallen, Jr.Deputy Chief Executive Officer
Archer & GreinerNew Jersey Counsel
Duane Morris, LLPPennsylvania Counsel
John D. RinkPATCO General Manager
Cheryl Y. SpicerPATCO Assistant General Manager
Danielle L. McNichol, Esq.General Counsel Corporate Secretary
Toni P. Brown, Esq.Chief Administrative Officer
John T. Hanson, CPAChief Financial OfficerTreasurer
Timothy M. PulteChief Operating Officer
OFFICERS & EXECUTIVE STAFF
– Betsy Ross Bridge– Walt Whitman Bridge– Commodore Barry Bridge– Ben Franklin Bridge– Transit Unit
– Internal and External Audits– Whistleblower Hotline– Investigations (Non-EEO)
– Capital Planning– Special Projects– Real Estate
– Safety
– Planning/Design– Construction
& Maintenance– Engineering
Administration– Traffic Management– Port Projects
– Way & Power– Equipment– Safety
– All Legal
BOARD
Chief ExecutiveOfficer
General Counsel Chief Operating Officer
Director, Government Relations Director, Corporate Communications Director, Labor Contract ComplianceDeputy Chief Executive Officer
– Accounting– Budget– Revenue
– Revenue Audit– Purchasing (DRPA/PATCO)– Contract Administration
– Accounting– Payroll– Budget– Analysis
Director, Finance
Director, Revenue
Director, PATCO Finance
– Systems Development– Production Systems
Director, Information Services
Assistant General Manager
– Transit Services– Fare Collection
– Business Development– EEO– Customer Service– Community Relations– Mail Room– Printing Services– Benefits Administration
Chief Administrative Officer
Director, Human Resource Services
– Personnel– Employee Training
Director, Engineering
Director, Risk Management & Safety
Police Chief
Director, Emergency Management
& Homeland Security
PATCOGeneral Manager
– Betsy Ross Bridge– Walt Whitman Bridge– Commodore Barry Bridge– Ben Franklin Bridge – Revenue Operations
Directors, Bridges
Chief FinancialOfficer
Board AppointedTreasurer
– Claims Administration– Corporate Secretary Function
Inspector GeneralBoard AppointedCorporate Secretary
7DRPA 2012 ANNUAL REPORT
INTRODUCTORY SECTION
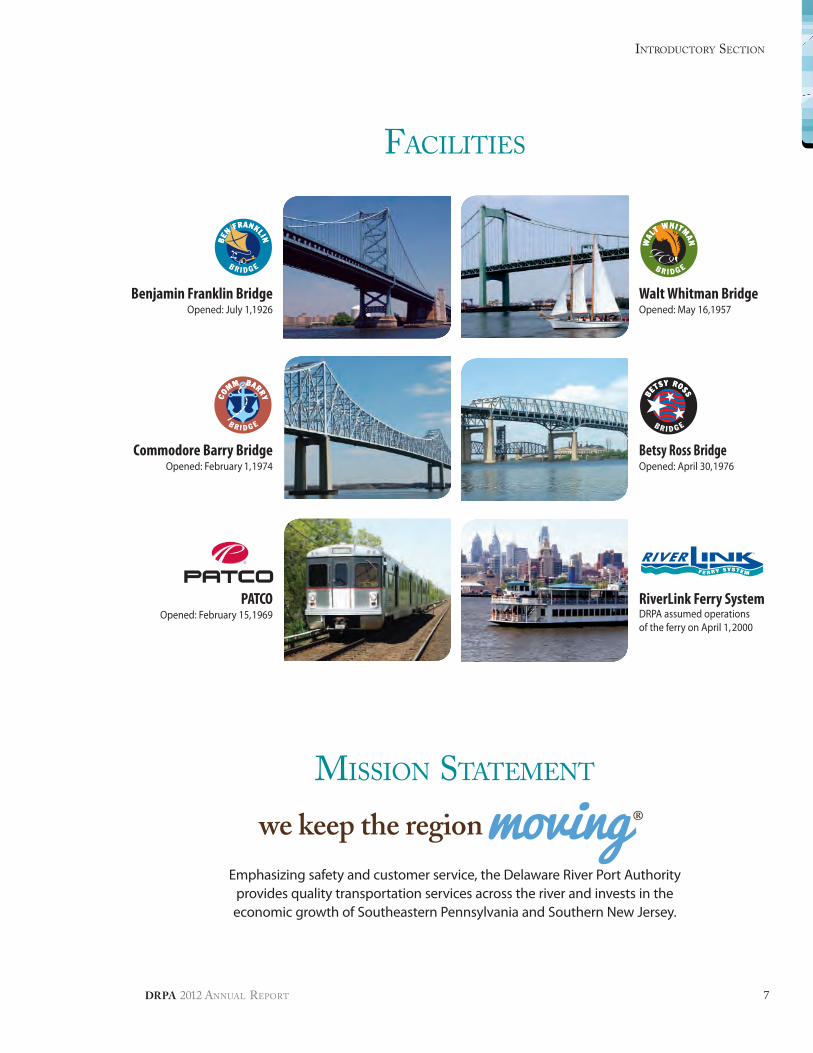
Emphasizing safety and customer service, the Delaware River Port Authority provides quality transportation services across the river and invests in the economic growth of Southeastern Pennsylvania and Southern New Jersey.
MISSION STATEMENT
FACILITIES
Benjamin Franklin BridgeOpened: July 1,1926
Walt Whitman BridgeOpened: May 16, 1957
Commodore Barry BridgeOpened: February 1, 1974
Betsy Ross BridgeOpened: April 30, 1976
PATCOOpened: February 15, 1969
RiverLink Ferry SystemDRPA assumed operations of the ferry on April 1, 2000
movingwe keep the region ®

8
INTRODUCTORY SECTION
DRPA 2012 ANNUAL REPORT
9DRPA 2012 ANNUAL REPORT
INTRODUCTORY SECTION
REPORT OF THECHIEF EXECUTIVE OFFICER
JOHN J. MATHEUSSENChief Executive Officer, DRPAPresident of PATCO
In December 2011, the Board of Commissioners approved the DRPA’s last economic development allocations. No longer would we fund new capital projects not owned and directly controlled by the DRPA.
We rededicated ourselves in 2012 to our core mission: Providing safe, secure, affordable transportation between Southern New Jersey and the five-county Philadelphia metropolitan area. We also reinforced our business fundamentals by embarking on a multi-year, comprehensive financial plan to reduce both long-term debt and debt carrying costs.
In April, we redeemed almost $96 million in debt securitized as DRPA Revenue Bonds and higher interest Port District Project Bonds. The redemption reduced DRPA debt service by about $2.5 million per month and lowered the authority’s aggregate debt and borrowing costs without compromising liquidity.
In December, we sold $153 million in investment-grade, tax-exempt, refunding bonds and again used the proceeds to refund higher interest Port District Project Bonds. The transaction resulted in a net present value savings of nearly $37 million.
By the end of 2012, we had reduced DRPA aggregate debt by approximately $185 million (based on par value), leaving us with approximately $1.1 billion in total outstanding debt.
Wall Street noticed. In late November, two bond ratings agencies rewarded the DRPA for improved financial management. Standard & Poor’s revised its outlook for all outstanding DRPA bonds from “stable” to “positive.” Moody’s changed its outlook from “negative” to “stable.”
Our attention to fundamentals yielded other benefits as well. The new focus on proprietary assets, transportation and finance encouraged DRPA and PATCO management to pursue operating efficiencies aggressively and creatively.
In May, for example, the DRPA completed an electricity reverse auction estimated to save about $1.3 million annually. We also signed fee-based – rather than premium-based – health insurance contracts that are expected to save toll and fare payers about $490,000 per year.
In addition, an organization-wide Lean Six Sigma® initiative – supported enthusiastically by the Board of Commissioners and involving more than 100 employees –produced 12 completed projects that either established or streamlined business-critical processes in ways that should save thousands of dollars over the coming years.
10
INTRODUCTORY SECTION
DRPA 2012 ANNUAL REPORT
The projects included introduction of a monthly key-performance indicator (KPI) dashboard for commissioners and managers, a streamlined employee-training approval process, a standardized procedure for modifying IT infrastructure and a more effective process for planning capital projects.
Our use of management efficiencies to contain costs found its most significant expression in the $257.7 million DRPA/PATCO annual budget approved by the Board of Commissioners in December. Despite a nearly 70 percent jump in employee pension costs, the Finance Department and the board’s Finance Committee were able to reduce 2013 operating and debt-service spending projections by $17.3 million or 6.3 percent.
Finally, 2012 was the year we received findings from a comprehensive management audit mandated by the Board of Commissioners.
Conducted by CGR Management Consultants LLP of Los Angeles and overseen by the DRPA Office of the Inspector General, the audit assessed the effectiveness and efficiency of DRPA administrative, support, public safety and homeland security functions. The auditors applied the “yellow book” standards set by the U.S. General Accounting Office (GAO).
The auditors recommended ways in which the DRPA could improve internal communications, pay structure, management diagnostic processes, management controls, information technology infrastructure and occupational safety program management.
A newly established Strategic Planning Committee of the Board of Commissioners is studying the auditors’ recommendations and looking for ways to integrate them into DRPA operations.
We fully expect the Strategic Planning Committee to present us with a variety of challenges in 2013. Some of them will be difficult, as changes often are.
We are committed, however, to continuous improvement, and we believe that our bridge,
rail and ferry customers will appreciate our critical introspection and hard work.
Activities and accomplishments over last year included the following:
• Carried an estimated 96.2 million vehicles across the Betsy Ross, Benjamin Franklin, Walt Whitman and Commodore Barry bridges.
• Transported more than 10.6 million passengers aboard the PATCO commuter rail line.
• Conveyed 145,395 passengers across the Delaware River aboard the seasonal RiverLink Ferry.
Bridges, Finance and Administration• The Finance Department prepared and the
Board of Commissioners approved a $257.7 million DRPA/PATCO annual budget for 2013. Despite a nearly 70 percent jump in employee pension costs, staff and the board reduced projected 2013 operating and debt service expenditures by $17.3 million or 6.3 percent.
• Created the Office of the Inspector General to investigate potential waste, fraud and abuse and hired FBI veteran Thomas W. Raftery III to fill the newly created position of inspector general. The IG issued his first report in June.
• Established the Strategic Planning and Labor committees of the DRPA Board of Commissioners.
• Completed the first five phases of a seven-phase, three-year $140 million project to remove and replace the Walt Whitman Bridge road deck.
• Commissioned biennial inspections at all four bridges and PATCO.
• Made substantive structural improvements on the Benjamin Franklin Bridge and built a new salt storage building at the bridge maintenance complex.
11DRPA 2012 ANNUAL REPORT
INTRODUCTORY SECTION
• Deployed DRPA personnel to design and complete a series of in-house capital projects, including a bridge ladder safety system at the Ben Franklin Bridge, an automatic security gate at the Ben Franklin Bridge maintenance building, a reconfigured conduit at a Walt Whitman Bridge access ramp in Pennsylvania, rehabilitation of the Walt Whitman Bridge foreman office and chiller replacements at the Commodore Barry Bridge administration building.
• Conducted the DRPA’s first reverse auction for electricity in May. The auction resulted in contracts with four energy suppliers: South Jersey Energy of Folsom, N.J.; Integrys Energy Group of Chicago; the Hess Corporation of New York; and Reliant Energy of Houston.
• Weathered Sandy relatively unscathed. Total storm damage to all DRPA facilities amounted to about $80,000, which was partly offset by about $60,000 in federal disaster relief. Although the bridges and PATCO were closed on Oct. 29 at the height of the storm, all of our facilities were open for business the following day.
• Evaluated and integrated many recommendations made by the New Jersey Office of the State Comptroller in an audit report released in March.
• Held a series of site-specific safety fairs and published a safety edition of the employee/retiree newsletter “The Bridge” during National Safety Month in June.
• Worked with the City of Philadelphia on a proposed extension of Delaware Avenue under the Betsy Ross Bridge. The city agreed to take possession of the DRPA-owned portion of Hedley Street during the second phase of the Delaware Avenue extension project.
• Worked with the City of Philadelphia on the street dedications and vacations necessary to advance redevelopment of the Pincus Brothers site near the Benjamin Franklin Bridge approach.
• Completed miscellaneous structural work at the Commodore Barry Bridge: Concrete spall repairs, walkway railing modifications, application of corrosion inhibitor, bridge deck line painting, bearing repairs, gusset plate repairs and girder span/truss span replacements.
• Started designing a new bicycle/pedestrian ramp slated for construction on the south side of the Benjamin Franklin Bridge landing in Camden.
• Participated in state and national highway safety campaigns, including Click It or Ticket, Drive Sober or Get Pulled Over and Put the Brakes on Fatalities.
• Hosted two mid-October health fairs, one for PATCO employees and the other for DRPA employees. Attendees were able to obtain flu shots, healthy cooking lessons, DermaScan screenings, biometric screenings and benefit information from DRPA/PATCO health care and wellness providers. About 180 employees attended the fairs.
• Staff prepared and the Board of Commissioners passed the last resolutions associated with a series of management reforms begun in 2010.
PATCO• Sold advertising space for the first time on
commuter fare tickets. The first customer, Rutgers University – Camden, purchased space on 200,000 paper tickets, the amount PATCO passengers typically consume during one month. The tickets began circulating in July, and the advertisements produced $5,000 to offset the high-speed line’s operating expenses.
• Successfully completed a PATCO “open fare” pilot project, in which passengers could use wave-and-pay, radio activated (RFID) MasterCard, Visa or American Express credit cards – or PATCO-branded, pre-loaded Visa debit cards – to pay rail fares at station turnstiles.
• Oversaw an ongoing, multi-year, $194 million project to rebuild PATCO’s 120 rail cars. Last year,
12
INTRODUCTORY SECTION
DRPA 2012 ANNUAL REPORT
the first 26 cars were shipped to the Alstom facility in Hornell, N.Y. The first completely rebuilt cars are scheduled to return to Lindenwold in 2013.
• Held an annual field disaster drill near Collingswood Station in November. More than 200 local emergency responders participated.
• After completing a popular pilot program, PATCO established the “Quiet Car” as a permanent feature on weekday rush-hour trains. Passengers on PATCO quiet cars are expected to limit cell phone use to silent texting and silent games, to keep conversations brief and whispered and to play music through headphones in a manner that cannot be heard by other passengers.
• Hosted the start and finish of the 32nd Annual Bike MS event at the end of September. PATCO has served as host for the past 23 years.
• Hosted the holiday-themed “Santa Train” in early December.
Law Enforcement• Protected life, property and public assets on four
Delaware River toll bridges, along the 13-station PATCO high-speed line, on other DPRA/PATCO property, on the Pennsylvania and New Jersey highways leading to the bridges, in municipalities located at the bridge landings (including Philadelphia, Chester, Pa. and Camden, N.J.) and in the Delaware River waterway itself.
• Supervised bridge and rail emergency operations during October’s Hurricane Sandy.
• Joined law enforcement professionals from across the United States in the Click it or Ticket seat belt awareness campaign for two weeks beginning on May 21. DRPA police stepped up enforcement of New Jersey’s primary seat belt law and educated motorists about the importance of buckling up in moving vehicles.
• Conferred the DRPA’s Second Annual Christopher Milito Awards on 25 police officers and
public safety support staff for heroism and meritorious service. The annual awards honor a DRPA corporal who died in the line of duty in January 2010.
• Supported the successful passage of New Jersey legislation that enables DRPA police to enforce hazardous material transportation laws in New Jersey. Before the law passed, police from the DRPA Commercial Vehicle Unit already had been trained in hazmat carrier enforcement and were enforcing similar laws in Pennsylvania.
• Joined Put the Brakes on Fatalities Day, a national effort to promote safe driving and keep Pennsylvania and New Jersey roadways free of fatalities for one day, Wednesday, October 10. Bridge operations programmed variable message signs at the Benjamin Franklin, Walt Whitman, Commodore Barry and Betsy Ross bridges with the reminder, “Oct. 10: Be Safe, Be Alert, Arrive Home Alive.”
• Hosted the Police Unity Tour’s bicycle ride across the Commodore Barry Bridge in May. Tour cyclists, who represent law enforcement agencies from across the United States, pedal to Washington, D.C. to raise money for the National Law Enforcement Officers Memorial and Museum and raise awareness of police officers who have fallen in the line of duty.
• Participated state and local driver safety and sobriety enforcement campaigns.
Signifi cant Changes in Management and Corporate Governance Personnel
Pennsylvania Gov. Tom Corbett announced in August that he would be stepping down as chairman of the Delaware River Port Authority Board of Commissioners. Gov. Corbett appointed himself to the board and was subsequently elected chairman in March 2011.
During his tenure, the DRPA ended a costly, controversial economic development program,
13DRPA 2012 ANNUAL REPORT
INTRODUCTORY SECTION
reduced aggregate debt, moved forward on bridge and rail capital projects, decreased the authority’s debt service, increased its operational liquidity, created the DRPA Office of the Inspector General, completed its first reverse auction for electricity and kept spending in check by submitting nearly flat annual operating budgets for two years in a row.
The governor named Commissioner David F. Simon of Gwynedd Valley, Pa. to replace him as chairman. Gov. Corbett also announced that Andrew J. Reilly of Middletown Township, Pa. would be filling the vacancy created by the governor’s resignation from the board.
Robert P. Gross, who served since April 2003 as deputy CEO, retired in January and was replaced by Michael J. Conallen Jr. of Yardley, Pa. That same month, the DRPA appointed Thomas W. Raftery III of Ocean City, N.J. as its first inspector general.
In April, Richard Brown announced his retirement as corporate secretary and general counsel after 22 years of service. He was replaced by Danielle Peyakovich McNichol of Glen Mills, Pa.
DRPA Police Chief David J. McClintock retired in May after 36 years of service.
Awards and Recognition The DRPA was honored on May 31 as a
Philadelphia Business Journal Healthiest Employer. The award recognizes the excellence of DRPA Administration Department health and wellness programs.
The Camden County Hero Scholarship Fund honored nine Delaware River Port Authority police officers on for valor in the line of duty during two separate emergencies in 2011. In both cases, DRPA officers rescued people imperiled by fire. Five of the officers escorted passengers from a smoke-filled rail car. Four others saved a girl trapped in a burning automobile.
The officers – Sgt. Christopher Bell, Acting Cpl. Tim Hoagland, Officer J.T. Hogan, Officer Larry Goodwin, Officer Matthew Murray, Officer Hugh McIntyre, Officer Robert Crean, Officer Joseph Graziano and Officer Sean Longfellow – accepted their awards on Feb. 24 during the 46th Annual Hero Scholarship Fund Dinner in Berlin, N.J.
Sgt. Bell, Acting Corporal Hoagland, and Officer Goodwin were later honored with Heroism Awards from the Citizens Crime Commission for risking their lives to rescue the victim of an automobile fire.
Jack Costello of the Purchasing Department penned the winning entry – “Safety is the Key to Accident Free” – in the 2012 DRPA Safety Slogan Contest. The winner was one of 31 submissions evaluated by the DRPA Central Safety & Health Committee. Jack’s safety slogans have won twice before.
Acting DRPA Police Sergeant Steven Hogan received the Corporal Christopher Milito Police Officer of the Year award for his leadership, work ethic and consistently superior professional performance.
For the 20th consecutive year, the DRPA annual report team – led by Chief Financial Officer John Hanson and supported by personnel from Finance, Corporate Communications and the Print Shop – earned the Certificate of Achievement for Excellence in Financial Reporting from the Government Finance Officers Association of the United States and Canada (GFOA). The award recognizes the DRPA’s Comprehensive Annual Financial Report for Year Ended December 31, 2011.
Citizens Advisory Committee (CAC)The DRPA CAC began its second full year of
operation. Established in a 2010, the CAC works in cooperation with the DRPA but is an independent, advisory body. It comprises 24 members – 12 each from Pennsylvania and New Jersey – who proportionately represent DRPA toll-payers and PATCO passengers.
14
INTRODUCTORY SECTION
DRPA 2012 ANNUAL REPORT
Community EngagementManagement and the Board of Commissioners
make DRPA and PATCO facilities available at little or no charge to qualified non-profit organizations whose representatives apply in advance for permission to use them.
Last year, our facilities hosted a series of events that benefitted the March of Dimes, regional multiple sclerosis organizations, a southern New Jersey school for children with disabilities and various police and firefighter charities.
At the request of civic leaders and non-profit representatives, the DRPA also lights the Benjamin Franklin Bridge in colors that commemorate non-profit fundraising drives, holidays, regional milestones and significant events of interest to our stakeholders in Southern New Jersey and the Philadelphia metropolitan area.
In addition, our employees raised money for the United Way, as well as for charities that fight breast cancer and heart disease.
2013 Work AgendaFinance
• The DRPA and PATCO will continue to manage costs in ways that keep operating expenses below budget limits and that preserve the current toll and fare structures for as long as possible.
• The DRPA will continue to pursue finance strategies that minimize debt costs, take advantage of historically low interest rates, preserve operating liquidity and maximize the value of DRPA debt instruments for owners and potential buyers.
• The DRPA and PATCO will continue to incorporate management efficiencies identified in completed Lean Six Sigma projects.
Bridges and Administration• The DRPA will continue the $140 million Walt
Whitman Bridge deck rehabilitation project, which includes the design, construction, and construction inspection efforts associated with removing existing suspension span deck and installation of a new deck. The work also will include replacing the existing reinforced concrete deck covering the Philadelphia and Gloucester City, N.J. anchorages. Construction began in 2010 and is expected to be completed during the second quarter of 2014.
• The DRPA is scheduled to begin a two-year, $15.5 million project to resurface the Betsy Ross Bridge. Work will include milling, waterproofing and repaving, removal of unsound concrete, repairing spalls in the concrete deck, improving highway safety, improving bridge drainage and repairing headers at expansion joints.
• The DRPA will install security cameras at the Walt Whitman and Betsy Ross bridges at a cost of approximately $1.5 million.
• The DRPA will continue the design phase of a $3.5 million project to build a bike and pedestrian access ramp on the south walkway of the Benjamin Franklin Bridge. The project is slated for completion in 2015.
• The DRPA will begin design and conceptual work in preparation for a $71 million project to paint the Walt Whitman Bridge and an $87 million project to paint Commodore Barry Bridge. Painting at both bridges is scheduled to be completed in 2017.
• The DRPA will begin a two-year, $5.1 million investigation of the main suspension cables on the Benjamin Franklin Bridge. The project includes the design of a dehumidification system for the main cables to improve corrosion protection.
15DRPA 2012 ANNUAL REPORT
INTRODUCTORY SECTION
• The DRPA will begin a $2 million project – slated for completion in 2014 – to renovate the toll booths and other toll island infrastructure at the Walt Whitman Bridge.
• The DRPA will begin work on a $3.2 million anchorage dehumidification project at the Walt Whitman Bridge.
PATCO• PATCO will continue its $194 million rail car
overhaul program. Pilot cars are scheduled for delivery to Lindenwold by the third quarter of 2013. All 120 cars are scheduled to be completed by the fourth quarter of 2016.
• PATCO and the DRPA are scheduled to begin a $102 million project to rehabilitate the north and south passenger rail tracks crossing the Delaware River on the Benjamin Franklin Bridge. Plans call for the replacement of wood ties, running rails, electrical cabling and information/switching systems and supporting steel trusses by the end of 2015.
• PATCO will complete an approximately $30 million power cable and pole line replacement project in the third quarter of 2013.
• PATCO will repave parking lots at the Ferry Avenue and Collingswood stations. The $2.6 million project should be completed by the fall of 2013.
• PATCO will complete a $5.5 million project to install elevators at the 9/10th and Locust Street and Ferry Avenue stations. The project is part of an approximately $22 million program to install elevators in all currently unequipped PATCO stations by 2017.
• PATCO will finish the $8.2 million construction of an annex to its Lindenwold machine shop. The new annex building will provide additional shop facilities for maintenance of rolling stock.
• PATCO is scheduled to complete a $4.8 million escalator replacement at the Woodcrest, 12th/13th and Locust Street and 15th/16th and Locust Street rail stations.
• PATCO will begin the $2.3 million second phase of a multi-year project to replace transformers at the Lindenwold, Ashland East, Collingswood and Ferry Avenue electrical substations.
• PATCO is scheduled to start and complete a $389,000 project to replace variable message signs on station platforms. The project also includes upgrades and replacements to station public address systems.
Vendor Diversity ProgramsSince 1994, the year the DRPA first implemented
non-discrimination programs, we have awarded more than $291 million to certified disadvantaged, minority and women-owned businesses.
We will continue to sponsor training and outreach programs and participate in business expos to encourage small and minority-owned businesses to compete for contracts with the DRPA and PATCO.
Community ActivitiesWe will continue to encourage our employees
to work on outreach projects as part of their everyday functions and to volunteer personal time to their communities.
Yours truly,
John J. MatheussenCEO, Delaware River Port AuthorityPresident, Port Authority Transit Corporation

16
INTRODUCTORY SECTION
DRPA 2012 ANNUAL REPORT
17DRPA is an equal opportunity employer
Mailing Address: PO Box 1949 Camden New Jersey 08101-1949 Telephone: (856) 968-2000
DELAWARE RIVER PORT AUTHORITY of Pennsylvania & New Jersey
TO THE BOARD OF COMMISSIONERSOF THE DELAWARE RIVER PORT AUTHORITY
The comprehensive annual financial report of the Delaware River Port Authority (“the Authority”) for the year ended December 31, 2012, is hereby submitted. Responsibility for both the accuracy of the data and the completeness and fairness of the presentation, including all disclosures, rests with the Authority. To the best of our knowledge and belief, the enclosed data is accurate in all material respects and is reported in a manner designed to present fairly the combined net position and results of operations of the Authority. All disclosures necessary to enable the reader to gain an understanding of the Authority’s financial activities have been included.
The Authority’s Indentures of Trust require an annual audit of the Authority’s financial statements by a firm of independent auditors. Additionally, as a recipient of funds from the Federal Transit Administration for projects involving the PATCO transit system, the Authority is required to have a single audit performed annually by an independent auditor in accordance with the Single Audit Act of 1984, as amended in 1996, and OMB Circular A-133. The purpose of the single audit is to determine the adequacy of the Authority’s internal controls and compliance with applicable laws and regulations relating to the receipt of federal assistance. The Authority retains an independent auditor to satisfy these audit requirements. The report of the independent auditor on the combined financial statements of the Authority is included in the financial section of this report. The Authority’s management is responsible for the content and presentation of the audited financial report.
Management of the Authority is responsible for establishing and maintaining a system of internal control designed to ensure that the assets of the Authority are protected from loss, theft or misuse and to ensure that adequate accounting data is compiled to allow for the preparation of financial statements in conformity with Generally Accepted Accounting Principles (GAAP) in the United States. The internal controls are designed to provide reasonable, but not absolute, assurance that these objectives are met. The concept of reasonable assurance recognizes that: (1) the cost of a control should not exceed the resulting benefits; and (2) the analysis of costs and benefits requires estimates and judgments by management.
In addition, as a recipient of federal financial assistance, the Authority is required to ensure that adequate internal controls are in place to ensure compliance with applicable laws and regulations relating to that federal assistance. These internal controls are subject to periodic evaluation by the Office of the Inspector General and by the management of the Authority.
The combined financial statements of the Authority are prepared using the accrual method of accounting in accordance with GAAP. Management has provided a narrative introduction, overview, and analysis to accompany the basic financial statements in the Management’s Discussion and Analysis (MD&A). This letter of transmittal is designed to complement the MD&A and should be read in conjunction with it. The Delaware River Port Authority’s MD&A can be found immediately following the report of the independent auditors.
July 26, 2013
18
INTRODUCTORY SECTION
DRPA 2012 ANNUAL REPORT
PROFILE OF GOVERNMENTThe Delaware River Port Authority is a public
corporate instrumentality of the Commonwealth of Pennsylvania and the State of New Jersey created with the consent of Congress by compact legislation between the Commonwealth of Pennsylvania and the State of New Jersey. The Authority, which has no stockholders or equity holders and was created in 1952 as a successor to the Delaware River Joint Commission, which was created in 1931. The Authority is governed by a 16-member Board of Commissioners. The Governor of New Jersey appoints eight commissioners with the advice and consent of the Senate of New Jersey. The Governor of Pennsylvania appoints six commissioners, with the Auditor General and the State Treasurer of Pennsylvania serving as ex-officio commissioners for Pennsylvania. Commissioners serve five-year terms without compensation. The Board of Commissioners establishes policy and plans for the operations of the Authority. A Chief Executive Officer is appointed by the Board of Commissioners to implement policy and to manage the daily operations of the Authority.
The Board of Commissioners of the Delaware River Port Authority has five committees established under the authority of its Bylaws. They are: the Operations and Maintenance Committee, Projects Committee, Executive Committee, Finance Committee, and Export Development and International Trade Committee. These committees adhere to the rules and leadership structure outlined in Article IX of the DRPA Bylaws. These Committees act pursuant to the power vested under the bylaws.
The Board of Commissioners of the Delaware River Port Authority has also established, under the Authority of resolution DRPA-10-040, an Audit Committee that is chaired by the Auditor General of Pennsylvania. The Audit Committee is charged with overseeing an independent financial, forensic and performance audit. The Board of The Delaware River Port Authority also adopted an Audit Committee charter through resolution DRPA-10-141. This resolution specifies that the purpose of the Audit Committee is to assist the board in fulfilling its oversight responsibility relating to: (1) the Authority’s internal and external audit process, the financial reporting process, and the risk assessment and internal controls over financial reporting; (2) Compliance with
applicable laws, policies, and accounting and auditing standards, and (3) Communication between the Authority’s management, internal and external auditors, experts, other advisors, and the Board.
The Audit Committee adheres to the rules and leadership structure outlined in resolutions DRPA-10-040 and DRPA-10-141. The Audit Committee acts pursuant to the power vested under these two resolutions. It is not vested with any power under the bylaws.
The Authority is vested with the ownership, control, operation, and collection of tolls and revenues of certain bridges spanning the Delaware River; namely, the Benjamin Franklin, Walt Whitman, Commodore Barry and Betsy Ross bridges. The Authority has also constructed and owns a high-speed transit system which is operated by its wholly owned subsidiary, the Port Authority Transit Corporation (PATCO). The transit system operates between Philadelphia, Pennsylvania and Lindenwold, New Jersey. The Authority’s Office of the Chief Operating Officer manages the RiverLink Ferry System which runs daily between Penn’s Landing in Philadelphia and the Camden Waterfront.
BUDGET PROCESSThe Authority prepares both operating and capital
budgets annually. The annual operating budget is a financial planning tool for the associated fiscal year; it also sets the maximum spending limit for the Authority. Each of the Authority’s Chief Officers and staff contribute to the development of a preliminary operating budget based on the expected staffing and funding levels necessary to operate the Authority’s facilities in an efficient and safe manner. After individual departmental budgets are reviewed at budget hearings conducted by the Operating Budget Review Committee, (which consists of the Chief Executive Officer, Deputy Chief Executive Officer, Chief Financial Officer, Chief Operating Officer, General Counsel, the General Manager of PATCO and other senior staff ), a proposed operating budget is presented by the Chief Executive Officer to the Finance Committee and ultimately to the Board of Commissioners for its review and approval. Any subsequent addition of funds to the total operating budget requires the approval of the Board of Commissioners.
19DRPA 2012 ANNUAL REPORT
INTRODUCTORY SECTION
A five year capital budget is also prepared through a similar process and submitted to the Finance Committee, and subsequently to the Board of Commissioners for approval. The capital budget is a planning document identifying the Authority’s potential commitments. The approval of the capital budget does not in itself authorize any specific project. Specific approval by the Board of Commissioners is required before any capital project may commence. The foundation for the major capital budget projects (those projects greater than $200K) is the biennial inspection which inspects all four bridges and PATCO. This inspection is required by the 1998 Revenue Bond Indenture. Smaller capital projects are identified by various operating and administrative departments.
Expenditures are monitored continuously throughout the year by the Finance Division to ensure that each department is in compliance with the approved operating budget and the established Policies and By-Laws of the Authority.
A Master Plan, detailing Port District and economic development projects, is distributed to the States, county and municipal governments, commissions, public corporations and authorities, and the private sector, when prepared by the Authority. When updated, the Authority approves amendments to each Master Plan as necessary to facilitate the implementation of new projects within the Port District. Updates and amendments to the Master Plan are approved through the Board of Commissioners.
In accordance with the Authority’s governing Revenue and Port District Project Bond Indentures, the next year’s annual budget must be submitted to the respective Bond Trustees by December 31 of each year.
FACTORS AFFECTING FINANCIAL CONDITION
During the past several years, the Authority has taken significant strategic steps to strengthen its financial position through: cost-containment of personnel and non-personnel expenditures, increasing its liquidity through growth in its General Fund, and restructuring its debt and swap portfolios. The latter policy is primarily in response to: changing financial markets, the exercise of various swaptions, which were
issued in 2001, passage of a board resolution mandating the liquidation of the Authority’s swap portfolio in an orderly and strategic fashion, and the necessity of funding its roughly $837.9 million 2012 Five Year Capital Program.
DEBT MANAGEMENTIn February, the Authority’s Board approved a
comprehensive finance plan to use the Authority’s General Fund for the early redemption of up to $120 million of its fixed-rate debt, restructure its variable rate debt and reduce the costs of its underlying letters of credit (on its 2008 and 2010 Revenue Refunding Bonds), and to refund a large portion of its port district project bond debt. The Authority successfully took actions to pay down approximately $96 million in revenue bond and port district project bond debt in April 2012, substantially reducing its 2012 debt service and improving its debt coverage ratio on its senior debt.
During December, the Authority executed the second part of its finance plan by issuing $153 million in Port District Project Refunding Bonds, Series 2012, to refund and redeem all of the outstanding principal balance and interest accrued on the Authority’s outstanding Port District Project Bonds, Series B of 1998, Series B of 1999 and Series A of 2001. As a result of these actions, the par amount of the Authority’s Port District Bond debt decreased from approximately $315 million to approximately $187 million. As of year-end, the Authority’s subordinate PDP debt is approximately 16% of the outstanding debt during the year. (As noted in the “Subsequent Events” section of the notes to the financial statements, the Authority has successfully completed the Direct Pay Letter of Credit substitution on the 2010 Revenue Refunding Bonds and has completed the execution of amendments for its 2008 Revenue Refunding Bonds. The Authority will see savings in excess of $4 million annually as a result of the completion of this third phase of the plan.)
As a result of the early redemption and refunding of debt, the Authority’s total debt decreased by over $162 million, to total $1.17 billion at year-end.
20
INTRODUCTORY SECTION
DRPA 2012 ANNUAL REPORT
LOCAL ECONOMYFrom the latest data available, it appears that
population growth increased slightly in the Pennsylvania and New Jersey counties within the Port District since 2010. The unemployment rate in the both areas has decreased slightly since 2010. Additional information can be found in the Statistical Section of this report.
LONG-TERM FINANCIAL PLANNINGAn important component of the Authority’s
long-term financial plan is ensuring that it has sufficient revenue to meet its operating and capital requirements. With assistance from its Financial Advisors, the Authority uses a long-term forecasting model, which creates a multi-year forecast of its revenues and expenses. The model incorporates numerous independent variables (including operating revenue and expense estimates, debt service coverages and capacity, etc.) in order to determine the annual cash flow required to create sufficient bonding capacity to finance its five-year capital plan. The Authority is expecting to have a traffic engineering study completed in the third quarter of 2013, which will contain projections for a 10-year period. This traffic engineer’s report will be included in the Official Statement for the bond issue discussed below.
As mentioned in the “Budget Process” section of this document, each year, the Authority develops a five-year capital plan which details the anticipated capital expenditures during this five-year period. The 2013 Capital Plan, developed, during the year, and approved in December 2012, outlined numerous bridge, transit system, security and technology project expenditures approaching $746.0 million (net of federal funding), for the five-year period commencing in 2013. (In a resolution adopted in February 2013, the Authority’s Board authorized the issuance of up to $510 million in new revenue bonds). As of December 31, 2012, the Authority has funded approximately $33.8 million in capital expenditures from its General Fund which it expects to reimburse from its future anticipated revenue bond issuance.
BRIDGE TOLL AND PASSENGER FARE SCHEDULES
There have been no changes to the Authority’s bridge toll and passenger fare schedules since July 2011.
AWARDS AND ACCOMPLISHMENTSThe Government Finance Officers Association
of the United States and Canada (GFOA) awarded a Certificate of Achievement for Excellence in Financial Reporting to the Delaware River Port Authority for its comprehensive annual financial report for the fiscal year ended December 31, 2011. This was the twentieth consecutive year that the Authority has achieved this prestigious award. In order to be awarded a Certificate of Achievement, a government must publish an easily readable and efficiently organized comprehensive annual financial report. This report must satisfy both GAAP and applicable legal requirements and employ best practices identified by the GFOA.
A Certificate of Achievement is valid for a period of one year only. We believe our current comprehensive annual financial report continues to meet the Certificate of Achievement Program’s requirements and we are submitting it to GFOA to determine its eligibility for another certificate.
The preparation of this report would not have been possible without the dedication and efficiency of the entire staff of the Finance, Administrative Services and Government & Corporate Communications Departments. I would especially like to express my appreciation to the members of these Departments who contributed to the preparation of this report. Special thanks must also be given to the Chairman, Vice Chairman, Chief Executive Officer, Deputy Chief Executive Officer and the Finance and Audit Committees of the Board for maintaining the highest standards in the management of the Delaware River Port Authority’s finances. Special thanks also to the DRPA Inspector General Thomas W. Raftery III for his leadership in facilitating this financial audit.
Respectfully submitted,
John T. Hanson Chief Financial Officer

FinancialSection

23
McGladrey LLP
Member of the RSM International network of independent accounting, tax and consulting firms.
Independent Auditor's Report
To the Board of Commissioners Delaware River Port Authority
Report on the Financial Statements
We have audited the accompanying combined financial statements of Delaware River Port Authority and subsidiary, which comprise the combined statements of net position as of December 31, 2012 and 2011, and the related combined statements of revenues, expenses, and changes in net position and cash flows for the years then ended, and the related notes to the combined financial statements.
Management’s Responsibility for the Financial Statements
Management is responsible for the preparation and fair presentation of these combined financial statements in accordance with accounting principles generally accepted in the United States of America; this includes the design, implementation, and maintenance of internal control relevant to the preparation and fair presentation of combined financial statements that are free from material misstatement, whether due to fraud or error.
Auditor’s Responsibility
Our responsibility is to express an opinion on these combined financial statements based on our audits. We conducted our audits in accordance with auditing standards generally accepted in the United States of America. Those standards require that we plan and perform the audit to obtain reasonable assurance about whether the combined financial statements are free from material misstatement.
An audit involves performing procedures to obtain audit evidence about the amounts and disclosures in the combined financial statements. The procedures selected depend on the auditor’s judgment, including the assessment of the risks of material misstatement of the combined financial statements, whether due to fraud or error. In making those risk assessments, the auditor considers internal control relevant to the entity’s preparation and fair presentation of the combined financial statements in order to design audit procedures that are appropriate in the circumstances, but not for the purpose of expressing an opinion on the effectiveness of the entity’s internal control. Accordingly, we express no such opinion. An audit also includes evaluating the appropriateness of accounting policies used and the reasonableness of significant accounting estimates made by management, as well as evaluating the overall presentation of the combined financial statements.
We believe that the audit evidence we have obtained is sufficient and appropriate to provide a basis for our audit opinion.
Opinion
In our opinion, the combined financial statements referred to above present fairly, in all material respects, the net position of the Delaware River Port Authority and subsidiary as of December 31, 2012 and 2011, and the changes in net position and cash flows for the years then ended in accordance with accounting principles generally accepted in the United States of America.
24
Other Matters
Required Supplementary Information
Accounting principles generally accepted in the United States of America require that management’s discussion and analysis and the schedule of funding progress for health benefits be presented to supplement the combined financial statements. Such information, although not a part of the combined financial statements, is required by the Governmental Accounting Standards Board who considers it to be an essential part of financial reporting for placing the combined financial statements in an appropriate operational, economic, or historical context. We have applied certain limited procedures to the required supplementary information in accordance with auditing standards generally accepted in the United States of America, which consisted of inquiries of management about the methods of preparing the information and comparing the information for consistency with management’s responses to our inquiries, the combined financial statements, and other knowledge we obtained during our audit of the combined financial statements. We do not express an opinion or provide any assurance on the information because the limited procedures do not provide us with sufficient evidence to express an opinion or provide any assurance.
Other Information
Our audits were conducted for the purpose of forming an opinion on the combined financial statements as a whole. The supplemental schedules on pages 86 to 90 and the introductory and statistical sections are presented for purposes of additional analysis and are not a required part of the combined financial statements.
The supplemental schedules on pages 86 to 90 are the responsibility of management and were derived from and relates directly to the underlying accounting and other records used to prepare the combined financial statements. Such information has been subjected to the auditing procedures applied in the audit of the combined financial statements and certain additional procedures, including comparing and reconciling such information directly to the underlying accounting and other records used to prepare the combined financial statements or to the combined financial statements themselves, and other additional procedures in accordance with auditing standards generally accepted in the United States of America. In our opinion, the information is fairly stated, in all material respects, in relation to the combined financial statements as a whole.
The introductory and statistical sections have not been subjected to the auditing procedures applied in the audit of the combined financial statements, and accordingly, we do not express an opinion or provide any assurance on them.
Blue Bell, Pennsylvania July 26, 2013
25
FINANCIAL SECTION
DRPA 2012 ANNUAL REPORT
As management of the Delaware River Port Authority (the Authority), we offer readers of our fi nancial statements this narrative overview and analysis of the fi nancial activities of the Authority for the years ended December 31, 2012 and 2011. We encourage readers to consider the information presented here in conjunction with additional information that we have furnished in our letter of transmittal, which can be found on pages 17-20 of this report. All amounts, unless otherwise indicated, are expressed in thousands of dollars.
FINANCIAL HIGHLIGHTS (IN THOUSANDS)
• Operating revenues were $327,400 in 2012, an increase of $27,852 or 9.30% over 2011. The increase was primarily related to the increase in toll revenues.
• The $25,125 increase in toll revenues (up 9.39%) during the year was primarily attributable to the full year’s impact of the prior year’s toll increase, which was implemented on July 1, 2011. The average toll increased from $5.4638 in 2011 to $6.0901 in 2012.
• Bridge traffi c decreased by 0.9 million vehicles (down 1.86%) during the year 2012. Traffi c on the bridges was largely impacted by general economic conditions in the region and, to some degree, from the previous year’s toll increase.
• The Port Authority Transit Corporation (PATCO) is a wholly-owned subsidiary of the DelawareRiver Port Authority (DRPA) and is subsidized by the Delaware River Port Authority. Operating expenses exceeded operating revenues for PATCO by $14,264 in 2012 and by $19,069 in 2011. The operating loss decreased by $4,805 from 2012 to 2011.
• PATCO passenger fare revenues increased by 8.46%, primarily resultant from the impact of increased PATCO ridership of 107 thousand (up 1.02%), and the full year’s impact of the prior year’s 10% passenger fare increase (enacted on July 1, 2011), which resulted in an increase in the average fare/ride. Net fare revenues increased by $2.0 million.
• Total “non-restricted” investments decreased by $22,776, a decrease of 7.09%. General Fund investment balances decreased by $23,194 (down 7.50%) to total $285,880 at year end. The General Fund decrease resulted from early redemption, of approximately $96 million in fi xed-rate debt, and the funding of approximately $34 million in capital expenditures.
• Total “restricted investments for capital projects” (revenue bond project funds) dropped by $59.0 million, attributable to capital expenditure activity during 2012.
MANAGEMENT’S DISCUSSION & ANALYSIS(UNAUDITED)
26
FINANCIAL SECTION
DRPA 2012 ANNUAL REPORT
• Bridge and general administration expenses increased a combined $10,697 (or by 11.90%) vs. 2011 expenses. Total expenses and the net position included the impact of the Authority’s non-cash accrual of $1,635 in expenses related to GASB 45 (Other Post-Employment Benefi ts other than pensions).
• The Authority’s total debt decreased $162,326 or by 12.18% during the current year, a function of maturing revenue, revenue refunding and port district project bond debt on January 1st, 2012 ($45.2 million), the early redemption of almost $96 million in fi xed-rate debt, and a refunding of its Port District Project bonds (completed in late 2012).
• Economic development expenditures totaled $8,695 in 2012, an increase in such expenditures of $6,670 over 2011. The Authority’s economic development spending now refl ects only previously committed projects, as the Authority’s Board approved a discontinuation of any new economic development projects in 2010.
• The assets of the Authority exceeded its liabilities at the close of 2012 resulting in net position of $427,547. Net position increased by $86,266 during the year.
27
FINANCIAL SECTION
DRPA 2012 ANNUAL REPORT
Delaware River Port Authority’s Net Position
Current and other assets Capital assets Total assets Deferred outfl ows Long-term liabilities outstanding Other liabilities Total liabilities Net position: Net invested in capital assets Restricted Unrestricted (defi ciency) Total net position
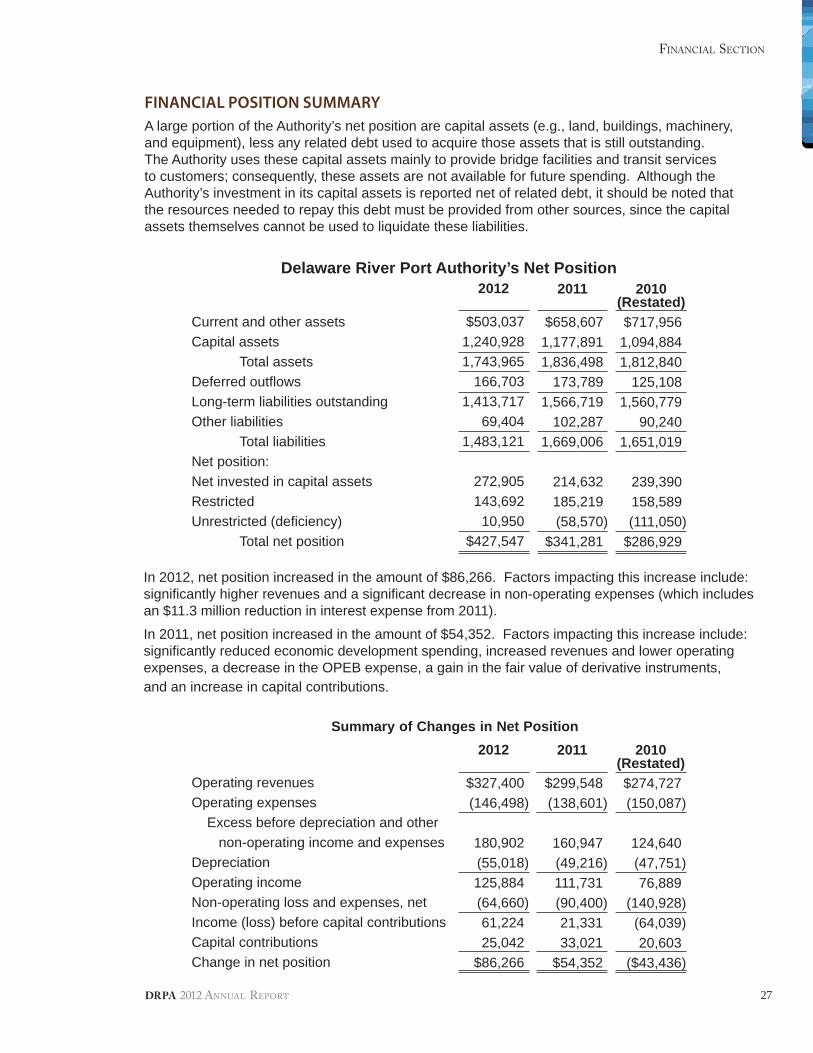
In 2012, net position increased in the amount of $86,266. Factors impacting this increase include: signifi cantly higher revenues and a signifi cant decrease in non-operating expenses (which includes an $11.3 million reduction in interest expense from 2011).
In 2011, net position increased in the amount of $54,352. Factors impacting this increase include: signifi cantly reduced economic development spending, increased revenues and lower operating expenses, a decrease in the OPEB expense, a gain in the fair value of derivative instruments, and an increase in capital contributions.
Summary of Changes in Net Position
Operating revenues Operating expenses Excess before depreciation and other non-operating income and expenses Depreciation Operating income Non-operating loss and expenses, net Income (loss) before capital contributions Capital contributions Change in net position
2012
$503,0371,240,9281,743,965
166,7031,413,717
69,4041,483,121
272,905143,692
10,950 $427,547
2012
$327,400(146,498)
180,902(55,018)125,884(64,660)61,22425,042
$86,266
2011
$658,6071,177,8911,836,498
173,7891,566,719
102,2871,669,006
214,632185,219(58,570)
$341,281
2011
$299,548(138,601)
160,947(49,216)111,731(90,400)21,33133,021
$54,352
2010(Restated)$717,956
1,094,8841,812,840
125,1081,560,779
90,2401,651,019
239,390158,589(111,050)
$286,929
2010(Restated)$274,727(150,087)
124,640(47,751)76,889
(140,928)(64,039)20,603
($43,436)
FINANCIAL POSITION SUMMARYA large portion of the Authority’s net position are capital assets (e.g., land, buildings, machinery, and equipment), less any related debt used to acquire those assets that is still outstanding. The Authority uses these capital assets mainly to provide bridge facilities and transit services to customers; consequently, these assets are not available for future spending. Although the Authority’s investment in its capital assets is reported net of related debt, it should be noted that the resources needed to repay this debt must be provided from other sources, since the capital assets themselves cannot be used to liquidate these liabilities.
28
FINANCIAL SECTION
DRPA 2012 ANNUAL REPORT
REVENUE SUMMARYSummary of revenues for the year ended December 31, 2012 and the amount and percentage change in relation to prior year amounts is as follows:
Operating: Bridge tolls PATCO passenger fares Other Cruise Terminal Total operating Non-Operating: Investment income Other Other grant revenues Capital contributions
Total Revenues (before change in fair value)Change in fair value of derivativesTOTAL REVENUES
2012Amount$292,810
26,0358,553
2327,400
5,80344
4,23225,042
$362,2511,835
$364,356
Percentof Total
80.77%7.18%2.36%0.00%
90.31%
1.60%0.00%1.17%6.92%
100.00%- -
Increase/(Decrease)From 2011
$25,1252,0311,131(435)
27,852
835(629)
1,850(7,979)
$21,929(6,830)
$15,099
PercentIncrease
(Decrease)9.39%8.46%
15.24%-99.54%
9.30%
16.81%-93.46%77.67%
-24.16%
6.44%-78.82%
4.32%
• Total revenues in 2012 increased by 4.32%, primarily due to the increase in total operating revenues. Total operating revenues in 2012 increased by 9.30%, primarily due to an increase in bridge toll and PATCO revenues.
• Bridge toll revenue increased by $25.1 million, or by 9.39%, despite an overall decrease in traffi c during 2012. (Bridge tolls accounted for almost 81% of total revenues.) Traffi c decreased by 1.86% but revenue increased $25,125 due to the full year’s impact of the new toll schedule implemented on July 1st, 2011.
• The year-to-year average toll rate increase (from $5.4638 to $6.0901) refl ects the higher toll schedule and a higher decrease in passenger vs. commercial vehicle traffi c.
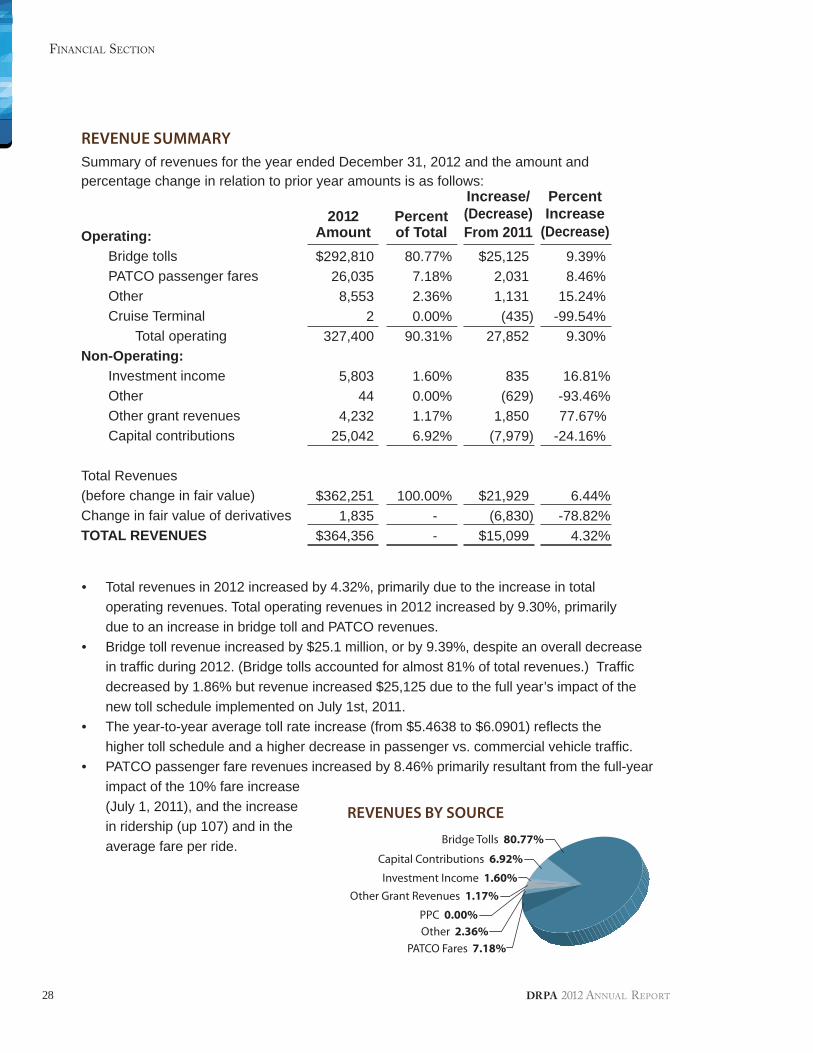
• PATCO passenger fare revenues increased by 8.46% primarily resultant from the full-year impact of the 10% fare increase (July 1, 2011), and the increase in ridership (up 107) and in the average fare per ride.
REVENUES BY SOURCE
Bridge Tolls 80.77%
PATCO Fares 7.18%Other 2.36%
Investment Income 1.60%
PPC 0.00%
Other Grant Revenues 1.17%
Capital Contributions 6.92%
29
FINANCIAL SECTION
DRPA 2012 ANNUAL REPORT
• Bridge and General Administration (G&A) expenses for DRPA operations increased by a combined $10,697 (or 11.90%) versus 2011. Major factors impacting the expenses include: increased healthcare expenses and employer pension contributions, biennial inspection costs and increased fees related to the E-ZPass operation.
• PATCO expenses decreased by $2,634 or (5.87%), primarily attributable to lower purchased power costs and a decrease in self-insurance reserve expenses.
• Total operating expenses increased by $13,699 or 7.29%, attributable to the increases in Bridge and General Administration (as cited above), and depreciation expenses.
• Depreciation expenses increased by $5,802 up 11.79% during the year. This increase was attributable to a $28,504 net increase in total capital assets being depreciated in 2012 (Note 7).
• Economic development expenditures totaled $8,695 in 2012, an increase of $6,670 from expenditures in 2011. The increase refl ects the Authority’s funding of previously authorized projects committed to prior to the Authority’s discontinuation of any new economic development projects in 2010.
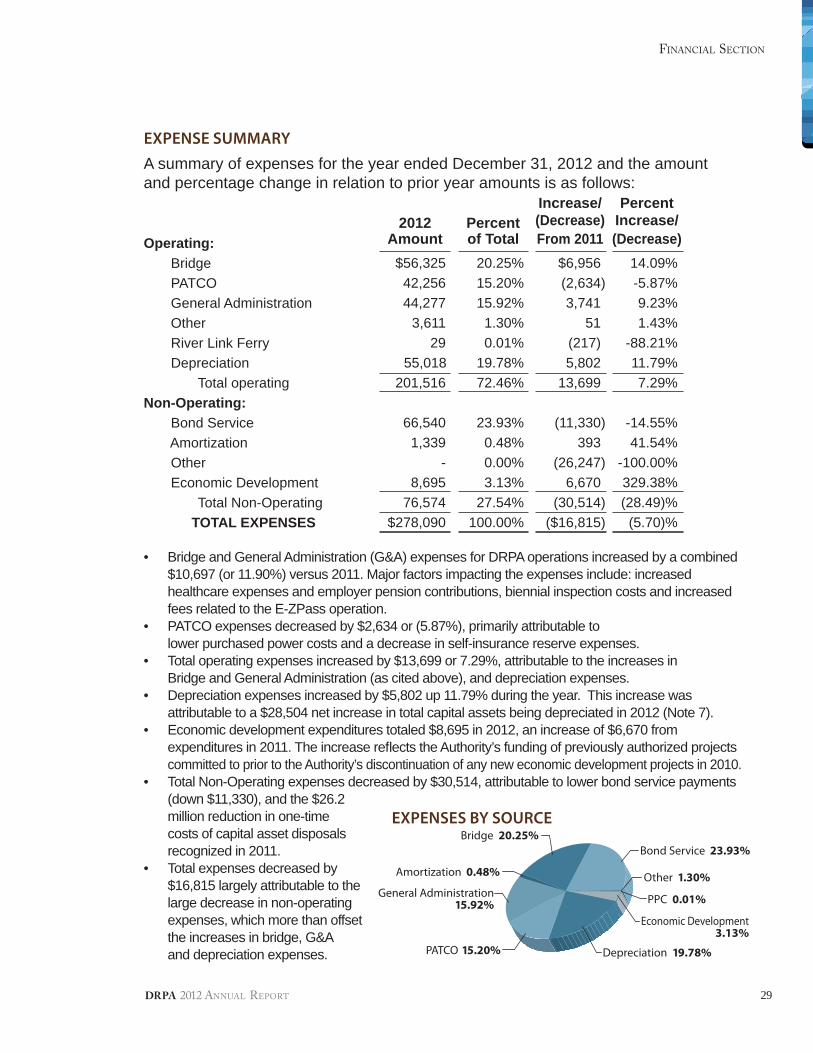
• Total Non-Operating expenses decreased by $30,514, attributable to lower bond service payments (down $11,330), and the $26.2 million reduction in one-time costs of capital asset disposals recognized in 2011.
• Total expenses decreased by $16,815 largely attributable to the large decrease in non-operating expenses, which more than offset the increases in bridge, G&A and depreciation expenses.
EXPENSE SUMMARYA summary of expenses for the year ended December 31, 2012 and the amount and percentage change in relation to prior year amounts is as follows:
Operating: Bridge PATCO General Administration Other River Link Ferry Depreciation Total operating Non-Operating: Bond Service Amortization Other Economic Development Total Non-Operating TOTAL EXPENSES
2012Amount
$56,32542,25644,277
3,61129
55,018201,516
66,5401,339
-8,695
76,574$278,090
Percentof Total
20.25%15.20%15.92%
1.30%0.01%
19.78%72.46%
23.93%0.48%0.00%3.13%
27.54%100.00%
Increase/(Decrease)From 2011
$6,956(2,634)3,741
51(217)5,802
13,699
(11,330)393
(26,247)6,670
(30,514)($16,815)
PercentIncrease/(Decrease)
14.09%-5.87%9.23%1.43%
-88.21%11.79%7.29%
-14.55%41.54%
-100.00% 329.38%(28.49)%
(5.70)%
EXPENSES BY SOURCE
Bond Service 23.93%
Depreciation 19.78%
Economic Development 3.13%
Amortization 0.48%
PPC 0.01%
Other 1.30%
PATCO 15.20%
General Administration 15.92%
Bridge 20.25%
30
FINANCIAL SECTION
DRPA 2012 ANNUAL REPORT
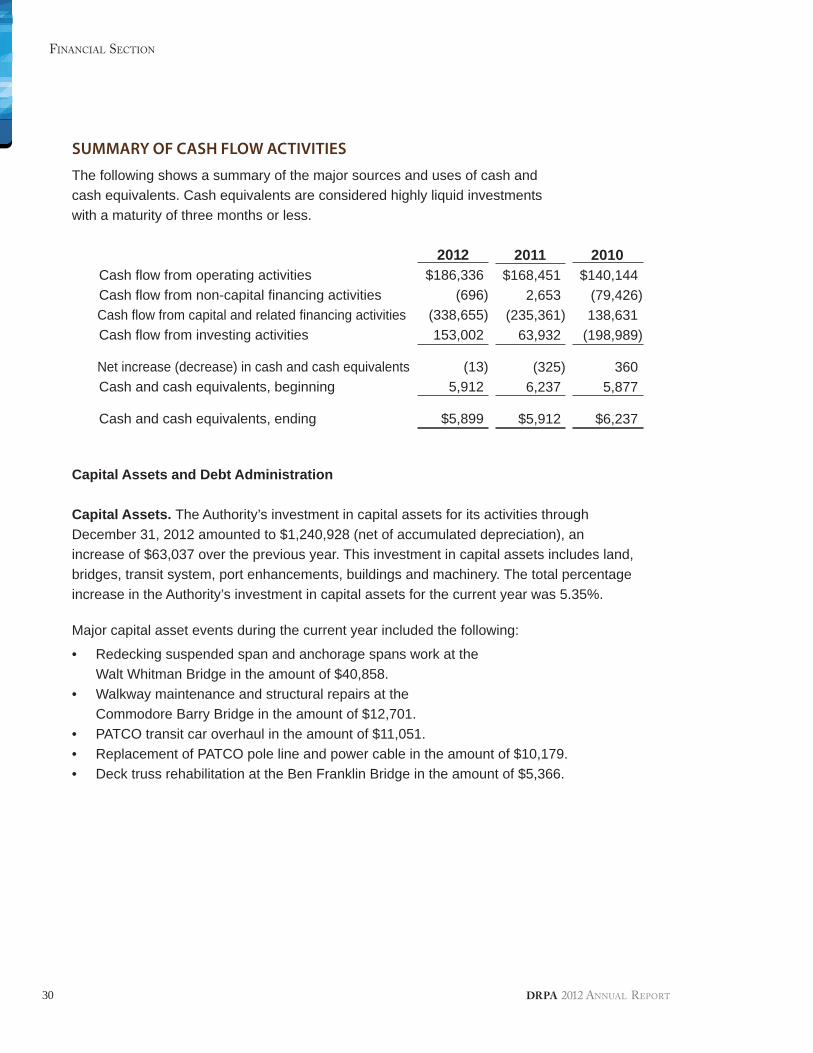
SUMMARY OF CASH FLOW ACTIVITIES
The following shows a summary of the major sources and uses of cash and cash equivalents. Cash equivalents are considered highly liquid investments with a maturity of three months or less.
Cash fl ow from operating activities Cash fl ow from non-capital fi nancing activities Cash fl ow from capital and related fi nancing activities Cash fl ow from investing activities Net increase (decrease) in cash and cash equivalents Cash and cash equivalents, beginning
Cash and cash equivalents, ending
Capital Assets and Debt Administration
Capital Assets. The Authority’s investment in capital assets for its activities through December 31, 2012 amounted to $1,240,928 (net of accumulated depreciation), an increase of $63,037 over the previous year. This investment in capital assets includes land, bridges, transit system, port enhancements, buildings and machinery. The total percentage increase in the Authority’s investment in capital assets for the current year was 5.35%.
Major capital asset events during the current year included the following:
• Redecking suspended span and anchorage spans work at the Walt Whitman Bridge in the amount of $40,858.
• Walkway maintenance and structural repairs at the Commodore Barry Bridge in the amount of $12,701.
• PATCO transit car overhaul in the amount of $11,051.• Replacement of PATCO pole line and power cable in the amount of $10,179.• Deck truss rehabilitation at the Ben Franklin Bridge in the amount of $5,366.
2012$186,336
(696)(338,655)153,002
(13)5,912
$5,899
2011$168,451
2,653(235,361)
63,932
(325)6,237
$5,912
2010$140,144
(79,426)138,631
(198,989)
3605,877
$6,237
31
FINANCIAL SECTION
DRPA 2012 ANNUAL REPORT
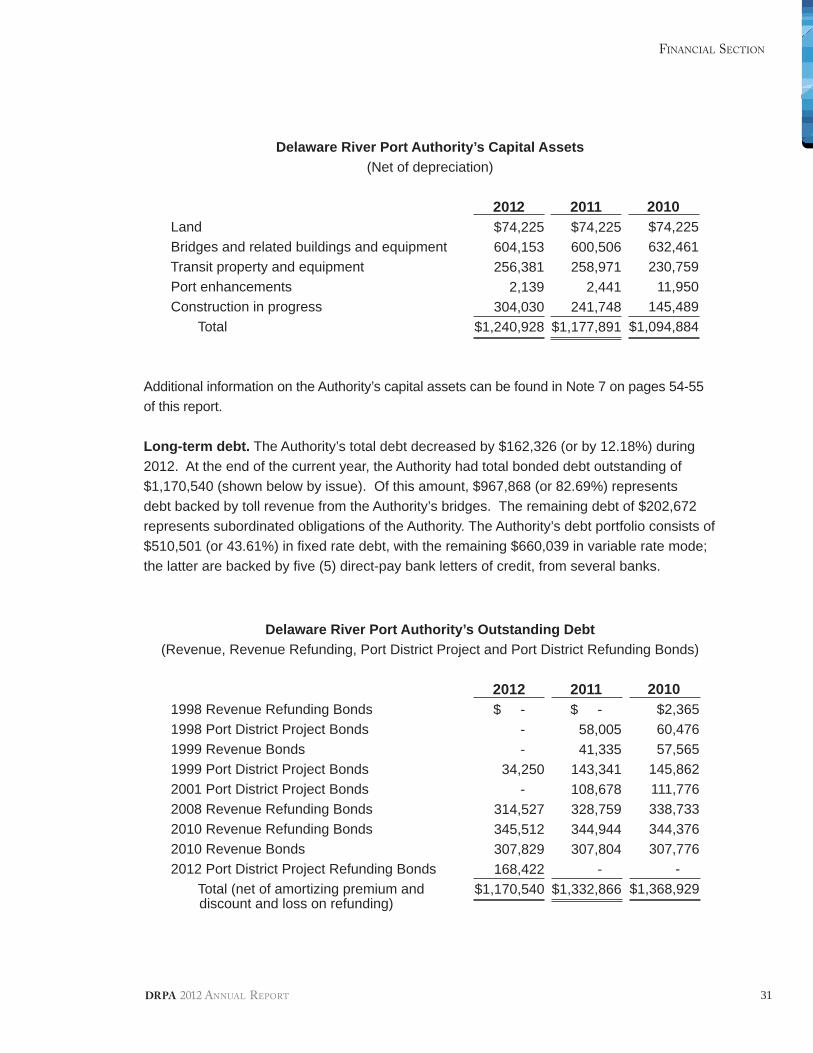
Delaware River Port Authority’s Capital Assets(Net of depreciation)
Land Bridges and related buildings and equipment Transit property and equipment Port enhancements Construction in progress Total
Additional information on the Authority’s capital assets can be found in Note 7 on pages 54-55 of this report.
Long-term debt. The Authority’s total debt decreased by $162,326 (or by 12.18%) during 2012. At the end of the current year, the Authority had total bonded debt outstanding of $1,170,540 (shown below by issue). Of this amount, $967,868 (or 82.69%) represents debt backed by toll revenue from the Authority’s bridges. The remaining debt of $202,672 represents subordinated obligations of the Authority. The Authority’s debt portfolio consists of $510,501 (or 43.61%) in fi xed rate debt, with the remaining $660,039 in variable rate mode; the latter are backed by fi ve (5) direct-pay bank letters of credit, from several banks.
2010$74,225632,461230,759
11,950145,489
$1,094,884
2012$74,225604,153256,381
2,139304,030
$1,240,928
2011$74,225600,506258,971
2,441241,748
$1,177,891
Delaware River Port Authority’s Outstanding Debt(Revenue, Revenue Refunding, Port District Project and Port District Refunding Bonds)
1998 Revenue Refunding Bonds 1998 Port District Project Bonds 1999 Revenue Bonds 1999 Port District Project Bonds 2001 Port District Project Bonds 2008 Revenue Refunding Bonds 2010 Revenue Refunding Bonds 2010 Revenue Bonds 2012 Port District Project Refunding Bonds Total (net of amortizing premium and discount and loss on refunding)
2010$2,36560,47657,565
145,862111,776338,733344,376307,776
- $1,368,929
2012$ -
- - 34,250 -
314,527345,512307,829168,422
$1,170,540
2011$ -
58,00541,335
143,341108,678328,759344,944307,804
- $1,332,866
32
FINANCIAL SECTION
DRPA 2012 ANNUAL REPORT
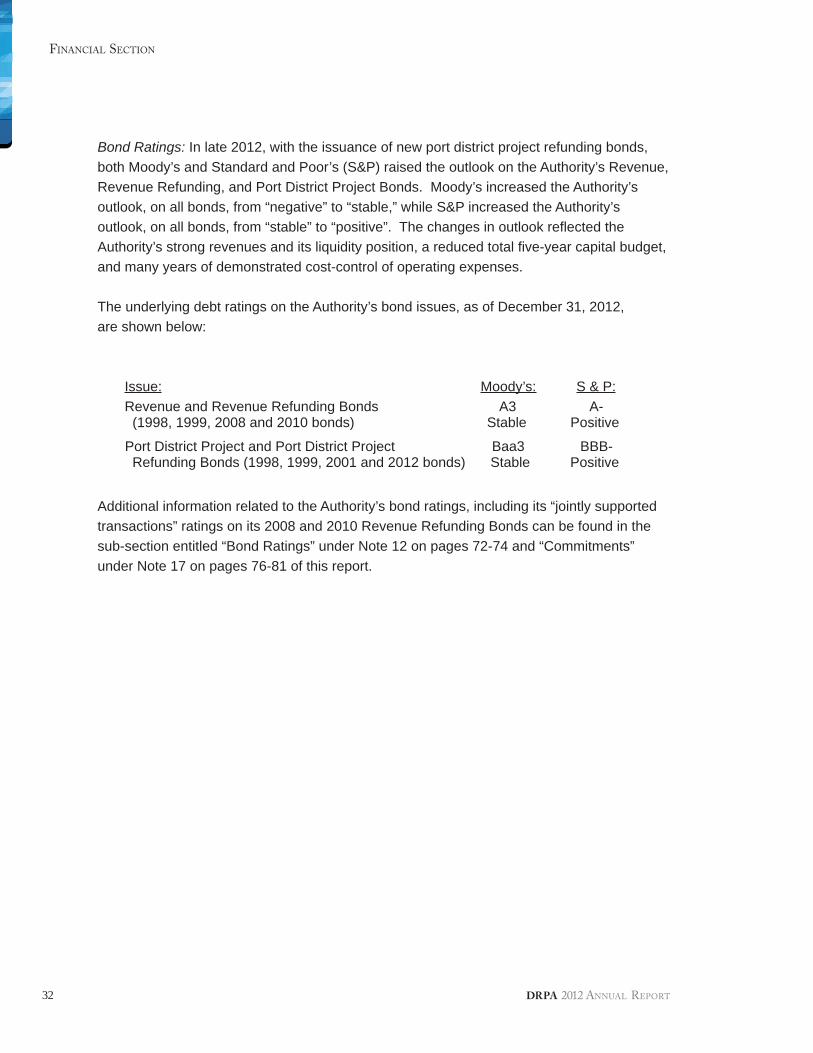
Bond Ratings: In late 2012, with the issuance of new port district project refunding bonds, both Moody’s and Standard and Poor’s (S&P) raised the outlook on the Authority’s Revenue, Revenue Refunding, and Port District Project Bonds. Moody’s increased the Authority’s outlook, on all bonds, from “negative” to “stable,” while S&P increased the Authority’s outlook, on all bonds, from “stable” to “positive”. The changes in outlook refl ected the Authority’s strong revenues and its liquidity position, a reduced total fi ve-year capital budget, and many years of demonstrated cost-control of operating expenses.
The underlying debt ratings on the Authority’s bond issues, as of December 31, 2012, are shown below:
Issue: Moody’s: S & P: Revenue and Revenue Refunding Bonds A3 A- (1998, 1999, 2008 and 2010 bonds) Stable Positive
Port District Project and Port District Project Baa3 BBB- Refunding Bonds (1998, 1999, 2001 and 2012 bonds) Stable Positive
Additional information related to the Authority’s bond ratings, including its “jointly supported transactions” ratings on its 2008 and 2010 Revenue Refunding Bonds can be found in the sub-section entitled “Bond Ratings” under Note 12 on pages 72-74 and “Commitments” under Note 17 on pages 76-81 of this report.
33
FINANCIAL SECTION
DRPA 2012 ANNUAL REPORT
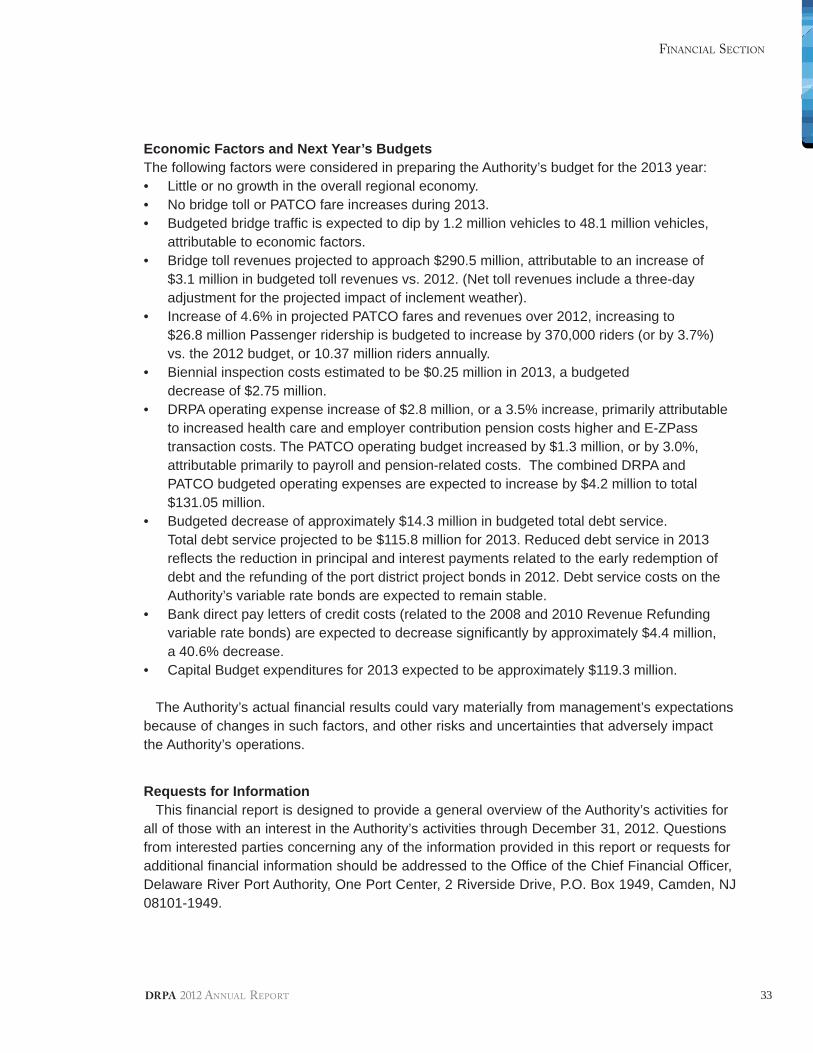
Economic Factors and Next Year’s Budgets The following factors were considered in preparing the Authority’s budget for the 2013 year: • Little or no growth in the overall regional economy.• No bridge toll or PATCO fare increases during 2013.• Budgeted bridge traffi c is expected to dip by 1.2 million vehicles to 48.1 million vehicles,
attributable to economic factors.• Bridge toll revenues projected to approach $290.5 million, attributable to an increase of
$3.1 million in budgeted toll revenues vs. 2012. (Net toll revenues include a three-day adjustment for the projected impact of inclement weather).
• Increase of 4.6% in projected PATCO fares and revenues over 2012, increasing to $26.8 million Passenger ridership is budgeted to increase by 370,000 riders (or by 3.7%) vs. the 2012 budget, or 10.37 million riders annually.
• Biennial inspection costs estimated to be $0.25 million in 2013, a budgeted decrease of $2.75 million.
• DRPA operating expense increase of $2.8 million, or a 3.5% increase, primarily attributable to increased health care and employer contribution pension costs higher and E-ZPass transaction costs. The PATCO operating budget increased by $1.3 million, or by 3.0%, attributable primarily to payroll and pension-related costs. The combined DRPA and PATCO budgeted operating expenses are expected to increase by $4.2 million to total $131.05 million.
• Budgeted decrease of approximately $14.3 million in budgeted total debt service. Total debt service projected to be $115.8 million for 2013. Reduced debt service in 2013 refl ects the reduction in principal and interest payments related to the early redemption of debt and the refunding of the port district project bonds in 2012. Debt service costs on the Authority’s variable rate bonds are expected to remain stable.
• Bank direct pay letters of credit costs (related to the 2008 and 2010 Revenue Refunding variable rate bonds) are expected to decrease signifi cantly by approximately $4.4 million, a 40.6% decrease.
• Capital Budget expenditures for 2013 expected to be approximately $119.3 million.
The Authority’s actual financial results could vary materially from management’s expectations because of changes in such factors, and other risks and uncertainties that adversely impact the Authority’s operations.
Requests for InformationThis financial report is designed to provide a general overview of the Authority’s activities for
all of those with an interest in the Authority’s activities through December 31, 2012. Questions from interested parties concerning any of the information provided in this report or requests for additional financial information should be addressed to the Office of the Chief Financial Officer, Delaware River Port Authority, One Port Center, 2 Riverside Drive, P.O. Box 1949, Camden, NJ 08101-1949.
34
FINANCIAL SECTION
DRPA 2012 ANNUAL REPORT
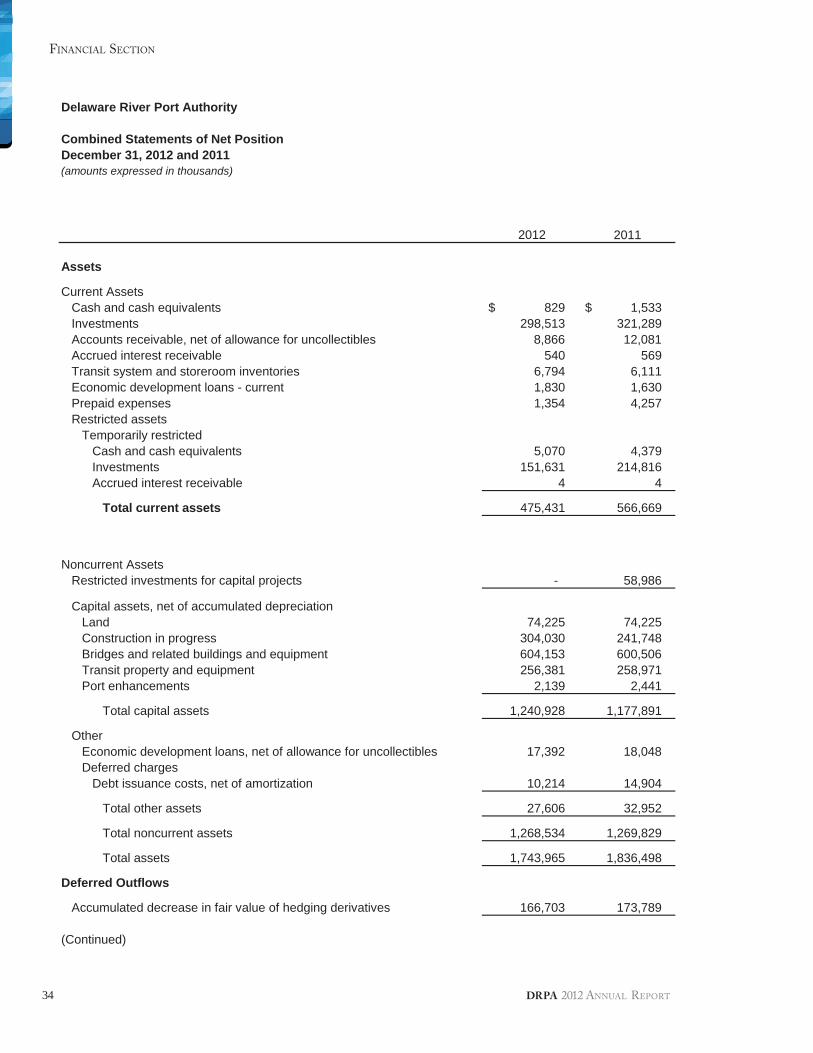
Delaware River Port Authority
Combined Statements of Net PositionDecember 31, 2012 and 2011(amounts expressed in thousands)
2012 2011
Assets
Current AssetsCash and cash equivalents 829$ 1,533$Investments 298,513 321,289Accounts receivable, net of allowance for uncollectibles 8,866 12,081Accrued interest receivable 540 569Transit system and storeroom inventories 6,794 6,111Economic development loans - current 1,830 1,630Prepaid expenses 1,354 4,257Restricted assets
Temporarily restrictedCash and cash equivalents 5,070 4,379Investments 151,631 214,816Accrued interest receivable 4 4
Total current assets 475,431 566,669
Noncurrent AssetsRestricted investments for capital projects - 58,986
Capital assets, net of accumulated depreciationLand 74,225 74,225Construction in progress 304,030 241,748Bridges and related buildings and equipment 604,153 600,506Transit property and equipment 256,381 258,971Port enhancements 2,139 2,441
Total capital assets 1,240,928 1,177,891
OtherEconomic development loans, net of allowance for uncollectibles 17,392 18,048Deferred charges
Debt issuance costs, net of amortization 10,214 14,904
Total other assets 27,606 32,952
Total noncurrent assets 1,268,534 1,269,829
Total assets 1,743,965 1,836,498
Deferred Outflows
Accumulated decrease in fair value of hedging derivatives 166,703 173,789
(Continued)
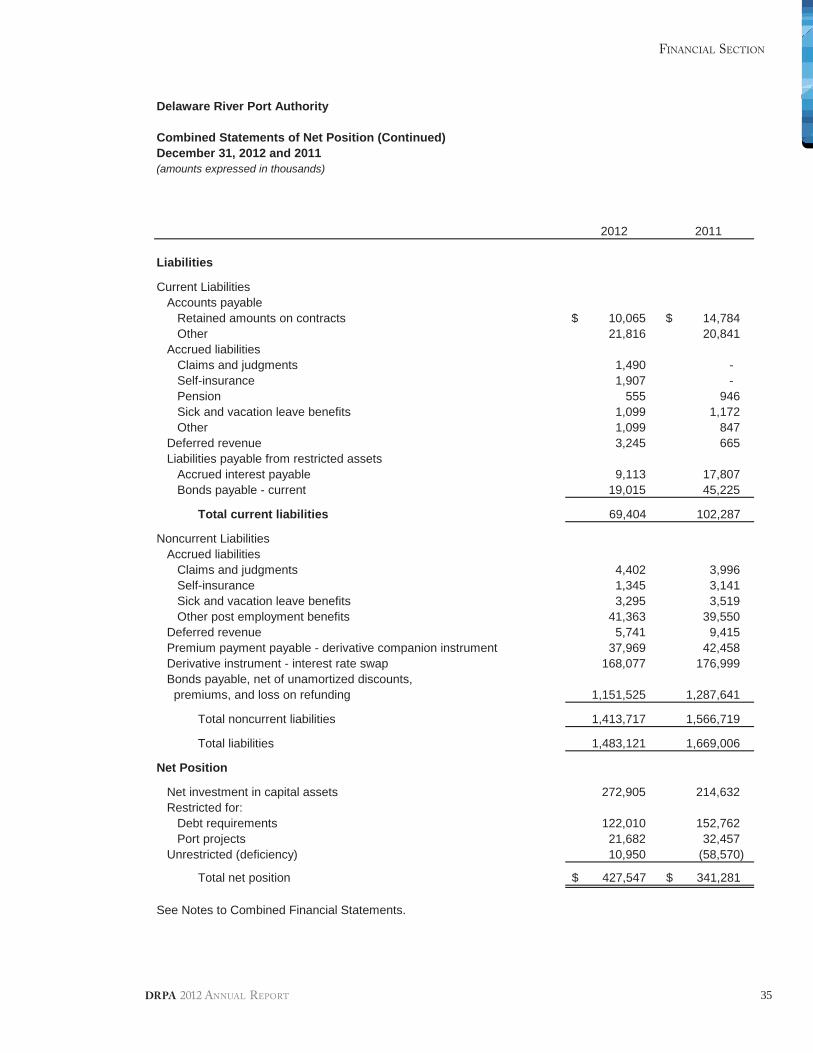
35
FINANCIAL SECTION
DRPA 2012 ANNUAL REPORT
Delaware River Port Authority
Combined Statements of Net Position (Continued)December 31, 2012 and 2011(amounts expressed in thousands)
2012 2011
Liabilities
Current LiabilitiesAccounts payable
Retained amounts on contracts 10,065$ 14,784$Other 21,816 20,841
Accrued liabilitiesClaims and judgments 1,490 -Self-insurance 1,907 -Pension 555 946Sick and vacation leave benefits 1,099 1,172Other 1,099 847
Deferred revenue 3,245 665Liabilities payable from restricted assets
Accrued interest payable 9,113 17,807Bonds payable - current 19,015 45,225
Total current liabilities 69,404 102,287
Noncurrent LiabilitiesAccrued liabilities
Claims and judgments 4,402 3,996Self-insurance 1,345 3,141Sick and vacation leave benefits 3,295 3,519Other post employment benefits 41,363 39,550
Deferred revenue 5,741 9,415Premium payment payable - derivative companion instrument 37,969 42,458Derivative instrument - interest rate swap 168,077 176,999Bonds payable, net of unamortized discounts,
premiums, and loss on refunding 1,151,525 1,287,641
Total noncurrent liabilities 1,413,717 1,566,719
Total liabilities 1,483,121 1,669,006
Net Position
Net investment in capital assets 272,905 214,632Restricted for:
Debt requirements 122,010 152,762Port projects 21,682 32,457
Unrestricted (deficiency) 10,950 (58,570)
Total net position 427,547$ 341,281$
See Notes to Combined Financial Statements.
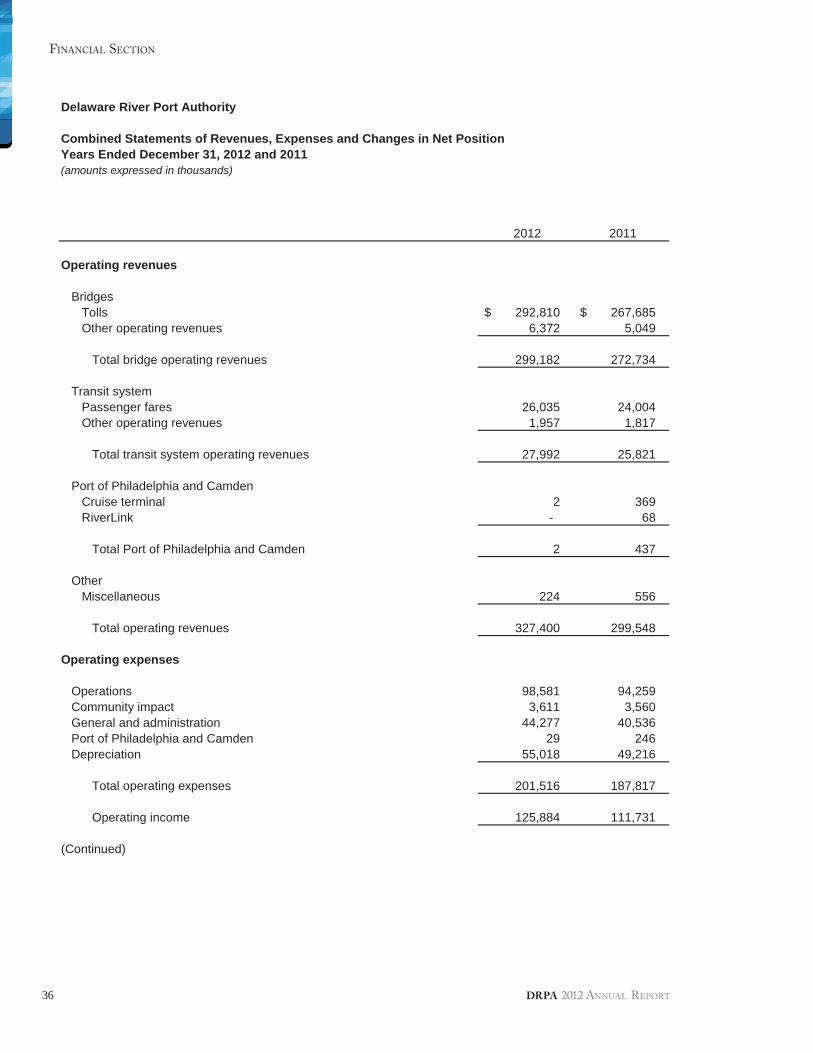
36
FINANCIAL SECTION
DRPA 2012 ANNUAL REPORT
Delaware River Port Authority
Combined Statements of Revenues, Expenses and Changes in Net PositionYears Ended December 31, 2012 and 2011(amounts expressed in thousands)
2012 2011
Operating revenues
BridgesTolls 292,810$ 267,685$Other operating revenues 6,372 5,049
Total bridge operating revenues 299,182 272,734
Transit systemPassenger fares 26,035 24,004Other operating revenues 1,957 1,817
Total transit system operating revenues 27,992 25,821
Port of Philadelphia and CamdenCruise terminal 2 369RiverLink - 68
Total Port of Philadelphia and Camden 2 437
OtherMiscellaneous 224 556
Total operating revenues 327,400 299,548
Operating expenses
Operations 98,581 94,259Community impact 3,611 3,560General and administration 44,277 40,536Port of Philadelphia and Camden 29 246Depreciation 55,018 49,216
Total operating expenses 201,516 187,817
Operating income 125,884 111,731
(Continued)
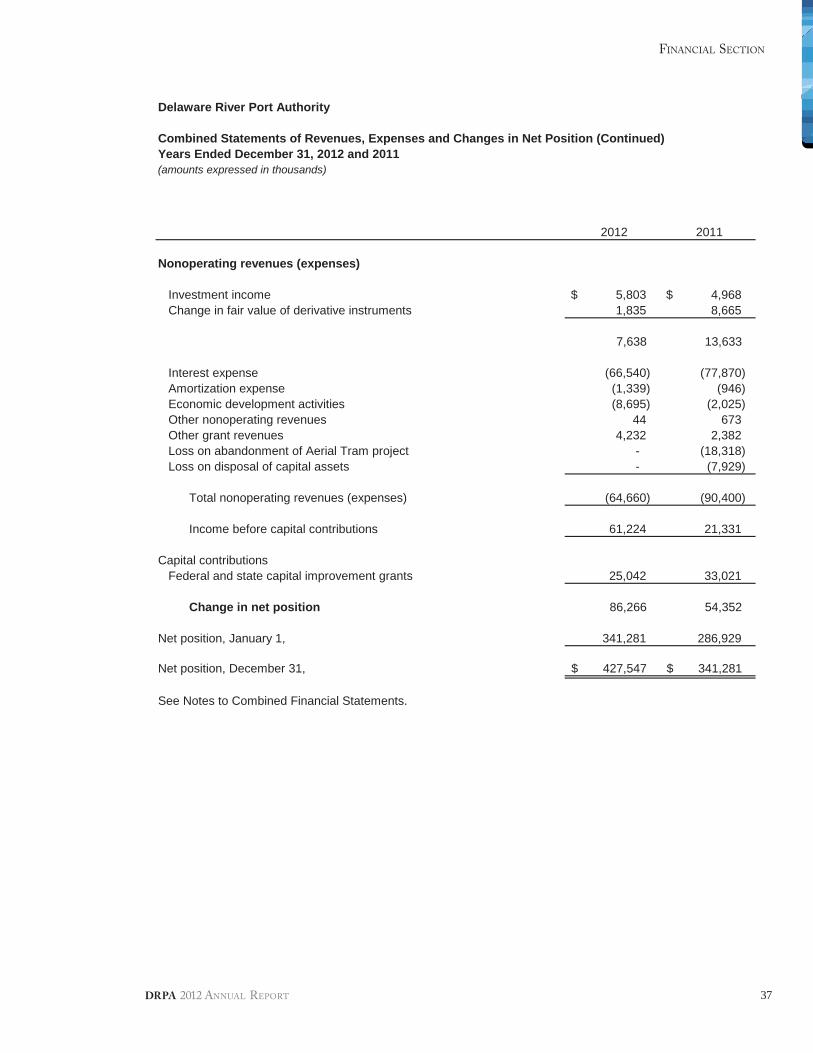
37
FINANCIAL SECTION
DRPA 2012 ANNUAL REPORT
Delaware River Port Authority
Combined Statements of Revenues, Expenses and Changes in Net Position (Continued)Years Ended December 31, 2012 and 2011(amounts expressed in thousands)
2012 2011
Nonoperating revenues (expenses)
Investment income 5,803$ 4,968$Change in fair value of derivative instruments 1,835 8,665
7,638 13,633
Interest expense (66,540) (77,870)Amortization expense (1,339) (946)Economic development activities (8,695) (2,025)Other nonoperating revenues 44 673Other grant revenues 4,232 2,382Loss on abandonment of Aerial Tram project - (18,318)Loss on disposal of capital assets - (7,929)
Total nonoperating revenues (expenses) (64,660) (90,400)
Income before capital contributions 61,224 21,331
Capital contributionsFederal and state capital improvement grants 25,042 33,021
Change in net position 86,266 54,352
Net position, January 1, 341,281 286,929
Net position, December 31, 427,547$ 341,281$
See Notes to Combined Financial Statements.
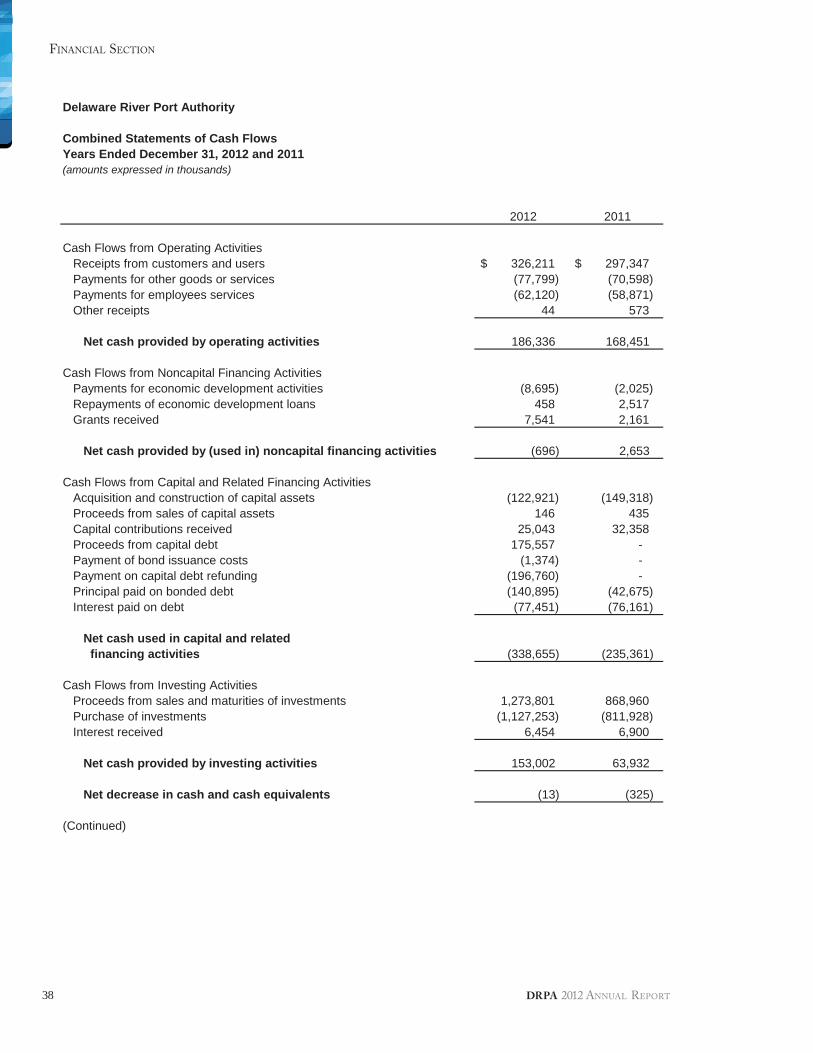
38
FINANCIAL SECTION
DRPA 2012 ANNUAL REPORT
Delaware River Port Authority
Combined Statements of Cash FlowsYears Ended December 31, 2012 and 2011(amounts expressed in thousands)
2012 2011
Cash Flows from Operating ActivitiesReceipts from customers and users 326,211$ 297,347$Payments for other goods or services (77,799) (70,598)Payments for employees services (62,120) (58,871)Other receipts 44 573
Net cash provided by operating activities 186,336 168,451
Cash Flows from Noncapital Financing ActivitiesPayments for economic development activities (8,695) (2,025)Repayments of economic development loans 458 2,517Grants received 7,541 2,161
Net cash provided by (used in) noncapital financing activities (696) 2,653
Cash Flows from Capital and Related Financing ActivitiesAcquisition and construction of capital assets (122,921) (149,318)Proceeds from sales of capital assets 146 435Capital contributions received 25,043 32,358Proceeds from capital debt 175,557 -Payment of bond issuance costs (1,374) -Payment on capital debt refunding (196,760) -Principal paid on bonded debt (140,895) (42,675)Interest paid on debt (77,451) (76,161)
Net cash used in capital and relatedfinancing activities (338,655) (235,361)
Cash Flows from Investing ActivitiesProceeds from sales and maturities of investments 1,273,801 868,960Purchase of investments (1,127,253) (811,928)Interest received 6,454 6,900
Net cash provided by investing activities 153,002 63,932
Net decrease in cash and cash equivalents (13) (325)
(Continued)
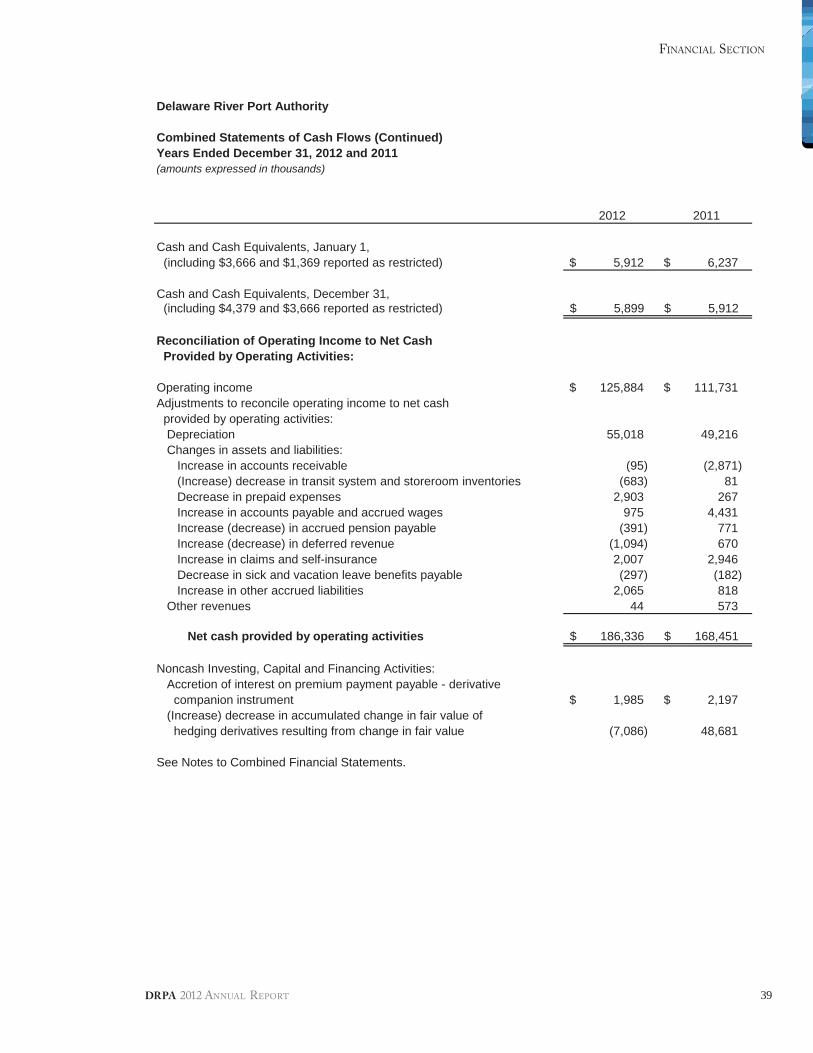
39
FINANCIAL SECTION
DRPA 2012 ANNUAL REPORT
Delaware River Port Authority
Combined Statements of Cash Flows (Continued)Years Ended December 31, 2012 and 2011(amounts expressed in thousands)
2012 2011
Cash and Cash Equivalents, January 1,(including $3,666 and $1,369 reported as restricted) 5,912$ 6,237$
Cash and Cash Equivalents, December 31,(including $4,379 and $3,666 reported as restricted) 5,899$ 5,912$
Reconciliation of Operating Income to Net CashProvided by Operating Activities:
Operating income 125,884$ 111,731$Adjustments to reconcile operating income to net cash
provided by operating activities:Depreciation 55,018 49,216Changes in assets and liabilities:
Increase in accounts receivable (95) (2,871)(Increase) decrease in transit system and storeroom inventories (683) 81Decrease in prepaid expenses 2,903 267Increase in accounts payable and accrued wages 975 4,431Increase (decrease) in accrued pension payable (391) 771Increase (decrease) in deferred revenue (1,094) 670Increase in claims and self-insurance 2,007 2,946Decrease in sick and vacation leave benefits payable (297) (182)Increase in other accrued liabilities 2,065 818
Other revenues 44 573
Net cash provided by operating activities 186,336$ 168,451$
Noncash Investing, Capital and Financing Activities:Accretion of interest on premium payment payable - derivative
companion instrument 1,985$ 2,197$(Increase) decrease in accumulated change in fair value of
hedging derivatives resulting from change in fair value (7,086) 48,681
See Notes to Combined Financial Statements.
40
FINANCIAL SECTION
DRPA 2012 ANNUAL REPORT
Delaware River Port Authority
Notes to Combined Financial Statements
Note 1. Summary of Significant Accounting Policies
Description of Operations: The Delaware River Port Authority (the “Authority”) is a public corporateinstrumentality of the Commonwealth of Pennsylvania (the “Commonwealth”) and the State of NewJersey (the “State”), created with the consent of Congress by compact legislation between theCommonwealth and the State. The Authority has no stockholders or equity holders. The Authority isvested with the ownership, control, operation, and collection of tolls and revenues of certain bridgesspanning the Delaware River; namely, the Benjamin Franklin, Walt Whitman, Commodore Barry, andBetsy Ross bridges. The Authority has also constructed and owns a high-speed transit system that isoperated by the Port Authority Transit Corporation (“PATCO”). The transit system operates betweenPhiladelphia, Pennsylvania and Lindenwold, New Jersey. The Authority’s Port of Philadelphia andCamden Department (“PPC”) was responsible for the operation of the Philadelphia Cruise Terminal atPier 1 at the former Navy Yard. (The Authority discontinued operations related to the Philadelphia CruiseTerminal effective July 1, 2011). The Office of the Chief Operating Officer manages the RiverLink FerrySystem which runs daily between Penn’s Landing in Philadelphia and the Camden Waterfront. The costsof providing facilities and services to the general public on a continuing basis are recovered primarily inthe form of tolls and fares. The Authority is a member of the E-ZPass Interagency Group, the largestinteroperable Electronic Toll Collection System in the world, comprised of twenty-two (22) agencies ineleven (11) states. Through December 2012, customer participation in the E-ZPass electronic tollcollection process grew to approximately sixty-seven (67%) of its toll collection activity during rush hourperiods. Toll revenues collected through E-ZPass now exceed sixty-three percent (63%) of total tollrevenues.
Basis of Presentation: The Authority is a single enterprise fund and maintains its records on the accrualbasis of accounting. Enterprise Funds account for activities (i) that are financed with debt that is securedsolely by a pledge of the net revenues from fees and charges of the activity; or (ii) that are required by lawor regulations that the activity’s cost of providing services, including capital cost (such as depreciation ordebt service), be recovered with fees and charges, rather than with taxes or similar revenues; or (iii) thatthe pricing policies of the activity establish fees and charges designed to recover its costs, includingcapital costs (such as depreciation or debt service). Under the accrual basis of accounting, revenues arerecorded when earned and expenses are recorded when the related liability is incurred.
Cash and Cash Equivalents: The Authority considers all highly liquid investments with a maturity of threemonths or less when purchased to be cash equivalents (Note 2). In addition, according to the variousIndentures of Trust which govern the flow and accounting of the Authority’s financial resources, certainaccounts are required to be maintained in order to comply with the provisions of the Indentures of Trust.For the accounts that are restricted, the Authority has recorded the applicable cash and cash equivalentsas restricted on the combined financial statements (Note 11).
Investment in Securities: Investments are stated at fair value, generally based on quoted market prices.Certain investments are maintained in connection with the Authority’s funded debt (Notes 3 and 12).Likewise, as with cash and cash equivalents, the accounts that are restricted as per the variousIndentures of Trust have been recorded as restricted investments on the combined financial statements(Note 11).
Accounts Receivable: The Authority establishes a provision for the estimated amount of uncollectibleaccounts based upon periodic analysis of collection history.
Transit System Inventory: Transit system inventory, consisting principally of spare parts for maintenanceof transit system facilities, is stated at the lower of cost (first-in, first-out method) or market.
Debt Issuance Costs, Bond Premiums, Bond Discounts and Loss on Refunding: Debt issuance costs areamortized by the straight-line method from the issue date to maturity. Premiums, discounts and loss onrefunding arising from the issuance of the revenue bonds and port district project bonds are amortized bythe effective interest method from the issue date to maturity.
41
FINANCIAL SECTION
DRPA 2012 ANNUAL REPORT
Delaware River Port Authority
Notes to Combined Financial Statements
Note 1. Summary of Significant Accounting Policies (Continued)
Investment in Facilities: Investment in facilities is stated at cost, which generally includes expenses foradministrative and legal expenses incurred during the construction period. Investment in facilities alsoincludes the cost incurred for port-related projects, and improvements, enlargements and betterments tothe original facilities. Replacements of existing facilities (except for primarily police and certain othervehicles whose estimated useful life is two years or less) are also recorded at cost. The related costs andaccumulated depreciation of the property replaced are removed from the respective accounts, and anygain or loss on disposition is credited or charged to non-operating revenues or expenses. Assetscapitalizable generally have an original cost of five thousand dollars ($5) or more and a useful life inexcess of three years. Depreciation and amortization are provided using the straight-line method over theestimated useful lives of the related assets, including those financed by federal and state contributions(Notes 7 and 15).
Asset lives used in the calculation of depreciation are generally as follows:
Bridges, freeways and tunnels 100 yearsBuildings, stations and certain bridge components 35 - 50 yearsElectrification, signals and communication system 30 - 40 yearsTransit cars, machinery and equipment 10 - 25 yearsComputer equipment, automobiles and other equipment 3 - 10 years
Maintenance and Repairs: Maintenance and repair costs considered necessary to maintain bridgefacilities in good operating condition are charged to operations as incurred.
Self-insurance: The Authority provides for the uninsured portion of potential public liability and workers’compensation claims through self-insurance programs and charges current operations for estimatedclaims to be paid (Note 16).
Economic Development Activities: The Authority establishes loan loss provisions for economicdevelopment loans receivable, based upon collection history and analysis of creditor’s ability to pay. TheAuthority has established a loss reserve in the amount of $1,345 for its economic development loansoutstanding.
Net Position: Net position is classified in the following three components:
Net Investment in Capital Assets: This component of net position consists of capital assets, net ofaccumulated depreciation, reduced, by the outstanding balances of any bonds, notes or otherborrowings that are attributable to the acquisition, construction, or improvement of those assets. Ifthere are significant unspent related debt proceeds at year-end, the portion of the debt attributable tothe unspent proceeds is not included in the calculation of net investment in capital assets. Rather,that portion of the debt is included in the same net position component as the unspent proceeds.
Restricted: This component of net position consists of external constraints imposed by creditors(such as debt covenants), grantors, contributors, laws or regulations of other governments, orconstraints imposed by law through constitutional provisions or enabling legislation, that restricts theuse of net position.
Unrestricted: This component of net position consists of a net position that does not meet thedefinition of “restricted” or “net investment in capital assets.” This component includes net positionthat may be allocated for specific purposes by the Board. A deficiency will require future funding.
42
FINANCIAL SECTION
DRPA 2012 ANNUAL REPORT
Delaware River Port Authority
Notes to Combined Financial Statements
Note 1. Summary of Significant Accounting Policies (Continued)
Operating and Non-operating Revenues and Expenses: Operating revenues include all revenues derivedfrom facility charges (i.e., toll revenues, which include E-ZPass revenues), PATCO operations (passengerfare, advertising and parking), and other revenue sources. Non-operating revenues principally consist ofinterest income earned on various interest-bearing accounts and on investments in debt securities.
Operating expenses include expenses associated with the operation, maintenance and repair of thebridges, PATCO, PPC operations, and general administrative expenses. Non-operating expensesprincipally include expenses attributable to the Authority’s interest on funded debt and economicdevelopment activities.
When both restricted and unrestricted resources are available for use, it is the Authority’s policy to userestricted resources first, then unrestricted resources as they are needed.
Debt Management: Total outstanding bond debt reflected on the balance sheet is net of unamortizedbond discounts, premiums, and loss on refunding (Note 12). The Authority presently has two activeinterest rate hedge (swap) agreements (derivative instruments) with UBS AG (Paine Webber) to hedgeinterest rates on a portion of its outstanding long-term debt (Note 4).
Derivative Instruments and the Related Companion Instruments: The Authority has entered into twointerest rate swap agreements with Bank of America, N.A. for the primary purposes of investing and forthe aforementioned purpose of hedging interest rates on its outstanding long-term debt. In accordancewith Governmental Accounting Standards Board Statement No. 53, Accounting and Financial Reportingfor Derivative Instruments, all activity related to the interest rate swap agreements has been recorded onthe combined financial statements and is further detailed in Note 4.
Budget: In accordance with Section 5.15 of the 1998 Revenue Refunding Bonds Indenture of Trust andits Supplemental Indentures and Section 5.07 of the 1998, 1999 and 2001 Port District Project BondIndentures of Trust, the Authority must annually adopt an Annual Budget on or before December 31 forthe ensuing year. Section 5.15 of the 1998 Revenue Bond Indenture of Trust requires that the Authority,on or before December 31, in each fiscal year, adopt a final budget for the ensuing fiscal year of (i)operational expenses, (ii) the PATCO Subsidy, (iii) the amount to be deposited to the credit of theMaintenance Reserve Fund, and (iv) the estimated amounts to be deposited into the Debt Service Fund,the Debt Service Reserve Fund, and the Rebate Fund. Each Annual Budget must also contain theAuthority’s projections of revenues for the ensuing fiscal year demonstrating compliance with thecovenant as to facility charges as set forth in Section 5.09 of the Indentures of Trust. On or beforeDecember 31 in each fiscal year, the Authority must file a copy of the Annual Budget for the ensuing fiscalyear with the Trustees.
The Port District Project Bond Indentures require the following: the adopted budget must set forth, interalia, the PATCO Subsidiary, the amount of any operating subsidy paid or payable by the Authority to orfor the account of any other subsidiary of the Authority (including, without limitation, the Port ofPhiladelphia and Camden) and all other material operating expenses of the Authority payable from theGeneral Fund. (See Note 11 for description of funds established under the Trust Indentures.) TheAuthority must also include the debt service payable on the Bonds and any Additional Subordinatedindebtedness during the ensuing fiscal year and all amounts required to be paid by the Authority into theDebt Service Reserve Fund or the Rebate Fund or to any Reserve Fund Credit Facility issuer during theensuing fiscal year. On or before December 31, in each fiscal year, the Authority must file a copy of theAnnual Budget for the ensuing fiscal year with the Trustees and Credit Facility Issuer.
The Authority may at any time adopt an amended or supplemental Annual Budget for the remainder ofthe then-current fiscal year, which shall be treated as the Annual Budget under the provisions of theIndentures of Trust. A copy of any amended or supplemental Annual Budget must be promptly filed withthe Trustee.
43
FINANCIAL SECTION
DRPA 2012 ANNUAL REPORT
Delaware River Port Authority
Notes to Combined Financial Statements
Note 1. Summary of Significant Accounting Policies (Continued)
Interfunds: Interfund receivables/payables represent amounts that are owed, other than charges forgoods and services rendered, to/from a particular fund. These receivables/payables are eliminatedduring the aggregation process.
Reclassifications: Certain reclassifications have been made in the 2011 comparative statements to be inconformity with the 2012 presentation.
Use of Estimates: The preparation of financial statements in conformity with accounting principlesgenerally accepted in the United States of America requires management to make estimates andassumptions that affect the reported amounts of assets and liabilities and disclosure of contingent assetsand liabilities at the date of the combined financial statements and the reported amounts of revenues andexpenses during the reporting period. Actual results could differ from those estimates.
Income Taxes: The Authority is a public corporate instrumentality of the State of New Jersey and theCommonwealth of Pennsylvania, and is described in its amended governing Compact, has been “deemedto be exercising an essential government function in effectuating such purposes,” and therefore is exemptfrom income taxes pursuant to the Internal Revenue Code (Section 115).
Note 2. Cash and Cash Equivalents
Custodial Credit Risk Related to Deposits: Custodial credit risk is the risk that, in the event of a bankfailure, the Authority’s deposits might not be recovered. The Authority does not have a deposit policy forcustodial credit risk. As of December 31, 2012 and 2011, the Authority’s bank balances of $55,806 and$84,951 (including certificates of deposit of $46,427 and $67,018 classified as investments in thestatement of net position), respectively, were exposed to custodial credit risk as follows:
2012 2011
Uninsured and uncollateralized 51,889$ 76,484$
Uninsured and collateralized (collateral held by bank'sdepartment or agent, but not in the Authority's name) 7,260$ 7,088$
Note 3. Investment in Securities
The Authority’s investments in various securities are maintained for specified funds in accordance withthe provisions of the Indenture of Trust adopted as of July 1, 1998.
Custodial Credit Risk Related to Investments: For an investment, custodial credit risk is the risk that, inthe event of the failure of the counterparty, the Authority will not be able to recover the value of itsinvestments or collateral securities that are in possession of an outside party. Of the Authority’sinvestments at December 31, 2012 and 2011, $403,717 and $528,073, respectively, consisted ofinvestments in asset backed securities, commercial paper, corporate bonds and notes, mortgage pass-through securities, municipal bonds, repurchase agreements, U.S. federal agency notes and bonds, andU.S. government treasuries, are uninsured, not registered in the name of the Authority, and held by thecounterparty’s trust department or agent but not in the Authority’s name.
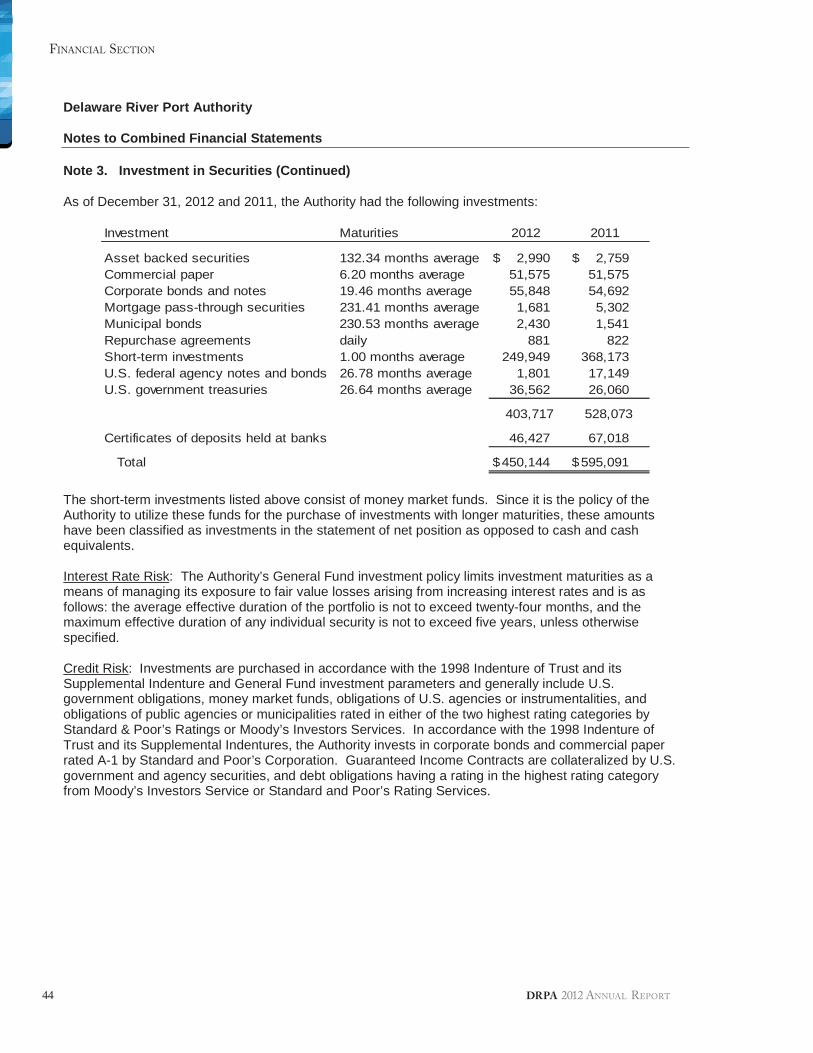
44
FINANCIAL SECTION
DRPA 2012 ANNUAL REPORT
Delaware River Port Authority
Notes to Combined Financial Statements
Note 3. Investment in Securities (Continued)
As of December 31, 2012 and 2011, the Authority had the following investments:
Investment Maturities 2012 2011
Asset backed securities 132.34 months average 2,990$ 2,759$Commercial paper 6.20 months average 51,575 51,575Corporate bonds and notes 19.46 months average 55,848 54,692Mortgage pass-through securities 231.41 months average 1,681 5,302Municipal bonds 230.53 months average 2,430 1,541Repurchase agreements daily 881 822Short-term investments 1.00 months average 249,949 368,173U.S. federal agency notes and bonds 26.78 months average 1,801 17,149U.S. government treasuries 26.64 months average 36,562 26,060
403,717 528,073
Certificates of deposits held at banks 46,427 67,018
Total 450,144$ 595,091$
The short-term investments listed above consist of money market funds. Since it is the policy of theAuthority to utilize these funds for the purchase of investments with longer maturities, these amountshave been classified as investments in the statement of net position as opposed to cash and cashequivalents.
Interest Rate Risk: The Authority’s General Fund investment policy limits investment maturities as ameans of managing its exposure to fair value losses arising from increasing interest rates and is asfollows: the average effective duration of the portfolio is not to exceed twenty-four months, and themaximum effective duration of any individual security is not to exceed five years, unless otherwisespecified.
Credit Risk: Investments are purchased in accordance with the 1998 Indenture of Trust and itsSupplemental Indenture and General Fund investment parameters and generally include U.S.government obligations, money market funds, obligations of U.S. agencies or instrumentalities, andobligations of public agencies or municipalities rated in either of the two highest rating categories byStandard & Poor’s Ratings or Moody’s Investors Services. In accordance with the 1998 Indenture ofTrust and its Supplemental Indentures, the Authority invests in corporate bonds and commercial paperrated A-1 by Standard and Poor’s Corporation. Guaranteed Income Contracts are collateralized by U.S.government and agency securities, and debt obligations having a rating in the highest rating categoryfrom Moody’s Investors Service or Standard and Poor’s Rating Services.
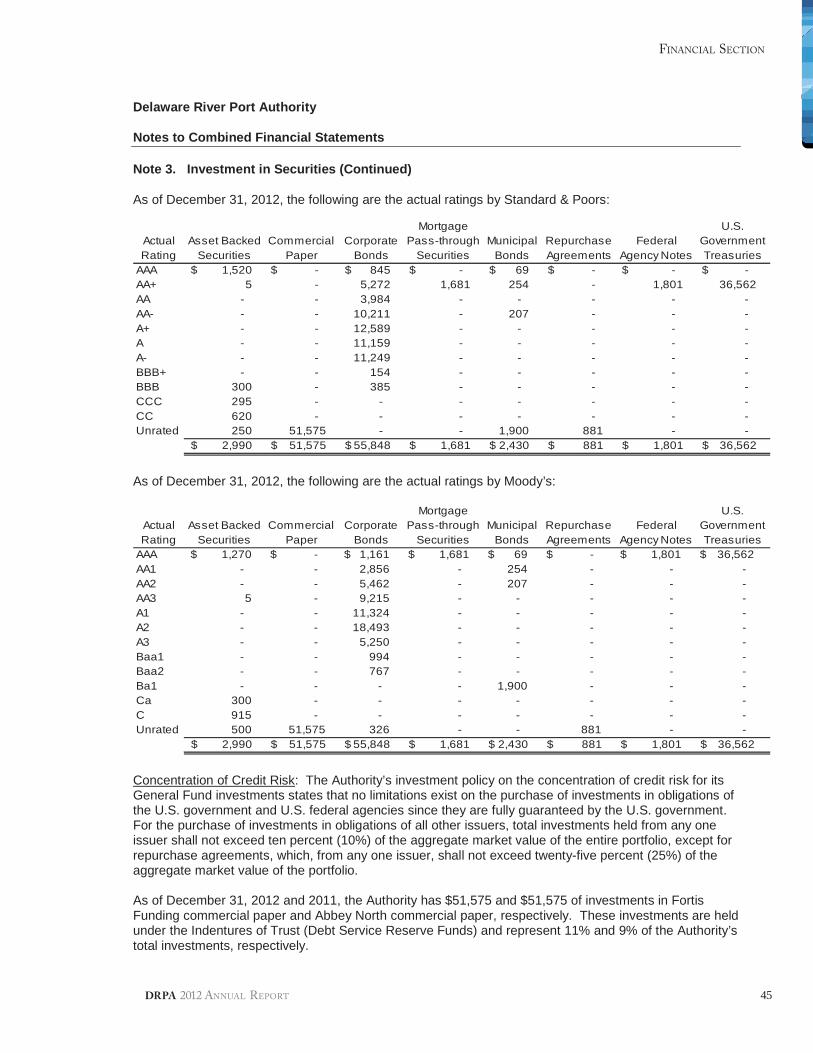
45
FINANCIAL SECTION
DRPA 2012 ANNUAL REPORT
Delaware River Port Authority
Notes to Combined Financial Statements
Note 3. Investment in Securities (Continued)
As of December 31, 2012, the following are the actual ratings by Standard & Poors:
ActualRating
Asset BackedSecurities
CommercialPaper
CorporateBonds
MortgagePass-through
SecuritiesMunicipal
BondsRepurchaseAgreements
FederalAgency Notes
U.S.GovernmentTreasuries
AAA 1,520$ -$ 845$ -$ 69$ -$ -$ -$AA+ 5 - 5,272 1,681 254 - 1,801 36,562AA - - 3,984 - - - - -AA- - - 10,211 - 207 - - -A+ - - 12,589 - - - - -A - - 11,159 - - - - -A- - - 11,249 - - - - -BBB+ - - 154 - - - - -BBB 300 - 385 - - - - -CCC 295 - - - - - - -CC 620 - - - - - - -Unrated 250 51,575 - - 1,900 881 - -
2,990$ 51,575$ 55,848$ 1,681$ 2,430$ 881$ 1,801$ 36,562$
As of December 31, 2012, the following are the actual ratings by Moody’s:
ActualRating
Asset BackedSecurities
CommercialPaper
CorporateBonds
MortgagePass-through
SecuritiesMunicipal
BondsRepurchaseAgreements
FederalAgency Notes
U.S.GovernmentTreasuries
AAA 1,270$ -$ 1,161$ 1,681$ 69$ -$ 1,801$ 36,562$AA1 - - 2,856 - 254 - - -AA2 - - 5,462 - 207 - - -AA3 5 - 9,215 - - - - -A1 - - 11,324 - - - - -A2 - - 18,493 - - - - -A3 - - 5,250 - - - - -Baa1 - - 994 - - - - -Baa2 - - 767 - - - - -Ba1 - - - - 1,900 - - -Ca 300 - - - - - - -C 915 - - - - - - -Unrated 500 51,575 326 - - 881 - -
2,990$ 51,575$ 55,848$ 1,681$ 2,430$ 881$ 1,801$ 36,562$
Concentration of Credit Risk: The Authority’s investment policy on the concentration of credit risk for itsGeneral Fund investments states that no limitations exist on the purchase of investments in obligations ofthe U.S. government and U.S. federal agencies since they are fully guaranteed by the U.S. government.For the purchase of investments in obligations of all other issuers, total investments held from any oneissuer shall not exceed ten percent (10%) of the aggregate market value of the entire portfolio, except forrepurchase agreements, which, from any one issuer, shall not exceed twenty-five percent (25%) of theaggregate market value of the portfolio.
As of December 31, 2012 and 2011, the Authority has $51,575 and $51,575 of investments in FortisFunding commercial paper and Abbey North commercial paper, respectively. These investments are heldunder the Indentures of Trust (Debt Service Reserve Funds) and represent 11% and 9% of the Authority’stotal investments, respectively.
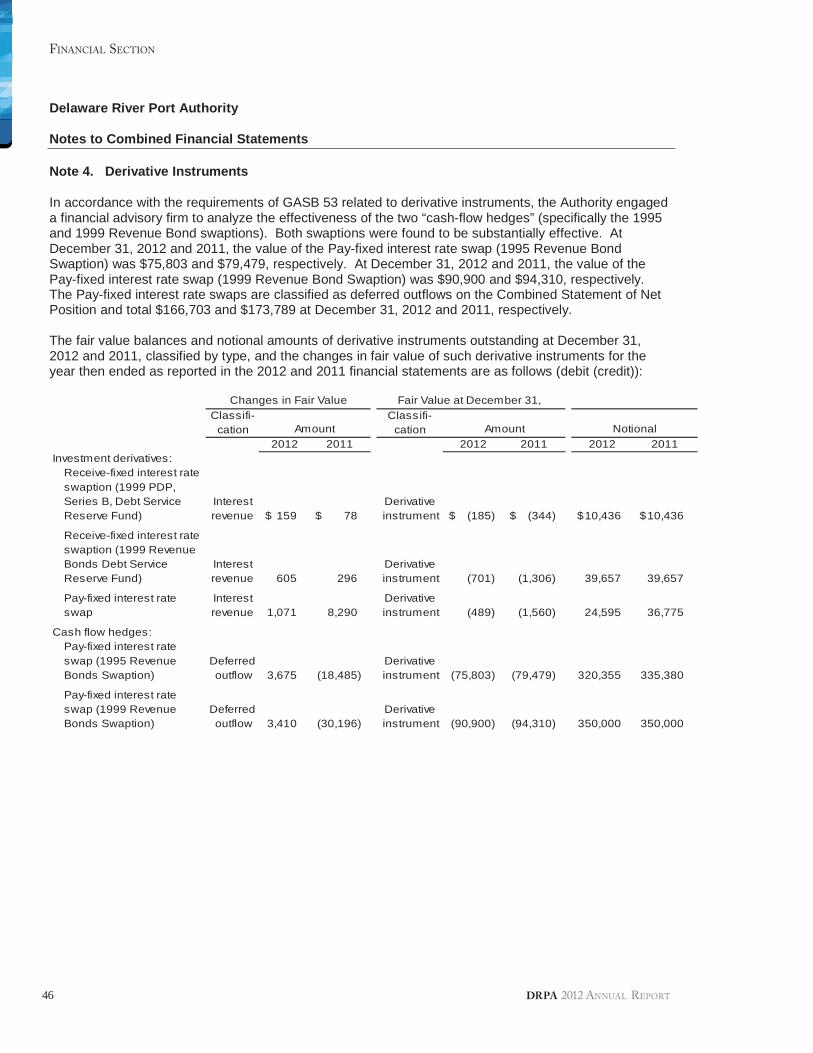
46
FINANCIAL SECTION
DRPA 2012 ANNUAL REPORT
Delaware River Port Authority
Notes to Combined Financial Statements
Note 4. Derivative Instruments
In accordance with the requirements of GASB 53 related to derivative instruments, the Authority engageda financial advisory firm to analyze the effectiveness of the two “cash-flow hedges” (specifically the 1995and 1999 Revenue Bond swaptions). Both swaptions were found to be substantially effective. AtDecember 31, 2012 and 2011, the value of the Pay-fixed interest rate swap (1995 Revenue BondSwaption) was $75,803 and $79,479, respectively. At December 31, 2012 and 2011, the value of thePay-fixed interest rate swap (1999 Revenue Bond Swaption) was $90,900 and $94,310, respectively.The Pay-fixed interest rate swaps are classified as deferred outflows on the Combined Statement of NetPosition and total $166,703 and $173,789 at December 31, 2012 and 2011, respectively.
The fair value balances and notional amounts of derivative instruments outstanding at December 31,2012 and 2011, classified by type, and the changes in fair value of such derivative instruments for theyear then ended as reported in the 2012 and 2011 financial statements are as follows (debit (credit)):
Classifi- Classifi-cation cation
2012 2011 2012 2011 2012 2011Investment derivatives:
Receive-fixed interest rateswaption (1999 PDP,Series B, Debt Service Interest DerivativeReserve Fund) revenue 159$ 78$ instrument (185)$ (344)$ 10,436$ 10,436$
Receive-fixed interest rateswaption (1999 RevenueBonds Debt Service Interest DerivativeReserve Fund) revenue 605 296 instrument (701) (1,306) 39,657 39,657
Pay-fixed interest rate Interest Derivativeswap revenue 1,071 8,290 instrument (489) (1,560) 24,595 36,775
Cash flow hedges:Pay-fixed interest rateswap (1995 Revenue Deferred DerivativeBonds Swaption) outflow 3,675 (18,485) instrument (75,803) (79,479) 320,355 335,380
Pay-fixed interest rateswap (1999 Revenue Deferred DerivativeBonds Swaption) outflow 3,410 (30,196) instrument (90,900) (94,310) 350,000 350,000
Changes in Fair Value Fair Value at December 31,
Amount Amount Notional
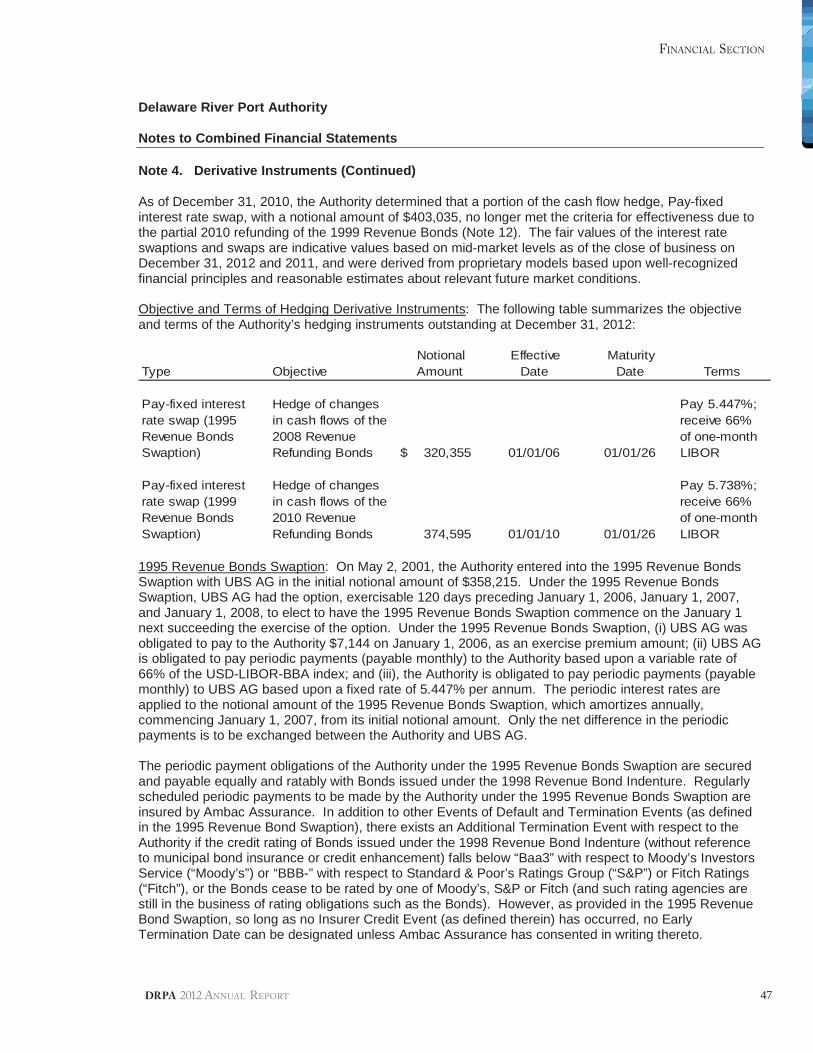
47
FINANCIAL SECTION
DRPA 2012 ANNUAL REPORT
Delaware River Port Authority
Notes to Combined Financial Statements
Note 4. Derivative Instruments (Continued)
As of December 31, 2010, the Authority determined that a portion of the cash flow hedge, Pay-fixedinterest rate swap, with a notional amount of $403,035, no longer met the criteria for effectiveness due tothe partial 2010 refunding of the 1999 Revenue Bonds (Note 12). The fair values of the interest rateswaptions and swaps are indicative values based on mid-market levels as of the close of business onDecember 31, 2012 and 2011, and were derived from proprietary models based upon well-recognizedfinancial principles and reasonable estimates about relevant future market conditions.
Objective and Terms of Hedging Derivative Instruments: The following table summarizes the objectiveand terms of the Authority’s hedging instruments outstanding at December 31, 2012:
Notional Effective MaturityType Objective Amount Date Date Terms
Pay-fixed interest Hedge of changes Pay 5.447%;rate swap (1995 in cash flows of the receive 66%Revenue Bonds 2008 Revenue of one-monthSwaption) Refunding Bonds 320,355$ 01/01/06 01/01/26 LIBOR
Pay-fixed interest Hedge of changes Pay 5.738%;rate swap (1999 in cash flows of the receive 66%Revenue Bonds 2010 Revenue of one-monthSwaption) Refunding Bonds 374,595 01/01/10 01/01/26 LIBOR
1995 Revenue Bonds Swaption: On May 2, 2001, the Authority entered into the 1995 Revenue BondsSwaption with UBS AG in the initial notional amount of $358,215. Under the 1995 Revenue BondsSwaption, UBS AG had the option, exercisable 120 days preceding January 1, 2006, January 1, 2007,and January 1, 2008, to elect to have the 1995 Revenue Bonds Swaption commence on the January 1next succeeding the exercise of the option. Under the 1995 Revenue Bonds Swaption, (i) UBS AG wasobligated to pay to the Authority $7,144 on January 1, 2006, as an exercise premium amount; (ii) UBS AGis obligated to pay periodic payments (payable monthly) to the Authority based upon a variable rate of66% of the USD-LIBOR-BBA index; and (iii), the Authority is obligated to pay periodic payments (payablemonthly) to UBS AG based upon a fixed rate of 5.447% per annum. The periodic interest rates areapplied to the notional amount of the 1995 Revenue Bonds Swaption, which amortizes annually,commencing January 1, 2007, from its initial notional amount. Only the net difference in the periodicpayments is to be exchanged between the Authority and UBS AG.
The periodic payment obligations of the Authority under the 1995 Revenue Bonds Swaption are securedand payable equally and ratably with Bonds issued under the 1998 Revenue Bond Indenture. Regularlyscheduled periodic payments to be made by the Authority under the 1995 Revenue Bonds Swaption areinsured by Ambac Assurance. In addition to other Events of Default and Termination Events (as definedin the 1995 Revenue Bond Swaption), there exists an Additional Termination Event with respect to theAuthority if the credit rating of Bonds issued under the 1998 Revenue Bond Indenture (without referenceto municipal bond insurance or credit enhancement) falls below “Baa3” with respect to Moody’s InvestorsService (“Moody’s”) or “BBB-” with respect to Standard & Poor’s Ratings Group (“S&P”) or Fitch Ratings(“Fitch”), or the Bonds cease to be rated by one of Moody’s, S&P or Fitch (and such rating agencies arestill in the business of rating obligations such as the Bonds). However, as provided in the 1995 RevenueBond Swaption, so long as no Insurer Credit Event (as defined therein) has occurred, no EarlyTermination Date can be designated unless Ambac Assurance has consented in writing thereto.
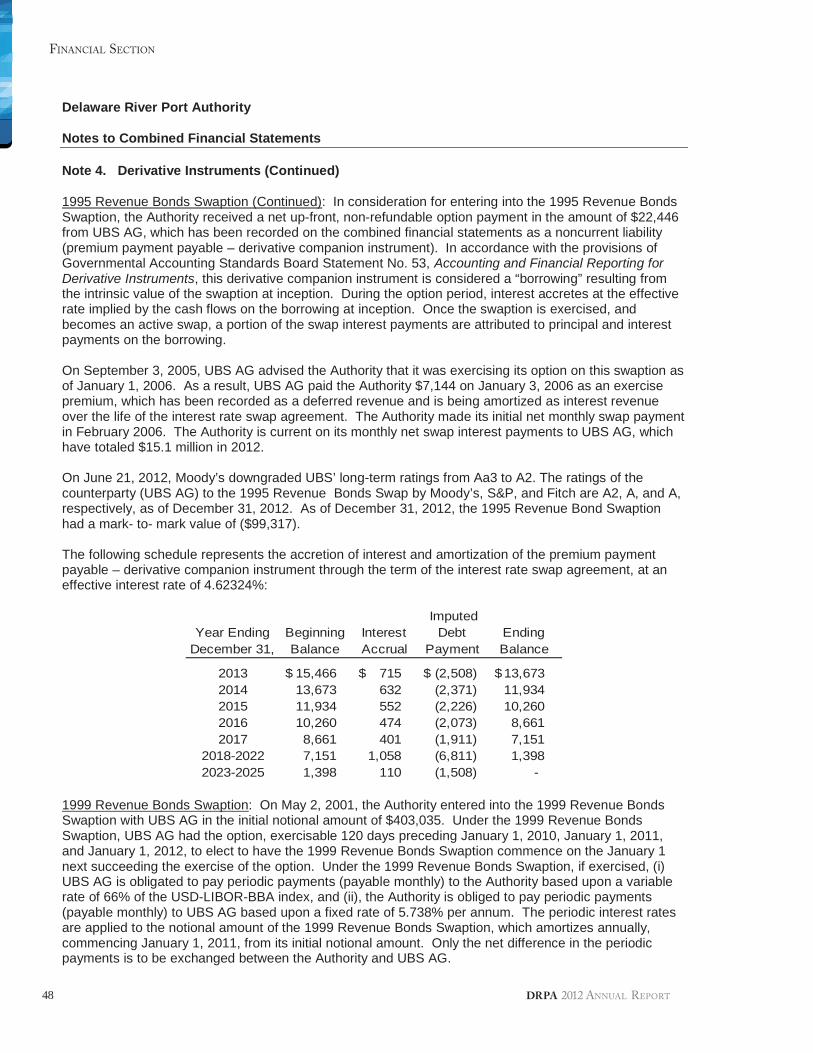
48
FINANCIAL SECTION
DRPA 2012 ANNUAL REPORT
Delaware River Port Authority
Notes to Combined Financial Statements
Note 4. Derivative Instruments (Continued)
1995 Revenue Bonds Swaption (Continued): In consideration for entering into the 1995 Revenue BondsSwaption, the Authority received a net up-front, non-refundable option payment in the amount of $22,446from UBS AG, which has been recorded on the combined financial statements as a noncurrent liability(premium payment payable – derivative companion instrument). In accordance with the provisions ofGovernmental Accounting Standards Board Statement No. 53, Accounting and Financial Reporting forDerivative Instruments, this derivative companion instrument is considered a “borrowing” resulting fromthe intrinsic value of the swaption at inception. During the option period, interest accretes at the effectiverate implied by the cash flows on the borrowing at inception. Once the swaption is exercised, andbecomes an active swap, a portion of the swap interest payments are attributed to principal and interestpayments on the borrowing.
On September 3, 2005, UBS AG advised the Authority that it was exercising its option on this swaption asof January 1, 2006. As a result, UBS AG paid the Authority $7,144 on January 3, 2006 as an exercisepremium, which has been recorded as a deferred revenue and is being amortized as interest revenueover the life of the interest rate swap agreement. The Authority made its initial net monthly swap paymentin February 2006. The Authority is current on its monthly net swap interest payments to UBS AG, whichhave totaled $15.1 million in 2012.
On June 21, 2012, Moody’s downgraded UBS’ long-term ratings from Aa3 to A2. The ratings of thecounterparty (UBS AG) to the 1995 Revenue Bonds Swap by Moody’s, S&P, and Fitch are A2, A, and A,respectively, as of December 31, 2012. As of December 31, 2012, the 1995 Revenue Bond Swaptionhad a mark- to- mark value of ($99,317).
The following schedule represents the accretion of interest and amortization of the premium paymentpayable – derivative companion instrument through the term of the interest rate swap agreement, at aneffective interest rate of 4.62324%:
ImputedYear Ending Beginning Interest Debt Ending
December 31, Balance Accrual Payment Balance
2013 15,466$ 715$ (2,508)$ 13,673$2014 13,673 632 (2,371) 11,9342015 11,934 552 (2,226) 10,2602016 10,260 474 (2,073) 8,6612017 8,661 401 (1,911) 7,151
2018-2022 7,151 1,058 (6,811) 1,3982023-2025 1,398 110 (1,508) -
1999 Revenue Bonds Swaption: On May 2, 2001, the Authority entered into the 1999 Revenue BondsSwaption with UBS AG in the initial notional amount of $403,035. Under the 1999 Revenue BondsSwaption, UBS AG had the option, exercisable 120 days preceding January 1, 2010, January 1, 2011,and January 1, 2012, to elect to have the 1999 Revenue Bonds Swaption commence on the January 1next succeeding the exercise of the option. Under the 1999 Revenue Bonds Swaption, if exercised, (i)UBS AG is obligated to pay periodic payments (payable monthly) to the Authority based upon a variablerate of 66% of the USD-LIBOR-BBA index, and (ii), the Authority is obliged to pay periodic payments(payable monthly) to UBS AG based upon a fixed rate of 5.738% per annum. The periodic interest ratesare applied to the notional amount of the 1999 Revenue Bonds Swaption, which amortizes annually,commencing January 1, 2011, from its initial notional amount. Only the net difference in the periodicpayments is to be exchanged between the Authority and UBS AG.
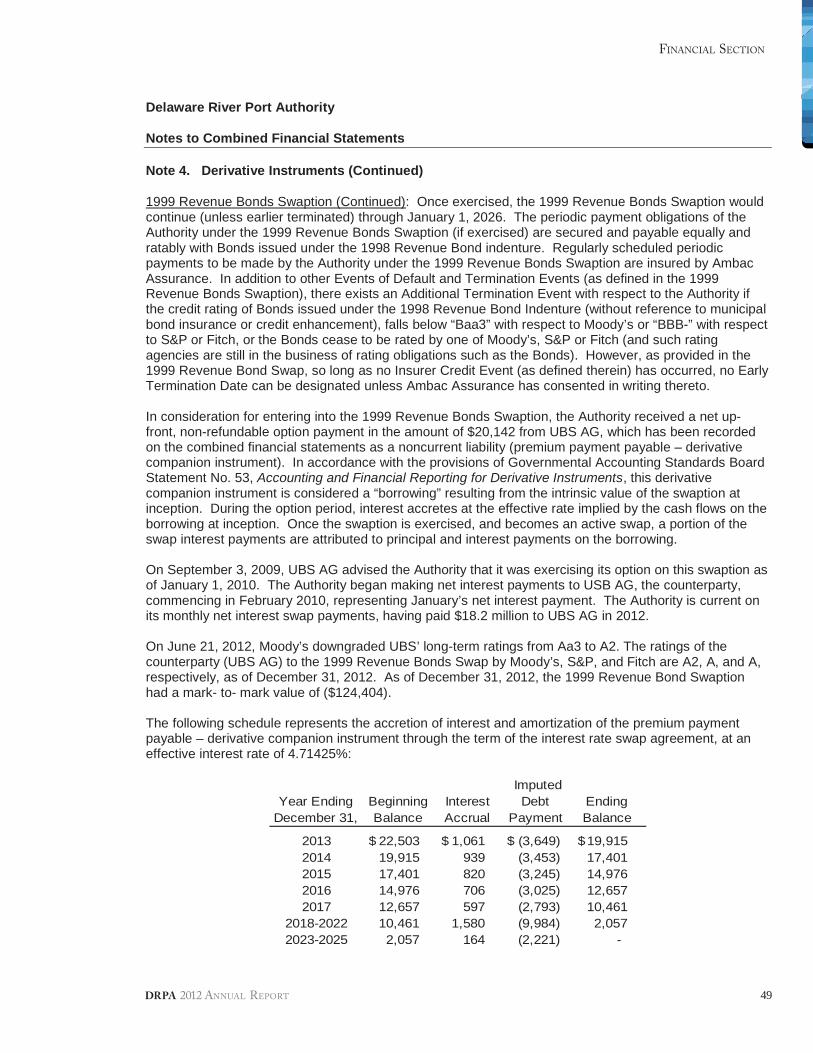
49
FINANCIAL SECTION
DRPA 2012 ANNUAL REPORT
Delaware River Port Authority
Notes to Combined Financial Statements
Note 4. Derivative Instruments (Continued)
1999 Revenue Bonds Swaption (Continued): Once exercised, the 1999 Revenue Bonds Swaption wouldcontinue (unless earlier terminated) through January 1, 2026. The periodic payment obligations of theAuthority under the 1999 Revenue Bonds Swaption (if exercised) are secured and payable equally andratably with Bonds issued under the 1998 Revenue Bond indenture. Regularly scheduled periodicpayments to be made by the Authority under the 1999 Revenue Bonds Swaption are insured by AmbacAssurance. In addition to other Events of Default and Termination Events (as defined in the 1999Revenue Bonds Swaption), there exists an Additional Termination Event with respect to the Authority ifthe credit rating of Bonds issued under the 1998 Revenue Bond Indenture (without reference to municipalbond insurance or credit enhancement), falls below “Baa3” with respect to Moody’s or “BBB-” with respectto S&P or Fitch, or the Bonds cease to be rated by one of Moody’s, S&P or Fitch (and such ratingagencies are still in the business of rating obligations such as the Bonds). However, as provided in the1999 Revenue Bond Swap, so long as no Insurer Credit Event (as defined therein) has occurred, no EarlyTermination Date can be designated unless Ambac Assurance has consented in writing thereto.
In consideration for entering into the 1999 Revenue Bonds Swaption, the Authority received a net up-front, non-refundable option payment in the amount of $20,142 from UBS AG, which has been recordedon the combined financial statements as a noncurrent liability (premium payment payable – derivativecompanion instrument). In accordance with the provisions of Governmental Accounting Standards BoardStatement No. 53, Accounting and Financial Reporting for Derivative Instruments, this derivativecompanion instrument is considered a “borrowing” resulting from the intrinsic value of the swaption atinception. During the option period, interest accretes at the effective rate implied by the cash flows on theborrowing at inception. Once the swaption is exercised, and becomes an active swap, a portion of theswap interest payments are attributed to principal and interest payments on the borrowing.
On September 3, 2009, UBS AG advised the Authority that it was exercising its option on this swaption asof January 1, 2010. The Authority began making net interest payments to USB AG, the counterparty,commencing in February 2010, representing January’s net interest payment. The Authority is current onits monthly net interest swap payments, having paid $18.2 million to UBS AG in 2012.
On June 21, 2012, Moody’s downgraded UBS’ long-term ratings from Aa3 to A2. The ratings of thecounterparty (UBS AG) to the 1999 Revenue Bonds Swap by Moody’s, S&P, and Fitch are A2, A, and A,respectively, as of December 31, 2012. As of December 31, 2012, the 1999 Revenue Bond Swaptionhad a mark- to- mark value of ($124,404).
The following schedule represents the accretion of interest and amortization of the premium paymentpayable – derivative companion instrument through the term of the interest rate swap agreement, at aneffective interest rate of 4.71425%:
ImputedYear Ending Beginning Interest Debt Ending
December 31, Balance Accrual Payment Balance
2013 22,503$ 1,061$ (3,649)$ 19,915$2014 19,915 939 (3,453) 17,4012015 17,401 820 (3,245) 14,9762016 14,976 706 (3,025) 12,6572017 12,657 597 (2,793) 10,461
2018-2022 10,461 1,580 (9,984) 2,0572023-2025 2,057 164 (2,221) -
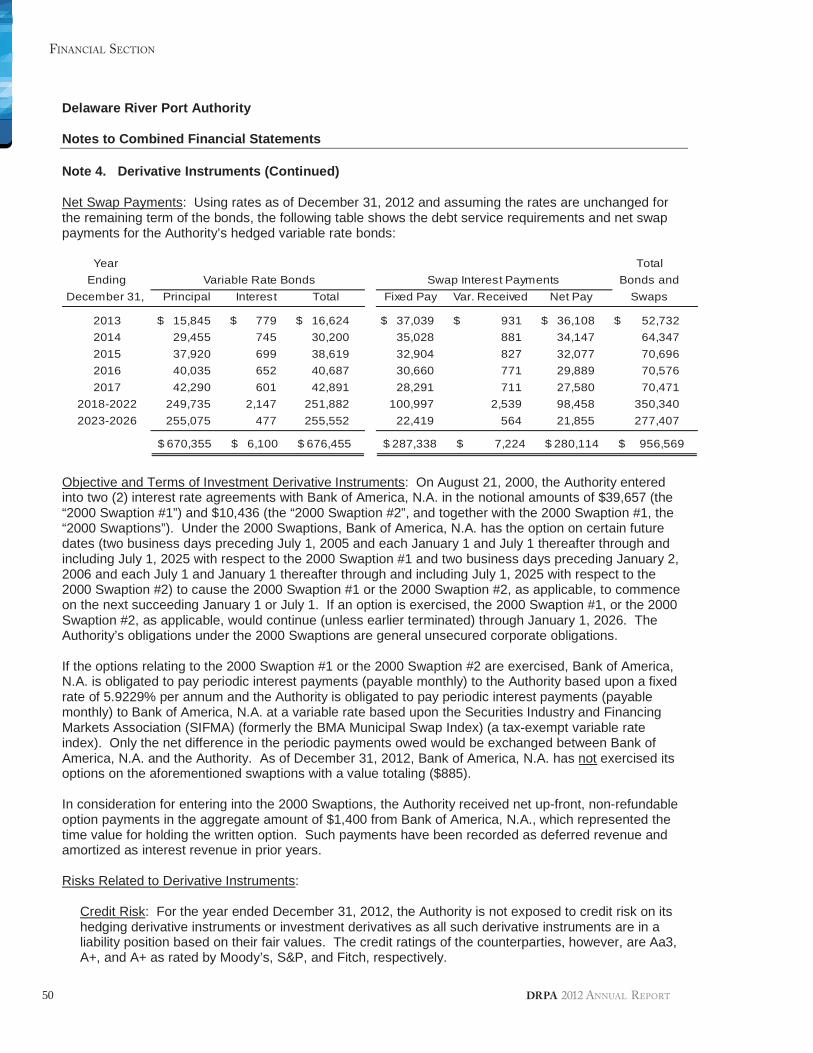
50
FINANCIAL SECTION
DRPA 2012 ANNUAL REPORT
Delaware River Port Authority
Notes to Combined Financial Statements
Note 4. Derivative Instruments (Continued)
Net Swap Payments: Using rates as of December 31, 2012 and assuming the rates are unchanged forthe remaining term of the bonds, the following table shows the debt service requirements and net swappayments for the Authority’s hedged variable rate bonds:
Year TotalEnding Bonds and
December 31, Principal Interest Total Fixed Pay Var. Received Net Pay Swaps
2013 15,845$ 779$ 16,624$ 37,039$ 931$ 36,108$ 52,732$2014 29,455 745 30,200 35,028 881 34,147 64,3472015 37,920 699 38,619 32,904 827 32,077 70,6962016 40,035 652 40,687 30,660 771 29,889 70,5762017 42,290 601 42,891 28,291 711 27,580 70,471
2018-2022 249,735 2,147 251,882 100,997 2,539 98,458 350,3402023-2026 255,075 477 255,552 22,419 564 21,855 277,407
670,355$ 6,100$ 676,455$ 287,338$ 7,224$ 280,114$ 956,569$
Swap Interest PaymentsVariable Rate Bonds
Objective and Terms of Investment Derivative Instruments: On August 21, 2000, the Authority enteredinto two (2) interest rate agreements with Bank of America, N.A. in the notional amounts of $39,657 (the“2000 Swaption #1”) and $10,436 (the “2000 Swaption #2”, and together with the 2000 Swaption #1, the“2000 Swaptions”). Under the 2000 Swaptions, Bank of America, N.A. has the option on certain futuredates (two business days preceding July 1, 2005 and each January 1 and July 1 thereafter through andincluding July 1, 2025 with respect to the 2000 Swaption #1 and two business days preceding January 2,2006 and each July 1 and January 1 thereafter through and including July 1, 2025 with respect to the2000 Swaption #2) to cause the 2000 Swaption #1 or the 2000 Swaption #2, as applicable, to commenceon the next succeeding January 1 or July 1. If an option is exercised, the 2000 Swaption #1, or the 2000Swaption #2, as applicable, would continue (unless earlier terminated) through January 1, 2026. TheAuthority’s obligations under the 2000 Swaptions are general unsecured corporate obligations.
If the options relating to the 2000 Swaption #1 or the 2000 Swaption #2 are exercised, Bank of America,N.A. is obligated to pay periodic interest payments (payable monthly) to the Authority based upon a fixedrate of 5.9229% per annum and the Authority is obligated to pay periodic interest payments (payablemonthly) to Bank of America, N.A. at a variable rate based upon the Securities Industry and FinancingMarkets Association (SIFMA) (formerly the BMA Municipal Swap Index) (a tax-exempt variable rateindex). Only the net difference in the periodic payments owed would be exchanged between Bank ofAmerica, N.A. and the Authority. As of December 31, 2012, Bank of America, N.A. has not exercised itsoptions on the aforementioned swaptions with a value totaling ($885).
In consideration for entering into the 2000 Swaptions, the Authority received net up-front, non-refundableoption payments in the aggregate amount of $1,400 from Bank of America, N.A., which represented thetime value for holding the written option. Such payments have been recorded as deferred revenue andamortized as interest revenue in prior years.
Risks Related to Derivative Instruments:
Credit Risk: For the year ended December 31, 2012, the Authority is not exposed to credit risk on itshedging derivative instruments or investment derivatives as all such derivative instruments are in aliability position based on their fair values. The credit ratings of the counterparties, however, are Aa3,A+, and A+ as rated by Moody’s, S&P, and Fitch, respectively.
51
FINANCIAL SECTION
DRPA 2012 ANNUAL REPORT
Delaware River Port Authority
Notes to Combined Financial Statements
Note 4. Derivative Instruments (Continued)
Risks Related to Derivative Instruments (Continued):
Interest Rate Risk: The Authority is exposed to interest rate risk on its derivative instruments. On itspay-variable, received-fixed interest rate swaptions, as the Securities Industry and Financing MarketsAssociation (SIFMA) rate increases, the Authority’s net payments on the swaptions, if exercised,increases. On its pay-fixed, receive-variable interest rate swaps, as the LIBOR rate decreases, theAuthority’s net payments on the swaps increases. While the Authority’s net payments may increase,these increases are partially offset by the variable rate bonds rate.
Basis Risk: The Authority is exposed to basis risk on its pay-fixed interest rate swap hedgingderivative instruments because the variable-rate payments received by the Authority on these hedgingderivative instruments are based on a rate or index other than interest rates the Authority pays on itshedged variable-rate debt, which is remarketed every five (5) days.
Termination Risk: The Authority or its counterparties may terminate a derivative instrument if the otherparty fails to perform under the terms of the contract.
Rollover Risk: The Authority is not exposed to rollover risk on its hedging derivative instruments. TheAuthority’s hedging derivative instruments terminate on the same day as the hedged debt matures,unless the Authority opts for earlier termination.
Market-Access Risk: If a particular option is exercised and refunding bonds are not issued, theaffected series of bonds would not be refunded, and the Authority would make net swap payments asrequired by the terms of the applicable aforementioned contracts. If the option is exercised and thevariable-rate bonds issued, the actual difference ultimately recognized by the transaction will beaffected by the relationship between the interest rate terms of the to-be-issued variable-rate bondsversus the payment as stipulated in the swaption agreement.
Swap Management Policy: On December 28, 2009, the Authority’s Board approved a resolution(DRPA#09-099, entitled “Use Debt-Related Swap Agreements”) which, among other things, declared: (i)“that it is the direction and intention of the Board that the DRPA not enter into any new debt-related swapagreements...”, and (ii) that the staff of the Authority” takes all steps necessary to immediately begin theprocess of recommending to the Board whether, when, and how to terminate the Authority’s currentswaps, with all such terminations, if determined to be advisable, to occur in a methodical and carefulmanner which avoids to the fullest extent possible additional costs or risks may be associated withtermination; and that staff report to the Finance Committee of the Board on a monthly basis the status ofall current swap agreements…”
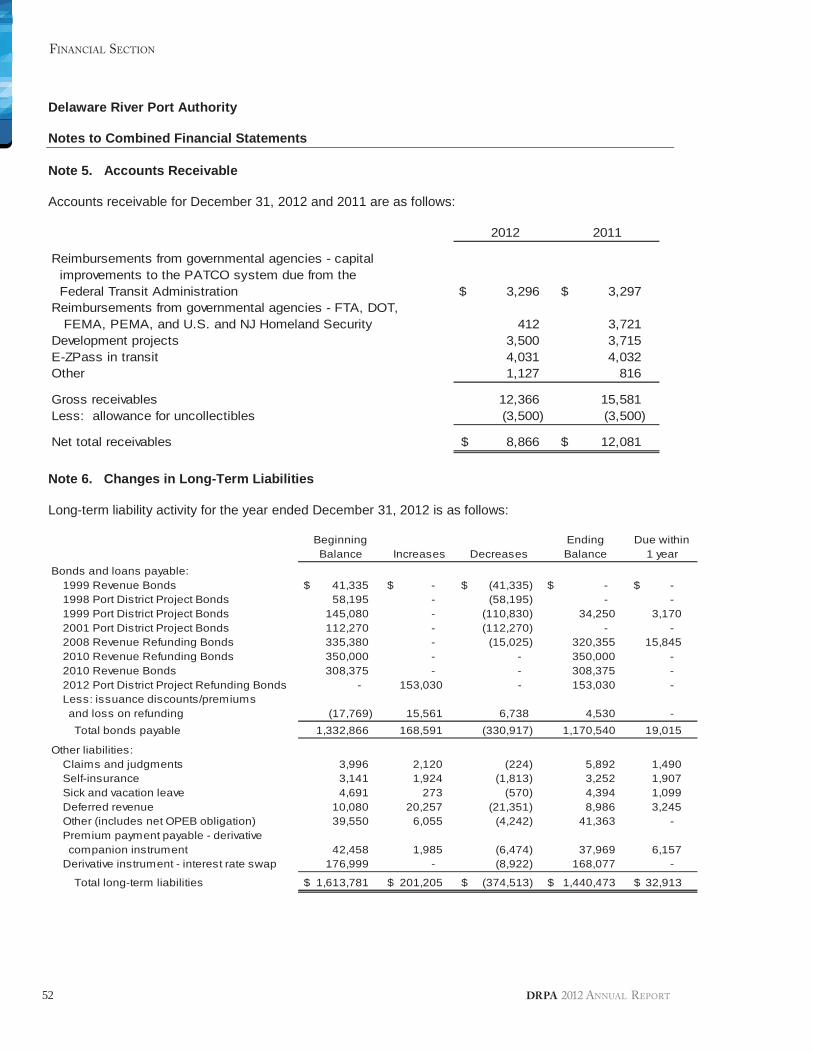
52
FINANCIAL SECTION
DRPA 2012 ANNUAL REPORT
Delaware River Port Authority
Notes to Combined Financial Statements
Note 5. Accounts Receivable
Accounts receivable for December 31, 2012 and 2011 are as follows:
2012 2011
Reimbursements from governmental agencies - capitalimprovements to the PATCO system due from theFederal Transit Administration 3,296$ 3,297$
Reimbursements from governmental agencies - FTA, DOT,FEMA, PEMA, and U.S. and NJ Homeland Security 412 3,721
Development projects 3,500 3,715E-ZPass in transit 4,031 4,032Other 1,127 816
Gross receivables 12,366 15,581Less: allowance for uncollectibles (3,500) (3,500)
Net total receivables 8,866$ 12,081$
Note 6. Changes in Long-Term Liabilities
Long-term liability activity for the year ended December 31, 2012 is as follows:
Beginning Ending Due withinBalance Increases Decreases Balance 1 year
Bonds and loans payable:1999 Revenue Bonds 41,335$ -$ (41,335)$ -$ -$1998 Port District Project Bonds 58,195 - (58,195) - -1999 Port District Project Bonds 145,080 - (110,830) 34,250 3,1702001 Port District Project Bonds 112,270 - (112,270) - -2008 Revenue Refunding Bonds 335,380 - (15,025) 320,355 15,8452010 Revenue Refunding Bonds 350,000 - - 350,000 -2010 Revenue Bonds 308,375 - - 308,375 -2012 Port District Project Refunding Bonds - 153,030 - 153,030 -Less: issuance discounts/premiumsand loss on refunding (17,769) 15,561 6,738 4,530 -Total bonds payable 1,332,866 168,591 (330,917) 1,170,540 19,015
Other liabilities:Claims and judgments 3,996 2,120 (224) 5,892 1,490Self-insurance 3,141 1,924 (1,813) 3,252 1,907Sick and vacation leave 4,691 273 (570) 4,394 1,099Deferred revenue 10,080 20,257 (21,351) 8,986 3,245Other (includes net OPEB obligation) 39,550 6,055 (4,242) 41,363 -Premium payment payable - derivativecompanion instrument 42,458 1,985 (6,474) 37,969 6,157
Derivative instrument - interest rate swap 176,999 - (8,922) 168,077 -
Total long-term liabilities 1,613,781$ 201,205$ (374,513)$ 1,440,473$ 32,913$
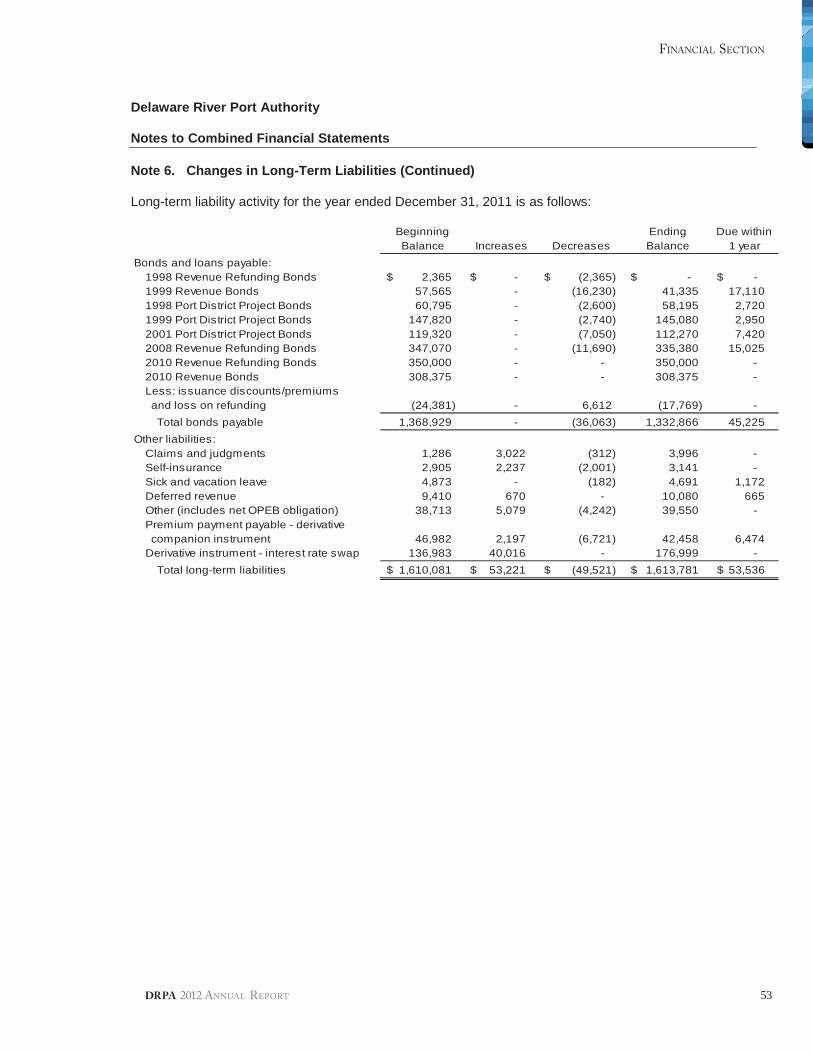
53
FINANCIAL SECTION
DRPA 2012 ANNUAL REPORT
Delaware River Port Authority
Notes to Combined Financial Statements
Note 6. Changes in Long-Term Liabilities (Continued)
Long-term liability activity for the year ended December 31, 2011 is as follows:
Beginning Ending Due withinBalance Increases Decreases Balance 1 year
Bonds and loans payable:1998 Revenue Refunding Bonds 2,365$ -$ (2,365)$ -$ -$1999 Revenue Bonds 57,565 - (16,230) 41,335 17,1101998 Port District Project Bonds 60,795 - (2,600) 58,195 2,7201999 Port District Project Bonds 147,820 - (2,740) 145,080 2,9502001 Port District Project Bonds 119,320 - (7,050) 112,270 7,4202008 Revenue Refunding Bonds 347,070 - (11,690) 335,380 15,0252010 Revenue Refunding Bonds 350,000 - - 350,000 -2010 Revenue Bonds 308,375 - - 308,375 -Less: issuance discounts/premiumsand loss on refunding (24,381) - 6,612 (17,769) -Total bonds payable 1,368,929 - (36,063) 1,332,866 45,225
Other liabilities:Claims and judgments 1,286 3,022 (312) 3,996 -Self-insurance 2,905 2,237 (2,001) 3,141 -Sick and vacation leave 4,873 - (182) 4,691 1,172Deferred revenue 9,410 670 - 10,080 665Other (includes net OPEB obligation) 38,713 5,079 (4,242) 39,550 -Premium payment payable - derivativecompanion instrument 46,982 2,197 (6,721) 42,458 6,474
Derivative instrument - interest rate swap 136,983 40,016 - 176,999 -Total long-term liabilities 1,610,081$ 53,221$ (49,521)$ 1,613,781$ 53,536$
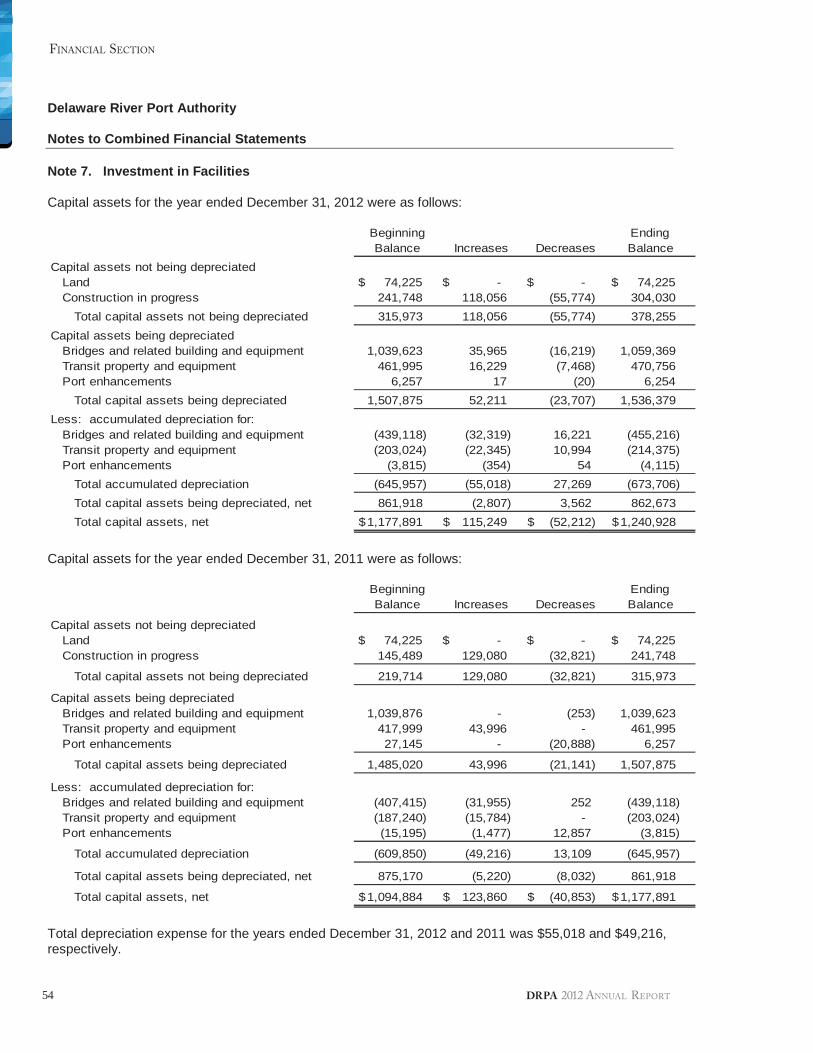
54
FINANCIAL SECTION
DRPA 2012 ANNUAL REPORT
Delaware River Port Authority
Notes to Combined Financial Statements
Note 7. Investment in Facilities
Capital assets for the year ended December 31, 2012 were as follows:
Beginning EndingBalance Increases Decreases Balance
Capital assets not being depreciatedLand 74,225$ -$ -$ 74,225$Construction in progress 241,748 118,056 (55,774) 304,030
Total capital assets not being depreciated 315,973 118,056 (55,774) 378,255Capital assets being depreciated
Bridges and related building and equipment 1,039,623 35,965 (16,219) 1,059,369Transit property and equipment 461,995 16,229 (7,468) 470,756Port enhancements 6,257 17 (20) 6,254
Total capital assets being depreciated 1,507,875 52,211 (23,707) 1,536,379Less: accumulated depreciation for:
Bridges and related building and equipment (439,118) (32,319) 16,221 (455,216)Transit property and equipment (203,024) (22,345) 10,994 (214,375)Port enhancements (3,815) (354) 54 (4,115)
Total accumulated depreciation (645,957) (55,018) 27,269 (673,706)Total capital assets being depreciated, net 861,918 (2,807) 3,562 862,673Total capital assets, net 1,177,891$ 115,249$ (52,212)$ 1,240,928$
Capital assets for the year ended December 31, 2011 were as follows:
Beginning EndingBalance Increases Decreases Balance
Capital assets not being depreciatedLand 74,225$ -$ -$ 74,225$Construction in progress 145,489 129,080 (32,821) 241,748
Total capital assets not being depreciated 219,714 129,080 (32,821) 315,973
Capital assets being depreciatedBridges and related building and equipment 1,039,876 - (253) 1,039,623Transit property and equipment 417,999 43,996 - 461,995Port enhancements 27,145 - (20,888) 6,257
Total capital assets being depreciated 1,485,020 43,996 (21,141) 1,507,875
Less: accumulated depreciation for:Bridges and related building and equipment (407,415) (31,955) 252 (439,118)Transit property and equipment (187,240) (15,784) - (203,024)Port enhancements (15,195) (1,477) 12,857 (3,815)
Total accumulated depreciation (609,850) (49,216) 13,109 (645,957)
Total capital assets being depreciated, net 875,170 (5,220) (8,032) 861,918
Total capital assets, net 1,094,884$ 123,860$ (40,853)$ 1,177,891$
Total depreciation expense for the years ended December 31, 2012 and 2011 was $55,018 and $49,216,respectively.
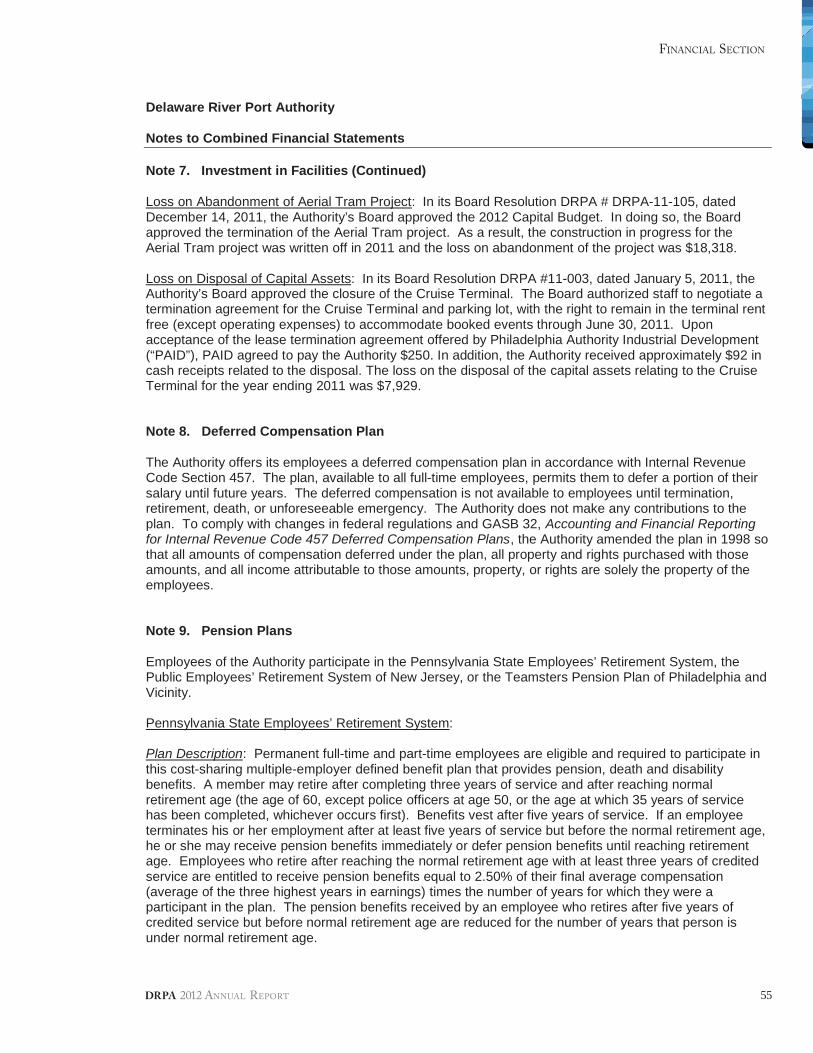
55
FINANCIAL SECTION
DRPA 2012 ANNUAL REPORT
Delaware River Port Authority
Notes to Combined Financial Statements
Note 7. Investment in Facilities (Continued)
Loss on Abandonment of Aerial Tram Project: In its Board Resolution DRPA # DRPA-11-105, datedDecember 14, 2011, the Authority’s Board approved the 2012 Capital Budget. In doing so, the Boardapproved the termination of the Aerial Tram project. As a result, the construction in progress for theAerial Tram project was written off in 2011 and the loss on abandonment of the project was $18,318.
Loss on Disposal of Capital Assets: In its Board Resolution DRPA #11-003, dated January 5, 2011, theAuthority’s Board approved the closure of the Cruise Terminal. The Board authorized staff to negotiate atermination agreement for the Cruise Terminal and parking lot, with the right to remain in the terminal rentfree (except operating expenses) to accommodate booked events through June 30, 2011. Uponacceptance of the lease termination agreement offered by Philadelphia Authority Industrial Development(“PAID”), PAID agreed to pay the Authority $250. In addition, the Authority received approximately $92 incash receipts related to the disposal. The loss on the disposal of the capital assets relating to the CruiseTerminal for the year ending 2011 was $7,929.
Note 8. Deferred Compensation Plan
The Authority offers its employees a deferred compensation plan in accordance with Internal RevenueCode Section 457. The plan, available to all full-time employees, permits them to defer a portion of theirsalary until future years. The deferred compensation is not available to employees until termination,retirement, death, or unforeseeable emergency. The Authority does not make any contributions to theplan. To comply with changes in federal regulations and GASB 32, Accounting and Financial Reportingfor Internal Revenue Code 457 Deferred Compensation Plans, the Authority amended the plan in 1998 sothat all amounts of compensation deferred under the plan, all property and rights purchased with thoseamounts, and all income attributable to those amounts, property, or rights are solely the property of theemployees.
Note 9. Pension Plans
Employees of the Authority participate in the Pennsylvania State Employees’ Retirement System, thePublic Employees’ Retirement System of New Jersey, or the Teamsters Pension Plan of Philadelphia andVicinity.
Pennsylvania State Employees’ Retirement System:
Plan Description: Permanent full-time and part-time employees are eligible and required to participate inthis cost-sharing multiple-employer defined benefit plan that provides pension, death and disabilitybenefits. A member may retire after completing three years of service and after reaching normalretirement age (the age of 60, except police officers at age 50, or the age at which 35 years of servicehas been completed, whichever occurs first). Benefits vest after five years of service. If an employeeterminates his or her employment after at least five years of service but before the normal retirement age,he or she may receive pension benefits immediately or defer pension benefits until reaching retirementage. Employees who retire after reaching the normal retirement age with at least three years of creditedservice are entitled to receive pension benefits equal to 2.50% of their final average compensation(average of the three highest years in earnings) times the number of years for which they were aparticipant in the plan. The pension benefits received by an employee who retires after five years ofcredited service but before normal retirement age are reduced for the number of years that person isunder normal retirement age.
56
FINANCIAL SECTION
DRPA 2012 ANNUAL REPORT
Delaware River Port Authority
Notes to Combined Financial Statements
Note 9. Pension Plans (Continued)
Pennsylvania State Employees’ Retirement System (Continued):
Plan Description (Continued): Pension provisions include death benefits, under which the survivingbeneficiary may be entitled to receive the employee’s accumulated contributions less the amount ofpension payments that the employee received, the present value of the employees’ account at retirementless the amount of pension benefits received by the employee, the same pension benefits formerlyreceived by the employee, or one-half of the monthly pension payment formerly received by theemployee. The maximum pension benefit to the employee previously described may be reduceddepending on the benefits elected for the surviving beneficiary.
The Pennsylvania State Employees’ Retirement System issues a publicly available annual financialreport, including financial statements, which may be obtained by writing to Pennsylvania StateEmployees’ Retirement System, 30 North Third Street, Harrisburg, Pennsylvania 17108-1147.
Funding Policy: The contribution requirements of plan members and the Authority are established andamended by the Pennsylvania State Employees’ Retirement System Board. As of January 1, 2002,employees are required to contribute 6.25% of their gross earnings to the plan. The Authority wasrequired to, and did, contribute an actuarially determined amount to the plan, which equaled 9.42%,6.03%, and 4.18%, of covered payroll in 2012, 2011 and 2010, respectively. In 2012, 2011 and 2010, theAuthority’s required contributions to the plan were $4,084, $2,604 and $1,817, respectively, whichrepresented 100% of the required contribution for the aforementioned years.
New Jersey Public Employees Retirement System (NJ PERS):
Plan Description: Permanent full-time employees, hired after January 1, 2002, who were members ofNJPERS when they were hired, are eligible to participate in the cost-sharing multiple-employer definedbenefit plan (administered by the New Jersey Division of Pensions and Benefits). The PERS wasestablished in 1955. The PERS provides retirement, death and disability, and medical benefits toqualified members. Vesting and benefit provisions are established by N.J.S.A. 43:15A and 43:3B.
Funding Policy: The contribution requirements of plan members are determined by State statute. Inaccordance with Chapter 92, P.L. 2007 and Chapter 103, P.L. 2007, plan members enrolled in the PublicEmployees’ Retirement System were required to contribute 5.5% of their annual covered salary, effectiveJuly 1, 2007. However, under the new provisions of Chapter 78, P.L. 2011, employee pensioncontribution rates will be increased by the following amounts: the employee pension contribution rate willincrease from 5.5% to 6.5% of salary, effective October 1, 2011. An additional increase to be phased overthe next 7 years will bring the total pension contribution rate to 7.5% of salary. The phased increase from6.5% to 7.5% will be applied equally over a 7-year period beginning July 1, 2012. The contribution ratewill increase by 0.14% each year with the first payroll of July 2012 until the 7.5% contribution rate isreached in July 2018. The State Treasurer has the right under the current law to make temporaryreductions in member rates based on the existence of surplus pension assets in the retirement system;however, the statute also requires the return to the normal rate when such surplus pension assets nolonger exist. The Authority is billed annually for its normal contribution, plus any accrued liability. TheAuthority began sending employee contributions to NJ PERS beginning in January 2006. The fiscal year2008 was the first year that the Authority was required to, and did, contribute an actuarially determinedamount to the plan. For the years ended December 31, 2012, 2011, and 2010, the Authority’s totalcontribution to the plan was $117, $135 and $197, respectively, which represented 100% of the requiredcontribution for the aforementioned years. For the years ended December 31, 2012, 2011 and 2010, thecontributions consisted of a normal contribution amount of $33, $45 and $80, respectively and an accruedliability amount of $84, $90 and $117, respectively.
57
FINANCIAL SECTION
DRPA 2012 ANNUAL REPORT
Delaware River Port Authority
Notes to Combined Financial Statements
Note 9. Pension Plans (Continued)
Teamsters Pension Plan of Philadelphia and Vicinity:
Plan Description: Certain represented employees are eligible and required to participate in theTeamsters Pension Plan of Philadelphia and Vicinity, which is a cost-sharing, multiple-employer benefitplan which provides pension, death and disability benefits. A member may retire at the later of (a) thedate the employee reaches 65 or (b) the tenth anniversary of the employee’s commencement ofparticipation in the plan. Additionally, employees are eligible for early retirement after 10 years ofparticipation in the plan and (a) completion of 30 years of vested service or (b) attainment of age 50 andcompletion of 10 years of vested service. Benefits vest after 10 years of service. An employee whoretires on or after his or her normal retirement age is entitled to receive benefits based on his or hercredited years of service multiplied by a monthly benefit rate, which is determined based on theemployer’s daily contributions. The benefits are subject to maximum rates that vary according toemployer daily contribution rates. Members may also receive benefits after early retirement at reducedrates depending on age at retirement.
An employee who qualifies for disability retirement benefits (total and permanent disability with 10 yearsof vested service and 5 years of continuous service with at least 300 covered days of contributions) isentitled to receive two hundred dollars per month until retirement age, when retirement benefits wouldcommence.
Provisions include surviving spouse death benefits, under which the surviving spouse is entitled to a 50%survivor annuity in certain cases.
The Teamsters Pension Plan of Philadelphia and Vicinity issues a publicly available annual financialreport, including financial statements, which may be obtained by writing to Teamsters Pension Plan ofPhiladelphia and Vicinity, Fourth and Cherry Streets, Philadelphia, Pennsylvania 19106.
Funding Policy: The Teamsters Pension Plan is controlled by the Teamsters Pension Plan ofPhiladelphia and Vicinity Board. The employer’s contribution requirements are determined under theterms of one Collective Bargaining Agreement in force between the employer and the Teamsters. During2012, the Authority was required to and did contribute twenty-one dollars and eighty cents ($21.80) perday for each PATCO participating employee. The Authority’s contributions totaled 8.22%, 9.81% and9.6% of covered payroll in 2012, 2011 and 2010, respectively. The employees of the Authority make nocontributions to the plan. The Authority contributed $1,076, $1,077 and $1,090 in 2012, 2011 and 2010,respectively, which represented 100% of the required contribution for the aforementioned years.
Note 10. Post-Employment Healthcare Plan
Plan Description: The Authority provides certain health care and life insurance benefits for retiredemployees, where such benefits are established and amended by the Authority’s Board ofCommissioners. The Authority’s plan provides two agent multiple-employer post-employment healthcareplans which cover two retiree populations: eligible retirees under the age of sixty-five (65) receivebenefits through Amerihealth and eligible retirees sixty-five (65) and over receive benefits through theUnited Health Group (in partnership with AARP) and Aetna. Life insurance benefits to qualifying retireesare provided through Prudential. The plans are administered by the Authority; therefore, premiumpayments are made directly by the Authority to the insurance carriers.
58
FINANCIAL SECTION
DRPA 2012 ANNUAL REPORT
Delaware River Port Authority
Notes to Combined Financial Statements
Note 10. Post-Employment Healthcare Plan (Continued)
Funding Policy: Employees become eligible for retirement benefits based on hire date and years ofservice. For employees hired after January 1, 2007, no subsidized retiree benefits are offered. Thecontribution requirements of plan members and the Authority are established and may be amended bythe Authority’s Board of Commissioners. Plan members receiving benefits contribute the followingamounts: $65 per month for retiree-only coverage for the base plan, $130 per month for retiree/spouse(or retiree/child) coverage, and $195 per month for retiree/family (or children) coverage to age sixty-five(65) for the base plan, and $55 per month per retiree, per dependent for both the United Health Group (inpartnership with AARP) and Aetna coverages. An additional amount is required for those retirees, underage sixty-five (65), who opt to participate in the “buy-up plan” for retirees and their dependents.
Retirees: The Authority presently funds its current retiree post employment benefit costs on a “pay-as-you-go” basis and, as shown above, receives annual contributions from retirees to offset a portion of thisannual cost. The Authority’s contributions to the plan for the years ended 2012, 2011 and 2010 were$4,242, $4,242 and $4,256, respectively.
Future Retirees: In accordance with Statement No.45 of the Government Accounting Standards Board,the Authority is required to expense the annual required contribution of the employer (ARC), an amountactuarially determined in accordance with the parameters of Statement No. 45. The ARC represents alevel of funding that, if paid on an ongoing basis, is projected to cover normal cost each year andamortize any unfunded actuarial liabilities (or funding excess) over a period not to exceed thirty (30)years. The ARC includes the costs of both current and future retirees. The current ARC was determinedto be $5,347 at an unfunded discount rate of 5%. As stated above, the Authority has funded the cost ofexisting retirees in the amount of $4,242, and in 2012, the Authority has accrued the benefit costs forfuture eligible employees, but has not yet begun funding this outstanding liability. The Authority plans tobegin funding a portion of this outstanding liability during the third quarter of 2013.
Annual OPEB Cost: The Authority’s annual required contribution (ARC), the interest on the net OPEBobligation, the adjustment to the ARC, the increase or decrease in the net OPEB obligation, the netOPEB obligation, and the percentage of annual OPEB cost contributed to the plan for 2012, 2011 and2010 are as follows:
2012 2011 2010
Annual Required Contribution (ARC) 5,347$ 5,230$ 13,763$Interest on the net OPEB Obligation 1,978 1,897 1,439Adjustment to the ARC (1,270) (1,270) (1,782)
Annual OPEB Cost 6,055 5,857 13,420Pay as You Go Cost (Existing Retirees) (4,242) (4,242) (4,256)
Increase (Decrease) in the Net OPEB Obligation 1,813 1,615 9,164
Net OPEB Obligation, January 1 39,550 37,935 28,771
Net OPEB Obligation, December 31 41,363$ 39,550$ 37,935$
Percentage of Annual OPEB Cost Contributed 70% 72% 32%
Funded Status and Funding Progress: As of January 1, 2011, the most recent actuarial valuation date,the Authority’s Plan was 0% funded. The actuarial accrued liability for benefits was $113,422, and theactuarial value of plan assets was $0, resulting in an unfunded actuarial accrued liability (UAAL) of$113,422. The covered payroll (annual payroll of active employees covered by the plan) was $56,820and the ratio of the UAAL to the covered payroll was 199.6%. (For additional information, please refer tothe “Required Supplementary Information Schedule of Funding Progress for Health Benefits Plan” shownat the end of the footnote section.) Actuarial valuations of an ongoing plan involve estimates of the valueof reported amounts and assumptions about the probability of occurrence of events far into the future.
59
FINANCIAL SECTION
DRPA 2012 ANNUAL REPORT
Delaware River Port Authority
Notes to Combined Financial Statements
Note 10. Post-Employment Healthcare Plan (Continued)
Funded Status and Funding Progress (Continued): Examples include assumptions about futureemployment, mortality and the healthcare cost trend. Amounts determined regarding the funded status ofthe plan and the annual required contributions of the employer are subject to continual revision as actualresults are compared with past expectations and new estimates are made about the future. The scheduleof funding progress, presented as required supplementary information following the notes to the financialstatements, presents multiyear trend information that shows whether the actuarial value of the planassets is increasing or decreasing over time relative to the actuarial accrued liabilities for benefits.
Actuarial Methods and Assumptions: Projections of benefits for financial reporting purposes are based onthe substantive plan (the plan as understood by the employer and plan members) and include the typesof benefits provided at the time of each valuation and the historical pattern of sharing benefit costsbetween the employer and plan members to that point. The actuarial methods and assumptions usedinclude techniques that are designed to reduce short-term volatility in actuarial accrued liabilities and theactuarial value of assets, consistent with the long-term perspective of the calculations.
In the January 1, 2011 actuarial valuation, the projected unit credit actuarial cost method was used.Under this method an actuarial accrued liability is determined as the actuarial present value of the portionof projected benefits which is allocated to service before the current plan year. In addition, a normal costis determined as the actuarial present value of the portion of projected benefits which is allocated toservice in the current plan year for each active participant under the assumed retirement age. The UAALis being amortized (straight-line) for thirty (30) year on an open basis. The actuarial assumptionsincluded the following:
Mortality: The mortality table employed in the valuation was the RP2000 Table Male and Female.
Discount Rate: Future costs have been discounted at the rate of 5.00% compounded annually forGASB 45 purposes.
Turnover: Assumptions for terminations of employment other than for death or retirement will vary byage and years of service with rates of turnover based on State Employees Retirement System ofPennsylvania.
Disability: No terminations of employment due to disability were assumed. Retirees resulting from adisability were factored into the determination of age at retirement.
Age of Retirement: The assumption that the active participants, on average, will receive their benefitswhen eligible, but no earlier than age 55.
Spousal Coverage: Married employees will remain married.
Prior Service: No prior service for active employees was assumed.
Health Care Cost Trend Rate:
Year Pre-65 Post 65Initial Trend 01/01/13 to 01/01/17 10.0% 10.0%Ultimate Trend 01/01/18 to later 5.0% 5.0%Grading Per Year 1.0% 1.0%
Projected Salary Increase: Annual salary increase is 2.5%.
Administration Expenses: The annual cost to administer the retiree claims was assumed at 2.5%which was included in the annual health care costs.
60
FINANCIAL SECTION
DRPA 2012 ANNUAL REPORT
Delaware River Port Authority
Notes to Combined Financial Statements
Note 10. Post-Employment Healthcare Plan (Continued)
Actuarial Methods and Assumptions (Continued):
Employee Contributions: It was assumed that employees will contribute two thousand three hundredforty-five dollars ($2,345) per year for family medical coverage and seven hundred ninety-two dollars($792) for single medical coverage.
Change in Assumptions: Effective January 1, 2011, assumptions were changed for mortality, medicaltrend costs and turnover.
Note 11. Indentures of Trust
The Authority is subject to the provisions of the following indentures of Trust: Revenue Refunding Bondsof 1998 with TD Bank, N.A. (as successor trustee to Commerce Bank, N.A.), dated July 1, 1998; and theRevenue Bonds of 1999 with TD Bank, N.A., dated December 1, 1999; the Revenue Refunding Bonds of2008, with TD Bank, N.A. as Trustee, dated July 25, 2008 and the Revenue Refunding Bonds of 2010and the 2010 Revenue Bonds (Series D), with TD Bank, N.A. as Trustee dated May 15, 2010 and July15, 2010, respectively (collectively the “Bond Resolution”); the Port District Project Bonds of 1998 withThe Bank of New York Mellon (as successor trustee to U.S. Trust Company of New Jersey), datedAugust 15, 1998; the Port District Bonds of 1999 with The Bank of New York Mellon (as successor trusteeto Summit Bank), dated December 1, 1999; the Port District Project Bonds of 2001 with TD Bank, N.A.,dated December 1, 2001 and the 2012 Port District Project Refunding Bonds with TD Bank, N.A., datedDecember 1, 2012. The Bond Resolution requires the maintenance of the following accounts:
Project Fund: This restricted account was established in accordance with Section 6.02 of the BondResolution. The Project Fund is held by the Trustee and is applied to pay the cost of the Projects andis pledged, pending application to such payment of costs for the security of the payment of principaland interest on the Revenue, Revenue Refunding, and Project Bonds (the “Bonds”).
Debt Service Fund: This restricted account was established in accordance with Section 6.04 of theBond Resolution for the payment of maturing interest and principal on the Bonds. The balance ondeposit must be sufficient to enable the Trustee to withdraw amounts equal to interest due on theBonds, principal amounts maturing on Bonds, accrued interest included in the purchase price of thebonds purchased for retirement, and sinking fund installments when payments are required.
Debt Service Reserve Fund: This restricted account was established in accordance with Section 6.05of the Bond Resolution. The amount of funds on deposit must be maintained at a level equal to theMaximum Debt Service to insure funds are available for payment of Debt Service.
Bond Redemption Fund: This restricted account was established in accordance with section 6.06 ofthe Bond Resolution to account for amounts received from any source for the redemption of Bonds,other than mandatory sinking fund payments.
Rebate Fund: This restricted account was established in accordance with Section 6.07 of the bondResolution account for amounts deposited from time to time in order to comply with the arbitragerebate requirements of Section 148 of the Code as applicable to any Series of Tax-Exempt Bondsissued.
Revenue Fund: This unrestricted account was established in accordance with Section 6.03 of theBond Resolution for the Authority to deposit all Revenues. On or before the 20th day of each calendarmonth, the Trustee shall, to the extent money is available, after deduction of cash and investmentbalances for the 15% working capital reserve, transfer to or credit funds needed in the following order:(1) the Debt Service Fund, (2) the Debt Service Reserve Fund, (3) any Reserve Fund Credit FacilityIssuer, (4) the Trustee’s Rebate Fund, (5) the Maintenance Reserve Fund, (6) the General Fund.
61
FINANCIAL SECTION
DRPA 2012 ANNUAL REPORT
Delaware River Port Authority
Notes to Combined Financial Statements
Note 11. Indentures of Trust (Continued)
Maintenance Reserve Fund: This restricted account was established in accordance with Section 6.08of the Bond Resolution. These funds are maintained for reasonable and necessary expenses withrespect to the system for major repairs, renewals, replacements, additions, betterments,enlargements, improvements and extraordinary expenses, all to the extent not provided for in thethen current Annual Budget. Money in this account is pledged for the security of payment principaland interest on the bonds. Whenever the amount in this account exceeds the “Maintenance ReserveFund Requirement”, the excess shall be deposited in the General Fund. The “Maintenance ReserveFund Requirement” on any date is at least $3,000.
General Fund: This unrestricted account was established in accordance with Section 6.09 of theBond Resolution. All excess funds of the Authority are recorded in the General Account. If theAuthority is not in default in the payment of bond principal or interest and all fund requirements aresatisfied, the excess funds may be used by the Authority for any lawful purpose.
Note 12. Funded and Long-Term Debt
At December 31, 2012, the Authority had $1,170,540 in Revenue, Revenue Refunding, and Port DistrictProject Bonds outstanding, consisting of bonds issued in 1999, 2008, 2010 and 2012. The 1998 PortDistrict Project Bonds were issued pursuant to an Indenture of Trust dated August 15, 1998. The 1999Revenue Bonds were issued pursuant to the Indenture of Trust dated July 1, 1998, a SecondSupplemental Indenture dated August 15, 1998, and a Third Supplemental Indenture dated December 1,1999. The 1999 Port District Project Bonds were issued to an Indenture of Trust dated December 1,1999. The 2001 Port District Project Bonds were issued pursuant to an Indenture of Trust datedDecember 1, 2001. The 2008 Revenue Refunding Bonds were issued pursuant to the Indenture of Trustdated July 1, 1998, as supplemented by a Fourth Supplemental Indenture dated October 1, 2007 and aFifth Supplemental Indenture dated July 15, 2008. The 2010 Revenue Refunding Bonds were issuedpursuant to an Indenture of Trust dated as of July 1, 1998 as previously supplemented by fivesupplemental indentures thereto and as further supplemented by a Sixth Supplemental Indenture datedas of March 15, 2010. The 2010 Revenue Bonds were issued pursuant to the Compact, the New JerseyAct, the Pennsylvania Act (as such terms are defined herein) and an Indenture of Trust, dated as of July1, 1998, by and between the Authority and TD Bank, N.A., Cherry Hill, as successor to Commerce Bank,N.A. (the “Trustee”), as supplemented by a First Supplemental Indenture, dated as of July 1, 1998, aSecond Supplemental Indenture, dated as of August 15, 1998, a Third Supplemental Indenture, dated asof December 1, 1999, a Fourth Supplemental Indenture, dated as of October 1, 2007, a FifthSupplemental Indenture, dated as of July 15, 2008, a Sixth Supplemental Indenture, dated as of March15, 2010, and a Seventh Supplemental Indenture, dated as of July 1, 2010 (collectively, the “1998Revenue Bond Indenture”). The 2012 Port District Project Refunding Bonds were issued pursuant to anIndenture of Trust dated December 1, 2012.
1998 Port District Project Bonds (fully redeemed in 2012): On September 2, 1998, the Authority issued$84,705 of Port District Project Bonds, Series of 1998, to provide funds to finance (a) all or a portion ofthe cost of certain economic development and capital projects, including reimbursing the Authority for thecost of economic development projects financed with Authority funds, (b) a deposit to the Port DistrictDebt Service Reserve Fund established under the 1998 Port District Indenture, and (c) all or a portion ofthe costs and expenses of the Authority relating to the issuance and sale of the 1998 Port District Bonds.
62
FINANCIAL SECTION
DRPA 2012 ANNUAL REPORT
Delaware River Port Authority
Notes to Combined Financial Statements
Note 12. Funded and Long-Term Debt (Continued)
1998 Port District Project Bonds (fully redeemed in 2012) (Continued): The 1998 Port District ProjectBonds were general corporate obligations of the Authority. Except as expressly provided in the 1998 PortDistrict Indenture, the 1998 Port District Project Bonds were not secured by a lien or charge on, or pledgeof, any revenue or other assets of the Authority. No tolls, rents, rates or other such charges were pledgedfor the benefit of the 1998 Port District Project Bonds. The 1998 Port District Project Bonds were payablefrom such funds and from other monies of the Authority legally available.
On December 20, 2012, all remaining 1998 Port District Project Bonds were redeemed, prior to maturity,at a redemption price of 100% using proceeds from the issuance of the 2012 Port District ProjectRefunding Bonds.
1999 Revenue Bonds (fully redeemed in 2012): On December 22, 1999, the Authority issued $422,310of Revenue Bonds of 1999 to provide funds, together with other funds available, (i) to finance, refinanceor reimburse a portion of the costs of certain capital projects undertaken or to be undertaken by theAuthority, (ii) to fund a portion of the interest on the 1999 Revenue Bonds during the period ofconstruction and acquisition of the aforesaid projects, (iii) to fund the Debt Service Reserve Requirementfor the 1999 Revenue Bonds, and (iv) to pay the costs of issuance of the 1999 Revenue Bonds.
The 1999 Revenue Bonds were equally and ratably payable solely from and secured by a lien on andsecurity interest in (i) the amounts on deposit in the 1995 General Fund established under the Indentureof Trust dated as of November 15, 1995, as supplemented as of November 15, 1995 (collectively, the“1995 Revenue Bond Indenture”), (ii) the amounts on deposit in the Funds established under the 1998Revenue Bond Indenture, except for the 1998 General Fund and the 1998 Rebate Fund. With thedefeasance of the Authority’s Revenue Bonds, Series of 1995 (the “1995 Revenue Bonds”), and the 1998Revenue Refunding Bonds, the 1999 Revenue Bonds were then secured by a lien on or security interestin the Net Revenue of the Authority.
On June 30, 2010, the Authority partially redeemed $349,360 in bonds with the issuance of $350,000 in2010 Revenue Refunding Bonds. On April 26, 2012, the Authority fully redeemed, prior to maturity, theremaining $24,225 of its 1999 Revenue Bonds.
1999 Port District Project Bonds: On December 22, 1999, the Authority issued $272,095 to provide fundsto finance (a) all or a portion of the cost of certain port improvement and economic development projectswithin the Port District, (b) a deposit of cash or a Reserve Fund Credit Facility to the credit of the DebtService Reserve Fund established under the 1999 Port District Project Bond Indenture and (c) all or aportion of the costs and expenses of the Authority relating to the issuance and sale of the 1999 PortDistrict Project Bonds.
The 1999 Port District Project Bonds are general corporate obligations of the Authority. The 1999 PortDistrict Project Bonds are not secured by a lien or charge on, or pledge of, any revenues or other assetsof the Authority other than the monies, if any, on deposit from time to time in the Funds established underthe 1999 Port District Project Bond Indenture. No tolls, rents, rates or other such charges are pledged forthe benefit of the 1999 Port District Project Bonds. The 1999 Port District Project Bonds are equally andratably secured by the funds on deposit in the Funds established under the 1999 Port District ProjectBond Indenture, except for the Rebate Fund. The 1999 Port District Project Bonds are payable from suchFunds and from other monies of the Authority legally available.
The 1999 Port District Project Bonds are subject to optional redemption and mandatory sinking fundredemption prior to maturity as more fully described herein.
The scheduled payment of principal and interest on the 1999 Port District Project Bonds when due areguaranteed under an insurance policy issued concurrently with the delivery of the 1999 Port DistrictProject Bonds by Financial Security Assurance Inc.
63
FINANCIAL SECTION
DRPA 2012 ANNUAL REPORT
Delaware River Port Authority
Notes to Combined Financial Statements
Note 12. Funded and Long-Term Debt (Continued)
1999 Port District Project Bonds (Continued): On December 20, 2012, all remaining 1999 Series B PortDistrict Project Bonds were redeemed, prior to maturity, at a redemption price of 100% using proceedsfrom the issuance of the 2012 Port District Project Refunding Bonds.
The 1999 Port District Project Bonds outstanding at December 31, 2012 are as follows:
Maturity Date Interest Principal Maturity Date Interest Principal(January 1) Rate/Yield Amount (January 1) Rate/Yield Amount
2013 7.54% 3,170$3,170
2014 7.63% 3,405$ 2018 7.63% 4,5702015 7.63% 3,665 2019 7.63% 4,9202016 7.63% 3,945 2020 7.63% 5,2952017 7.63% 4,245 2021 7.63% 1,035
31,080
Total par value of 1999 Port District Project Bonds 34,250Less unamortized bond discount -
Total 1999 Port District Project Bonds, net 34,250$
Series A Bonds
Term Bonds
Optional Redemption: The Series A Port District Project Bonds are redeemable by the Authority on anyinterest payment date in whole or in part, and if in part, in any order of maturity specified by the Authorityand in any principal amount within a maturity as specified by the Authority. Any such redemption shall bemade at a redemption price equal to accrued interest to the redemption date plus the greater of (i) theprincipal amount of the Series A Port District Project Bonds to be redeemed, and (ii) an amount equal tothe discounted remaining fixed amount payments applicable to the Series A Port District Project Bonds tobe redeemed. Allocation of the amounts of Series A Port District Project Bonds to be redeemed shall beproportionate nearly as reasonably possible having due regard for minimum authorized denominations ofthe 1999 Port District Project Bonds among the respective interest of the holders of the Series A PortDistrict Project Bonds to be redeemed at the time of selection of such Series A Port District Project Bondsfor redemption.
2001 Port District Project Bonds (fully redeemed in 2012): On December 27, 2001, the Authority issued$128,395 of Port District Project Refunding Bonds, Series A of 2001, and $31,180 Port District ProjectBonds, Series B of 2001 (now fully redeemed). The 2001 Port District Project Bonds were issued toprovide funds to finance (a) the current refunding of $100,500 of the Authority’s Port District ProjectBonds, Series A of 1999 (Federally Taxable), (b) all or a portion of the cost of certain port improvementand economic development projects within the Port District, (c) a deposit of cash to the credit of the DebtService Reserve Fund established under the 2001 Port District Project Bond Indenture, and (d) all or aportion of the costs and expenses of the Authority relating to the issuance and sale of the 2001 PortDistrict Project Bonds.
64
FINANCIAL SECTION
DRPA 2012 ANNUAL REPORT
Delaware River Port Authority
Notes to Combined Financial Statements
Note 12. Funded and Long-Term Debt (Continued)
2001 Port District Project Bonds (fully redeemed in 2012) (Continued): On April 26, 2012, the Authorityredeemed, prior to maturity, $71,445 of its 2001 Series A & B Port District Project Bonds. As a result, the2001 PDP Series B bonds were redeemed in full. The redeemed bonds had interest rates varying from4.625% to 5.750% with maturities through 2025. The remaining 2001 Port District Project Bonds werefully refunded on December 20, 2012, prior to maturity, at a redemption price of 100% using proceedsfrom the issuance of the 2012 Port District Project Refunding Bonds.
2008 Revenue Refunding Bonds: On July 25, 2008, the Authority issued $358,175 in RevenueRefunding Bonds as variable rate demand obligations (VRDO’s). The 2008 Revenue Refunding Bondswere issued to provide funds, together with other funds available: (a) to finance the current refunding of$358,175 aggregate principal amount of the Authority’s Revenue Refunding Bonds, Series of 2007,consisting of all of the outstanding bonds of such series; and (b) to pay the costs of issuance of the 2008Revenue Refunding Bonds.
The 2008 Revenue Refunding Bonds were issued pursuant to the Compact, the New Jersey Act, thePennsylvania Act (as such terms are defined herein) and an Indenture of Trust dated as of July 1, 1998,by and between the Authority and TD Bank, N.A., Cherry Hill, New Jersey, as successor to CommerceBank, N.A. (the “Trustee”), as supplemented by a First Supplemental Indenture dated as of July 1, 1998,a Second Supplemental Indenture dated as of August 15, 1998, a Third Supplemental Indenture dated asof December 1, 1999, a Fourth Supplemental Indenture dated as of October 1, 1997 and a FifthSupplemental Indenture dated as of July 15, 2008 (the “Fifth Supplemental Indenture”) (collectively, the“1998 Revenue Bond Indenture”).
The 2008 Revenue Refunding Bonds, together with all other indebtedness outstanding under the 1998Revenue Bond Indenture and any parity obligations hereafter issued under the 1998 Revenue BondIndenture, are equally and ratably payable solely from and secured by a lien on and security interest in (i)the Net Revenues described herein, (ii) all moneys, instruments and securities at any time and from heldby the Authority or the Trustee in any Fund created or established under the 1998 Revenue BondIndenture and (iii) the proceeds of all the foregoing, except for the moneys, instruments and securitiesheld in the 1998 General Fund and the 1998 Rebate Fund. The 2008A Letter of Credit (as definedherein) secures only the 2008A Revenue Refunding Bonds and the 2008B Letter of Credit (as definedherein) secures only the 2008B Revenue Refunding Bonds.
The 2008 Revenue Refunding Bonds are subject to purchase on the demand of the holder at a priceequal to principal plus accrued interest on seven days’ notice and delivery to the Authority’s tender agent,TD Bank, N.A. The tender agent shall provide a copy of said notice to the applicable remarketing agent,who is authorized to use its best efforts to sell the repurchased bonds at a price equal to 100 percent ofthe principal plus accrued interest to the purchase date.
Under irrevocable letters of credit issued by Bank of America, N.A. and TD Bank, N.A., the trustee or theremarketing agent is entitled to draw an amount sufficient to pay the purchase price of the bondsdelivered to it. The letters of credit are valid through July 23, 2013 and require the Authority to makeimmediate payment of any draws under the line. (See Note 17.)
The Authority is required to pay annual facility fees to Bank of America, N.A. and TD Bank, N.A. for theletters of credit. The fee is calculated based on 1.35% of the gross amount available under the line basedon the Authority’s bond ratings, as determined by Moody’s and S&P. In addition, the Authority is requiredto pay an annual remarketing fee, payable quarterly in arrears, equal to 0.07% of the aggregate principalamount of the bonds outstanding at the beginning of the period.
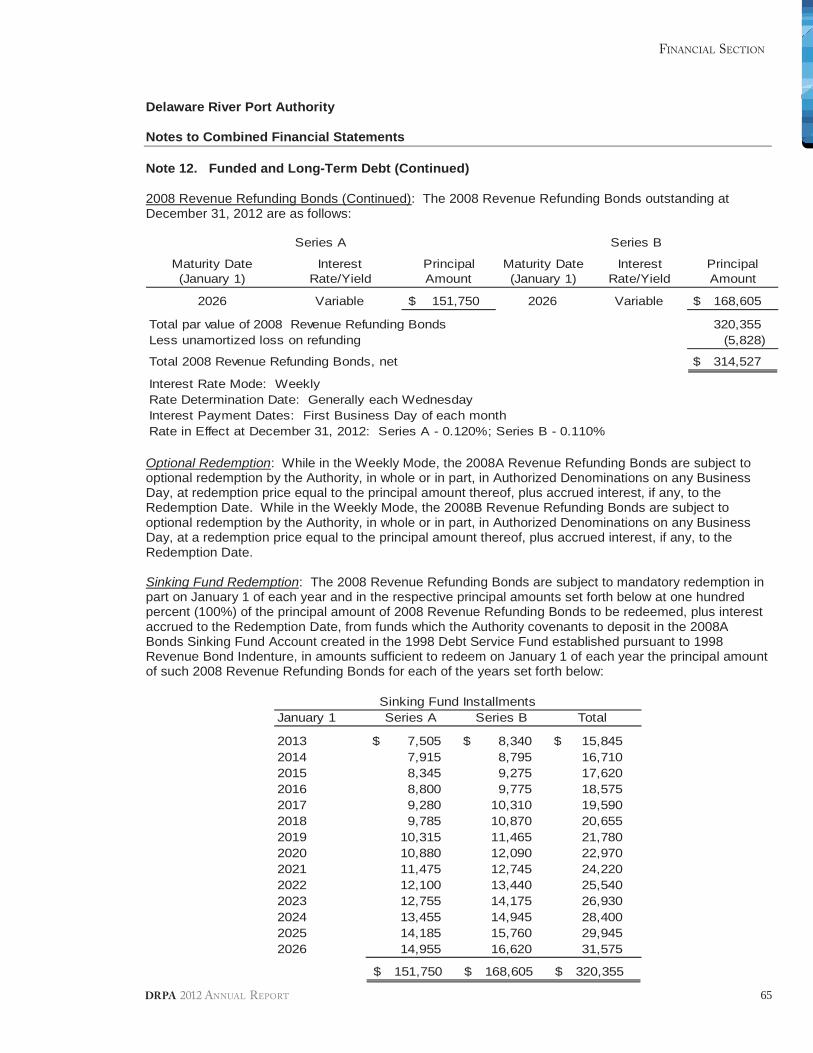
65
FINANCIAL SECTION
DRPA 2012 ANNUAL REPORT
Delaware River Port Authority
Notes to Combined Financial Statements
Note 12. Funded and Long-Term Debt (Continued)
2008 Revenue Refunding Bonds (Continued): The 2008 Revenue Refunding Bonds outstanding atDecember 31, 2012 are as follows:
Maturity Date Interest Principal Maturity Date Interest Principal(January 1) Rate/Yield Amount (January 1) Rate/Yield Amount
2026 Variable 151,750$ 2026 Variable 168,605$
Total par value of 2008 Revenue Refunding Bonds 320,355Less unamortized loss on refunding (5,828)
Total 2008 Revenue Refunding Bonds, net 314,527$
Interest Rate Mode: WeeklyRate Determination Date: Generally each WednesdayInterest Payment Dates: First Business Day of each monthRate in Effect at December 31, 2012: Series A - 0.120%; Series B - 0.110%
Series A Series B
Optional Redemption: While in the Weekly Mode, the 2008A Revenue Refunding Bonds are subject tooptional redemption by the Authority, in whole or in part, in Authorized Denominations on any BusinessDay, at redemption price equal to the principal amount thereof, plus accrued interest, if any, to theRedemption Date. While in the Weekly Mode, the 2008B Revenue Refunding Bonds are subject tooptional redemption by the Authority, in whole or in part, in Authorized Denominations on any BusinessDay, at a redemption price equal to the principal amount thereof, plus accrued interest, if any, to theRedemption Date.
Sinking Fund Redemption: The 2008 Revenue Refunding Bonds are subject to mandatory redemption inpart on January 1 of each year and in the respective principal amounts set forth below at one hundredpercent (100%) of the principal amount of 2008 Revenue Refunding Bonds to be redeemed, plus interestaccrued to the Redemption Date, from funds which the Authority covenants to deposit in the 2008ABonds Sinking Fund Account created in the 1998 Debt Service Fund established pursuant to 1998Revenue Bond Indenture, in amounts sufficient to redeem on January 1 of each year the principal amountof such 2008 Revenue Refunding Bonds for each of the years set forth below:
January 1 Series A Series B Total
2013 7,505$ 8,340$ 15,845$2014 7,915 8,795 16,7102015 8,345 9,275 17,6202016 8,800 9,775 18,5752017 9,280 10,310 19,5902018 9,785 10,870 20,6552019 10,315 11,465 21,7802020 10,880 12,090 22,9702021 11,475 12,745 24,2202022 12,100 13,440 25,5402023 12,755 14,175 26,9302024 13,455 14,945 28,4002025 14,185 15,760 29,9452026 14,955 16,620 31,575
151,750$ 168,605$ 320,355$
Sinking Fund Installments
66
FINANCIAL SECTION
DRPA 2012 ANNUAL REPORT
Delaware River Port Authority
Notes to Combined Financial Statements
Note 12. Funded and Long-Term Debt (Continued)
2010 Revenue Refunding Bonds: On June 30, 2010, the Authority issued $350,000 in Revenue RefundingBonds, Series A of 2010, Revenue Refunding Bonds, Series B of 2010 and Revenue Refunding Bonds,Series C of 2010 as variable rate demand obligations (“VRDOs”). The 2010 Revenue Refunding Bondswere issued pursuant to the Indenture of Trust dated as of July 1, 1998 by and between the Authority andTD Bank, N.A., Cherry Hill, New Jersey, as successor to Commerce Bank, N.A. (“Trustee”), as previouslysupplemented by five supplemental indentures thereto and as further supplemented by a SixthSupplemental Indenture (“Sixth Supplemental Indenture”) dated as of March 15, 2010 (collectively, “1998Revenue Bond Indenture”). The 2010 Revenue Refunding Bonds were issued to provide funds, togetherwith other available funds, to (i) currently refund $349,360 aggregate principal amount of the Authority’soutstanding Revenue Bonds, Series of 1999, (ii) fund any required deposit to the 1998 Debt ServiceReserve Fund (defined herein), and (iii) pay the costs of issuance of the 2010 Revenue Refunding Bonds.
The 2010 Revenue Refunding Bonds are subject to purchase on the demand of the holder at a price equalto principal plus accrued interest on seven days’ notice and delivery to the Authority’s tender agent, TDBank, N.A. The tender agent shall provide a copy of said notice to the applicable remarketing agent, whois authorized to use its best efforts to sell the repurchased bonds at a price equal to 100 percent of theprincipal plus accrued interest to the purchase date.
Under irrevocable letters of credit issued by J.P. Morgan Chase, N.A., Bank of America, N.A. and PNCBank, N.A., the trustee or the remarketing agent is entitled to draw an amount sufficient to pay thepurchase price of the bonds delivered to it. The letters of credit are valid through March 29, 2013 andrequire the Authority to make immediate payment of any draws under the line. (See Note 17 and Note 20.)
The Authority is required to pay annual facility fees to J.P. Morgan Chase, N.A., Bank of America, N.A. andPNC Bank, N.A. for the letters of credit in percentages varying from 1.35% to 1.675% of the gross amountavailable under the line, based on the Authority’s bond ratings as determined by Moody’s and S&P. Inaddition, the Authority is required to pay an annual remarketing fee, payable quarterly in arrears, equal to0.10% of the aggregate principal amount of the bonds outstanding at the beginning of the period.
The 2010 Revenue Refunding Bonds outstanding at December 31, 2012 were as follows:
Maturity Date Interest Principal(January 1) Rate/Yield Amount
Series A 2026 Variable 150,000$Series B 2026 Variable 150,000Series C 2026 Variable 50,000
Total par value of 2010 Revenue Refunding Bonds 350,000Less unamortized loss on refunding (4,488)
Total 2010 Revenue Refunding Bonds, net 345,512$
Interest rate Mode: WeeklyRate Determination Date: Generally each WednesdayRate in Effect at December 31, 2012: Series A - 0.130%; Series B - 0.120%; Series C - 0.110%
The issuance of the 2010 Revenue Refunding Bonds resulted in a loss of $5,624 which represents thecosts associated with the refunding of the 1999 Revenue Bonds.
Optional Redemption: While in the Weekly Mode, each Series of the 2010 Revenue Refunding Bonds issubject to optional redemption by the Authority, in whole or in part, in Authorized Denominations on anyBusiness Day, at a redemption price equal to the principal amount thereof, plus accrued interest, if any, tothe applicable Redemption Date.
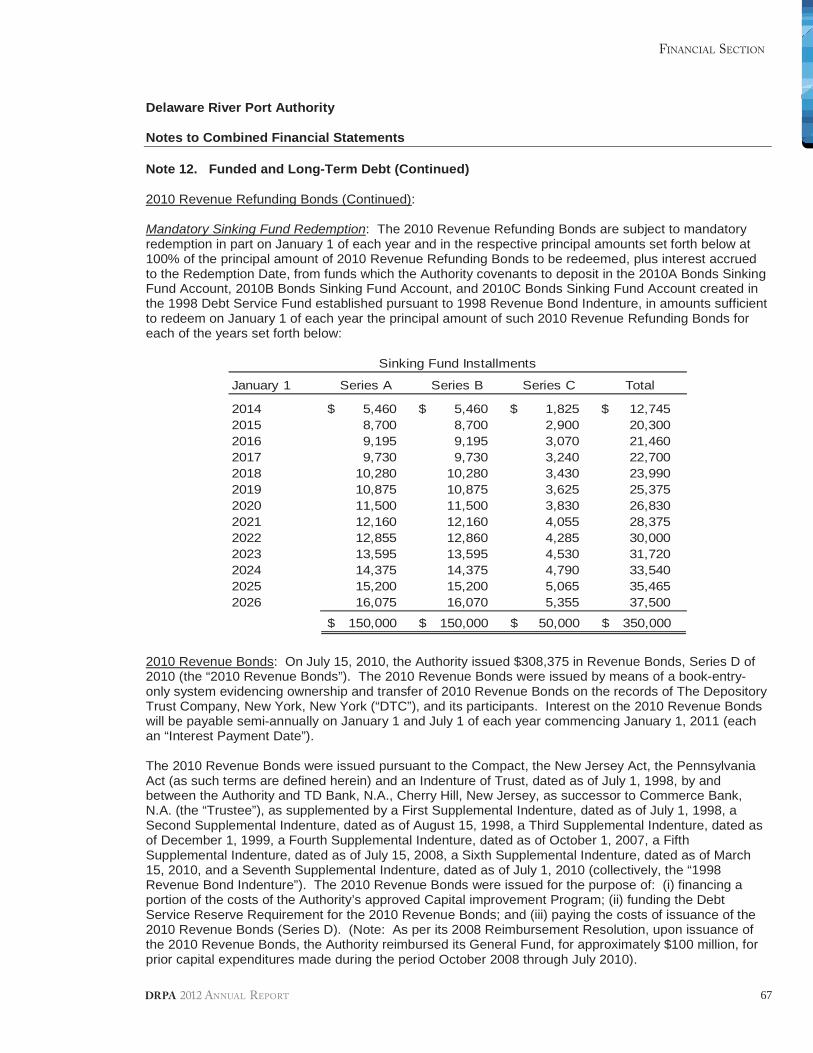
67
FINANCIAL SECTION
DRPA 2012 ANNUAL REPORT
Delaware River Port Authority
Notes to Combined Financial Statements
Note 12. Funded and Long-Term Debt (Continued)
2010 Revenue Refunding Bonds (Continued):
Mandatory Sinking Fund Redemption: The 2010 Revenue Refunding Bonds are subject to mandatoryredemption in part on January 1 of each year and in the respective principal amounts set forth below at100% of the principal amount of 2010 Revenue Refunding Bonds to be redeemed, plus interest accruedto the Redemption Date, from funds which the Authority covenants to deposit in the 2010A Bonds SinkingFund Account, 2010B Bonds Sinking Fund Account, and 2010C Bonds Sinking Fund Account created inthe 1998 Debt Service Fund established pursuant to 1998 Revenue Bond Indenture, in amounts sufficientto redeem on January 1 of each year the principal amount of such 2010 Revenue Refunding Bonds foreach of the years set forth below:
January 1 Series A Series B Series C Total
2014 5,460$ 5,460$ 1,825$ 12,745$2015 8,700 8,700 2,900 20,3002016 9,195 9,195 3,070 21,4602017 9,730 9,730 3,240 22,7002018 10,280 10,280 3,430 23,9902019 10,875 10,875 3,625 25,3752020 11,500 11,500 3,830 26,8302021 12,160 12,160 4,055 28,3752022 12,855 12,860 4,285 30,0002023 13,595 13,595 4,530 31,7202024 14,375 14,375 4,790 33,5402025 15,200 15,200 5,065 35,4652026 16,075 16,070 5,355 37,500
150,000$ 150,000$ 50,000$ 350,000$
Sinking Fund Installments
2010 Revenue Bonds: On July 15, 2010, the Authority issued $308,375 in Revenue Bonds, Series D of2010 (the “2010 Revenue Bonds”). The 2010 Revenue Bonds were issued by means of a book-entry-only system evidencing ownership and transfer of 2010 Revenue Bonds on the records of The DepositoryTrust Company, New York, New York (“DTC”), and its participants. Interest on the 2010 Revenue Bondswill be payable semi-annually on January 1 and July 1 of each year commencing January 1, 2011 (eachan “Interest Payment Date”).
The 2010 Revenue Bonds were issued pursuant to the Compact, the New Jersey Act, the PennsylvaniaAct (as such terms are defined herein) and an Indenture of Trust, dated as of July 1, 1998, by andbetween the Authority and TD Bank, N.A., Cherry Hill, New Jersey, as successor to Commerce Bank,N.A. (the “Trustee”), as supplemented by a First Supplemental Indenture, dated as of July 1, 1998, aSecond Supplemental Indenture, dated as of August 15, 1998, a Third Supplemental Indenture, dated asof December 1, 1999, a Fourth Supplemental Indenture, dated as of October 1, 2007, a FifthSupplemental Indenture, dated as of July 15, 2008, a Sixth Supplemental Indenture, dated as of March15, 2010, and a Seventh Supplemental Indenture, dated as of July 1, 2010 (collectively, the “1998Revenue Bond Indenture”). The 2010 Revenue Bonds were issued for the purpose of: (i) financing aportion of the costs of the Authority’s approved Capital improvement Program; (ii) funding the DebtService Reserve Requirement for the 2010 Revenue Bonds; and (iii) paying the costs of issuance of the2010 Revenue Bonds (Series D). (Note: As per its 2008 Reimbursement Resolution, upon issuance ofthe 2010 Revenue Bonds, the Authority reimbursed its General Fund, for approximately $100 million, forprior capital expenditures made during the period October 2008 through July 2010).
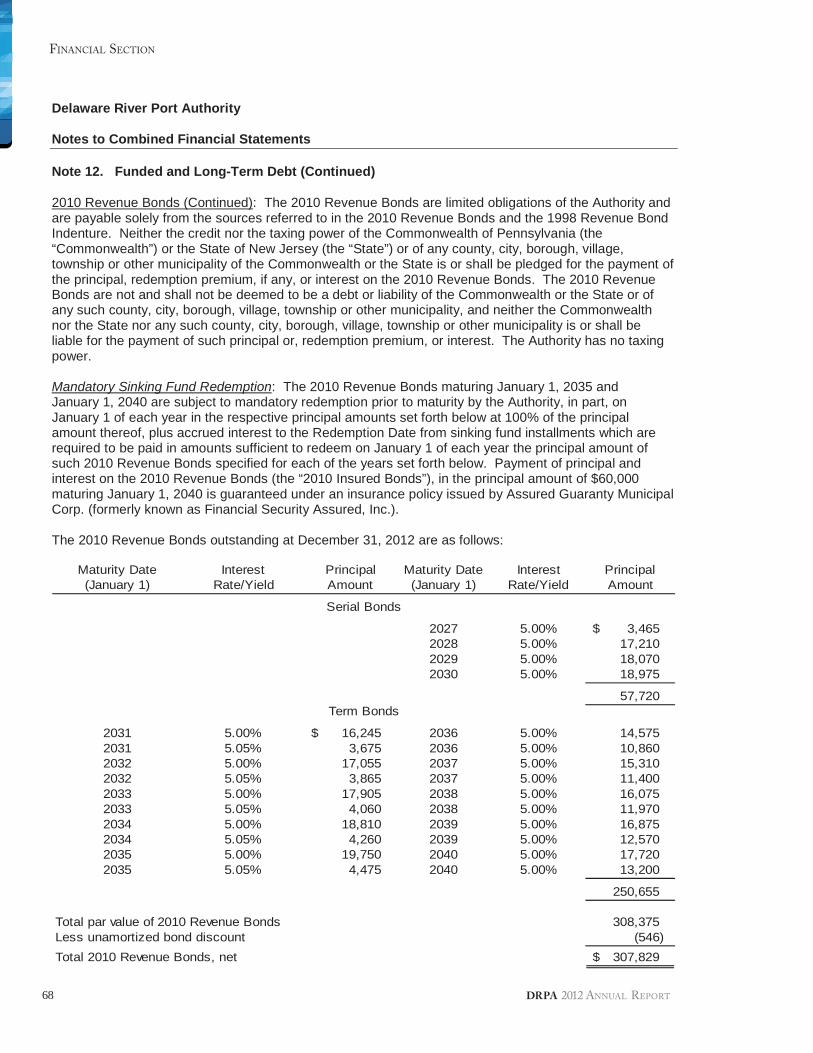
68
FINANCIAL SECTION
DRPA 2012 ANNUAL REPORT
Delaware River Port Authority
Notes to Combined Financial Statements
Note 12. Funded and Long-Term Debt (Continued)
2010 Revenue Bonds (Continued): The 2010 Revenue Bonds are limited obligations of the Authority andare payable solely from the sources referred to in the 2010 Revenue Bonds and the 1998 Revenue BondIndenture. Neither the credit nor the taxing power of the Commonwealth of Pennsylvania (the“Commonwealth”) or the State of New Jersey (the “State”) or of any county, city, borough, village,township or other municipality of the Commonwealth or the State is or shall be pledged for the payment ofthe principal, redemption premium, if any, or interest on the 2010 Revenue Bonds. The 2010 RevenueBonds are not and shall not be deemed to be a debt or liability of the Commonwealth or the State or ofany such county, city, borough, village, township or other municipality, and neither the Commonwealthnor the State nor any such county, city, borough, village, township or other municipality is or shall beliable for the payment of such principal or, redemption premium, or interest. The Authority has no taxingpower.
Mandatory Sinking Fund Redemption: The 2010 Revenue Bonds maturing January 1, 2035 andJanuary 1, 2040 are subject to mandatory redemption prior to maturity by the Authority, in part, onJanuary 1 of each year in the respective principal amounts set forth below at 100% of the principalamount thereof, plus accrued interest to the Redemption Date from sinking fund installments which arerequired to be paid in amounts sufficient to redeem on January 1 of each year the principal amount ofsuch 2010 Revenue Bonds specified for each of the years set forth below. Payment of principal andinterest on the 2010 Revenue Bonds (the “2010 Insured Bonds”), in the principal amount of $60,000maturing January 1, 2040 is guaranteed under an insurance policy issued by Assured Guaranty MunicipalCorp. (formerly known as Financial Security Assured, Inc.).
The 2010 Revenue Bonds outstanding at December 31, 2012 are as follows:
Maturity Date Interest Principal Maturity Date Interest Principal(January 1) Rate/Yield Amount (January 1) Rate/Yield Amount
2027 5.00% 3,465$2028 5.00% 17,2102029 5.00% 18,0702030 5.00% 18,975
57,720
2031 5.00% 16,245$ 2036 5.00% 14,5752031 5.05% 3,675 2036 5.00% 10,8602032 5.00% 17,055 2037 5.00% 15,3102032 5.05% 3,865 2037 5.00% 11,4002033 5.00% 17,905 2038 5.00% 16,0752033 5.05% 4,060 2038 5.00% 11,9702034 5.00% 18,810 2039 5.00% 16,8752034 5.05% 4,260 2039 5.00% 12,5702035 5.00% 19,750 2040 5.00% 17,7202035 5.05% 4,475 2040 5.00% 13,200
250,655
Total par value of 2010 Revenue Bonds 308,375Less unamortized bond discount (546)Total 2010 Revenue Bonds, net 307,829$
Serial Bonds
Term Bonds
69
FINANCIAL SECTION
DRPA 2012 ANNUAL REPORT
Delaware River Port Authority
Notes to Combined Financial Statements
Note 12. Funded and Long-Term Debt (Continued)
2010 Revenue Bonds (Continued):
Optional Redemption: The 2010 Revenue Bonds are subject to redemption at the option of the Authority,prior to maturity, in whole or in part (and if in part, in such order of maturity or within a maturity as theAuthority shall specify, or if the Authority shall fail to specify, by lot or by such other method as the PayingAgent determines to be fair and reasonable and in any principal amount in Authorized Denominations) atany time on or after January 1, 2020. Any such redemption shall be made at a redemption price equal to100% of the principal amount of the 2010 Bonds to be redeemed, plus accrued interest to theRedemption Date.
2012 Port District Project Refunding Bonds: On December 20, 2012, the Authority issued $153,030 inPort District Project Refunding Bonds, Series 2012. The Port District Project Refunding Bonds, Series2012 (the “2012 Bonds”) were issued pursuant to the Compact, the New Jersey Act, the Pennsylvania Act(as such terms are defined herein) and an Indenture of Trust (the "Indenture") dated as of December 1,2012, between the Authority and TD Bank, N.A., Cherry Hill, New Jersey, as trustee (the "Trustee").The2012 Bonds were issued to (i) refund and redeem all of the outstanding principal balance of and interestaccrued on the Authority's outstanding Port District Project Bonds, Series B of 1998, (the "1998 RefundedBonds"), Port District Project Bonds, Series B of 1999 (the "1999 Refunded Bonds"), and Port DistrictProject Bonds, Series A of 2001 (the "2001 Refunded Bonds").
The refunding resulted in a loss (difference between the reacquisition price and the net carrying amountof the old debt) of $7 million. This difference, reported in the accompanying financial statements as adeduction from bonds payable, is being charged to operations through the year 2025 using the effectiveinterest method. The Authority completed the refunding to reduce its total debt service payments over thenext 15 years by $69.3 million and to obtain an economic gain (difference between the present values ofthe old debt and new debt service payments) of $37 million. See Note 13.
The 2012 Bonds are general corporate obligations of the Authority. The 2012 Bonds are not secured by alien or charge on, or pledge of, any revenues or other assets of the Authority other than the moneys, ifany, on deposit from time to time in the Funds established under the Indenture, except for the RebateFund. No tolls, rents, rates or other charges are pledged for the benefit of the 2012 Bonds. The 2012Bonds are equally and ratably secured by the monies, if any, on deposit in the Funds established underIndenture, except for the Rebate Fund. The 2012 Bonds are payable from such Funds and from othermonies of the Authority legally available therefore.
Redemption Provisions:
Optional Redemption: The 2012 Bonds maturing on or after January 1, 2024 are subject to redemptionprior to maturity at the option of the Authority on or after January 1, 2023, in whole at any time, or in partat any time and from time to time, in any order of maturity specified by the Authority and within a maturityas selected by the Trustee as provided in the Indenture and as summarized below under the subheading“Redemption Provisions – Selection of 2012 Bonds to be Redeemed.” Any such redemption shall bemade at a redemption price equal to the principal amount of the Bonds to be redeemed plus interestaccrued to the date fixed for redemption.
Payment of Redemption Price: Notice of redemption having been given in the manner provided in theIndenture, or written waivers of notice having been filed with the Trustee prior to the date set forredemption, the 2012 Bonds (or portions thereof) so called for redemption shall become due and payableon the redemption date so designated and interest on such 2012 Bonds (or portions thereof) shall ceaseto accrue from the redemption date whether or not such Bonds shall be presented for payment. Theprincipal amount of all 2012 Bonds so called for redemption, together with the redemption premium, ifany, payable with respect thereto and accrued and unpaid interest thereon to the date of redemption,shall be paid (upon presentation and surrender of such 2012 Bonds) by the Paying Agent out of theappropriate Fund or other funds deposited for the purpose.
70
FINANCIAL SECTION
DRPA 2012 ANNUAL REPORT
Delaware River Port Authority
Notes to Combined Financial Statements
Note 12. Funded and Long-Term Debt (Continued)
2012 Port District Project Refunding Bonds (Continued):
Redemption Provisions (Continued):
Selection of 2012 Bonds to be Redeemed: If less than all of the 2012 Bonds are to be redeemed andpaid prior to maturity, 2012 Bonds registered in the name of the Authority shall be redeemed before other2012 Bonds are redeemed. Thereafter, the portion of 2012 Bonds to be redeemed shall be selected bythe Authority, or if no such selection is made, by lot by the Trustee from among all Outstanding 2012Bonds eligible for redemption. In the case of a partial redemption of 2012 Bonds when 2012 Bonds ofdenominations greater than the minimum Authorized Denomination are Outstanding, then for all purposesin connection with such redemption, each principal amount equal to the minimum AuthorizedDenomination shall be treated as though it were a separate 2012 Bond for purposes of selecting the 2012Bonds to be redeemed, provided that no 2012 Bonds shall be redeemed in part if the principal amount tobe Outstanding following such partial redemption is not an Authorized Denomination.
Notice of Redemption: The Trustee shall cause a notice of redemption to be mailed to the applicable2012 Bondholders. Such notice shall specify (a) the complete official name of the 2012 Bonds, with seriesdesignation; (b) if less than all of the then Outstanding Bonds are to be redeemed, the numbers, includingCUSIP numbers if applicable, of the 2012 Bonds to be redeemed which may, if appropriate, be expressedin designated blocks of numbers; (c) the date of issue of each 2012 Bond being redeemed as originallyissued; (d) the maturity date of each 2012 Bond being redeemed; and (e) any other descriptiveinformation considered appropriate by the Authority or the Trustee to accurately identify the 2012 Bondsto be redeemed. Such notice shall also state the redemption price and the date fixed for redemption, thaton such date the 2012 Bonds called for redemption will be due and become payable at the designatedoffice of the Paying Agent, and that from and after such date interest thereon shall cease to accrue;provided, however, that the Owners of 2012 Bonds to be redeemed may file written waivers of notice withthe Trustee, and if so waived, such 2012 Bonds may be redeemed and all rights and liabilities of saidOwners shall mature and accrue on the date set for such redemption, without the requirement of writtennotice. If a notice is given with respect to an optional redemption prior to moneys for such redemptionbeing deposited with the Trustee, such notice shall be conditioned upon the deposit of the redemptionmoneys with the Trustee before the date fixed for redemption and such notice shall be of no effect (andshall so state) unless such moneys are so deposited.
Each redemption notice to 2012 Bondholders shall be deposited by the Trustee in the United States mail,first-class postage prepaid, at least thirty (30) days, but not more than sixty (60) days, prior to theredemption date, addressed to the Owners of 2012 Bonds called for redemption at their respectiveaddresses appearing upon the Bond Register.
Not more than sixty (60) days following the applicable redemption date, a further notice shall be mailed asprovided above to the 2012 Bondholders of any 2012 Bonds called for redemption and not thenpresented for payment containing substantially the same information set forth above.
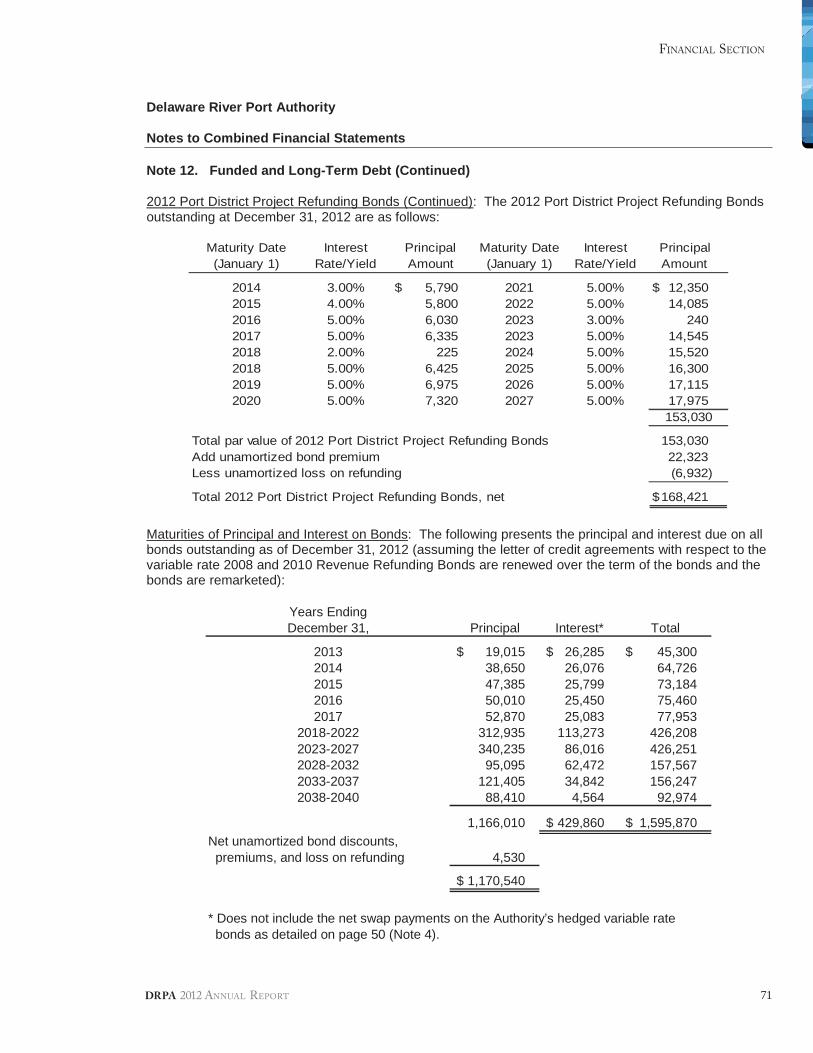
71
FINANCIAL SECTION
DRPA 2012 ANNUAL REPORT
Delaware River Port Authority
Notes to Combined Financial Statements
Note 12. Funded and Long-Term Debt (Continued)
2012 Port District Project Refunding Bonds (Continued): The 2012 Port District Project Refunding Bondsoutstanding at December 31, 2012 are as follows:
Maturity Date Interest Principal Maturity Date Interest Principal(January 1) Rate/Yield Amount (January 1) Rate/Yield Amount
2014 3.00% 5,790$ 2021 5.00% 12,350$2015 4.00% 5,800 2022 5.00% 14,0852016 5.00% 6,030 2023 3.00% 2402017 5.00% 6,335 2023 5.00% 14,5452018 2.00% 225 2024 5.00% 15,5202018 5.00% 6,425 2025 5.00% 16,3002019 5.00% 6,975 2026 5.00% 17,1152020 5.00% 7,320 2027 5.00% 17,975
153,030
Total par value of 2012 Port District Project Refunding Bonds 153,030Add unamortized bond premium 22,323Less unamortized loss on refunding (6,932)
Total 2012 Port District Project Refunding Bonds, net 168,421$
Maturities of Principal and Interest on Bonds: The following presents the principal and interest due on allbonds outstanding as of December 31, 2012 (assuming the letter of credit agreements with respect to thevariable rate 2008 and 2010 Revenue Refunding Bonds are renewed over the term of the bonds and thebonds are remarketed):
Years EndingDecember 31, Principal Interest* Total
2013 19,015$ 26,285$ 45,300$2014 38,650 26,076 64,7262015 47,385 25,799 73,1842016 50,010 25,450 75,4602017 52,870 25,083 77,953
2018-2022 312,935 113,273 426,2082023-2027 340,235 86,016 426,2512028-2032 95,095 62,472 157,5672033-2037 121,405 34,842 156,2472038-2040 88,410 4,564 92,974
1,166,010 429,860$ 1,595,870$Net unamortized bond discounts,premiums, and loss on refunding 4,530
1,170,540$
* Does not include the net swap payments on the Authority’s hedged variable ratebonds as detailed on page 50 (Note 4).
72
FINANCIAL SECTION
DRPA 2012 ANNUAL REPORT
Delaware River Port Authority
Notes to Combined Financial Statements
Note 12. Funded and Long-Term Debt (Continued)
Maturities of Principal and Interest on Bonds (Continued): The interest on variable rate debt is computedusing the interest rate effective at December 31, 2012. The interest rates on the Authority’s variable ratedebt are set by the remarketing agent and are reset weekly. As of December 31, 2012, the outstandingbalance on the 2008 and 2010 Revenue Refunding Bonds was $670,355, which is reported in the tableabove as maturing in 2013 through 2026.
In June 2013, the letters of credit supporting the 2008 variable rate bonds were renewed and extendedwith Bank of America, N.A. and TD Bank, N.A. to July 2016 and December 2017, respectively (Note 20).If the letter of credit agreements supporting the 2008 variable rate bonds are not renewed in 2016 and2017 and the 2008 bonds are mandatorily redeemed, the 2016 debt service requirements will be$169,195, rather than the $50,010 shown in the table above and the 2017 debt service requirements willbe $174,980, rather than the $52,870 shown in the table above.
In March 2013, the letters of credit supporting the 2010 variable rate bonds were replaced with newletters of credit from Royal Bank of Canada (Series A), Barclay’s Bank PLC (Series B), and The Bank ofNew York Mellon (Series C), which expire in March 2016, March 2015, and March 2016, respectively(Note 20). If the letter of credit agreements supporting the 2010 Series A and Series C variable ratebonds are not renewed in 2016 and the 2010 Series A and Series C bonds are mandatorily redeemed,the 2016 debt service requirements will be $206,595, rather than the $50,010 shown in the table above.If the letter of credit agreement supporting the 2010 Series B variable rate bonds is not renewed in 2015and the 2010 Series B bonds are mandatorily redeemed, the 2015 debt service requirement will be$165,330, rather than the $47,385 shown in the table above.
Interest on all of the Authority’s fixed rate debt (revenue bonds and port district project bonds issued in1999, 2010 and 2012) is payable semi-annually on January 1 and July 1 in each year. Interest on the2008 and 2010 Revenue Refunding Bonds is payable monthly on the first business day of each month.The Authority is current on all of its monthly debt service payments on all obligations.
Debt Authorized But Not Issued: At its November 2009 Board meeting, the Authority’s Board approvedthe following resolution related to its proposed “new money issuance”.
DRPA-09-064 authorized the Authority to issue new revenue bonds, up to a maximum of $510 million tofund a portion of the 2010 Capital Plan. (This resolution rescinded the earlier “new money” authorizationpassed in October 2008). The new bonds can be issued as fixed or variable rate bonds, along with anyinterest rate hedge agreements, if necessary. The Authority issued $308 million in fixed rate bonds inJuly 2010, pursuant to this resolution.
Bond Ratings:
Moody’s Investors Service Bond Ratings: Concurrent with the issuance of $350 million in RevenueRefunding Bonds on June 30, 2010, in its report dated March 2010, Moody’s assigned its A3 underlyingratings to the Authority’s 2010 Revenue Refunding Bonds Series (A thru C). Moody’s affirmed its ‘A3underlying ratings, on the Authority’s existing revenue bond debt, and the ‘Baa3’ long term ratings on itsPDP Bonds. The outlook was changed from “stable” to a “negative outlook” on all of the Authority’sbonds.
Concurrent with the issuance of $308.4 million in Revenue Bonds on July 15, 2010, in its report datedMay 4, 2010, Moody’s assigned its A3 underlying ratings to the Authority’s 2010 Revenue Bonds (SeriesD). Moody’s affirmed its ‘A3 underlying ratings, on the Authority’s existing revenue bond debt, and the‘Baa3’ long term ratings on its PDP Bonds. (Note: Moody’s also assigned a rating of Aa3 “negativeoutlook” to the 2010 Insured Revenue Bonds).
Concurrent with the issuance of the $153.03 million in Port District Project Refunding Bonds, onNovember 30, 2012, Moody’s affirmed the ratings on all Authority Revenue and Port District ProjectBonds; however the outlook improved from “negative” to “stable” on all bonds. As of December 31, 2012,all Authority bonds remain with a “stable” outlook.
73
FINANCIAL SECTION
DRPA 2012 ANNUAL REPORT
Delaware River Port Authority
Notes to Combined Financial Statements
Note 12. Funded and Long-Term Debt (Continued)
Bond Ratings (Continued):
Standard & Poor’s Ratings Services Bond Ratings: On July 13, 2009, S&P raised the underlying rate(SPUR) on all of the Authority’s revenue/revenue refunding bonds from BBB+ to A- with a stable outlook.S&P reaffirmed the existing BBB- ratings on the port district project bonds with a “positive outlook.”
Concurrent with the issuance of $350 million in revenue refunding bonds on June 30, 2010, in its reportdated February 24, 2010, S&P assigned its “A-” underlying rating (SPUR) to the Authority’s 2010Revenue Refunding Bond Series A through C. S&P affirmed its “A-” underlying ratings, on the Authority’sexisting revenue bond debt, and the “BBB-” long term ratings on its PDP Bonds. The outlook remainedas “stable.”
Concurrent with the issuance of $308.4 million in revenue bonds on July 15, 2010, in its report dated May4, 2010, S&P assigned its “A-” underlying rating (SPUR) to the Authority’s 2010 Revenue Bonds (SeriesD). S&P affirmed its “A-” underlying ratings, on the Authority’s existing revenue bond debt, and the “BBB”long term ratings on its PDP Bonds. (Note: S&P also assigned a rating of “AAA negative outlook” to the2010 Insured Revenue Bonds).
Concurrent with the issuance of $153.03 million in Port District Project Refunding Bonds, on November30, 2012, S&P affirmed the ratings on all Authority Revenue and Port District Project Bonds; however theoutlook improved from “stable” to positive on all bonds. As of December 31, 2012, the outlook remains as“positive” on all of the Authority’s bonds.
Ratings on Jointly Supported Transactions: Moody’s Investors Service (“Moody’s”) and Standard &Poor’s Ratings Services, a division of The McGraw-Hill Companies, Inc. (“S&P”), initially assigned theirmunicipal bond ratings to the 2008 Revenue Refunding Bonds as set forth in the following chart basedupon the understanding that upon delivery of the 2008A Revenue Refunding Bonds or 2008B RevenueRefunding Bonds, the respective Letter of Credit securing the payment when due of the principal of, orpurchase price of 2008A Revenue Refunding Bonds or 2008B Revenue Refunding Bonds tendered forpurchase and not otherwise remarketed and interest on the 2008A Revenue Refunding Bonds or 2008BRevenue Refunding Bonds will be delivered by Bank of America, N.A. and TD Bank, N.A., respectively.
Long-term Short-term
2008A Revenue Refunding Bonds Moody's: Aaa VMIG 1S&P: AA+ A-1+
2008 B Revenue Refunding Bonds Moody's: Aaa VMIG 1S&P: AA- A-1+
The long-term ratings assigned by Moody’s and S&P reflect each organization’s approach to rating jointlysupported transactions and are based upon the Direct Pay Letters of Credit provided by Bank of America,N.A. for the 2008A Revenue Refunding Bonds and TD Bank, N.A. for the 2008B Revenue RefundingBonds. Since a loss to a bondholder of a 2008A Revenue Refunding Bond or a 2008B RevenueRefunding Bond would occur only if both the bank providing the applicable Letter of Credit and theAuthority default in payment, Moody’s and S&P have assigned a long-term rating to the 2008 RevenueRefunding Bonds based upon the joint probability of default by both applicable parties. In determining thejoint probability of default, Moody’s considers the level of correlation between the bank providing theapplicable Letter of Credit and the Authority. Moody’s has determined that there is a low level ofcorrelation between the bank providing the applicable Letter of Credit and the Authority. Given thiscorrelation, Moody’s believes the joint probability of default results in credit risk consistent with a Aaarating for the 2008 Revenue Refunding Bonds.
74
FINANCIAL SECTION
DRPA 2012 ANNUAL REPORT
Delaware River Port Authority
Notes to Combined Financial Statements
Note 12. Funded and Long-Term Debt (Continued)
Bond Ratings (Continued):
Ratings on Jointly Supported Transactions (Continued): No provider of a Letter of Credit is obligated tomaintain its present or any other credit rating and shall have no liability if any such credit rating islowered, withdrawn, or suspended.
In May 2009, the Authority was advised that Standard & Poor’s Ratings Services had updated itsmethodology and assumptions for rating “jointly supported obligations” when each obligor is fullyresponsible for the entire obligation. In this situation, a default on the obligation would occur only if bothobligors default. As a result, in its report dated April 22, 2009 (“List of U.S. Public Finance Ratings Placedon CreditWatch Positive As A Result of Joint-Supported Criteria Update”), S&P changed its ratings on the2008 Revenue Refunding Bonds (Series A), supported by a Letter of Credit by Bank of America, N.A.,from AA+/A-1 + to A-/A-1.
Note 13. Current Refunding of Debt
As detailed in Note 12, on December 20, 2012, the Authority issued $153,030 in Port District ProjectRefunding Bonds to currently refund $196,760 aggregate principal amount of the Authority’s outstanding1998 Series B Port District Project Bonds ($55,475), 1999 Series B Port District Project Bonds($107,880), and 2001 Series A Port District Project Bonds ($33,405). The refunding was executed by theAuthority to reduce its total debt service payments by $69.3 million over the next 15 years.
As a result of the current refunding of the Port District Bonds, the Authority incurred a loss on refunding of$6,966, which has been recorded as a contra-liability account against the noncurrent liability of bondeddebt, and is being amortized as a component of interest expense over the life of the newly issued,refunding debt.
The following schedule details the difference between the cash flow required to service the old debt (therefunded portion of the Port District Project Bonds) and the new debt (2012 Port District ProjectRefunding Bonds). In addition, the economic gain from the refunding, which represents the differencebetween the present value of the aforementioned old debt service and the present value of theaforementioned new debt service requirements, discounted at the effective interest rate of 2.89%,adjusted for any additional cash, is as flows:
Cash Flow Difference
Old debt service cash flows 303,610$Less prior receipts 11,291Prior net cash flows 292,319
New debt service cash flows 222,997
Cash flows savings 69,322$
Economic Gain
Present value of cash flow difference 36,975$
75
FINANCIAL SECTION
DRPA 2012 ANNUAL REPORT
Delaware River Port Authority
Notes to Combined Financial Statements
Note 14. Conduit Debt Obligations
The Authority is authorized to plan, finance, develop, acquire, construct, purchase, lease, maintain,market, improve and operate any project within the Port District including, but not limited to, any terminal,terminal facility, transportation facility, or any other facility of commerce or economic development activity,from funds available after appropriate allocation for maintenance of bridge and other capital facilities.Utilizing this authorization, the Authority has issued certain debt bearing its name to lower the cost ofborrowing for specific governmental entities. This debt is commonly referred to as conduit (or non-commitment) debt. Typically, the debt proceeds are used to finance facilities within the Authority’sjurisdiction that are transferred to the third party either by lease or by sale. The underlying lease ormortgage loan agreement, which serves as collateral for the promise of payments by the third party, callsfor payments that are essentially the same as collateral for the promise of payments by the third party,calls for payments that are essentially the same as those required by the debt. These payments are madeby the third-party directly to an independent trustee, who is appointed to service and administer thearrangement. The Authority assumes no responsibility for repayment of this debt beyond the resourcesprovided by the underlying leases or mortgage loans.
As of December 31, 2012, there was one series of Charter School Project Bonds outstanding, issued forthe LEAP Academy Charter School, Inc. The corresponding aggregate principal totaling $8,500 is treatedstrictly as conduit debt obligations under Interpretation No. 2 of the Governmental Accounting StandardsBoard (GASB) and accordingly is not included in the financial statements. The following schedule detailsthe series together with the amount outstanding:
1/1/2011 12/31/2011 12/31/2012Issue Issued Beginning Ending Ending
Issue Date Amount Balance Paid Balance Paid Balance
Charter School ProjectBonds, Series 2003 09/01/03 8,500$ 7,310$ 270$ 7,040$ 285$ 6,755$
See Note 20, “Subsequent Events” for additional information related to LEAP Bonds.
Note 15. Government Contributions for Capital Improvements, Additions and Other Projects
The Authority receives contributions in aid for financing capital improvements to the rapid transit systemfrom the Federal Transit Administration and other government agencies. Capital improvement grantfunds of $25,042 and $33,021 were received in 2012 and 2011, respectively. The Authority receivesfederal and state grants for specific construction purposes that are subject to review and audit by thegrantor agencies. Although such audits could result in disallowances under terms of the grants, it is theopinion of management that any required reimbursements will not be material to the Authority’s netposition.
Note 16. Contingencies
Public Liability claim exposures are self-insured by the Authority within its self insured retention limit of $5million for each occurrence, after which, exists a $25 million limit of Claims made Excess LiabilityInsurance per occurrence, and in the aggregate, to respond to any large losses exceeding the retention.The Authority, excluding PATCO, self-insures the initial $1 million limit, per accident, for Workers’Compensation claims, after which a $5 million limit of Excess Workers’ Compensation insurance isretained to respond to significant claims. PATCO is completely self-insured for Workers’ Compensationclaims.
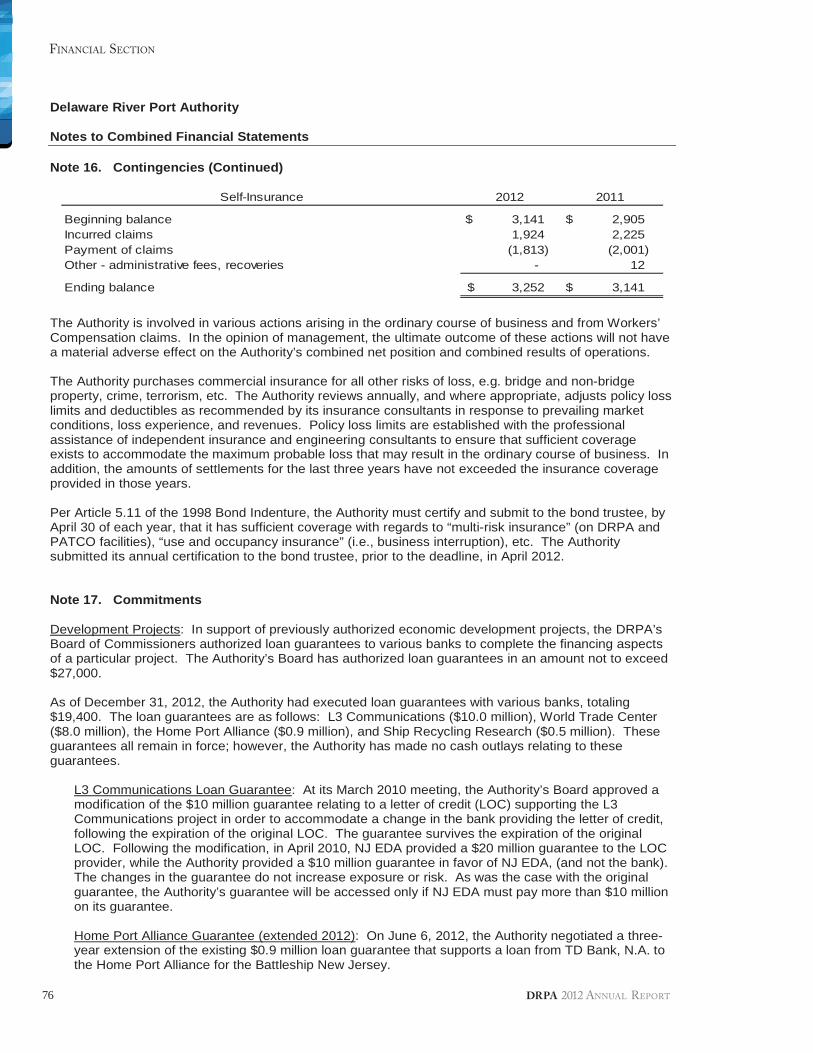
76
FINANCIAL SECTION
DRPA 2012 ANNUAL REPORT
Delaware River Port Authority
Notes to Combined Financial Statements
Note 16. Contingencies (Continued)
Self-Insurance 2012 2011
Beginning balance 3,141$ 2,905$Incurred claims 1,924 2,225Payment of claims (1,813) (2,001)Other - administrative fees, recoveries - 12
Ending balance 3,252$ 3,141$
The Authority is involved in various actions arising in the ordinary course of business and from Workers’Compensation claims. In the opinion of management, the ultimate outcome of these actions will not havea material adverse effect on the Authority’s combined net position and combined results of operations.
The Authority purchases commercial insurance for all other risks of loss, e.g. bridge and non-bridgeproperty, crime, terrorism, etc. The Authority reviews annually, and where appropriate, adjusts policy losslimits and deductibles as recommended by its insurance consultants in response to prevailing marketconditions, loss experience, and revenues. Policy loss limits are established with the professionalassistance of independent insurance and engineering consultants to ensure that sufficient coverageexists to accommodate the maximum probable loss that may result in the ordinary course of business. Inaddition, the amounts of settlements for the last three years have not exceeded the insurance coverageprovided in those years.
Per Article 5.11 of the 1998 Bond Indenture, the Authority must certify and submit to the bond trustee, byApril 30 of each year, that it has sufficient coverage with regards to “multi-risk insurance” (on DRPA andPATCO facilities), “use and occupancy insurance” (i.e., business interruption), etc. The Authoritysubmitted its annual certification to the bond trustee, prior to the deadline, in April 2012.
Note 17. Commitments
Development Projects: In support of previously authorized economic development projects, the DRPA’sBoard of Commissioners authorized loan guarantees to various banks to complete the financing aspectsof a particular project. The Authority’s Board has authorized loan guarantees in an amount not to exceed$27,000.
As of December 31, 2012, the Authority had executed loan guarantees with various banks, totaling$19,400. The loan guarantees are as follows: L3 Communications ($10.0 million), World Trade Center($8.0 million), the Home Port Alliance ($0.9 million), and Ship Recycling Research ($0.5 million). Theseguarantees all remain in force; however, the Authority has made no cash outlays relating to theseguarantees.
L3 Communications Loan Guarantee: At its March 2010 meeting, the Authority’s Board approved amodification of the $10 million guarantee relating to a letter of credit (LOC) supporting the L3Communications project in order to accommodate a change in the bank providing the letter of credit,following the expiration of the original LOC. The guarantee survives the expiration of the originalLOC. Following the modification, in April 2010, NJ EDA provided a $20 million guarantee to the LOCprovider, while the Authority provided a $10 million guarantee in favor of NJ EDA, (and not the bank).The changes in the guarantee do not increase exposure or risk. As was the case with the originalguarantee, the Authority’s guarantee will be accessed only if NJ EDA must pay more than $10 millionon its guarantee.
Home Port Alliance Guarantee (extended 2012): On June 6, 2012, the Authority negotiated a three-year extension of the existing $0.9 million loan guarantee that supports a loan from TD Bank, N.A. tothe Home Port Alliance for the Battleship New Jersey.
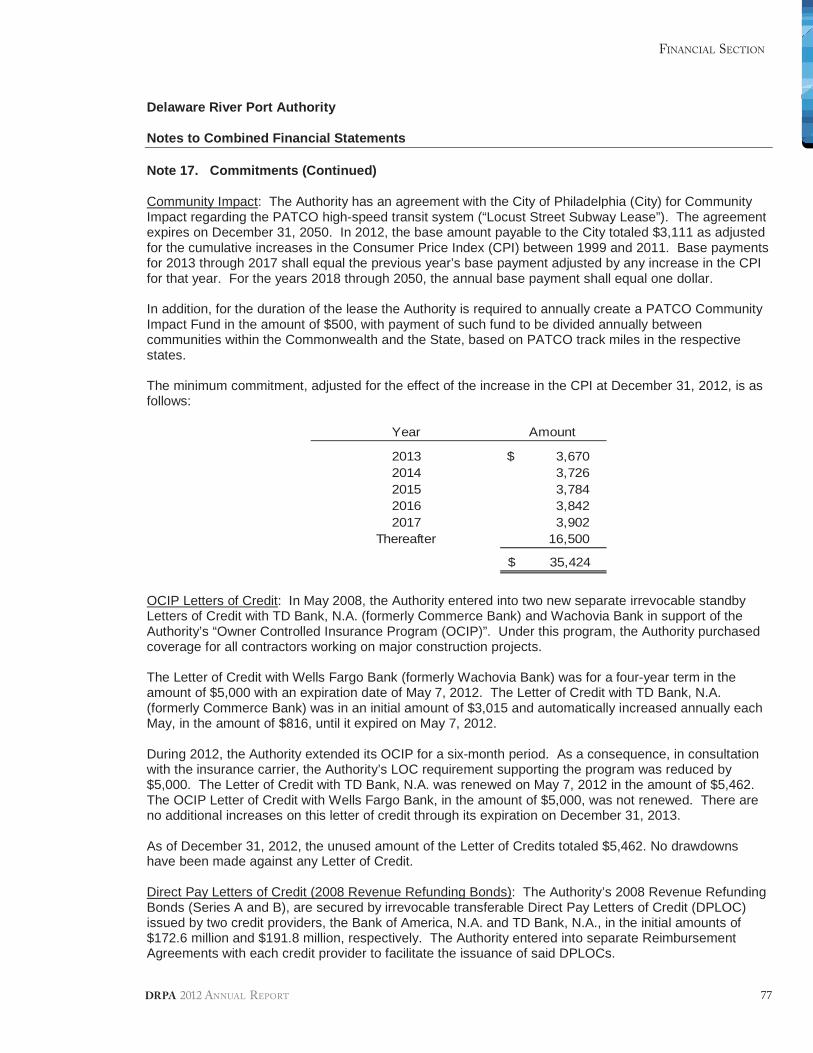
77
FINANCIAL SECTION
DRPA 2012 ANNUAL REPORT
Delaware River Port Authority
Notes to Combined Financial Statements
Note 17. Commitments (Continued)
Community Impact: The Authority has an agreement with the City of Philadelphia (City) for CommunityImpact regarding the PATCO high-speed transit system (“Locust Street Subway Lease”). The agreementexpires on December 31, 2050. In 2012, the base amount payable to the City totaled $3,111 as adjustedfor the cumulative increases in the Consumer Price Index (CPI) between 1999 and 2011. Base paymentsfor 2013 through 2017 shall equal the previous year’s base payment adjusted by any increase in the CPIfor that year. For the years 2018 through 2050, the annual base payment shall equal one dollar.
In addition, for the duration of the lease the Authority is required to annually create a PATCO CommunityImpact Fund in the amount of $500, with payment of such fund to be divided annually betweencommunities within the Commonwealth and the State, based on PATCO track miles in the respectivestates.
The minimum commitment, adjusted for the effect of the increase in the CPI at December 31, 2012, is asfollows:
Year Amount
2013 3,670$2014 3,7262015 3,7842016 3,8422017 3,902
Thereafter 16,500
35,424$
OCIP Letters of Credit: In May 2008, the Authority entered into two new separate irrevocable standbyLetters of Credit with TD Bank, N.A. (formerly Commerce Bank) and Wachovia Bank in support of theAuthority’s “Owner Controlled Insurance Program (OCIP)”. Under this program, the Authority purchasedcoverage for all contractors working on major construction projects.
The Letter of Credit with Wells Fargo Bank (formerly Wachovia Bank) was for a four-year term in theamount of $5,000 with an expiration date of May 7, 2012. The Letter of Credit with TD Bank, N.A.(formerly Commerce Bank) was in an initial amount of $3,015 and automatically increased annually eachMay, in the amount of $816, until it expired on May 7, 2012.
During 2012, the Authority extended its OCIP for a six-month period. As a consequence, in consultationwith the insurance carrier, the Authority’s LOC requirement supporting the program was reduced by$5,000. The Letter of Credit with TD Bank, N.A. was renewed on May 7, 2012 in the amount of $5,462.The OCIP Letter of Credit with Wells Fargo Bank, in the amount of $5,000, was not renewed. There areno additional increases on this letter of credit through its expiration on December 31, 2013.
As of December 31, 2012, the unused amount of the Letter of Credits totaled $5,462. No drawdownshave been made against any Letter of Credit.
Direct Pay Letters of Credit (2008 Revenue Refunding Bonds): The Authority’s 2008 Revenue RefundingBonds (Series A and B), are secured by irrevocable transferable Direct Pay Letters of Credit (DPLOC)issued by two credit providers, the Bank of America, N.A. and TD Bank, N.A., in the initial amounts of$172.6 million and $191.8 million, respectively. The Authority entered into separate ReimbursementAgreements with each credit provider to facilitate the issuance of said DPLOCs.
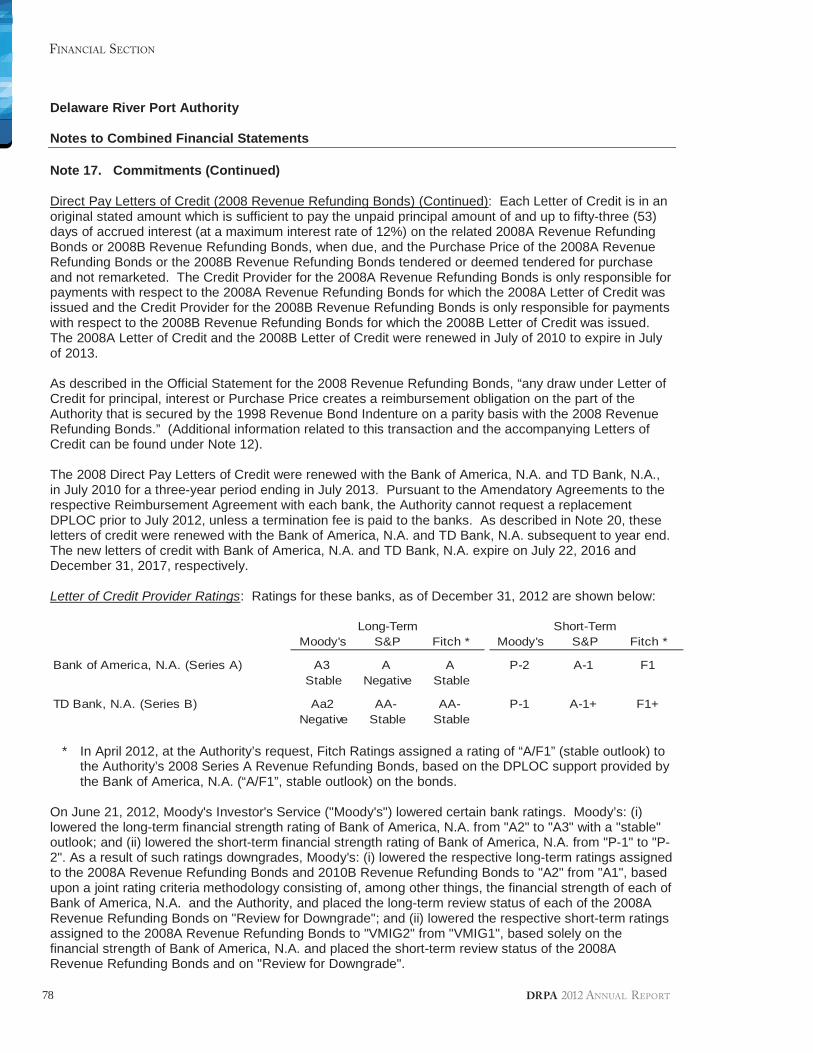
78
FINANCIAL SECTION
DRPA 2012 ANNUAL REPORT
Delaware River Port Authority
Notes to Combined Financial Statements
Note 17. Commitments (Continued)
Direct Pay Letters of Credit (2008 Revenue Refunding Bonds) (Continued): Each Letter of Credit is in anoriginal stated amount which is sufficient to pay the unpaid principal amount of and up to fifty-three (53)days of accrued interest (at a maximum interest rate of 12%) on the related 2008A Revenue RefundingBonds or 2008B Revenue Refunding Bonds, when due, and the Purchase Price of the 2008A RevenueRefunding Bonds or the 2008B Revenue Refunding Bonds tendered or deemed tendered for purchaseand not remarketed. The Credit Provider for the 2008A Revenue Refunding Bonds is only responsible forpayments with respect to the 2008A Revenue Refunding Bonds for which the 2008A Letter of Credit wasissued and the Credit Provider for the 2008B Revenue Refunding Bonds is only responsible for paymentswith respect to the 2008B Revenue Refunding Bonds for which the 2008B Letter of Credit was issued.The 2008A Letter of Credit and the 2008B Letter of Credit were renewed in July of 2010 to expire in Julyof 2013.
As described in the Official Statement for the 2008 Revenue Refunding Bonds, “any draw under Letter ofCredit for principal, interest or Purchase Price creates a reimbursement obligation on the part of theAuthority that is secured by the 1998 Revenue Bond Indenture on a parity basis with the 2008 RevenueRefunding Bonds.” (Additional information related to this transaction and the accompanying Letters ofCredit can be found under Note 12).
The 2008 Direct Pay Letters of Credit were renewed with the Bank of America, N.A. and TD Bank, N.A.,in July 2010 for a three-year period ending in July 2013. Pursuant to the Amendatory Agreements to therespective Reimbursement Agreement with each bank, the Authority cannot request a replacementDPLOC prior to July 2012, unless a termination fee is paid to the banks. As described in Note 20, theseletters of credit were renewed with the Bank of America, N.A. and TD Bank, N.A. subsequent to year end.The new letters of credit with Bank of America, N.A. and TD Bank, N.A. expire on July 22, 2016 andDecember 31, 2017, respectively.
Letter of Credit Provider Ratings: Ratings for these banks, as of December 31, 2012 are shown below:
Moody's S&P Fitch * Moody's S&P Fitch *
Bank of America, N.A. (Series A) A3 A A P-2 A-1 F1Stable Negative Stable
TD Bank, N.A. (Series B) Aa2 AA- AA- P-1 A-1+ F1+Negative Stable Stable
Long-Term Short-Term
* In April 2012, at the Authority’s request, Fitch Ratings assigned a rating of “A/F1” (stable outlook) tothe Authority’s 2008 Series A Revenue Refunding Bonds, based on the DPLOC support provided bythe Bank of America, N.A. (“A/F1”, stable outlook) on the bonds.
On June 21, 2012, Moody's Investor's Service ("Moody's") lowered certain bank ratings. Moody’s: (i)lowered the long-term financial strength rating of Bank of America, N.A. from "A2" to "A3" with a "stable"outlook; and (ii) lowered the short-term financial strength rating of Bank of America, N.A. from "P-1" to "P-2". As a result of such ratings downgrades, Moody's: (i) lowered the respective long-term ratings assignedto the 2008A Revenue Refunding Bonds and 2010B Revenue Refunding Bonds to "A2" from "A1", basedupon a joint rating criteria methodology consisting of, among other things, the financial strength of each ofBank of America, N.A. and the Authority, and placed the long-term review status of each of the 2008ARevenue Refunding Bonds on "Review for Downgrade"; and (ii) lowered the respective short-term ratingsassigned to the 2008A Revenue Refunding Bonds to "VMIG2" from "VMIG1", based solely on thefinancial strength of Bank of America, N.A. and placed the short-term review status of the 2008ARevenue Refunding Bonds and on "Review for Downgrade".
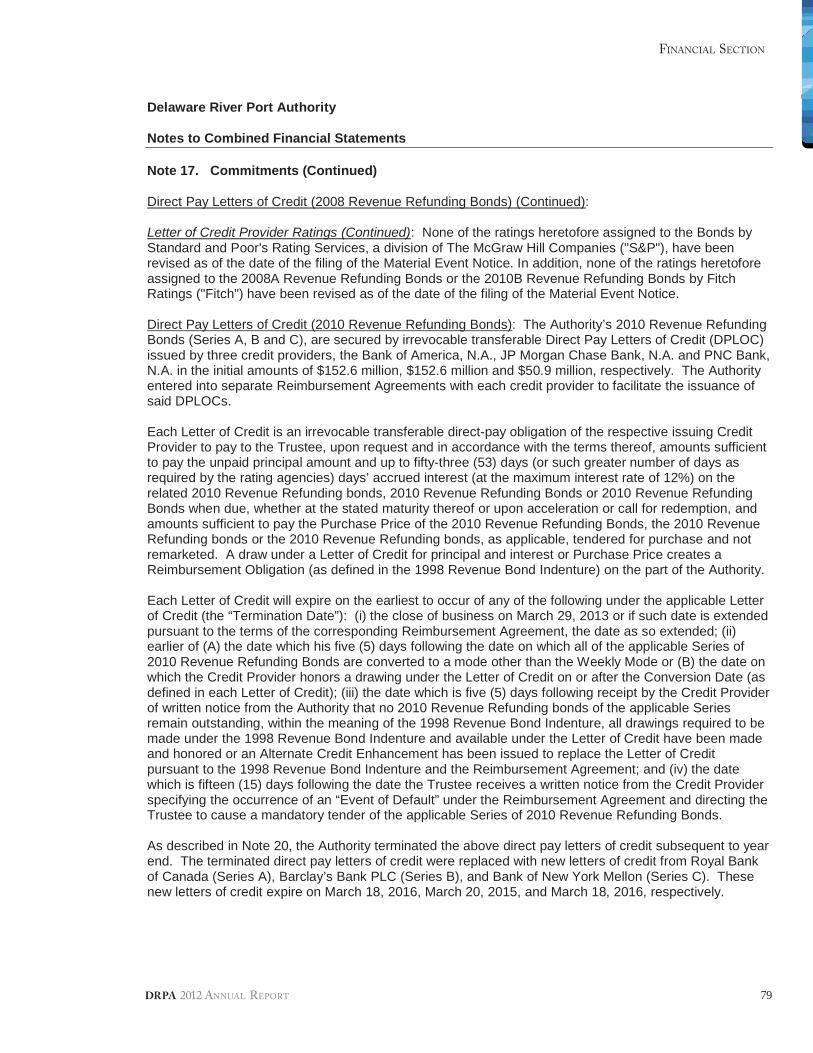
79
FINANCIAL SECTION
DRPA 2012 ANNUAL REPORT
Delaware River Port Authority
Notes to Combined Financial Statements
Note 17. Commitments (Continued)
Direct Pay Letters of Credit (2008 Revenue Refunding Bonds) (Continued):
Letter of Credit Provider Ratings (Continued): None of the ratings heretofore assigned to the Bonds byStandard and Poor's Rating Services, a division of The McGraw Hill Companies ("S&P"), have beenrevised as of the date of the filing of the Material Event Notice. In addition, none of the ratings heretoforeassigned to the 2008A Revenue Refunding Bonds or the 2010B Revenue Refunding Bonds by FitchRatings ("Fitch") have been revised as of the date of the filing of the Material Event Notice.
Direct Pay Letters of Credit (2010 Revenue Refunding Bonds): The Authority’s 2010 Revenue RefundingBonds (Series A, B and C), are secured by irrevocable transferable Direct Pay Letters of Credit (DPLOC)issued by three credit providers, the Bank of America, N.A., JP Morgan Chase Bank, N.A. and PNC Bank,N.A. in the initial amounts of $152.6 million, $152.6 million and $50.9 million, respectively. The Authorityentered into separate Reimbursement Agreements with each credit provider to facilitate the issuance ofsaid DPLOCs.
Each Letter of Credit is an irrevocable transferable direct-pay obligation of the respective issuing CreditProvider to pay to the Trustee, upon request and in accordance with the terms thereof, amounts sufficientto pay the unpaid principal amount and up to fifty-three (53) days (or such greater number of days asrequired by the rating agencies) days’ accrued interest (at the maximum interest rate of 12%) on therelated 2010 Revenue Refunding bonds, 2010 Revenue Refunding Bonds or 2010 Revenue RefundingBonds when due, whether at the stated maturity thereof or upon acceleration or call for redemption, andamounts sufficient to pay the Purchase Price of the 2010 Revenue Refunding Bonds, the 2010 RevenueRefunding bonds or the 2010 Revenue Refunding bonds, as applicable, tendered for purchase and notremarketed. A draw under a Letter of Credit for principal and interest or Purchase Price creates aReimbursement Obligation (as defined in the 1998 Revenue Bond Indenture) on the part of the Authority.
Each Letter of Credit will expire on the earliest to occur of any of the following under the applicable Letterof Credit (the “Termination Date”): (i) the close of business on March 29, 2013 or if such date is extendedpursuant to the terms of the corresponding Reimbursement Agreement, the date as so extended; (ii)earlier of (A) the date which his five (5) days following the date on which all of the applicable Series of2010 Revenue Refunding Bonds are converted to a mode other than the Weekly Mode or (B) the date onwhich the Credit Provider honors a drawing under the Letter of Credit on or after the Conversion Date (asdefined in each Letter of Credit); (iii) the date which is five (5) days following receipt by the Credit Providerof written notice from the Authority that no 2010 Revenue Refunding bonds of the applicable Seriesremain outstanding, within the meaning of the 1998 Revenue Bond Indenture, all drawings required to bemade under the 1998 Revenue Bond Indenture and available under the Letter of Credit have been madeand honored or an Alternate Credit Enhancement has been issued to replace the Letter of Creditpursuant to the 1998 Revenue Bond Indenture and the Reimbursement Agreement; and (iv) the datewhich is fifteen (15) days following the date the Trustee receives a written notice from the Credit Providerspecifying the occurrence of an “Event of Default” under the Reimbursement Agreement and directing theTrustee to cause a mandatory tender of the applicable Series of 2010 Revenue Refunding Bonds.
As described in Note 20, the Authority terminated the above direct pay letters of credit subsequent to yearend. The terminated direct pay letters of credit were replaced with new letters of credit from Royal Bankof Canada (Series A), Barclay’s Bank PLC (Series B), and Bank of New York Mellon (Series C). Thesenew letters of credit expire on March 18, 2016, March 20, 2015, and March 18, 2016, respectively.
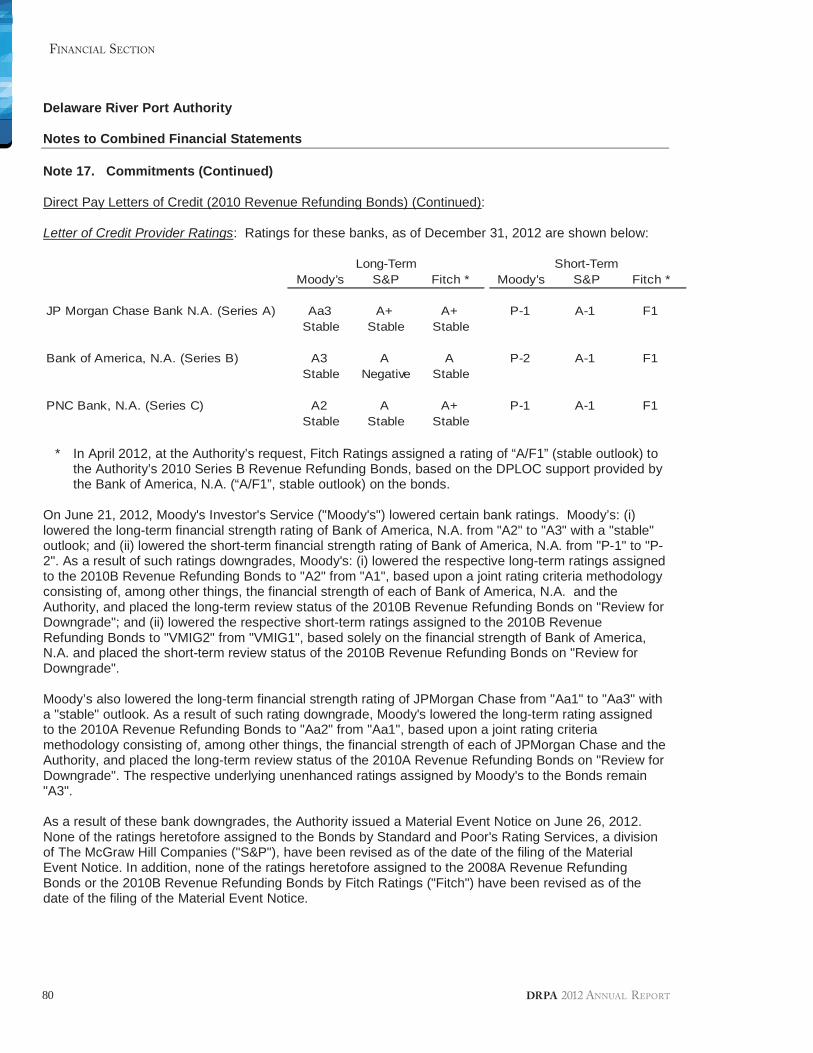
80
FINANCIAL SECTION
DRPA 2012 ANNUAL REPORT
Delaware River Port Authority
Notes to Combined Financial Statements
Note 17. Commitments (Continued)
Direct Pay Letters of Credit (2010 Revenue Refunding Bonds) (Continued):
Letter of Credit Provider Ratings: Ratings for these banks, as of December 31, 2012 are shown below:
Moody's S&P Fitch * Moody's S&P Fitch *
JP Morgan Chase Bank N.A. (Series A) Aa3 A+ A+ P-1 A-1 F1Stable Stable Stable
Bank of America, N.A. (Series B) A3 A A P-2 A-1 F1Stable Negative Stable
PNC Bank, N.A. (Series C) A2 A A+ P-1 A-1 F1Stable Stable Stable
Long-Term Short-Term
* In April 2012, at the Authority’s request, Fitch Ratings assigned a rating of “A/F1” (stable outlook) tothe Authority’s 2010 Series B Revenue Refunding Bonds, based on the DPLOC support provided bythe Bank of America, N.A. (“A/F1”, stable outlook) on the bonds.
On June 21, 2012, Moody's Investor's Service ("Moody's") lowered certain bank ratings. Moody’s: (i)lowered the long-term financial strength rating of Bank of America, N.A. from "A2" to "A3" with a "stable"outlook; and (ii) lowered the short-term financial strength rating of Bank of America, N.A. from "P-1" to "P-2". As a result of such ratings downgrades, Moody's: (i) lowered the respective long-term ratings assignedto the 2010B Revenue Refunding Bonds to "A2" from "A1", based upon a joint rating criteria methodologyconsisting of, among other things, the financial strength of each of Bank of America, N.A. and theAuthority, and placed the long-term review status of the 2010B Revenue Refunding Bonds on "Review forDowngrade"; and (ii) lowered the respective short-term ratings assigned to the 2010B RevenueRefunding Bonds to "VMIG2" from "VMIG1", based solely on the financial strength of Bank of America,N.A. and placed the short-term review status of the 2010B Revenue Refunding Bonds on "Review forDowngrade".
Moody’s also lowered the long-term financial strength rating of JPMorgan Chase from "Aa1" to "Aa3" witha "stable" outlook. As a result of such rating downgrade, Moody's lowered the long-term rating assignedto the 2010A Revenue Refunding Bonds to "Aa2" from "Aa1", based upon a joint rating criteriamethodology consisting of, among other things, the financial strength of each of JPMorgan Chase and theAuthority, and placed the long-term review status of the 2010A Revenue Refunding Bonds on "Review forDowngrade". The respective underlying unenhanced ratings assigned by Moody's to the Bonds remain"A3".
As a result of these bank downgrades, the Authority issued a Material Event Notice on June 26, 2012.None of the ratings heretofore assigned to the Bonds by Standard and Poor's Rating Services, a divisionof The McGraw Hill Companies ("S&P"), have been revised as of the date of the filing of the MaterialEvent Notice. In addition, none of the ratings heretofore assigned to the 2008A Revenue RefundingBonds or the 2010B Revenue Refunding Bonds by Fitch Ratings ("Fitch") have been revised as of thedate of the filing of the Material Event Notice.
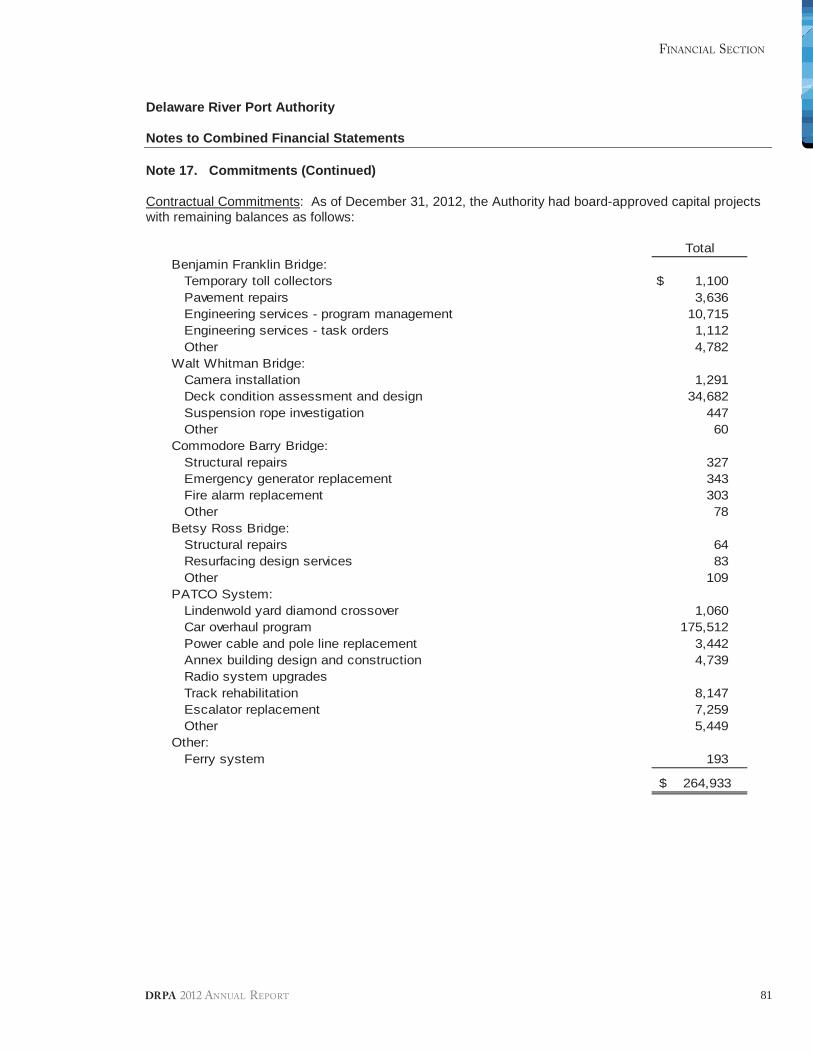
81
FINANCIAL SECTION
DRPA 2012 ANNUAL REPORT
Delaware River Port Authority
Notes to Combined Financial Statements
Note 17. Commitments (Continued)
Contractual Commitments: As of December 31, 2012, the Authority had board-approved capital projectswith remaining balances as follows:
TotalBenjamin Franklin Bridge:
Temporary toll collectors 1,100$Pavement repairs 3,636Engineering services - program management 10,715Engineering services - task orders 1,112Other 4,782
Walt Whitman Bridge:Camera installation 1,291Deck condition assessment and design 34,682Suspension rope investigation 447Other 60
Commodore Barry Bridge:Structural repairs 327Emergency generator replacement 343Fire alarm replacement 303Other 78
Betsy Ross Bridge:Structural repairs 64Resurfacing design services 83Other 109
PATCO System:Lindenwold yard diamond crossover 1,060Car overhaul program 175,512Power cable and pole line replacement 3,442Annex building design and construction 4,739Radio system upgradesTrack rehabilitation 8,147Escalator replacement 7,259Other 5,449
Other:Ferry system 193
264,933$
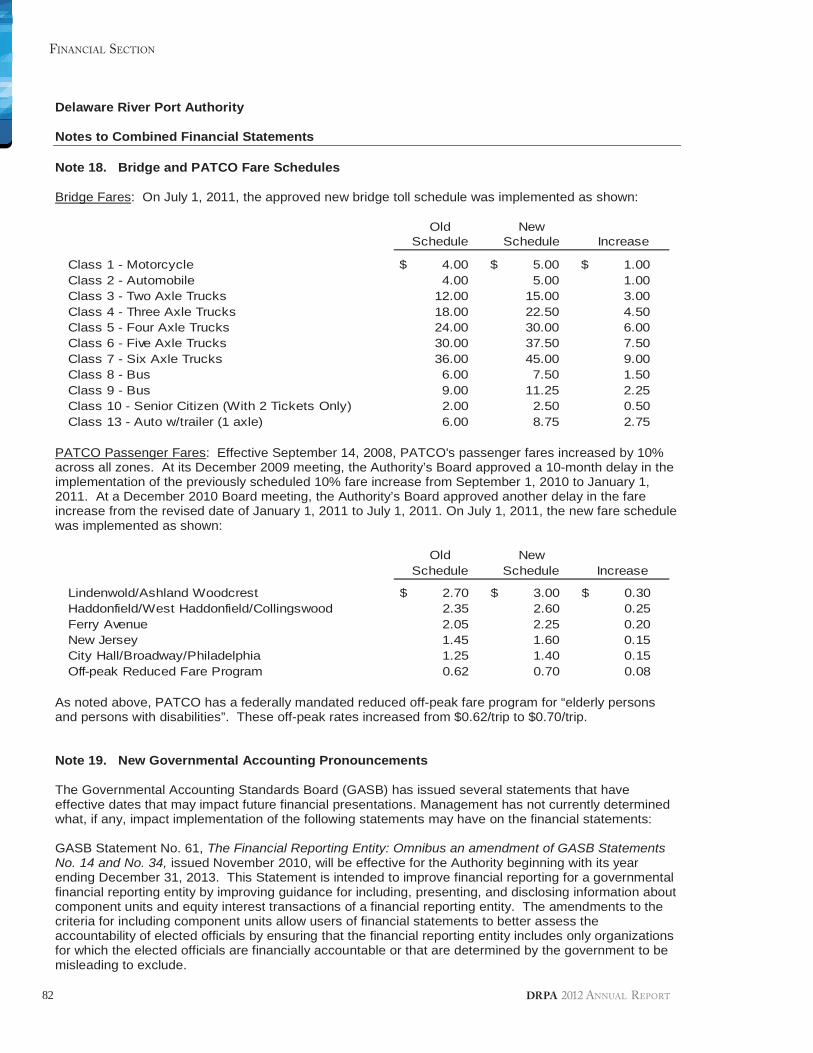
82
FINANCIAL SECTION
DRPA 2012 ANNUAL REPORT
Delaware River Port Authority
Notes to Combined Financial Statements
Note 18. Bridge and PATCO Fare Schedules
Bridge Fares: On July 1, 2011, the approved new bridge toll schedule was implemented as shown:
Old NewSchedule Schedule Increase
Class 1 - Motorcycle 4.00$ 5.00$ 1.00$Class 2 - Automobile 4.00 5.00 1.00Class 3 - Two Axle Trucks 12.00 15.00 3.00Class 4 - Three Axle Trucks 18.00 22.50 4.50Class 5 - Four Axle Trucks 24.00 30.00 6.00Class 6 - Five Axle Trucks 30.00 37.50 7.50Class 7 - Six Axle Trucks 36.00 45.00 9.00Class 8 - Bus 6.00 7.50 1.50Class 9 - Bus 9.00 11.25 2.25Class 10 - Senior Citizen (With 2 Tickets Only) 2.00 2.50 0.50Class 13 - Auto w/trailer (1 axle) 6.00 8.75 2.75
PATCO Passenger Fares: Effective September 14, 2008, PATCO's passenger fares increased by 10%across all zones. At its December 2009 meeting, the Authority’s Board approved a 10-month delay in theimplementation of the previously scheduled 10% fare increase from September 1, 2010 to January 1,2011. At a December 2010 Board meeting, the Authority’s Board approved another delay in the fareincrease from the revised date of January 1, 2011 to July 1, 2011. On July 1, 2011, the new fare schedulewas implemented as shown:
Old NewSchedule Schedule Increase
Lindenwold/Ashland Woodcrest 2.70$ 3.00$ 0.30$Haddonfield/West Haddonfield/Collingswood 2.35 2.60 0.25Ferry Avenue 2.05 2.25 0.20New Jersey 1.45 1.60 0.15City Hall/Broadway/Philadelphia 1.25 1.40 0.15Off-peak Reduced Fare Program 0.62 0.70 0.08
As noted above, PATCO has a federally mandated reduced off-peak fare program for “elderly personsand persons with disabilities”. These off-peak rates increased from $0.62/trip to $0.70/trip.
Note 19. New Governmental Accounting Pronouncements
The Governmental Accounting Standards Board (GASB) has issued several statements that haveeffective dates that may impact future financial presentations. Management has not currently determinedwhat, if any, impact implementation of the following statements may have on the financial statements:
GASB Statement No. 61, The Financial Reporting Entity: Omnibus an amendment of GASB StatementsNo. 14 and No. 34, issued November 2010, will be effective for the Authority beginning with its yearending December 31, 2013. This Statement is intended to improve financial reporting for a governmentalfinancial reporting entity by improving guidance for including, presenting, and disclosing information aboutcomponent units and equity interest transactions of a financial reporting entity. The amendments to thecriteria for including component units allow users of financial statements to better assess theaccountability of elected officials by ensuring that the financial reporting entity includes only organizationsfor which the elected officials are financially accountable or that are determined by the government to bemisleading to exclude.
83
FINANCIAL SECTION
DRPA 2012 ANNUAL REPORT
Delaware River Port Authority
Notes to Combined Financial Statements
Note 19. New Governmental Accounting Pronouncements (Continued)
GASB Statement No. 61, The Financial Reporting Entity: Omnibus an amendment of GASB StatementsNo. 14 and No. 34 (Continued), The amendments to the criteria for blending also improve the focus of afinancial reporting entity on the primary government by ensuring that the primary government includesonly those component units that are so intertwined with the primary government that they are essentiallythe same as the primary government, and by clarifying which component units have that characteristic.
GASB Statement No. 65, Items Previously Reported as Assets and Liabilities, issued March 2012, will beeffective for the Authority beginning with the year ending December 31, 2013. The objective of thisStatement is to either (a) properly classify certain items that were previously reported as assets andliabilities as deferred outflows of resources or deferred inflows of resources or (b) recognized certainitems that were previously reported as assets and liabilities as outflows of resources (expenses orexpenditures) or inflows of resources (revenues). These determinations are based on the definitions ofthat element in Concepts Statements No. 4, Elements of Financial Statements.
GASB Statement No. 66, Technical Corrections—2012—an amendment of GASB Statements No. 10 andNo. 62, issued March 2012, will be effective for the Authority beginning with its year ending December 31,2013. The objective of this Statement is to improve accounting and financial reporting for a governmentalfinancial reporting entity by resolving conflicting guidance that resulted from the issuance of twopronouncements, Statements No. 54, Fund Balance Reporting and Governmental Fund Type Definitions,and No. 62, Codification of Accounting and Financial Reporting Guidance Contained in Pre-November 30,1989 FASB and AICPA Pronouncements.
GASB Statement No. 68, Accounting and Financial Reporting for Pensions—an amendment of GASBStatement No. 27, issued in June 2012, will be effective for the Authority beginning with the year endingDecember 31, 2015. This statement replaces the requirements of Statement No. 27, Accounting forPensions by State and Local Governmental Employers and Statement No. 50, Pension Disclosures, asthey relate to governments that provide pensions through pension plans administered as trusts or similararrangements that meet certain criteria. Statement 68 requires governments providing defined benefitpensions to recognize their long-term obligation for pension benefits as a liability for the first time, and tomore comprehensively and comparably measure the annual costs of pension benefits. The Statementalso enhances accountability and transparency through revised and new note disclosures and requiredsupplementary information (RSI).
GASB Statement No. 69, Government Combinations and Disposals of Government Operations, issuedJanuary 2013, will be effective for the Authority beginning with the year ending December 31, 2014. ThisStatement establishes accounting and financial reporting standards related to government combinationsand disposals of government operations. As used in this Statement, the term government combinationsincludes a variety of transactions referred to as mergers, acquisitions, and transfers of operations.
This Statement requires disclosures to be made about government combinations and disposals ofgovernment operations to enable financial statement users to evaluate the nature and financial effects ofthose transactions.
GASB Statement No. 70, Accounting and Financial Reporting for Nonexchange Financial Guarantees,issued April 2013, will be effective for the Authority beginning with the year ending December 31, 2014.Some governments extend financial guarantees for the obligations of another government, a not-for-profitentity, or a private entity without directly receiving equal or approximately equal value in exchange (anonexchange transaction). As a part of this nonexchange financial guarantee, a government commits toindemnify the holder of the obligation if the entity that issued the obligation does not fulfill its paymentrequirements. Also, some governments issue obligations that are guaranteed by other entities in anonexchange transaction. The objective of this Statement is to improve accounting and financial reportingby state and local governments that extend and receive nonexchange financial guarantees.
FINANCIAL SECTION
DRPA 2012 ANNUAL REPORT84
Delaware River Port Authority
Notes to Combined Financial Statements
Note 19. New Governmental Accounting Pronouncements (Continued)
GASB Statement No. 70, Accounting and Financial Reporting for Nonexchange Financial Guarantees(Continued): This Statement specifies the information required to be disclosed by governments thatextend nonexchange financial guarantees. In addition, this Statement requires new information to bedisclosed by governments that receive nonexchange financial guarantees.
Note 20. Subsequent Events
Letter of Credit Substitutions and Extensions: In March 2013, the Authority terminated the Direct PayLetter of Credits (DPLOC) supporting the 2010 Revenue Refunding Bonds Series A, Series B and SeriesC, with JPMorgan Chase, Bank of America, N.A. and PNC Bank, respectively, and then replaced theseDPLOCs by securing new letters of credit from the following banks: Royal Bank of Canada (Series A),Barclay’s Bank PLC (Series B) and The Bank of New York Mellon (Series C). The outstanding principalamount of the remarketed variable rate bonds (remarketed in weekly mode), remains at $350.0 million.The Authority issued a “Remarketing Memorandum Dated March 12, 2013” describing this letter of creditsubstitution transaction.
On June 28, 2013, the Authority amended and extended its DPLOC with TD Bank, N.A. supporting the2008 Revenue Refunding Bonds, Series B, to expire on December 31, 2017. In addition, the Authorityamended and extended its DPLOC with the Bank of America, N.A., effective on July 22, 2013, to expireon July 22, 2016.
Material Event Notices – TD Bank, N.A. and Assured Guaranty: During January, the Authority filed two(2) material event notices related to Moody’s downgrade of TD Bank, N.A. ratings and its downgrade ofAssured Guaranty’s ratings (from Aa3 to A2). TD Bank, N.A.’s DPLOC supports the Authority’s 2008Revenue Refunding Bonds and Assured Guaranty guarantees the principal and interest payments oncertain Authority bond issues. The long-term debt ratings of the Authority remain unchanged as shown inthe ratings section in Note 12.
LEAP Academy: The Authority was advised by the bond trustee, and counsel for LEAP Academy, thatLEAP had lost its tax exemption for failure to file Form 990 for the past three years. LEAP bonds wereissued through the Authority; however, DRPA has no responsibility for repayment of this debt, as the debtis guaranteed by Rutgers University. LEAP filed a material event notice in January 2013. This issue hasbeen partially resolved by an IRS ruling reinstating its tax exemption status for a partial period; however,LEAP is still in the process of resolving this matter. The 501(c)3 status was not retroactively reinstated forthe bond period 2010-2012 but an appeal is being filed.
Debt Authorized, Not Issued: At its regularly scheduled February meeting, the Authority’s Boardapproved Resolution #13-030, which authorized the Authority to issue up to $500 million in new fixed-raterevenue bonds to fund a large portion of its $746.0 million five year 2013 Capital Plan. The Authorityexpects to issue new revenue bonds in the $400-$500 million principal amount sometime in the early thirdquarter, after completion of a new traffic study, which is in progress. (Approved resolutions can be foundon the Authority website, www.drpa.org under “Board Information, Approved Resolutions”).
Investment Policy: At its February 20, 2013 meeting, the Authority’s Board approved Resolution #13-034,adopting a new comprehensive General Fund investment policy which revised and refined its existingconservative investment policy. The policy clearly defines the approved, and non-approved, investmentvehicles, in which its existing investment management firms may invest the Authority’s funds. This policybecame effective July 1, 2013.
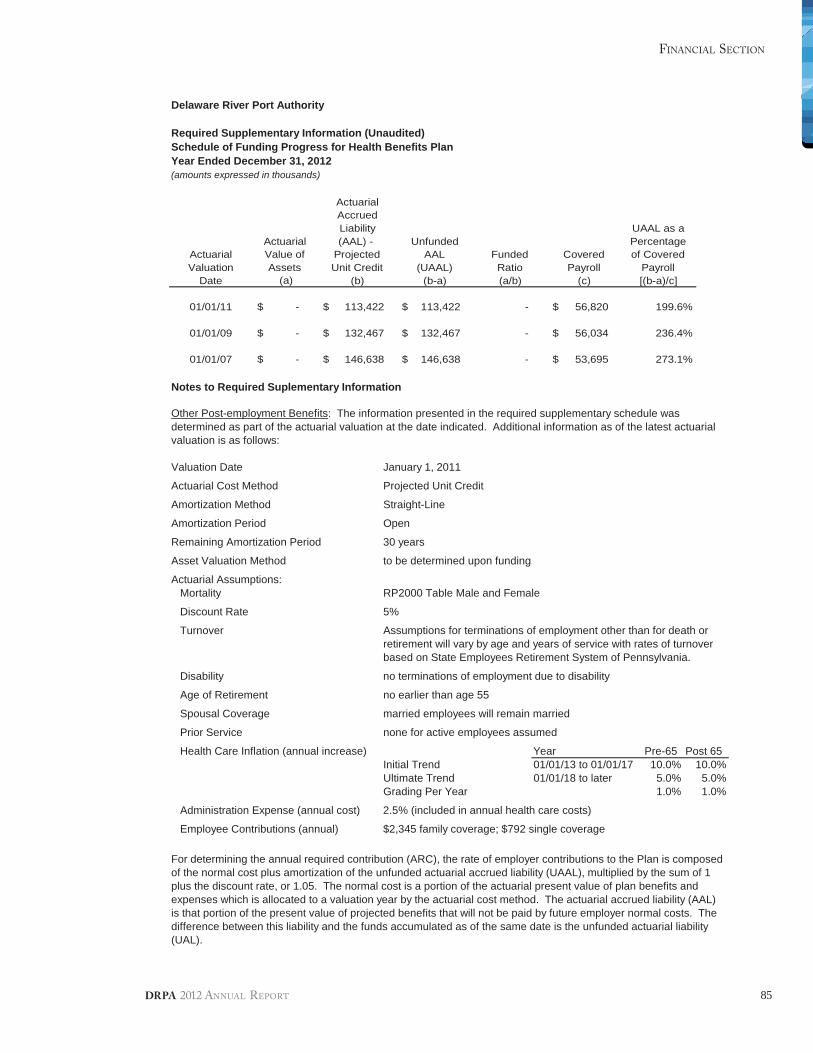
85
FINANCIAL SECTION
DRPA 2012 ANNUAL REPORT
Delaware River Port Authority
Required Supplementary Information (Unaudited)Schedule of Funding Progress for Health Benefits PlanYear Ended December 31, 2012(amounts expressed in thousands)
Notes to Required Suplementary Information
Valuation Date January 1, 2011
Actuarial Cost Method Projected Unit Credit
Amortization Method Straight-Line
Amortization Period Open
Remaining Amortization Period 30 years
Asset Valuation Method to be determined upon funding
Actuarial Assumptions:Mortality RP2000 Table Male and Female
Discount Rate 5%
Turnover
Disability no terminations of employment due to disability
Age of Retirement no earlier than age 55
Spousal Coverage married employees will remain married
Prior Service none for active employees assumed
Health Care Inflation (annual increase) Year Pre-65 Post 65Initial Trend 01/01/13 to 01/01/17 10.0% 10.0%Ultimate Trend 01/01/18 to later 5.0% 5.0%Grading Per Year 1.0% 1.0%
Administration Expense (annual cost) 2.5% (included in annual health care costs)
Employee Contributions (annual) $2,345 family coverage; $792 single coverage
For determining the annual required contribution (ARC), the rate of employer contributions to the Plan is composedof the normal cost plus amortization of the unfunded actuarial accrued liability (UAAL), multiplied by the sum of 1plus the discount rate, or 1.05. The normal cost is a portion of the actuarial present value of plan benefits andexpenses which is allocated to a valuation year by the actuarial cost method. The actuarial accrued liability (AAL)is that portion of the present value of projected benefits that will not be paid by future employer normal costs. Thedifference between this liability and the funds accumulated as of the same date is the unfunded actuarial liability(UAL).
Assumptions for terminations of employment other than for death orretirement will vary by age and years of service with rates of turnoverbased on State Employees Retirement System of Pennsylvania.
Other Post-employment Benefits: The information presented in the required supplementary schedule wasdetermined as part of the actuarial valuation at the date indicated. Additional information as of the latest actuarialvaluation is as follows:
ActuarialAccruedLiability UAAL as a
Actuarial (AAL) - Unfunded PercentageActuarial Value of Projected AAL Funded Covered of CoveredValuation Assets Unit Credit (UAAL) Ratio Payroll Payroll
Date (a) (b) (b-a) (a/b) (c) [(b-a)/c]
01/01/11 -$ 113,422$ 113,422$ - 56,820$ 199.6%
01/01/09 -$ 132,467$ 132,467$ - 56,034$ 236.4%
01/01/07 -$ 146,638$ 146,638$ - 53,695$ 273.1%
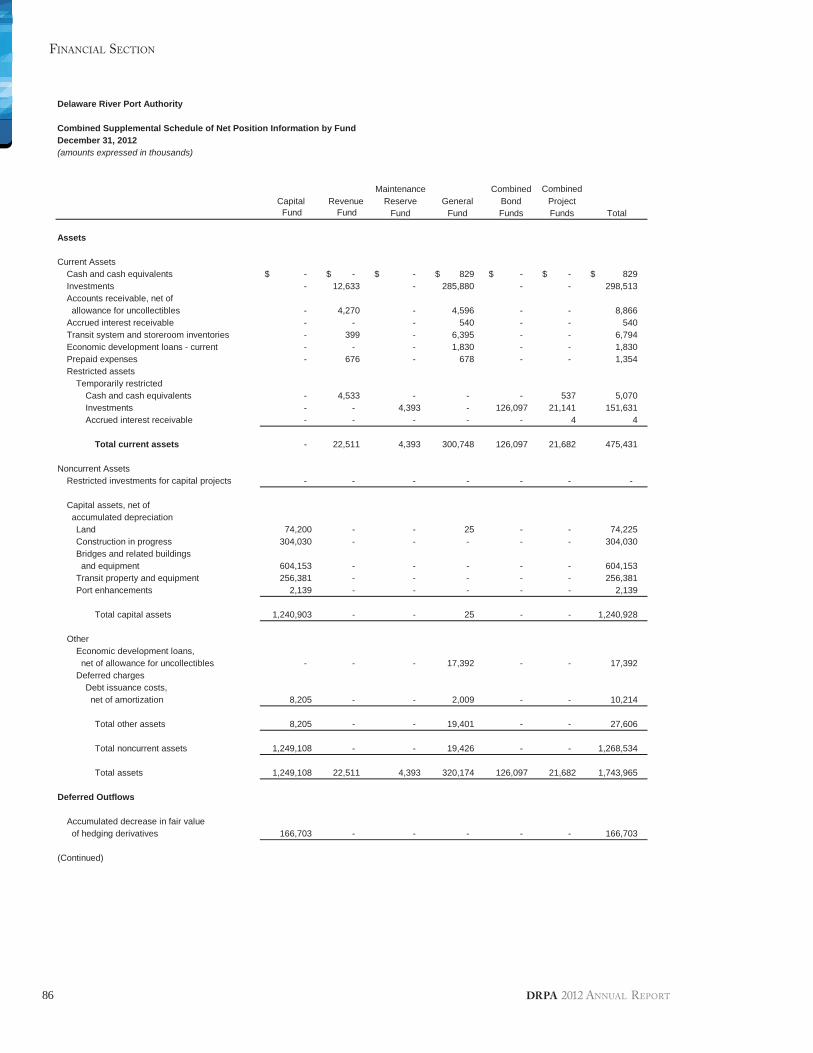
86
FINANCIAL SECTION
DRPA 2012 ANNUAL REPORT
Delaware River Port Authority
Combined Supplemental Schedule of Net Position Information by FundDecember 31, 2012(amounts expressed in thousands)
Maintenance Combined CombinedCapital Revenue Reserve General Bond ProjectFund Fund Fund Fund Funds Funds Total
Assets
Current AssetsCash and cash equivalents -$ -$ -$ 829$ -$ -$ 829$Investments - 12,633 - 285,880 - - 298,513Accounts receivable, net ofallowance for uncollectibles - 4,270 - 4,596 - - 8,866
Accrued interest receivable - - - 540 - - 540Transit system and storeroom inventories - 399 - 6,395 - - 6,794Economic development loans - current - - - 1,830 - - 1,830Prepaid expenses - 676 - 678 - - 1,354Restricted assets
Temporarily restrictedCash and cash equivalents - 4,533 - - - 537 5,070Investments - - 4,393 - 126,097 21,141 151,631Accrued interest receivable - - - - - 4 4
Total current assets - 22,511 4,393 300,748 126,097 21,682 475,431
Noncurrent AssetsRestricted investments for capital projects - - - - - - -
Capital assets, net ofaccumulated depreciationLand 74,200 - - 25 - - 74,225Construction in progress 304,030 - - - - - 304,030Bridges and related buildingsand equipment 604,153 - - - - - 604,153
Transit property and equipment 256,381 - - - - - 256,381Port enhancements 2,139 - - - - - 2,139
Total capital assets 1,240,903 - - 25 - - 1,240,928
OtherEconomic development loans,net of allowance for uncollectibles - - - 17,392 - - 17,392
Deferred chargesDebt issuance costs,net of amortization 8,205 - - 2,009 - - 10,214
Total other assets 8,205 - - 19,401 - - 27,606
Total noncurrent assets 1,249,108 - - 19,426 - - 1,268,534
Total assets 1,249,108 22,511 4,393 320,174 126,097 21,682 1,743,965
Deferred Outflows
Accumulated decrease in fair valueof hedging derivatives 166,703 - - - - - 166,703
(Continued)
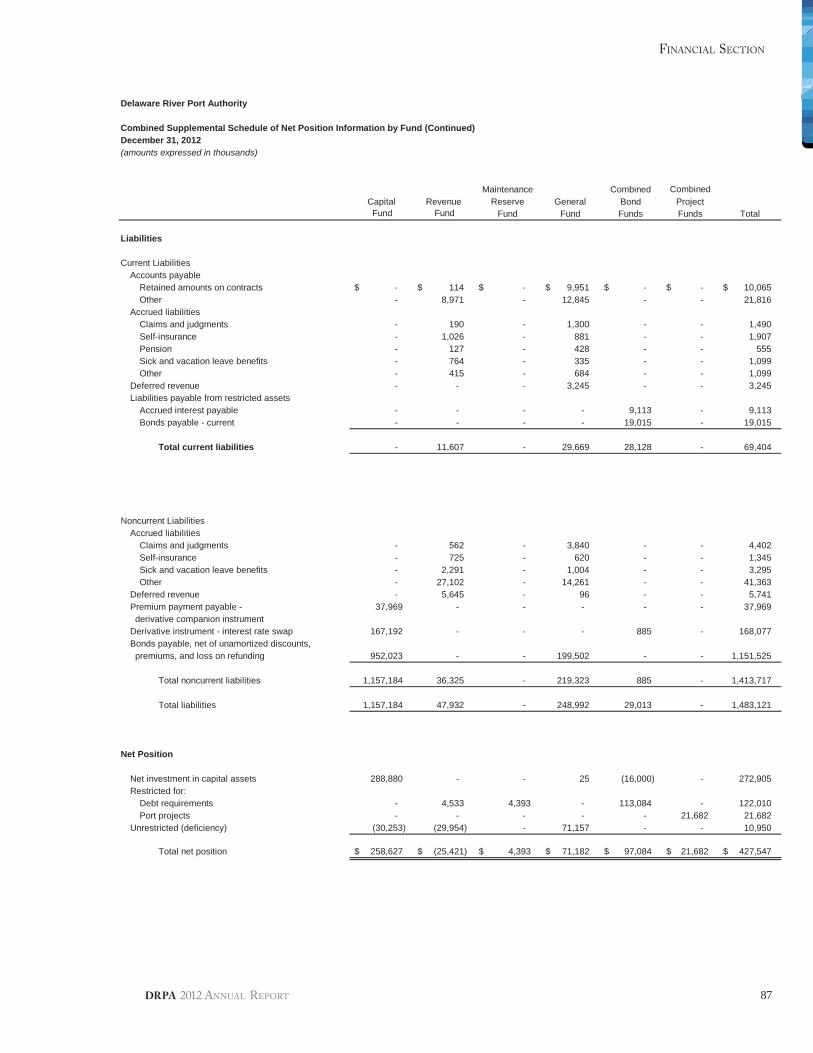
87
FINANCIAL SECTION
DRPA 2012 ANNUAL REPORT
Delaware River Port Authority
Combined Supplemental Schedule of Net Position Information by Fund (Continued)December 31, 2012(amounts expressed in thousands)
Maintenance Combined CombinedCapital Revenue Reserve General Bond ProjectFund Fund Fund Fund Funds Funds Total
Liabilities
Current LiabilitiesAccounts payable
Retained amounts on contracts -$ 114$ -$ 9,951$ -$ -$ 10,065$Other - 8,971 - 12,845 - - 21,816
Accrued liabilitiesClaims and judgments - 190 - 1,300 - - 1,490Self-insurance - 1,026 - 881 - - 1,907Pension - 127 - 428 - - 555Sick and vacation leave benefits - 764 - 335 - - 1,099Other - 415 - 684 - - 1,099
Deferred revenue - - - 3,245 - - 3,245Liabilities payable from restricted assets
Accrued interest payable - - - - 9,113 - 9,113Bonds payable - current - - - - 19,015 - 19,015
Total current liabilities - 11,607 - 29,669 28,128 - 69,404
Noncurrent LiabilitiesAccrued liabilities
Claims and judgments - 562 - 3,840 - - 4,402Self-insurance - 725 - 620 - - 1,345Sick and vacation leave benefits - 2,291 - 1,004 - - 3,295Other - 27,102 - 14,261 - - 41,363
Deferred revenue - 5,645 - 96 - - 5,741Premium payment payable - 37,969 - - - - - 37,969derivative companion instrument
Derivative instrument - interest rate swap 167,192 - - - 885 - 168,077Bonds payable, net of unamortized discounts,premiums, and loss on refunding 952,023 - - 199,502 - - 1,151,525
Total noncurrent liabilities 1,157,184 36,325 - 219,323 885 - 1,413,717
Total liabilities 1,157,184 47,932 - 248,992 29,013 - 1,483,121
Net Position
Net investment in capital assets 288,880 - - 25 (16,000) - 272,905Restricted for:
Debt requirements - 4,533 4,393 - 113,084 - 122,010Port projects - - - - - 21,682 21,682
Unrestricted (deficiency) (30,253) (29,954) - 71,157 - - 10,950
Total net position 258,627$ (25,421)$ 4,393$ 71,182$ 97,084$ 21,682$ 427,547$
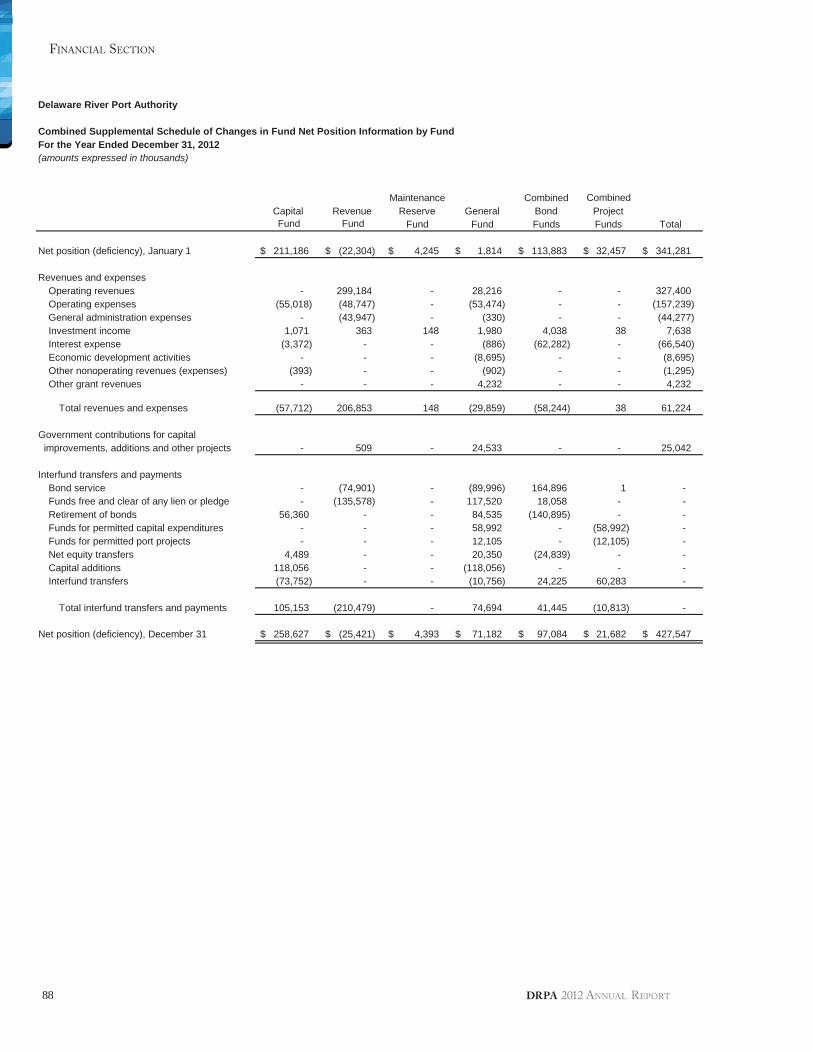
88
FINANCIAL SECTION
DRPA 2012 ANNUAL REPORT
Delaware River Port Authority
Combined Supplemental Schedule of Changes in Fund Net Position Information by FundFor the Year Ended December 31, 2012(amounts expressed in thousands)
Maintenance Combined CombinedCapital Revenue Reserve General Bond ProjectFund Fund Fund Fund Funds Funds Total
Net position (deficiency), January 1 211,186$ (22,304)$ 4,245$ 1,814$ 113,883$ 32,457$ 341,281$
Revenues and expensesOperating revenues - 299,184 - 28,216 - - 327,400Operating expenses (55,018) (48,747) - (53,474) - - (157,239)General administration expenses - (43,947) - (330) - - (44,277)Investment income 1,071 363 148 1,980 4,038 38 7,638Interest expense (3,372) - - (886) (62,282) - (66,540)Economic development activities - - - (8,695) - - (8,695)Other nonoperating revenues (expenses) (393) - - (902) - - (1,295)Other grant revenues - - - 4,232 - - 4,232
Total revenues and expenses (57,712) 206,853 148 (29,859) (58,244) 38 61,224
Government contributions for capitalimprovements, additions and other projects - 509 - 24,533 - - 25,042
Interfund transfers and paymentsBond service - (74,901) - (89,996) 164,896 1 -Funds free and clear of any lien or pledge - (135,578) - 117,520 18,058 - -Retirement of bonds 56,360 - - 84,535 (140,895) - -Funds for permitted capital expenditures - - - 58,992 - (58,992) -Funds for permitted port projects - - - 12,105 - (12,105) -Net equity transfers 4,489 - - 20,350 (24,839) - -Capital additions 118,056 - - (118,056) - - -Interfund transfers (73,752) - - (10,756) 24,225 60,283 -
Total interfund transfers and payments 105,153 (210,479) - 74,694 41,445 (10,813) -
Net position (deficiency), December 31 258,627$ (25,421)$ 4,393$ 71,182$ 97,084$ 21,682$ 427,547$
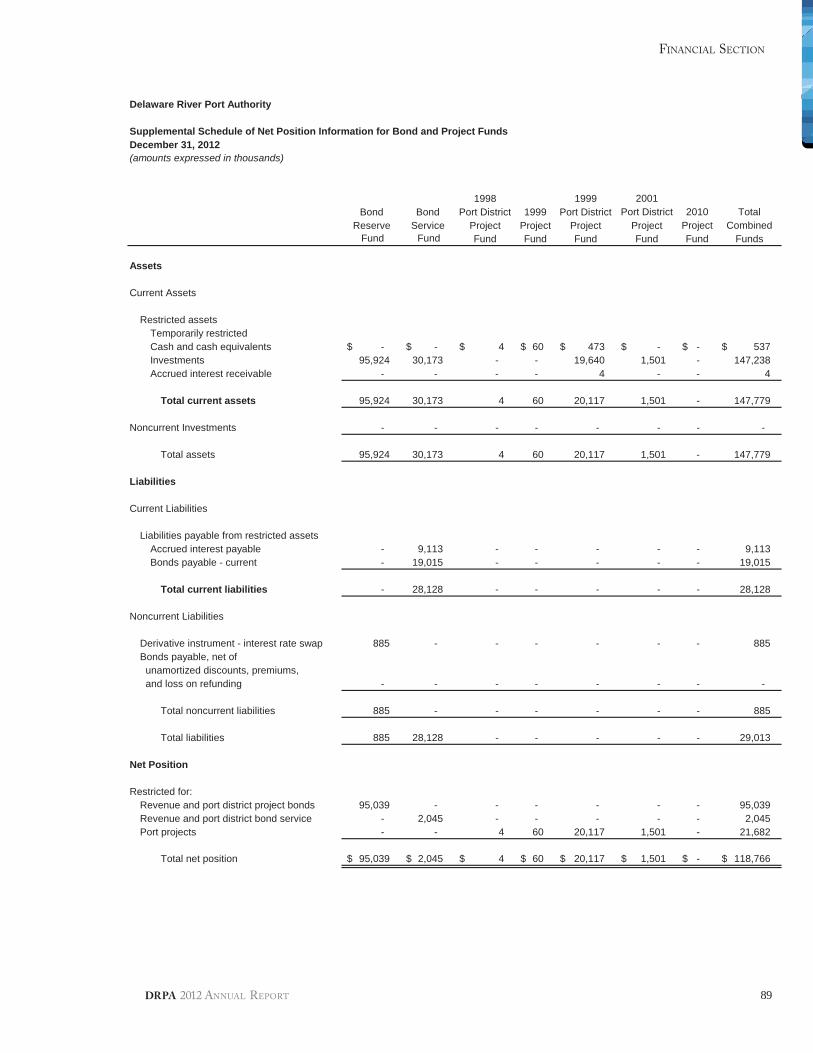
89
FINANCIAL SECTION
DRPA 2012 ANNUAL REPORT
Delaware River Port Authority
Supplemental Schedule of Net Position Information for Bond and Project FundsDecember 31, 2012(amounts expressed in thousands)
1998 1999 2001Bond Bond Port District 1999 Port District Port District 2010 Total
Reserve Service Project Project Project Project Project CombinedFund Fund Fund Fund Fund Fund Fund Funds
Assets
Current Assets
Restricted assetsTemporarily restrictedCash and cash equivalents -$ -$ 4$ 60$ 473$ -$ -$ 537$Investments 95,924 30,173 - - 19,640 1,501 - 147,238Accrued interest receivable - - - - 4 - - 4
Total current assets 95,924 30,173 4 60 20,117 1,501 - 147,779
Noncurrent Investments - - - - - - - -
Total assets 95,924 30,173 4 60 20,117 1,501 - 147,779
Liabilities
Current Liabilities
Liabilities payable from restricted assetsAccrued interest payable - 9,113 - - - - - 9,113Bonds payable - current - 19,015 - - - - - 19,015
Total current liabilities - 28,128 - - - - - 28,128
Noncurrent Liabilities
Derivative instrument - interest rate swap 885 - - - - - - 885Bonds payable, net of
unamortized discounts, premiums,and loss on refunding - - - - - - - -
Total noncurrent liabilities 885 - - - - - - 885
Total liabilities 885 28,128 - - - - - 29,013
Net Position
Restricted for:Revenue and port district project bonds 95,039 - - - - - - 95,039Revenue and port district bond service - 2,045 - - - - - 2,045Port projects - - 4 60 20,117 1,501 - 21,682
Total net position 95,039$ 2,045$ 4$ 60$ 20,117$ 1,501$ -$ 118,766$
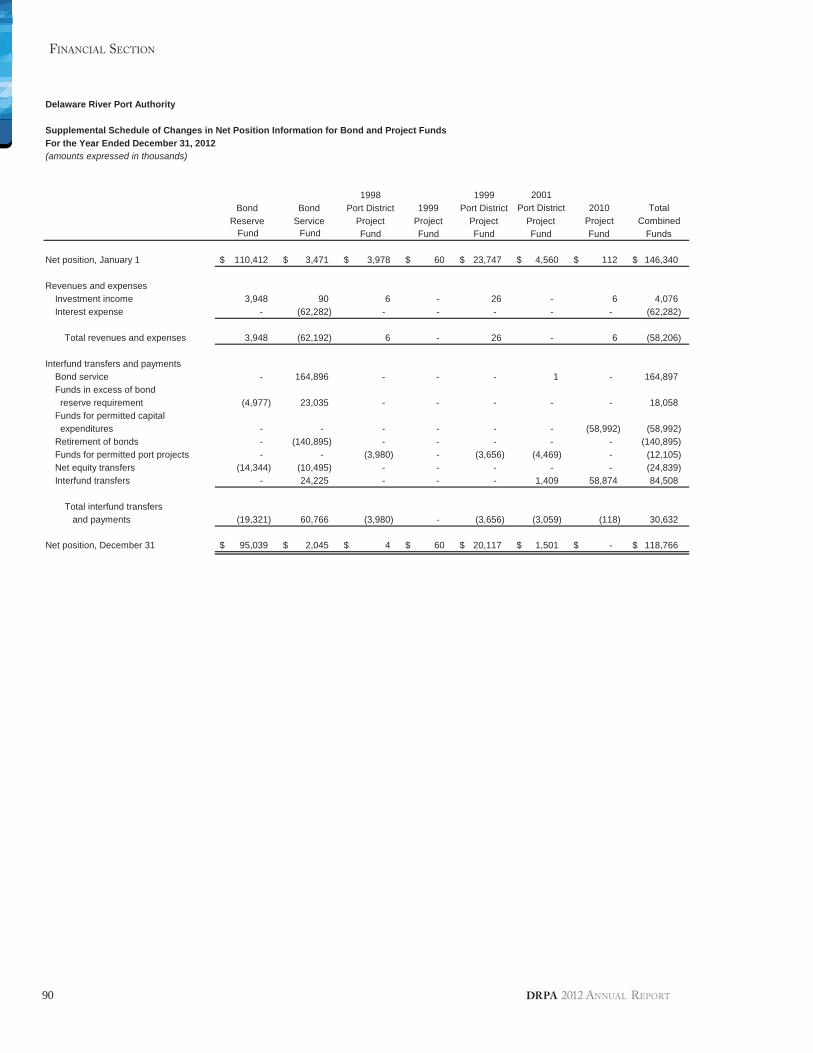
90
FINANCIAL SECTION
DRPA 2012 ANNUAL REPORT
Delaware River Port Authority
Supplemental Schedule of Changes in Net Position Information for Bond and Project FundsFor the Year Ended December 31, 2012(amounts expressed in thousands)
1998 1999 2001Bond Bond Port District 1999 Port District Port District 2010 Total
Reserve Service Project Project Project Project Project CombinedFund Fund Fund Fund Fund Fund Fund Funds
Net position, January 1 110,412$ 3,471$ 3,978$ 60$ 23,747$ 4,560$ 112$ 146,340$
Revenues and expensesInvestment income 3,948 90 6 - 26 - 6 4,076Interest expense - (62,282) - - - - - (62,282)
Total revenues and expenses 3,948 (62,192) 6 - 26 - 6 (58,206)
Interfund transfers and paymentsBond service - 164,896 - - - 1 - 164,897Funds in excess of bond
reserve requirement (4,977) 23,035 - - - - - 18,058Funds for permitted capital
expenditures - - - - - - (58,992) (58,992)Retirement of bonds - (140,895) - - - - - (140,895)Funds for permitted port projects - - (3,980) - (3,656) (4,469) - (12,105)Net equity transfers (14,344) (10,495) - - - - - (24,839)Interfund transfers - 24,225 - - - 1,409 58,874 84,508
Total interfund transfersand payments (19,321) 60,766 (3,980) - (3,656) (3,059) (118) 30,632
Net position, December 31 95,039$ 2,045$ 4$ 60$ 20,117$ 1,501$ -$ 118,766$

StatisticalSection

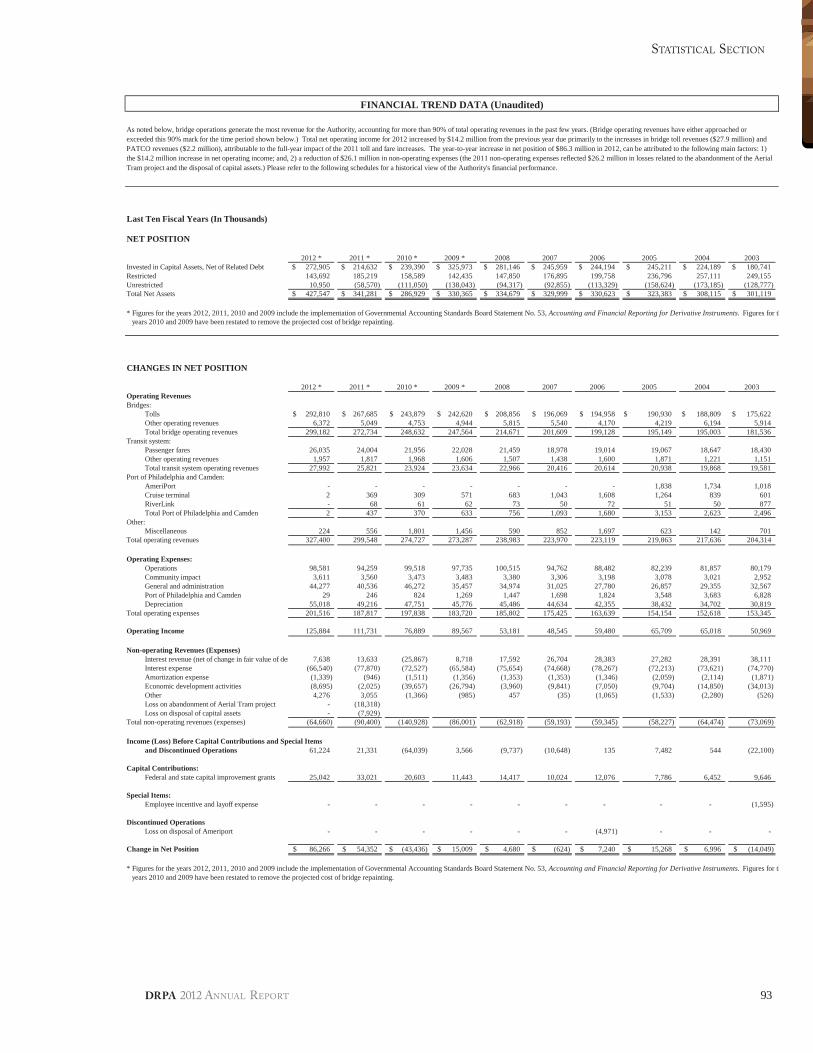
STATISTICAL SECTION
DRPA 2012 ANNUAL REPORT 93
FINANCIAL TREND DATA (Unaudited)
Last Ten Fiscal Years (In Thousands)
NET POSITION
2012 * 2011 * 2010 * 2009 * 2008 2007 2006 2005 2004 2003Invested in Capital Assets, Net of Related Debt 272,905$ 214,632$ 239,390$ 325,973$ 281,146$ 245,959$ 244,194$ 245,211$ 224,189$ 180,741$Restricted 143,692 185,219 158,589 142,435 147,850 176,895 199,758 236,796 257,111 249,155Unrestricted 10,950 (58,570) (111,050) (138,043) (94,317) (92,855) (113,329) (158,624) (173,185) (128,777)Total Net Assets 427,547$ 341,281$ 286,929$ 330,365$ 334,679$ 329,999$ 330,623$ 323,383$ 308,115$ 301,119$
* Figures for the years 2012, 2011, 2010 and 2009 include the implementation of Governmental Accounting Standards Board Statement No. 53, Accounting and Financial Reporting for Derivative Instruments. Figures for th
CHANGES IN NET POSITION
2012 * 2011 * 2010 * 2009 * 2008 2007 2006 2005 2004 2003Operating RevenuesBridges:
Tolls 292,810$ 267,685$ 243,879$ 242,620$ 208,856$ 196,069$ 194,958$ 190,930$ 188,809$ 175,622$Other operating revenues 6,372 5,049 4,753 4,944 5,815 5,540 4,170 4,219 6,194 5,914Total bridge operating revenues 299,182 272,734 248,632 247,564 214,671 201,609 199,128 195,149 195,003 181,536
Transit system:Passenger fares 26,035 24,004 21,956 22,028 21,459 18,978 19,014 19,067 18,647 18,430Other operating revenues 1,957 1,817 1,968 1,606 1,507 1,438 1,600 1,871 1,221 1,151Total transit system operating revenues 27,992 25,821 23,924 23,634 22,966 20,416 20,614 20,938 19,868 19,581
Port of Philadelphia and Camden:AmeriPort - - - - - - - 1,838 1,734 1,018Cruise terminal 2 369 309 571 683 1,043 1,608 1,264 839 601RiverLink - 68 61 62 73 50 72 51 50 877Total Port of Philadelphia and Camden 2 437 370 633 756 1,093 1,680 3,153 2,623 2,496
Other:Miscellaneous 224 556 1,801 1,456 590 852 1,697 623 142 701
Total operating revenues 327,400 299,548 274,727 273,287 238,983 223,970 223,119 219,863 217,636 204,314
Operating Expenses:Operations 98,581 94,259 99,518 97,735 100,515 94,762 88,482 82,239 81,857 80,179Community impact 3,611 3,560 3,473 3,483 3,380 3,306 3,198 3,078 3,021 2,952General and administration 44,277 40,536 46,272 35,457 34,974 31,025 27,780 26,857 29,355 32,567Port of Philadelphia and Camden 29 246 824 1,269 1,447 1,698 1,824 3,548 3,683 6,828Depreciation 55,018 49,216 47,751 45,776 45,486 44,634 42,355 38,432 34,702 30,819
Total operating expenses 201,516 187,817 197,838 183,720 185,802 175,425 163,639 154,154 152,618 153,345
Operating Income 125,884 111,731 76,889 89,567 53,181 48,545 59,480 65,709 65,018 50,969
Non-operating Revenues (Expenses)Interest revenue (net of change in fair value of der 7,638 13,633 (25,867) 8,718 17,592 26,704 28,383 27,282 28,391 38,111Interest expense (66,540) (77,870) (72,527) (65,584) (75,654) (74,668) (78,267) (72,213) (73,621) (74,770)Amortization expense (1,339) (946) (1,511) (1,356) (1,353) (1,353) (1,346) (2,059) (2,114) (1,871)Economic development activities (8,695) (2,025) (39,657) (26,794) (3,960) (9,841) (7,050) (9,704) (14,850) (34,013)Other 4,276 3,055 (1,366) (985) 457 (35) (1,065) (1,533) (2,280) (526)Loss on abandonment of Aerial Tram project - (18,318)Loss on disposal of capital assets - (7,929)
Total non-operating revenues (expenses) (64,660) (90,400) (140,928) (86,001) (62,918) (59,193) (59,345) (58,227) (64,474) (73,069)
Income (Loss) Before Capital Contributions and Special Itemsand Discontinued Operations 61,224 21,331 (64,039) 3,566 (9,737) (10,648) 135 7,482 544 (22,100)
Capital Contributions:Federal and state capital improvement grants 25,042 33,021 20,603 11,443 14,417 10,024 12,076 7,786 6,452 9,646
Special Items:Employee incentive and layoff expense - - - - - - - - - (1,595)
Discontinued OperationsLoss on disposal of Ameriport - - - - - - (4,971) - - -
Change in Net Position 86,266$ 54,352$ (43,436)$ 15,009$ 4,680$ (624)$ 7,240$ 15,268$ 6,996$ (14,049)$
* Figures for the years 2012, 2011, 2010 and 2009 include the implementation of Governmental Accounting Standards Board Statement No. 53, Accounting and Financial Reporting for Derivative Instruments. Figures for thyears 2010 and 2009 have been restated to remove the projected cost of bridge repainting.
As noted below, bridge operations generate the most revenue for the Authority, accounting for more than 90% of total operating revenues in the past few years. (Bridge operating revenues have either approached orexceeded this 90% mark for the time period shown below.) Total net operating income for 2012 increased by $14.2 million from the previous year due primarily to the increases in bridge toll revenues ($27.9 million) andPATCO revenues ($2.2 million), attributable to the full-year impact of the 2011 toll and fare increases. The year-to-year increase in net position of $86.3 million in 2012, can be attributed to the following main factors: 1)the $14.2 million increase in net operating income; and, 2) a reduction of $26.1 million in non-operating expenses (the 2011 non-operating expenses reflected $26.2 million in losses related to the abandonment of the AerialTram project and the disposal of capital assets.) Please refer to the following schedules for a historical view of the Authority's financial performance.
years 2010 and 2009 have been restated to remove the projected cost of bridge repainting.
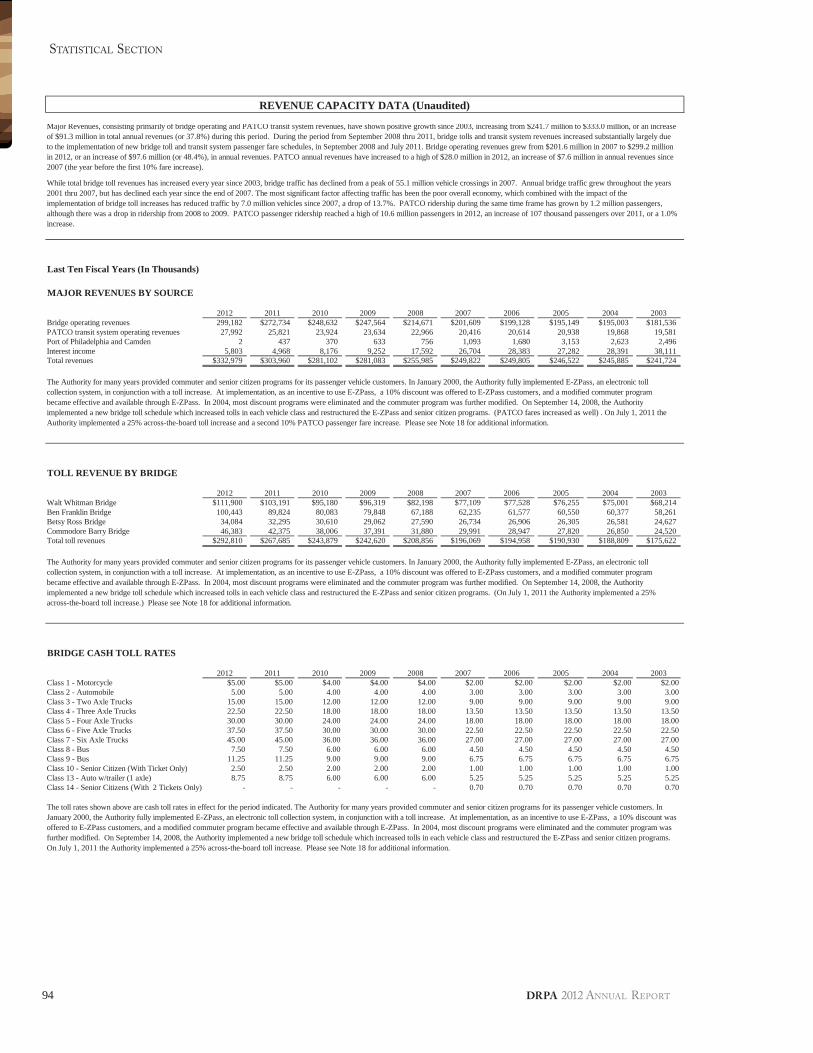
94
STATISTICAL SECTION
DRPA 2012 ANNUAL REPORT
REVENUE CAPACITY DATA (Unaudited)
Last Ten Fiscal Years (In Thousands)
MAJOR REVENUES BY SOURCE
2012 2011 2010 2009 2008 2007 2006 2005 2004 2003Bridge operating revenues 299,182 $272,734 $248,632 $247,564 $214,671 $201,609 $199,128 $195,149 $195,003 $181,536PATCO transit system operating revenues 27,992 25,821 23,924 23,634 22,966 20,416 20,614 20,938 19,868 19,581Port of Philadelphia and Camden 2 437 370 633 756 1,093 1,680 3,153 2,623 2,496Interest income 5,803 4,968 8,176 9,252 17,592 26,704 28,383 27,282 28,391 38,111Total revenues $332,979 $303,960 $281,102 $281,083 $255,985 $249,822 $249,805 $246,522 $245,885 $241,724
TOLL REVENUE BY BRIDGE
2012 2011 2010 2009 2008 2007 2006 2005 2004 2003Walt Whitman Bridge $111,900 $103,191 $95,180 $96,319 $82,198 $77,109 $77,528 $76,255 $75,001 $68,214Ben Franklin Bridge 100,443 89,824 80,083 79,848 67,188 62,235 61,577 60,550 60,377 58,261Betsy Ross Bridge 34,084 32,295 30,610 29,062 27,590 26,734 26,906 26,305 26,581 24,627Commodore Barry Bridge 46,383 42,375 38,006 37,391 31,880 29,991 28,947 27,820 26,850 24,520Total toll revenues $292,810 $267,685 $243,879 $242,620 $208,856 $196,069 $194,958 $190,930 $188,809 $175,622
BRIDGE CASH TOLL RATES
2012 2011 2010 2009 2008 2007 2006 2005 2004 2003Class 1 - Motorcycle $5.00 $5.00 $4.00 $4.00 $4.00 $2.00 $2.00 $2.00 $2.00 $2.00Class 2 - Automobile 5.00 5.00 4.00 4.00 4.00 3.00 3.00 3.00 3.00 3.00Class 3 - Two Axle Trucks 15.00 15.00 12.00 12.00 12.00 9.00 9.00 9.00 9.00 9.00Class 4 - Three Axle Trucks 22.50 22.50 18.00 18.00 18.00 13.50 13.50 13.50 13.50 13.50Class 5 - Four Axle Trucks 30.00 30.00 24.00 24.00 24.00 18.00 18.00 18.00 18.00 18.00Class 6 - Five Axle Trucks 37.50 37.50 30.00 30.00 30.00 22.50 22.50 22.50 22.50 22.50Class 7 - Six Axle Trucks 45.00 45.00 36.00 36.00 36.00 27.00 27.00 27.00 27.00 27.00Class 8 - Bus 7.50 7.50 6.00 6.00 6.00 4.50 4.50 4.50 4.50 4.50Class 9 - Bus 11.25 11.25 9.00 9.00 9.00 6.75 6.75 6.75 6.75 6.75Class 10 - Senior Citizen (With Ticket Only) 2.50 2.50 2.00 2.00 2.00 1.00 1.00 1.00 1.00 1.00Class 13 - Auto w/trailer (1 axle) 8.75 8.75 6.00 6.00 6.00 5.25 5.25 5.25 5.25 5.25Class 14 - Senior Citizens (With 2 Tickets Only) - - - - - 0.70 0.70 0.70 0.70 0.70
Major Revenues, consisting primarily of bridge operating and PATCO transit system revenues, have shown positive growth since 2003, increasing from $241.7 million to $333.0 million, or an increaseof $91.3 million in total annual revenues (or 37.8%) during this period. During the period from September 2008 thru 2011, bridge tolls and transit system revenues increased substantially largely dueto the implementation of new bridge toll and transit system passenger fare schedules, in September 2008 and July 2011. Bridge operating revenues grew from $201.6 million in 2007 to $299.2 millionin 2012, or an increase of $97.6 million (or 48.4%), in annual revenues. PATCO annual revenues have increased to a high of $28.0 million in 2012, an increase of $7.6 million in annual revenues since2007 (the year before the first 10% fare increase).
While total bridge toll revenues has increased every year since 2003, bridge traffic has declined from a peak of 55.1 million vehicle crossings in 2007. Annual bridge traffic grew throughout the years2001 thru 2007, but has declined each year since the end of 2007. The most significant factor affecting traffic has been the poor overall economy, which combined with the impact of theimplementation of bridge toll increases has reduced traffic by 7.0 million vehicles since 2007, a drop of 13.7%. PATCO ridership during the same time frame has grown by 1.2 million passengers,although there was a drop in ridership from 2008 to 2009. PATCO passenger ridership reached a high of 10.6 million passengers in 2012, an increase of 107 thousand passengers over 2011, or a 1.0%increase.
The Authority for many years provided commuter and senior citizen programs for its passenger vehicle customers. In January 2000, the Authority fully implemented E-ZPass, an electronic tollcollection system, in conjunction with a toll increase. At implementation, as an incentive to use E-ZPass, a 10% discount was offered to E-ZPass customers, and a modified commuter programbecame effective and available through E-ZPass. In 2004, most discount programs were eliminated and the commuter program was further modified. On September 14, 2008, the Authorityimplemented a new bridge toll schedule which increased tolls in each vehicle class and restructured the E-ZPass and senior citizen programs. (PATCO fares increased as well) . On July 1, 2011 theAuthority implemented a 25% across-the-board toll increase and a second 10% PATCO passenger fare increase. Please see Note 18 for additional information.
The Authority for many years provided commuter and senior citizen programs for its passenger vehicle customers. In January 2000, the Authority fully implemented E-ZPass, an electronic tollcollection system, in conjunction with a toll increase. At implementation, as an incentive to use E-ZPass, a 10% discount was offered to E-ZPass customers, and a modified commuter programbecame effective and available through E-ZPass. In 2004, most discount programs were eliminated and the commuter program was further modified. On September 14, 2008, the Authorityimplemented a new bridge toll schedule which increased tolls in each vehicle class and restructured the E-ZPass and senior citizen programs. (On July 1, 2011 the Authority implemented a 25%across-the-board toll increase.) Please see Note 18 for additional information.
The toll rates shown above are cash toll rates in effect for the period indicated. The Authority for many years provided commuter and senior citizen programs for its passenger vehicle customers. InJanuary 2000, the Authority fully implemented E-ZPass, an electronic toll collection system, in conjunction with a toll increase. At implementation, as an incentive to use E-ZPass, a 10% discount wasoffered to E-ZPass customers, and a modified commuter program became effective and available through E-ZPass. In 2004, most discount programs were eliminated and the commuter program wasfurther modified. On September 14, 2008, the Authority implemented a new bridge toll schedule which increased tolls in each vehicle class and restructured the E-ZPass and senior citizen programs.On July 1, 2011 the Authority implemented a 25% across-the-board toll increase. Please see Note 18 for additional information.
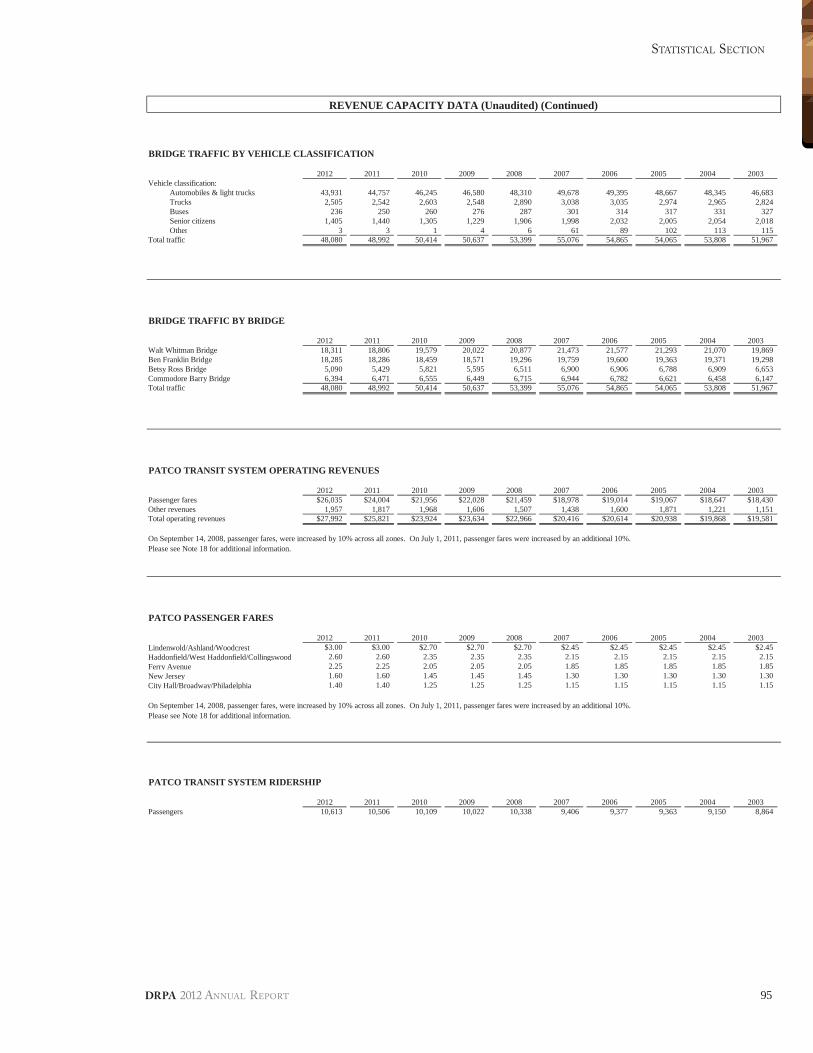
95
STATISTICAL SECTION
DRPA 2012 ANNUAL REPORT
REVENUE CAPACITY DATA (Unaudited) (Continued)
BRIDGE TRAFFIC BY VEHICLE CLASSIFICATION
2012 2011 2010 2009 2008 2007 2006 2005 2004 2003Vehicle classification:
Automobiles & light trucks 43,931 44,757 46,245 46,580 48,310 49,678 49,395 48,667 48,345 46,683Trucks 2,505 2,542 2,603 2,548 2,890 3,038 3,035 2,974 2,965 2,824Buses 236 250 260 276 287 301 314 317 331 327Senior citizens 1,405 1,440 1,305 1,229 1,906 1,998 2,032 2,005 2,054 2,018Other 3 3 1 4 6 61 89 102 113 115
Total traffic 48,080 48,992 50,414 50,637 53,399 55,076 54,865 54,065 53,808 51,967
BRIDGE TRAFFIC BY BRIDGE
2012 2011 2010 2009 2008 2007 2006 2005 2004 2003Walt Whitman Bridge 18,311 18,806 19,579 20,022 20,877 21,473 21,577 21,293 21,070 19,869Ben Franklin Bridge 18,285 18,286 18,459 18,571 19,296 19,759 19,600 19,363 19,371 19,298Betsy Ross Bridge 5,090 5,429 5,821 5,595 6,511 6,900 6,906 6,788 6,909 6,653Commodore Barry Bridge 6,394 6,471 6,555 6,449 6,715 6,944 6,782 6,621 6,458 6,147Total traffic 48,080 48,992 50,414 50,637 53,399 55,076 54,865 54,065 53,808 51,967
PATCO TRANSIT SYSTEM OPERATING REVENUES
2012 2011 2010 2009 2008 2007 2006 2005 2004 2003Passenger fares $26,035 $24,004 $21,956 $22,028 $21,459 $18,978 $19,014 $19,067 $18,647 $18,430Other revenues 1,957 1,817 1,968 1,606 1,507 1,438 1,600 1,871 1,221 1,151Total operating revenues $27,992 $25,821 $23,924 $23,634 $22,966 $20,416 $20,614 $20,938 $19,868 $19,581
Please see Note 18 for additional information.
PATCO PASSENGER FARES
2012 2011 2010 2009 2008 2007 2006 2005 2004 2003Lindenwold/Ashland/Woodcrest $3.00 $3.00 $2.70 $2.70 $2.70 $2.45 $2.45 $2.45 $2.45 $2.45Haddonfield/West Haddonfield/Collingswood 2.60 2.60 2.35 2.35 2.35 2.15 2.15 2.15 2.15 2.15Ferry Avenue 2.25 2.25 2.05 2.05 2.05 1.85 1.85 1.85 1.85 1.85New Jersey 1.60 1.60 1.45 1.45 1.45 1.30 1.30 1.30 1.30 1.30City Hall/Broadway/Philadelphia 1.40 1.40 1.25 1.25 1.25 1.15 1.15 1.15 1.15 1.15
Please see Note 18 for additional information.
PATCO TRANSIT SYSTEM RIDERSHIP
2012 2011 2010 2009 2008 2007 2006 2005 2004 2003Passengers 10,613 10,506 10,109 10,022 10,338 9,406 9,377 9,363 9,150 8,864
On September 14, 2008, passenger fares, were increased by 10% across all zones. On July 1, 2011, passenger fares were increased by an additional 10%.
On September 14, 2008, passenger fares, were increased by 10% across all zones. On July 1, 2011, passenger fares were increased by an additional 10%.
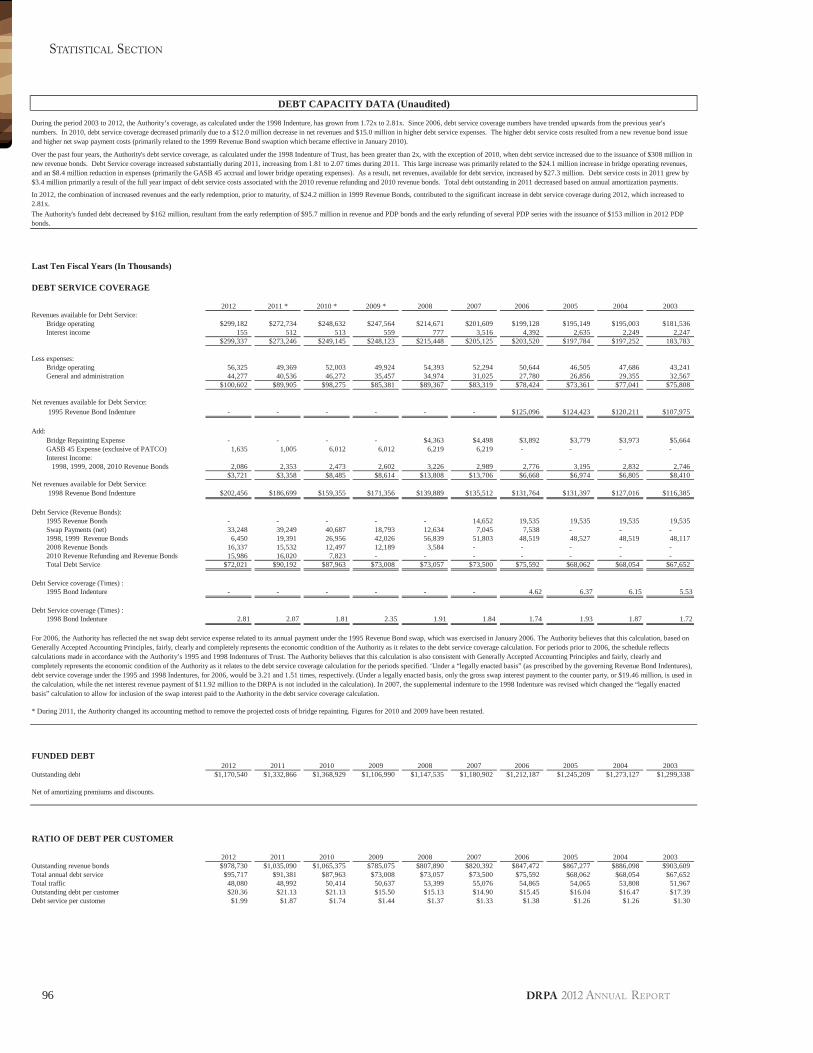
96
STATISTICAL SECTION
DRPA 2012 ANNUAL REPORT
DEBT CAPACITY DATA (Unaudited)
Last Ten Fiscal Years (In Thousands)
DEBT SERVICE COVERAGE
2012 2011 * 2010 * 2009 * 2008 2007 2006 2005 2004 2003Revenues available for Debt Service:
Bridge operating $299,182 $272,734 $248,632 $247,564 $214,671 $201,609 $199,128 $195,149 $195,003 $181,536Interest income 155 512 513 559 777 3,516 4,392 2,635 2,249 2,247
$299,337 $273,246 $249,145 $248,123 $215,448 $205,125 $203,520 $197,784 $197,252 183,783
Less expenses:Bridge operating 56,325 49,369 52,003 49,924 54,393 52,294 50,644 46,505 47,686 43,241General and administration 44,277 40,536 46,272 35,457 34,974 31,025 27,780 26,856 29,355 32,567
$100,602 $89,905 $98,275 $85,381 $89,367 $83,319 $78,424 $73,361 $77,041 $75,808
Net revenues available for Debt Service:1995 Revenue Bond Indenture - - - - - - $125,096 $124,423 $120,211 $107,975
Add:Bridge Repainting Expense - - - - $4,363 $4,498 $3,892 $3,779 $3,973 $5,664GASB 45 Expense (exclusive of PATCO) 1,635 1,005 6,012 6,012 6,219 6,219 - - - -Interest Income:
1998, 1999, 2008, 2010 Revenue Bonds 2,086 2,353 2,473 2,602 3,226 2,989 2,776 3,195 2,832 2,746$3,721 $3,358 $8,485 $8,614 $13,808 $13,706 $6,668 $6,974 $6,805 $8,410
Net revenues available for Debt Service:1998 Revenue Bond Indenture $202,456 $186,699 $159,355 $171,356 $139,889 $135,512 $131,764 $131,397 $127,016 $116,385
Debt Service (Revenue Bonds):1995 Revenue Bonds - - - - - 14,652 19,535 19,535 19,535 19,535Swap Payments (net) 33,248 39,249 40,687 18,793 12,634 7,045 7,538 - - -1998, 1999 Revenue Bonds 6,450 19,391 26,956 42,026 56,839 51,803 48,519 48,527 48,519 48,1172008 Revenue Bonds 16,337 15,532 12,497 12,189 3,584 - - - - -2010 Revenue Refunding and Revenue Bonds 15,986 16,020 7,823 - - - - - - -Total Debt Service $72,021 $90,192 $87,963 $73,008 $73,057 $73,500 $75,592 $68,062 $68,054 $67,652
Debt Service coverage (Times) :1995 Bond Indenture - - - - - - 4.62 6.37 6.15 5.53
Debt Service coverage (Times) :1998 Bond Indenture 2.81 2.07 1.81 2.35 1.91 1.84 1.74 1.93 1.87 1.72
* During 2011, the Authority changed its accounting method to remove the projected costs of bridge repainting. Figures for 2010 and 2009 have been restated.
FUNDED DEBT2012 2011 2010 2009 2008 2007 2006 2005 2004 2003
Outstanding debt $1,170,540 $1,332,866 $1,368,929 $1,106,990 $1,147,535 $1,180,902 $1,212,187 $1,245,209 $1,273,127 $1,299,338
Net of amortizing premiums and discounts.
RATIO OF DEBT PER CUSTOMER
2012 2011 2010 2009 2008 2007 2006 2005 2004 2003Outstanding revenue bonds $978,730 $1,035,090 $1,065,375 $785,075 $807,890 $820,392 $847,472 $867,277 $886,098 $903,609Total annual debt service $95,717 $91,381 $87,963 $73,008 $73,057 $73,500 $75,592 $68,062 $68,054 $67,652Total traffic 48,080 48,992 50,414 50,637 53,399 55,076 54,865 54,065 53,808 51,967Outstanding debt per customer $20.36 $21.13 $21.13 $15.50 $15.13 $14.90 $15.45 $16.04 $16.47 $17.39Debt service per customer $1.99 $1.87 $1.74 $1.44 $1.37 $1.33 $1.38 $1.26 $1.26 $1.30
During the period 2003 to 2012, the Authority’s coverage, as calculated under the 1998 Indenture, has grown from 1.72x to 2.81x. Since 2006, debt service coverage numbers have trended upwards from the previous year'snumbers. In 2010, debt service coverage decreased primarily due to a $12.0 million decrease in net revenues and $15.0 million in higher debt service expenses. The higher debt service costs resulted from a new revenue bond issueand higher net swap payment costs (primarily related to the 1999 Revenue Bond swaption which became effective in January 2010).
Over the past four years, the Authority's debt service coverage, as calculated under the 1998 Indenture of Trust, has been greater than 2x, with the exception of 2010, when debt service increased due to the issuance of $308 million innew revenue bonds. Debt Service coverage increased substantially during 2011, increasing from 1.81 to 2.07 times during 2011. This large increase was primarily related to the $24.1 million increase in bridge operating revenues,and an $8.4 million reduction in expenses (primarily the GASB 45 accrual and lower bridge operating expenses). As a result, net revenues, available for debt service, increased by $27.3 million. Debt service costs in 2011 grew by$3.4 million primarily a result of the full year impact of debt service costs associated with the 2010 revenue refunding and 2010 revenue bonds. Total debt outstanding in 2011 decreased based on annual amortization payments.
For 2006, the Authority has reflected the net swap debt service expense related to its annual payment under the 1995 Revenue Bond swap, which was exercised in January 2006. The Authority believes that this calculation, based onGenerally Accepted Accounting Principles, fairly, clearly and completely represents the economic condition of the Authority as it relates to the debt service coverage calculation. For periods prior to 2006, the schedule reflectscalculations made in accordance with the Authority’s 1995 and 1998 Indentures of Trust. The Authority believes that this calculation is also consistent with Generally Accepted Accounting Principles and fairly, clearly andcompletely represents the economic condition of the Authority as it relates to the debt service coverage calculation for the periods specified. ‘Under a “legally enacted basis” (as prescribed by the governing Revenue Bond Indentures),debt service coverage under the 1995 and 1998 Indentures, for 2006, would be 3.21 and 1.51 times, respectively. (Under a legally enacted basis, only the gross swap interest payment to the counter party, or $19.46 million, is used inthe calculation, while the net interest revenue payment of $11.92 million to the DRPA is not included in the calculation). In 2007, the supplemental indenture to the 1998 Indenture was revised which changed the “legally enactedbasis” calculation to allow for inclusion of the swap interest paid to the Authority in the debt service coverage calculation.
The Authority's funded debt decreased by $162 million, resultant from the early redemption of $95.7 million in revenue and PDP bonds and the early refunding of several PDP series with the issuance of $153 million in 2012 PDPbonds.
In 2012, the combination of increased revenues and the early redemption, prior to maturity, of $24.2 million in 1999 Revenue Bonds, contributed to the significant increase in debt service coverage during 2012, which increased to2.81x.
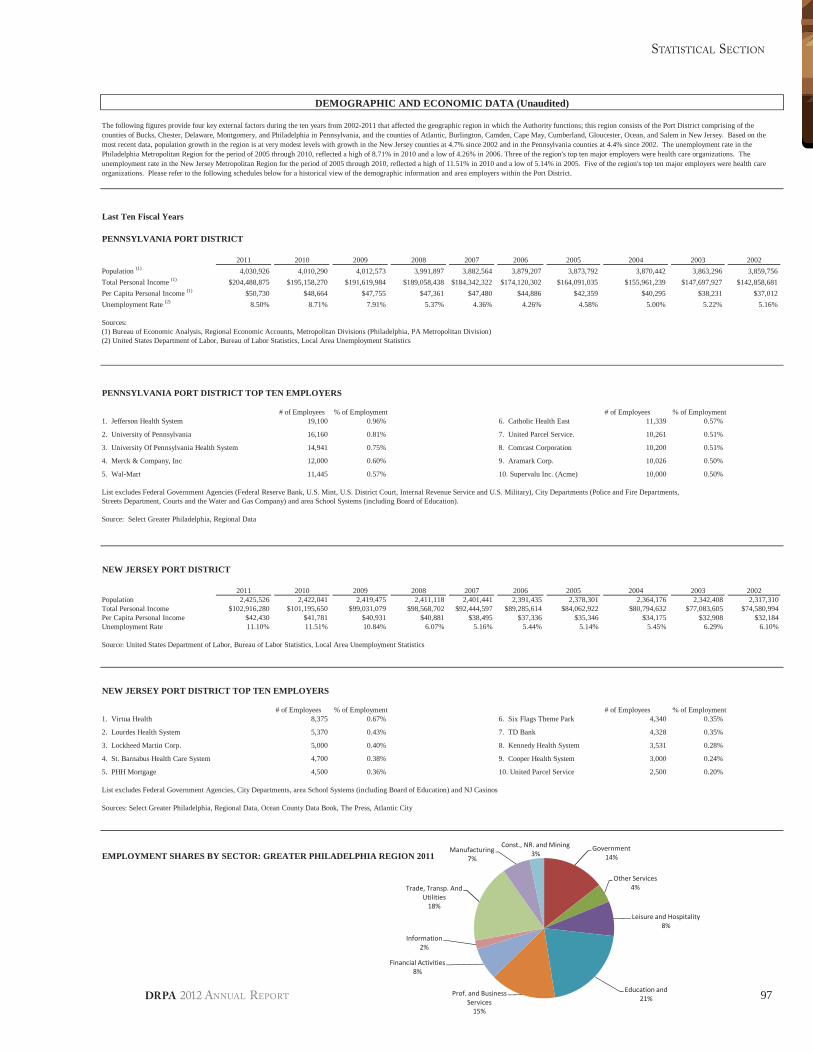
97
STATISTICAL SECTION
DRPA 2012 ANNUAL REPORT
Government14%
Other Services4%
Leisure and Hospitality8%
Education and21%
Prof. and BusinessServices15%
Financial Activities8%
Information2%
Trade, Transp. AndUtilities18%
Manufacturing7%
Const., NR. and Mining3%
DEMOGRAPHIC AND ECONOMIC DATA (Unaudited)
Last Ten Fiscal Years
PENNSYLVANIA PORT DISTRICT
2011 2010 2009 2008 2007 2006 2005 2004 2003 2002Population (1) 4,030,926 4,010,290 4,012,573 3,991,897 3,882,564 3,879,207 3,873,792 3,870,442 3,863,296 3,859,756Total Personal Income (1) $204,488,875 $195,158,270 $191,619,984 $189,058,438 $184,342,322 $174,120,302 $164,091,035 $155,961,239 $147,697,927 $142,858,681Per Capita Personal Income (1) $50,730 $48,664 $47,755 $47,361 $47,480 $44,886 $42,359 $40,295 $38,231 $37,012Unemployment Rate (2) 8.50% 8.71% 7.91% 5.37% 4.36% 4.26% 4.58% 5.00% 5.22% 5.16%
Sources:(1) Bureau of Economic Analysis, Regional Economic Accounts, Metropolitan Divisions (Philadelphia, PA Metropolitan Division)(2) United States Department of Labor, Bureau of Labor Statistics, Local Area Unemployment Statistics
PENNSYLVANIA PORT DISTRICT TOP TEN EMPLOYERS
# of Employees % of Employment # of Employees % of Employment1. Jefferson Health System 19,100 0.96% 6. Catholic Health East 11,339 0.57%
2. University of Pennsylvania 16,160 0.81% 7. United Parcel Service. 10,261 0.51%
3. University Of Pennsylvania Health System 14,941 0.75% 8. Comcast Corporation 10,200 0.51%
4. Merck & Company, Inc 12,000 0.60% 9. Aramark Corp. 10,026 0.50%
5. Wal-Mart 11,445 0.57% 10. Supervalu Inc. (Acme) 10,000 0.50%
List excludes Federal Government Agencies (Federal Reserve Bank, U.S. Mint, U.S. District Court, Internal Revenue Service and U.S. Military), City Departments (Police and Fire Departments,Streets Department, Courts and the Water and Gas Company) and area School Systems (including Board of Education).
Source: Select Greater Philadelphia, Regional Data
NEW JERSEY PORT DISTRICT
2011 2010 2009 2008 2007 2006 2005 2004 2003 2002Population 2,425,526 2,422,041 2,419,475 2,411,118 2,401,441 2,391,435 2,378,301 2,364,176 2,342,408 2,317,310Total Personal Income $102,916,280 $101,195,650 $99,031,079 $98,568,702 $92,444,597 $89,285,614 $84,062,922 $80,794,632 $77,083,605 $74,580,994Per Capita Personal Income $42,430 $41,781 $40,931 $40,881 $38,495 $37,336 $35,346 $34,175 $32,908 $32,184Unemployment Rate 11.10% 11.51% 10.84% 6.07% 5.16% 5.44% 5.14% 5.45% 6.29% 6.10%
Source: United States Department of Labor, Bureau of Labor Statistics, Local Area Unemployment Statistics
NEW JERSEY PORT DISTRICT TOP TEN EMPLOYERS
# of Employees % of Employment # of Employees % of Employment1. Virtua Health 8,375 0.67% 6. Six Flags Theme Park 4,340 0.35%
2. Lourdes Health System 5,370 0.43% 7. TD Bank 4,328 0.35%
3. Lockheed Martin Corp. 5,000 0.40% 8. Kennedy Health System 3,531 0.28%
4. St. Barnabus Health Care System 4,700 0.38% 9. Cooper Health System 3,000 0.24%
5. PHH Mortgage 4,500 0.36% 10. United Parcel Service 2,500 0.20%
List excludes Federal Government Agencies, City Departments, area School Systems (including Board of Education) and NJ Casinos
Sources: Select Greater Philadelphia, Regional Data, Ocean County Data Book, The Press, Atlantic City
EMPLOYMENT SHARES BY SECTOR: GREATER PHILADELPHIA REGION 2011
The following figures provide four key external factors during the ten years from 2002-2011 that affected the geographic region in which the Authority functions; this region consists of the Port District comprising of thecounties of Bucks, Chester, Delaware, Montgomery, and Philadelphia in Pennsylvania, and the counties of Atlantic, Burlington, Camden, Cape May, Cumberland, Gloucester, Ocean, and Salem in New Jersey. Based on themost recent data, population growth in the region is at very modest levels with growth in the New Jersey counties at 4.7% since 2002 and in the Pennsylvania counties at 4.4% since 2002. The unemployment rate in thePhiladelphia Metropolitan Region for the period of 2005 through 2010, reflected a high of 8.71% in 2010 and a low of 4.26% in 2006. Three of the region's top ten major employers were health care organizations. Theunemployment rate in the New Jersey Metropolitan Region for the period of 2005 through 2010, reflected a high of 11.51% in 2010 and a low of 5.14% in 2005. Five of the region's top ten major employers were health careorganizations. Please refer to the following schedules below for a historical view of the demographic information and area employers within the Port District.
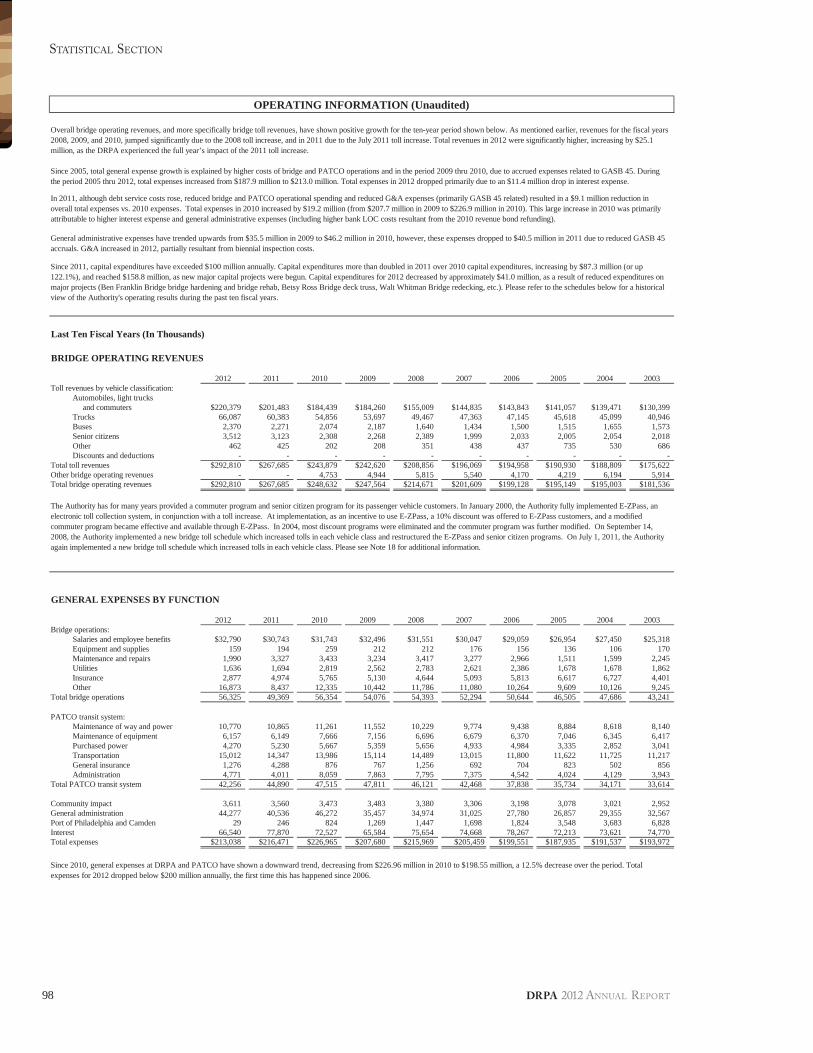
98
STATISTICAL SECTION
DRPA 2012 ANNUAL REPORT
OPERATING INFORMATION (Unaudited)
Last Ten Fiscal Years (In Thousands)
BRIDGE OPERATING REVENUES
2012 2011 2010 2009 2008 2007 2006 2005 2004 2003Toll revenues by vehicle classification:
Automobiles, light trucksand commuters $220,379 $201,483 $184,439 $184,260 $155,009 $144,835 $143,843 $141,057 $139,471 $130,399
Trucks 66,087 60,383 54,856 53,697 49,467 47,363 47,145 45,618 45,099 40,946Buses 2,370 2,271 2,074 2,187 1,640 1,434 1,500 1,515 1,655 1,573Senior citizens 3,512 3,123 2,308 2,268 2,389 1,999 2,033 2,005 2,054 2,018Other 462 425 202 208 351 438 437 735 530 686Discounts and deductions - - - - - - - - - -
Total toll revenues $292,810 $267,685 $243,879 $242,620 $208,856 $196,069 $194,958 $190,930 $188,809 $175,622Other bridge operating revenues - - 4,753 4,944 5,815 5,540 4,170 4,219 6,194 5,914Total bridge operating revenues $292,810 $267,685 $248,632 $247,564 $214,671 $201,609 $199,128 $195,149 $195,003 $181,536
GENERAL EXPENSES BY FUNCTION
2012 2011 2010 2009 2008 2007 2006 2005 2004 2003Bridge operations:
Salaries and employee benefits $32,790 $30,743 $31,743 $32,496 $31,551 $30,047 $29,059 $26,954 $27,450 $25,318Equipment and supplies 159 194 259 212 212 176 156 136 106 170Maintenance and repairs 1,990 3,327 3,433 3,234 3,417 3,277 2,966 1,511 1,599 2,245Utilities 1,636 1,694 2,819 2,562 2,783 2,621 2,386 1,678 1,678 1,862Insurance 2,877 4,974 5,765 5,130 4,644 5,093 5,813 6,617 6,727 4,401Other 16,873 8,437 12,335 10,442 11,786 11,080 10,264 9,609 10,126 9,245
Total bridge operations 56,325 49,369 56,354 54,076 54,393 52,294 50,644 46,505 47,686 43,241
PATCO transit system:Maintenance of way and power 10,770 10,865 11,261 11,552 10,229 9,774 9,438 8,884 8,618 8,140Maintenance of equipment 6,157 6,149 7,666 7,156 6,696 6,679 6,370 7,046 6,345 6,417Purchased power 4,270 5,230 5,667 5,359 5,656 4,933 4,984 3,335 2,852 3,041Transportation 15,012 14,347 13,986 15,114 14,489 13,015 11,800 11,622 11,725 11,217General insurance 1,276 4,288 876 767 1,256 692 704 823 502 856Administration 4,771 4,011 8,059 7,863 7,795 7,375 4,542 4,024 4,129 3,943
Total PATCO transit system 42,256 44,890 47,515 47,811 46,121 42,468 37,838 35,734 34,171 33,614
Community impact 3,611 3,560 3,473 3,483 3,380 3,306 3,198 3,078 3,021 2,952General administration 44,277 40,536 46,272 35,457 34,974 31,025 27,780 26,857 29,355 32,567Port of Philadelphia and Camden 29 246 824 1,269 1,447 1,698 1,824 3,548 3,683 6,828Interest 66,540 77,870 72,527 65,584 75,654 74,668 78,267 72,213 73,621 74,770Total expenses $213,038 $216,471 $226,965 $207,680 $215,969 $205,459 $199,551 $187,935 $191,537 $193,972
Overall bridge operating revenues, and more specifically bridge toll revenues, have shown positive growth for the ten-year period shown below. As mentioned earlier, revenues for the fiscal years2008, 2009, and 2010, jumped significantly due to the 2008 toll increase, and in 2011 due to the July 2011 toll increase. Total revenues in 2012 were significantly higher, increasing by $25.1million, as the DRPA experienced the full year’s impact of the 2011 toll increase.
Since 2005, total general expense growth is explained by higher costs of bridge and PATCO operations and in the period 2009 thru 2010, due to accrued expenses related to GASB 45. Duringthe period 2005 thru 2012, total expenses increased from $187.9 million to $213.0 million. Total expenses in 2012 dropped primarily due to an $11.4 million drop in interest expense.
The Authority has for many years provided a commuter program and senior citizen program for its passenger vehicle customers. In January 2000, the Authority fully implemented E-ZPass, anelectronic toll collection system, in conjunction with a toll increase. At implementation, as an incentive to use E-ZPass, a 10% discount was offered to E-ZPass customers, and a modifiedcommuter program became effective and available through E-ZPass. In 2004, most discount programs were eliminated and the commuter program was further modified. On September 14,2008, the Authority implemented a new bridge toll schedule which increased tolls in each vehicle class and restructured the E-ZPass and senior citizen programs. On July 1, 2011, the Authorityagain implemented a new bridge toll schedule which increased tolls in each vehicle class. Please see Note 18 for additional information.
Since 2010, general expenses at DRPA and PATCO have shown a downward trend, decreasing from $226.96 million in 2010 to $198.55 million, a 12.5% decrease over the period. Totalexpenses for 2012 dropped below $200 million annually, the first time this has happened since 2006.
Since 2011, capital expenditures have exceeded $100 million annually. Capital expenditures more than doubled in 2011 over 2010 capital expenditures, increasing by $87.3 million (or up122.1%), and reached $158.8 million, as new major capital projects were begun. Capital expenditures for 2012 decreased by approximately $41.0 million, as a result of reduced expenditures onmajor projects (Ben Franklin Bridge bridge hardening and bridge rehab, Betsy Ross Bridge deck truss, Walt Whitman Bridge redecking, etc.). Please refer to the schedules below for a historicalview of the Authority's operating results during the past ten fiscal years.
General administrative expenses have trended upwards from $35.5 million in 2009 to $46.2 million in 2010, however, these expenses dropped to $40.5 million in 2011 due to reduced GASB 45accruals. G&A increased in 2012, partially resultant from biennial inspection costs.
In 2011, although debt service costs rose, reduced bridge and PATCO operational spending and reduced G&A expenses (primarily GASB 45 related) resulted in a $9.1 million reduction inoverall total expenses vs. 2010 expenses. Total expenses in 2010 increased by $19.2 million (from $207.7 million in 2009 to $226.9 million in 2010). This large increase in 2010 was primarilyattributable to higher interest expense and general administrative expenses (including higher bank LOC costs resultant from the 2010 revenue bond refunding).
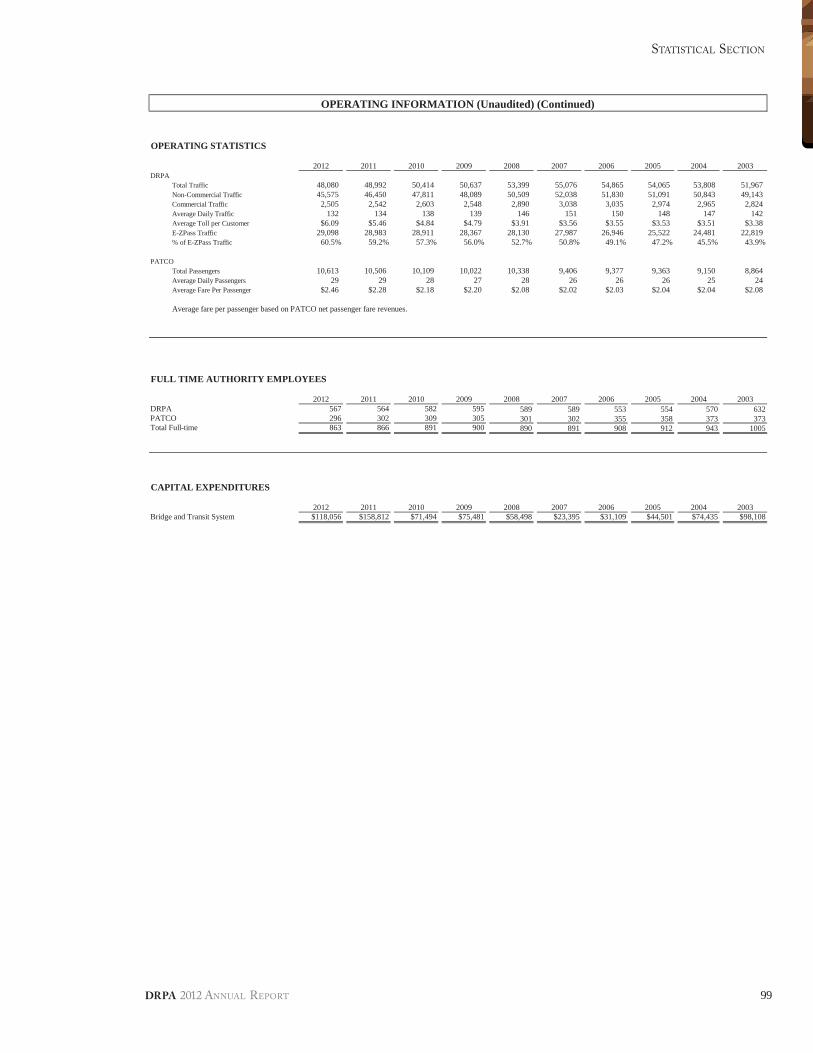
99
STATISTICAL SECTION
DRPA 2012 ANNUAL REPORT
OPERATING STATISTICS
2012 2011 2010 2009 2008 2007 2006 2005 2004 2003DRPA
Total Traffic 48,080 48,992 50,414 50,637 53,399 55,076 54,865 54,065 53,808 51,967Non-Commercial Traffic 45,575 46,450 47,811 48,089 50,509 52,038 51,830 51,091 50,843 49,143Commercial Traffic 2,505 2,542 2,603 2,548 2,890 3,038 3,035 2,974 2,965 2,824Average Daily Traffic 132 134 138 139 146 151 150 148 147 142Average Toll per Customer $6.09 $5.46 $4.84 $4.79 $3.91 $3.56 $3.55 $3.53 $3.51 $3.38E-ZPass Traffic 29,098 28,983 28,911 28,367 28,130 27,987 26,946 25,522 24,481 22,819% of E-ZPass Traffic 60.5% 59.2% 57.3% 56.0% 52.7% 50.8% 49.1% 47.2% 45.5% 43.9%
PATCOTotal Passengers 10,613 10,506 10,109 10,022 10,338 9,406 9,377 9,363 9,150 8,864Average Daily Passengers 29 29 28 27 28 26 26 26 25 24Average Fare Per Passenger $2.46 $2.28 $2.18 $2.20 $2.08 $2.02 $2.03 $2.04 $2.04 $2.08
Average fare per passenger based on PATCO net passenger fare revenues.
FULL TIME AUTHORITY EMPLOYEES
2012 2011 2010 2009 2008 2007 2006 2005 2004 2003DRPA 567 564 582 595 589 589 553 554 570 632PATCO 296 302 309 305 301 302 355 358 373 373Total Full-time 863 866 891 900 890 891 908 912 943 1005
CAPITAL EXPENDITURES
2012 2011 2010 2009 2008 2007 2006 2005 2004 2003Bridge and Transit System $118,056 $158,812 $71,494 $75,481 $58,498 $23,395 $31,109 $44,501 $74,435 $98,108
OPERATING INFORMATION (Unaudited) (Continued)
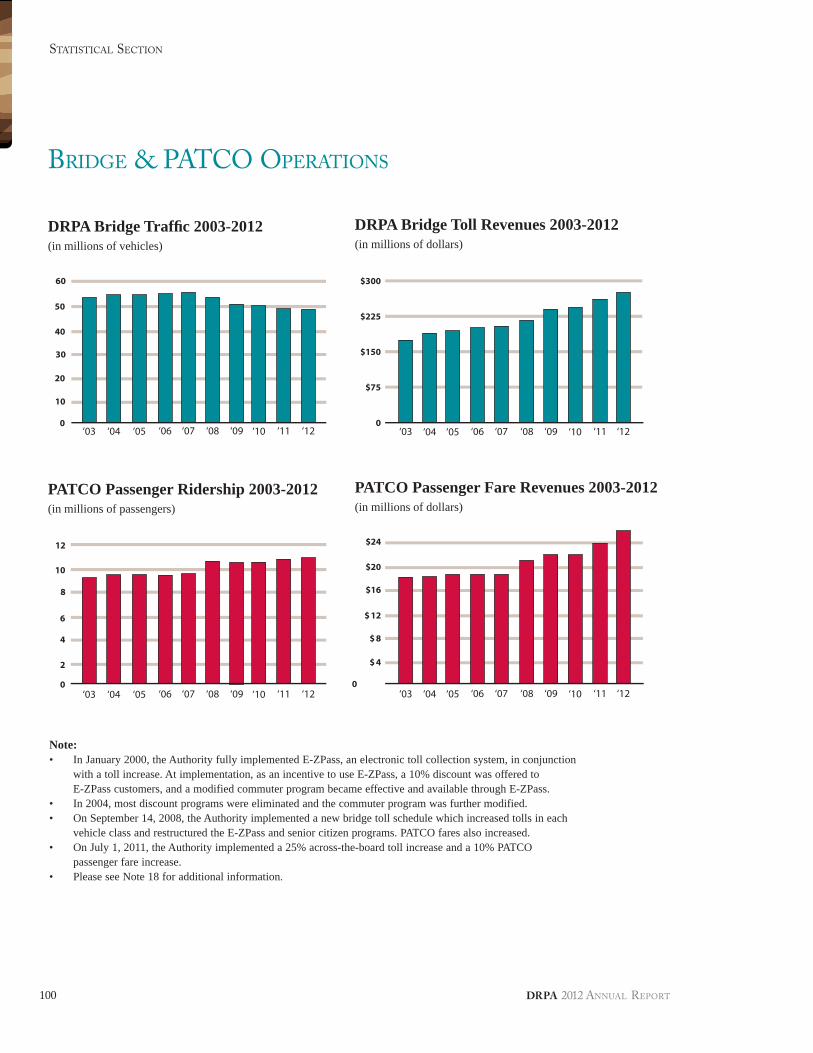
100
STATISTICAL SECTION
DRPA 2012 ANNUAL REPORT
0 0
$300
$225
$150
$75
$ 8
$ 4
0
$ 12
$16
$20
$24
10
20
30
40
50
60
4
2
0
6
8
12
10
Note:• In January 2000, the Authority fully implemented E-ZPass, an electronic toll collection system, in conjunction
with a toll increase. At implementation, as an incentive to use E-ZPass, a 10% discount was offered to E-ZPass customers, and a modified commuter program became effective and available through E-ZPass.
• In 2004, most discount programs were eliminated and the commuter program was further modified. • On September 14, 2008, the Authority implemented a new bridge toll schedule which increased tolls in each
vehicle class and restructured the E-ZPass and senior citizen programs. PATCO fares also increased. • On July 1, 2011, the Authority implemented a 25% across-the-board toll increase and a 10% PATCO
passenger fare increase. • Please see Note 18 for additional information.
‘03 ‘04 ‘06 ‘07 ‘08 ‘09 ‘10 ‘11 ‘12
‘03 ‘04 ‘06 ‘07 ‘08 ‘09 ‘10 ‘11 ‘12 ‘03 ‘04 ‘06 ‘07 ‘08 ‘09 ‘10 ‘11 ‘12
‘04‘05
‘05 ‘05
‘05 ‘06 ‘07 ‘08 ‘09 ‘10 ‘11 ‘12‘03
DRPA Bridge Traffi c 2003-2012(in millions of vehicles)
PATCO Passenger Ridership 2003-2012(in millions of passengers)
DRPA Bridge Toll Revenues 2003-2012(in millions of dollars)
PATCO Passenger Fare Revenues 2003-2012(in millions of dollars)
BRIDGE & PATCO OPERATIONS

Delaware River Port Authority
Comprehensive Annual Financial Report
for the Year Ended December 31, 2012
PRODUCED BY:
The Offi ce of Corporate Communications
DESIGNED BY:
Michael D. Williams
PHOTOGRAPHY:
DRPA Archives
PRINTED BY:
DRPA Printing Services
FINANCIAL DATA COMPILED BY: Jennifer A. DePoder Ronnie Gilbert James M. White, Jr., CCM

One Port Center • 2 Riverside Drive, PO Box 1949 • Camden, NJ 08101-1949 (856) 968-2000 • (215) 218-3750 • www.drpa.org