Embed Size (px)
Citation preview

Twin Disc, Incorporated
WE PUT HORSEPOWER TO WORK ™

Twin Disc, Incorporated
April 27, 2011
2
Safe Harbor StatementThis presentation contains statements that are forward-looking within the meaning of Section 21E of the Securities Exchange Act of 1934, as amended. These statements are based on management‟s current expectations that are based on assumptions that are subject to risks and uncertainties. Actual results may vary because of variations between these assumptions and actual performance. Investors are referred to Twin Disc‟s fiscal year 2010 Annual Report and Form 10-K, “Management‟s Discussion and Analysis of Financial Condition and Results of Operations - Forward-Looking Information,” which outlines certain risks regarding the Company‟s forward-looking statements. Copies of the Company‟s SEC filings may be obtained from the SEC, and are available on Twin Disc‟s web site (www.twindisc.com), or by request from the Investor Relations department at the Company.

Twin Disc, Incorporated
April 27, 2011
3
Twin Disc At A Glance
Manufacturing
• Founded in 1918
• Headquartered in Racine, WI
• ≈913 employees (FYE „10)
• TTM Revenues of $277MFY10 Revenues of $228MFY09 Revenues of $296MFY08 Revenues of $332M
• We are a global company– Well-known customers
around the world
– Mfg Operations in the U.S., Italy, Belgium, Switzerland and Japan (JV)
– World-wide distributor network
– 65% of fiscal 2010 sales to international markets
21
21
1
# Manufacturing location (# of facilities in each location)
Company owned distribution/service location
Purchasing/sourcing offices

Twin Disc, Incorporated
$47.1
$55.2$61.0
$64.3
-$10
$10
$30
$50
$70
Q1 Q2 Q3 Q4
Sales
April 27, 2011
4
FY 2010 Financial Highlights$ millions
-$2.4
-$0.5
$1.5
$2.0
-$3
-$2
-$1
$0
$1
$2
$3
Q1 Q2 Q3 Q4
Net Earnings
$ millions
• Quarterly sequential sales &
earnings improvement
– Despite challenges, profitable for
the full fiscal year
• Key Markets
– Mega Yacht and European markets
remained soft throughout fiscal 2010
– ARFF, Military and Commercial Marine
were steady
– Sales in the Pacific Rim continued
strong, at near record levels
– Oil & gas markets experienced strong
growth in 2nd half of fiscal year

Twin Disc, Incorporated
• Generated $35 million of cash
from operating activities
• Reduced debt by $19.6 million,
or 39%
– Cash also increased $5.8 million, or 44%,
to $19.0 million
• $25 million cost reduction and
avoidance program fully implemented
– announced in 2009‟s 4th Fiscal
Quarter
April 27, 2011
5
FY 2010 Financial Highlights
$8.5$7.5
$7.1
$12.0
$0
$5
$10
$15
Q1 Q2 Q3 Q4
Operating Cash Flow
$ millions
$50.8 $49.0
$41.6
$35.1$31.1
$0
$10
$20
$30
$40
$50
$60
FYE '09 Q1 Q2 Q3 FYE '10
Total Debt
$ millions

Twin Disc, Incorporated
April 27, 2011
6
Net Sales & Net Earnings(First Nine Months)
$ millions
$163
$213
$0
$50
$100
$150
$200
$250
FY10 FY11
Sales
• Sales up 31%
– Oil & gas markets strong
– Experienced continued softness in
mega yacht and European markets
– Prior year: seasonal and temporary
plant shutdowns impacted Q1
shipments
– Asian markets continued at near
record levels
• $11.2 million profit, up $12.7 million
– Prior year includes extended plant
shutdowns in Q1 at European and
US manufacturing locations
$ millions
($1.4)
$11.2
-$2
$0
$2
$4
$6
$8
$10
$12
FY10 FY11
Net Earnings

Twin Disc, Incorporated
April 27, 2011
7
Marine & Propulsion Systems
• Pleasure Craft market
continues soft worldwide
– However, building share of
market with new technology
• Work Boat market steady
– Europe soft
– North America showing
improvement
– Asia-Pacific moderating
• Patrol Boat market
experiencing global growth
– Asian market experiencing
strong growth
Twin Disc, Incorporated
April 27, 2011
8
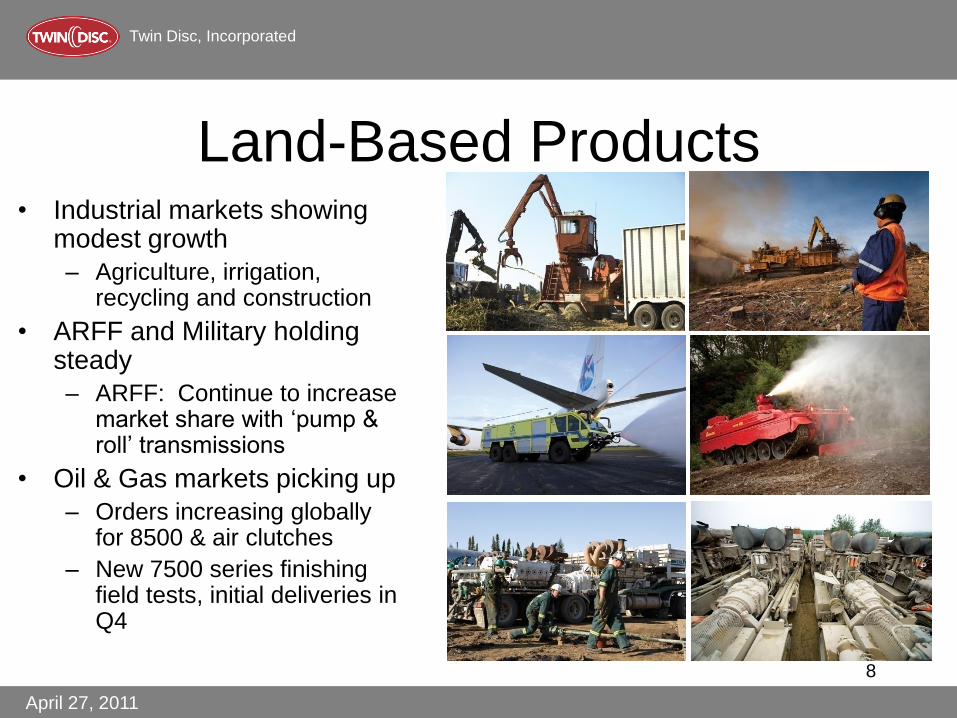
Land-Based Products• Industrial markets showing
modest growth
– Agriculture, irrigation, recycling and construction
• ARFF and Military holding steady
– ARFF: Continue to increase market share with „pump & roll‟ transmissions
• Oil & Gas markets picking up
– Orders increasing globally for 8500 & air clutches
– New 7500 series finishing field tests, initial deliveries in Q4

Twin Disc, Incorporated
April 27, 2011
9
Corporate Profile – Geographic Diversity
11%
37%
52%
2006
48% International Sales 65% International Sales
USA
Italy
Rest of
World
2010
35%
52%
13%

Twin Disc, Incorporated
April 27, 2011
10
Managing Our Cost StructureCAPEX
• Investing in core competencies
• Spent over $64 million over past 6 yrs

Twin Disc, Incorporated
Sourcing Offices
April 27, 2011
11
Managing Our Cost Structure
Low Cost Lower Cost Corporate HQ/Mfg Mfg locations

Twin Disc, Incorporated
April 27, 2011
12
What Differentiates Us?• Technology
– Oil & Gas
• 8500 Series
• 7500 Series – new in Fiscal 2011
– ARFF
• “Pump & Roll”
– Military
• “Legacy” Contracts
– Marine
• Patented QuickShift®
• Express Joystick System® – new in Fiscal 2011
• Dynamic Positioning/DPII
• Rolla CFD

Twin Disc, Incorporated
April 27, 2011
13
What Differentiates Us?• 92+ Years of Proven Application Know-How
• Niche Market Focus
• Global Distribution and Service Network
• Product/Market & Geographic Diversity
• Core Manufacturing Capabilities
# Mfg location
Co.-owned dist.
3rd Party dist.
Service dealers

Twin Disc, Incorporated
Looking Ahead

Twin Disc, Incorporated
April 27, 2011
15
$52
$66
$86
$118$126
$82
$61
$73
$140
$0
$20
$40
$60
$80
$100
$120
$140
$160
S D M J S D M J S D M J S D M J S D M J S D M J S D M J S D M
FY04 FY05 FY06 FY07
$ millions
Corporate Six Month Backlog(Mfg Orders to be shipped in the next 6 months)
FY08 FY09 FY11FY10
+131%

Twin Disc, Incorporated
April 27, 2011
16
Fiscal Year 2011/12 Outlook
• Mega Yacht & Europe – weakness expected to continue, modest growth off historic lows expected
• Industrial, ARFF & Military will remain stable, modest growth
• Oil & Gas – experiencing strong growth in demand
• Patrol Boat market expanding
• Asian market continues at near record levels
• New product launches: 7500 & Express Joystick System®
• Continued focus on working capital management
• Expect continued improvement into fiscal 2012
Twin Disc, Incorporated
WE PUT HORSEPOWER TO WORK ™

Twin Disc, Incorporated
Appendices

Twin Disc, Incorporated
April 27, 2011
19
Corporate Profile – Market Diversity
Pleasure Craft Market:
• Target Markets: High speed planing and displacement yachts from 50‟ to 150‟, diesel powered
• Products: Transmissions, Surface Drives, Propellers, Steering/Thruster/Trim Systems, Water Jets, Control Systems
• Channels: Engine OEMs & dealers, & boat builders
• Customers: CAT, CMD, MAN, MTU, Volvo / Azimuth, Baia, Ferretti, Maritimo, Palmer Johnson, Riviera, Sanlorenzo, Sunseeker
• Competition: ZF, Reintjes / Kamewa /Side Power, Ultraflex
Appendix I

Twin Disc, Incorporated
April 27, 2011
20
Corporate Profile – Market Diversity
Work Boat Market:
• Target Markets: planing and displacement vessels from 30‟ to 250‟, diesel powered
• Products: Transmissions, Propellers, MCD‟s, Water Jets, Controls
• Channels: Engine OEMs & dealers, boat builders & distribution
• Customers: CAT, Cummins, IVECO, Mitsubishi, Volvo / Damen / Sewart Supply (operators: Secor, Tidewater, Groupe Bourbon)
• Competition: ZF, Reintjes / Kamewa, Hamilton
Appendix II

Twin Disc, Incorporated
April 27, 2011
21
Corporate Profile – Market Diversity
Patrol Boat Market:
• Target Markets: military, patrol and coast guard vessels from 30‟ to 90‟, diesel powered
• Products: Transmissions, Surface Drives, Propellers, Steering/Thruster/Trim Systems, Water Jets, Controls, EJS
• Channels: Engine OEMs & dealers, naval authorities & boat builders
• Customers: CAT, CMD, MAN, MTU, Volvo / Indian Navy/Coast Guard, Israeli Navy, Turkish Coast Guard, USCG, US Navy, RCMP
• Competition: ZF / Kamewa
Appendix III

Twin Disc, Incorporated
April 27, 2011
22
Arneson Surface Drives, Rolla Propellers, Water Jets, Drivelines
QuickShift® Transmissions
EJS®/Electronic
Controls
Bow Thrusters
Anchor Winches
Gangways
Trim Tabs, Stern Thrusters
Power Steering
Marine Transmissions, Propulsion & Boat Management Systems
Corporate Profile – Market Diversity
We have been very successful “bundling” more marine products
• Increasing content and value on each vessel
• Working directly with the shipyards
• Industry expert on vessel performance and handling
Appendix IV

Twin Disc, Incorporated
April 27, 2011
23
Corporate Profile – Market Diversity
Industrial Products:
• Target Market: Heavy duty industrial disconnect applications
• Products: Mechanical & hydraulic clutches, PTOs & pump mount drives, 100 - 2,500 HP
• Channels: Distribution & OEMs
• Customers: Bandit, Morbark, Peterson Pacific / OEM engine dealers
• Competitors: Funk, NACD, PT Tech, Stiebel, Transfluid, WPT
Appendix V

Twin Disc, Incorporated
April 27, 2011
24
Corporate Profile – Market Diversity
Industrial Transmissions:
• Target Market: Off-highway and all-terrain specialty vehicles, diesel powered
• Products: Powertrain components - 400 to 3,000 HP
• Channel: OEM vehicle mfrs.
• Customers: BAE, Rosenbauer, Oshkosh, Tatra / BJ Services, Cisco High-Lift, Crown Energy, Enerflo, Fractec, MG Bryan, Trican, Tai‟an, Zoomlion
• Competitors: Allison, ZF
Appendix VI

Twin Disc, Incorporated
April 27, 2011
25
EBITDA(See Appendices VIII & IX for note on non-GAAP Financial Disclosures and a
reconciliation of net earnings to EBITDA)
$34.6
$33.0
$13.7
$44.5
$16.2
$30.5
$46.1
7.4%
12.5% 12.5%
6.0%
14.0%
10.2%
13.9%
$0
$10
$20
$30
$40
$50
FY05 FY06 FY07 FY08 FY09 FY10 TTM*
0%
2%
4%
6%
8%
10%
12%
14%
16%
EBITDA % of Sales
$ millions % sales
* See Appendix X for reconciliation of TTM figures to reported figures.
Appendix VII

Twin Disc, Incorporated
April 27, 2011
26
Non-GAAP Financial Disclosures
Non-GAAP Financial Disclosures
Financial information excluding the impact of certain significant items in this presentation are not measures that
are defined in U.S. Generally Accepted Accounting Principles (“GAAP”). These items are measures that
management believes are important to adjust for in order to have a meaningful comparison to prior and future
periods and to provide a basis for future projections and for estimating our earnings growth prospects. Non-
GAAP measures are used by management as a performance measure to judge profitability of our business
absent the impact of foreign currency exchange rate changes and acquisitions. Management analyzes the
company‟s business performance and trends excluding these amounts. These measures, as well as EBITDA,
provide a more consistent view of performance than the closest GAAP equivalent for management and
investors. Management compensates for this by using these measures in combination with the GAAP
measures. The presentation of the non-GAAP measures in this presentation are made alongside the most
directly comparable GAAP measures.
Definition - Earnings Before Interest, Taxes, Depreciation and Amortization (EBITDA)
The sum of, net earnings and adding back provision for income taxes, interest expense, depreciations and
amortization expenses: this is a financial measure of the profit generated excluding the above mentioned
items.
Appendix VIII

Twin Disc, Incorporated
April 27, 2011
27
Reconciliation of Net Earnings to EBITDA
in $ thousands, except % data TTM 2010 2009 2008 2007 2006 2005
Net Earnings 13,278$ 597$ 11,502$ 24,252$ 21,852$ 14,453$ 6,910$
Income Taxes 10,094 992 6,257 10,904 12,273 8,470 2,485
Interest Expense 1,770 2,282 2,487 3,038 3,154 1,718 1,134
Depreciation & Amortization 9,462 9,817 9,774 7,881 7,252 5,866 5,677
34,604$ 13,688$ 30,020$ 46,075$ 44,531$ 30,507$ 16,206$
Net Sales 277,339$ 227,534$ 295,618$ 331,694$ 317,200$ 243,287$ 218,472$
EBITDA as a % of Sales 12.5% 6.0% 10.2% 13.9% 14.0% 12.5% 7.4%
Earnings before interest,
taxes, depreciation and
amortization
* See Appendix X for reconciliation of TTM figures to reported figures.
Appendix IX

Twin Disc, Incorporated
April 27, 2011
28
Reconciliation of TTM Data to Reported Quarterly Figures
Appendix X
Q4 10 FY 10** Q1 11* Q2 11* Q3 11* TTM
Sales 64,313$ 227,534$ 61,395$ 75,160$ 76,471$ 277,339$
Gross Profit 19,426 60,465 20,023 23,757 27,782 90,988
Operating Income 4,274 3,085 5,246 5,118 10,728 25,366
Interest Exp 461 2,282 439 440 430 1,770
Net Earnings 2,040 597 2,656 4,034 4,548 13,278
EPS, Diluted 0.18$ 0.05$ 0.24$ 0.35$ 0.40$ 1.17$
EPS, Basic 0.18$ 0.05$ 0.24$ 0.36$ 0.40$ 1.18$
CAPEX 1,665 4,456 1,247 1,668 1,184 5,764
Deprec. 2,479 9,817 2,272 2,346 2,365 9,462
Oper Cash Flow 12,002 35,116 3,503 4,980 (4,417) 16,068
Dividends 784 3,133 792 794 908 3,278
Pretax Income 4,498 1,722 4,253 4,589 10,105 23,445
Taxes 2,446 992 1,556 529 5,563 10,094
* Quaterly Data is from the Company's unaudited quarterly Form 10-Q filings with the SEC.
** Annual Data is from the Company's audited Form 10-K filing with the SEC.

Twin Disc, Incorporated
April 27, 2011
29
Fiscal Year Condensed Consolidated Statements of Operations
($ thousands, per Form 10-K) 2010 2009 2008 2007 2006
Sales 227,534$ 295,618$ 331,694$ 317,200$ 243,287$
Gross Profit 60,465 81,443 104,868 102,909 74,390
26.6% 27.6% 31.6% 32.4% 30.6%
MEA Expense 56,886 60,470 66,349 63,267 49,606
25.0% 20.5% 20.0% 19.9% 20.4%
Restructuring 494 1,188 (373) 2,652 -
Interest Expense 2,282 2,487 3,038 3,154 1,718
Misc. Exp/(Inc) (919) (747) 606 (493) 14
Pretax Earnings 1,722 18,045 35,248 34,329 23,052
Income Taxes 992 6,257 10,904 12,273 8,470
Minority Interest (133) (286) (92) (204) (129)
Net Earnings 597$ 11,502$ 24,252$ 21,852$ 14,453$
EBITDA 13,688$ 33,020$ 46,075$ 44,531$ 30,507$
DILUTED EPS 0.05$ 1.03$ 2.13$ 1.84$ 1.22$
Appendix XI

Twin Disc, Incorporated
April 27, 2011
30
3rd Fiscal Qtr Condensed Consolidated Statements of Operations($ thousands, unaudited) 2011 2010 2009 2008 2007
Sales 76,471$ 60,977$ 69,292$ 85,838$ 86,405$
Gross Profit 27,782 16,505 19,151 26,627 28,185
36.3% 27.1% 27.6% 31.0% 32.6%
MEA Expense 17,054 14,555 14,517 14,969 15,913
22.3% 23.9% 21.0% 17.4% 18.4%
Interest Expense 430 639 526 757 886
Misc. Exp/(Inc) 193 (433) 1,049 194 (199)
Pretax Earnings 10,105 1,744 3,059 10,707 11,585
Income Taxes 5,563 244 362 2,719 4,023
Minority Interest 6 (49) 153 (59) (53)
Net Earnings 4,548$ 1,451$ 2,850$ 7,929$ 7,509$
EBITDA 12,906$ 4,800$ 6,292$ 13,271$ 14,254$
DILUTED EPS 0.40$ 0.13$ 0.26$ 0.70$ 0.64$
Appendix XII

Twin Disc, Incorporated
April 27, 2011
31
YTD Condensed Consolidated Statements of Operations(first nine months of the fiscal year)
($ thousands, unaudited) 2011 2010 2009 2008 2007
Sales 213,026$ 163,220$ 223,562$ 241,345$ 226,418$
Gross Profit 71,562 41,038 62,176 75,823 72,887
33.6% 25.1% 27.8% 31.4% 32.2%
MEA Expense 50,470 42,228 47,843 47,041 44,093
23.7% 25.9% 21.4% 19.5% 19.5%
Interest Expense 1,309 1,821 1,837 2,325 2,353
Misc. Exp/(Inc) 836 (236) 37 368 (527)
Pretax Earnings 18,947 (2,775) 12,459 26,089 26,968
Income Taxes 7,648 (1,454) 3,639 8,686 9,973
Minority Interest (61) (122) (72) (160) (144)
Net Earnings 11,238$ (1,443)$ 8,748$ 17,243$ 16,851$
EBITDA 27,178$ 6,262$ 21,532$ 33,680$ 34,381$
DILUTED EPS 0.98$ (0.13)$ 0.78$ 1.51$ 1.43$
Appendix XIII

Twin Disc, Incorporated
April 27, 2011
32
$174
$230 $234$205
$143 $133
$69
$87 $98
$91
$85$80
$0
$50
$100
$150
$200
$250
$300
$350
FY06 FY07 FY08 FY09 FY10 YTD 11
Manufacturing Distribution
$317
$243
$332
$296
Net Sales by Segment
Appendix XIV
$228
$213
(9 months)

Twin Disc, Incorporated
April 27, 2011
33
$19
$32$40
$17$25
$4
$6
$6
$6
$5
$7
$0$0
$10
$20
$30
$40
$50
FY06 FY07 FY08 FY09 FY10 YTD 11
Manufacturing Distribution
Net Earnings by Segment (before Corporate Expense)
Appendix XV
(9 months)

Twin Disc, Incorporated
April 27, 2011
34
$18.3 $17.5$19.9
$11.6
$35.1
$16.1
7.5%
5.5%
5.8%6.0%
15.4%
3.9%
$0
$5
$10
$15
$20
$25
$30
$35
$40
FY06 FY07 FY08 FY09 FY10 TTM
0%
2%
4%
6%
8%
10%
12%
14%
16%
Cash Flows from Operations % of Sales
$ millions % sales
Operating Cash Flows – Fiscal Year
Appendix XVI

Twin Disc, Incorporated
April 27, 2011
35
Express Joystick System® in Action
Go to http://www.twindisc.com/MarineProducts/EJS.html to see the new
revolutionary Twin Disc Express Joystick System® in action.

Twin Disc, Incorporated
WE PUT HORSEPOWER TO WORK ™


![Social Fundraising: Put Your Network to Work [Webcast]](https://img.pdfslide.net/doc/110x75/55c885fdbb61eb9d188b45d7/social-fundraising-put-your-network-to-work-webcast.jpg)

