Embed Size (px)
Citation preview

IN THE BLINK OF AN EYE
Fourth Quarter / Full Year 2014
February 13, 2015
WE PUT THE THINKING IN SAFETY
COGNITIVE SAFETY SYSTEMS
Financial Results Presentation
Safe Harbor Statement
This presentation contains statements that are not statements of historical fact, but instead are forward-looking statements within the meaning of the U.S. Private Securities Litigation Reform Act of 1995. We caution readers not to place undue reliance on these statements, which speak only as of the date hereof. All forward-looking statements are subject to numerous assumptions, risks and uncertainties which could cause our actual results to differ materially from those suggested by our forward-looking statements, including those set forth in our Annual Report on Form 10-K for the fiscal year ended December 31, 2013 (our “Form 10-K”) and our reports on Form 10-Q for the fiscal quarters ended March 28, 2014, June 27, 2014 and September 26, 2014, such as: the occurrence of any event, change or other circumstances that could give rise to the termination of the ZF merger agreement, which could have a material adverse effect on us and our stock price; the inability to consummate the proposed ZF merger or the inability to consummate the ZF merger in the timeframe or manner currently anticipated, due to the failure to satisfy conditions to completion of the proposed ZF merger, including that a governmental entity may prohibit, delay or refuse to grant approval for the consummation of the transaction, could have a material adverse effect on us and our stock price; risks related to disruption of management’s attention from our ongoing business operations due to the ZF merger; the effect of the announcement of the proposed ZF merger on the Company’s relationships with its customers, suppliers, joint venture partners and others, as well as our operating results and business generally; strengthening of the U.S. dollar and other foreign currency exchange rate fluctuations impacting our results; economic conditions adversely
© TRW Automotive 2015 P2Q4 2014 Earnings Presentation – February 13, 2015
affecting our business, results or the viability of our supply base; risks associated with non-U.S. operations, including economic and political uncertainty in some regions, adversely affecting our business, results or financial condition; any developments related to antitrust investigations adversely affecting our financial condition, results, cash flows or reputation; pricing pressures from our customers adversely affecting our profitability; global competition adversely affecting our sales, profitability or financial condition; any disruption in our information technology systems adversely impacting our business and operations; any shortage of supplies causing a production disruption for any customers or us; the loss of any of our largest customers or a significant amount of their business, or a significant decline in their production levels, adversely affecting us; our contingent liabilities and tax matters causing us to incur losses or costs; any inability to protect our intellectual property rights adversely affecting our business or our competitive position; costs or adverse effects on our business, reputation or results from governmental regulations; work stoppages or other labor issues at our facilities or those of our customers or others in our supply chain adversely affecting our business, results or financial condition; commodity inflationary pressures adversely affecting our profitability or supply base; any increase in the expense of our pension and other postretirement benefits or the funding requirements of our pension plans reducing our profitability; and other risks and uncertainties set forth in our Form 10-K under “Item 1A. Risk Factors" and in our other filings with the U.S. Securities and Exchange Commission. All forward-looking statements are expressly qualified in their entirety by such cautionary statements. We do not undertake any obligation to release publicly any update or revision to any of the forward-looking statements.

© TRW Automotive 2015 P3
Business Summary
John C. PlantChairman and CEO
Q4 2014 Earnings Presentation – February 13, 2015

Summary Comments
• Healthy vehicle production in major markets resulte d in a solid finish to the year: – In North America, consumer demand remained strong and supported a 4% year-on-year increase
in vehicle production for the fourth quarter.
– In Europe, vehicle production continued to be stable; full year production increased 3%.
– Results remain mixed in the emerging markets – moderating growth in China, contraction in Brazil.
• TRW’s fourth quarter results concluded another stro ng year for the Company:– Fourth quarter sales of $4.3 billion and full year record sales of $17.5 billion; an increase of 2% and
6%, respectively excluding the effect of businesses exited. (a)
– Excluding special items, Q4 operating margin of 8.4%; full year operating margin of 8.0%..... both
© TRW Automotive 2015 P4
(a) For adjusted results reconciliation to nearest GAAP equivalent, see slides P14, P18 and P27.(b) For adjusted results reconciliation to nearest GAAP equivalent see slide P29.
– Excluding special items, Q4 operating margin of 8.4%; full year operating margin of 8.0%..... both improved versus last year. (a)
– Excluding special items, Q4 net earnings of $2.31 per diluted share (up 26% y-o-y); full year net earnings of $8.18 per diluted share (up 19% y-o-y). (a)
– Completed significant pension abatement actions resulting in the elimination of $5.0 billion of gross legacy obligations.
• Full year operating cash flow before pension abatem ent contributions, less capital expenditures, of $435 million. (b)
TRW’s solid performance in 2014 highlights the Company’s strong market position and diversific ation.
Q4 2014 Earnings Presentation – February 13, 2015

Fourth Quarter Summary
Financial Summary(US $ in millions, except where noted)
Sales Summary
Sales
Q4 Vehicle Production (% changes based on year-over-year comparisons and IHS data)
Actual
Detroit 3 -4%
EU OE 19%
Asian OE 12%
Total Region 4%
North America
Europe
Q4 2014 Q4 2013
$4,348 $4,496
© TRW Automotive 2015 P5
10% (China up 19%)ROW (4%) (up 5% excl currency)Europe (11%) (up 4% excl divestitures)North America
Net Earnings Summary
GAAP Adjusted(a) GAAP Adjusted
(a)
Net Earnings (360)$ 268$ 363$ 222$
Diluted Earnings Per Share (3.22)$ 2.31$ 3.00$ 1.84$
Q4 2014 Q3 2013
(a) For adjusted results reconciliation to nearest GAAP equivalent, see slide P14.
West 4%
East -7%
Total Region 0%
China 7%
Brazil -10%
India 2%
ROW
Q4 2014 Earnings Presentation – February 13, 2015
Up 26%

Actively Managing Legacy Liabilities
� Several steps taken in 2014 to permanently reduce obligations:
1. U.K. Plan – elimination of $4.3 billion of gross obligations through buy-out and annuitization actions.
2. U.S. Plan – annuitization of certain obligations ($520 million obligation eliminated).
3. Canadian Plan – annuitization of certain obligations ($224 million obligation eliminated).
(US $ millions)
December 31, 2013 $ (6,428) $ 6,786 $ 358
Abatement Actions 5,026 (5,026) 0
Other Movements $ (1,249) $ 718 $ (531)
December 31, 2014 $ (2,651) $ 2,478 $ (173)
Obligations AssetsFunded Status
Total Pension
© TRW Automotive 2015 P6
obligation eliminated).
� The Company made $175 million of contributions to facilitate the above abatement actions.
� Significant progress made despite historically low interest (discount) rates and expanding mortality assumptions.
� The Company is well-positioned to take additional actions if opportunities arise.
December 31, 2014 $ (2,651) $ 2,478 $ (173)
Q4 2014 Earnings Presentation - February 13, 2015
Discount Rates Used 2014 2013
U.S. 4.25% 5.00%U.K 3.75% 4.50%ROW 2.41% 4.18%

Full Year Summary
Financial Summary(US $ in millions, except where noted)
Sales Summary
Sales
Full Year Vehicle Production (% changes based on year-over-year comparisons and IHS data)
Actual
Detroit 3 2%
EU OE 11%
Asian OE 6%
Total Region 5%
North America
Europe
FY 2014 FY 2013
$17,539 $17,435
© TRW Automotive 2015 P7
6% (China up 14%)ROW 4% Europe
(7%) (up 7% excl divestitures)North America
Net Earnings Summary
GAAP Adjusted(a) GAAP Adjusted
(a)
Net Earnings 293$ 958$ 970$ 850$
Diluted Earnings Per Share 2.54$ 8.18$ 7.85$ 6.89$
Full Year 2014 Full Year 2013
(a) For adjusted results reconciliation to GAAP, see slide P18.
West 5%
East -1%
Total Region 3%
China 9%
Brazil -14%
India -1%
ROW
Q4 2014 Earnings Presentation – February 13, 2015
Up 19%

Strengthening Our Current Position
Successfully launched 94 programs during Q4• Ford: F-150/SuperCrew (North America):
Driver Airbag Module; Foundation Brakes; Electric Park Brake with ECU; Steering Wheel; Suspension Parts
• Opel: Corsa (Europe):
Driver and Passenger Airbag Modules; Rear Caliper Foundation Brakes;
Ford F-150
Opel Corsa
© TRW Automotive 2015 P8
Product launches across multiple segments and geogr aphic regions continued to strengthen our leading diversi fication.
Rear Caliper Foundation Brakes; Steering Wheel
• FAW– Weizhi (Asia Pacific):
Safety and Sensor Electronics; Steering Wheel; Airbag Modules
Opel Corsa
FAW Weizhi
Q4 2014 Earnings Presentation – February 13, 2015

2.3
2.1
Q1E
2014 Operating Environment
� Consumer demand continues to support the current level of production in North America; full year 2015 production forecast at 17.4 million units.
� In Europe, the recovery remains fragile; Western European production appears stable despite weakness in Eastern Europe.
� Vehicle production expansion is expected to continue in China albeit at a slower pace.
Industry Production Assumptions(1)
(units in millions)
North America
8.3 8.8 9.0 9.1
7.1 7.4 8.0 8.3
2012 2013 2014 2015E2009 2010
Detroit 3 Other
17.015.4 16.2
17.4
4.4
© TRW Automotive 2015
3.5
1.6
Q1E
5.5
0.7
Q1E
16.9 19.4 21.322.9
3.23.5
3.03.0
2012 2013 2014 2015E
P9
pace.
China & Brazil
(1) Source: IHS light vehicle assumptions and Company estimates.
Industry Production Assumptions(1)
(units in millions)Industry Production Assumptions(1)
(units in millions)
Europe
12.5 12.6 13.3 13.5
6.7 6.8 6.8 6.5
2012 2013 2014 2015E
China Brazil Western Eastern
20.1
25.922.9 24.3
19.2 20.119.4 20.05.16.2
Q4 2014 Earnings Presentation – February 13, 2015

Outlook - 2015
� Global vehicle production levels in 2015 are expect ed to increase year-over-year, although pace of growth is expected to moderate in certain regions:
– Full year 2015 production is expected to be 17.4 million in North America (up 3%) -- production growth for Detroit 3 manufacturers forecasted at 1%.
– European production is expected to be flat year-over-year at 20.0 million units.
– Production growth in China is expected, although the pace of growth will likely moderate compared to last year.
� TRW’s 2015 sales guidance reflects vehicle producti on forecasts, latest view of
© TRW Automotive 2015 P10Q4 2014 Earnings Presentation – February 13, 2015
� TRW’s 2015 sales guidance reflects vehicle producti on forecasts, latest view of foreign currency rates and reduced sales related to divested businesses.
– Full year sales are expected to range between $16.6 billion and $16.9 billion (including first quarter sales of $4.2 billion).
� Capital spending is expected to range between $650 million and $690 million as TRW continues to invest in strategic high growth areas.
TRW is carrying the positive momentum of last year into 2015 and is executing the right strategies to ensure lon g-term success.

Financial Overview
© TRW Automotive 2015 P11© TRW Automotive 2015
Financial Overview
Joseph S. CantieExecutive Vice President and Chief Financial Officer
Q4 2014 Earnings Presentation – February 13, 2015

$4,496$4,348
$266
$(184)$(230)
Financial Summary
� Fourth quarter sales variance:
― Fourth quarter sales of $4.3 billion, down $148 million from prior year period (exited businesses negatively impacted y-o-y comparison by $230 million).
― Excluding the effect of businesses exited and currency, sales were up
Fourth Quarter 2014 Sales WalkUS $ in millions
© TRW Automotive 2015 P12
exited and currency, sales were up 6% y-o-y.
― Core sales growth driven by increasing demand for TRW’s technologies and growth in China.
― Sales in China accounted for 21% of TRW’s fourth quarter sales.
TRW’s Q4 sales reflect the Company’s focus and abil ity to capitalize on increasing demand for its safety tech nologies.
Q4 2014 Earnings Presentation – February 13, 2015
Q4 2013 Sales Core Sales Terminated Businesses
Q4 2014 SalesCurrency

Financial Summary
� Fourth quarter earnings:
― Excluding special items, fourth quarter operating income and margin of $364 million and 8.4%, respectively. (a)
― Several factors contributed to the improvement in earnings and margin compared to last year.
Fourth Quarter 2014 GAAP to Adjusted EPS Walk
$2.31$5.21 $0.29 $0.08
$(0.05)
© TRW Automotive 2015 P13
― Excluding special items, earnings were $2.31 per diluted share, up 26% compared to last year’s Q4 earnings of $1.84 per diluted share.(a)
TRW’s solid fourth quarter results continued the po sitive momentum established earlier in the year.
(a) Refer to slide P14 for reconciliation to nearest GAAP equivalent and share count and slide P28 for special items detail.
GAAPEPS
AdjustedEPS (a)
Restructuring and Asset
Impairments
Q4 2014 Earnings Presentation – February 13, 2015
$(3.22)Pension
Settlement Loss
OtherLoss on Retirement of Debt and Transaction
Costs

(In millions, except where noted)
GAAP
Results
Adjusting
Items (a)
Adjusted
Results
GAAP
Results
Adjusting
Items (a)
Adjusted
Results
Sales 4,348$ -$ 4,348$ 4,496$ -$ 4,496$
Operating (Loss) Income (481) 845 364 300 36 336
Operating Margin 8.4% 7.5%
Interest Expense - Net 27 - 27 35 - 35
Q4 2014 Q4 2013
Fourth Quarter Results
© TRW Automotive 2015
Loss on Retirement of Debt - Net 7 (7) - 15 (15) -
Equity in Earnings of Affiliates, Net of Tax (13) - (13) (11) - (11)
Income Tax (Benefit) Expense (154) 224 70 (107) 185 78
Net (Loss) Earnings (348)$ 628$ 280$ 368$ (134)$ 234$
Less: Net Earnings Attributable to Noncontrolling Interest, Net of Tax 12 - 12 5 7 12
Net (Loss) Earnings Attributable to TRW (360)$ 628$ 268$ 363$ (141)$ 222$
Share Count 111.7 117.0 121.7 121.7
Diluted Earnings Per Share (3.22)$ 2.31$ 3.00$ 1.84$ `
P14
(a) Refer to slide P28 for special items detail.
Q4 2014 Earnings Presentation – February 13, 2015
EPS up 26% y-o-y.

Fourth Quarter Results
EBITDA & Adjusted EBITDA (a)
US $ in millions
2014 2013
GAAP Net (Loss) Earnings Attributable to TRW (360)$ 363$
Income Tax Benefit (154) (107)
Interest Expense - Net 27 35
Depreciation & Amortization 107 112
Fourth Quarter
© TRW Automotive 2015 P15
(a) Refer to slide P25 for management’s rationale for using these metrics.
Q4 2014 Earnings Presentation – February 13, 2015
EBITDA (380)$ 403$
Restructuring Charges and Asset Impairments 48 23
Net Pension Buyouts and OPEB Curtailments 790 13
Transaction Costs 7 -
Loss on Retirement of Debt - Net 7 15
Noncontrolling Interest Impact of Certain Tax Matters - (7)
Adjusted EBITDA 472$ 447$

Financial Summary
� Full year sales variance:
― Sales of $17.5 billion, an increase of $104 million or 1% from prior year. Excluding the impact of businesses exited and currency, sales increased 6%.
― Increased demand for TRW’s active and passive safety technologies
$17,435 $17,539$960$(55) $(801)
Full Year 2014 Sales WalkUS $ in millions
© TRW Automotive 2015 P16Q4 2014 Earnings Presentation – February 13, 2015
and passive safety technologies and higher production volume more than offset the negative impact of terminated businesses.
― Sales in China increased 14% y-o-y and accounted for 18% of TRW’s full year sales.
TRW’s record sales highlight the Company’s strong market position.
FY 2013 Sales Core Sales Currency FY 2014 SalesTerminated Business

Financial Summary
� Full year earnings:
― Excluding special items, record full year operating profit and margin was $1,395 million and 8.0%, respectively.(a)
― Strong profit improvement resulting from a higher level of sales, improved mix of sales and other factors.
Full Year 2014 GAAP to Adjusted EPS Walk
$2.54
$8.18$5.16 $0.52 $0.17
$(0.21)
© TRW Automotive 2015 P17Q4 2014 Earnings Presentation – February 13, 2015
― Full year GAAP net earnings of $2.54 per diluted share; excluding special items, earnings were $8.18 per diluted share, up 19% year-on-year.(a)
TRW’s focused strategy and operational execution re sulted in improved adjusted earnings and margin levels.
(a) Refer to slide P18 for reconciliation to GAAP and share count and slide P28 for special items detail.
GAAPEPS
Other Adjusted EPS (a)
Restructuring and Asset
Impairments
Pension Settlement
Loss
Loss on Retirement of
Debt and Transaction
Costs

(In millions, except where noted)
GAAP
Results
Adjusting
Items (a)
Adjusted
Results
GAAP
Results
Adjusting
Items (a)
Adjusted
Results
Sales 17,539$ -$ 17,539$ 17,435$ -$ 17,435$
Operating Income 501 894 1,395 1,227 79 1,306
Operating Margin 8.0% 7.5%
Interest Expense - Net 109 - 109 132 - 132
Loss on Retirement of Debt - Net 7 (7) - 20 (20) -
FY 2014 FY 2013
Full Year Results
© TRW Automotive 2015
Loss on Retirement of Debt - Net 7 (7) - 20 (20) -
Equity in Earnings of Affiliates, Net of Tax (45) - (45) (46) - (46)
Income Tax (Benefit) Expense 96 236 332 114 212 326
Net Earnings 334$ 665$ 999$ 1,007$ (113)$ 894$
Less: Net Earnings Attributable to Noncontrolling Interest, Net of Tax 41 - 41 37 7 44
Net Earnings Attributable to TRW 293$ 665$ 958$ 970$ (120)$ 850$
Share Count 118.0 118.0 124.6 124.6
Diluted Earnings Per Share 2.54$ 8.18$ 7.85$ 6.89$ `
P18Q4 2014 Earnings Presentation – February 13, 2015
(a) Refer to slide P28 for special items detail.
EPS up 19% y-o-y.

Full Year Results
EBITDA & Adjusted EBITDA (a)
US $ in millions
2014 2013
GAAP Net Earnings Attributable to TRW 293$ 970$
Income Tax Expense 96 114
Interest Expense - Net 109 132
Depreciation & Amortization 444 430
Full Year Ended
© TRW Automotive 2015 P19Q4 2014 Earnings Presentation – February 13, 2015
(a) Refer to slide P25 for management’s rationale for using these metrics.
EBITDA 942$ 1,646$
Restructuring Charges and Asset Impairments 84 66
Net Pension Buyouts and OPEB Curtailments 790 13
Transaction Costs 20 -
Loss on Retirement of Debt - Net 7 20
Noncontrolling Interest Impact of Certain Tax Matters - (7)
Adjusted EBITDA 1,843$ 1,738$

Capital Structure Summary
– Fourth quarter operating cash flow and free cash flow of $673 million and $508 million, respectively.(a)
– Capital expenditures totaled $340 million in Q4 2014 compared to $324 in Q4 2013.
– At December 31, 2014, total gross and net debt of $1,578 million and $547 million, respectively.(b)
Free Cash Flow (a)
US $ in millions
Net Debt (b)
December 31,
2014
December 31,
2013
December 31,
2014
December 31,
2013
Operating Cash Flow 673$ 886$ 954$ 1,126$
Add: Pension Settlement Contributions 175 - 175 -
Capital Expenditures (340) (324) (694) (735)
Free Cash Flow 508$ 562$ 435$ 391$
Three Months Ended Full Year Ended
© TRW Automotive 2015
2009 2010 2011 2012 2013 2014
$1,583
$768 $291 $239 $385$547
P20
(a) Refer to P29 for management’s rationale for using this metric.(b) Net debt is equal to total debt less cash and marketable securities. For a calculation of net debt refer to P30.(c) Net leverage represents period ending net debt divided by Adj. EBITDA for the preceding twelve months. Refer to P25 for management’s rationale for using these metrics and P26 for a
reconciliation of Adj. EBITDA and net leverage to nearest GAAP equivalent.
Net Debt US $ in millions
Memo: Net Leverage (c)
Year Ended
0.2x 0.3x
Q4 2014 Earnings Presentation – February 13, 2015

Revolver
3.500% Exchangable Notes, at face amount
4.500% Bonds
4.450% Bonds
7.250% Bonds
Maturity Schedule of Significant Debt
(US $ in millions)As of
12/31/14
Revolver ($1,400)(a) -$
7.25% Senior USD 2017 441
4.50% Senior USD 2021 400
4.45% Senior USD 2023 400
Debt Maturity(as of December 31, 2014– US $ equivalents in millions)
$1,841 Includes $1,400 million undrawn revolver (a)
© TRW Automotive 2015
2015 2016 2017 2018 2019 2020 2021 2022 2023
P21
Capital structure in good condition – no near-term d ebt maturities.
3.50% Exchangeable 2015 31
Other 306
Total Debt 1,578$
Cash and Cash Equivalents (1,031)
Net Debt 547$
(a) Subject to earlier maturity in November 2016 under certain conditions.
$31
$400
Q4 2014 Earnings Presentation – February 13, 2015
$400

Outlook Discussion
2015 Full Year First QuarterProjection Estimate
Planning Assumptions(Production – in mils)
Industry Volumes: N.A. 17.4 4.4Europe 20.0 5.1
© TRW Automotive 2015 P22
TRW is on track and remains focused on achieving its key objectives for the year.
Sales ≈ $16.6 - $16.9 bil $4.2 bilCapital Spending ≈ $650 - $690 mil -Restructuring Expense ≈ $60 mil -Tax Rate ≈ 27% – 29% -
Q4 2014 Earnings Presentation – February 13, 2015

Key Investment Highlights
Growth�Consistent ability over time to generate sales in excess of industry growth in each of TRW’s
major geographic regions.
� Increasing demand for TRW’s innovative products (electric power steering, electronic park brake, driver assist systems, etc.).
�Governments and vehicle manufacturers continue to place a high importance on vehicle safety; regulations in high growth markets are expected to expand.
Cash Generation / Maximizing Shareholder Value�Consistent ability to generate substantial cash flow.
�
�
© TRW Automotive 2015 P23
�Consistent ability to generate substantial cash flow.�Cash generation has enabled TRW to transition from a levered company to an investment grade
company. �Continued cash generation will support TRW’s growth strategy and ongoing shareholder value
enhancements.
Market Position�Highly diversified – sales (continued growth in ROW region), customers (VW and Ford provide firm
foundation) and products (broadest array of active and passive safety products).�Global footprint and innovative technologies that support our customers’ global platform strategies. �Strong balance sheet and flexible capital structure to support future growth.
�
�
Q4 2014 Earnings Presentation – February 13, 2015

© TRW Automotive 2015
Appendix and Financial Reconciliations
P24© TRW Automotive 2015 Q4 2014 Earnings Presentation – February 13, 2015

Non-GAAP Financial MeasurementsThe accompanying unaudited consolidated financial information, reconciliation of GAAP net earnings to EBITDA and Adjusted EBITDA (as defined below) and calculation of net leverage, should be read in conjunction with the TRW Automotive Holdings Corp. Annual Report on Form 10-K for the year ended December 31, 2013, and our reports on form 10-Q for the quarters ended March 28, 2014, June 27, 2014, and September 26, 2014 which contain summary historical data. Since all companies do not use identical calculations, our definition and presentation of these measures may not be comparable to similarly titled measures reported by other companies.
EBITDA and Adjusted EBITDAEarnings before income tax (benefit) expense, interest expense and depreciation and amortization (“EBITDA”) is a measure used by management to evaluate the operating performance of the Company and its business segments and to forecast future periods. Adjusted EBITDA is defined as EBITDA excluding restructuring charges, asset impairments, loss on retirement of debt, and other significant special items.
© TRW Automotive 2015 P25
restructuring charges, asset impairments, loss on retirement of debt, and other significant special items. Management uses Adjusted EBITDA to evaluate the performance of ongoing operations separate from items that may have a disproportionate impact in any particular period. EBITDA and Adjusted EBITDA are frequently used by securities analysts, institutional investors and other interested parties in the evaluation of companies in our industry.
EBITDA and Adjusted EBITDA do not purport to be alternatives to net earnings as an indicator of operating performance, nor to cash flows from operating activities as a measure of liquidity. Additionally, neither is intended to be a measure of free cash flow for management’s discretionary use, as they do not consider certain cash requirements such as interest payments, tax payments and debt service requirements.
Net LeverageNet Leverage is calculated as Net Debt divided by Adjusted EBITDA for the preceding twelve months. We believe that Net Leverage is an important metric for industry analysts and investors in evaluating the Company's liquidity and ability to service existing debt. However, Net Leverage is not a recognized term under GAAP as a measure of financial performance and it does not purport to be an alternative to cash flows from operating activities as a measure of liquidity.
Q4 2014 Earnings Presentation – February 13, 2015
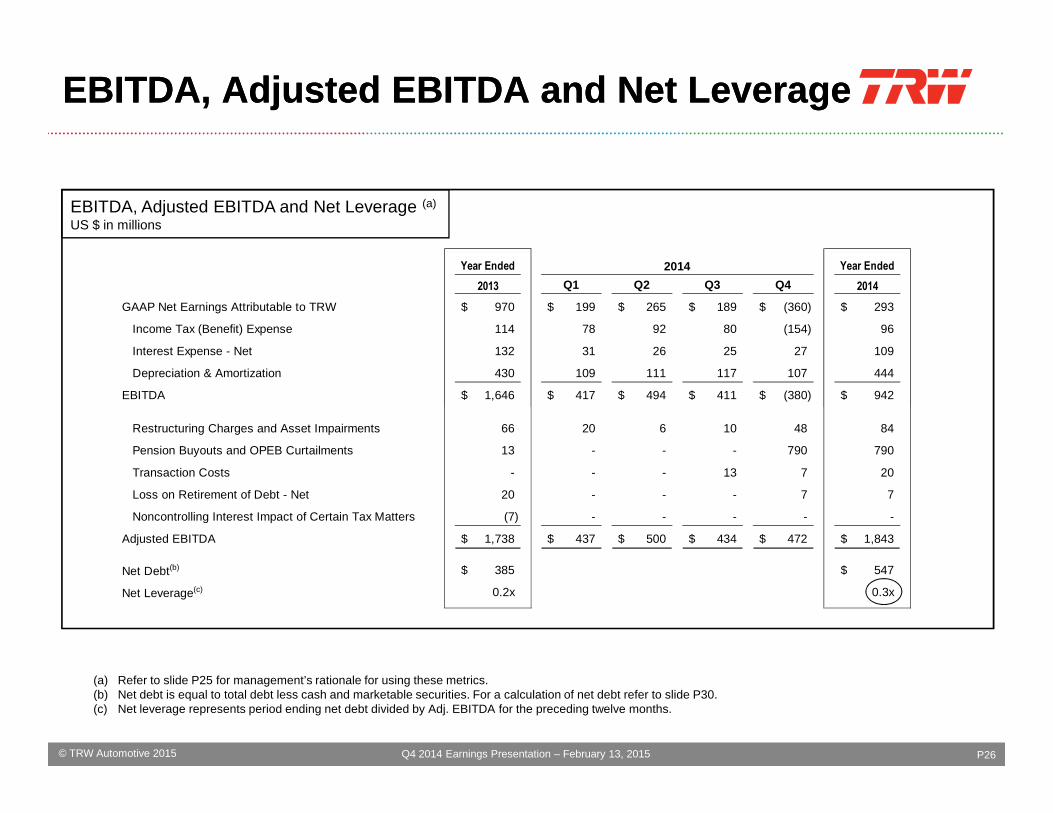
EBITDA, Adjusted EBITDA and Net Leverage (a)
US $ in millions
EBITDA, Adjusted EBITDA and Net LeverageEBITDA, Adjusted EBITDA and Net Leverage
Year Ended Year Ended
2013 Q1 Q2 Q3 Q4 2014
GAAP Net Earnings Attributable to TRW 970$ 199$ 265$ 189$ (360)$ 293$
Income Tax (Benefit) Expense 114 78 92 80 (154) 96
Interest Expense - Net 132 31 26 25 27 109
Depreciation & Amortization 430 109 111 117 107 444
EBITDA 1,646$ 417$ 494$ 411$ (380)$ 942$
2014
© TRW Automotive 2015 P26
(a) Refer to slide P25 for management’s rationale for using these metrics.(b) Net debt is equal to total debt less cash and marketable securities. For a calculation of net debt refer to slide P30.(c) Net leverage represents period ending net debt divided by Adj. EBITDA for the preceding twelve months.
Q4 2014 Earnings Presentation – February 13, 2015
Restructuring Charges and Asset Impairments 66 20 6 10 48 84
Pension Buyouts and OPEB Curtailments 13 - - - 790 790
Transaction Costs - - - 13 7 20
Loss on Retirement of Debt - Net 20 - - - 7 7
Noncontrolling Interest Impact of Certain Tax Matters (7) - - - - -
Adjusted EBITDA 1,738$ 437$ 500$ 434$ 472$ 1,843$
Net Debt(b) 385$ 547$
Net Leverage(c) 0.2x 0.3x

Fourth Quarter and Full Year Adjusted SalesFourth Quarter and Full Year Adjusted Sales
(US $ in millions) December 31, 2014 December 31, 2013
Increase
from
Prior
Period
Sales 4,348$ 4,496$
Three Months Ended
The following shows the impact of exiting certain of our brake component and modules businesses in North America during the first quarter of 2014:
© TRW Automotive 2015 P27Q4 2014 Earnings Presentation – February 13, 2015
Exited Businesses -$ 230$
Sales Excluding Exited Businesses 4,348$ 4,266$ 2%
December 31, 2014 December 31, 2013
Sales 17,539$ 17,435$
Exited Businesses 105$ 906$
Sales Excluding Exited Businesses 17,434$ 16,529$ 6%
Full Year Ended

Fourth Quarter and Full Year Special ItemsFourth Quarter and Full Year Special Items
(US $ in millions)
December 31,
2014
December 31,
2013
December 31,
2014
December 31,
2013
Restructuring Charges and Asset Impairments
Total Restructuring Charges 41$ 17$ 65$ 57$
Fixed Asset Impairments 7 6 19 9
Sub Total - Restructuring Charges and Fixed Asset
Impairments 48$ 23$ 84$ 66$
Pension Buyouts and OPEB Curtailments - 13 - 13
Net Pension Settlement Loss 790 - 790 -
Three Months Ended Full Year Ended
© TRW Automotive 2015 P28
(a) Represents elimination of (i) for all periods, the income tax impact of the above adjustments, by calculating the income tax impact of each of these items using the appropriate tax rate for the jurisdiction were the charges were incurred, (ii) for the Q4 and FY 2013 periods, a tax benefit relating to prior year’s United States foreign tax credits that were recognized as deferred tax assets during the period, (iii) for the Q4 and FY 2013 periods, a tax benefit relating to various legislative changes and other tax matters, and (iv) for the Q4 and FY 2014 periods, also represents the favorable tax impact due to a favorable ruling received and reversal of a valuation allowance in foreign jurisdictions.
(b) Represents the noncontrolling interest impact of certain tax matters included in (a) above.
Q4 2014 Earnings Presentation – February 13, 2015
Transaction Costs 7 - 20 -
Loss on Retirement of Debt - Net 7 15 7 20
Total Special Items Before Income Taxes 852$ 51$ 901$ 99$
Less:
Tax Benefit(a)
224 185 236 212
Noncontrolling Interest Impact of Certain Tax Matters(b)
- 7 - 7
Total Special Items 628$ (141)$ 665$ (120)$

Free Cash FlowFree Cash Flow
Free cash flow represents net cash provided by operating activities, excluding special pension settlement contributions, less capital expenditures, and is used by management in analyzing the Company’s ability to service and repay its debt and to forecast future periods. However, this measure does not represent funds available for investment or other discretionary uses since it does not deduct cash used to service debt or for other non-discretionary expenditures. This measure should not be used as a substitute for cash flow provided by operating activities. Further, since all companies do not use identical calculations, our definition and presentation of free cash flow may not be comparable to similarly titled measures reported by other companies.
© TRW Automotive 2015 P29Q4 2014 Earnings Presentation – February 13, 2015
(US $ in millions) December 31, 2014 December 31, 2013 December 31, 2014 December 31, 2013
Operating Cash Flow 673$ 886$ 954$ 1,126$
Add: Pension Settlement Contributions 175$ -$ 175$ -$
Capital Expenditures (340) (324) (694) (735)
Free Cash Flow 508$ 562$ 435$ 391$
Three Months Ended Full Year Ended

Net Debt CalculationNet Debt Calculation
(US $ in millions)
Period End
Balance
12/31/09 12/31/10 12/31/11 12/31/12 12/31/13 12/31/14
Cash and cash equivalents 788$ 1,078$ 1,241$ 1,223$ 1,729$ 1,031$
Short-term debt 18 23 65 67 159 222
Senior notes due 2014 862 768 550 533 467 -
Senior notes due 2017 812 734 693 667 446 444
Year End Balance
© TRW Automotive 2015 P30Q4 2014 Earnings Presentation – February 13, 2015
Senior notes due 2017 812 734 693 667 446 444
Senior notes due 2021 - - - - 400 400
Senior notes due 2023 - - - - 400 400
Exchangeable senior notes due 2015 195 203 143 150 134 30
Term loan facilities 400 - - - - -
Revolving credit facilities - - - - - -
Other borrowings 84 118 81 45 108 82
Total debt 2,371 1,846 1,532 1,462 2,114 1,578
Net debt 1,583$ 768$ 291$ 239$ 385$ 547$

• Limited reliance on any single customer or vehicle platform• Ability to leverage technology and products across customers
and regional markets• Scale provides leverage to optimize cost structure
Industry Leading Diversification
Other 13.8%Toyota
2.1%Volkswagen
25.8%
Honda 1.3%
Customer Mix
Company Overview Company Overview –– Global ReachGlobal Reach
Regional Mix
2014 Sales $17.5 Billion
© TRW Automotive 2015 P31
Ford 18.3%
Hyundai 2.6%
PSA 2.5%
Rest of World24.8%
Europe42.1%
North America 33.1%
Asia21.0%
Chrysler 9.8%
General Motors 7.3%
Fiat 3.7%
Daimler 4.9%
Renault/ Nissan 4.2%
BMW 3.7%
VW Group (Excl Audi)
23.0%
Ford 12.1%
Renault / Nissan 7.5%
BMW6.4%
PSA4.8%
Fiat6.9%
Other21.6%
Europe MixDaimler 8.0%
Audi7.1%
GM2.6%
Q4 2014 Earnings Presentation - February 13, 2015

Modules 11.1%
Foundation Brakes17.0%
2014 Product Mix
Broadest Safety PortfolioBroadest Safety Portfolio
Body Controls 4.5%
Engine Valves 3.4%
Fasteners and Components 2.8%
Automotive Components Chassis – “Active Safety”
2014 Sales $17.5 Billion
© TRW Automotive 2015
Steering Systems15.7%
Brake Controls 8.3%
Aftermarket 7.4%
Linkage, Suspension 1.8%
P32
Airbags 10.5%
Seat Belts 7.2%
Steering Wheels 4.5%
5.8%
OSS – “Passive Safety”
Electronics
Q4 2014 Earnings Presentation - February 13, 2015