Embed Size (px)
Citation preview

Wealthy Asia Market strategy
Find CLSA research on Bloomberg, Thomson Reuters, CapIQ and themarkets.com - and profit from our evalu@tor® proprietary database at clsa.com
Amar Gill, CFA Head of Research
(Special Projects) [email protected]
(65) 65122337
Xun Ming Ip (65) 64167856
5 September 2011
Asia ex-Japan Thematics
Large-cap picks
Commonwealth Bk (O-PF)
China MGM (O-PF)
EVA Airways (BUY)
Genting Berhad (BUY)
Golden Eagle (O-PF)
LG H&H (O-PF)
L’Occitane (BUY)
Parkson Retail (BUY)
Prada (BUY)
Sands China (BUY)
Shinhan Financial (BUY)
Wynn Macau (BUY)
www.clsa.com
Fat cats in fast lanes Surge in high net worth individuals

Wealthy Asia
2 [email protected] 5 September 2011
Contents
Executive summary.............................................................................. 3
Asian wealth surge .............................................................................. 5
Asian currency boost ......................................................................... 13
HNWI analysis - Key markets ............................................................ 16
Risks to Asian wealth ......................................................................... 25
Plays on Asian wealth ........................................................................ 28
Appendix: Extract from Dipped in gold - From head to toe................ 38
All prices quoted herein are as at close of business 1 September 2011, unless otherwise stated
Return of key themes

Executive summary Wealthy Asia
5 September 2011 [email protected] 3
Fat cats in fast lanes The Asia ex-Japan countries we examine are home to about 1.2 million high-net-worth individuals (HNWI), which we define as those with investible assets of US$1m and above (excluding the property they live in). This is just 0.06% of the adult population, puny in the context of its two city-states, Singapore and Hong Kong, where 1.5% of adults are fat cats. With per-capita GDP of US$20,000 (about half of the USA) approximately 0.4% of South Korea and Taiwan’s adults enjoy high net worth. That is 8x the ratio in China, and 20x India and Indonesia. As the region develops, the surge in Asian fat cats and the impact of their spending-power will be a multi-decade theme.
Within five years we estimate there will be 2.4x as many HNWIs in the region as in 2010. We project their numbers to grow at 19% per annum for the coming years, thus the ratio of HNWIs to adult population to double, yet still remain at only 0.13% for the region in 2015. Over this period, China will account for more than half of those getting into the wealth set for these countries. With rising net worth of those already in this category, we project HNWIs’ wealth in these countries to enjoy a 23% Cagr over the next five years, rising from about US$6tn to close to US$16tn by 2015.
In US-dollar terms, currency appreciation will boost HNWI growth, a driver of Asian spending power for internationally priced goods that is often underemphasised. We factor in an average 4% annual rise in Asian currencies over the coming years. The compounded effect lifts the numbers by just over one quarter, contributing to some 600,000 additional dollar millionaires in the region over the coming five years.
Five-year growth estimate in HNWIs by country
0 5 10 15 20 25
Hong Kong
Taiwan
Singapore
Malaysia
S Korea
Philippines
India
Thailand
China
Indonesia
(%)
Source: CLSA Asia-Pacific Markets
China will make up the largest part of the increase in wealth for these 10 countries, given our projected nominal-GDP growth of 14.5% pa, combined with a currency appreciating at 5% per year against the dollar. By our estimate, about 0.1% of its population or almost 900,000 mainland Chinese will move into the wealthy set over the next five years. Together with Hong Kong, this will make up more than 60% of the estimated increase in total wealth, with India a distant second, accounting for 15% of the projected rise in HNWIs’ investible assets for these countries. Indonesia, however, has the fastest estimated expansion in HNWIs at a 25% Cagr. Growth in HNWIs for India and Thailand will also be strong, at around 20% pa. Hong Kong, with a pegged currency, is likely to see the slowest growth in dollar millionaires, unless our stock-market and property-gain projections prove too conservative.
HNWI analysis: Key markets
HNWIs to rise by 2.4x in five years
Asian currency boost
Asian wealth surge
Strongest growth in HNWI numbers
Indonesia, China with India not far behind

Executive summary Wealthy Asia
4 [email protected] 5 September 2011
Asian economies are extremely open and a global downturn is a significant risk for the region’s expansion. Key concerns relate to how robust China’s growth is, the risk of an unexpected dollar rally, and if Asian assets do not rise to the extent assumed. Our sensitivity analysis indicates the projections are much more sensitive to assumptions on currency and GDP growth than stock-market returns. Asia’s rich generally have a larger part of their wealth in properties than equities. Only one-sixth of the growth in HNWIs for the region is driven by projected stock-market gains. Savings from annual income along with investment yields underpin the increase in wealth over the coming years.
Rising Asian wealth has positive implications for a range of sectors from high-end retail, autos, properties, leisure and gaming, travel, hotels, healthcare, pharmaceuticals, as well as for asset managers with distribution in the region. Listed companies with upside from rising Asian wealth have an aggregate US$600bn capitalisation and are set to outperform market indices. Superlative prospects inevitably will attract competition. The most compelling investments are companies generating positive economic value with a durable competitive advantage to allow them to continue to be value-creators, where stock prices are at attractive valuations.
Among EVA®-positive companies with business franchises catering for Asian wealth, our key picks are Prada, L’Occitane, Parkson Retail, Golden Eagle, Ports Design and LG Household & Health Care in the consumer space; Sands China, Wynn Macau, China MGM and the Genting group offer gaming exposure; EVA Airways and Formosa International are among the plays for travel and high-end hotels; while asset management in the region provides upside for Commonwealth Bank of Australia and Shinhan Financial, among others.
Franchise businesses to play on Asian HNWI theme (sorted by ROIC) Code ROIC
(%)EVA®/IC
(%) ROE(%)
EV/Ebit(x)
Titan Industries TTAN IB >100 >100 43.7 19.6Wynn Macau 1128 HK >100 >100 90.9 15.5Ctrip CTRP US >100 90.2 16.4 20.3China MGM 2282 HK 94.0 85.1 88.6 13.7Formosa International 2707 TT 85.4 80.7 42.0 24.3Golden Eagle 3308 HK 60.0 50.5 29.1 16.0Evergreen 238 HK 54.6 39.8 15.7 2.0Megastudy 072870 KQ 52.8 40.8 23.3 7.2L'Occitane 973 HK 40.0 28.6 20.7 12.5Ports Design 589 HK 29.4 19.4 29.0 8.5Sands China 1928 HK 25.6 19.1 22.7 19.4Prada 1913 HK 24.4 18.5 28.0 14.8Tata Motors TTMT IB 23.7 40.5 32.0 4.6Parkson Retail 3368 HK 22.8 14.3 25.0 13.3LG H&H 051900 KS 22.4 13.8 30.7 17.4Amore Pacific 090430 KS 22.4 12.5 18.1 18.2Genting Singapore GENS SP 22.1 16.0 19.0 12.1Genting Berhad GENT MK 22.0 12.4 18.2 5.3China Merchant Bank 3968 HK 21.9 12.4 21.9 8.6Hengdeli 3389 HK 20.0 9.4 19.3 10.2Commonwealth Bank CBA AU 19.8 17.9 19.8 9.8Genting Malaysia GENM MK 18.0 5.5 13.0 6.2Shinhan Financial 055550 KS 15.7 6.5 15.7 6.4Celltrion 068270 KQ 15.4 4.6 19.1 27.0Chinatrust Financial 2891 TT 11.7 2.9 11.7 12.5OCBC OCBC SP 10.5 2.5 10.5 12.4Cathay Pacific 293 HK 9.5 3.7 13.2 9.1EVA Air 2618 TT 9.1 5.2 13.8 10.6Note: Financials are averaged for 2011-12; PE not EV/Ebit for banks. Source: CLSA Asia-Pacific Markets
Risks to Asian wealth
Plays on Asian wealth
Prefer franchise businesses catering to
Asian wealth
Attractive valuations on a number of franchise plays
on Asian wealth

Section 1: Asian wealth surge Wealthy Asia
5 September 2011 [email protected] 5
Asian wealth surge We examined wealth distribution in 10 of the most significant economies in Asia that we cover. We estimate these countries have almost 1.2m HNWIs, defined as those with investible assets of US$1m or above (excluding their first homes). While a fairly large number are already in the wealthy set, they comprise just 0.06% of the population. We estimate less than one person of every 15,000 to be in the category of HNWIs in this region.
Our study does not include analysis of the Western world, nevertheless it allows comparisons of this Asian average with the more developed economies in the region. HNWIs in Singapore and Hong Kong make up approximately 1.5% of their adult populations. These richer city-states have high wealth concentrations even by global standards. South Korea and Taiwan, with per-capita GDP of around US$20,000 are about half the US per-capita income level; HNWIs are approximately 0.4% of adults. That is 8x as many HNWIs than the ratio for China, and 20x relative to India and Indonesia.
Strikingly, in India and Indonesia only 0.02%, or one in five thousand adults, are in the HNWI category; in China it is just 0.05% or one in two thousand. As the economies develop and wealth accumulates, the extremely low ratios of HNWIs will rise sharply. We project within five years there will be 2.4x as many HNWIs in the region compared with 2010. With the number of HNWIs forecast to grow at 19% per year, the ratio of HNWI to adult population will double, taking it to 0.13% for the region by 2015.
Figure 1
HNWI to adult population (2010)
0.0 0.2 0.4 0.6 0.8 1.0 1.2 1.4 1.6 1.8
Indonesia
India
Philippines
China
Thailand
Malaysia
S Korea
Taiwan
Hong Kong
Singapore
HNWIs/adults (%)
Figure 2
Composition of HNWIs in Asia ex Japan (2010)
India15%
Indonesia3%
S Korea12%
Hong Kong7%
China44%
Malaysia3%
Philippines1%
Singapore5%
Taiwan6%
Thailand4%
Total: 1.16m
Source: CLSA Asia-Pacific Markets
There were 1.2m HNWIs in the region as of 2010
HNWIs approximately 1.5% of adult population
in Singapore and HK
But only 0.02% of adults in India and Indonesia in
HNWI category
Highest ratio of HNWI to population in
Singapore and HK
China and HK just over half of the HNWIs in
countries surveyed

Section 1: Asian wealth surge Wealthy Asia
6 [email protected] 5 September 2011
The nations we examined for this report range from large, developing economies with big populations, namely China, India and Indonesia, to fairly-developed countries like South Korea and Taiwan, as well as the city-states Hong Kong and Singapore, which have relatively small populations but high wealth concentration. The analysis excludes Japan and Australia, where wealth growth is likely to be more modest. China makes up just under half of the adult population for the countries examined. Together with India and Indonesia, the countries that we term Chindonesia® account for 91% of this region’s adult population and 76% of its GDP.
Wealth skew Wealth is never evenly distributed. This is especially true for developing countries. The differences between those able to accumulate and build on wealth relative to the many who live at subsistence levels are compounded over time. A statistical measure of the disparity, represented by the Gini coefficient, is greater for wealth than for incomes. There are significant differences in income and very large disparity in wealth between the countries in Asia, as illustrated in the chart below.
Figure 3
Wealth levels in Asia (2010)
0 50 100 150 200 250 300
India
Philippines
Indonesia
China
Thailand
Malaysia
S Korea
Taiwan
Singapore
Hong Kong
Mean wealth
Median wealth
(US$ '000)
Source: CLSA Asia-Pacific Markets
Average disposable incomes for the top-three nations in our sample are 14x those of the lowest three. By estimates of median wealth however, the top-three countries are some 28x of the bottom-three countries. That is a clear illustration of both the compounded effect of higher savings enjoyed by wealthier countries, as well as the skew in wealth distribution, which pushes down the median, especially in poorer nations.
The chart also makes an important distinction in the average, understood in terms of the mean versus the median. The mean is simply total wealth divided by total adult population. The median is the level that divides into equal halves those who are above, and those who are below, that level. Because a relatively large portion of wealth is usually held by a disproportionate few, the average person’s net assets as represented by the median is generally much lower than the statistical mean.
By our estimates, median wealth in these countries is typically about half of the mean. The skew is more pronounced in some of the developing countries, with median wealth only about 30% of the mean in India and Indonesia. Wealth distribution is less skewed in more developed countries like Singapore and South Korea; but even there, median wealth is only around 60% of the mean.
Wealth especially unevenly distributed in
developing countries
Median wealth levels much lower than mean
Much greater skew in wealth distribution
compared to incomes
Average person’s wealth is much lower than mean
In developing countries median wealth only about
30% of the mean
Chindonesia makes up 91% of adult population
of countries in our sample

Section 1: Asian wealth surge Wealthy Asia
5 September 2011 [email protected] 7
The major differences in the wealth levels of the different countries are worth noting. In Singapore and Hong Kong, the average adult’s wealth, the median, is estimated at just above US$150,000 per head. For the less developed countries, wealth levels are a fraction of these. The typical person has less than US$5,000 wealth in India, the Philippines and Indonesia. In China, mean wealth is around US$22,000 per adult but the median is only half that level.
Wealth explosion People get wealthy in different ways but across nations, wealth-creation drivers can be analysed in terms of:
Increase in savings as a function of economic growth
Return on assets - the yield and appreciation in capital values
Appreciation of Asian exchange rates, impacting wealth defined in US dollar terms
The forces for wealth creation are extremely favourable for Asia over the coming years. The economies are growing faster than any other region in the world. Savings ratios are high and the stock markets are likely to provide strong returns over time. The value of business investments is rising on strong growth and low capital costs. Property prices are escalating as the middle class move their cash out of low-yielding bank accounts into appreciating real assets. Meanwhile, rising Asian currencies are lifting the dollar value of these assets.
In Figure 4, we show the assumptions we input in estimating the increase in wealth over the five years to 2015. By and large they err on the conservative side, especially with regards to property-price appreciation. Our property team expects prices to be held down in Singapore and projects only moderate property gains in South Korea, Hong Kong and Taiwan. Our research heads expect stock markets to provide better returns, averaging 12% annually across the region, while we look for currencies to appreciate at an average rate of just under 4% pa.
Figure 4
Key assumptions for wealth projections: 2010-15 (%) Nominal
GDP CagrExch rate
appreciationNom GDP
growth in US$ Property
returnsStock mkt
returnsChina 14.5 5.1 20.3 6.6 11.2Hong Kong 6.8 0.0 6.8 3.5 11.0India 15.9 2.4 18.6 4.5 13.6Indonesia 16.5 5.9 23.5 11.0 14.9S Korea 8.2 3.3 11.8 2.5 8.1Malaysia 10.9 3.7 15.0 11.0 12.0Philippines 10.7 4.8 16.0 8.8 10.8Singapore 7.2 3.8 11.3 (0.1) 9.3Taiwan 5.3 3.8 9.3 1.8 12.2Thailand 10.0 5.1 15.6 10.0 16.8Simple avg 10.6 3.8 14.8 5.9 12.0
Source: CLSA Asia-Pacific Markets
The more buoyant, but nevertheless realistic projection is on economic growth. Our economics team estimates nominal GDP growth to range from 5.0% to 16.5% pa and on average to rise at approximately 10.5% pa in nominal terms for these countries. Note that rising wealth is a function of the increase in savings and rising asset values denominated in the relevant currency. Thus, the growth for our analysis is nominal rather than inflation-adjusted “real” terms.
The average adult has little wealth in a number of developing countries
Three drivers of wealth creation
Strong wealth creation prospects
Conservative estimates on property
It is nominal GDP growth that is relevant
for estimating wealth creation
Robust nominal GDP growth and stock market
returns anticipated

Section 1: Asian wealth surge Wealthy Asia
8 [email protected] 5 September 2011
The results of combining these relatively conservative assumptions, however, are staggering. Over the next five years, the number of HNWIs in the region is set to increase at a 19% Cagr. We estimate wealth to grow 23% pa. Within five years, the number of HNWIs is set to rise to 2.4x on 2010 levels, climbing from approximately 1.2m to 2.8m. The dollar value of their assets is set to almost triple from US$5.6tn to close to US$16tn.
Figure 5
Estimates of wealth and HNWIs: 2010
Adult pop (m)
Mean wealth (US$)
Median wealth (US$)
No. of HNWIs ('000)
HNWI/adults
(%)
Wealth of HNWIs
(US$bn)China 975.0 22,082 10,921 502 0.05 2,627Hong Kong 5.8 287,701 151,719 86 1.49 484India 729.7 9,254 3,495 173 0.02 949Indonesia 153.4 18,099 4,706 33 0.02 129S Korea 36.8 81,351 47,667 138 0.37 412Malaysia 17.2 47,084 17,607 32 0.19 143Philippines 50.5 9,214 4,698 16 0.03 60Singapore 3.8 274,249 160,695 64 1.67 312Taiwan 17.9 102,036 35,404 70 0.39 269Thailand 49.7 38,205 19,479 47 0.10 214Sum/Weighted avg 2,039.8 88,927 45,639 1,161 0.06 5,599
Figure 6
Projections of wealth and HNWIs: 2015
Adult pop (m)
No of HNWIs
5Y Cagr in HNWI
(%)
HNWIs/ adults
(%)
Wealth of HNWIs
(US$bn)
Wealth Cagr of HNWIs
(%)China 1,024.7 1,378 22.4 0.13 8,764 27.2Hong Kong 6.2 131 8.7 2.12 711 8.0India 805.6 403 18.5 0.05 2,465 21.0Indonesia 161.0 99 24.7 0.06 487 30.4S Korea 38.5 310 17.6 0.81 1,074 21.1Malaysia 19.2 68 16.1 0.36 329 18.2Philippines 56.9 38 18.0 0.07 164 22.1Singapore 4.1 129 15.2 3.12 616 14.6Taiwan 18.7 136 14.4 0.73 593 17.1Thailand 52.2 128 21.9 0.24 609 23.2Sum/Weighted avg 2,187.2 2,821 19.4 0.13 15,812 23.1
Figure 7
Five-year growth estimate in HNWIs by country
0 5 10 15 20 25
Hong Kong
Taiwan
Singapore
Malaysia
S Korea
Philippines
India
Thailand
China
Indonesia
(%)
Source: CLSA Asia-Pacific Markets
Number of HNWIs in region estimated to grow
19% compounded
On average only 0.06% in HNWI category
in the region
In five years, percentage in HNWI category
will double
Number of HNWIs to grow over 20% in Indonesia, China
and Thailand

Section 1: Asian wealth surge Wealthy Asia
5 September 2011 [email protected] 9
Figure 8
Composition of wealth increase for HNWIs: 2010-15
China + Hong Kong
62%
India15%
Other 7 Asian countries
23%
Source: CLSA Asia-Pacific Markets
China will make up the largest part of the increase in wealth for the region, given our economics team’s 14.5% pa nominal-GDP-growth projection, combined with a currency appreciating at 5% per year in dollar terms. By our estimate just under 0.1% of its population will enter the HNWI category over the coming five years. This will mean almost 900,000 individuals will be added to the wealth bracket in China alone. Together with Hong Kong, it will make up over 60% of our estimated increase in HNWIs’ total wealth in the region. India is a distant second, accounting for 15% of the projected increase in investible assets of HNWIs for these countries. The other nations contribute a much smaller share of the wealth generation.
Methodology: Estimating wealth To estimate the number of HNWI and their wealth, we used public data on private-sector savings in these countries over the past 50 years. Based on our research on the middle class in Asia, in particular the Mr and Mrs Asia 2009 regional survey, we took data on average composition of middle-class assets in each country to reflect the composition of savings in various asset classes, namely properties, equities, bonds, cash and private investments. We applied historical data on the returns of these assets to arrive at total wealth in these countries. From this, we used data on wealth distribution from an academic study (JB Davies, S Sandstrom, A Shorrocks, and EN Wolff, ‘The World Distribution of Household Wealth’, United Nations University, February 2008).
We also took the most recent 2010 estimates by Forbes for the number of billionaires and the wealth of the richest individuals in each country (see the weblink: http://www.forbes.com/lists/2010/10/billionaires-2010_The-Worlds-Billionaires_Rank_13.html). The wealth distribution data allows us to create a Pareto function of the best fit for the number of individuals as a function of wealth levels. The academic literature indicates that across observed countries, there is a similar inverse relationship in the number of individuals and wealth levels shown on a log scale for both variables. At the extremes of very high and very low wealth levels, the distribution might be away from the best-fit Pareto function, but for the middle range of wealth distribution including to those with assets crossing over US$1m, this function for each country gives a fairly reliable fit.
Over 60% of wealth increase for HNWIs to be
in China/Hong Kong
Just under 0.1% of Chinese adult population to enter HNWI category
Incorporated data on über-rich from Forbes list

Section 1: Asian wealth surge Wealthy Asia
10 [email protected] 5 September 2011
Figure 9
Number of dollar billionaires and wealth of richest individual
3
4
4
9
14
16
25
36
55
100
0 20 40 60 80 100 120
Thailand
Philippines
Singapore
Malaysia
Indonesia
South Korea
Taiwan
Hong Kong
India
China
(No.)
9.4
5.8
5.8
12.6
5.0
8.6
6.8
26.0
31.1
6.5
Wealth of richest individual (US$bn)
Source: Forbes.com, CLSA Asia-Pacific Markets
Figure 10
Impact on population as wealth function moves up
0
1
2
3
4
5
6
7
8
9
10
0 1 2 3 4 5 6 7 8 9 10
Increase in wealth
Increase in population at same
wealth level
(Log scale of wealth)
(Log scale of population)
Source: CLSA Asia-Pacific Markets
The function for the log scales of population on the vertical axis to wealth on the horizontal axis has a slope greater than one in all countries observed. For instance, the equation has a slope of minus 1.4 for China. This indicates that as we move down the best-fit line, the number of people at lower levels of wealth rises proportionately faster than the change in wealth. It also indicates that as wealth levels rise for the country, moving this function up and to the right, the number of people at a given level will grow at a faster rate than the wealth increase, as illustrated schematically in the previous chart.
China estimated to have 100 billionaires
A large increase in those at any given wealth
level as the function moves right
Slope greater than one means faster increase in
HNWIs as wealth levels rise

Section 1: Asian wealth surge Wealthy Asia
5 September 2011 [email protected] 11
Our estimate is that median wealth rises 2.4x over the coming five years for China (a 19.3% compounded annual rate). If the wealth function does not change its slope of minus 1.4 but only moves out to the right on the chart, then the number of people at any given level of wealth rises 3.4x (ie, 2.4 times 1.4). As we use log scales, the equation shows proportionate changes that are equal across the range that the equation applies to.
It is significant that rising wealth has an amplified impact on the number of people at given wealth levels. This is true for all the countries we examined as they all have a slope of greater than minus one in their corresponding Pareto functions of number of adults to wealth levels (represented in log scales).
Our projections are based on our economics team’s estimates for nominal GDP growth. Our heads of research estimated the upside from the stock markets in each country, and our property analysts project sector values for each of the countries. We calculate the growth in wealth initially in local currency as a function of the return on existing assets, combined with incremental wealth from each year’s savings. To derive the wealth expansion in US dollar terms, we apply currency-appreciation estimates for each currency, except for the Hong Kong dollar, which we assume will remain pegged to the US dollar.
The numbers we arrive at can only be approximations given the lack of information at an individual level about total wealth and composition. The inputs for the growth in wealth are subject to assumptions that could err on either side, but we believe they are realistic and if anything slightly conservative. As we derive the data from estimates of accumulated savings on official GDP over the last 50 years, one element of underestimation comes from the grey economy in each of these countries, which may in some cases account for more than 30% of the officially recorded economy.
With or without unofficial sources of income, the rise in investible wealth is a function of: 1) the increase in the number of HNWIs; and 2) the rise in wealth for those already in this group. Combining these two factors, investible wealth is set to grow faster than the number of HNWIs. Across Asia, wealth will also generally rise at a faster clip than incomes, driven by returns on existing assets, combined with the incremental wealth from additional savings, as incomes grow.
Conservative on property Notably the assumptions we have used are generally conservative on property prices. In Singapore, the estimate is that over the five years to 2015, property prices will be essentially flat, while in Taiwan, South Korea and Hong Kong prices are not estimated to rise much more than an annual rate of 3% pa. Underlying factors remain bullish for property with low interest rates, rising inflation, which pushes down real interest rates, high savings, wealth creation and individuals’ desire to upgrade their properties. However, the view is that the authorities will act to keep a lid on property prices.
The assumption on properties is important as around 40% of total wealth in the region is in properties (in estimating the number of HNWIs, where we use the definition of investible assets in excess of US$1m, we make adjustments in each country for the estimated percentage of total assets tied up in the home these individuals live in). On average we estimate property prices in
China’s median wealth estimated to rise 2.4x
over coming five years
Rising wealth has amplified impact on number of wealthy
Inputs are from our research team
Wealth estimates can only be approximations as they do not explicitly
include the grey economy
Total wealth of HNWIs rises faster than the
numbers in this category
We assume flat property prices in Singapore and
very minor rise in Taiwan, Korea and HK
Property assumption is key

Section 1: Asian wealth surge Wealthy Asia
12 [email protected] 5 September 2011
these 10 countries to rise close to 6% pa. For China, CLSA estimates that the curbs on the property sector could ease soon, as they have been effective in controlling price increases over the last twelve months. The officials will be comfortable if property price increases are not higher than income growth. We estimate over the coming five years, property prices in the mainland to rise at around 7% pa.
Properties in choice locations, however, generally appreciate much faster than the average. As HNWIs are likely to own assets in better areas, most of them will see gains in their property investments that are higher than the estimates we use for general price appreciation. As our projection for property prices is relatively modest, there is upside in the wealth estimates if properties rise faster than anticipated.
Figure 11
Projected average property appreciation 2010-15
(2) 0 2 4 6 8 10 12
Singapore
Taiwan
S Korea
Hong Kong
India
China
Philippines
Thailand
Malaysia
Indonesia
(%)
Source: CLSA Asia-Pacific Markets
Price appreciation likely to be higher for
properties owned by HNWIs
Prices to rise 10% pa in Indonesia, Malaysia, Thailand but muted
assumptions for others

Section 2: Asian currency boost Wealthy Asia
5 September 2011 [email protected] 13
Asian currency boost The Asian currency index has appreciated 8% against the US dollar from the start of 2010 to mid-August 2011. Currency appreciation has been as high as 17% for the Singapore dollar and 15% for the Malaysian ringgit, while the Taiwan dollar, Thai baht and Indonesian rupiah have gained over 10% against the dollar in the period. Robust economic expansion in the region has pushed inflation rates up, resulting in high nominal GDP growth. Usually, rising inflation leads to depreciating currencies but in Asia most currencies are undervalued. Thus high nominal GDP growth is coupled with appreciating currencies, which will significantly boost the number of US dollar millionaires.
We estimate the number of HNWIs for these countries to rise at almost 14% Cagr if the currencies do not appreciate. The growth rate gets a 5.5ppt boost to more than 19% pa with the effect of Asian currencies appreciating at an average of 4% pa. For China, yuan appreciation pushes up the growth rate of HNWIs from 16% to just over 22% pa. The impact of Asian currencies’ higher dollar values will lift the number of HNWIs in dollar terms by 600,000, or just over 25% on average for these countries.
Figure 12
Asian currency index
95
100
105
110
115
120
125
Jan 05 Feb 06 Mar 07 Apr 08 May 09 Jul 10 Aug 11
Figure 13
Gains in Asian currencies to US$ from end 2009 to August 2011
(2) 0 2 4 6 8 10 12 14 16 18
HK$
Rs
Rmb
won
P
Rp
NT$
Bt
RM
S$
(%)
Source: Bloomberg, CLSA Asia-Pacific Markets
Appreciation of Asian currencies will
boost numbers of dollar millionaires
Number of HNWIs boosted by one-quarter
because of currencies
Asian currencies well past their previous
peak in 2007
S$ and RM have seen some of the strongest
gains since last year

Section 2: Asian currency boost Wealthy Asia
14 [email protected] 5 September 2011
Figure 15 shows Hong Kong has the lowest projected growth in HNWIs defined in US dollar terms. One of the main reasons is that there is no boost in its numbers from currency gains, as the HK dollar peg to the US dollar is likely to remain in place. For the other countries, the growth rate in HNWIs on a US-dollar base is an average 6ppts higher pa, or boosting the growth rate in HNWIs by about half on average, compared with the wealth increase without currency appreciation.
Figure 14
Nominal GDP growth 2010-15 in local currency and US$ terms
0 5 10 15 20 25
Hong Kong
Taiwan
Singapore
Malaysia
S Korea
Philippines
India
Thailand
China
Indonesia
5Y Cagr in HNWI ex-FX Currency boost to HNWI Cagr
(%)
Figure 15
Impact of currency appreciation on growth of HNWIs in Asia: 2010-15
0 5 10 15 20 25
Hong Kong
Taiwan
Singapore
Malaysia
S Korea
Philippines
India
Thailand
China
Indonesia
Cagr in HNWIs without currency appreciation Growth in HNWIs from currency appreciation
(%)
Source: CLSA Asia-Pacific Markets
In 2009, CLSA undertook a purchasing-power-parity (PPP) analysis of the fair value for various Asian currencies. The following chart shows the estimate of the relative value of the currencies adjusting for nominal exchange rate appreciation as well as relative inflation rates since then. We estimate that the yuan is 25% below its PPP value, that is, the value by which the basket of goods used for comparison would have an equal price as in the USA.
Faster growth in Asian economies when
converted into US$ terms
Significant added growth in HNWIs due to currency
appreciation in all countries other than HK
Rmb estimated to be some 25% below
PPP value
Lack of currency appreciation holds down
HNWI growth in HK

Section 2: Asian currency boost Wealthy Asia
5 September 2011 [email protected] 15
The appreciation of real exchange rates will continue through both higher inflation rates as well as currency appreciation. Our economics team estimates that the yuan will continue to appreciate by 5% pa. Other countries are likely to allow their currencies to appreciate at about this rate or even slightly higher. The Indonesian rupiah, which on the PPP analysis is one of the most undervalued, is projected to be the fastest appreciating currency for the 10 countries, rising close to 6% pa over 2010 to 2015.
Figure 16
PPP value of currencies (as at May 2011)
0.69
0.69
0.71
0.74
0.75
0.83
1.03
1.21
1.35
1.42
1.66
0.93
0.97
1.00
0.0 0.2 0.4 0.6 0.8 1.0 1.2 1.4 1.6 1.8
Philippines
India
Indonesia
Taiwan
China
Malaysia
Thailand
Hong Kong
US
Korea
UK
Singapore
Australia
Japan
Source: CLSA Asia-Pacific Markets
House view for Rmb to appreciate around 5% pa
S$ only currency in the region that appears
expensive on PPP basis

Section 3: HNWI analysis - Key markets Wealthy Asia
16 [email protected] 5 September 2011
HNWI analysis - Key markets Our study of wealth and growth in HNWIs is for the 10 Asia-Pacific countries covered by CLSA research, excluding Japan and Australia. Below we provide a summary of our findings for the larger countries in our study - China, India, Indonesia and South Korea - as well as the city-states, Hong Kong and Singapore, which have the highest concentration of wealth.
Figure 17
Increase in number of HNWIs over 2010-15
0 200 400 600 800 1,000
Philippines
Malaysia
Hong Kong
Singapore
Indonesia
Taiwan
Thailand
S Korea
India
China
('000)
Source: CLSA Asia-Pacific Markets
China will make up the largest part of the increase in wealth for the region, given the projection of nominal GDP growth of 14.5% pa, combined with a currency appreciating at 5% per year in dollar terms. By our estimate, just under 0.1% of its population will enter the HNWI category over the coming five years. This will mean almost 900,000 individuals will be added to the wealth bracket in China alone. Together with Hong Kong, it will make up over 60% of the estimated increase in total wealth of HNWIs in the region. India is a distant second, accounting for 15% of the estimated increase in investible assets of HNWIs for these countries.
South Korea already has one of the highest ratios of HNWIs to adult population. Over the next five years it will have one of the largest increases in HNWI numbers, although its growth rate in HNWIs, at around 17.5% over the coming five years, is slightly lower than our estimated growth rate of 19% for the region. The countries we forecast to have the fastest growth rates in HNWIs are Indonesia (25% Cagr) followed by China (22% growth rate). For Thailand, we project growth in HNWIs at slightly higher than 20%, while for India at just under 20% pa.
China China has a massive population, strong economic growth and high savings leading to rapid wealth creation. Presently, we estimate just one in two thousand of the population (0.05%) to be in the HNWI category, or approximately half a million people. One of the highest economic growth rates combined with an undervalued currency, appreciating at about 5% pa will lead to almost 900,000 mainland Chinese getting into the wealth set. China will thus account for over half of the HNWI growth in the region.
Indonesia estimated to have highest growth
rate in HNWIs
China accounts for just over half of increase in
HNWIs in the region
Some 900k Chinese could enter HNWI category in
next five years
Just under 0.1% of Chinese adult population to enter HNWI category
Our study covers 10 Asia ex-Japan countries

Section 3: HNWI analysis - Key markets Wealthy Asia
5 September 2011 [email protected] 17
In real terms, the economy is growing at around 9% pa. With inflation we estimate the growth in nominal terms at 14.5% pa, which is slightly lower compared with the 16.1% growth rate over the past five years. The GDP deflator, namely the difference between real and nominal economic growth rates, has consistently been higher than the official inflation figure, underscoring that much of the data is not totally reliable. Nevertheless, the rapid wealth creation is plain to see, with a build-up in the momentum in recent years. The official data is what we go by, even if often the data is revised up, as more of the unofficial economy gets captured in the measurement of economic activity.
Currency appreciation of 5% pa compounded on a 14.5% local currency growth rate leads to a growth rate in US dollar terms pushing 20% pa. By 2015, this will lead to an economy in dollar terms that is 2.5x the size it was in 2010, a much faster expansion compared with the 97% growth over the period without yuan appreciation.
Our head of A-share research, Manop Sangiambut, estimates that the A-share stock market will provide mainland equity investors with returns of approximately 11% pa for the coming five years, driven mainly by earnings growth. There is upside risk to these estimates as current valuations for the market are well below historical averages. Property prices have been almost unchanged for the last year after the government imposed restrictions to control speculation. These measures reduce the risk of a bubble developing in the sector. Our assumptions are that property prices in China rise on average by just under 7% pa over the coming years.
In dollar terms, we project median wealth to rise 19% pa. The number of individuals in the HNWI category rises at a faster rate (owing to the downward slope with a gradient larger than minus one for the Pareto function of population to wealth). We project the number of HNWIs in China to grow just over 22% pa. Rising numbers entering this set, together with the increasing wealth of those already in the group, leads to projected growth in HNWIs investible assets from US$2.6tn to US$8.8tn, an explosive compounded growth rate of 27% pa. China will thus contribute more than 60% of the growth in wealth for HNWIs in the region.
Figure 18
China: 2010-15 key wealth estimates
2010 15CL 5-year Cagr (%)
Adult population (m) 975 1,025 1.0
Median wealth (US$) 10,921 26,341 19.3
No. of HNWIs ('000) 502 1,378 22.4
HNWIs to adult population 0.05 0.13 21.1
Wealth of HNWIs (US$bn) 2,627 8,764 27.2
Nominal GDP (Rmbbn) 39,798 78,311 14.5
Rmb/US$ 6.61 5.16 5.1
Nominal GDP (US$bn) 5,880 14,829 20.3
Property market returns 6.6
Stock-market returns 11.2
Source: CLSA Asia-Pacific Markets
China’s economy growing around 15% pa in local
currency terms
In US$ terms, China’s economy growing
around 20% pa
Assume 11% pa gains on Chinese equities and 7%
for property-price gains per year
Median wealth estimated to rise 19% pa
By 2015, near 1.4m HNWIs in China

Section 3: HNWI analysis - Key markets Wealthy Asia
18 [email protected] 5 September 2011
Figure 19
China’s fitted Pareto distribution of adult population to wealth levels
0.001
0.01
0.1
1
10
100
1,000
10,000
100,000
0.001 1 10 100 1,000 10,000 100,000 1,000,000
Adult population ('000)
Wealth (US$ '000)
0.01 0.1
Relationship in log scale y = -1.4063x + 10.232
Source: CLSA Asia-Pacific Markets
India India is the second-largest economy in Asia, excluding Japan. Its total population is now at 1.2bn, close to China’s (1.3bn). However, a much larger segment of India’s population is made up of children. Measured by adults over the age of 20, India’s population is just under three-quarters that of China. Its economic development has lagged its larger neighbour, with total GDP of US$1.7tn compared with China’s US$5.9tn in 2010. India’s disposable income per capita was at US$1,100 last year, less than half of China’s. Lower income levels, coupled with a smaller savings ratio, result in much lower wealth. Median wealth, estimated at US$3,500 per adult for 2010, is about one-third of China’s.
India’s economic growth should, however, be stronger than China’s over the next few years. Coming from a lower income level, it has greater growth opportunities. Demographics are also in India’s favour. China’s adult population is now barely growing (and in about five years will start to decline), India’s, however, will continue to grow at around 2% pa for at least the next decade. We expect India’s economy to grow at close to 16% pa in local currency terms, some 1.5ppts faster than China’s growth.
However, we are less bullish on rupee appreciation. India’s current account deficit contrasts with China’s surplus and will lead to muted currency appreciation. We project the rupee to appreciate by 2.4% pa over the next five years, just under half the rate of the yuan. Thus in US dollar terms, the expansion of India’s economy will be slightly slower than China’s.
Wealth growth in India will nevertheless be extremely strong. Median wealth is projected to double over five years on GDP rising at approximately 19% pa in dollar terms. Robust returns from key asset classes will push up Indian wealth. The stock market should provide almost 14% annual returns, while we estimate Indian properties to rise on average close to 5% pa. The number of HNWIs is set to rise from approximately 170,000 in 2010 to over 400,000
India’s median wealth at a third of China’s
However economic growth should be
faster in India
But we are less bullish on rupee appreciation
relative to Rmb
Number of HNWIs set to more than double over
five years . . .
Downward sloping with gradient greater
than one . . .
. . . thus, rise in HNWIs grows faster than wealth
as function moves right

Section 3: HNWI analysis - Key markets Wealthy Asia
5 September 2011 [email protected] 19
in five years. From being one in five thousand of the adult population, in five years we estimate one in two thousand to be HNWIs, similar to the ratio for China last year. We estimate investible assets of this segment of the Indian population are estimated to grow at 21% pa; thus in five years assets of Indian HNWIs are set to be 2.6x of what they were in 2010.
Figure 20
India: Key wealth estimates
2010 15CL 5-year Cagr (%)
Adult population (m) 730 806 2.0
Median wealth (US$) 3,495 6,962 14.8
No. of HNWIs ('000) 173 403 18.5
HNWIs to adult population 0.02 0.05 16.2
Wealth of HNWIs (US$bn) 949 2,465 21.0
Nominal GDP (Rsbn) 78,779 164,433 15.9
Rp/US$ 45.0 40.0 2.4
Nominal GDP (US$bn) 1,731 4,065 18.6
Property market returns 4.5
Stock-market returns 13.6
Figure 21
India’s fitted Pareto distribution of adult population to wealth levels
0.001
0.01
0.1
1
10
100
1,000
10,000
100,000
0.001 0.01 0.1 1 10 100 1,000 10,000 100,000 1,000,000
Relationship in log scaley = -1.2672x + 9.3675
Adult population ('000)
Wealth (US$ '000)
Source: CLSA Asia-Pacific Markets
Indonesia Indonesia is positioned for the fastest growth in HNWIs as well as in investible wealth of the countries we examined. This is due to the economy’s fastest growth rates. In local currency terms, we estimate nominal GDP to grow at 16.5% pa over 2010-15. The rupiah is also one of the strongest currencies with 29% upside to its PPP value. Over the coming five years we estimate that the rupiah will appreciate close to 6% pa. Thus in US dollar terms, we expect the Indonesian economy to grow at 23.5% pa.
. . . from around 170,000 currently to cross 400,000 by 2015
Downward slope greater than one . . .
. . . hence faster increase in numbers at given wealth level as line
moves right
Indonesia to have fastest growth of HNWIs
in the region

Section 3: HNWI analysis - Key markets Wealthy Asia
20 [email protected] 5 September 2011
Wealth will be boosted by robust returns on key assets. Our Indonesian property analyst, Sarina Lesmina, expects property values in Indonesia to rise 11% pa in local currency terms, while Dee Senaratne, our head of research for the market projects the stock market to provide returns close to 15% pa, matching earnings growth.
Wealth levels are still low but will see robust growth. Currently, we estimate just 0.02% or one in five thousand Indonesians to be in the HNWI bracket. Their numbers, at around 33,000 estimated for 2010, is projected to triple over five years and reach close to 100,000. We estimate that the wealth of the HNWIs will grow at the fastest rate in the region, at approximately 21%, without currency gains or around 30% pa, taking into account rupiah appreciation. It is not surprising to find reports of busty private bankers at a large American banking group driving customers to death in dubious attempts to get a slice of this business.
Figure 22
Indonesia: Key wealth estimates
2010 15CL 5-year Cagr (%)
Adult population (m) 153 161 1.0
Median wealth (US$) 4,706 12,173 20.9
No. of HNWIs ('000) 33 99 24.7
HNWIs to adult population 0.02 0.06 23.5
Wealth of HNWIs (US$bn) 129 487 30.4
Nominal GDP (Rptn) 6,423 13,805 16.5
Rs/US$ 9,009 6,750 5.9
Nominal GDP (US$bn) 708 2,029 23.5
Property market returns 11.0
Stock-market returns 14.9
Figure 23
Indonesia’s fitted Pareto distribution of adult population to wealth levels
0.001
0.01
0.1
1
10
100
1,000
10,000
0.001 0.01 0.1 1 10 100 1,000 10,000 100,000
Relationship in log scale y = -1.3439x + 8.7563
Adult population ('000)
Wealth (US$ '000)
Source: CLSA Asia-Pacific Markets
Expect 15% pa gains from Indonesian
equities and 11% pa from properties
Number of HNWIs expected to roughly triple in five years
Estimated 33,000 HNWIs in 2010 which could reach
almost 100,000 by 2015
Like other countries, the line-of-best fit
slope is greater than minus one . . .
. . . hence faster growth in number of HNWIs as
wealth levels rise

Section 3: HNWI analysis - Key markets Wealthy Asia
5 September 2011 [email protected] 21
South Korea South Korea is not one of the fastest-growing economies in the region. However, it has a relatively high number of HNWIs and our appraisal of wealth prospects indicates it is set to have the third-largest increase in HNWIs in Asia Pacific, after China and India. Our economics team estimates Korea’s nominal GDP to grow 8% pa over the coming five years. With the won projected to appreciate 3% annually, economic growth in US dollar terms will be close to 12% pa.
We forecast only fairly conservative asset-price appreciation of 2.5% pa for properties and 8% pa for Korean equities. The result is that median wealth is likely to grow at 12.5% and thus, the number of HNWIs is set to rise at faster rate of almost 18% annually. From approximately 140,000 in 2010, within five years the number of HNWIs could rise to 310,000. In absolute terms this is the third-highest increase in HNWIs in the region. However, the growth rate of Korea’s HNWI is slightly lower than the overall average for the countries surveyed. While South Korea has 12% of the estimated HNWIs of these 10 countries as at 2010, we project it will make up a 10% lower share of the new HNWIs for the region over the coming five years.
Figure 24
South Korea: Key wealth estimates
2010 15CL 5-year Cagr (%)Adult population (m) 36.8 38.5 0.9Median wealth (US$) 47,667 85,822 12.5No. of HNWIs ('000) 138 310 17.6HNWIs to adult population 0.37 0.81 16.6Wealth of HNWIs (US$bn) 412 1,074 21.1Nominal GDP (tn won) 1,170 1,735 8.2won/US$ 1,120 950 3.3Nominal GDP (US$bn) 1,012 1,769 11.8Property market returns 2.5Stock market returns 8.1
Figure 25
South Korea’s fitted Pareto distribution of adult population to wealth levels
0.001
0.01
0.1
1
10
100
1,000
10,000
0.001 0.01 0.1 1 10 100 1,000 10,000 100,000
Relationship in log scale y = -1.3746x + 9.4762
Adult population ('000)
Wealth (US$ '000)
Source: CLSA Asia-Pacific Markets
Economic growth in US$ terms around 12% pa
Conservative assumptions on asset prices
Just over 400,000 HNWIs currently, which could
reach 1m by 2015
Like other countries, downward slope greater
than one . . .
. . . hence faster growth in HNWIs as
wealth levels rise

Section 3: HNWI analysis - Key markets Wealthy Asia
22 [email protected] 5 September 2011
Singapore The highest concentration of HNWIs relative to population in the region is in Singapore. The island-republic had almost exactly the same GDP as Hong Kong at approximately US$225bn for 2010, but with Singapore-dollar appreciation its economy is surpassing Hong Kong this year in US dollar terms. The red dot has a smaller population, a higher savings rate and thus higher income, as well as wealth per capita. We estimate 1.7% of its population to be in the HNWI bracket, slightly more than the 1.5% for Hong Kong. On its smaller population base this translates to 64,000 HNWIs, compared with 86,000 for Hong Kong.
Our assumptions for wealth growth are relatively modest for Singapore. We project nominal GDP to rise 7% pa. With the appreciation of the Singapore dollar, this translates to around 11% pa in US dollar terms. Wealth grows steadily as a large part of income is saved with a national savings ratio (savings to GDP) of 46%, the second-highest in the region after China.
However, we expect only moderate returns on Singapore assets. After a rapid appreciation in property values over the past two years, the government has come out with a series of measures to put a lid on speculation. The recent electoral setback for the government is likely to keep the authorities vigilant on property prices, a major issue for a large part of the local population. Over the next five years, we project property prices to be about flat. We are more positive on Singaporean equities, which we expect to provide an average 9% annual return.
Median wealth is estimated to rise 9% pa in US dollar terms. The number of HNWIs and their total wealth is thus set to grow just over 15% pa. In five years, HNWIs in the island-republic will thus double to reach close to 130,000. Currently, one-third of the population are non-Singaporeans. The election result is likely to temper growth in visas for foreigners to work and live in Singapore, but we believe the authorities will remain open to immigration for those with targeted skills and substantial wealth. The city state maintains its policy of allowing those with S$10m in investible assets in Singapore and a total net worth of S$20m to join their investment visa programme. HNWI resident inflow gives upside to our estimates.
Figure 26
Singapore: Key wealth estimates
2010 15CL 5-year Cagr (%)
Adult population (m) 3.8 4.1 1.7
Median wealth (US$) 160,695 250,558 9.3
No. of HNWIs ('000) 64 129 15.2
HNWIs to adult population 1.67 3.12 13.3
Wealth of HNWIs (US$bn) 312 616 14.6
Nominal GDP (S$bn) 305 433 7.2
S$/US$ 1.28 1.06 3.8
Nominal GDP (US$bn) 224 383 11.3
Property market returns (0.1)
Stock market returns 9.3
Source: CLSA Asia-Pacific Markets
Highest concentration of HNWIs in Singapore
We project Singapore property prices to be
about flat over five years
Median wealth estimate to rise 9% pa
From 64,000 last year, by 2015 estimated 129,000
HNWIs in Singapore

Section 3: HNWI analysis - Key markets Wealthy Asia
5 September 2011 [email protected] 23
Figure 27
Singapore’s fitted Pareto distribution of adult population to wealth levels
0.001
0.01
0.1
1
10
100
1,000
10,000
0.001 0.01 0.1 1 10 100 1,000 10,000
Relationship in log scale y = -1.446x + 9.4624
Adult population ('000)
Wealth (US$ '000)
Source: CLSA Asia-Pacific Markets
Hong Kong Hong Kong has a lower ratio of HNWIs to its population relative to Singapore but has a higher total at 86,000. The 2010 Forbes rich list illustrates the greater number of ultra-HNWIs in Hong Kong, in which it estimates there are 36 US-dollar billionaires in the territory. Singapore has just four with the highest net worth for a Singaporean estimated at US$4bn. Hong Kong has 10 individuals thought to have greater wealth than the highest in Singapore, with Li Ka Shing calculated to be worth US$26bn. The figures from the Forbes wealth list need to be taken with care as they are based on holdings mainly of publicly listed assets and will not fully capture privately held assets, but also will not take into account their debt. Nevertheless, they demonstrate the likely size of the über-rich in each country with rough estimates of their wealth.
With a currency pegged to the US dollar, the growth in income and wealth in Hong Kong is tied to just what is achieved in local dollars. We estimate the economies of both Hong Kong and Singapore to grow at about 7% pa in local currency terms but appreciation means that the rise in wealth in US dollars should be faster in Singapore. A currency that remains undervalued will however mean asset prices appreciate in local currency terms at a slightly higher rate. We estimate somewhat higher returns on Hong Kong properties and equities than Singapore. Nevertheless, property-price inflation is also an issue targeted by the authorities in the territory, and we project average property prices to rise just 3.5% pa.
With the pegged currency, the growth in wealth in dollar terms in Hong Kong will be the slowest of the countries we examined. We estimate HNWI numbers to rise close to 9% pa, which would take it up to 130,000 by 2015. Nevertheless, the size of this wealth set with investible assets expanding around 50% over five years is still solid for a territory that already has high levels of wealth.
Like other countries, the function has
negative slope greater than minus one . . .
. . . thus implying faster growth in HNWIs as
wealth levels rise
Higher number of HNWIs but lower concentration
relative to population than Singapore
Singapore’s growth in dollar terms is faster than
Hong Kong due to currency appreciation
Growth in wealth in US$ terms held back in Hong
Kong due to currency peg

Section 3: HNWI analysis - Key markets Wealthy Asia
24 [email protected] 5 September 2011
Figure 28
Hong Kong: Key wealth estimates
2010 15CL 5-year Cagr (%)
Adult population (m) 5.8 6.2 1.3
Median wealth (US$) 151,719 200,668 5.8
No. of HNWIs ('000) 86 131 8.7
HNWIs to adult population 1.49 2.12 7.4
Wealth of HNWIs (US$bn) 484 711 8.0
Nominal GDP (HK$bn) 1,748 2,431 6.8
HK$/US$ 7.77 7.77 0.0
Nominal GDP (US$bn) 225 313 6.8
Property market returns 3.5
Stock market returns 11.0
Figure 29
Hong Kong’s fitted Pareto distribution of adult population to wealth levels
0.001
0.01
0.1
1
10
100
1,000
10,000
100,000
0.001 0.01 0.1 1 10 100 1,000 10,000
Relationship in log scale y = -1.2263x + 8.9328
Adult population ('000)
Wealth (US$ '000)0.001
0.01
0.1
1
10
100
1,000
10,000
100,000
0.001 0.01 0.1 1 10 100 1,000 10,000
Relationship in log scale y = -1.2263x + 8.9328
Adult population ('000)
Wealth (US$ '000)
Source: CLSA Asia-Pacific Markets
From almost 90,000 HNWIs estimated to rise
to cross 130,000 by 2015
Shape of best fit function means faster growth in
number of HNWIs as wealth levels rise

Section 4: Risks to Asian wealth Wealthy Asia
5 September 2011 [email protected] 25
Risks to Asian wealth What could go wrong with these strong projections? Asian economies are extremely open and a global downturn will clearly affect the region’s growth. A key concern is the strength of China’s growth, which has implications for the region. An unexpected dollar rally could also impact asset values in Asia. From our sensitivity analysis, our projections are more sensitive to assumptions on property prices than to stock-market returns, as Asia’s rich generally have a larger part of their wealth in properties than equities. Geopolitical risks also need to be kept in mind, which could impact economic growth and wealth across the region.
A number of commentators are concerned over the strength of the Chinese economy with fears of a property bubble that might affect its banks. Property prices are certainly high in Tier-1 cities, but these are just four of more than 150 cities with a population of over one million. Most mainland Chinese buy their properties with little or no mortgage debt, reducing the risk to banks. Still, hiccups in Chinese growth, now a major driver of Asian as well as global growth, are a risk on the income and wealth projections for the region.
We noted in the earlier section that rising Asian currencies accounts for over a quarter of the number of Asian HNWIs in 2015 when calculated in US dollar terms. The outlook for the US dollar remains weak but the dollar is becoming increasingly undervalued against major currencies. An unexpected rally in the greenback would not just impact the dollar translation of Asian wealth. Because of the dollar carry-trade, essentially using cheap dollars to finance the purchase of Asian equities and other assets, a rise in the dollar would also have a negative impact in the local value of these assets.
Various geopolitical risks emanate from North Korea, Pakistan as well as lower level risks over Taiwan sovereignty and islands in the South China Seas. A blowout in these could hit regional investments and asset values. Terrorism continues to be a risk but does not appear to be a bigger issue for the region than in the West. Unexpected events could slow the tide of Asian wealth. Nevertheless, its governments’ reserves and fiscal positions, resourcefulness and ambition of its people, intraregional growth reinforcement, and rising prosperity off a very base, provide structural support for a surge in Asian wealth over the coming decade and beyond.
Projection sensitivities Figure 20 and 31 show our projections are most sensitive to assumptions on currencies. Every 1ppt change in the assumed appreciation for regional currencies, for example reducing the average expected currency appreciation of 3.8% to 2.8% pa, will have around a 1.5ppt impact in the annual growth rate of HNWIs and their wealth. The high sensitivity to currency assumption is because of the translation effect into dollars, which impacts both existing total assets as well as the incremental wealth from income saved each year.
For the other variables, the sensitivity is much less as each of these constituents a relatively small portion of the increase in wealth. Thus a 1ppt difference in the growth rate for property prices has a 0.6ppt impact on HNWI wealth; for GDP growth and stock-market gains, the sensitivity is only 0.4ppt and 0.2ppt respectively on wealth growth.
Some of the key risks relate to China and
currency rates
Risk if undervalued US$ has a counter trend rally
North Korea, Pakistan as well as Taiwan represent
geopolitical risks
Projections are most sensitive to currencies
Low sensitivity to returns on asset classes
Limited gearing will reduce negative impact if
property market in China corrects

Section 4: Risks to Asian wealth Wealthy Asia
26 [email protected] 5 September 2011
Over five years, however, the cumulative impact can become more significant. A 1ppt difference in property-price appreciation has slightly more than 3% impact on the rise in wealth over five years; a similar difference in GDP expansion would lead to just over a 2% impact on the growth rate of HNWIs, while a 1ppt difference in assumed stock-market returns impacts the growth in HNWIs by 1.3% over five years. Our projections are more sensitive to property prices than the stock market as on average HNWIs in these countries have a larger part of their wealth in properties (especially for those who are just entering into the HNWI category). Meanwhile, a 1ppt difference in currency appreciation over five years would have almost a 10% impact on the growth of HNWIs and their wealth - a much greater impact than changes in other assumptions.
Figure 30
Sensitivity to 1ppt change in assumptions
Chg in pa growth rate (ppt) Impact on 2010-15 growth (%)
5Y Cagr in HNWI 5Y Wealth Cagr HNWIs Wealth
GDP growth rate 0.3 0.4 2.1 2.3
Currency appreciation 1.5 1.6 9.6 9.4
Property prices 0.5 0.6 3.3 3.4
Stock market 0.2 0.2 1.3 1.3
Figure 31
Sensitivity to zero growth in inputs
Chg in pa growth rate (%-pt) Impact on 2010-15 growth (%)
5Y Cagr in HNWI 5Y wealth Cagr HNWIs Wealth
GDP growth rate (3.4) (4.1) (22.7) (24.2)
Currency appreciation (5.7) (6.3) (36.6) (35.5)
Property prices (2.9) (3.3) (19.7) (19.9)
Stock market (2.3) (2.5) (15.8) (15.3)
Cumulative impact (13.5) (15.3) (66.9) (66.9)
Source: CLSA Asia-Pacific Markets
An alternative perspective is the impact on the projections if these variables did not rise but hypothetically stayed stagnant for the next five years. The two right columns in Figure 31 show the impact if there was no growth over five years in the inputs. On average we estimate the currencies to appreciate by almost 4% per year for the region. If instead they remain unchanged against the US dollar, the growth over the next five years in HNWIs would be reduced by just over one-third and similarly for their wealth.
GDP growth is the next most important factor, as it drives annual savings, which adds to wealth. For the 10 countries, we project an average 10.6% annual GDP growth in nominal terms. If these economies do not grow, the increase in HNWIs would fall by 23%, with a slightly greater impact on their estimated wealth.
Properties are a larger part of the HNWI’s wealth, on which we project an average 6% annual gains across these countries. The increase in HNWIs and their wealth over the coming five years would be reduced by about 20% if property prices do not rise. Meanwhile, if Asian equities stay unchanged over five years, compared to our estimate of 12% average annual appreciation, the growth in HNWIs would fall by about 15%, and similarly for their wealth.
Cumulative effect over five years can, however,
be significant
Without currency appreciation, growth in
HNWIs would be down by a third
GDP growth next most important input in
estimating HNWI growth
If property prices did not rise in the region,
increase in HNWIs would be reduced by 20%
If zero returns on assets, and no currency
appreciation, estimates of HNWIs drop significantly
A 1% change in currency assumption would lead to almost 10% difference in
HNWI estimate

Section 4: Risks to Asian wealth Wealthy Asia
5 September 2011 [email protected] 27
In the unlikely scenario that there is no growth in these economies, that their currencies do not appreciate against the dollar, and property prices as well as stock markets are completely stagnant in the region, the cumulative impact is that the growth in HNWIs over the next five years would be reduced by two-thirds (similarly for their wealth). No growth in any of these factors would nevertheless still allow the number of HNWIs to rise approximately 6% and their wealth by almost 8% pa. That comes from the portion of income saved each year, which incrementally adds to wealth.
The number of HNWIs only declines if there is a significant fall in asset values. Otherwise, savings from annual income, plus the yield on investments, underpin the wealth increase. Over the coming years, growth in wealth for the region is thus pretty much a given. Our unaggressive assumptions compounded together, point to Asian wealth set to surge quite significantly. These projections may even be exceeded if some of the inputs turn out to be too conservative.
High savings in the region gives underlying support
to growth in HNWI even if assets provide zero return
Number of HNWIs would decline only if significant
decline in asset values

Section 5: Plays on Asian wealth Wealthy Asia
28 [email protected] 5 September 2011
Plays on Asian wealth Rising Asian wealth has positive implications across a range of sectors from high-end retail, autos, properties, leisure and gaming, travel, hotels, healthcare and pharmaceuticals, as well as for asset managers with distribution in this region. Listed companies we identify in these segments have an aggregate US$600bn in market capitalisation, which is set to rise faster than overall market indices. Excellent prospects, however, will attract competition. The most compelling investments will be companies generating positive economic value with some competitive advantage allowing them to continue to be value-creators, where stock prices are at attractive valuations.
Among the EVA®-positive companies with business franchises catering for Asian wealth, our top picks are Prada, L’Occitane, Parkson Retail, Golden Eagle, Ports Design, LG H&H in the consumer space; Sands China, Wynn Macau, China MGM and Genting Berhad, as well as its subsidiaries for exposure to gaming; EVA Airways and Formosa International among plays on travel and high-end hotels; while Commonwealth Bank of Australia and Shinhan Financial will enjoy wealth management upside from the region.
Wealth sectors Just 0.06% of the region’s population were in the HNWI category as of 2010, while the developed parts of Asia have 1.5% of their adult population in the wealth set. As these countries develop, the rise in the numbers of the wealthy Asians and their high-end spending power will be a multi-decade theme. For the next five years, we estimate Asian wealth to grow 23% on a compounded basis. Meanwhile, our regional consumer and gaming team, led by Aaron Fischer, in their classic January 2011 Dipped in gold report estimate luxury spending in Asia ex-Japan to record a 17% Cagr (although we estimate that luxury spending in China will grow at a faster rate of 25% pa).
Luxury goods spending in Asia ex-Japan was around 17% of the global total last year. Our consumer team estimate that in 10 years that will more than double to 36%. We show our regional consumer team’s estimates in Figures 32-33, while their analysis of luxury spending in China, which represents 60% of the increase in wealth for the region, is attached in the Appendix.
Figure 32
Luxury market size and Cagr by domestic spending
0
50
100
150
200
250
300
350
400
2010 2011 2012 2013 2014 2015 2016 2017 2018 2019 2020
(€bn) 2010-20CL Cagr
Other 5%Japan 4%
Americas 5%
Europe 7%
Asia ex-Jp 17%
Source: CLSA Asia-Pacific Markets
Positive for wide range of sectors
Multi-decade theme
Prefer franchise businesses catering to
Asian wealth
Asia ex-Japan domestic luxury spending was 17% of global total in 2010, set
to rise to 36% by 2020

Section 5: Plays on Asian wealth Wealthy Asia
5 September 2011 [email protected] 29
Figure 33
Luxury-goods-market estimates
(€bn) 2010 2011 2012 2013 2014 2015 2016 2017 2018 2019 2020 Cagr 10-20 (%)
China 9 12 14 18 22 28 34 41 50 61 74 23% of total 5 6 7 9 10 12 13 14 16 18 19Japan 18 19 20 20 21 22 22 23 24 25 26 3% of total 11 11 10 10 9 9 8 8 8 7 7Japanese 16 17 17 17 17 17 17 18 18 18 18 1Mainland tourists 1 1 1 2 2 2 3 3 3 4 5 16Others 1 1 1 2 2 2 2 2 3 3 3 12Americas 50 53 55 57 60 63 66 70 73 78 82 5% of total 30 29 28 28 27 26 25 24 23 22 21Americans 44 45 47 48 50 51 53 54 56 58 59 3Mainland tourists 1 2 2 3 4 5 6 7 8 10 12 25Others 5 5 6 6 7 7 8 9 9 10 11 8Europe 62 66 69 74 78 84 89 96 103 112 121 7% of total 37 36 36 36 35 34 34 33 33 32 31Europeans 47 48 50 51 53 54 56 57 59 61 63 3Mainland tourists 6 7 8 10 12 15 18 21 26 31 37 21Others 10 11 12 13 14 15 16 17 19 20 22 8Hong Kong 4 5 6 7 8 10 12 14 16 19 23 18% of total 3 3 3 3 4 4 4 5 5 6 6HK locals 2 2 2 3 3 3 3 3 4 4 4 8Mainland tourists 2 3 3 4 5 7 8 10 12 15 18 23Others 0 0 0 0 0 0 0 0 0 0 0 7Taiwan 3 3 4 4 4 4 5 5 5 5 6 6% of total 2 2 2 2 2 2 2 2 2 2 2Taiwan locals 3 3 3 3 4 4 4 4 4 4 5 5Mainland tourists 0 0 0 0 1 1 1 1 1 1 1 13Others - - - - - - - - - - - -Macau 1 1 1 1 2 2 3 4 5 6 7 27% of total 0 0 1 1 1 1 1 1 1 2 2Macau locals 0 0 0 0 0 0 0 0 0 0 0 5Mainland tourists 1 1 1 1 2 2 3 4 5 6 7 27Others - - - - - - - - - - - -South Korea 6 6 7 7 8 9 9 10 11 12 13 8% of total 3 3 4 4 4 4 4 4 3 3 3Korea locals 5 6 6 6 7 7 8 8 9 10 10 7Mainland tourists 1 1 1 1 1 1 1 2 2 2 3 17Others 0 0 0 0 0 0 0 0 0 0 0 10Singapore 3 3 4 4 5 6 6 7 8 9 10 13% of total 2 2 2 2 2 2 2 2 3 3 3Singapore locals 3 3 3 4 4 4 5 6 6 7 8 12Mainland tourists 0 0 0 1 1 1 1 1 2 2 2 22Others 0 0 0 0 0 0 0 0 0 0 0 8Thailand 1 1 1 1 1 2 2 2 2 2 3 11% of total 1 1 1 1 1 1 1 1 1 1 1Thailand locals 1 1 1 1 1 1 1 1 1 2 2 8Mainland tourists 0 0 0 0 0 0 0 0 1 1 1 22Others 0 0 0 0 0 0 0 0 0 0 0 10India 1 1 1 1 1 2 2 2 2 3 3 15% of total 0 1 1 1 1 1 1 1 1 1 1India locals 1 1 1 1 1 2 2 2 2 3 3 15Mainland tourists - - - - - - - - - - - -Others - - - - - - - - - - - -Others 10 10 11 11 12 13 13 14 15 15 16 5% of total 6 6 6 6 5 5 5 5 5 4 4Global luxury market 168 180 193 207 224 243 264 288 316 348 385 9Source: CLSA Asia-Pacific Markets

Section 5: Plays on Asian wealth Wealthy Asia
30 [email protected] 5 September 2011
This has significant implications across sectors from luxury retail, retail landlords, high-end residential properties, wealth management, as well as private banking, leisure and hotels, autos and airlines to name some of the key sectors set to enjoy high growth. The direct beneficiaries are companies in Asia exposed to this wealth surge. However, global luxury brands will also enjoy upside from this segment, as well as from Asia’s wealthy shopping for high-end goods, through their increasing international travel.
Figure 34
Beneficiaries of Asian wealth surge
Code Mkt cap (US$m)
Description
Australia
CFS Retail CFX AU 4,925 Property trust that invests in, manages, and develops a portfolio of retail assets throughout Australia
Charter Hall Reit CQR AU 966 Owns a portfolio of supermarkets and shopping centres located in non-metropolitan areas throughout Australia, New Zealand and the United States
Commonwealth Bank CBA AU 77,160 Banking group with strong fund management through Colonial First State with funds sold in Asia
Echo Entertainment EGP AU 2,703 Owns and operates the Star City Casino in New South Wales, Jupiters Hotel & Casino on the Gold Coast, Treasury Casino & Hotel in Brisbane and Jupiters Townsville Casino
MAP Group MAP AU 6,236 An infrastructure investment company, whose portfolio is comprised of airport assets located throughout the world
Mirvac MGR AU 3,820 Manages hotels and resorts in Australia and New Zealand
Qantas QAN AU 3,617 Network of domestic and intercontinental routes mainly in the Asia-Pacific region
Westfield Group WDC AU 18,920 Property trust that invests in, leases and manages retail shopping centres in Australia, New Zealand, the United States and the United Kingdom. Operations also include funds and asset management
Westfield Reit WRT AU 7,722 Owns and manages a portfolio of shopping malls in Australia and New Zealand
China
Agile 3383 HK 4,710 Mix caters to higher end developments in China
Air China 753 HK 17,405 Provides passenger, cargo, and airline-related services in China, primarily based in Beijing. The main airline for international travel for mainlanders
China Merchant Bank 3968 HK 41,367 Provides a wide range of commercial banking services and has a strong wealth management brand under Sunflower Wealth Management
China Zhengtong 1728 HK 2,769 Automotive dealerships throughout China for BMWs and Audis
COLI 688 HK 17,571 Significant part of development for the well-heeled in China
CR Land 1109 HK 8,871 Projects catering to high-end in their mix of developments in China
Ctrip CTRP US 5,962 Consolidator of hotel accommodations and airline tickets in China
Evergreen 238 HK 305 Operates a nationwide retail network in the PRC targeting the high-end business formal and casual menswear market
Golden Eagle 3308 HK 4,417 Operates department stores in China located in prime areas
Hengdeli 3389 HK 1,800 Retails and wholesales international brand watches in China, backed by Swatch and LVMH who are shareholders, as well as Richemont and Rolex
Longfor Prop 960 HK 7,548 Higher-end development projects in the mainland
NWDS 825 HK 1,166 Owns and operates second largest department store network in the PRC
Parkson Retail 3368 HK 3,602 Network of department stores in the PRC in prime locations and runs a successful VIP programme
Hong Kong
Brilliance 1114 HK 6,461 Assembles BMWs for the PRC market
Cathay Pacific 293 HK 8,035 Leader among global airlines operating out of Hong Kong
China MGM 2282 HK 7,459 Owns a luxury resort, hotel and casino in Macau
Chow Sang Sang 116 HK 2,544 Manufactures and retails gold and gem-set jewellery products; also retails watches and trades in gold bullion
Dah Chong 1828 HK 2,262 Distributes Bentleys in China and Hong Kong
Dickson Concepts 113 HK 234 Has the Harvey Nicholls franchise for HK/China as well as brands including ST Dupont, Brooks Brothers, Tommy Hilfiger, Rolex, Chopard and Longines
Emperor Watch 887 HK 1,440 Retails luxurious branded watches, and offers design and sales of jewellery products.
Galaxy 27 HK 10,845 Operates casino, hotel and other entertainment facilities in Macau
Genting HK 678 HK 2,672 Operates cruise ships under the Star Cruises brand
Hang Lung 101 HK 15,061 Invests in, develops, and manages properties, establishing higher-end malls in China
HK & Sh Hotels 45 HK 2,168 Owns the Peninsula chain of hotels
Hong Kong Resources 2882 HK 91 Hong Kong Resources , through its subsidiaries, operates and franchises shops that retail gold and jewellery in China, including Hong Kong and Macau
Continued on the next page
Direct beneficiaries are companies in Asia
exposed to wealth surge

Section 5: Plays on Asian wealth Wealthy Asia
5 September 2011 [email protected] 31
Figure 34
Beneficiaries of Asian wealth surge (cont’d) Code Mkt cap
(US$m) Description
Hong Kong I.T Ltd 999 HK 1,102 Offers a wide range of apparel products, including items under the Fcuk, D&G, YSL, Zucca among
other brands Kerry Prop 683 HK 6,293 Invests in and develops real estate including projects in JV with sister company, Shangri La Asia Lifestyle 1212 HK 5,341 Operates the Sogo store and Nufron in Hong Kong and expanding into China L'Occitane 973 HK 3,875 Manufactures and retails cosmetics and personal-care products from natural and organic ingredients Luk Fook 590 HK 2,996 Retails gold jewellery, gold ornaments, gem-set jewellery and gemstones, and other accessory items Mandarin Oriental MAND SP 1,724 Owns hotels under the Mandarin Oriental brand as well The Oriental, Bangkok Melco Crown MPEL US 6,426 Owns and operates casino gaming and entertainment resort facilities in Macau Ming Fung 860 HK 374 Designs, manufactures, and sells a broad range of gem-set jewellery products on ODM/OEM basis;
also trades diamonds and gemstones Oriental 398 HK 414 Retailer of watches Ports Design 589 HK 1,090 Designs, manufactures, and retails ladies' and men's fashion garments, and sells accessories such
as shoes, handbags, scarves, and fragrances in China and Hong Kong under its brand name Ports International
Prada 1913 HK 14,133 Italian fashion company that designs, manufactures, promotes and sells high-end leather goods, ready-to-wear and footwear through the Prada, Miu Miu, Church's, and Car Shoe brands
Sands China 1928 HK 23,648 Owns and operates integrated resorts and casinos in Macau Shangri La 69 HK 7,518 Owns and operates hotels primarily in Asia, and provides management and related services SJM 880 HK 12,840 Operates casinos, hotels, and other tourism-related facilities in Macau SHKP 16 HK 36,143 Broad range of projects including higher end Sino Land 83 HK 8,240 Rich pipeline including some up-market projects to be launched Sparkle Roll 970 HK 443 Distributes Rolls Royce and Bentleys in China; its subsidiaries distribute other luxury goods Trinity 891 HK 1,711 Retails higher-end men's clothing with stores in the PRC, Hong Kong, Macau and Taiwan Value Partners 806 HK 1,107 An independent, value-oriented asset management group with a focus on China and Asia-Pacific Wharf 4 HK 20,055 Diversified group but a major asset are high-end retail properties in Tsim Sha Tsui in Hong Kong Wynn Macau 1128 HK 16,806 Owns and operates Wynn Macau India EIH EIH IB 1,051 Operates luxury hotels in India under the name "Oberoi" in addition to hotels in Egypt, Australia, Sri
Lanka, Indonesia and Saudi Arabia Hotel Leela Venture LELA IB 326 Owns and operates hotels, palaces and resorts; known for strategic location, individuality,
architectural aesthetics, lush greens and the intrinsic Indian heritage Indian Hotels IH IB 1,189 Operates The Taj Group of hotels Jet Airways JETIN IB 667 Operates between all of India's major cities and building out a global network Oberoi Realty OBER IB 1,614 Real estate development company operating in Mumbai, focused on premium developments Tata Motors TTMT IB 10,505 Jaguar Land Rover accounts for 58% of Tata Motors' consolidated revenue and 64% of Ebitda Titan Indus TTAN IB 4,086 Manufactures and retails jewellery and watches Indonesia Lippo Karawaci LPKR IJ 1,989 Develops higher-end residential units Panin Sek PANS IJ 116 Securities broking as well as investment management and advisory Summarecon SMRA IJ 1,040 Develops higher-end residential houses and apartments as well as shopping and recreational centres Trimegah Se TRIM IJ 40 Securities broking as well as investment management and advisory Japan Frontier Reit 8964 JP 1,729 Reit mainly investing in commercial buildings in metropolitan area and local cities Japan Retail Fund 8953 JP 2,424 Reit mainly investing in shopping centres and roadside retail stores which are managed by
Mitsubishi Corp-UBS Realty Toyota 7203 JT 129,882 Upside for the Lexus although currently only a small part of revenues for Toyota group Korea Amore Pacific 090430 KS 6,545 Manufactures and exports skincare, make-up, and fragrance products aiming for the higher end
through brands like Hera and Sulwhasoo Celltrion 068270 KQ 5,000 Biosimilars produced by the Co are half the price of bio-drugs but still costs US$10-30k pa per
patient; Company benefits from Asia's ageing population coupled with rising wealth class supports Grand Korea 114090 KS 1,342 Casino operator in Korea Korean Air 003490 KS 4,116 Provides domestic and international airline services LG H&H 051900 KS 6,681 Markets skincare and make-up products aimed at high end consumers including OHUI, WHOO, S:UM. Megastudy 072870 KQ 911 Offers on-line and off-line educational programmes to high school students, which remains a priority
for HNWIs in the region Mirae Asset 037620 KS 1,589 Provides mutual funds, asset management and brokerage services Osstem 048260 KS 137 Manufactures dental implant systems; provides products for dental surgery and exports abroad Paradise 034230 KQ 662 Operates casino facilities including hotel and retail in South Korea and Kenya Shinhan Financial 055550 KS 20,064 Businesses include banking, securities brokerage, trust banking, and asset management Shinsegae 004170 KS 2,911 Having spun off Emart, Shinsegae is now purely a departmental store business with prospects
supported by the country's growing wealth
Continued on the next page

Section 5: Plays on Asian wealth Wealthy Asia
32 [email protected] 5 September 2011
Figure 34
Beneficiaries of Asian wealth surge (cont’d) Code Mkt cap
(US$m) Description
Malaysia C&C Bintang CNCB MK 125 Assembles, distributes, and retails Mercedes Benz in Malaysia Genting Berhad GENT MK 12,584 90% of NAV from gaming activities, which span Asean region as well as UK and also has cruise
operations under Genting Hong Kong Genting M’sia GENM MK 7,070 Owns and operates gaming and resort operations in Malaysia KPJ Healthcare KPJ MK 876 Specialist medical centres in Malaysia and Indonesia M’sia Airport MAHB MK 2,395 Operates the KLIA airport Poh Kong PKH MK 58 Manufactures and retails jewellery mainly in Malaysia Philippines Alliance Global AGI PM 2,768 Casino operations in JV with the Genting Berhad in the Philippines Ayala Land ALI PM 4,888 Develops and invests in higher end real estate properties; also operates hotels BDO BDO PM 3,748 Wealth management division still relatively small but estimated to contribute around 7% of net income Belle BEL PM 891 Constructing a casino that will be operational by 2013 Shang Prop SHNG PM 215 Develops, manages and invests in real estate; portfolio includes the Shangri-La Hotel and Plaza Mall Singapore Banyan Tree BTH SP 479 Owns and manages premier hotels; operates spas, galleries and golf courses as well CapitaMall Trust CT SP 4,673 Reit which owns and invests in retail properties primarily in Singapore CapitaMalls Asia CMA SP 3,798 Shopping mall developer with a pan-Asian portfolio ranging from Singapore, China, Malaysia,
Japan and India City Dev CIT SP 7,818 Mix of projects with higher-end tilt in Singapore Cortina CTN SP 67 Retails and distributes luxury watches in the Asia Pacific region Fortune Reit FRT SP 798 Reit investing in a portfolio of retail shopping malls in Hong Kong, eg, The Metropolis Mall,
Ma On Shan Plaza, Smartland, The Household Center, and Jubilee Court Shopping Centre Frasers FCT SP 934 Reit investing in retail properties in Singapore and overseas Genting Sing GENS SP 16,466 Operates one of the two integrated resorts with casino operations in Singapore Hotel Prop HPL SP 846 Operates and manages hotels, including Concorde, Four Seasons, Hilton Hour Glass HG SP 208 Retails and wholesales watches, jewellery and also manufactures watches Jardine C&C JCNC SP 12,834 Distributor of Mercedes Benz in Singapore OCBC OCBC SP 25,091 Fully-owned subsidiary, Bank of Singapore, came about from acquisition of ING Asia Private Bank
and is positioned for wealth management in the region OUE OUE SP 1,936 Diversified real estate owner of prime properties in Singapore including the Meritus hotels Raffles Medical RFMD SP 982 Operates medical clinics and dental treatment services SC Global SCGD SP 426 Higher-end residential property developer Singapore Airlines SIA SP 11,040 Leading global airline operating out of Singapore positioned as the preferred airline for Asean
travellers among others Starhill Global SGREIT SP 981 Reit which invests in retail and office buildings in Singapore and overseas UOL Group UOL SP 2,968 Diversified group which also manages hotels under the Pan Pacific brand WBL Corp WBL SP 652 Distributes high-end cars in Singapore including Bugatti, McLaren, Bentley Taiwan China Airlines 2610 TT 2,513 One of only three Taiwanese airlines flying direct to China Chinatrust 2891 TT 8,139 Financial group; asset management is approximately 25% of group profit E.Sun 2884 TT 2,438 Financial group; asset management is approximately 15% of group profit EVA Air 2618 TT 2,355 One of only three Taiwanese airlines flying direct to China Far Eastern 2903 TT 2,513 Operates department stores in Taiwan Formosa International
2707 TT 1,314 Operates restaurants, night clubs, and hotel management consulting and own the Regent hotel brand globally
Prince Housing 2511 TT 969 Operates the W hotel in Taiwan Taishin 2887 TT 3,071 Financial group; asset management is approximately 15% of group profit Thailand Airports Of Thailand AOT TB 2,254 Operates the Bangkok International Airport (Don Muang) as well as provincial airports in Chiang Mai,
Chiang Rai, Hat Yai, and Phuket; is developing the new Bangkok international airport (Suvarnabhumi) Bangkok Dusit Md BGH TB 3,290 Operates Bangkok General Hospital which specialises in cardiovascular, lung, neurological, eye and
genitourinary cancer Bumrungrad BH TB 924 Owns and operates the Bumrungrad Hospital in Bangkok Erawan Group ERW TB 214 Develops and operates hotels, offices and shopping centres in Bangkok, including Grand Hyatt, JW
Marriott and the Renaissance in Koh Samui Land & Houses LH TB 2,293 Develops real estate projects including single-detached homes, townhouses, and condominiums Minor Int MINT TB 1,421 Owns and operates restaurants and hotels in Asia Quality Houses QH TB 549 Developer specialising in single-house, apartment, and condominium development projects Robinson Dept St ROBINS TB 1,487 Owns and operates Robinson department store chain Thai Airways THAI TB 2,132 Thailand's national airline providing with domestic and international routes including Asia, Europe,
North America, Africa and South West Pacific
Source: CLSA Asia-Pacific Markets

Section 5: Plays on Asian wealth Wealthy Asia
5 September 2011 [email protected] 33
Figure 34 shows an array of companies positioned to capitalise on high-end spending power in Asia. Catering to the high-end segment may not yet be a large part of the business for a number of these companies. That, however, is precisely because this market segment is quite small. As it grows at a faster rate, the companies with a durable competitive advantage will grow faster than peers. Prada, Ports Design, Hengdeli, Emperor Watch and Dickson Concepts. IT Ltd. is already seeing the bulk of its business coming from the luxury segment. Departmental stores such as Golden Eagle, Parkson Retail, Shinsegae, LG H&H and Robinson Department Store all provide exposure to higher-end spending.
Various listed companies operate five- and six-star hotel chains including Hong Kong Shanghai Hotels, Mandarin Oriental, Shangri-la, as well as Formosa International Hotels (which owns the Regent hotel brand), Banyan Tree in Singapore, and the premier hotel groups from the subcontinent, Indian Hotels (operates the Taj chain) and also EIH (which operates Oberoi). Meanwhile, gaming companies in Macau get the bulk of revenue from high-rollers; this segment is also significant for Genting Singapore’s operations. In the Philippines, Alliance Global operates a casino together with the Genting group, while Belle will open its gaming doors in 2013.
The wealthy in Asia have a large choice of developers and projects to choose from. Most of the listed property companies cater for the burgeoning middle-class segment. However, those with upside from premier developments include CR Land, Agile and China Overseas Land, Sino Land, India’s Oberoi Realty, City Developments and SC Global in Singapore, Ayala in the Philippines, Land and Houses in Thailand, as well as Lippo Karawaci and Summarecon in Indonesia. The indirect beneficiaries of high spenders are landlords such as Wharf, as well as Hang Lung, Capitamalls Asia and various Reits that give indirect exposure to rapidly-rising retail spending in the region.
Figure 35
China domestically made luxury segment vs overall auto sales growth
(20)
0
20
40
60
80
100
120
140
Jan 10 Mar 10 Jun 10 Sep 10 Dec 10 Mar 11 Jun 11
Luxury brand YoY Overall YoY(%)
Source: Chinese Association of Automobile Manufacturers, CLSA Asia-Pacific Markets
Growth for autos will be stronger at the top-end. For instance, the overall auto market in China has been subdued, growing at just 6% YoY in 1H11; meanwhile the luxury segment raced ahead with 56% YoY growth. Our China autos analyst, Scott Laprise points out that luxury car sales are only 3% of
Luxury brand sales growing faster, despite overall auto market in
China slowing since 2H10
High-end hospitality and gaming
Array of companies to see upside
Growth in top-end of auto sector more robust
High-end developers and various Reits

Section 5: Plays on Asian wealth Wealthy Asia
34 [email protected] 5 September 2011
total sales and expects domestically-made BMW sales to rise 99% and Mercedes Benz to grow 76% for the full year. Efforts by makers in these segments to price their products at a premium so as to maintain their cache, should mean there is less risk of margin erosion, unlike the mass segment where distributors are in a fist-fight for market share.
Figure 36 Figure 37
Shanghai auto show’s high bid at US$7m China is Porsche Cayenne’s No.1 market
Source: autohome.com.cn
Auto makers and distributors in the premier segment include Brilliance (assembling BMWs in China), Dah Chong Hong (distributing Bentleys in the PRC), Sparkle Roll (Bentley distribution in Beijing), Cycle and Carriage Bintang, as well as Jardine C&C for Mercedes distribution in Malaysia and Singapore. Tata Motors’ big bet in the acquisition of Jaguar Land Rover should also pay off handsomely, supported by growth in this region.
Filling aircraft up at the front will also help airlines get a better yield. Prospects are much better in Asia than the developed world, where HNWI the growth is more subdued. This should be a medium-term fillip for the likes of Cathay Pacific, Singapore Airlines, and even Air China, as well as China Airlines and EVA Airways (which is part of an oligopoly controlling direct flights between Taiwan and the mainland).
Wealth management is still very much in its infancy in Asia and thus a small part of most banking group’s earnings. However, OCBC’s acquisition of ING’s Asian wealth management business, now renamed Bank of Singapore, positions it to tap Asia’s wealth. Meanwhile the likes of Mirae Asset Management in Korea, Value Partners in Hong Kong, as well as Commonwealth Bank in Australia, through subsidiary Colonial First State, are likely to be among the asset managers set to find tremendous growth in wealth.
The well-heeled in Asia will also propel growth for healthcare groups such as Raffles Medical, KPJ Healthcare and Bumrungrad, as well as pharmaceutical companies catering to those with higher spending power like Celltrion’s bio-similar drugs.
The market cap of companies we identified benefiting from rising Asian wealth adds up to some US$600bn (excluding giants like Toyota and Commonwealth Bank, where the exposure to Asian wealth is still relatively limited). This is significant but not yet a large part of Asian markets. However, the spending power of Asia’s wealthy will rise faster than for the average person, thus opportunities for these companies will drive higher returns for this segment relative to market averages.
Prefer automakers and distributors of
luxury makes
Asian wealthy will fill up the front-end of airplanes
Wealth management in Asia is a growth business
Positive for healthcare
Aggregate market cap of US$600bn to rise faster
than regional indices
Shanghai motor show saw it highest ever
bid at US$7m for an Aston Martin

Section 5: Plays on Asian wealth Wealthy Asia
5 September 2011 [email protected] 35
Franchises tapping Asian wealth As in any area where prospects are strong, new entrants will emerge. In The moat report issued in February 2011 we argued that companies with a business franchise that had a return on capital higher than their cost of capital and a durable competitive advantage to remain value-creators, were likely to be the best investments when their stocks are attractively priced. Similarly, for companies positioned to benefit from the massive growth in the wealth set in Asia: the best investments will be stocks representing franchises able to withstand the inevitable competition. The preferred exposure should be through companies that have some competitive advantage or moat around their business to grow profitably on the tide of Asian wealth.
Figure 38 shows companies that we believe have a business franchise and give the current valuations on their stocks, while Figure 39 summarises the positioning of these companies and their competitive advantage. Some of these stocks may have held up better and thus have less upside relative to the market over the next six to 12 months, thus have a negative recommendations (CLSA bases it recommendations on expected relative stock performance to the market).
Where valuations appear reasonable (EV/Ebit multiple at 14x or less), we reiterate positive recommendations on the business franchises that will capitalise on Asian wealth, including L’Occitane, Parkson Retail, Golden Eagle, Ports Design and smaller cap, Evergreen in China. The Genting group of companies represent a brand name for gaming in the region and is attractively valued, with the ultimate Malaysian parent company at just 6x EV/Ebit; similarly valuations on the recently listed China MGM are reasonable relative to other Macau plays.
Figure 38
Franchise businesses to play on Asian HNWI theme (sorted by ROIC) Code ROIC (%) ROE (%) EV/Ebit (x) RecTitan Industries TTAN IB >100 43.7 19.6 SELLWynn Macau 1128 HK >100 90.9 15.5 BUYCtrip CTRP US >100 16.4 20.3 U-PFChina MGM 2282 HK 94.0 88.6 13.7 O-PFFormosa International 2707 TT 85.4 42.0 24.3 BUYGolden Eagle 3308 HK 60.0 29.1 16.0 O-PFEvergreen 238 HK 54.6 15.7 2.0 BUYMegastudy 072870 KQ 52.8 23.3 7.2 U-PFL'Occitane 973 HK 40.0 20.7 12.5 BUYPorts Design 589 HK 29.4 29.0 8.5 BUYSands China 1928 HK 25.6 22.7 19.4 BUYPrada 1913 HK 24.4 28.0 14.8 BUYTata Motors TTMT IB 23.7 32.0 4.6 U-PFParkson Retail 3368 HK 22.8 25.0 13.3 BUYLG H&H 051900 KS 22.4 30.7 17.4 O-PFAmore Pacific 090430 KS 22.4 18.1 18.2 SELLGenting Singapore GENS SP 22.1 19.0 12.1 BUYGenting Berhad GENT MK 22.0 18.2 5.3 BUYChina Merchant Bank 3968 HK 21.9 21.9 8.6 U-PFHengdeli 3389 HK 20.0 19.3 10.2 BUYCommonwealth Bank CBA AU 19.8 19.8 9.8 U-PFGenting Malaysia GENM MK 18.0 13.0 6.2 O-PFShinhan Financial 055550 KS 15.7 15.7 6.4 BUYCelltrion 068270 KQ 15.4 19.1 27.0 U-PFChinatrust Financial 2891 TT 11.7 11.7 12.5 U-PFOCBC OCBC SP 10.5 10.5 12.4 U-PFCathay Pacific 293 HK 9.5 13.2 9.1 SELLEVA Air 2618 TT 9.1 13.8 10.6 BUY
Note: Financials are averaged for 2011-12; PE not EV/Ebit for banks. Source: CLSA Asia-Pacific Markets
Business franchises catering to Asian wealth
Recs are relative to expected market upside
Franchise stock in consumer retail
and gaming
Valuations on a number of Franchise
plays on Asian wealth are quite attractive

Section 5: Plays on Asian wealth Wealthy Asia
36 [email protected] 5 September 2011
Among airlines with a franchise that will benefit from more passengers sitting in the front end of aircraft, our pick is EVA Air - one of the three Taiwanese companies operating direct flights to the mainland. Meanwhile, Commonwealth Bank of Australia and Shinhan Financial are well-positioned among financial groups to tap the potential in Asian wealth management.
We have positive ratings on Sands China, Wynn Macau, Prada, LG H&H and Formosa International, although currently at somewhat higher multiples; they nevertheless represent franchise stocks to benefit from HNWI spending. China Merchant Bank, OCBC, Chinatrust, Cathay Pacific, Singapore Airlines, Hengdeli, Celltrion, Megastudy and Tata Motors presently have a negative rating. However, valuations have become more attractive and are also positioned to benefit from growth in Asian wealth.
The list of franchise stocks to play on the theme of Asian wealth is a much smaller one compared with the overall list of companies in the relevant segments. However, it is these stocks that we believe have a competitive advantage in their markets. Already generating positive economic value, they should provide investors with strongest returns to ride on Asian wealth.
Figure 39
Key competitive advantage of franchise businesses on Asian HNWI theme (sorted by EVA®/IC)
Code Avg EVA®/IC¹
Competitive advantage
Titan Industries TTAN IB >100 Largest manufacturer and retailer of watches (12,000 multibrand watch outlets) and jewellery in India with 65% market share in the organised watch market and 80% share in the organised jewellery market and recently moved into prescriptive eyewear market
Wynn Macau 1128 HK >100 Wynn is a destination casino resort in Macau with another casino, Encore, recently added to the portfolio; company chairman, Steve Wynn has an excellent track record developing nine luxury properties in Las Vegas and Macau with each better than the last. Wynn is the most profitable casino in Macau
Ctrip CTRP US 90.2 China's largest online travel agency, its brand enjoys a higher level of recognition, while its larger volumes lead to guaranteed room allocations by hotels and special discounts from airline operators as well, thus providing a significant competitive advantage
China MGM 2282 HK 85.1 One of five companies authorised to operate a gaming licence in Macau, deploying branding from its parent, MGM Resorts International
Formosa International 2707 TT 82.1 Becoming a global hotel play with Regent Hotel brand, the company is also focusing on expanding its own hotel brands as Silks and Just Sleep
Golden Eagle 3308 HK 45.2 Prime location of stores and ownership of flagship stores to cap rental pressure that most competitors will face plus a successful VIP programme and sophisticated ERP system
Evergreen 238 HK 39.8 One of China's leading menswear companies positioned at the mid-upper to high-end segment through two self-owned brands, has a nationwide retail network of 268 outlets
Tata Motors TTMT IB 39.5 Formidable reputation in domestic commercial vehicle market and amongst top-three car manufacturers, establishing itself as a price leader with the 'Nano' but with the fate of the group now tied largely to Jaguar Land Rover internationally
Megastudy 072870 KQ 32.2 One of the most innovative companies in Korea and has thus dominated the online education space. Focuses on the growing middle- and elementary-school businesses; scale confers network effects and improves competitiveness via strong returns funding the best lecturers who in turn bring in more students
L'Occitane 973 HK 28.6 French cosmetics company specialising in products based on natural ingredients; Asia accounts for almost half of sales. Has established a niche position in the fast-growing natural-ingredient and organic cosmetics segment, and a strong brand identity through expansion of its own managed-store network
Ports Design 589 HK 20.2 Consistently ranks among the top luxury women's wear brands in China thus well-positioned to capture the uptrend of China's fast-growing luxury market with over 300 stores in more than 60 cities across China
Continued on the next page
Other franchise stocks we are positive on benefiting
from Asian wealth
Also in airlines and wealth management
Franchise plays on Asian wealth set to be
outperformers

Section 5: Plays on Asian wealth Wealthy Asia
5 September 2011 [email protected] 37
Figure 39
Key competitive advantage of franchise businesses on Asian HNWI theme (sorted by EVA®/IC) (cont’d)
Code Avg EVA®/IC¹
Competitive advantage
Sands China 1928 HK 19.1 Operates three casino-hotels in Macau with 3,573 hotel rooms and suites, as well as about 849,000 sq ft in casino space and 1.2m sq ft of meeting facilities; the Macau casinos follow the excellent track record of the parent group in Las Vegas of developing luxury properties leading to higher net win per tables and Ebitda margins
Prada 1913 HK 18.5 One of the world's luxury-goods companies with an iconic triangle logo; its impressive and longstanding heritage is a barrier to entry for potential competitors
Commonwealth Bank CBA AU 18.2 Sunk IT spend creates a sustainable competitive advantage versus its Aussie peers
Genting Singapore GENS SP 17.6 One of the two integrated resorts with a casino, which is strong in Singapore's mass segment; government licensing will prevent any further casinos opening until after 2017
Parkson Retail 3368 HK 14.9 The largest listed PRC department store chain with 40 stores in over 20 cities and a total floor area of approx 1m m²; prime location of stores nationally and a successful VIP programme and sophisticated ERP system. Brand equity being built with about 4m Parkson loyalty card member who account for around 40% of gross sales and about 500,000 co-branded China Merchants Bank credit card holders
LG H&H 051900 KS 13.8 Market leader in Household Products and No.2 in cosmetics as well as soft drinks; combines distribution power, strong sales and marketing execution which has driven market share gains in household products, cosmetics, beverages and the dairy market; is the Korean partner for Coke and Danone
China Merchant Bank 3968 HK 13.4 Perception of being the best retail bank and has the highest share of retail loans; one of the first to launch credit cards in China where it is a market leader (13% share) just behind ICBC. Also enjoys a good brand name in wealth management (Golden Sunflower)
Amore Pacific 090430 KS 12.5 Korea's most successful cosmetics company with 34% market share; sells two premium brands, Hera and Sulwhasoo
Genting Berhad GENT MK 12.4 Genting's 40 years of casino branding in Malaysia has successfully expanded into Singapore and the Philippines; the group is also making inroads into casino/leisure business in the UK and USA
EVA Air 2618 TT 8.8 A unique and integrated cargo logistics service under Evergreen group, which would add value for clients after China open skies for air cargo transhipment; unit cost 20% lower than regional airlines
Hengdeli 3389 HK 8.6 Watch retailer/wholesaler targeting mid to high-end segments with more than 250 stores mostly in China; this segment requires brand support thus relationship and trust with similar brand-management vision as suppliers; Hengdeli is backed by the four largest Swiss-watch groups, Swatch, LVMH, Richemont and Rolex with Swatch and LVMH shareholders of the company
Shinhan Financial 055550 KS 6.1 Korea's second-largest financial institution with superior nonbank positioning, its greatest strength is its culture of innovation and product leadership; has two asset-management businesses, a life-insurance operation and securities operation
Genting Malaysia GENM MK 5.5 The firm operates a near-monopoly franchise in Malaysia with its Genting Highlands Resorts; has 19.6% stake in Genting HK which operates Star Cruises, arguably another gaming firm
Celltrion 068270 KQ 4.5 Strong biologic drug development technology, built up in-house and through technology-transfer via a Genentech spinoff; likely to remain dominant in biosimilar space in emerging markets and expand in developed markets when patents expire with high barriers to entry in technology, production and marketing
Chinatrust Financial 2891 TT 2.9 Taiwan's best banking franchise, strong in consumer banking and wealth management, with the highest underlying profitability in the sector; already has the brand and a regional foundation to build on, and with good potential to build its business in China
Cathay Pacific 293 HK 2.8 Consistently ranks among the world's top-three airlines in customer surveys; owns Dragonair, which flies from HK to China and shorthaul regional routes; has an 18% stake in Air China, the largest airline in the mainland
OCBC OCBC SP 2.4 Has built a network of 480 branches in 15 countries with a significant presence in Malaysia and Indonesia; insurance subsidiary, Great Eastern is the largest insurance group in Singapore and Malaysia; acquired ING Asia Private Bank and has rebranded it as Bank of Singapore, which is the wealth management arm
¹ ROE-COE for financials, Source: CLSA Asia-Pacific Markets

Appendix Wealthy Asia
38 [email protected] 5 September 2011
Appendix: From head to toe The global luxury-goods market is evenly split among apparel, prestige cosmetics, “hard luxury” items which includes watches and jewellery, and others including accessories and leather goods. China’s market, however, leans more towards hard luxury and accessories, at the expense of apparel. As we previously discussed, watches and jewellery top China’s luxury shopping list and accessories are great for displaying success and wealth.
Luxury market category breakdown
1425
25
25
29
25
3225
0102030405060708090
100
China World
Others, incl. accessories and leather goodsHard luxuryPrestige cosmeticsApparel
(%)
Source: Bain, CLSA Asia-Pacific Markets
We believe hard luxury should continue to lead growth of the luxury-goods market for cultural reasons, although apparel and prestige cosmetics would still expand at very impressive rates.
Luxury segment growth
0
10
20
30
40
50
60
70
80
2010 2011 2012 2013 2014 2015 2016 2017 2018 2019 2020
Apparel
Prestige cosmetics
Hard luxury
Others (incl. accessories and leather goods)
2010-20Cagr20%
14%
27%
25%
(€bn)
Source: CLSA Asia-Pacific Markets
Jewellery Jewellery retail sales in China reached Rmb113.6bn in the first 11 months of 2010, up 56% YoY, according to the National Bureau of Statistics of China. Momentum has been very strong with YoY growth accelerating to 23-82%. Gold prices have increased in the past 10 years, jumping from US$272/oz in 2000 to more than US$1,421/oz in December 2010. Jewellery sales, however, have outpaced the gold price increase.
Aaron Fischer, CFA Regional Head of Consumer and Gaming Research [email protected] (852) 26008256
Mariana Kou (852) 26008190
Strong momentum
We include an extract from Dipped in gold - our
consumer team’s analysis of China’s luxury market

Appendix Wealthy Asia
5 September 2011 [email protected] 39
China jewellery sales (retail value)
0
20
40
60
80
100
120
140
2000 2001 2002 2003 2004 2005 2006 2007 2008 2009 Annualized10CL
(Rmbbn)
Source: Wind, CLSA Asia-Pacific Markets
Jewellery sales versus gold prices
(10)
0
10
20
30
40
50
60
2001 2002 2003 2004 2005 2006 2007 2008 2009 Annualized10CL
Jewellery sales YoY Gold prices(%)
Source: Wind, Bloomberg, CLSA Asia-Pacific Markets
Gold is popular among Chinese consumers for its intrinsic value and as a symbol of wealth and social status. Gold accessories are often purchased as gifts for special occasions, especially weddings, baby showers and birthdays. The World Gold Council reports that mainland Chinese demand for gold in the 12 months ended 3Q10 reached 526.8 tonnes, up 21% YoY, compared with the global average of 8% YoY. The increase was driven by 70% YoY growth in net retail investment and an 8% YoY rise in jewellery demand. In Hong Kong, demand for gold jewellery supported by mainland tourists jumped by 17% in the same period.
The council estimates in the past five years about 60% of gold demand from China was bought for jewellery. In the past 12 months, 71% of the demand was for jewellery. Nevertheless, our CRR middle-class panel still believes that gold is a good investment option, only after property and domestic stocks. The council expects gold demand in China may double within a decade.
Shining gold
Gold demand may double within a decade
Accelerating growth
Jewellery sales growing faster than gold prices

Appendix Wealthy Asia
40 [email protected] 5 September 2011
India continues to dominate world demand for gold. Although India is not a key luxury-goods market, gold demand is very strong so this segment could be one way to play the rising income and consumption story there.
Japan, on the other hand, sees dishoarding gathering pace. As gold prices skyrocket, Japanese investors sold back 68 tonnes of gold in the past 12 months, offsetting the 21 tonnes demanded for jewellery consumption.
Gold consumption demand in value (3Q09-10), including jewellery & retail investment
(1,711)
18
67
591
770
1,118
1,287
1,381
1,631
2,543
2,776
2,801
2,934
4,127
4,197
9,168
9,553
19,616
31,807
(5,000) 0 5,000 10,000 15,000 20,000 25,000 30,000 35,000
JapanFranceTaiwan
South KoreaHong Kong
UKIndonesia
ItalyOther Europe
RussiaVietnam
SwitzerlandThailand
GermanyTurkey
Middle EastUSA
ChinaIndia
(US$m)
Breakdown of consumption demand
820
5667697177
919592
80
4433312923
95
0
10
20
30
40
50
60
70
80
90
100
HongKong
MiddleEast
India China World Turkey USA Vietnam Thailand
Jewellery Net retail investment(%)
Source: World Gold Council, CLSA Asia-Pacific Markets
According to discussions with management of a few large players, rose gold is the new favourite among Chinese consumers. The growing popularity of gemstones and diamond rings in a country that was traditionally more interested in gold and jade also adds to the strong jewellery sales. According to the Ministry of Civil Affairs, more than 11 million couples tied the knot in the mainland in 2009. Industry leader De Beers estimates that nearly half of
Some 71% of Chinese gold demand for jewellery
Indian demand for gold is very strong
Rose gold is the new favourite

Appendix Wealthy Asia
5 September 2011 [email protected] 41
the couples getting married in Beijing, Shanghai, and Guangzhou are now buying diamond engagement rings. With the 20-34 age group expected to stay at around 30% of total Chinese population in the next decade, demand for valuable jewellery should continue to be robust.
The jewellery companies we surveyed also said mainland tourists are increasingly looking for larger diamonds. One company said they just recently had a customer asking for a HK$4m pure jade bangle and another one buying a HK$10m diamond. Another large retailer also said mainlanders like to buy two to three-carat diamonds for investment. In 2009, the US accounted for about 40% of global consumer diamond demand.
Diamond demand based on polished wholesale price (2008)
China5%
Gulf8%
USA41%
India8%
Hong Kong2%
Taiwan2%
Italy4%
Rest of world19%
Japan11%
Source: De Beers, CLSA Asia-Pacific Markets
As the world’s largest diamond producer, De Beers forecasts China’s diamond demand to grow from 6-7% of global demand to 16% by 2016 (15% cagr).
Chinese diamond demand as percentage of global demand
16
6
0
2
4
6
8
10
12
14
16
18
2009 2016
(%)
Source: De Beers, CLSA Asia-Pacific Markets
According to Euromonitor data, Chinese consumers have a strong preference for rings, contributing to almost 50% of jewellery sales.
Chinese diamond demand to rise rapidly
Jewellery also good for investment

Appendix Wealthy Asia
42 [email protected] 5 September 2011
Sale of jewellery in China by type (2009)
Rings50%
Wristwear8%
Neckwear19%
Earrings23%
Source: De Beers, CLSA Asia-Pacific Markets
There are a handful of big players in the jewellery industry in China, with the big three taking up 32% of real jewellery shares. A number of the top players are listed in Hong Kong, including Luk Fook (590 HK), Chow Sang Sang (116 HK), TSL Jewellery (417 HK) and 3D-Gold (870 HK). Euromonitor estimates that 99.5% of jewellery sales in China were made in retail stores.
3D-Gold’s corporate gift collection
Jewellery and decor designed to cater to Chinese
Source: Company website Source: Chow Tai Fook’s online product catalogue
This strong demand is driving retailers to expand aggressively. Privately-held Chow Tai Fook, for example, is looking to open 1,000 additional outlets on the mainland, doubling its existing network by 2020. It will also add more production lines to its two jewellery processing plants in Guangdong and Shenzhen. Half of the investment planned for the next decade will go to third and fourth-tier cities in rural areas, where management sees enormous potential. Kent Wong, managing director at Chow Tai Fook, said in an interview with a Hong Kong journal, “Consumers in big cities like Beijing and Shanghai now buy jewellery casually when they do their weekend shopping. We expect that will be happening in smaller cities as well in 10 years’ time.”
Few dominant players
Aggressive expansion to capture segment
growth potential
Chinese love rings

Appendix Wealthy Asia
5 September 2011 [email protected] 43
The jewellery market is considerably more consolidated than other segments like clothing and drinks. We believe this is partially due to the high inventory that needs to be held on hand, thus creating a high barrier to entry for smaller players. More importantly, Chinese consumers highly value jewellery brands and retailer reputation. News of low-quality gold being sold in the market often encourages consumers to shop at big brand-name stores, which they believe should have a better-developed quality control system. The Chinese Gold & Silver Exchange Society recently said that at least 200 ounces of fake gold was discovered on the Hong Kong gold market and president Haywood Cheung estimates 10x that amount might have infiltrated the retail market.
Real jewellery company shares in China
% retail value (retail selling price) 2005 2006 2007 2008 2009
Company
Chow Tai Fook Jewellery 10.5 10.7 10.9 11.3 11.6
Luk Fook Holdings (International) 9.5 9.6 9.7 9.9 10.1
Chow Sang Sang Holdings International 9.8 9.8 9.8 9.9 10.0
Gallop Jewellery 9.3 9.2 9.2 9.1 8.9
Shanghai Laofengxiang 7.6 7.6 7.7 7.8 7.9
TSL Jewellery (Macau) 5.8 5.8 5.9 6.0 6.2
Chow Tai Seng Jewellery 5.1 5.3 5.5 5.7 6.0
Fujian Fuhui Jewelry 4.3 4.3 4.4 4.5 4.5
3D-Gold Jewellery Holdings 3.6 3.7 3.9 4.1 4.3
Zhejiang Yuewang Jewellery 4.0 4.1 4.1 4.1 4.1
Others 30.6 29.9 29.0 27.5 26.4
Total 100.0 100.0 100.0 100.0 100.0
Source: Euromonitor
Our CRR survey shows that Chow Tai Fook is a brand leader in the jewellery segment in China.
CRR survey: Which jewellery brand did you buy?
1
1
1
2
2
3
3
4
14
0 2 4 6 8 10 12 14 16
Cartier
Hermes
Tiffany
Laofengxiang
Jinboli
King Liu Fook
Chow Sang Sang
Swarovski
Chow Tai Fook
(No. of mentions)
Source: China Reality Research
Jewellery market more consolidated than
other sectors
Leading by a wide margin

Appendix Wealthy Asia
44 [email protected] 5 September 2011
Chinese millionaires’ favourite jewellery brands
2006 2007 2008 2009 2010
Cartier Cartier Cartier Cartier Cartier
Chanel Bulgari Chanel Van Cleef & Arpels
Bvlgari
Piaget Piaget Tiffany Tiffany Montblanc
Tiffany Dior Van Cleef & Arpels
Bvlgari Tiffany
Bulgari Chanel Piaget Chanel Chanel
Dior Tiffany Bvlgari Piaget Piaget
Van Cleef & Arpels
Adler Mikimoto Mikimoto Van Cleef & Arpels
Adler Van Cleef & Arpels
Harry Winston Harry Winston Mikimoto
na Mikimoto Adler Adler Adler
na na Dior Chaumet Chaumet
Source: Hurun Research Institute
Watches The Swiss watch industry is worth SFr15.7bn (US$14.9bn). The industry did contract in 2009 due to the global financial crisis, by 22.8%, the first contraction after five consecutive years of growth. This year so far has been one of growth, up 21.8% to November. The largest buyer of Swiss watches in the world is Hong Kong, accounting for 19% of total Swiss watch exports by value. Hong Kong superseded the US as the largest Swiss watch importer from mid-2007, spurred on by a combination of a healthy financial and property markets (prior to the crisis) and the influx of mainland Chinese tourists. It is also well accepted (without official estimates though) that Hong Kong does serve as a re-export hub, hence some of the direct intake into Hong Kong does find its way to other parts of Asia, including China. As of November 2010, China is currently ranked the fourth-biggest buyer of Swiss watches, up from 10th place in November 2006.
Largest buyers of Swiss watches
0
500
1,000
1,500
2,000
2,500
3,000
3,500
Hong K
ong
USA
Fran
ce
Chin
a
Ital
y
Sin
gap
ore
Ger
man
y
Japan UK
UAE
Spai
n
Tai
wan
Sau
di Ara
bia
Russ
ia
Thai
land
2006 2010(CHF)
Source: CLSA Asia-Pacific Markets, Federation of Swiss Watch Manufacturers. Data is annualised to November 2010
China is currently the fourth-largest imported
Swiss watches
Cartier is the beloved jewellery brand
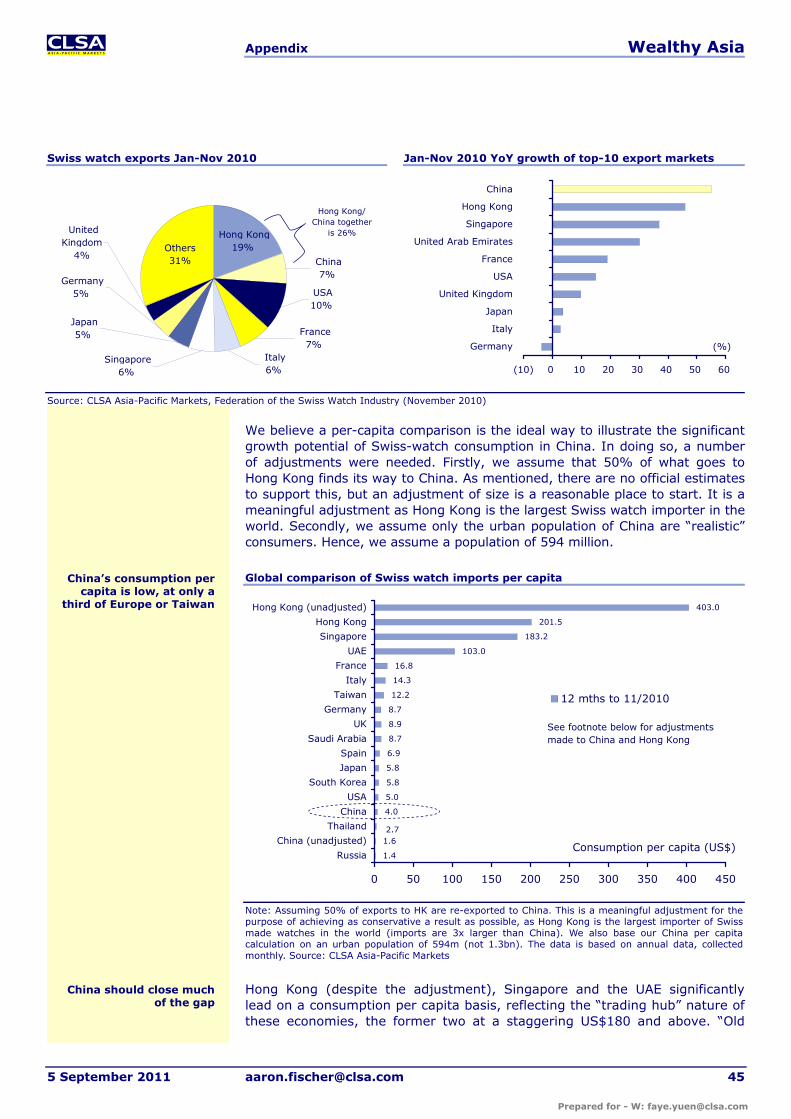
Appendix Wealthy Asia
5 September 2011 [email protected] 45
Swiss watch exports Jan-Nov 2010
Jan-Nov 2010 YoY growth of top-10 export markets
China 7%
USA 10%
Others31%
France 7%
Italy 6%
United Kingdom
4%
Germany 5%
Japan 5%
Singapore 6%
Hong Kong 19%
Hong Kong/China together
is 26%
(10) 0 10 20 30 40 50 60
Germany
Italy
Japan
United Kingdom
USA
France
United Arab Emirates
Singapore
Hong Kong
China
(%)
Source: CLSA Asia-Pacific Markets, Federation of the Swiss Watch Industry (November 2010)
We believe a per-capita comparison is the ideal way to illustrate the significant growth potential of Swiss-watch consumption in China. In doing so, a number of adjustments were needed. Firstly, we assume that 50% of what goes to Hong Kong finds its way to China. As mentioned, there are no official estimates to support this, but an adjustment of size is a reasonable place to start. It is a meaningful adjustment as Hong Kong is the largest Swiss watch importer in the world. Secondly, we assume only the urban population of China are “realistic” consumers. Hence, we assume a population of 594 million.
Global comparison of Swiss watch imports per capita
Consumption per capita (US$)1.4
1.6
4.0
5.0
5.8
5.8
6.9
8.7
8.9
8.7
12.2
14.3
16.8
103.0
183.2
201.5
403.0
2.7
0 50 100 150 200 250 300 350 400 450
Russia
China (unadjusted)
Thailand
China
USA
South Korea
Japan
Spain
Saudi Arabia
UK
Germany
Taiwan
Italy
France
UAE
Singapore
Hong Kong
Hong Kong (unadjusted)
12 mths to 11/2010
See footnote below for adjustmentsmade to China and Hong Kong
Note: Assuming 50% of exports to HK are re-exported to China. This is a meaningful adjustment for the purpose of achieving as conservative a result as possible, as Hong Kong is the largest importer of Swiss made watches in the world (imports are 3x larger than China). We also base our China per capita calculation on an urban population of 594m (not 1.3bn). The data is based on annual data, collected monthly. Source: CLSA Asia-Pacific Markets
Hong Kong (despite the adjustment), Singapore and the UAE significantly lead on a consumption per capita basis, reflecting the “trading hub” nature of these economies, the former two at a staggering US$180 and above. “Old
China’s consumption per capita is low, at only a
third of Europe or Taiwan
China should close much of the gap

Appendix Wealthy Asia
46 [email protected] 5 September 2011
world” economies such as France, Italy, Germany and the UK are between US$8.90 and US$17. With the exception of France, the consumption in these economies has been stable for the past five years. The major decline is seen in the US, unsurprisingly, now consuming US$5.0 per capita, compared to US$6.2 five years ago. On the flipside, China is accelerating. Its per-capita consumption of Swiss watches increased by 117% between 2005 and 2010. However, at US$4.0 currently, China still significantly lags more developed (and higher GDP) economies. We believe China should close much of the gap in Swiss watch consumption per capita over the medium to longer term.
China accounts for a 7% share of Swiss watch exports, up from 3% in 2005
0
1
2
3
4
5
6
7
8
9
2004 2005 2006 2007 2008 2009 2010
0
2,000
4,000
6,000
8,000
10,000
12,000
14,000
16,000China's share of Top 15 export destinations
Top 15 export value, CHFm (RHS)
(%)
Asia ex-Japan leading the recovery in Swiss watch exports (YoY growth, quarterly)
(60)
(40)
(20)
0
20
40
60
80
100
120
Jun 05 Apr 06 Mar 07 Feb 08 Jan 09 Dec 09 Oct 10
China Asia ex-J Europe USA(%)
Source: CLSA Asia-Pacific Markets, Federation of Swiss Watch Manufacturers (November 2010)
In terms of preferences, Chinese consumers like mechanical watches and also unique watches that require specific craftsmanship, such as enamel, mother-of-pearl engraving. Rolex is almost synonymous with luxury watches in China. When asked what brands come to mind when thinking about luxury watches, 48% of those surveyed in China said Rolex. That is far greater than the second brand Omega at 14%, followed by Vacheron, Cartier, and Longines.
China’s share of Swiss watch exports has
doubled in past five years
China was the quickest to recover from the
financial crisis
Rolex, Rolex, Rolex

Appendix Wealthy Asia
5 September 2011 [email protected] 47
Which luxury brand would you like to own?
Which luxury brands did you buy?
Watch
1
1
1
1
4
4
4
5
10
21
0 5 10 15 20 25
Rado
Swatch
Piaget
Tissot
Patek Philippe
Longines
Cartier
Vacheron
Omega
Rolex
(% of consumers)
Watch
1
1
1
2
2
3
3
5
6
7
9
0 2 4 6 8 10
Casio
Calvin Klein
Enigma
Citizen
Tudor
Cartier
Rado
Rolex
Longines
Tissot
Omega
(No. of mentions)
Source: China Reality Research
Executives from top luxury watch retailers told us that part of the reason Rolex is so popular is because Chinese consumers view it as almost hard cash given the liquid second-hand market. Its signature crown logo and easy to pronounce name have helped the brand gain recognition in the early days in China.
A lot of mainland customers also pay high regards to the Omega brand thanks to its association with the first moon landing. Trendy designs also help to attract younger customers. Longines is popular for its more affordable price points and it sells very well on the mainland.
The limited supply for some models generates much excitement among the wealthy and it serves as an effective way to display success and power. For example, the market price for the Rolex Daytona watch can reach HK$85,000-90,000, despite a list price at HK$75,000, due to limited supply. Getting one of these limited models is a way to show your influence and connections. “It is about face, not the money (the premium you are paying),” the executive said.
When it comes to picking watch retailers, Chinese consumers are looking for a good selection and a reputable store.
Long waitlist Apply to spend more than HK$1m on a watch We asked management at Emperor Watch & Jewellery, one of the world’s largest buyers at the annual industry fair Baselworld, where we can buy a Patek Philippe minute repeater, one of the hottest collections that is in limited supply. Demand is so strong and the collection is so rare that we learnt each interested buyer would have to file an application form listing his personal information and occupation. To be considered, chances are you would have to be a frequent shopper (ie, have bought more than 10 Patek Philippe watches). Being a professional with a number of certificates may help push your application to the top of the pile as well.
Patek Philippe minute repeater
Source: Company website
Limited editions are even more popular
Retailer reputation is also a key factor

Appendix Wealthy Asia
48 [email protected] 5 September 2011
How do you decide which watch retailer to purchase from?
0.0 0.5 1.0 1.5 2.0 2.5 3.0 3.5 4.0 4.5
Staff knowledge
Brand selections
Staff friendliness
After sales service
Store reputation/image
Model selection
5 is very important
Source: Hengdeli
Clothing Based on Bain’s estimate, the luxury apparel market in the mainland is worth Rmb9.8bn. The potential is huge given that wealthy consumers spend more on clothing as income rises. As consumers get wealthier in China, we expect to see more trading up.
Clothing and footwear spending as percentage of total expenditure
3.7
5.1
5.7
6.26.6
7.07.3
7.68.0
8.5
3
4
5
6
7
8
9
1 2 3 4 5 6 7 8 9 10
(%)
(income by decile)
Source: Euromonitor, CLSA Asia-Pacific Markets
Menswear is the key component of this market segment. As the luxury market booms, leaders in luxury menswear are aggressively expanding. Trinity, which manages Altea, Cerruti 1881, D'urban, Gieves & Hawkes, Intermezzo and Kent & Curmen, said in April 2010 that it would add 50 or more stores in smaller Chinese cities to its 272-store network on the mainland. Evergreen, which owns V.E. DELURE and TESTANTIN and which went public recently, planned to add 63 new retail stores in China in 2010 and 172 in 2011 to bring total mainland store count to 491.
To accelerate expansion in China, global brands have come up with a variety of strategies. Hugo Boss started a joint venture with local fashion retailer Rainbow Group in July 2010 and planned to open as many as 20 stores in
Spend more on clothing as income rises
Menswear is a key component
Players trying different strategies
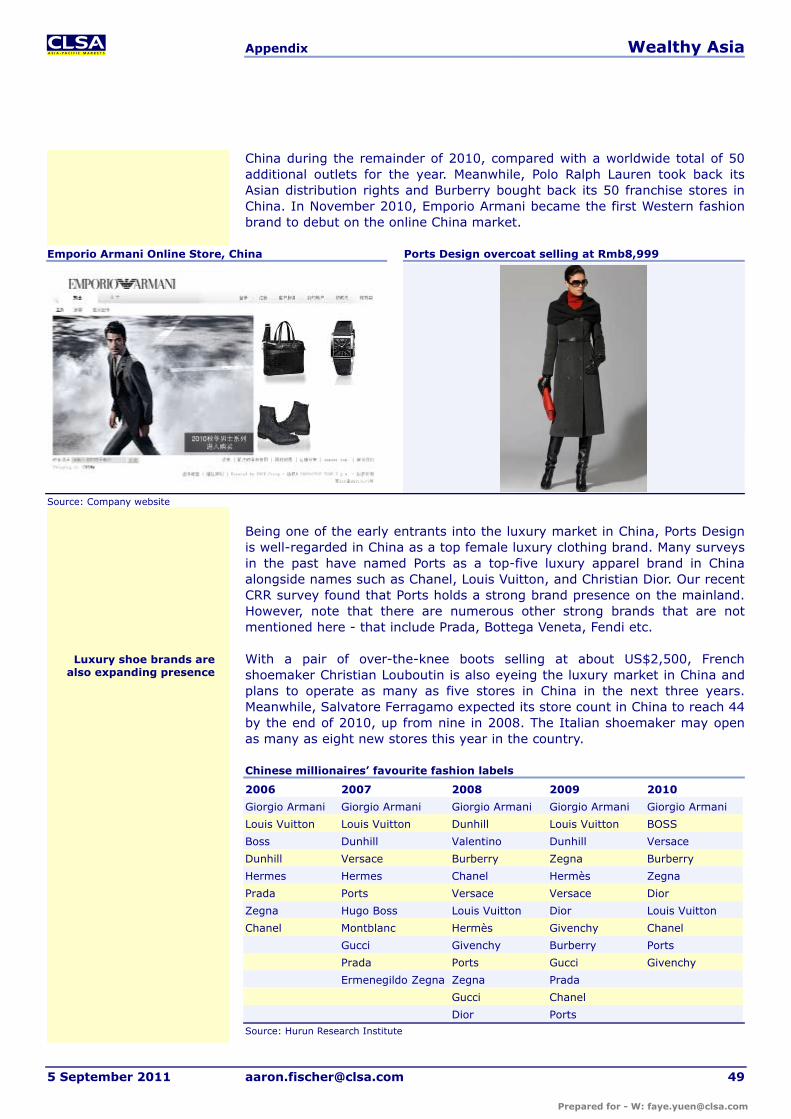
Appendix Wealthy Asia
5 September 2011 [email protected] 49
China during the remainder of 2010, compared with a worldwide total of 50 additional outlets for the year. Meanwhile, Polo Ralph Lauren took back its Asian distribution rights and Burberry bought back its 50 franchise stores in China. In November 2010, Emporio Armani became the first Western fashion brand to debut on the online China market.
Emporio Armani Online Store, China
Ports Design overcoat selling at Rmb8,999
Source: Company website
Being one of the early entrants into the luxury market in China, Ports Design is well-regarded in China as a top female luxury clothing brand. Many surveys in the past have named Ports as a top-five luxury apparel brand in China alongside names such as Chanel, Louis Vuitton, and Christian Dior. Our recent CRR survey found that Ports holds a strong brand presence on the mainland. However, note that there are numerous other strong brands that are not mentioned here - that include Prada, Bottega Veneta, Fendi etc.
With a pair of over-the-knee boots selling at about US$2,500, French shoemaker Christian Louboutin is also eyeing the luxury market in China and plans to operate as many as five stores in China in the next three years. Meanwhile, Salvatore Ferragamo expected its store count in China to reach 44 by the end of 2010, up from nine in 2008. The Italian shoemaker may open as many as eight new stores this year in the country.
Chinese millionaires’ favourite fashion labels
2006 2007 2008 2009 2010
Giorgio Armani Giorgio Armani Giorgio Armani Giorgio Armani Giorgio Armani
Louis Vuitton Louis Vuitton Dunhill Louis Vuitton BOSS
Boss Dunhill Valentino Dunhill Versace
Dunhill Versace Burberry Zegna Burberry
Hermes Hermes Chanel Hermès Zegna
Prada Ports Versace Versace Dior
Zegna Hugo Boss Louis Vuitton Dior Louis Vuitton
Chanel Montblanc Hermès Givenchy Chanel
Gucci Givenchy Burberry Ports
Prada Ports Gucci Givenchy
Ermenegildo Zegna Zegna Prada
Gucci Chanel
Dior Ports Source: Hurun Research Institute
Luxury shoe brands are also expanding presence

Appendix Wealthy Asia
50 [email protected] 5 September 2011
Menswear According to research firm Frost & Sullivan, retail sales of menswear in China increased at a 13.4% Cagr between 2006 and 2009 with sales reaching Rmb300bn (or US$44.2bn) in 2009. Frost & Sullivan expects sales to achieve a 15.8% Cagr over 2009-13.
Retail sales of menswear in China
205.7228.9
262.6
300.3
345.4
399.3
539.9
464.5
11.3
16.315.615.0
14.414.7 16.2
0
100
200
300
400
500
600
2006 2007 2008 2009 10F 11F 12F 13F
(Rmbbn)
0
2
4
6
8
10
12
14
16
18
20(%)Retail value Growth rate (RHS)
Source: Frost & Sullivan
We believe that the increase in disposable income, accelerated urbanisation, a demographic shift in the male population towards the young and middle-aged, rising brand awareness as well as improved product design and quality have and will continue to underpin industry growth.
More importantly, China menswear consumption per capita in urban areas is only about 25% of that in the USA and 20% of European countries.
Menswear consumption per capita in urban areas, 2008
Menswear consumption per capita, 2008
291
1,175
1,489
0
200
400
600
800
1,000
1,200
1,400
1,600
China USA Europeancountries
(US$)
US$15.4bn40.7%
US$10.3bn27.3%
US$5.4bn14.3%
US$6.7 bn17.7%
0
100
200
300
400
500
0 1 2 3 4 5
(US$) First-tier cities
Second-tier citiesThird-tier cities
Fourth-tier cities
US$240
US$378
US$318
US$77
PRC average
(US$bn)
Note: “European countries” refers to 15 countries within European Union as of 1 May 2004. Source: Frost & Sullivan
The consumption behaviour of male consumers in China differs significantly from that of their female counterparts. This results in substantially different operating metrics for menswear versus ladieswear.
We see strong growth in the menswear
market in China
Urbanisation and rising incomes are key drivers
Low menswear consumption per
capita in China
Menswear has different operating metrics from
ladieswear

Appendix Wealthy Asia
5 September 2011 [email protected] 51
Comparison of China’s menswear versus ladieswear markets
Menswear business Ladieswear business Brand loyalty High Low Consumers’ price sensitiveness Low High Product ASPs for similar market positioning High Relatively low Average ticket size per purchase High Relatively Low Stay-and-buy ratio High Low Consumers’ purchase frequency Low High Potential for ASP increase High Limited Purchase target More intentional purchases with clear
brand targets in most circumstances More impulse purchases with no clear brand targets in most circumstances
Purchase intention Less show-off factor More show-off factor Retail inventory risk Relatively low Relatively high Fashion risk Low High Product cycle Relatively long Short Market segmentation Relatively broad More defined Consumers’ product focus Product quality, fabrics and functionality Design, colour and trendiness Requirement for raw material procurement High Relatively low Requirements for accessories Low High Number of product SKUs Relatively low High Number of product collections Relatively low High Corporate sales More corporate sales Minimum corporate sales Source: CLSA Asia-Pacific Markets
Menswear brands should enjoy more resilient gross margins and more sustainable same-store sales (SSS) growth compared with ladieswear brands. According to Frost & Sullivan, the business formal (including business suits, shirts and trousers) and smart casual (including casual suits, shirts, jackets and trousers) market accounts for 60.6% of the overall menswear apparel market in China.
China’s menswear market by product, 2009
Accessories4.3%
Business formal and smart casual
60.6%
Fashion casual35.1%
Source: Frost & Sullivan
Within the business-formal and smart-casual menswear market, Frost & Sullivan expects the high-end segment (which is defined as a suit retailing for Rmb5,000-15,000) to enjoy slightly higher growth rates (ie, a 17.5% 2009-13F Cagr) than other segments.
High-end segment expected to outgrow
other segments
Menswear brands should enjoy more resilient gross
margins and SSS growth
Business and smart casual represent 61% of
total menswear market

Appendix Wealthy Asia
52 [email protected] 5 September 2011
Breakdown and growth of business-formal and smart-casual menswear segment
(Rmbbn) 2006 2007 2008 2009 10F 11F 12F 13F Cagr 06-09
Cagr 09-13F
Luxury-end 13 14 17 19 22 26 31 36
Growth (%) 12.6 15.4 15.8 16.2 17.1 17.7 17.3 14.7 17.1
High-end 9 10 11 13 15 18 21 25
Growth (%) 12.4 15.9 16.0 16.7 17.3 18.0 18.1 14.7 17.5
Mid-to-low-end 100 112 130 150 174 203 238 280
Growth (%) 12.4 15.8 15.4 16.2 16.7 17.4 17.3 14.6 16.9
Total 121 136 158 182 211 247 290 340
Growth (%) 12.5 15.7 15.5 16.2 16.7 17.5 17.3 14.6 17.0
Note: Market segmentation is defined by ASP of a suit: luxury=above Rmb15,000; high-end=Rmb5,000-15,000; low-end=below Rmb5,000. Source: Frost & Sullivan
It should be noted that China’s high-end business-formal and smart-casual menswear market is extremely fragmented, with the top-five brands commanding only a 22% market share (versus 45% for the sportswear sector). As such, we see huge potential for market consolidation in favour of companies with strong brand equity and well-established retail networks such as Evergreen. See our 8 December 2010 report Tailored for success.
Market share of top-five players in China consumer space, 2009
95
75
67
66
65
58
57
50
49
45
45
37
22
0 20 40 60 80 100
Carbonated drinks
Ready-to-drink (RTD) tea
Instant noodles
RTD coffee
Hair care
Beer
Milk
Bottled water
Down apparel
Sportswear
Bath and shower products
Fruit/vegetable juice
High-end business formal & casual menswear (%)
Note: Market share by retail sales value for carbonated drinks, RTD tea, instant noodles, hair care, RTD coffee, milk, bottled water, down apparel, fruit/vegetable juice, bath and shower products and bedding products; by total sales volume for beer, wine and spirits; by wholesale value for sportswear. Source: CLSA Asia-Pacific Markets (milk, down apparel and sportswear), Euromonitor (all others)
Only Satchi and VASTO have 5% or more of the high-end business-formal and smart-casual menswear market. However, Satchi has almost 2x as many stores in the mainland.
Highly fragmented high-end formal business and smart-casual menswear
Lowest concentration in high-end formal business
and smart-casual menswear segment

Appendix Wealthy Asia
5 September 2011 [email protected] 53
Market share in terms of retail sales, 1H10
China store networks, 1H10
VSKONNE2%
Auta Son2%Aquascutum
1%
Didiboy3%
Lampo3%
BONI3%
S.D. Spontini4%
V.E. DELURE4%
VASTO5%
Other brands67%
Satchi6%
332
201
180
178
170
168
131
100
100
82
0 50 100 150 200 250 300 350
Satchi
V.E. DELURE
BONI
DIDIBOY
VASTO
Lampo
Aquascutum
S.D. Spontini
VSKONNE
Auta Son (No. of outlets)
V.E. DELURE
Source: Frost & Sullivan
The degree of concentration in the high-end business-formal and smart-casual menswear market segment is substantially below that of the China sportswear market.
China high-end business-formal and smart-casual menswear vs sportswear, 2009
6
15
22
33
13
33
45
62
0
10
20
30
40
50
60
70
Top 1 Top 3 Top 5 Top 10
(%) High-end business formal & smart casual menswear
Sportswear
Source: Frost & Sullivan (menswear), CLSA Asia-Pacific Markets (sportswear)
Within the casual fashion menswear market, the middle-upper segment (ie, a jacket together with a pair of trousers retailing for Rmb2,000-5,000) is expected to enjoy a higher growth rate (ie, 16.5% 2009-13F Cagr) than other segments.
Breakdown and growth of casual fashion menswear segment
(Rmbbn) 2006 2007 2008 2009 2010F 2011F 2012F 2013F Cagr 06-09
Cagr 09-13F
High to luxury end 6 7 8 9 10 12 13 15
Growth (%) 11.1 14.3 12.5 14.4 13.6 14.5 14.9 12.5 14.3
Middle upper end 6 7 8 9 10 12 14 16
Growth (%) 12.1 15.6 15.2 15.8 16.2 17.0 16.9 14.3 16.5
Mid to low end 64 70 78 88 99 112 127 144
Growth (%) 9.1 12.4 12.0 12.7 13.0 13.8 13.7 11.2 13.3
Total 76 83 94 105 119 135 154 176
Growth (%) 9.6 12.7 12.3 13.1 13.4 14.1 14.1 11.5 13.7
Note: Market segmentation is defined by ASP of a jacket and a pair of trousers: High to luxury-end=Above Rmb5,000; Middle-upper end=Rmb2,000 to Rmb5,000; Mid to low-end=Below Rmb2,000. Source: Frost & Sullivan
Middle-upper segment outgrows others in casual
fashion menswear
Market concentration below that of China sportswear market
Market share

Appendix Wealthy Asia
54 [email protected] 5 September 2011
Handbags and briefcases According to Hurun’s Best of the Best survey, men’s luxury brands dominated the accessory segment in 2008, but the same survey in 2010 shows that there is a shift towards a more balanced list.
Chinese millionaires’ favourite accessory brands
2008 2010
Dior Hermès
Emporio Armani Armani
BOSS Chanel
Montblanc Louis Vuitton
Louis Vuitton Dior
Chanel Cartier
Bally Gucci
Dunhill na
Source: Hurun Research Institute
Louis Vuitton’s world-class craftsmanship
Dunhill’s leather collection
Source: Company website
As we mentioned before, girl power should be growing in China and we expect global premium luxury brands like Prada, Fendi and Tod’s to catch up very quickly. Burberry recently bought back 50 franchise stores in China to take control of its positioning in this key luxury market. Meanwhile, Coach recently made a number of senior appointments and expects its business in China to reach US$250m by FY12 and double by FY15.
Points of sale in China
0 50 100 150 200 250 300 350
LanvinChanel¹TiffanyPradaFendi
CelineGivenchy
VersaceBulgariHermes
Tod'sGucci
EscadaLouis Vuitton
CoachBurberry
Giorgio ArmaniCanali
Salvatore FerragamoErmenegildo Zegna
CerrutiHugo Boss
Alfred DunhillCartier
Ports
¹ Only fashion/accessories. Source: Company websites, CLSA Asia-Pacific Markets
Not as male-dominant
Mens’ brands have a wider store network

Appendix Wealthy Asia
5 September 2011 [email protected] 55
Luxury cars Dressed up in luxury clothing with a gold watch and a huge diamond ring, wealthy Chinese consumers are ready to hop into a vehicle to go out - a luxury car with a starting price of about Rmb850,000. Luxury car sales in China are on fire. The Big 3 in China have all recorded impressive growth rates this year, despite high mainland taxes. Sparkle Roll Group (970 HK), which operates Bentley, Rolls-Royce and Lamborghini showrooms in Beijing, estimates that for a car with an engine bigger than four litres, the combined import duties, value-added taxes and consumption taxes add up to more than 140%, compared with about 105% in Hong Kong and 60% in Macau.
Luxury car sales in China
Top brands 2010 YoY (%)
Volkswagen's Audi 227,938 43
BMW 168,998 87
Mercedes-Benz 147,670 115
Source: Company data
Mercedes-Benz is the fastest-growing major luxury brand
115
87
43
820,000
840,000
860,000
880,000
900,000
920,000
940,000
Audi BMW Mercedes-Benz
(Rmb)
0
20
40
60
80
100
120
140Starting price YoY growth (RHS)
A8L
7 Series
S-Class
(%)
Source: Company data, CLSA Asia-Pacific Markets
The Volkswagen China Group sold 1.92 million cars in 2010, up 37% YoY. Audi sold 227,938 cars in 2010, more than the 200,000 units previously forecasted and up 43% YoY. The company plans to sell another one million vehicles there within the next three years. Audi has sold more than one million vehicles in China to date, thanks to an early entry of its parent firm Volkswagen in the 1980s. Audi is also the biggest supplier of official cars in China.
However, BMW and Daimler’s Mercedes-Benz are quickly catching up as Chinese consumers’ appetite for luxury cars continues to grow. BMW’s sales in China almost doubled to September YTD and China is now the BMW Group’s third-largest market.
Meanwhile, Mercedes-Benz is the fastest-growing major luxury auto brand, with sales up 115% yoy in 2010 at 147,670 units, exceeding expectations of 120,000 units. Its parent Daimler expects China to become Mercedes-Benz’ largest market by 2014-16, aiming to sell 300,000 vehicles in China in 2015.
Not discouraged at all by the high taxes and duties
Audi is the largest supplier of official cars
BMW and Mercedes-Benz are catching up
More expensive cars enjoying higher growth

Appendix Wealthy Asia
56 [email protected] 5 September 2011
As mentioned before, high-end market leader Audi sold one million units in China to date. We estimate that about 20% of Audi sales in China were from the government. Taking this into account and the Hurun Research Institute’s study which says Chinese millionaires on average own three cars, we believe China’s luxury car market has huge potential.
The super-luxury segment, where executive limousines generally retail at Rmb3,000,000-9,000,000 after taxes, shows strong demand. Volkswagen’s Bentley, BMW’s Rolls-Royce and Daimler’s Maybach are the top choices for these ultra-wealthy individuals.
Bentley China chairman Peter Mak is amazed by the huge demand and rapid income growth on the mainland, since some of these buyers might not even have a car 15 years ago. Unlike buyers in the early days who would have bodyguards bringing in large travel bags filled with cash, buyers today usually pay a 10% deposit with a debit card and settle the balance with a bank transfer.
Super-luxury car sales in China
Top brands October YTD YoY (%)Bentley 569 71Rolls-Royce 156 438Source: SCMP
Our CRR survey shows strong brand preference for BMW and Mercedes-Benz, which we believe explains the impressive September YTD growth of 89% and 98% the carmakers enjoyed.
Which luxury car brands would you like to own?
13
12
10
8
6
6
4
3
2
2
0 2 4 6 8 10 12 14 16
Land Rover
Maybach
Hummer
Bentley
Audi
Porche
Rolls-Royce
Ferrari
Mercedes-Benz
BMW
(% of consumers)
Source: China Reality Research
Rich individuals from China also prefer longer cars that appear more extravagant and easier for those who would like to be chauffeured. This demand drove Audi to introduce an extended A6 sedan (13cm longer) in China back in 2000 and an extended A4 last year. BMW and Mercedes-Benz also introduced extended versions, adding 14cm to the BMW 5-Series and Mercedes E-Class sedans.
Volvo, which was purchased by China’s Geely Holding Group last year, plans to hire a team of Chinese designers to cater to local tastes. Rolls-Royce has also outfitted vehicles with options such as gold-plated Spirit of Ecstasy hood
Bentley, Rolls-Royce and Maybach are the top three
for super luxury
Chinese wealthy like longer cars
Gold-plated Spirit of Ecstasy
BMW is the winning brand

Appendix Wealthy Asia
5 September 2011 [email protected] 57
ornaments and starlight roofliners that depict astrological signs. Some customers choose red, which is considered to be the lucky colour, and many like to get vehicle identification numbers that contain lucky numbers, with the most popular being “8”. BMW has also offered a Chinese version of its M3 sports car called the Tiger M3, for the year of Tiger (2010), with each of the headrests embroidered with an orange tiger’s head.
Extended A6 exclusively for Chinese consumers
Rolls-Royce’s Spirit of Ecstasy
Source: Company website
Premium drinks Euromonitor estimates that the Chinese alcohol market is at 53 billion litres in 2010, compared with 30 billion litres in the US, and expects the overall alcohol market to enjoy a 7% Cagr to 70bn litres by 2014. Consumption of alcoholic drinks per capita (at legal drinking age) has increased by 64% in 2000-10 in China. Beer remains the preferred drink, with each person consuming 38.7 litres in 2009 while the total alcohol consumption per capita in China was 45 litres.
Chinese alcohol market size and growth
Consumption per capita (2009)
0
10,000
20,000
30,000
40,000
50,000
60,000
70,000
80,000
1998 2002 2006 2010 2014
0
2
4
6
8
10
12
14
16Alcoholic drinks
YoY growth (RHS)(%)(m litres)
3.6 2.7
38.7
05
1015202530354045
Beer Wine Spirits
(litres)
Source: Euromonitor, CLSA Asia-Pacific Markets
We expect whiskey to lead growth in the drinks segment at 17% annual growth, followed by grape wine at 12% in 2009-14. Sparkling wine is also expanding quickly, but so far China is still a relatively small market for champagne. Despite being the dominant alcohol in the market, beer has been growing only moderately at a 6% Cagr in the past 10 years and we expect this level of growth to continue.
Beer is the dominant alcohol, but the slow
growth segment
Whiskey and grape wine should lead growth at
double digits

Appendix Wealthy Asia
58 [email protected] 5 September 2011
Alcohol market growth 09-14CL
17
12
10
10
9
7
7
5
4
0 2 4 6 8 10 12 14 16 18
Brandy and Cognac
Non-grape wine
Average
Beer
Rum
White Spirits
Sparkling wine
Grape wine
Whiskey
(%)
Source: Euromonitor, CLSA Asia-Pacific Markets
Champagne market breakdown
Other emerging markets
5%
Other mature markets
4%
Mainland China0%
Japan2%
US6%
EU1583%
Source: Cheuvreux
Chinese alcohol consumption is still relatively low compared with the rest of the world and therefore we expect much potential in the drinks segment. As expected, Chinese wine consumption per capita ranks much lower than European counterparts, and spirit consumption per capita much lower than Japanese and Koreans who are big fans of shochu/soju (a very popular distilled beverage in the region).
Beer consumption per capita (2009)
0 20 40 60 80 100 120 140
SingaporeTaiwan
ItalyFranceChina
South KoreaJapan
CanadaUnited Kingdom
USAGermany
Source: Euromonitor, CLSA Asia-Pacific Markets
Chinese alcohol consumption still low
Still a moderate drinker
About 50% of the EU15’s share is from France

Appendix Wealthy Asia
5 September 2011 [email protected] 59
Wine consumption per capita (2009)
Spirits consumption per capita (2009)
0 10 20 30 40 50 60
SingaporeChina
TaiwanJapan
South KoreaUSA
CanadaUnited Kingdom
GermanyFrance
Italy
(litres)
0 10 20 30 40
SingaporeTaiwan
ItalyChina
CanadaUnited Kingdom
GermanyUSA
FranceJapan
South Korea
(litres)
Source: Euromonitor, CLSA Asia-Pacific Markets
In terms of channels, restaurants are more important in southern China and bars in the north. Because of the cold weather in the north, Chinese consumers there in general prefer stronger alcohol.
As income rises, we expect consumers to trade up to premium alcohol and this should drive growth in the prestige local spirits and the more expensive wine and spirit segments in general. Also, as economic activities continue to grow in the mainland, local spirits popular among businessmen and government officials should see strong growth. Gifting accounts for about 65% of the market, according to an executive from a premium alcohol company.
We believe this is also a segment where local brands can potentially develop into premium players. According to the executive, China is already in the top 10 globally in terms of wineries and plantation.
Wine consumption and income per capita (2010)
(20)
(10)
0
10
20
30
40
50
60
70
0 20,000 40,000 60,000 80,000 100,000 120,000
Wine consumption (litre per capita)
(US$ per capita)
Correlation = 0.69
Luxembourg
Norway
SwitzerlandDenmarkAustria
FranceItaly
Portugal
Greece
SpainUK
Germany Belgium
Netherlands
Belgium Ireland
USA
FinlandCanada
Japan
SingaporeHong Kong
Sourth Korea
Taiwan
Russia
TurkeyMalaysiaPhils
China
Source: CLSA Asia-Pacific Markets
More trading up
Wine consumption should rise as income grows
Just the beginning

Appendix Wealthy Asia
60 [email protected] 5 September 2011
Average retail selling price in China
2009 Rmb per litre Taobao Beer 7 Non-grape wine 40 Grape wine 57 Premium local spirits 295
Kweichow Moutai 500ml Rmb115 (US$17)
Rum 402
Bacardi black rum 750ml Rmb97 (US$15)
White Spirits 405
Grey Goose 700ml Rmb370 (US$56)
Brandy and Cognac 464
Hennessy VSOP 750ml Rmb293 (US$44)
Sparkling wine 538
Moet & Chandon NV 750ml Rmb340 (US$52)
Whiskey 727
Chivas Regal 700ml 18 years old Rmb425 (US$64)
Source: Euromonitor, Taobao.com, CLSA Asia-Pacific Markets
Premium local spirits Unlike other luxury segments, premium local spirits brands have a significant presence in China, accounting for 6% of the total spirits market in China. Brands like Jian Nan Chun, Moutai and Wu Liang Ye are very popular nationwide. Together these three brands account for more than 27% of the premium local spirits segment. Average unit price in this segment is almost Rmb300 per litre, with the ultra premium ones priced much higher than top whiskey.
Moutai (500ml) gift set selling at Rmb1,588 on Taobao
500ml of Wu Liang Ye’s 68% selling at Rmb888
Source: Company website, Taobao.com
Source: Taobao.com
Premium local spirits are popular
Many premium options

Appendix Wealthy Asia
5 September 2011 [email protected] 61
Premium local spirits market in China
50
70
90
110
130
150
170
190
210
230
250
2001 2002 2003 2004 2005 2006 2007 2008 2009(8)
(6)
(4)
(2)
0
2
4
6
8
10Volume YoY (RHS) (%)(m litres)
Source: Euromonitor, CLSA Asia-Pacific Markets
Imports and global players While beer consumed in China is mostly produced locally with only 28 million litres imported out of the 40.7 billion litres consumed in 2008, imported wine and spirits are common. About 6% of wine and 1.4% of spirits was imported from overseas in 2008. The import share of wine has been growing rapidly. In total, 18% of the wine and 31% of the spirits imported came from France.
Imports as a percentage of total volume
0
1
2
3
4
5
6
7
2000 2001 2002 2003 2004 2005 2006 2007 2008
Wine Spirits(%)
Wine imports in volume (2008)
Spirits imports in volume (2008)
Spain9%
Australia9%
France18%
Chile32%
Argentina16%
Italy6%
Others5%
United States
5%
United Kingdom
33%
Spain10%
France31%
Others9% Japan
2%
Sweden2%
United States
3%
Korea10%
Source: Euromonitor, CLSA Asia-Pacific Markets
Alcohol imports growing
Steadily growing
France has a large share

Appendix Wealthy Asia
62 [email protected] 5 September 2011
These fast-expanding segments together with their growing imports component are driving up sales at global producers. Pernod-Ricard reported 1Q (ended September 2010) sales growth that beat consensus estimates. The company recorded more than 30% YoY growth in China on the back of wholesalers’ restocking on Martell. Its Chivas Regal holds a dominant 33% brand share in the whiskey segment. Absolut is the leader in white spirits and Martell is No.3 among brandy and cognac brands in China.
Diageo is also upbeat about China’s market outlook and sees consumers trading up in general. Its Johnnie Walker brand holds 23% share in the whiskey segment while the Smirnoff brand has 22.5% of the white spirits share in China.
Barcardi & Co’s Barcardi rum significantly dominates this segment with a whopping 72% share.
The surging whiskey demand in China inspired the Royal Salute Whisky group to launch the 62 Gun Salute in the Chinese market. The company said the whiskey tastes rich and complex and it is exactly what Chinese consumers like. Bottled in a hand-crafted decanter made by Dartington Crystal, the whiskey features a Royal Salute crest painted in liquid 24-carat gold, along with a 24-carat gold-plated collar and a crystal stopper set with a 24-carat gold-plated crown. Each bottle sells for Rmb18,000.
Meanwhile, to endear itself to Chinese consumers, Château Lafite-Rothschild also decided to feature an embossed red character for the lucky “eight” on every bottle of its 2008 vintage. According to the online fine-wine exchange LivEx, the price of a case of 2008 Lafite jumped 17% in just 48 hours after the announcement. Similarly, Château Mouton Rothschild also features art work by famous Chinese artists while vodka brand Absolut puts Chinese literary figures on its labels to attract Chinese consumers.
62 Gun Salute at Rmb18,000
Chateau Lafite Rothschild 2008
Source: Company
LVMH has a very strong market presence in the sparkling-wine segment with its Moët & Chandon brand. Its market share is tied with Yantai Changyu Group’s Changyu brand at 19% as the top two players in sparkling wine. Seeing such a strong presence that premium local spirits have in China, LVMH has also started building an Asian luxury spirits brand, Wenjun. The pricing is very much in line with top players Moutai and Wu Liang Ye.
Pernod-Ricard holds a number of high-
ranking brands
Catering to locals
Prices jumped 17% with an embossed red eight
LVMH setting up luxury white spirits brand

Appendix Wealthy Asia
5 September 2011 [email protected] 63
Wenjun by LVMH at Rmb600
Special collection at Rmb1,600
Source: Company website, Taobao.com
Figure 40
Top alcoholic drinks brands in China
Brand Company Share (%)Premium local spirits Jian Nan Chun Sichuan Jian Nan Chun (Group) 10.6Moutai Kweichow Moutai 9.9Wu Liang Ye Sichuan Yibin Wuliangye Distillery 6.9Luzhou Lao Jiao Luzhou Lao Jiao 2.5Xiao Hu Tu Xian Guangzhou Pearl River Yunfeng Winery 1.9Grape wine Great Wall China National Cereals, Oils & Foodstuffs Imp & Exp 10.6Changyu Yantai Changyu Group 8.8Weilong Yantai Weilong Grape Wine 4.6Dynasty Dynasty Winery 4.0Suntime Vinisuntime International 3.3Sparkling wine Changyu Yantai Changyu Group 18.9Moët & Chandon LVMH Moët Hennessy Louis Vuitton 18.9Dynasty Dynasty Winery 8.6Piper Heidsieck Rémy Cointreau Group 8.1Weilong Yantai Weilong Grape Wine 7.0Whiskey Chivas Regal Pernod-Ricard Groupe 33.1Johnnie Walker Diageo 23.1Jack Daniel's Brown-Forman Corp 6.1Jim Beam Fortune Brands 3.3Ballantine's Pernod Ricard Groupe 2.0Brandy/Cognac Changyu Yantai Changyu Group 57.1Hennessy LVMH Moët Hennessy Louis Vuitton 14.1Martell Pernod-Ricard Groupe 7.5Rémy Martin Rémy Cointreau Group 6.1Courvoisier Fortune Brands 1.0White Spirits Absolut Pernod-Ricard Groupe 28.1Smirnoff Diageo 22.5Gordon's Diageo 10.6Eristoff Bacardi & Co 5.4Skyy Campari Milano SpA, Davide 4.4Rum Bacardi Bacardi & Co 72.4Havana Club Pernod-Ricard Groupe 6.4Captain Morgan Diageo 3.8
Source: Euromonitor
LVMH’s Asian luxury spirits

Appendix Wealthy Asia
64 [email protected] 5 September 2011
Chinese millionaires’ favourite drinks
2008 2009 2010 Best Luxury Imported Drinks Brand
Royal Salute Royal Salute Louis XIII
Hennessy Hennessy Hennessy
Johnnie Walker Louis XIII Royal Salute Rémy Martin Rémy Martin Ballantine
Chivas Chivas Rémy Martin
Best Super Luxury Whiskey
Royal Salute 21 Years Old Royal Salute 21 Years Old Royal Salute 21 Years OldJohnnie Walker Blue Label Johnnie Walker Blue Label Johnnie Walker Blue Label
Macallan 40 Years Old Ballantine's 30 Years Old
Ballantine's 30 Years Old Royal Salute 38 Years Old
Macallan 40 Years Old Best Ultra Luxury Cognac
Louis XIII Louis XIII Louis XIII
L'Age d'Or de Rémy Martin Richard Hennessy Richard Hennessy
Richard Hennessy Best Premium Cognac
Hennessy XO Hennessy XO Hennessy X.O
Martell XO Rémy Martin XO Martell Cordon Bleu
Rémy Martin XO Martell XO Rémy Martin X.O Best Chinese Spirits
Moutai Moutai Moutai
Wuliangye Wuliangye Wuliangye
Luzhou Laojiao Luzhou Laojiao Luzhou Laojiao Best Premium Champagne
Veuve Clicquot La Grande Dame Veuve Clicquot La Grande Dame Moět & Chandon
Dom Pérignon Moět & Chandon Brut Imperial Vintage Dom Pérignon
Moět & Chandon Brut Imperial Vintage Dom Pérignon Veuve Clicquot Piper- Heidsieck Brut Cuvée Rare Piper-Heidsieck Brut Cuvée Rare
Source: Hurun Research Institute
Prestige cosmetics We believe China will have the fastest-growing premium cosmetics market in the world over the next four years - we expect a 14% Cagr compared with the global average of 5%. Slowing/declining growth in the cosmetics market in Western economies will largely be offset by expansion in emerging markets, particularly Russia, India, China of what we estimate will be 14-17% per annum. The USA and Japan remain the largest premium cosmetics markets in the world, and sales in these countries are expected to remain flat/slightly decline in 2010-14. We estimate that the Chinese premium cosmetics market will grow from US$3.5bn to US$6bn in 14CL.
Cosmetics and toiletries market 2009-14 Cagr
(5) 0 5 10 15 20
JapanUSA
FranceItaly
United KingdomSpain
CanadaWorldBrazilChinaIndia
Russia
(%)
Source: Euromonitor, CLSA Asia-Pacific markets
Rising demand from emerging economies
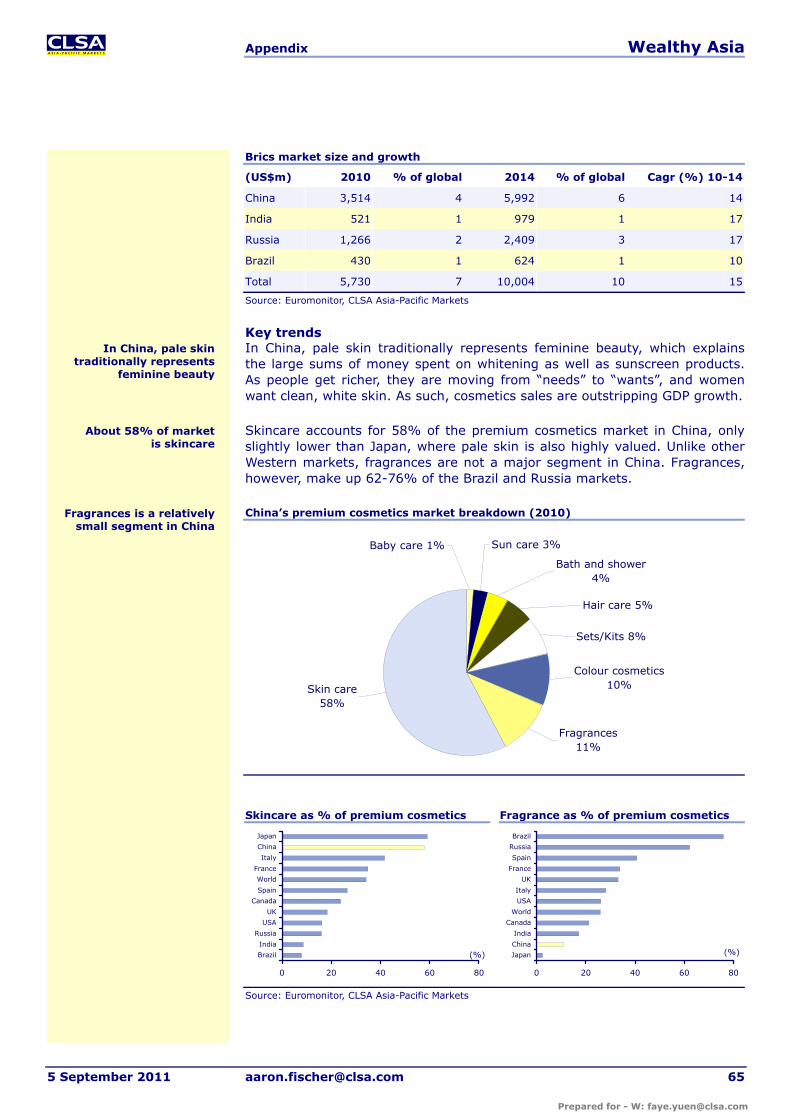
Appendix Wealthy Asia
5 September 2011 [email protected] 65
Brics market size and growth
(US$m) 2010 % of global 2014 % of global Cagr (%) 10-14
China 3,514 4 5,992 6 14
India 521 1 979 1 17
Russia 1,266 2 2,409 3 17
Brazil 430 1 624 1 10
Total 5,730 7 10,004 10 15
Source: Euromonitor, CLSA Asia-Pacific Markets
Key trends In China, pale skin traditionally represents feminine beauty, which explains the large sums of money spent on whitening as well as sunscreen products. As people get richer, they are moving from “needs” to “wants”, and women want clean, white skin. As such, cosmetics sales are outstripping GDP growth.
Skincare accounts for 58% of the premium cosmetics market in China, only slightly lower than Japan, where pale skin is also highly valued. Unlike other Western markets, fragrances are not a major segment in China. Fragrances, however, make up 62-76% of the Brazil and Russia markets.
China’s premium cosmetics market breakdown (2010)
Skin care58%
Sun care 3%
Bath and shower 4%
Hair care 5%
Sets/Kits 8%
Colour cosmetics 10%
Fragrances11%
Baby care 1%
Skincare as % of premium cosmetics
Fragrance as % of premium cosmetics
0 20 40 60 80
Brazil
India
Russia
USA
UK
Canada
Spain
World
France
Italy
China
Japan
(%)
0 20 40 60 80
Japan
China
India
Canada
World
USA
Italy
UK
France
Spain
Russia
Brazil
(%)
Source: Euromonitor, CLSA Asia-Pacific Markets
In China, pale skin traditionally represents
feminine beauty
About 58% of market is skincare
Fragrances is a relatively small segment in China

Appendix Wealthy Asia
66 [email protected] 5 September 2011
China’s premium cosmetics market enjoyed a strong 24% Cagr over 2000-10, especially in premium skincare, as consumers’ discretionary income rises. But it remains highly fragmented and the lack of premium local Chinese brands creates a tremendous opportunity for foreign companies. China’s premium skincare market is valued at US$2bn, still a fraction of Japan’s US$9bn market but growing very rapidly.
China premium cosmetics segment growth rates (10-14CL)
0 5 10 15 20
Bath and shower
Hair care
Fragrances
Skin care
Sets/Kits
Sun care
Baby care
Colour cosmetics
(%)
Source: Euromonitor, CLSA Asia-Pacific Markets
Foreign brands are doing well in cosmetics. For example, our US analyst Caroline Levy projects that China would grow to 10% of total Ebit for Estée Lauder by 2020 from 4.5% today. This translates to US$1.6bn of sales and US$273m of Ebit. As we should expect in this fast-growing market, investment levels are high, channels are segmenting, brands are innovating, and distribution is evolving fast. Geographical differences play a role: for example, the drier northern region has a stronger bias towards moisturising products.
Global cosmetics giant Amway Corp holds a dominant share in China with its direct selling and retailing strategy in the country. However, in terms of brand recognition, ultra-premium brands Chanel, Dior, Shiseido, L’Oreal, and Hugo Boss are still the top five that mainland millionaires like. Although domestic firms, like Shanghai Jahwa, are trying to break into the premium segment, their success so far is still primarily coming from the mid-market.
Premium cosmetics brand shares in China
Brand (%) Company 2005 2006 2007 2008 2009Amway Amway Corp 28.9 23.8 22.7 24.9 23.0Shiseido Shiseido 2.9 4.1 4.4 5.1 7.3Lancôme L'Oréal 4.5 5.4 5.5 6.0 6.9Estée Lauder Estée Lauder 2.9 3.8 4.4 4.7 5.0Fancl Fancl Corp 0.3 1.0 2.0 2.9 3.3Clinique Estée Lauder 1.8 2.2 2.3 2.4 2.5Kosé Kosé Corp 2.3 2.6 2.4 2.3 2.3Chanel Chanel SA 1.3 1.7 2.0 2.1 2.2Christian Dior LVMH Moët Hennessy Louis Vuitton 1.6 1.8 1.9 2.0 2.0Biotherm L'Oréal 1.3 1.5 1.6 1.6 1.7Guerlain LVMH Moët Hennessy Louis Vuitton 1.0 1.1 1.3 1.4 1.5SK-II Procter & Gamble 4.2 2.2 1.4 1.1 0.9Others Others 47.1 48.9 48.3 43.6 41.4Total Total 100.0 100.0 100.0 100.0 100.0
Source: Euromonitor
US$2bn premium skincare market
Still a foreign brands’ market

Appendix Wealthy Asia
5 September 2011 [email protected] 67
Chinese millionaires’ favourite skincare brands
2008 2009 2010
Shiseido Shiseido Chanel
HUGO BOSS Lancome Dior
Lancôme HUGO BOSS Shiseido
Biotherm Chanel L' Oréal
Chanel Biotherm HUGO BOSS
Shu Uemura L' Oréal La Mer
La Mer Shu Uemura
L' Oréal La Mer
Source: Hurun Research Institute
Our proprietary survey’s results also confirm that global foreign brands dominate the prestigious cosmetics market in the mainland.
Which luxury brands would you like to own?
Which luxury brands did you buy?
Skincare & Cosmetics15
8
6
5
5
1
1
1
1
1
0 5 10 15 20
Marubi
VICHY
Clinique
Olay
L'Oreal
Dior
Shiseido
Chanel
Lancome
Estee Lauder
(% of consumers)
Skincare & Cosmetics
2
2
2
3
3
4
4
6
11
14
0 5 10 15
Biotherm
Nivea
Sisley
L'Oreal
Olay
Clinique
Dior
Lancome
Shiseido
Estee Lauder
(No. of mentions)
Perfume
16
15
7
3
2
1
1
1
0
0
0 5 10 15 20
Hermes
Davidoff
Prairie
AnnaSui
Guerlain
Calvin Klein
Lancome
Dior
Chanel
Estee Lauder
(% of consumers)
Perfume
1
1
1
2
2
2
2
4
4
12
0 5 10 15
Hermes
Kenzo
Issey Miyake
Adidas
Burberry
Calvin Klein
Estee Lauder
Dior
Lancome
Chanel
(No. of mentions)
Source: CLSA Asia-Pacific Markets
Cosmetics are characterised by high brand loyalty, as our recent China Brands Index report confirms.
Another trend in the cosmetics space in China is the rapid growth of the men’s grooming market. Euromonitor expects the market Cagr for male-grooming products in 2010-14 to be more than double that of the overall beauty and personal care market at 22%, compared with 10%. Unilever and L’Oreal have both invested heavily in this segment in the past four years and built a 32% and 11% market share in men’s toiletries. As the men’s market continues to develop, we expect high-end brands to tap into this fast-growing segment as well.
Foreign brands well-recognised
Men’s grooming market may be the next luxury segment
Everyone likes foreign names

Appendix Wealthy Asia
68 [email protected] 5 September 2011
Brand loyalty across sectors
0 20 40 60 80 100
Mobile service
Supermarket
Cosmetics
Insurance
Dept store
Skin care
Camera
Aircon
Wine
Washing machine
Online travel
PC
Instant messaging
Instant noodles
Juice
Refrigerator
Dairy
Mobile handset
Tea beverages
Shampoo
CSD drinks
Beer
Bottled water
TV
Car
Banking
Search engine
Sportswear
Shoes (non-sports)
Clothing (non-sports)(%)
Source: CLSA Asia-Pacific Markets
Men’s grooming market growth vs overall beauty and personal-care market
9101011109
1214
1820
2426
2727
38
22
0
5
10
15
20
25
30
35
40
45
2007 2008 2009 2010 2011 2012 2013 2014
(%) Men's grooming market
Beauty and personal care market
Source: Euromonitor, CLSA Asia-Pacific Markets
Our China Brands Index shows high loyalty for
cosmetics and skincare
Growing at double-digits

Appendix Wealthy Asia
5 September 2011 [email protected] 69
Luxury services As the Chinese saying goes, daily life is all about clothes, food, accommodation and travel. Luxury goods, therefore, are only part of the equation. Chinese affluent are also willing to pay to get the best out of other elements of life, including eating, sleeping, and even match-making.
Restaurants Mainland Chinese enjoy high-end services, ranging from gourmet restaurants to match-making services. In Hong Kong, overnight visitors from China spent HK$561 per capita on meals outside hotel, or 8% of their total spending in Hong Kong. However, affluent mainland tourists are spending much more than this average during their trips to Hong Kong.
Miramar group in Hong Kong said they often see travellers walk in to their upmarket Cantonese restaurant with their shopping bags and walk out with a HK$100,000 bill for dinner. A classic lunch party would be a table of 10 mainland travellers washing down a menu of abalone and shark’s fin soup with half a dozen bottles of Chateau Lafite Rothschild. The restaurant’s dinner sets range from HK$8,880-13,880.
With strong brand recognition, Miramar is planning to expand into China. It is aiming to open 20 restaurants by 2017 at a total cost of HK$400m. The company estimates that in Beijing, where its first outlet will open by mid-2011, wealthy Chinese would spend about Rmb1,200 per head. It aims to recover the HK$30m investment cost in two years.
The imperial four In China, the four most prestigious food ingredients are abalone, sea cucumber, shark’s fin, and fish maw. These items are believed to be imperial food ingredients only served at the emperor’s table. Time has changed, however, and the affluent individuals in the mainland
now frequently visit luxury restaurants and order these items for dining along with other delicacies such as bird’s nest, snake soup and hairy crabs. In recent years, Western favourites such as lobsters and truffle are also appearing more often on Chinese menus.
Sample full dinner menus
Chinese French
Roasted whole crispy suckling pig Fresh and smoked salmon tartare
Stir-fried prawns braised with crab roe sauce Chestnut soup with praline cream and chicken mousse dumpling
Braised seasonal green with bamboo fungus and Yunnan ham Seared sea bass with steamed zucchini, tomato, basil and truffle
Braised whole conpoy stuffed in turnip ring Duck breast fillet with caramelized autumn fruit and fig reduction
Braised superior shark’s fin with Chinese cabbage in brown sauce Dessert
Steamed fresh spotted garoupa Coffee or tea
Braised abalone and sea cucumber with premium oyster cause
Deep-fried crispy chicken with osmanthus sauce
Fried rice with dried conpoy, dried fish and roasted duck
Braised e-fu noodles with wild mushrooms
Double-boiled sweetened lotus seed with red dates and dried longans
Chinese petits four
Source: Cuisine Cuisine, Le Jardin de Joel Robuchon
Abalone and shark’s fin soup
Rmb1,200 per head

Appendix Wealthy Asia
70 [email protected] 5 September 2011
Shark’s fin and imperial bird’s nest (HK$720 per bowl)
Braised assorted snake soup (HK$880 per bowl)
Source: Company website
With more than 50 outlets nationwide, mainland restaurant chain South Beauty Group has also introduced the Lan Club in Beijing and Shanghai to target affluent individuals in the mainland. Bringing in world-class professionals who have designed New York’s Buddakan and the W Hotel Pudong in Shanghai, South Beauty Group feels that the Chinese elite demands sophistication and taste in their dining experience. Meanwhile, one of the world’s most famous chefs Jean-Georges Vongerichten also opened a restaurant in Shanghai featuring appetizers starting from Rmb118-198 and dinner entrees from Rmb248-348.
Hotels Chinese affluent like to maintain their luxurious lifestyle when they are on the road. According to Hurun’s Best of the Best survey, Shangri-La is the top hotel brand among Chinese millionaires. Grand Hyatt, Hyatt Regency and Hilton have also consistently been ranked among the top five.
Chinese millionaires’ favourite hotels
2006 2007 2008 2009 2010
Shangri-La Shangri-La Shangri-La Shangri-La Shangri-La
Grand Hyatt Grand Hyatt Hyatt Regency Grand Hyatt Grand Hyatt
Hyatt Regency Hyatt Regency Grand Hyatt Hyatt Regency Hilton
Hilton Hilton Kempinski Hilton Sheraton
Sheraton Sheraton Sheraton Kempinski Hyatt Regency
JW Marriott Marriott
Kempinski Kempinski
Source: Hurun Research Institute
High-end hotel chains have ramped up their expansion plans in China to capture opportunities in this luxury segment. Starwood expects to add 86 hotels to its current network of 62 in China.
Meanwhile, InterContinental aims to double its number of rooms in the Greater China region in the next five years. The company expects China to overtake the US as the world’s largest hotel market by 2025 and become twice the size of the current US market by 2039.
Shangri-La is the top brand
High-end dining taking off in the mainland

Appendix Wealthy Asia
5 September 2011 [email protected] 71
Hotel growth rate in mainland China (number of hotels)
(40)
(30)
(20)
(10)
0
10
20
30
40
50
60
1995 1997 1999 2001 2003 2005 2007 2009
Total hotels 5-star hotels(%)
Source: CEIC, CLSA Asia-Pacific Markets
Some luxury hotels in Shanghai are already at a price range comparable with those in financial hubs such as New York and London.
Luxury hotel price comparison
0 100 200 300 400 500 600 700
Intercontinental Beijing Beichen Hotel
St. Regis Shanghai
Westin, Bund Center Shanghai
The Westin Beijing Chaoyang
The Peninsula Beijing
Hilton New York
Grand Hyatt Shenzhen
Sheraton Shenzhen Futian Hotel
Grand Hyatt Shanghai
Grand Hyatt Beijing
Shangri-La China World Hotel, Beijing
JW Marriott Hotel Beijing
Four Seasons London Canary Wharf
Four Seasons Shanghai
Pudong Shangri-La Shanghai
Trump Soho New York
The New York Palace
The Ritz-Carlton Shanghai, Pudong
The Peninsula Shanghai
Mandarin Oriental Hyde Park, London
The Ritz London
Ritz-Carlton New York, Central Park
(US$)
Source: Expedia, CLSA Asia-Pacific Markets
Not only are these hotel chains aggressively building up in major cities, they are also targeting popular tourist spots in China. In November 2010, St. Regis opened the first international luxury hotels in Lhasa, the capital of Tibet. Shangri-La Asia is also targeting to develop one there in 2012 and InterContinental is planning a 2,000-room hotel within three years.
Luxury five-star hotels booming
Hotel prices catching up with global peers . . .
. . . primarily in Tier-1 cities

Appendix Wealthy Asia
72 [email protected] 5 September 2011
Match-making The rapid rise of these Chinese affluent has created a new challenge for themselves and a business opportunity for some. The Chinese Academy of Social Sciences forecasts that by 2020, 24 million Chinese men of marrying age could see a shortage of brides, partly because of the one-child policy.
Mainland population aged 18-34
145
150
155
160
165
170
2009 2010 2011 2012 2013 2014 2015 2016 2017 2018 2019 2020
Male aged 18-34 Female aged 18-34(m)
Source: Euromonitor, CLSA Asia-Pacific Markets
Coupled with this macro trend, wealthy Chinese are moving into circles that make it hard for them to find partners, said the founder of a match-making company in China, Diamond Bachelor. Diamond Bachelor, which claims that it has five million clients and a success rate, defined as clients falling in love with their recommendations, of at least 80%, sends “love hunters” out to restaurants and malls to scour for the right women. The company then categorises women based on age, education, height, and looks. According to its website (915915.com, which is a homonym for “just want me, just want me”), the company’s definition for a “diamond bachelor” is an individual with net worth of more than Rmb2m or with “extremely outstanding” profiles.
In 2009, a group of 21 single billionaires and 22 single women attended a match-making ball in Beijing with tickets costing Rmb100,000 a head. In June 2010, jiayuan.com, a large online-dating agency, even held a competition to find the perfect match for 18 of its millionaire members. It was reported that the competition drew 50,000 Chinese applicants including girls from Vancouver, Singapore, New York and Paris.
Diamond Bachelor website featuring its “love hunters”
Source: 915915.com.cn
Rmb100,000 for a match-making ball ticket
VIP match-making service
Hard time finding a bride
Claiming an 80% success rate

Important notices
© 2011 CLSA Asia-Pacific Markets ("CLSA").
This publication/communication is subject to and incorporates the terms and conditions of use set out on the www.clsa.com website. Neither the publication/ communication nor any portion hereof may be reprinted, sold or redistributed without the written consent of CLSA. CLSA has produced this publication/communication for private circulation to professional, institutional and/or wholesale clients only. The information, opinions and estimates herein are not directed at, or intended for distribution to or use by, any person or entity in any jurisdiction where doing so would be contrary to law or regulation or which would subject CLSA to any additional registration or licensing requirement within such jurisdiction. The information and statistical data herein have been obtained from sources we believe to be reliable. Such information has not been independently verified and we make no representation or warranty as to its accuracy, completeness or correctness. Any opinions or estimates herein reflect the judgment of CLSA at the date of this publication/ communication and are subject to change at any time without notice. Where any part of the information, opinions or estimates contained herein reflects the views and opinions of a sales person or a non-analyst, such views and opinions may not correspond to the published view of the CLSA research group. This is not a solicitation or any offer to buy or sell. This publication/ communication is for information purposes only and does not constitute any recommendation, representation, warranty or guarantee of performance. Any price target given in the report may be projected from 1 or more valuation models and hence any price target may be subject to the inherent risk of the selected model as well as other external risk factors. This is not intended to provide professional, investment or any other type of advice or recommendation and does not take into account the particular investment objectives, financial situation or needs of individual recipients. Before acting on any information in this publication/ communication, you should consider whether it is suitable for your particular circumstances and, if appropriate, seek professional advice, including tax advice. CLSA does not accept any responsibility and cannot be held liable for any person’s use of or reliance on the information and opinions contained herein. To the extent permitted by applicable securities laws and regulations, CLSA accepts no liability whatsoever for any direct or consequential loss arising from the use of this publication/communication or its contents. Where the publication does not contain rating, the material should not be construed as research but is offered as factual commentary. It is not intended to, nor should it be used to form an investment opinion about the not rated companies. The analyst/s who compiled this publication/communication hereby state/s and confirm/s that the contents hereof truly reflect his/her/their views and opinions on the subject matter and that the analyst/s has/have not been placed under any undue influence, intervention or pressure by any person/s in compiling such publication/ communication. Subject to any applicable laws and regulations at any given time CLSA, its affiliates or companies or individuals connected with CLSA may have used the information contained herein before publication and may have positions in, may from time to time purchase or sell or have a material interest in any of the securities mentioned or related securities or may currently or in future have or have had a business or financial relationship with, or may provide or have provided investment banking, capital markets and/or other services to, the entities referred to herein, their advisors and/or any other connected parties. As a result, investors should be aware that CLSA and/or such individuals may have one or more conflicts of interests that could affect the objectivity of this report. The Hong Kong Securities and Futures Commission requires disclosure of certain relationships and interests with respect to companies covered in CLSA's research reports and the securities of which are listed on The Stock Exchange of Hong Kong Limited and such details are available at http://www.clsa.com/member/research_disclosures/. Disclosures therein include the position of the CLSA Group only and do not reflect those of Credit Agricole Corporate & Investment Bank
and/or its affiliates. If investors have any difficulty accessing this website, please contact [email protected] on (852) 2600 8111. If you require disclosure information on previous dates, please contact [email protected]. This publication/communication is distributed for and on behalf of CLSA Limited (for non-US markets research) and /or Credit Agricole Securities (USA) Inc. (for US research) in Australia by CLSA Australia Pty Ltd; in Hong Kong by CLSA Research Ltd.; in India by CLSA India Ltd. (Address: 8/F, Dalamal House, Nariman Point, Mumbai 400021. Tel No: +91-22-66505050. SEBI Registration No: BSE Capital Market Segment: INB010826432; BSE F&O Segment: INF010826432; NSE Capital Market Segment: INB230826436; NSE F&O Segment: INF230826436); in Indonesia by PT CLSA Indonesia; in Japan by Credit Agricole Securities Asia B.V., Tokyo Branch, a member of the JSDA licensed to use the "CLSA" logo in Japan; in Korea by CLSA Securities Korea Ltd.; in Malaysia by CLSA Securities Malaysia Sdn Bhd; in the Philippines by CLSA Philippines Inc. (a member of Philippine Stock Exchange and Securities Investors Protection Fund); in Thailand by CLSA Securities (Thailand) Limited; and in Taiwan by CLSA Limited, Taipei Branch. United States of America: This research report is distributed into the United States by CLSA solely to persons who qualify as "Major U.S. Institutional Investors" as defined in Rule 15a-6 under the Securities and Exchange Act of 1934 and who deal with Credit Agricole Corporate & Investment Bank. However, the delivery of this research report to any person in the United States shall not be deemed a recommendation to effect any transactions in the securities discussed herein or an endorsement of any opinion expressed herein. Any recipient of this research in the United States wishing to effect a transaction in any security mentioned herein should do so by contacting Credit Agricole Securities (USA) Inc. (a broker-dealer registered with the Securities and Exchange Commission) and an affiliate of CLSA. United Kingdom: Notwithstanding anything to the contrary herein, the following applies where the publication/communication is distributed in and/or into the United Kingdom. This publication/communication is only for distribution and/or is only directed at persons ("permitted recipients") who are (i) persons falling within Article 19 of the Financial Services and Markets Act 2000 (Financial Promotion) Order 2001 (the "FPO") having professional experience in matters relating to investments or high net worth companies, unincorporated associations etc. falling within Article 49 of the FPO, and (ii) where an unregulated collective investment scheme (an "unregulated CIS") is the subject of the publication/communication, also persons of a kind to whom the unregulated CIS may lawfully be promoted by a person authorised under the Financial Services and Markets Act 2000 ("FSMA") by virtue of Section 238(5) of the FSMA. The investments or services to which this publication/communication relates are available only to permitted recipients and persons of any other description should not rely upon it. This publication/ communication may have been produced in circumstances such that it is not appropriate to categorise it as impartial in accordance with the FSA Rules. Singapore: This publication/communication is distributed for and on behalf of CLSA Limited (for non-US markets research) and /or Credit Agricole Securities (USA) Inc. (for US research) in Singapore through CLSA Singapore Pte Ltd solely to persons who qualify as Institutional, Accredited and Expert Investors only, as defined in s.4A(1) of the Securities and Futures Act. Pursuant to Paragraphs 33, 34, 35 and 36 of the Financial Advisers (Amendment) Regulations 2005 with regards to an Accredited Investor, Expert Investor or Overseas Investor, sections 25, 27 and 36 of the Financial Adviser Act shall not apply to CLSA Singapore Pte Ltd. Please contact CLSA Singapore Pte Ltd in connection with queries on the report. MICA (P) 168/12/2009 The analysts/contributors to this publication/communication may be employed by a Credit Agricole or a CLSA company which is different from the entity that distributes the publication/communication in the respective jurisdictions.
MSCI-sourced information is the exclusive property of Morgan Stanley Capital International Inc. (MSCI). Without prior written permission of MSCI, this information and any other MSCI intellectual property may not be reproduced, redisseminated or used to create any financial products, including any indices. This information is provided on an "as is" basis. The user assumes the entire risk of any use made of this information. MSCI, its affiliates and any third party involved in, or related to, computing or compiling the information hereby expressly disclaim all warranties of originality, accuracy, completeness, merchantability or fitness for a particular purpose with respect to any of this information. Without limiting any of the foregoing, in no event shall MSCI, any of its affiliates or any third party involved in, or related to, computing or compiling the information have any liability for any damages of any kind. MSCI, Morgan Stanley Capital International and the MSCI indexes are services marks of MSCI and its affiliates. The Global Industry Classification Standard (GICS) was developed by and is the exclusive property of Morgan Stanley Capital International Inc. and Standard & Poor's. GICS is a service mark of MSCI and S&P and has been licensed for use by CLSA Asia-Pacific Markets.
01/01/2011

Research & sales offices
www.clsa.com
Australia CLSA Australia Pty Ltd CLSA House Level 15 20 Hunter Street Sydney NSW 2000 Tel: (61) 2 8571 4200 Fax: (61) 2 9221 1188
India CLSA India Ltd 8/F, Dalamal House Nariman Point Mumbai 400021 Tel: (91) 22 6650 5050 Fax: (91) 22 2284 0271
Philippines CLSA Philippines, Inc 19/F, Tower Two The Enterprise Center 6766 Ayala corner Paseo de Roxas Makati City Tel: (63) 2 860 4000 Fax: (63) 2 860 4051
USA - Boston Credit Agricole Securities (USA) Inc 99 Summer Street Suite 220 Boston, MA 02110 Tel: (1) 617 295 0100 Fax: (1) 617 295 0140
China - Beijing CLSA Limited - Beijing Rep Office Unit 10-12, Level 25 China World Trade Centre Tower 2 1 Jian Guo Men Wai Ave Beijing 100004 Tel: (86) 10 5965 2188 Fax: (86) 10 6505 2209
Indonesia PT CLSA Indonesia WISMA GKBI Suite 901 Jl Jendral Sudirman No.28 Jakarta 10210 Tel: (62) 21 2554 8888 Fax: (62) 21 574 6920
Singapore CLSA Singapore Pte Ltd 80 Raffles Place, No.18-01 UOB Plaza 1 Singapore 048624 Tel: (65) 6416 7888 Fax: (65) 6533 8922
USA - Chicago Credit Agricole Securities (USA) Inc 227 W. Monroe Street Suite 3800 Chicago, IL 60606 Tel: (1) 312 278 3604
China - Shanghai CLSA Limited - Shanghai Rep Office Room 910, 9/F 100 Century Avenue Pudong New Area Shanghai 200120 Tel: (86) 21 2020 5888 Fax: (86) 21 2020 5666
Japan Credit Agricole Securities Asia BVTokyo Branch 15/F, Shiodome Sumitomo Building 1-9-2, Higashi-Shimbashi Minato-ku, Tokyo 105-0021 Tel: (81) 3 4580 5533 (General) (81) 3 4580 5171 (Trading)Fax: (81) 3 4580 5896
Taiwan CLSA Limited Taiwan Branch 27/F, 95 Tun Hwa South Road Section 2 Taipei Tel: (886) 2 2326 8188 Fax: (886) 2 2326 8166
USA - New York Credit Agricole Securities (USA) Inc 15/F, Credit Agricole Building1301 Avenue of The AmericasNew York 10019 Tel: (1) 212 408 5888 Fax: (1) 212 261 2502
China - Shenzhen CLSA Limited - Shenzhen Rep Office Room 3111, Shun Hing Square Di Wang Commercial Centre 5002 Shennan Road East Shenzhen 518008 Tel: (86) 755 8246 1755 Fax: (86) 755 8246 1754
Korea CLSA Securities Korea Ltd 15/F, Sean Building 116, 1-Ka, Shinmun-Ro Chongro-Ku Seoul, 110-061 Tel: (82) 2 397 8400 Fax: (82) 2 771 8583
Thailand CLSA Securities (Thailand) Ltd 16/F, M Thai Tower All Seasons Place 87 Wireless Road, Lumpini Pathumwan, Bangkok 10330 Tel: (66) 2 257 4600 Fax: (66) 2 253 0532
USA - San Francisco Credit Agricole Securities (USA) Inc Suite 850 50 California Street San Francisco, CA 94111 Tel: (1) 415 544 6100 Fax: (1) 415 434 6140
Hong Kong CLSA Limited 18/F, One Pacific Place 88 Queensway Hong Kong Tel: (852) 2600 8888 Fax: (852) 2868 0189
Malaysia CLSA Securities Malaysia Sdn Bhd Suite 20-01, Level 20 Menara Dion 27 Jalan Sultan Ismail 50250 Kuala Lumpur Tel: (60) 3 2056 7888 Fax: (60) 3 2056 7988
United Kingdom CLSA (UK) 12/F, Moor House 120 London Wall London EC2Y 5ET Tel: (44) 207 614 7000 Fax: (44) 207 614 7070
CLSA Sales Trading Team Australia (61) 2 8571 4201 China (Shanghai) (86) 21 2020 5810 Hong Kong (852) 2600 7003 India (91) 22 6622 5000 Indonesia (62) 21 573 9460 Japan (81) 3 4580 5169 Korea (82) 2 397 8512
Malaysia (60) 3 2056 7852 Philippines (63) 2 860 4030 Singapore (65) 6416 7878 Taiwan (886) 2 2326 8124 Thailand (66) 2 257 4611 UK (44) 207 614 7260 US (1) 212 408 5800
CLEANGREEN& TM
At CLSA we supportsustainable development.
We print on paper sourced fromenvironmentally conservativefactories that only use fibres
from plantation forests.Please recycle.
CLSA is certified ISO14001:2004
© 2011 CLSA Asia-Pacific Markets ("CLSA"). Key to CLSA investment rankings: BUY = Expected to outperform the local market by >10%; O-PF = Expected to outperform the local market by 0-10%; U-PF = Expected to underperform the local market by 0-10%; SELL = Expected to underperform the local market by >10%. Performance is defined as 12-month total return (including dividends). 01/01/2011