Embed Size (px)
Citation preview
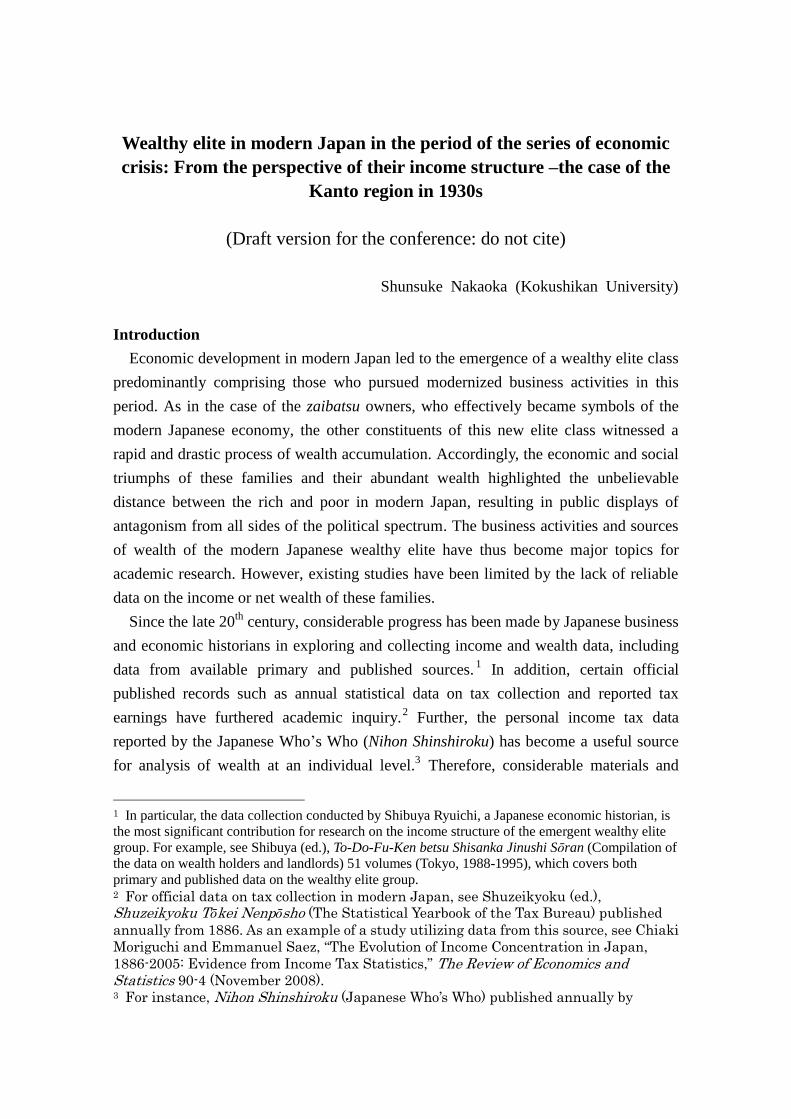
Wealthy elite in modern Japan in the period of the series of economic
crisis: From the perspective of their income structure –the case of the
Kanto region in 1930s
(Draft version for the conference: do not cite)
Shunsuke Nakaoka (Kokushikan University)
Introduction
Economic development in modern Japan led to the emergence of a wealthy elite class
predominantly comprising those who pursued modernized business activities in this
period. As in the case of the zaibatsu owners, who effectively became symbols of the
modern Japanese economy, the other constituents of this new elite class witnessed a
rapid and drastic process of wealth accumulation. Accordingly, the economic and social
triumphs of these families and their abundant wealth highlighted the unbelievable
distance between the rich and poor in modern Japan, resulting in public displays of
antagonism from all sides of the political spectrum. The business activities and sources
of wealth of the modern Japanese wealthy elite have thus become major topics for
academic research. However, existing studies have been limited by the lack of reliable
data on the income or net wealth of these families.
Since the late 20th
century, considerable progress has been made by Japanese business
and economic historians in exploring and collecting income and wealth data, including
data from available primary and published sources.1 In addition, certain official
published records such as annual statistical data on tax collection and reported tax
earnings have furthered academic inquiry.2 Further, the personal income tax data
reported by the Japanese Who’s Who (Nihon Shinshiroku) has become a useful source
for analysis of wealth at an individual level.3 Therefore, considerable materials and
1 In particular, the data collection conducted by Shibuya Ryuichi, a Japanese economic historian, is
the most significant contribution for research on the income structure of the emergent wealthy elite
group. For example, see Shibuya (ed.), To-Do-Fu-Ken betsu Shisanka Jinushi Sōran (Compilation of
the data on wealth holders and landlords) 51 volumes (Tokyo, 1988-1995), which covers both
primary and published data on the wealthy elite group. 2 For official data on tax collection in modern Japan, see Shuzeikyoku (ed.),
Shuzeikyoku Tōkei Nenpōsho (The Statistical Yearbook of the Tax Bureau) published
annually from 1886. As an example of a study utilizing data from this source, see Chiaki
Moriguchi and Emmanuel Saez, “The Evolution of Income Concentration in Japan,
1886-2005: Evidence from Income Tax Statistics,” The Review of Economics and Statistics 90-4 (November 2008). 3 For instance, Nihon Shinshiroku (Japanese Who’s Who) published annually by
sources for analyzing the wealthy elite in modern Japan have surfaced more recently.
However, it is also apparent that, even with these sources, a detailed analysis of the
income or wealth of the target group is still not possible. Many of the published sources
mainly consist of data on the estimated wealth of the individual wealthy elites; given
that the methods of wealth estimation used are unclear, the reliability of information
from these materials is quite dubious.4 Moreover, it is difficult to access detailed
personal information from the statistical references published by the tax authorities,
since these publications present aggregate results on the basis of earning categories.
Moreover, the data on personal income tax in published materials is also problematic,
since several reforms of the income tax system were undertaken during Japan’s early
period of modernization. Notably, dividends from firms’ shares were exempt from tax
payments until the income tax reform in the 1920s.5 This poses special challenges for
wealth estimations of members of the zaibatsu families, who principally gained their
income in the form of dividends from the zaibatsu holding companies.6
This paper aims to examine and analyze the income structure of the modern Japanese
wealthy elite by utilizing newly discovered official income data published by the
Japanese tax authority. This official document, Dai-Shotoku Nozeishashirabe
(Examination on the annual income of higher taxpayers), covers detailed income data
by category—for instance, tenants, rents, salaries, and dividends—for each
higher-income taxpayer. Therefore, the document can be utilized as a valuable source
for data analysis.7 Nevertheless, it should be noted that even if this document provides
Kōjunsha, a Japanese publisher, reported personal income tax data of individuals listed
on Shinshiroku. As an example of a study utilizing such data from this publication, see
Yazawa Hirotake, Kindai Nihon no Shotoku-Bunpu to Kazoku Keizai (Income
distribution and family economy in modern Japan: Tokyo, 2004). 4 However, it should be noted that some wealth estimates were based directly on
personal income tax data, officially announced by the tax authority. When income tax
was introduced in the late 19th century, the tax authority initially approved the public
announcement of data for higher-income taxpayers at the local level. See Zeimu
Daigakko (ed.), Shotokuzei no Dōnyu to Chōsa-Iin Seido (The introduction of income tax
system and the income tax investigation committee: Tokyo, 2007). 5 For the history of changes in the income tax system in modern Japan, see Ōkurashō
(ed.), Meiji Taishō Zaiseishi Vol. 7 (Tokyo, 1950), especially, pp.1000–1150. 6 For instance, until the income tax reform of the 1920s, the income tax payments of the
Mitsui families were considerably lower than that of the other wealthy elite. According
to the data for 1916, the income tax payment of Mitsui Takamine, the head of the Mitsui
zaibatsu in this period, was 453 Japanese yen, compared to 42,814 yen for Iwasaki
Hisaya, the head of the Mitsubishi zaibatsu. This data is derived from Kōjunsha (ed.),
Nihon Shinshiroku Dai 21pan (21th edition: Tokyo, 1916). 7 Although dates and areas covered by this official document are limited, it is collected
in Shōwa Zaiseishi Shiryō (Documents of Financial History in the Shōwa period), and
can be found in the National Archive of Japan. The remaining Dai-Shotoku
accurate and useful information on the kind of personal wealth of interest in this paper,
owing to the insufficient numbers of tax officers, the tax authority sanctioned a 10 to 20
percent tax reduction policy to encourage “respectable” income tax payment on the part
of higher taxpayers.8 This indicates that, in some cases, the data contained in the
Dai-Shotoku Nozeishashirabe may reflect such reductions. Furthermore, from other
evidence, it is apparent that there was a significant gap between the official data on
annual income listed in the Dai-Shotoku Nozeishashirabe and actual annual income.9
However, even though this document has some clear limitations, it undoubtedly
provides detailed information, which proves to be useful in analyzing the structure of
the annual earnings of higher income taxpayers.
Particular attention is given to the Kanto region, containing the capital city of Tokyo
and its suburban surroundings, the heart of modern Japan’s economic activity. This
paper’s focus on the Kanto region directly reflects the fact that the Dai-Shotoku
Nozeishashirabe data is the most comprehensive for this area. In addition, it is difficult
to examine the data from this document over a long-term time series, since we can find
data for 1931, 1932, 1933, and 1936 from the remaining documents.10
Furthermore,
there are differences between data for 1931 and 1932, and 1933 and 1936, as regards the
targeted taxpayers and areas covered.11
By analyzing the limited data collected from
these documents and with the assistance of other official publications such as
Shuzeikyoku Tōkei Nenpōsho, we discuss the characteristics of the Japanese wealthy
elite in this period as follows.
First, along with the data collected from Shuzeikyoku Tōkei Nenpōsho, a general
perspective on the wealthy elite in the Kanto region and this class’s characteristics is
Nozeishashirabe can be found in Shōwa Zaiseishi Shiryō dai 4gō dai 33satsu (Vol.4,
book 33: 05-059-00, 00359100; National Archive of Japan). 8 This tax reduction policy has been corroborated by publications of the contemporary
tax office. See, for example, Kataoka Keiichi (ed.), Kojin Nōzei Dokuhon (The book for
personal tax payment: Tokyo, 1934). 9 This is applicable to the case of the Mitsui families. According to detailed research, it
is clear that a huge gap existed between the annual income of families and the annual
allowance that they received from their respective holding companies, owing to the fact
that a certain percentage of annual income was reserved for the expansion of Mitsui’s
business activities. For details, see Mitsui Bunko (ed.), Mitsui Hachirōemon Takamine Den (Biography of Mitsui Hachirōemon Takamine: Tokyo, 1989), especially, pp.315-336. 10 The data for 1936 was found from another document in the library of the Faculty of
Economics at the University of Tokyo. Showa 11nendo bun Dai3shu Shotoku Dai-Nozeisha Shirabe in Hamada Tokumi ShiryōⅡ(University of Tokyo, mf99:w1:8). 11 Although the data for 1931 and 1932 include information on higher-income taxpayers,
whose annual income topped 30 thousand yen and who resided in the Kanto region, the
data for the years 1933 and 1936 cover those with an annual income of over 100
thousand yen residing in mainland Japan.
analyzed at the national level. Next, from the data obtained from Nenpōsho, which
focuses on the period from 1926 to 1935, the early era of the Shōwa period in Japan, a
comparison of the Kanto region with other regions is made. This comparison also aims
to consider differing wealth concentrations at the regional level and the impact of the
national-level depression (Shōwa Kyōkō) and the Great Depression of 1929, which
occurred during this period. Following this general view, a detailed analysis of annual
income is conducted in the next part. Note that, owing to limitations of the available
data, our attention is focused on individuals with annual income exceeding 100
thousand yen—probably, the crème de la crème of the Japanese rich.12
For example,
this section explores whether these individuals derived their income from salaries or
dividends. Further, a detailed analysis by occupational classification and social class is
conducted to identify structural income differences on the basis of each occupation or
social group. Moreover, the influence of the economic depression and lingering
stagnation on the wealthy elites’ incomes is discussed, since the 1930s was a decade
marked by financial and economic crises, both national and global. A major aim
throughout this paper is estimating the possible influence of the series of crises on
Japanese income levels and wealth disparities between the rich and poor.
1. General Perspective of the Japanese wealthy elite from the late 1920s to the
early 1930s
Description of data and sources
Before focusing on the main point of analysis in this section, we briefly describe the
nature and contents of the data used in this paper, along with a review of the income tax
system in modern Japan. Owing to several systemic reforms, income tax in modern
Japan was divided into several categories, namely: the first category (Dai-Isshu, or
taxation of company profits, which closely approximates the current corporate tax); the
second category (Dai-Nishu, or taxation of interest on bonds and bank deposits); and the
third category (Dai-Sanshu, which closely resembles the current personal income tax.13
From taxpayers’ perspective, Dai-Nishu and Dai-Sanshu were significant, since these
categories applied to personal income tax collection. However, using this data may
preclude an accurate estimation of personal wealth. First, there was a difference
between Dai-Nishu and Dai-Sanshu with regard to the tax rate system. The former was
12 For example, the currency conversion rate between the Japanese yen and British
pound in the1930s averaged 20 JPY = 1 GBP. Therefore, the wealthy elite, the subject of
detailed analysis in this paper, had annual incomes in excess of 5,000 GBP in this
period. See Nakamura Takafusa, Economic development in modern Japan (Tokyo, 1981),
p.34. 13 For more on these categories, see Ōkurashō (ed.), Meiji Taishō Zaiseishi Vol.7, pp.
1035-36.
levied at a flat rate, and the latter was a progressive tax. This signifies that some
personal income, in particular, income from bonds or deposits, was taxed at a different
rate.14
Moreover, most of the income tax data included in publications such as the
Who’s Who was based on Dai-Sanshu income tax payments. Thus, it is difficult to
estimate personal income from these types of publications, since the data does not cover
personal income beyond that taxed in the Dai-Sanshu category. In addition, statistical
data of personal income in official publications, as in the case of Shuzeikyoku Tōkei
Nenpōsho, provided information on numbers of tax-paying individuals, net incomes,
and individual income tax payments by income categories. However, it is impossible to
break down this aggregate data on an individual level.
In the case of Dai-Shotoku Nozeishashirabe, the document provides various data on
personal income, since it divided the revenue of higher-income taxpayers into categories
such as agriculture, rent and lease, business, dividends, salary (including bonuses and
pension monies), and other income sources. Another advantage of this official document
is that it covers information on income that was subject to not only the Dai-Sanshu
payment, but also, the Dai-Nishu payment.15
This would suggest that Dai-Shotoku
Nozeishashirabe is a comprehensive source of personal income data for the
higher-income taxpayers in this period.
However, because of the limitations of the available documents, which were
mentioned in the section above, the analysis and discussion in the present study are
confined only to the ultra-rich in this period. In addition, it is expected the results from
these data only represent the minority among the income taxpayers in 1930s.16
Therefore, data from Shuzeikyoku Tōkei Nenpōsho is necessary to describe and analyze
general trends, changes, and perspectives on the income of the wealthy elite in this
period. Nevertheless, it should be noted that, in addition to drawing from Nenpōsho and
Dai-Shotoku Nozeishashirabe, additional data processing would be needed. First, until
14 The historical background of the income tax reforms is concisely described in
Teranishi Jūrō, Senzenki Nihon no Kinyū Sistemu (The financial system in prewar
Japan: Tokyo, 2011), especially, pp.751-757. In addition, for an economic analysis of
income tax reform in this period, see, for example, Jinno Naohiko, “Shakai seisakuteki
sozei seisaku no tenkai-1920nen dai no sozei seisaku” (The development of the taxation
policy as social policy in the case of 1920s taxation policy), Keizaigaku Zasshi 86-3
(1985). 15 The income subjected to the Dai-Nishu payment, such as interest earned on bonds or
bank deposits, is categorized as “other income sources” as per Dai-Shotoku Nozeishashirabe. 16 According to the data in Shuzeikyoku Tokei Nenpōsho, the wealthy elite whose
annual income was over 100 thousand in this period represented only 0.08-0.09 percent
of the total number of income taxpayers in the 1930s. This finding is based on
Shuzeikyoku (ed.), Shuzeikyoku Tōkei Nenpōsho vol. 58–vol.63 (1930–36).
the end of World War II, the income tax was calculated and paid on the basis of the
household unit (in Japanese: Ie), or an aggregate of family members’ incomes for tax
purposes.17
Since the data contained in Nozeishashirabe is based on this household unit
system, a recalculation of the Nenpōsho data is needed to standardize individual
payments from the household unit.18
Second, a reorganization of the Nenpōsho regional
divisions is necessary, since such divisions reflected the jurisdiction of the local tax
bureau (Zeimu Kantokukyoku).19
In addition, for analyzing this particular group on a
broader and more holistic level, the Nenpōsho data is used only for those taxpayers
whose annual income exceeded 30 thousand yen (since Nozeishashirabe in 1931 and
1932 targeted those higher-income earners).20
After such data processing, the findings
and characteristics of this particularly elite group, at the national and regional levels, are
discussed. The aim is to present a clear picture of the level of income concentration and
inequality in modern Japan during this period, which was marked by a series of
economic crises.
General trends on national and regional levels
Figures 1 to 4 present the general trends with regard to income taxpayers on the basis
of Nenpōsho reports. Figures 1 and 2 depict changes in the numbers and total income of
all income taxpayers from 1926 to 1936. In this particular period, the Japanese economy
suffered from several economic crises that deeply damaged economic activities. Events
such as the financial crisis in the late 1920s, followed by the Great Depression from
1929, certainly triggered substantial reductions in Japanese personal and household
17 For details on the origins of the family unit payment system, see Yamamoto Hiroshi
and Orii Nobuyoshi, “Sōseiki no Shotokuzeisei Sōkō” (The inauguration period of the
income tax system), Zeidai Ronsō 20 (1990), esp. pp.64-66. 18 Recalculation of the Nenpōsho data is simple, since both the number of individuals
who paid income tax and the number of individuals who were members of families
whose income was aggregated for tax purposes were reported. Therefore, the number of
household units in each income bracket can be obtained by subtracting the number of
the latter from the former. 19 As the jurisdictional divisions of the tax authority certainly differed from the
Japanese regional divisions, some data processing will be needed. The regional division
of Japan in this paper on the basis of the general definition is as follows:
Hokkaido; Tōhoku (Aomori, Iwate, Miyagi, Akita, Yamagata, and Fukushima); Kanto
(Tokyo, Kanagawa, Saitama, Chiba, Gunma, Tochigi, Ibaragi, and Yamanashi ); Chubu
(Aichi, Shizuoka, Nagano, Gifu, Mie, and Niigata); Hokuriku (Toyama, Ishikawa, and
Fukui); Kansai (Osaka, Kyoto, Hyogo, Nara, Shiga, and Wakayama); Chugoku
(Okayama, Hiroshima, Tottori, Shimane, and Yamaguchi); Shikoku (Kagawa,
Tokushima, Ehime, and Kochi); Kyushu (Fukuoka, Saga, Nagasaki, Oita, Miyazaki,
Kagoshima, and Okinawa). In each case, the parenthetical names refer to prefectures
located within each regional division. 20 Nozeishashirabe for 1933 and 1936 only targeted those whose wealth exceeded
100,000 JPY. This data was collected on the national level.
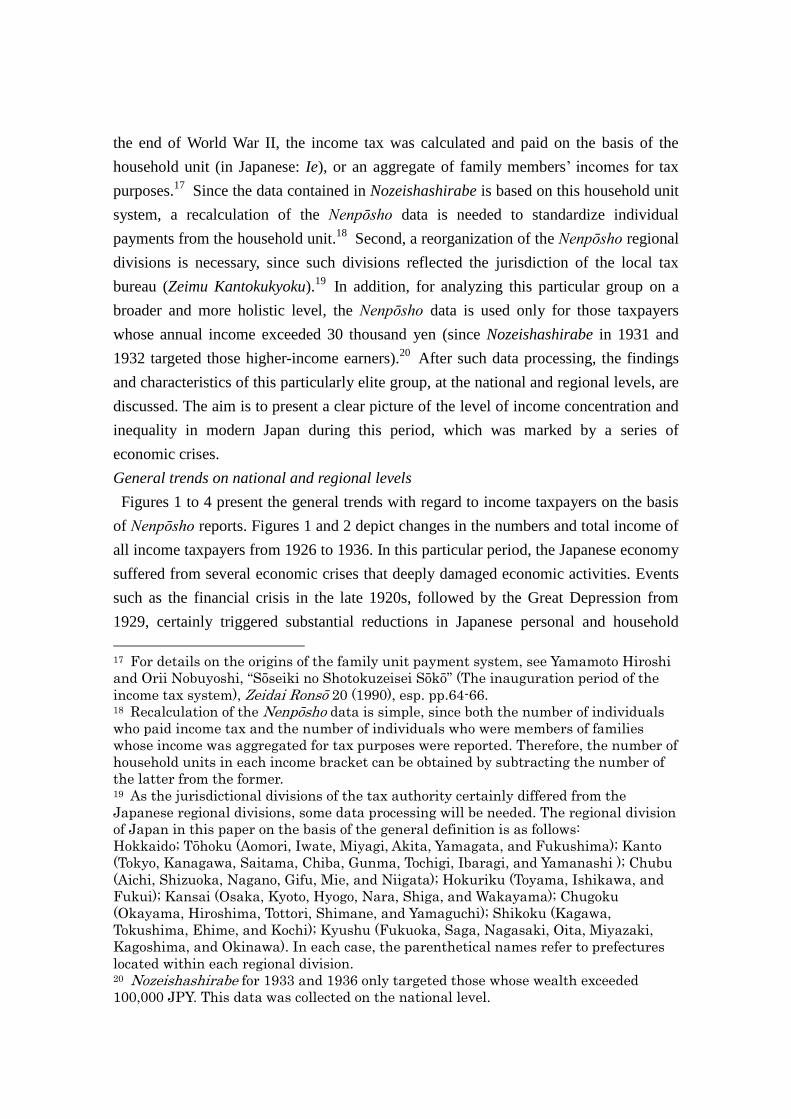
incomes.21
Sources: Shuzeikyoku (ed.), Shuzeikyoku Tōkei Nenpōsho, Vol. 54 – Vol. 64 (1926-1936).
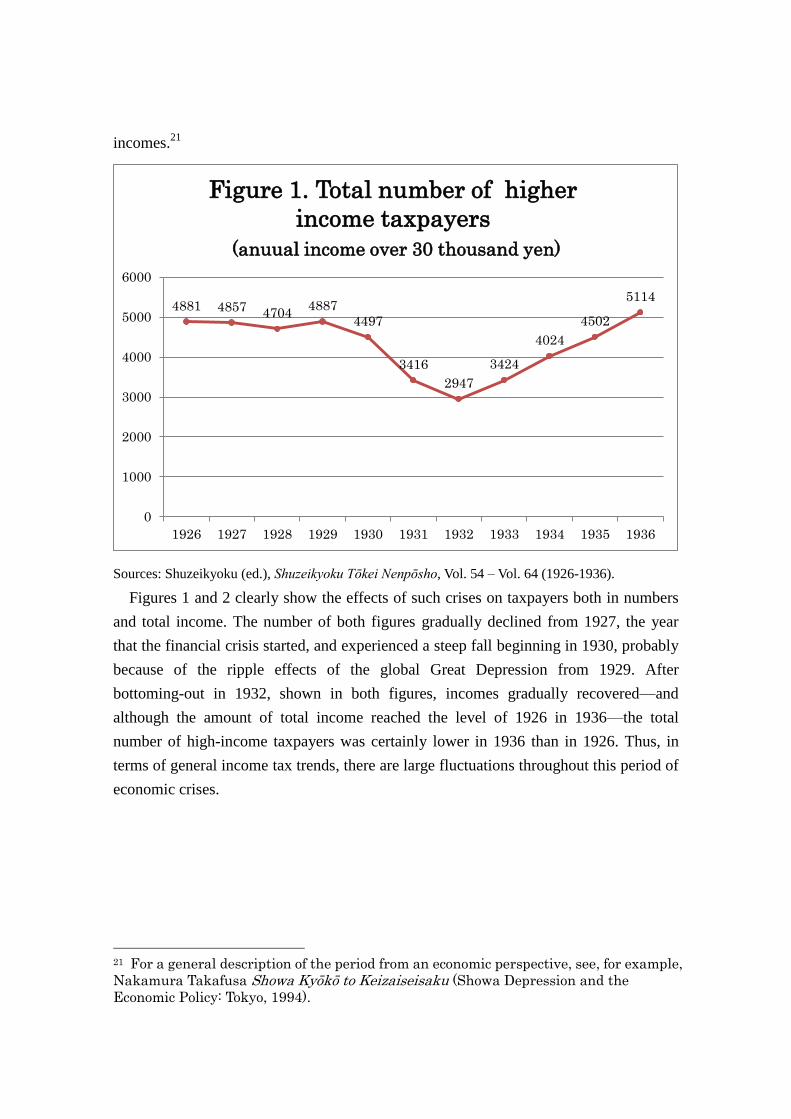
Figures 1 and 2 clearly show the effects of such crises on taxpayers both in numbers
and total income. The number of both figures gradually declined from 1927, the year
that the financial crisis started, and experienced a steep fall beginning in 1930, probably
because of the ripple effects of the global Great Depression from 1929. After
bottoming-out in 1932, shown in both figures, incomes gradually recovered—and
although the amount of total income reached the level of 1926 in 1936—the total
number of high-income taxpayers was certainly lower in 1936 than in 1926. Thus, in
terms of general income tax trends, there are large fluctuations throughout this period of
economic crises.
21 For a general description of the period from an economic perspective, see, for example,
Nakamura Takafusa Showa Kyōkō to Keizaiseisaku (Showa Depression and the
Economic Policy: Tokyo, 1994).
4881 4857 4704 4887
4497
3416
2947
3424
4024
4502
5114
0
1000
2000
3000
4000
5000
6000
1926 1927 1928 1929 1930 1931 1932 1933 1934 1935 1936
Figure 1. Total number of higher
income taxpayers
(anuual income over 30 thousand yen)
By contrast, changes in numbers and total income among higher-income taxpayers
shown in Figures 3 and 4, reveal that the effects of the economic crises were shorter and
804419
732236 693808
700518
677870
569045 528165
569585
629709
679343
740732
0
100000
200000
300000
400000
500000
600000
700000
800000
900000
1926 1927 1928 1929 1930 1931 1932 1933 1934 1935 1936
Figure 2: Total number of income
taxpayers
332447793 343662596
327101774 343596539
317710595
234674455
193794408
230026942
293695554
319760576
366157571
0
50000000
100000000
150000000
200000000
250000000
300000000
350000000
400000000
1926 1927 1928 1929 1930 1931 1932 1933 1934 1935 1936
Figure 3: The total amount of wealth among higher
income taxpayers (japanese yen)
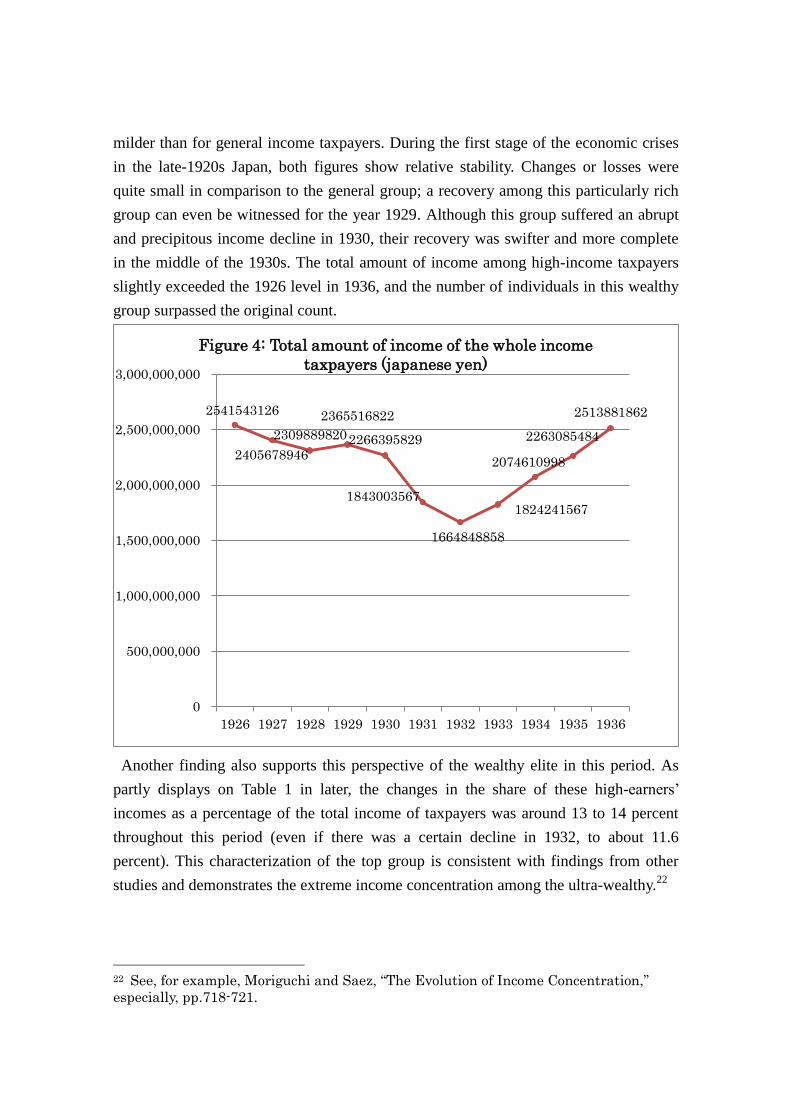
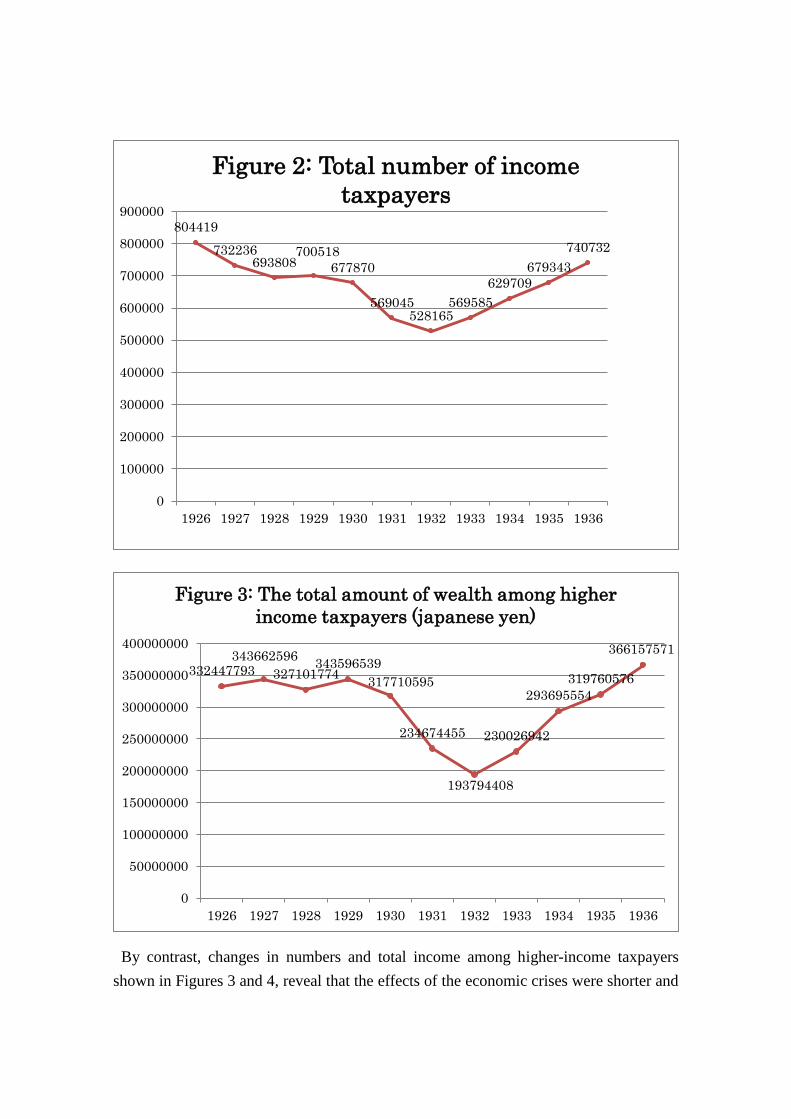
milder than for general income taxpayers. During the first stage of the economic crises
in the late-1920s Japan, both figures show relative stability. Changes or losses were
quite small in comparison to the general group; a recovery among this particularly rich
group can even be witnessed for the year 1929. Although this group suffered an abrupt
and precipitous income decline in 1930, their recovery was swifter and more complete
in the middle of the 1930s. The total amount of income among high-income taxpayers
slightly exceeded the 1926 level in 1936, and the number of individuals in this wealthy
group surpassed the original count.
Another finding also supports this perspective of the wealthy elite in this period. As
partly displays on Table 1 in later, the changes in the share of these high-earners’
incomes as a percentage of the total income of taxpayers was around 13 to 14 percent
throughout this period (even if there was a certain decline in 1932, to about 11.6
percent). This characterization of the top group is consistent with findings from other
studies and demonstrates the extreme income concentration among the ultra-wealthy.22
22 See, for example, Moriguchi and Saez, “The Evolution of Income Concentration,”
especially, pp.718-721.
2541543126
2405678946
2309889820
2365516822
2266395829
1843003567
1664848858
1824241567
2074610998
2263085484
2513881862
0
500,000,000
1,000,000,000
1,500,000,000
2,000,000,000
2,500,000,000
3,000,000,000
1926 1927 1928 1929 1930 1931 1932 1933 1934 1935 1936
Figure 4: Total amount of income of the whole income
taxpayers (japanese yen)

A regional-level examination of data reveals different findings than that from a
national-level perspective. Figures 5 and 6 show changes and shifts in regional
distribution and incomes of higher-income taxpayers.
Figure 5. Shares of higher income taxpayers of each region (by %)
As indicated in Figure 5, the majority of this group resided in two particular regions,
that is, Kanto and Kansai. Kanto has the Japanese capital, Tokyo, at the heart of the
region, and thus, is a natural political and economic center. Kansai is home to another
economic center of modern Japan, Osaka, and is regarded as a symbol of industrial and
economic development in this period.23
Around 70 percent of higher-income taxpayers
were concentrated in these two regions throughout this period; the other regions had
relatively minor concentrations of wealth and wealthy individuals. However, if we
compare the Kanto and Kansai regions, there were several relevant differences between
23 For details of the role of Kansai or Osaka in the modern Japanese economy, see, for
example, Abe Takeshi, Kindai Osaka Keizaishi (Economic History of Osaka in the
Modern Period: Osaka, 2006).
0
5
10
15
20
25
30
35
40
45
1926 1927 1928 1929 1930 1931 1932 1933 1934 1935 1936
Kanto
Kansai
Hokkaido
Tohoku
Hokuriku
Chubu
Shikoku
Chugoku
Kyushu
the two areas. First, although both regions show similar trends on the national level with
regard to changes in total amount that influenced by economic events, it is apparent that
the crème de la crème of this wealthy group tended to cluster in the Kanto region.
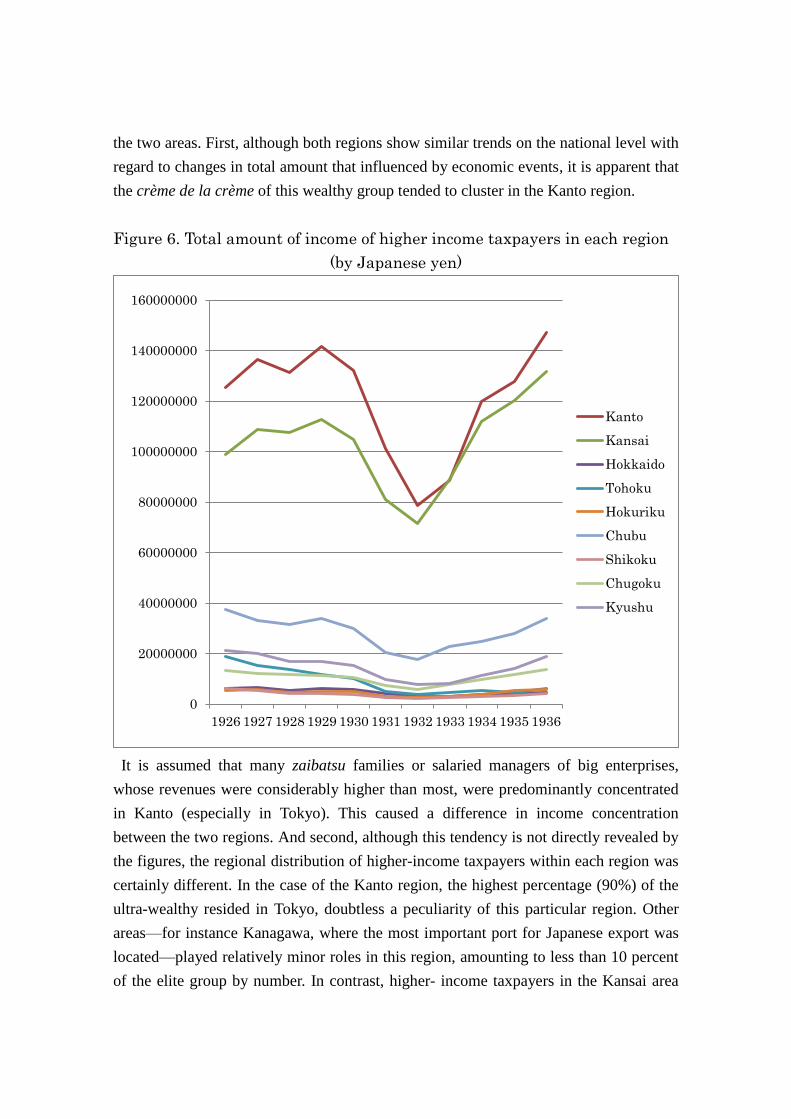
Figure 6. Total amount of income of higher income taxpayers in each region
(by Japanese yen)
It is assumed that many zaibatsu families or salaried managers of big enterprises,
whose revenues were considerably higher than most, were predominantly concentrated
in Kanto (especially in Tokyo). This caused a difference in income concentration
between the two regions. And second, although this tendency is not directly revealed by
the figures, the regional distribution of higher-income taxpayers within each region was
certainly different. In the case of the Kanto region, the highest percentage (90%) of the
ultra-wealthy resided in Tokyo, doubtless a peculiarity of this particular region. Other
areas—for instance Kanagawa, where the most important port for Japanese export was
located—played relatively minor roles in this region, amounting to less than 10 percent
of the elite group by number. In contrast, higher- income taxpayers in the Kansai area
0
20000000
40000000
60000000
80000000
100000000
120000000
140000000
160000000
1926 1927 1928 1929 1930 1931 1932 1933 1934 1935 1936
Kanto
Kansai
Hokkaido
Tohoku
Hokuriku
Chubu
Shikoku
Chugoku
Kyushu
tended to disperse from Osaka, the economic center of the region, to suburban areas of
the Hyogo prefecture, which developed as a residential area favored by the wealthy
elite.24
Thus, in contrast to the case of the Kanto region, only around 50 percent of
wealthy individuals resided in the central hub of Osaka.
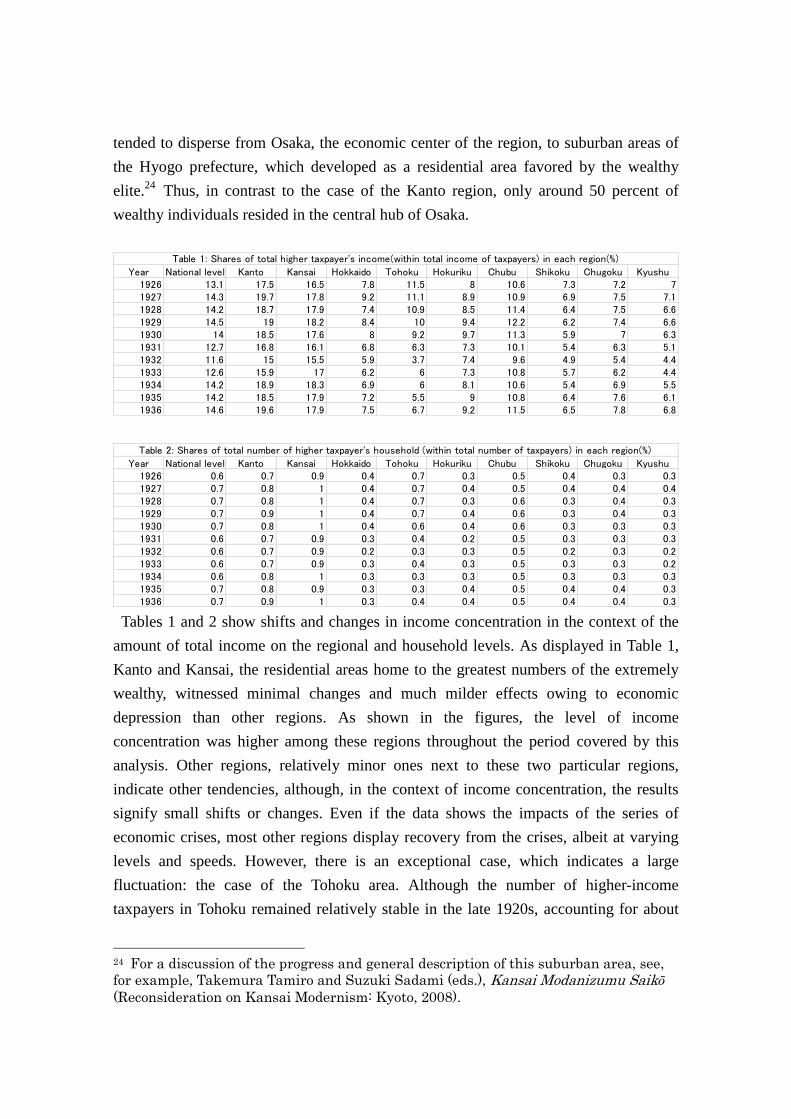
Tables 1 and 2 show shifts and changes in income concentration in the context of the
amount of total income on the regional and household levels. As displayed in Table 1,
Kanto and Kansai, the residential areas home to the greatest numbers of the extremely
wealthy, witnessed minimal changes and much milder effects owing to economic
depression than other regions. As shown in the figures, the level of income
concentration was higher among these regions throughout the period covered by this
analysis. Other regions, relatively minor ones next to these two particular regions,
indicate other tendencies, although, in the context of income concentration, the results
signify small shifts or changes. Even if the data shows the impacts of the series of
economic crises, most other regions display recovery from the crises, albeit at varying
levels and speeds. However, there is an exceptional case, which indicates a large
fluctuation: the case of the Tohoku area. Although the number of higher-income
taxpayers in Tohoku remained relatively stable in the late 1920s, accounting for about
24 For a discussion of the progress and general description of this suburban area, see,
for example, Takemura Tamiro and Suzuki Sadami (eds.), Kansai Modanizumu Saikō
(Reconsideration on Kansai Modernism: Kyoto, 2008).
Year National level Kanto Kansai Hokkaido Tohoku Hokuriku Chubu Shikoku Chugoku Kyushu1926 13.1 17.5 16.5 7.8 11.5 8 10.6 7.3 7.2 71927 14.3 19.7 17.8 9.2 11.1 8.9 10.9 6.9 7.5 7.11928 14.2 18.7 17.9 7.4 10.9 8.5 11.4 6.4 7.5 6.61929 14.5 19 18.2 8.4 10 9.4 12.2 6.2 7.4 6.61930 14 18.5 17.6 8 9.2 9.7 11.3 5.9 7 6.31931 12.7 16.8 16.1 6.8 6.3 7.3 10.1 5.4 6.3 5.11932 11.6 15 15.5 5.9 3.7 7.4 9.6 4.9 5.4 4.41933 12.6 15.9 17 6.2 6 7.3 10.8 5.7 6.2 4.41934 14.2 18.9 18.3 6.9 6 8.1 10.6 5.4 6.9 5.51935 14.2 18.5 17.9 7.2 5.5 9 10.8 6.4 7.6 6.11936 14.6 19.6 17.9 7.5 6.7 9.2 11.5 6.5 7.8 6.8
Table 1: Shares of total higher taxpayer's income(within total income of taxpayers) in each region(%)
Year National level Kanto Kansai Hokkaido Tohoku Hokuriku Chubu Shikoku Chugoku Kyushu1926 0.6 0.7 0.9 0.4 0.7 0.3 0.5 0.4 0.3 0.31927 0.7 0.8 1 0.4 0.7 0.4 0.5 0.4 0.4 0.41928 0.7 0.8 1 0.4 0.7 0.3 0.6 0.3 0.4 0.31929 0.7 0.9 1 0.4 0.7 0.4 0.6 0.3 0.4 0.31930 0.7 0.8 1 0.4 0.6 0.4 0.6 0.3 0.3 0.31931 0.6 0.7 0.9 0.3 0.4 0.2 0.5 0.3 0.3 0.31932 0.6 0.7 0.9 0.2 0.3 0.3 0.5 0.2 0.3 0.21933 0.6 0.7 0.9 0.3 0.4 0.3 0.5 0.3 0.3 0.21934 0.6 0.8 1 0.3 0.3 0.3 0.5 0.3 0.3 0.31935 0.7 0.8 0.9 0.3 0.3 0.4 0.5 0.4 0.4 0.31936 0.7 0.9 1 0.3 0.4 0.4 0.5 0.4 0.4 0.3
Table 2: Shares of total number of higher taxpayer's household (within total number of taxpayers) in each region(%)
10 to 11 percent of the population, this demographic experienced an abrupt decline in
the following period (from 10 to around 3 percent), and did not recover to the pre-crisis
level in the mid-1930s, in sharp contrast with other regions. In addition, as shown in
Figure 8, Tohoku also experienced a certain decline in the number of higher-income
households; by contrast, other regions display relative stability in this regard. The
exceptional position of the Tohoku region is plausibly owing to its unique economic
structure, heavily reliant on agriculture. It may be assumed that decline in agricultural
production prices, because of the Great Depression, led to the precipitous decline of
overall income in this region.25
Although the data itself is limited to discuss on the trend of the short period when the
Japanese economy managed to survive extreme economic condition, the results from
this section’s analysis would be beneficial in distinguishing the features of the Kanto
region with regard to higher-income taxpayers (in other words, the wealthy elite) more
fully. The first point is that, although Kanto had a rival region in Kansai, in the context
of income concentration (both with respect to the numbers of the wealthy and their net
wealth), the former region occupied a more prestigious position in modern Japan. This
economic supremacy of the Kanto region was because the nation’s very highest income
earners, like zaibatsu families, tended to concentrate here. The second point is that even
if the series of economic crises had an impact on the Japanese ultra-rich in this period,
the effects were much milder for those in the Kanto region in comparison to other
regions. The fluctuation in income or numbers was shorter. The decline was temporary
and was followed by a steep and swift recovery. These characteristics illustrate the
predominant position of the Kanto region with regard to wealth accumulation and
income concentration. A further detailed analysis is attempted in the next section.
2. Income structures and differences of the wealthy elite in the Kanto region
Composition of the wealthy elite in the Kanto region
To understand the wealthy elite of this particular region, an occupational distribution
analysis is conducted to highlight the social and economic characteristics of this group
in detail. Although the occupational data is according to information listed in
Nozeishashirabe in 1931, 1932, 1933 and 1936, supplementary information is collected
from other biographical materials, for instance, the Who’s Who (Shinshiroku) and
biographical dictionaries (for instance Jinji Kōshinroku).26
In the following figures, the
25 For details of the local effects of economic crises in this period, see, for example,
Kusumoto Masahiro, Kyōkō ka no Tohoku Nōson (The farming area of Tohoku in the
period of the Great Depression: Tokyo, 1984), and also Kerry Smith, A Time of Crisis: Japan, the Great Depression and Rural Revitalization (Cambridge; Mass, 2003). 26 Some of these materials included those republished in the postwar period. For
wealthy elite are classified into eight categories on the basis of available occupational
information: (1) members of the zaibatsu families, (2) businessmen and merchants (who
owned firms), (3) salaried managers, (4) political elites (in this case, including
politicians, officials, and military officers), (5) professionals (lawyers, doctors,
accountants, etc.), (6) landlords (both urban and agricultural), (7) Japanese nobility, and
(8) others (whose occupational information is unknown).
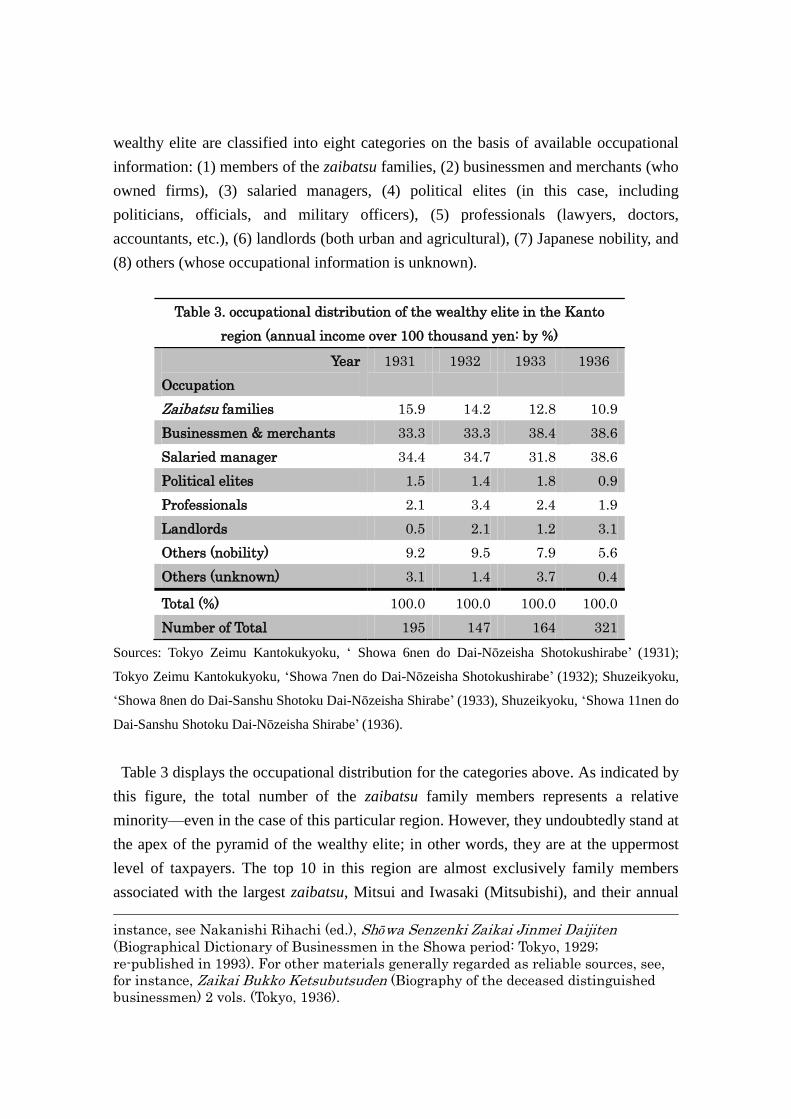
Table 3. occupational distribution of the wealthy elite in the Kanto
region (annual income over 100 thousand yen: by %)
Year
Occupation
1931 1932 1933 1936
Zaibatsu families 15.9 14.2 12.8 10.9
Businessmen & merchants 33.3 33.3 38.4 38.6
Salaried manager 34.4 34.7 31.8 38.6
Political elites 1.5 1.4 1.8 0.9
Professionals 2.1 3.4 2.4 1.9
Landlords 0.5 2.1 1.2 3.1
Others (nobility) 9.2 9.5 7.9 5.6
Others (unknown) 3.1 1.4 3.7 0.4
Total (%) 100.0 100.0 100.0 100.0
Number of Total 195 147 164 321
Sources: Tokyo Zeimu Kantokukyoku, ‘ Showa 6nen do Dai-Nōzeisha Shotokushirabe’ (1931);
Tokyo Zeimu Kantokukyoku, ‘Showa 7nen do Dai-Nōzeisha Shotokushirabe’ (1932); Shuzeikyoku,
‘Showa 8nen do Dai-Sanshu Shotoku Dai-Nōzeisha Shirabe’ (1933), Shuzeikyoku, ‘Showa 11nen do
Dai-Sanshu Shotoku Dai-Nōzeisha Shirabe’ (1936).
Table 3 displays the occupational distribution for the categories above. As indicated by
this figure, the total number of the zaibatsu family members represents a relative
minority—even in the case of this particular region. However, they undoubtedly stand at
the apex of the pyramid of the wealthy elite; in other words, they are at the uppermost
level of taxpayers. The top 10 in this region are almost exclusively family members
associated with the largest zaibatsu, Mitsui and Iwasaki (Mitsubishi), and their annual
instance, see Nakanishi Rihachi (ed.), Shōwa Senzenki Zaikai Jinmei Daijiten
(Biographical Dictionary of Businessmen in the Showa period: Tokyo, 1929;
re-published in 1993). For other materials generally regarded as reliable sources, see,
for instance, Zaikai Bukko Ketsubutsuden (Biography of the deceased distinguished
businessmen) 2 vols. (Tokyo, 1936).
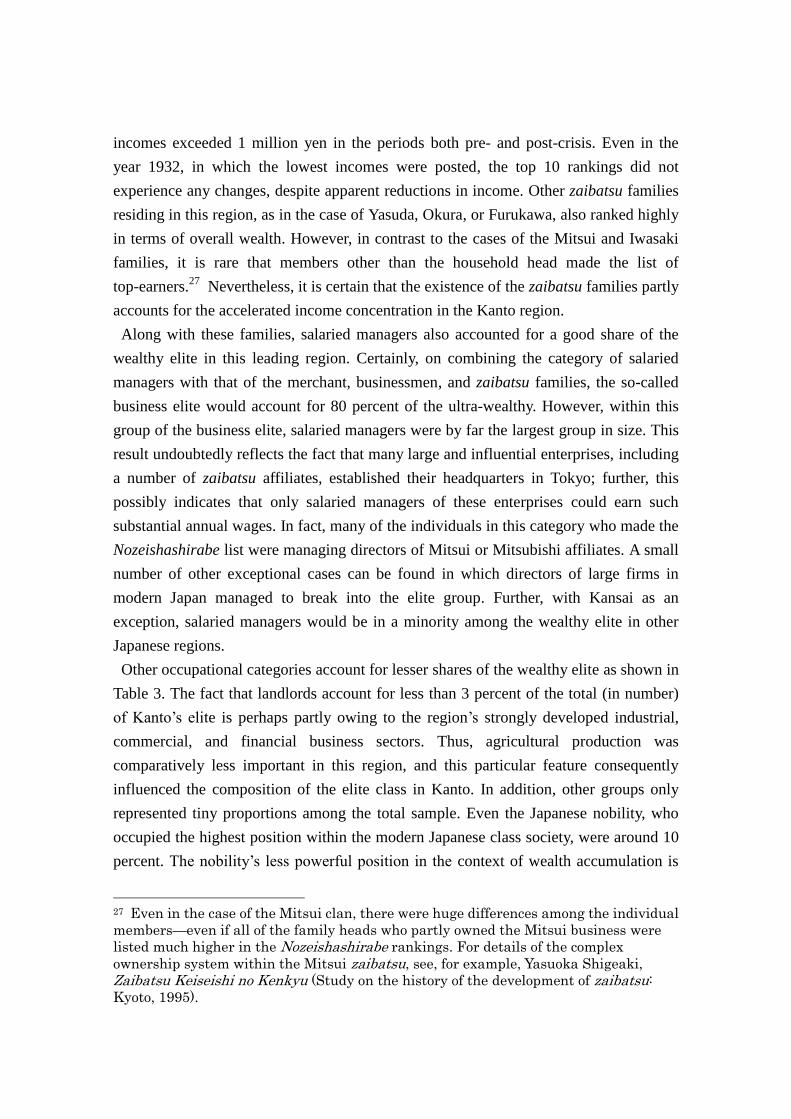
incomes exceeded 1 million yen in the periods both pre- and post-crisis. Even in the
year 1932, in which the lowest incomes were posted, the top 10 rankings did not
experience any changes, despite apparent reductions in income. Other zaibatsu families
residing in this region, as in the case of Yasuda, Okura, or Furukawa, also ranked highly
in terms of overall wealth. However, in contrast to the cases of the Mitsui and Iwasaki
families, it is rare that members other than the household head made the list of
top-earners.27
Nevertheless, it is certain that the existence of the zaibatsu families partly
accounts for the accelerated income concentration in the Kanto region.
Along with these families, salaried managers also accounted for a good share of the
wealthy elite in this leading region. Certainly, on combining the category of salaried
managers with that of the merchant, businessmen, and zaibatsu families, the so-called
business elite would account for 80 percent of the ultra-wealthy. However, within this
group of the business elite, salaried managers were by far the largest group in size. This
result undoubtedly reflects the fact that many large and influential enterprises, including
a number of zaibatsu affiliates, established their headquarters in Tokyo; further, this
possibly indicates that only salaried managers of these enterprises could earn such
substantial annual wages. In fact, many of the individuals in this category who made the
Nozeishashirabe list were managing directors of Mitsui or Mitsubishi affiliates. A small
number of other exceptional cases can be found in which directors of large firms in
modern Japan managed to break into the elite group. Further, with Kansai as an
exception, salaried managers would be in a minority among the wealthy elite in other
Japanese regions.
Other occupational categories account for lesser shares of the wealthy elite as shown in
Table 3. The fact that landlords account for less than 3 percent of the total (in number)
of Kanto’s elite is perhaps partly owing to the region’s strongly developed industrial,
commercial, and financial business sectors. Thus, agricultural production was
comparatively less important in this region, and this particular feature consequently
influenced the composition of the elite class in Kanto. In addition, other groups only
represented tiny proportions among the total sample. Even the Japanese nobility, who
occupied the highest position within the modern Japanese class society, were around 10
percent. The nobility’s less powerful position in the context of wealth accumulation is
27 Even in the case of the Mitsui clan, there were huge differences among the individual
members—even if all of the family heads who partly owned the Mitsui business were
listed much higher in the Nozeishashirabe rankings. For details of the complex
ownership system within the Mitsui zaibatsu, see, for example, Yasuoka Shigeaki,
Zaibatsu Keiseishi no Kenkyu (Study on the history of the development of zaibatsu:
Kyoto, 1995).
partly owing to their economic vulnerability beginning in the modern period.28
Characteristics and differences in income structure
In this part, the elites’ income is decomposed into six categories in line with the
categorizations provided by Nozeishashirabe.29
Although the data utilized for the
detailed analysis were taken from a period marked by large economic fluctuations, there
were almost no significant changes in general trends and characteristics of income
structure as displayed in Table 4.
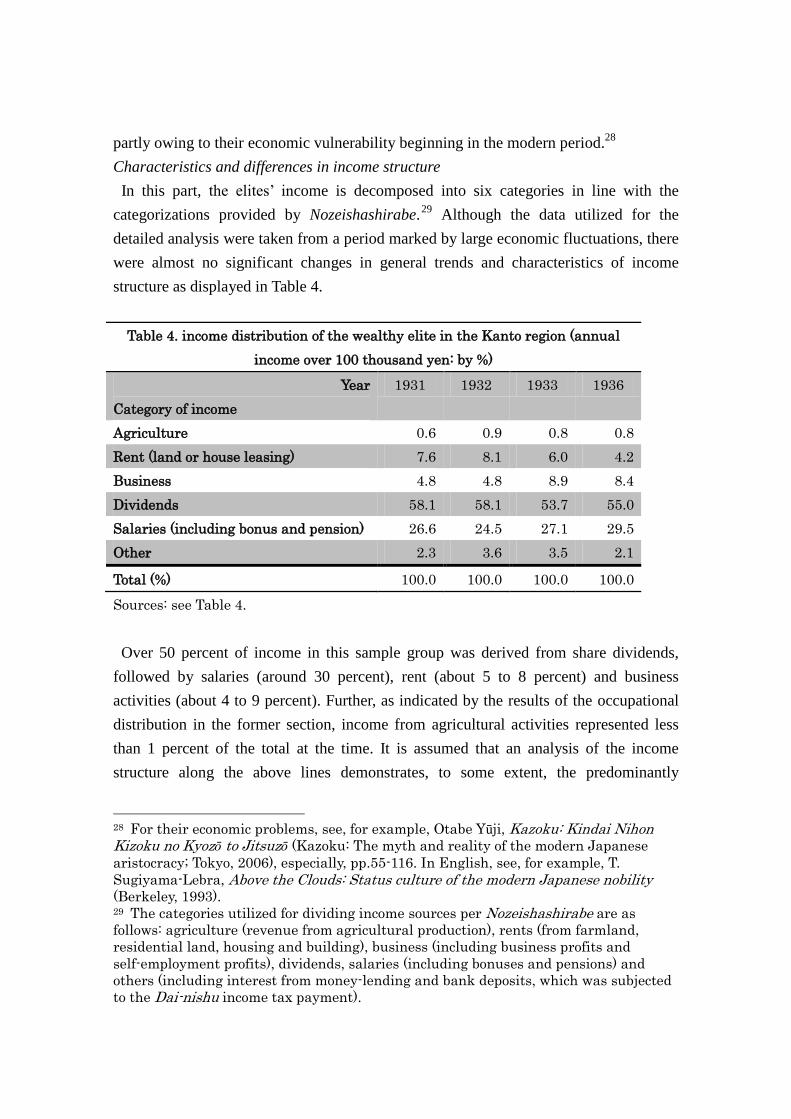
Table 4. income distribution of the wealthy elite in the Kanto region (annual
income over 100 thousand yen: by %)
Year
Category of income
1931 1932 1933 1936
Agriculture 0.6 0.9 0.8 0.8
Rent (land or house leasing) 7.6 8.1 6.0 4.2
Business 4.8 4.8 8.9 8.4
Dividends 58.1 58.1 53.7 55.0
Salaries (including bonus and pension) 26.6 24.5 27.1 29.5
Other 2.3 3.6 3.5 2.1
Total (%) 100.0 100.0 100.0 100.0
Sources: see Table 4.
Over 50 percent of income in this sample group was derived from share dividends,
followed by salaries (around 30 percent), rent (about 5 to 8 percent) and business
activities (about 4 to 9 percent). Further, as indicated by the results of the occupational
distribution in the former section, income from agricultural activities represented less
than 1 percent of the total at the time. It is assumed that an analysis of the income
structure along the above lines demonstrates, to some extent, the predominantly
28 For their economic problems, see, for example, Otabe Yūji, Kazoku: Kindai Nihon Kizoku no Kyozō to Jitsuzō (Kazoku: The myth and reality of the modern Japanese
aristocracy; Tokyo, 2006), especially, pp.55-116. In English, see, for example, T.
Sugiyama-Lebra, Above the Clouds: Status culture of the modern Japanese nobility
(Berkeley, 1993). 29 The categories utilized for dividing income sources per Nozeishashirabe are as
follows: agriculture (revenue from agricultural production), rents (from farmland,
residential land, housing and building), business (including business profits and
self-employment profits), dividends, salaries (including bonuses and pensions) and
others (including interest from money-lending and bank deposits, which was subjected
to the Dai-nishu income tax payment).
business-oriented characteristic of the wealthy elite in Kanto. However, from the
standpoint of general trends, it is certain that the individuals who formed part of this
elite group did not rely on one particular income source and tended to display
diversification in their wealth management. In addition, even if certain income
reductions were apparent in a certain year, for example in 1932, the income structure of
this sample group did not experience significant changes throughout the period.
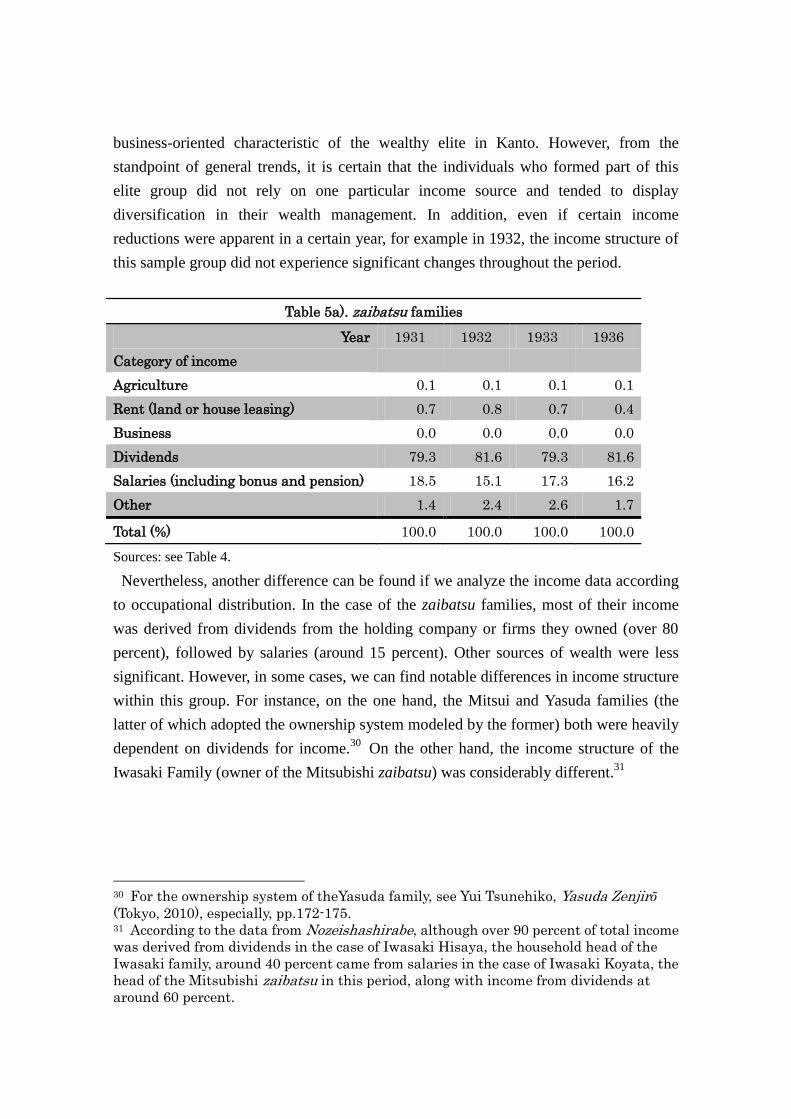
Table 5a). zaibatsu families
Year
Category of income
1931 1932 1933 1936
Agriculture 0.1 0.1 0.1 0.1
Rent (land or house leasing) 0.7 0.8 0.7 0.4
Business 0.0 0.0 0.0 0.0
Dividends 79.3 81.6 79.3 81.6
Salaries (including bonus and pension) 18.5 15.1 17.3 16.2
Other 1.4 2.4 2.6 1.7
Total (%) 100.0 100.0 100.0 100.0
Sources: see Table 4.
Nevertheless, another difference can be found if we analyze the income data according
to occupational distribution. In the case of the zaibatsu families, most of their income
was derived from dividends from the holding company or firms they owned (over 80
percent), followed by salaries (around 15 percent). Other sources of wealth were less
significant. However, in some cases, we can find notable differences in income structure
within this group. For instance, on the one hand, the Mitsui and Yasuda families (the
latter of which adopted the ownership system modeled by the former) both were heavily
dependent on dividends for income.30
On the other hand, the income structure of the
Iwasaki Family (owner of the Mitsubishi zaibatsu) was considerably different.31
30 For the ownership system of theYasuda family, see Yui Tsunehiko, Yasuda Zenjirō
(Tokyo, 2010), especially, pp.172-175. 31 According to the data from Nozeishashirabe, although over 90 percent of total income
was derived from dividends in the case of Iwasaki Hisaya, the household head of the
Iwasaki family, around 40 percent came from salaries in the case of Iwasaki Koyata, the
head of the Mitsubishi zaibatsu in this period, along with income from dividends at
around 60 percent.
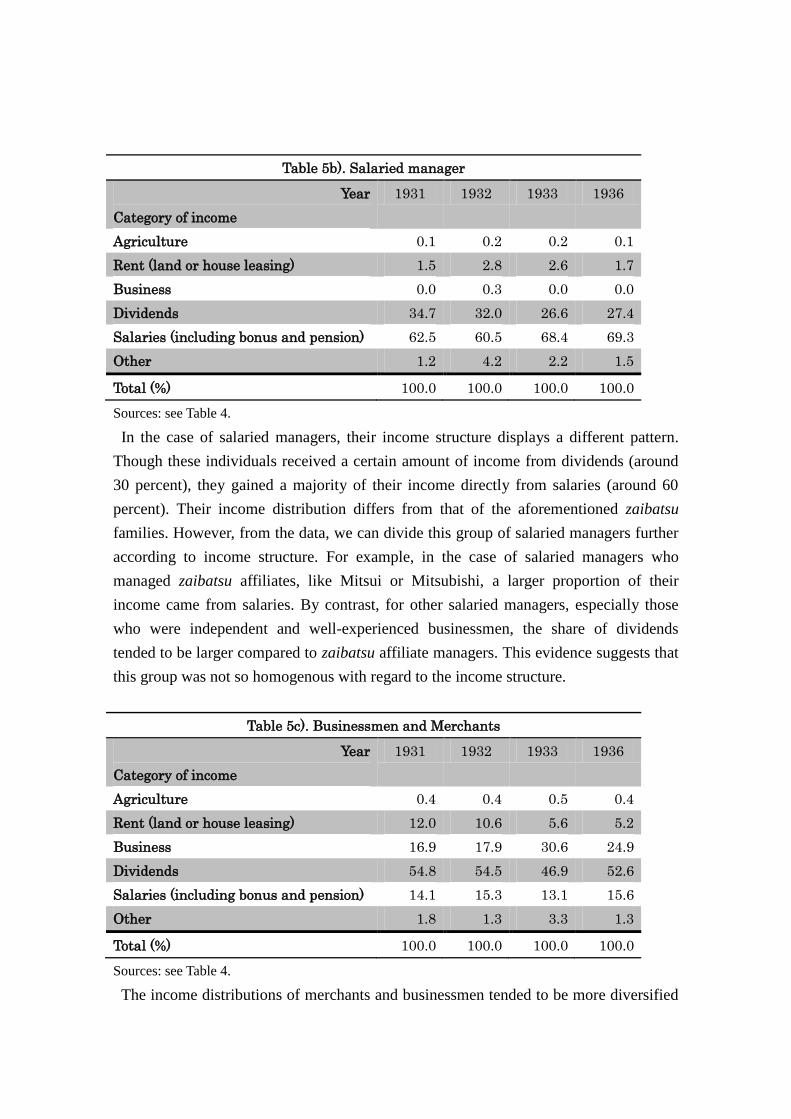
Table 5b). Salaried manager
Year
Category of income
1931 1932 1933 1936
Agriculture 0.1 0.2 0.2 0.1
Rent (land or house leasing) 1.5 2.8 2.6 1.7
Business 0.0 0.3 0.0 0.0
Dividends 34.7 32.0 26.6 27.4
Salaries (including bonus and pension) 62.5 60.5 68.4 69.3
Other 1.2 4.2 2.2 1.5
Total (%) 100.0 100.0 100.0 100.0
Sources: see Table 4.
In the case of salaried managers, their income structure displays a different pattern.
Though these individuals received a certain amount of income from dividends (around
30 percent), they gained a majority of their income directly from salaries (around 60
percent). Their income distribution differs from that of the aforementioned zaibatsu
families. However, from the data, we can divide this group of salaried managers further
according to income structure. For example, in the case of salaried managers who
managed zaibatsu affiliates, like Mitsui or Mitsubishi, a larger proportion of their
income came from salaries. By contrast, for other salaried managers, especially those
who were independent and well-experienced businessmen, the share of dividends
tended to be larger compared to zaibatsu affiliate managers. This evidence suggests that
this group was not so homogenous with regard to the income structure.
Table 5c). Businessmen and Merchants
Year
Category of income
1931 1932 1933 1936
Agriculture 0.4 0.4 0.5 0.4
Rent (land or house leasing) 12.0 10.6 5.6 5.2
Business 16.9 17.9 30.6 24.9
Dividends 54.8 54.5 46.9 52.6
Salaries (including bonus and pension) 14.1 15.3 13.1 15.6
Other 1.8 1.3 3.3 1.3
Total (%) 100.0 100.0 100.0 100.0
Sources: see Table 4.
The income distributions of merchants and businessmen tended to be more diversified
still. For this category, there was a marked dependence on income from dividends
(around 60 percent) compared to salaries (about 13 to 15 percent) and other sources of
income. The higher proportion of income from dividends was possibly caused by
several factors. First, there was a strong tendency that business ownership and
investment was heavily concentrated among individual shareholders, in particular,
among those from the wealthy business elite group.32
Second, since many companies
established in the modern period distributed a large amount of their profits as
shareholder dividends, this policy plausibly accelerated investment even in the case of
wealthy merchants and businessmen, who formed part of the wealthy elite targeted by
this data analysis.33
However, it should be noted that if we focus on individual cases,
we could discover many exceptional findings. Several cases indicate a diversification of
assets into residential land or house holdings, along with business activities, the main
source of income; other cases show well-balanced earnings from business, dividends,
and salaries. Therefore, as in the case of salaried managers, the income structure of this
group was not homogenous but diversified.34
Concluding Remarks
In this paper, we attempted to analyze the income structure of the Japanese wealthy
elite from the late 1920s to the early 1930s, when Japan underwent serious economic
crises. Although this work is still in progress, and some parts of this paper need further
consideration, some remarks from the analysis bear further explanation by way of
conclusion.
From an inspection of the trends surrounding this particular group in such an extreme
period, as undertaken in the first section, it is clear that the wealthy elite in the Kanto
region occupied a unique position. Although the economic losses were relatively small
and recovery was swift nationwide for the ultra-wealthy elite considered in this paper,
the data suggests that the Kanto elite were indeed at the top nationally in terms of the
number of individuals in this category and their total income. This was owing to the
heavy concentration of the highest income earners in this region, in addition to the
32 For detailed analysis on this concentration, see, for example, Suzuki Tsuneo et Al.
(eds.), Kigyō Nettowāku no Keisei to Tenkai (Formation and development of networks of
businessmen in modern Japan: Nagoya, 2009). 33 For details, see, for example, Abe Takeshi and Miyamoto Matao “Meiji no Shisanka to
Kaisha Seido” (Wealth holders and the enterprise system in the Meiji period), in Abe
and Miyamoto (eds.), Keiei Kakushin to Kōgyōka: Nihon Keieishi vol.2 (Managerial
innovation and Industrialization: Japanese Business History vol.2; Tokyo, 1995). 34 For other occupational groups, which were relatively minor within the sample, and
which were not discussed in this section, individual cases varied greatly and were more
diversified.
prominent political and economic status of Tokyo the main city in the region. On
considering other data sources, the predominant position of Kanto also indicates the
likely expansion of wealth and income equality in this period.
In the context of income structure, revenues consisted primarily of earnings from
business activities, for instance, dividends or salaries; this, in turn, certainly influenced
the composition of the ultra-wealthy class, with a business elite a clear majority.
Moreover, dividing the sample group according to occupational categories illustrates the
clear distinction of income structure among different occupational groups that formed
characteristics of business activities and source of revenue of each category. However, it
should be noted that if we focus on the individual income structure of each category,
different structural characteristics, which are at odds with the general trend, might be
observed.
Finally, unanswered questions related to the subject of this paper remain. First, an
analysis on the elites’ survival—that is, whether the individuals listed in the
Nozeishashirabe maintained their status among the wealthy class in the long run—is
needed. Second, and related to the first question, it is necessary to examine kinship ties
within the sample groups to ascertain the level of income concentration among
individuals in a particular group. These, among other questions, would be important
subjects for future investigations.