Embed Size (px)
Citation preview

1
2014 Annual Monitoring Report – Permit No. VPA00579
Permit Holder: Weanack Land LLC -- February 13, 2015
Prepared By: W. Lee Daniels & Sara Koropchak, Virginia Tech
G. Richard Whittecar, ODU
Introduction and Permit History & Background
This report and associated maps, attachments and data sets comprise our Annual Monitoring Report for all work conducted in calendar year 2014 for ground and surface water monitoring, hydrogeologic modeling and beneficial use study requirements for VPA Permit No. VPA00579 for Weanack Land LTD LLC (Weanack) in Charles City County. The original monitoring plan was submitted to DEQ by American Land Concepts (ALC) in November, 2000, and focused on the Woodrow Wilson Bridge (WWB) sediment utilization area (Fig. 1). This approved monitoring plan served as the basis for our protocols and designs through mid-2004. On September 7, 2004, Virginia DEQ approved a modification to the monitoring plan as outlined below that reduced the number of water quality sampling points and frequency. Subsequently, in June 2005, DEQ approved further modifications to the permit and monitoring requirements to allow placement of a new source of dredge materials (Earle Naval Weapons Station - Earle) into a separate utilization basin as shown in Figure 2. In July of 2005, modifications to the Operations and Maintenance Manual (OMM) and Monitoring Plans for both utilization areas were approved by DEQ. Over time, the site originally designated as the Earle Basin has also received sediments from the Cheatham Annex on two occasions. In 2006, permit coordination and liaison responsibilities for this permit were transferred from ALC to Marshall Miller & Associates (now Cardno) with whom we have worked closely over the past seven years. Virginia Tech and Old Dominion University (ODU) continue to serve as subcontractors to Weanack to carry out monitoring and research as specified in the approved plans. A new and extensive revision to the VPA permit was approved by DEQ in December of 2012. In December 2014, DEQ PRO approved an additional modification of the VPA permit VPA00579 which was reissued on December 12, 2012. The modifications included revisions to the Source Monitoring Table, a reduction of parameters for ground water and surface water monitoring as well as annual monitoring of ground water and surface water. This report therefore reflects the 2012 revised water quality criteria for the April 2014 sampling event. However, future monitoring and reports will be based upon the December 12, 2014 modified criteria and requirements.

2
Over the 2014 monitoring year, we continued limited monitoring of a project installed in 2007 by Virginia Tech in cooperation with Science Applications International Corporation (SAIC) and the Norfolk District of the U.S. Army Corps of Engineers. This project is a small (35 x 120 feet) dredge sediment field experiment adjacent to the Earle Basin that is known as the Landfarm Pilot Study (LPS). The SAIC/LPS study plan was approved on 7/25/07 to assess the ability of surfactants plus an added microbial consortium to degrade moderately contaminated (with PAH’s) sediments from the nearby Appomattox River. A separate and detailed report on that project was submitted to USCOE and DEQ by SAIC in 2010. We did not sample the LPS in 2014, but vegetation and external berms were maintained. We have also continued monitoring an experiment involving potentially acid forming materials from the Maryland Ports Administration (MPA) located between the LPS research cells and the Earle basin. Detailed information on the installation of this experiment is available in the 2010 annual report. On September 18, 2014, Weanack received approval from DEQ PRO for upland placement of freshwater dredge material from the City of Alexandria City Marina maintenance dredging project in the Potomac River. During December, three barges containing a total of 6,450 cubic yards of dredge material from the maintenance dredging of the City of Alexandria City Marina was placed in the Woodrow Wilson Basin (WWB). Monthly reports for this permit have been compiled by Charles (Chee) Saunders and we gratefully acknowledge his assistance in our monitoring efforts. The description of agronomic practices contained in this report is based upon input from Charles Carter III of Weanack LLC. We certify under penalty of law that this document and all attachments were prepared under our direction or supervision in accordance with a system designed to assure that qualified personnel properly gather and evaluate the information submitted. Based on our inquiry of the person or persons who manage the system, or those persons directly responsible for gathering the information, the information is, to the best of our knowledge and belief, true, accurate, and complete. We are aware that there are significant penalties for submitting false information, including the possibility of fine and imprisonment for knowing violations.

3
Figure 1. Map of basin location and monitoring wells around the Woodrow Wilson Bridge (WWB) sediments discussed in this report. The Shirley Plantation (SP) drinking well in the NW corner of the map was also sampled but is not shown. The dashed line corresponds to a local terrace scarp which defines the base of older river sediments to the West. Please note that this map shows all wells installed over time at the WWB Basin and certain wells are not currently sampled. Monitoring locations are detailed below.
4
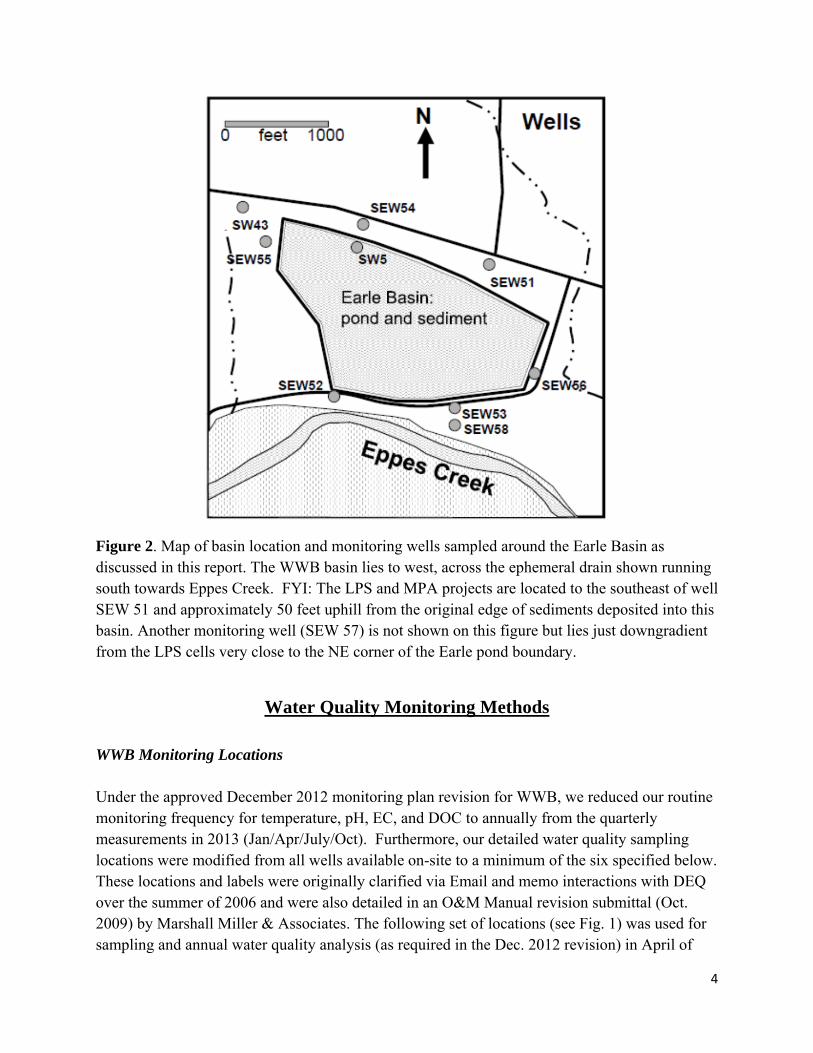
Figure 2. Map of basin location and monitoring wells sampled around the Earle Basin as discussed in this report. The WWB basin lies to west, across the ephemeral drain shown running south towards Eppes Creek. FYI: The LPS and MPA projects are located to the southeast of well SEW 51 and approximately 50 feet uphill from the original edge of sediments deposited into this basin. Another monitoring well (SEW 57) is not shown on this figure but lies just downgradient from the LPS cells very close to the NE corner of the Earle pond boundary.
Water Quality Monitoring Methods
WWB Monitoring Locations Under the approved December 2012 monitoring plan revision for WWB, we reduced our routine monitoring frequency for temperature, pH, EC, and DOC to annually from the quarterly measurements in 2013 (Jan/Apr/July/Oct). Furthermore, our detailed water quality sampling locations were modified from all wells available on-site to a minimum of the six specified below. These locations and labels were originally clarified via Email and memo interactions with DEQ over the summer of 2006 and were also detailed in an O&M Manual revision submittal (Oct. 2009) by Marshall Miller & Associates. The following set of locations (see Fig. 1) was used for sampling and annual water quality analysis (as required in the Dec. 2012 revision) in April of

5
2014. Water quality samples from the April sampling event were analyzed by Air, Water & Soil Laboratories (AWS) of Richmond. Upgradient groundwater wells: SDS 3 and SW 43 Downgradient groundwater wells: SW 30 and SW 31 Surface water: SW2 has been sampled over time from the continuous water body present within the dikes (SSG3 is the staff gage reading in that pond). The old mining slimes pond to the south of the WWB basin has been dry for the vast majority of sampling dates since 2005, and therefore reporting on that location (SSG 2/SW 3) was discontinued.
Owner’s drinking well: SP-well (reported with Earle well array in this report).
Earle Monitoring Locations
Procedures and rationale for the location, installation and sampling of the primary water quality monitoring points for the Earle Basin were included in the 2005 permit revision materials, the 2006 annual report and the October 2009 revisions to the O&M Manual. The following set of locations (see Fig. 2) was used for sampling and annual water quality analysis in April of 2014.
Upgradient groundwater wells: SEW 51 and SEW 54
Downgradient groundwater wells: SEW 52, SEW 53 and SEW 58
Surface water: SW 5 is sampled from within the Earle Basin ponded portion (Figure 2).
We began conducting routine annual monitoring in April 2014, after quarterly monitoring (Jan/Apr/July/Oct) in 2013 of wells around the WWB and Earle Basin sites for water level, pH, conductivity, temperature, and DOC. Monitoring parameters for the April 2014 water quality sampling were specified in the December 2012 permit revision and differ in many ways from the older “partial suite” and “full suite” parameters that were applied differentially to the WWB and Earle Basin water quality monitoring schedules. As per the revisions of the December 2012 permit, approved in December 2014, sampling frequency for the water quality analysis was decreased to once a year for all primary locations and future monitoring will test for a reduced list of parameters.
Inadvertently, a sample for contaminant analysis was not collected from well SEW 58 during the April 2014 sampling period, so a sample was collected from this well in January 2015 to ensure the annual sampling took place at all wells. This sample was analyzed for the same full set of criteria used on the samples collected April 2014 (e.g. the December 2012 list).

6
Well Maintenance and Hydrogeologic Analyses
Virginia Tech and ODU maintained the well sites around the existing basin containing the Woodrow Wilson Bridge (WWB) and Earle Basin sediments. We conducted routine monitoring of wells and ponds around the WWB and Earle Basin sites for water levels, pH, conductivity, temperature, and DOC on April 26, 2014. We collected water samples around both the Earle and WWB basins for prescribed comprehensive water quality analyses on April 26, 2014. Water flow analyses for the two basins are combined on one map (see Fig. 3) due to the close proximity of the basins. This more comprehensive view gives a larger perspective of the relationships of water flow through this topographically and stratigraphically complex setting.
Woodrow Wilson Bridge Site
Relatively wet conditions during the winter and spring months of 2014 caused water levels in the pond inside of the WWB berm (measured at SSG3) to be as much as 3 feet higher than during most of 2013. Pond levels are maintained by a combination of direct precipitation and groundwater inflow from the sediment mound deposited in the western end of the disposal area. Analyses of water flow direction for the WWB disposal site shown in Figure 3 indicate no important change in flow directions from previous analyses. As is usual, minor changes were observed over time and over short distances. Shallow wells and wells close to storm water drainage ditches proved to be the most responsive to rainfall events, being the most likely to rise after one of the few rain showers. The close relationship between the shape of the berm and groundwater contours reflects the permeable connection between the fill sediments, the pond, and surrounding aquifer. Variations in hydraulic conductivity of these permeable sediments over short distances cause the locally steep gradients in the water table.
7
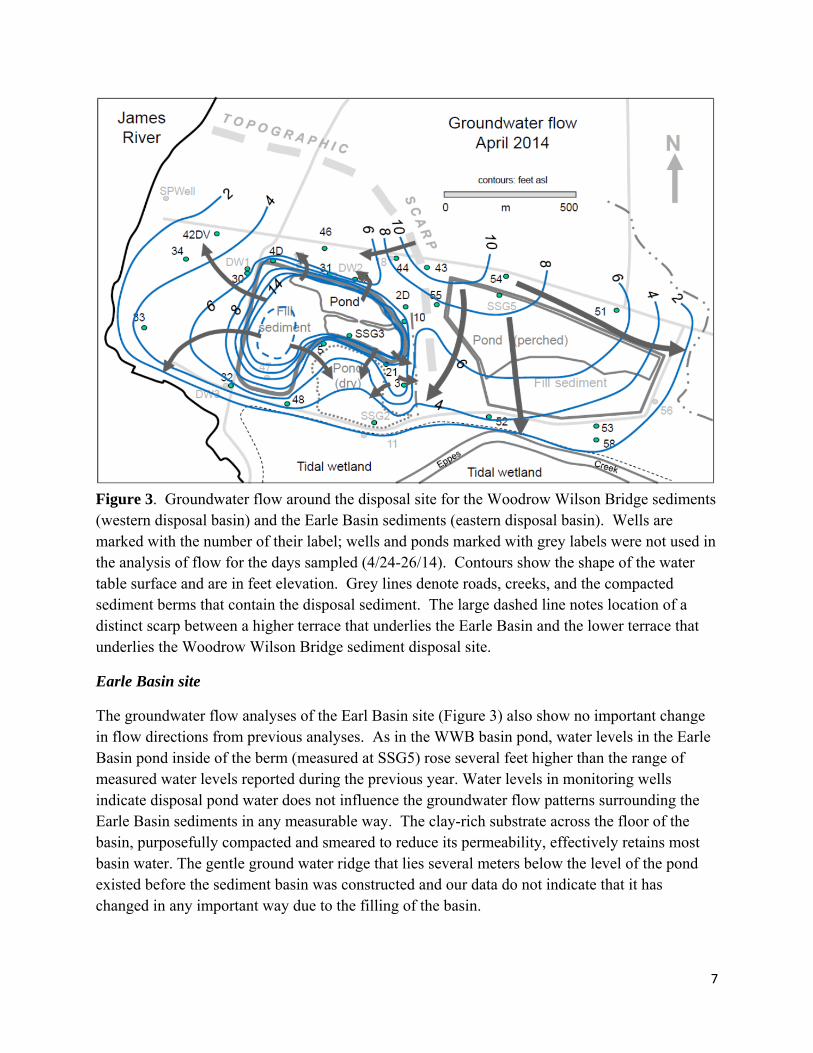
Figure 3. Groundwater flow around the disposal site for the Woodrow Wilson Bridge sediments (western disposal basin) and the Earle Basin sediments (eastern disposal basin). Wells are marked with the number of their label; wells and ponds marked with grey labels were not used in the analysis of flow for the days sampled (4/24-26/14). Contours show the shape of the water table surface and are in feet elevation. Grey lines denote roads, creeks, and the compacted sediment berms that contain the disposal sediment. The large dashed line notes location of a distinct scarp between a higher terrace that underlies the Earle Basin and the lower terrace that underlies the Woodrow Wilson Bridge sediment disposal site.
Earle Basin site
The groundwater flow analyses of the Earl Basin site (Figure 3) also show no important change in flow directions from previous analyses. As in the WWB basin pond, water levels in the Earle Basin pond inside of the berm (measured at SSG5) rose several feet higher than the range of measured water levels reported during the previous year. Water levels in monitoring wells indicate disposal pond water does not influence the groundwater flow patterns surrounding the Earle Basin sediments in any measurable way. The clay-rich substrate across the floor of the basin, purposefully compacted and smeared to reduce its permeability, effectively retains most basin water. The gentle ground water ridge that lies several meters below the level of the pond existed before the sediment basin was constructed and our data do not indicate that it has changed in any important way due to the filling of the basin.

8
Detailed Water Quality Results for 2014
The monitoring wells around the WWB and Earle Basins were sampled quarterly in 2013 and annually in 2014 for water level, temperature, pH, EC and DOC. Data are presented in Attachment 1.
Woodrow Wilson Bridge Basin
Field tests of pH, EC and temperature in monitoring wells around the WWB site produced values that were similar to past readings. The two exceptions were from the two down-gradient wells – SW30 and SW31. Both of these showed significant decreases in EC to levels lower than those measured in 2013. As reported last year, in 2013 a moderate volume of acid-forming construction sediments was placed into the eastern portion of the WWB site and immediately limed and flooded per our prescriptions. However, the short period of “dry exposure” in the late summer of 2013 led to an increase in EC levels which subsequently dropped again in 2014, as expected. Because the WWB basin is not lined and stored sediments are in direct contact with the shallow surficial aquifer being monitored, the rapid response and decline of these wells following addition of the new sediments is not surprising. The detailed water quality data for the April 2014 sampling (Attachment 2) revealed no significant levels of concern for any parameters analyzed and no obvious changes from previous year results. The only parameters that continue to show a significant influence of the weathering dredge materials (via differential analysis of up- vs. down-gradient) wells are sulfate and TDS as discussed in previous reports. The downgradient levels remain moderate, however. Earle Basin
The water pH and conductivity readings for most of the monitoring wells around the Earle Basin are values typical for groundwater in this hydrogeologic setting. The water in the Earle Basin sediment retention basin is brackish, reflecting the pore water quality of the estuarine sediments placed in the basin. Fluctuations in pH and EC values also reflect the influence of rainfall events within a few days of sampling times, as well as the dry conditions during much of the year. The conductivity values for SEW 53 and SEW 58- down-gradient monitoring wells southeast of the disposal area – continued to be elevated during the year. From July 2007 to April 2014
values at SEW53 rose from relatively stable values of approximately 300 S to 6910 S. From
July 2011 to October 2013, EC values at SEW 58 rose from approximately 450 S to over 850,
S but by April 2014 had dropped to 704 S. SEW 53 sits 25 m directly south of the berm around the Earle basin; SEW58 is approximately 50 m down-gradient of SEW 53. The trends in data from these wells suggest that brackish seepage water from the basin has formed a salinity plume extending at least as far as Well 58. The cause of the apparent 2014 decline in SEW 58 is unclear, in part because the land around that well was cleared of mature woods to become a

9
plowed field; the presumed increase of groundwater recharge in that field due to the loss of the trees may be the cause of the lower conductivity values. Conductivity readings during 2014 (152
S) in SEW 52, the other clearly down-gradient well, are still within the range of values
measured at that well since 2007 (131-250S). As reported in reports for the past several years, the dike/berm wall immediately upgradient from SEW 53 (see Fig. 4) was repaired in late 2012 and we assume that some influence of that will be noted at some point in time. Other than parameters related to potential salinity effects (e.g. chloride, sulfate, TDS, EC) at SEW 53 and 58, the detailed water quality data for the April 2014 sampling (Attachment 2) revealed no significant levels of concern for any parameters analyzed and no obvious changes from previous year results with the exception of Fe, which appeared higher (several > 100 mg/L) at most of the Earle sampling locations vs. previous years. However, similarly high levels were also noted in wells SEW 51 and SW 43 which are clearly upgradient of the Earle and WWB sites, respectively. As reported in previous years, the underlying Shirley Formation is sulfidic and periodically high Fe values have been noted in a number of wells around both basins in past years.
MPA Study Plots
In November 2009, 150 cubic yards of dredge material were transported from the Cox Creek Facility of the Maryland Ports Authority to Port Tobacco, Weanack in Charles City, VA. Samples of the delivered dredge sediment were analyzed and it was determined that 12.5 tons of CaCO3 were needed to treat each 1000 tons of material (125% of the predicted acid-forming potential). Because of the predicted acid-forming nature of the sediment, the primary concern was to control the acidity of the sediment to minimize leaching of metals such as Fe and Mn. In May 2010, three research cells were constructed to determine whether bulk-blending or layering agricultural limestone with the acid-forming sediments was more effective in reducing acidity and leaching of metals (primarily Mn and Fe).
Before dredge placement, three zero-tension lysimeters were installed at -75 cm to allow the sampling of downward percolating waters leaching through the sediment. Research cells were lined with a compacted clay liner and all drain into a catchment tank to control the release of leachate into the Earle Basin. The first cell received untreated dredge material to serve as a control, the second was blended with 381 kg of agricultural lime before placement, and the third was placed with 6 alternating layers of lime and dredge sediment as it was placed. Here we present water quality results after five years.

10
Figure 4. Image of the repaired berm wall (on left) just to the north of well SEW 53 taken in late 2012. This view is to the west. Well SEW 53 is to the immediate left (south) of this image. The light colored soil materials in the middle of image are the higher clay materials utilized to reconstruct the berm. The former gravel bedded road extended to the right (north) of the ponded area. The area in the mid-background is the middle section of the Earle basin which was successfully established to winter wheat. The excavator working in the far background is on the eastern edge of the section where placement of the Cheatham dredge materials began in December, 2012.
2014 MPA Leachate Data
Rainfall was fairly limited in the summer and fall of 2014, and so we only sampled three times over the year. Overall, pH was affected by an interaction between sample date and liming treatment (p < 0.001; Fig. 5). The layered treatment increased in pH over time, and was the only treatment in which pH differed among sampling dates. For the two later sampling events, pH was highest in the layered lime treatment, though the layered lime and blended lime treatments did not differ in June.

11
Date
Dec/13 Feb/14 Apr/14 Jun/14 Aug/14 Oct/14 Dec/14
pH
3
4
5
6
7
8
ControlBlended limeLayered lime
y
a
ay
b
b
ax
b
Collection date * liming treatment p < 0.001
Figure 5. Leachate pH of the control and two liming treatments for all sampling dates in 2014. Error bars represent standard deviation. Letters a-b represent significant differences among treatments within one sampling date. Letters x-y represent significant differences among sampling dates within one treatment.
Although on average the layered lime treatment has the highest pH, the large standard deviation within this treatment, compared to the control and blended lime treatments, shows the unpredictable behavior of the layered liming treatment within acid-forming dredge material.
Electrical conductivity (EC) decreased through 2013, but did not decrease over 2014. The layered treatment continues to have the highest EC (p = 0.015) compared to the blended liming treatment, though the control treatment did not differ from either of the liming treatments in 2014. It is important to note that leachate EC levels are still fairly high (all > 2.0 mS cm-1 and the layered lime treatment usually > 4.0 mS cm-1), although salt tolerant species, such as weeping lovegrass, have successfully established on these sulfidic soil materials.

12
Date
Dec/13 Feb/14 Apr/14 Jun/14 Aug/14 Oct/14 Dec/14
EC
(m
S c
m-1
)
1
2
3
4
5
6
ControlBlended limeLayered lime
Liming treatment p = 0.015
b
a
ab
Figure 6. Electrical conductivity in the control and two liming treatments in 2014. Error bars represent one standard error above and below the mean. Letters a-b represent significant differences among treatments within one sampling date.
The leachate from the blended treatment consistently had the lowest concentrations of Fe and Mn, and mean concentrations were within acceptable levels for release of water (Fe < 3.0 mg L-1, Mn < 3.5 mg L-1). With the exception of one of the layered lime lysimeters which had Fe levels at least 14 times higher than the limit in almost every sample, the leachate from the control and layered treatments had low levels of Fe in every sample (< 2 mg L-1). The leachate from the control and layered treatments had high, but erratic concentrations of manganese (34.85 – 81.04 mg L-1 in control treatment, 20.08 – 89.33 mg L-1 in layered lime treatment; Table 1). Moreover, Mn in the layered liming treatment is only marginally lower than the control treatment, showing that this liming treatment is ineffective at reducing Mn leaching.
Overall, the combined water quality data collected by the zero tension lysimeters (which mimic net leaching to local groundwater) continue to indicate that bulk-blending of lime is (a) superior to layering lime with acid-forming materials and (b) is essential for protecting long-term groundwater quality pH and metal levels.

13
Table 1. Mean concentrations ± standard deviations of iron and manganese from zero-tension lysimeter waters under the three treatments in 2014.
Fe (mg L-1) Mn (mg L-1) Control 0.18 ± 0.13 57.88 ± 15.20 Blended 0.30 ± 0.46 0.94 ± 1.07 Layered 11.30 ± 21.41 43.21 ± 24.14
MPA Storage Tank Releases in 2014
The permit modification that allowed for the MPA requires that the leachates from the MPA cells are captured in a holding tank and treated to achieve a pH between 6.5 and 8.5, iron <3.0 mg L-1, and manganese <3.5 mg L-1 before release over the surface of the Earle Basin sediments. The water in the MPA storage tank tends to be acidic and very high in Mn (>80 mg L-1) when it leaves the MPA research cells, particularly from the control cell. Weanack’s lime treatment protocol to date has been to raise the tank pH to ≥10 which quickly generates very low levels (<0.1 mg L-1) of Fe and Mn in solution. However, Weanack is then required to re-acidify the water (using commercial grade muriatic acid) to pH 8.5 or less to meet the release criteria. This allows Mn to resolubilize to some extent from the sludge in the tank bottom and this behavior makes it very difficult for Weanack to meet the Mn release criteria. Mr. Carter has alleviated some of the problems associated with pH adjustment by pumping the overflow leachate into a secondary tank so that it can be isolated from additional leachate exiting the cells and adjusted more easily. When we collect lysimeter samples, we also collect samples from the storage tank. With the addition of a secondary tank of treated leachate, we now collect samples from both the treated and untreated leachate. A summary of collection results corresponding to the reported (by Cardno monthly reports) tank releases is presented in Table 2. The water entering the tank continues to be rather acidic and high in Fe and Mn. Despite the initial difficulties adjusting the tank pH, the applications of lime and muriatic acid have become fine-tuned and have minimized concentrations of Mn (< 3.5 mg L-1) and iron (<3.0 mg L-1). Table 2. Water quality data for the MPA storage tank and volumes of leachate released into the Earle Basin.
Date pH Fe (mg L-1) Mn (mg L-1) Release
2/1/14 8.5 <0.005 0.0181 3125 gallons 7/5/2014 7.92 0.2429 2.0621 2400 gallons 10/25/14 8.57 1.1421 0.8754 950 gallons
14
Dredge Sediment Placement Activities Placement of dredge sediment from the City of Alexandria City Marina into the Woodrow Wilson Basin began in mid-December and 6,450 yd3 were placed as of December 31, 2014. This material was approved by DEQ PRO on September 18, 2014. Upon completion of the project in 2015, the total volume of dredge sediment will be approximately 22,000 yd3. Prior to placement, the material was tested for potential pollutants, nutrients and other parameters of agronomic concern and screened using the Virginia Tech dredge analysis template. The full pre-dredging dataset of analyte concentrations as provided by URS Corporation in May 2014 can be found in Attachment 4. All parameters clearly met our “clean fill” criteria except for several SVOCs. However, those parameters were reported out by their analytical lab at less than their respective reporting levels (RLs) and even with that arbitrary reporting convention were still well below our permit exclusion criteria for placement. During dredging, which is ongoing, an additional composite was collected and will be sent to AWS to test for all potential contaminants and the material will be screened by our screening template criteria to reconfirm that it is “clean fill”. Additionally, samples will be analyzed in our labs at Virginia Tech for a few other parameters including total sulfur, pH, EC, and calcium carbonate equivalency (CCE) to determine if the material requires any additional liming.
Summary of Agronomic Practices by Placement Site
Woodrow Wilson Basin: Winter wheat yields in June 2014 were in excess of 75 bu/ac, but that was considered a relatively poor yield for the field given its history. The relatively lower yield is attributed to an excessively thick 2013 post-harvest corn stubble making no-till planting difficult (reduced seed-soil contact) and excessive goose damage. National and Virginia averages for winter wheat are 62-65 bu/ac. Native (un-mined, un-disturbed) Pamunkey soils typically yield 70-75 bu/ac as they did locally here in 2014.
Double crop soybeans yielded 57 bu/ac and were limited by lower summer rainfall locally after early July. National and Virginia averages for soybeans are 42-45 bu/ac.
WWB has not needed lime until this year when the pH of the surface 6” of soil dropped below 6.3. Fertilization is and has been to soil lab recommendations. Earle Basin: Winter wheat planted in late 2013 in Cell 2 (4 cells total) yielded 77 bu/ac in June 2014 (Figure 7). Weanack subsequently planted salt-excluder soybeans in late June 2014 in Cell 2 which produced 44.5 bu/ac (by combine monitor). This was 7 bu/ac more than the ‘standard’ soybeans in a test strip in running from highest to lowest elevation in the middle of Cell 2.

15
In early November 2014, Weanack planted winter wheat into Cells 1, 2 & 3 and vegetative progress looks very good, even on Cell 1 (where Cheatham dredge was placed in 2012/2013). Multiple bush-hogging and tillage events were required in cells 1 & 3 prior to planting due to heavy vegetative/weed growth. Fertilizer & lime were applied in 2014 as per Virginia Tech Extension Soil Testing Lab recommendations. Herbivory of the wheat by geese appears to be the largest threat to vegetative growth at the present time (Feb. 2015). For 2015, after harvesting wheat, Mr. Carter will plant salt-excluder soybeans in late June in Cells 1, 2 & 3. The Cheatham material placed in 2012 dried down adequately in 2013 (a very wet summer) and was planted in late 2014 with its first crop. The second half of 2014 (after mid-July) was relatively dry and helped pre-plant tillage operations. Prior to late 2014, attempts to get onto the surface were limited by a thin crust and fairly flat surface. Dry weather, ditching the surface and wide track equipment finally made it possible by the late fall. Even so, only 75% of Cell 1 was planted. It is anticipated that 90-100% will be planted in late 2015.
Figure 7. Aerial image of the Earle Basin showing the four separate cells (Google Earth 2012). The LPS and MPA plots are visible just to the NE of Cell 3.
The Polofield: (2012 placement of Honeywell Intake dredged material under their VWP)
Winter wheat yields on the placement material on the North side of the polofield (west of WWB) yields were once again in the 85 bu/ac range as estimated by the combine monitor. The middle segment of the polofield, which contains no dredged sediment and is composed mostly of clayey

16
spoil left over from mining in the 1960s, yielded 53 bu/ac. The sandy spoil segment on the Southern side of the polofield yielded 37 bu/ac (excluding areas un-harvested due to crop failure of about 10% of the total segment). Soybeans yielded 52, 36 and 27 bu/ac across the Northern, Middle and Southern segments, respectively. Fertilization is and has been to Virginia Tech Extension Soil Testing Lab recommendations. Summary of Agronomic Practices and Expectations: Overall, the dredged sediments once again matched or exceeded the yield potentials of some of the most productive soil in the state, as well as the National and State averages. This occurred despite reduced rainfall in the second half of 2014, difficulties with planting into crop residues, and goose damage. However, the improved yield of the WWB dredged material when compared with productive local native soils is not as dramatic as the doubling or tripling of yields when compared to the previously sand & gravel mined sites that previously existed under that location. Dredged sediments continue to improve and develop into agriculturally productive soils. It also seems reasonable to expect the saline materials in the Earle Basin cells to increase yields for the near term as the soils develop further and salinity in the upper soil layers (root zone) declines in the soil profile. The ability to remove the improved sediments from the basins at some point in the future for placement on native farm fields could improve the overall productivity of the farm. The native fields have areas of lower productivity where topsoil has eroded over the past 400 years down to the clayey subsoil which would be enhanced by a layer of higher-producing sediment. Combine monitor yield measurement taken across native fields show considerable variability along a given transect. Typically, areas of erosion, changes in soil types, elevation changes, field edges, and other differences are revealed by the yield monitor as producing less than the field average. Amending these low-output areas with higher-quality dredged sediments from a basin or project could boost the total yield of a field considerably. A future demonstration of dredge sediment amendment to low productivity native soil is recommended to study depth of amendment needed, salinity, underlying native soil characteristics, elutriates, runoff potential, before- and after-amendment productivity, and other factors.
Summary and Conclusions
Overall, we continue to observe no significant short- or long-term impacts of dredge material placement into either the WWB or Earle Basin on overall water quality with respect to metals, organics, nutrients, pH etc. That being said, the elevated EC levels observed in SEW 53 (outside of the Earle Basin berm) over the past three years, and to a much more limited extent in SEW 58 (further downgradient), continues to indicate that saline groundwater did locally migrate out of

17
that basin for some period of time. Remedial corrective measures were applied in 2012 and it will apparently take several more years of monitoring to accurately assess their effectiveness.
In 2013, we noted an increase in EC and sulfate levels in two downgradient wells for the WWB basin, but that response was clearly due to unintended consequences of the import of moderately sulfidic construction sediments and the EC and sulfate levels dropped back down again as expected in 2014. In 2014, we also noted higher levels of Fe at a number of locations around the Earle Basin, but similarly high levels (> 100 mg/L) were also noted in upgradient wells and therefore do not reflect an influence of dredge material placement in the basins. This differential analysis continues to be complicated by what appears to be background oxidation of sulfides in the underlying Shirley Formation.
The cured sediments in the WWB basin continue to be some of the best agricultural lands in Charles City County and clearly demonstrate the beneficial use potential of upland placement of appropriately screened and placed dredge materials. Similarly, despite their original saline nature, all areas of the Earle Basin sediments continue to improve in their ability to support normal agricultural rowcrop production within several years after placement and dewatering. This further supports our overall conclusions regarding beneficial use potentials.

18
ATTACHMENT 1 2013 Quarterly (for reference) and 2014 Annual Water
Quality Analyses (April sampling)

19
Weanack 2013/2014
2013 Quarterly/2014 Annual Water Levels
1/11/2013 4/15/2013 7/3/2013 10/14/2013 4/26/2014
SDS 2 10.82 12.24 11.51 11.03 12.06 SDS 2D 4.16 5.58 6.09 5.17 5.47 SDS 3 8.46 9.09 9.27 9.78 8.75 SDS 4D 3.32 7 5.86 4.16 6.63 SDS 5 5.65 5.78 6.36 6.97 6.69 SDS 5P 5.8 5.93 6.36 6.97 6.87 SDS 9A 3.95 5.82 6.07 4.85 5.43 SDS 9B dry 4.83 5.08 dry 4.43 SDS 10 5.91 8.46 7.97 6.36 4.53 SDS 11 n.a. n.a. n.a. n.a. n.a. SDS 18 15.71 15.13 16.07 16.99 15.9 SDS 21 7.79 7.98 8.37 9.07 n.a. SW 30 2.73 3.93 4.1 3.8 3.84 SW 31 2.95 4.65 4.85 3.99 4.47 SW 32 2.9 3.89 3.54 5.31 4.01 SW 33 2.94 6.02 5.09 4.94 5.48 SW 34 2.32 3.43 3.6 3.44 3.34 SSG 2 dry dry dry dry dry SSG 3 10.03 11.05 11.49 10.42 14.87 SW 42DV 1.87 2.99 3.17 2.99 2.93 SW 43 10.65 11.26 11.68 11.45 11.85 SW 44 7.32 9.34 9.97 7.7 8.46 SW 46 3.94 5.69 6.02 5.06 5.39 SW 47 n.a. n.a. n.a. n.a. n.a. SW 48 5.51 5.74 6.12 6.71 6.66 SEW 51 4.57 5.32 5.83 5.99 6.51 SEW 52 4.22 4.72 4.27 4.25 4.9 SEW 53 2.01 2.5 2.87 3.03 3.19 SEW 54 9.33 9.99 10.08 9.73 9.85 SEW 55 6.91 7.55 7.92 7.81 7.66 SEW 56 n.a. n.a. n.a. n.a. 9.5 SEW 58 1.91 2.45 2.71 2.85 3.13 SSG 5 25.9 25.52 24.35 25.42 28.44
(Reported as feet above sea level)
n.a. = not available

20
2013 Quarterly/2014 Annual pH WWB 1/11/2013 4/15/2013 7/3/2013 10/14/2013 4/26/2014 SDS 3 5.93 5.94 5.96 6.11 6.03 SW 30 6.27 6.05 6.27 6.2 6.35 SW 31 5.98 5.89 5.95 6.11 6.01 SW43 6.35 5.81 5.85 6.19 5.88 SW 3 dry dry dry dry dry SW 2 7.45 8.62 6.44 6.45 8.06
Earle SP Well 8.38 7.9 7.34 7.67 7.91 SEW 51 6.01 5.64 5.65 6.3 5.85 SEW 52 6.21 6.05 5.92 6.04 6.09 SEW 53 5.52 5.4 5.26 5.5 5.44 SEW 54 6.72 6.21 6.67 5.87 6.50 SEW 58 6.01 5.69 5.66 5.75 5.73 SW 5 7.99 10.01 9.48 8.93 7.93
2013 Quarterly DOC (at VT)
WWB 1/16/2013 4/20/2013 7/25/2013 10/8/2013 SDS 3 0.40 0.38 5.61 3.99 SW 30 8.58 1.28 12.08 7.14 SW 31 0.65 0.76 10.72 3.73 SW 43 0.64 0.53 3.75 1.52 SW 2 0.67 0.34 2.30 6.73
Earle SP Well 0.23 0.39 3.15 2.57 SEW 51 0.32 0.37 1.59 1.21 SEW 52 0.49 0.40 3.73 2.64 SEW 53 0.75 0.66 6.04 5.42 SEW 54 0.84 0.33 0.94 3.53 SEW 58 0.88 0.48 2.26 1.81 SW 5 1.75 0.70 6.71 14.99
DOC (mg L-1)

21
2014 Annual TOC (at VT)
WWB April 2014
SDS 3 4.03
SW 30 2.94
SW 31 3.64
SW 43 3.20
SW 2 2.83
Earle
SP Well 2.32
SEW 51 3.07
SEW 52 3.40
SEW 53 9.39
SEW 54 3.68
SEW 58 4.08 SW 5 5.85
TOC (mg L-1)
2013 Quarterly/2014 Annual Temperature
WWB 1/11/2013 4/15/2013 7/3/2013 10/14/2013 4/26/2014 SDS 3 10.9 14 21 18.9 17.1 SW 30 14.7 16.1 21.7 18 16.1 SW 31 14.9 15.8 16.4 16.6 14.9 SW43 14.1 14.6 16.2 19.6 16.6 SW 3 dry dry dry dry dry SW 2 8.4 20.3 31.6 19.6 25.5
Earle SP Well 20.5 37.6 27.1 20.3 20.1 SEW 51 15.5 16.2 18.2 19.3 22.4 SEW 52 15.1 14.3 19.4 18.8 14.2 SEW 53 15.3 15.8 17.6 20 23.6 SEW 54 14.6 15.5 18.7 17.6 23 SEW 58 14.6 15.8 18 17.5 17.6 SW 5 7.4 17.6 39.2 18.2 24 Temp in °C

22
2013 Quarterly/2014 Annual EC WWB 1/11/2013 4/15/2013 7/3/2013 10/14/2013 4/26/2014 SDS 3 347 354 261 456 162 SW 30 1110 1074 993 2790 844 SW 31 620 646 683 1356 528 SW 43 152 173 154 162 148 SW 3 dry dry dry dry dry SW 2 418 324 245 2420 690
Earle SP Well 463 473 508 439 389 SEW 51 170 194 197 262 190 SEW 52 147 154 150 151 152 SEW 53 6200 5920 6000 6300 6910 SEW 54 316 361 382 479 232 SEW 58 672 719 804 872 704 SW 5 10420 8240 7050 6080 3830 EC - Conductance in µS cm-1
23
ATTACHMENT 2 2014 Annual Water Quality Analyses

24
Earle Basin
Date: 4/26/2014 4/26/2014 4/26/2014
Well ID: SEW 51 SEW 52 SEW 53 Water Annual Sampling Method Units Results Results Results Arsenic SW6010C mg/L 0.0282 0.0245 0.0416 Barium SW6010C mg/L 0.341 0.178 0.209 Cadmium SW6010C mg/L 0.0128 0.0027 0.0139 Chromium SW6010C mg/L 0.0603 0.0344 0.0475 Copper SW6010C mg/L 0.0283 0.0240 0.0219 Iron SW6010C mg/L 122 23.6 43.0 Lead SW6010C mg/L 0.0463 0.0219 0.0102 Manganese SW6010C mg/L 1.94 0.419 0.559 Mercury SW7470A mg/L <0.0002 <0.0002 <0.0002 Selenium SW6010C mg/L 0.0097 <0.0080 0.0225 Silver SW6010C mg/L <0.0020 <0.0020 <0.0020 Zinc SW6010C mg/L 0.232 0.107 0.213 4,4-DDT [2C] SW8081B µg/L <0.005 <0.005 <0.005 Aldrin SW8081B µg/L <0.005 <0.005 <0.005 Chlordane SW8081B µg/L <0.200 <0.200 <0.200 Dieldrin SW8081B µg/L <0.003 <0.003 <0.003 Endrin SW8081B µg/L <0.002 <0.002 <0.002 Gamma-BHC (Lindane) SW8081B µg/L <0.003 <0.003 <0.003 Heptachlor SW8081B µg/L <0.003 <0.003 <0.003 Heptachlor epoxide SW8081B µg/L <0.002 <0.002 <0.002 Methoxychlor [2C] SW8081B µg/L <0.004 <0.004 <0.004 Mirex SW8081B µg/L <0.002 <0.002 <0.002 Toxaphene SW8081B µg/L <0.200 <0.200 <0.200 2,4,5-TP (Silvex) SW8151A µg/L <0.1 <0.1 <0.1 2,4-D [2C] SW8151A µg/L <0.1 <0.1 <0.1 Chloride EPA300.0/R2.1 mg/L 16.3 18.2 2020 Fluoride EPA300.0/R2.1 mg/L <0.100 <0.100 <0.100 Sodium SW6010C mg/L 9.97 25.1 682 Cyanide SW9012 mg/L <0.01 <0.01 <0.01 Nitrate Calc. mg/L 8.47 1.77 6.03 Nitrate+Nitrite SM 18/4500-NO3 F mg/L 8.47 1.77 6.03 Nitrite SM 18/4500-NO2 B mg/L <0.05 <0.05 <0.05 Sulfate EPA-300.0/R2.1 mg/L 16.1 11.7 624 Total recoverable phenolics EPA420.1 mg/L <0.05 <0.05 <0.05 Total Organic Carbon SW9060 mg/L 1.2 1.6 4.6 Total Dissolved Solids SM18/2540C mg/L 155 249 3870 TPH-Volatiles (GRO) SW8015C mg/L <0.50 <0.50 <0.50 Kepone SW8270D µg/L <2.00 <2.04 <2.00 TPH-Semi-Volatiles (DRO) SW8015C mg/L <0.30 <0.30 <0.30

25
Earle Basin Sample Date: 4/26/2014 4/26/2014 4/26/2014 Well ID: SEW 54 SP Well SW 5
Water Annual Sampling Method Units Results Results Results Arsenic SW6010C mg/L 0.0286 <0.0090 0.0095 Barium SW6010C mg/L 0.298 0.0140 0.0084 Cadmium SW6010C mg/L 0.0059 <0.0020 <0.0020 Chromium SW6010C mg/L 0.0535 <0.0010 <0.0010 Copper SW6010C mg/L 0.0494 <0.0030 <0.0030 Iron SW6010C mg/L 54.5 0.0154 0.589 Lead SW6010C mg/L 0.0469 <0.0060 <0.0060 Manganese SW6010C mg/L NR* 0.0103 1.04 Mercury SW7470A mg/L <0.0002 <0.0002 <0.0002 Selenium SW6010C mg/L 0.0096 <0.0080 0.0140 Silver SW6010C mg/L <0.0020 <0.0020 <0.0100 Zinc SW6010C mg/L 0.205 <0.010 0.0326 4,4-DDT [2C] SW8081B µg/L <0.005 <0.005 <0.005 Aldrin SW8081B µg/L <0.005 <0.005 <0.005 Chlordane SW8081B µg/L <0.200 <0.200 <0.200 Dieldrin SW8081B µg/L <0.003 <0.003 <0.003 Endrin SW8081B µg/L <0.002 <0.002 <0.002 Gamma-BHC (Lindane) SW8081B µg/L <0.003 <0.003 <0.003 Heptachlor SW8081B µg/L <0.003 <0.003 <0.003 Heptachlor epoxide SW8081B µg/L <0.002 <0.002 <0.002 Methoxychlor [2C] SW8081B µg/L <0.004 <0.004 <0.004 Mirex SW8081B µg/L <0.002 <0.002 <0.002 Toxaphene SW8081B µg/L <0.200 <0.200 <0.200 2,4,5-TP (Silvex) SW8151A µg/L <0.1 <0.1 <0.1 2,4-D [2C] SW8151A µg/L <0.1 <0.1 <0.1 Chloride EPA300.0/R2.1 mg/L 28.6 18.6 750 Fluoride EPA300.0/R2.1 mg/L <0.100 1.54 0.147 Sodium SW6010C mg/L 20.9 82.2 514 Cyanide SW9012 mg/L <0.01 <0.01 <0.01 Nitrate Calc. mg/L 13.9 <0.10 <0.10 Nitrate+Nitrite SM 18/4500-NO3 F mg/L 13.9 <0.05 <0.05 Nitrite SM 18/4500-NO2 B mg/L <0.05 <0.05 <0.05 Sulfate EPA-300.0/R2.1 mg/L 9.7 11.6 650 Total recoverable phenolics EPA420.1 mg/L <0.05 <0.05 <0.05 Total Organic Carbon SW9060A mg/L 1.2 <1.0 11.4 Total Dissolved Solids SM18/2540C mg/L 221 256 2270 TPH-Volatiles (GRO) SW8015C mg/L <0.50 <0.50 <0.50
Kepone SW8270D µg/L <2.02 <2.02 <2.02 TPH-Semi-Volatiles (DRO) SW8015C mg/L <0.30 <0.30 <0.30 *Not reported by AWS

26
Earle Basin Sample Date: 4/16/2014 1/8/2015 1/8/2015 Well ID: Field Blank SEW 58 Field Blank
Water Annual Sampling Method Units Results Results Results Arsenic SW6010C mg/L <0.0090 <0.0090 0.0101 Barium SW6010C mg/L <0.0020 0.922 <0.002 Cadmium SW6010C mg/L <0.0020 0.0227 0.0035 Chromium SW6010C mg/L <0.0010 0.136 <0.0010 Copper SW6010C mg/L <0.0030 0.0710 <0.0030 Iron SW6010C mg/L <0.0030 195 <0.0030 Lead SW6010C mg/L <0.0060 0.0549 <0.0060 Manganese SW6010C mg/L <0.0020 3.22 <0.0020 Mercury SW7470A mg/L <0.0002 0.00022 <0.0002 Selenium SW6010C mg/L <0.0080 <0.0080 <0.0080 Silver SW6010C mg/L <0.0020 <0.0020 0.0020 Zinc SW6010C mg/L <0.0100 0.426 0.0128 4,4-DDT [2C] SW8081B µg/L <0.005 <0.005 <0.005 Aldrin SW8081B µg/L <0.005 <0.005 <0.005 Chlordane SW8081B µg/L <0.200 <0.200 <0.200 Dieldrin SW8081B µg/L <0.003 <0.003 <0.003 Endrin SW8081B µg/L <0.002 <0.002 <0.002 Gamma-BHC (Lindane) SW8081B µg/L <0.003 <0.003 <0.003 Heptachlor SW8081B µg/L <0.003 <0.003 <0.003 Heptachlor epoxide SW8081B µg/L <0.002 <0.002 <0.002 Methoxychlor [2C] SW8081B µg/L <0.004 <0.004 <0.004 Mirex SW8081B µg/L <0.002 <0.002 <0.002 Toxaphene SW8081B µg/L <0.200 <0.200 <0.200 2,4,5-TP (Silvex) SW8151A µg/L <0.1 <0.1 <0.1 2,4-D [2C] SW8151A µg/L <0.1 <0.1 <0.1 Chloride EPA300.0/R2.1 mg/L <1.0 207 <1.0 Fluoride EPA300.0/R2.1 mg/L <0.100 <0.500 <0.100 Sodium SW6010C mg/L 0.25 58.4 <0.20 Cyanide SW9012 mg/L <0.01 <0.01 <0.01 Nitrate Calc. mg/L <0.10 5.27 NR Nitrate+Nitrite SM 18/4500-NO3 F mg/L <0.05 5.27 <0.05 Nitrite SM 18/4500-NO2 B mg/L <0.05 <0.05 <0.05 Sulfate EPA-300.0/R2.1 mg/L <1.0 16.0 <1.0 Total recoverable phenolics EPA420.1 mg/L <0.05 <0.05 <0.05 Total Organic Carbon SW9060A mg/L <1.0 1.4 <1.0 Total Dissolved Solids SM18/2540C mg/L <10 478 <10 TPH-Volatiles (GRO) SW8015C mg/L <0.50 <0.10 <0.10 Kepone SW8270D µg/L <2.04 <2.11 NR TPH-Semi-Volatiles (DRO) SW8015C mg/L <0.30 <0.30 <0.30

27
WWB Basin Sample Date: 4/26/2014 4/26/2014 4/26/2014 Well ID: SW2 SW 30 SW 31
Water Annual Sampling Method Units Results Results Results Arsenic SW6010C mg/L <0.0090 <0.0090 <0.0090 Barium SW6010C mg/L 0.0352 0.0440 0.1040 Cadmium SW6010C mg/L <0.0020 <0.0020 <0.0020 Chromium SW6010C mg/L <0.0010 0.0081 0.0057 Copper SW6010C mg/L <0.0030 <0.0030 0.0033 Iron SW6010C mg/L 0.325 4.70 5.86 Lead SW6010C mg/L <0.0060 <0.0060 <0.0060 Manganese SW6010C mg/L 0.137 10.2 0.830 Mercury SW7470A mg/L <0.0002 <0.0002 <0.0002 Selenium SW6010C mg/L 0.0147 0.0133 0.0100 Silver SW6010C mg/L <0.0020 0.0036 <0.0020 Zinc SW6010C mg/L <0.01 0.0158 0.0250 4,4-DDT [2C] SW8081B µg/L <0.005 <0.005 <0.005 Aldrin SW8081B µg/L <0.005 <0.005 <0.005 Chlordane SW8081B µg/L <0.200 <0.200 <0.200 Dieldrin SW8081B µg/L <0.003 <0.003 <0.003 Endrin SW8081B µg/L <0.002 <0.002 <0.002 Gamma-BHC (Lindane) SW8081B µg/L <0.003 <0.003 <0.003 Heptachlor SW8081B µg/L <0.003 <0.003 <0.003 Heptachlor epoxide SW8081B µg/L <0.002 <0.002 <0.002 Methoxychlor [2C] SW8081B µg/L <0.004 <0.004 <0.004 Mirex SW8081B µg/L <0.002 <0.002 <0.002 Toxaphene SW8081B µg/L <0.200 <0.200 <0.200 2,4,5-TP (Silvex) SW8151A µg/L <0.1 <0.1 <0.1
2,4-D [2C] SW8151A µg/L <0.1 <0.1 <0.1 Chloride EPA300.0/R2.1 mg/L 19.3 17.2 11.0 Fluoride EPA300.0/R2.1 mg/L 0.195 0.120 <0.100 Sodium SW6010C mg/L 10.5 10.9 11.8 Cyanide SW9012 mg/L <0.01 <0.01 <0.01 Nitrate Calc. mg/L <0.10 3.44 5.97 Nitrate+Nitrite SM 18/4500-NO3 F mg/L <0.05 3.44 5.97 Nitrite SM 18/4500-NO2 B mg/L <0.05 <0.05 <0.05 Sulfate EPA-300.0/R2.1 mg/L 288 200 170 Total recoverable phenolics EPA420.1 mg/L <0.05 <0.05 <0.05 Total Organic Carbon SW9060 mg/L 7.4 4.0 1.9 Total Dissolved Solids SM18/2540C mg/L 549 627 422 TPH-Volatiles (GRO) SW8015C mg/L <0.50 <0.50 <0.50 Kepone SW8270D µg/L <2.00 <2.04 <2.02 TPH-Semi-Volatiles (DRO) SW8015C mg/L <0.30 <0.30 <0.30

28
WWB Basin Sample Date: 4/26/2014 4/26/2014 Well ID: SW 43 SDS 3
Water Annual Sampling Method Units Results Results
Arsenic SW6010C mg/L 0.0405 0.0097 Barium SW6010C mg/L 0.619 0.0510 Cadmium SW6010C mg/L 0.0121 <0.0020 Chromium SW6010C mg/L 0.110 0.0022 Copper SW6010C mg/L 0.0642 <0.0030 Iron SW6010C mg/L 114 8.44 Lead SW6010C mg/L 0.0648 <0.0060 Manganese SW6010C mg/L 0.868 0.409 Mercury SW7470A mg/L <0.0002 <0.0002 Selenium SW6010C mg/L <0.0080 <0.0080 Silver SW6010C mg/L <0.0020 <0.0020 Zinc SW6010C mg/L 0.300 0.0152 4,4-DDT [2C] SW8081B µg/L <0.005 <0.005 Aldrin SW8081B µg/L <0.005 <0.005 Chlordane SW8081B µg/L <0.200 <0.200 Dieldrin SW8081B µg/L <0.003 <0.003 Endrin SW8081B µg/L <0.002 <0.002 Gamma-BHC (Lindane) SW8081B µg/L <0.003 <0.003 Heptachlor SW8081B µg/L <0.003 <0.003 Heptachlor epoxide SW8081B µg/L <0.002 <0.002 Methoxychlor [2C] SW8081B µg/L <0.004 <0.004 Mirex SW8081B µg/L <0.002 <0.002 Toxaphene SW8081B µg/L <0.200 <0.200 2,4,5-TP (Silvex) SW8151A µg/L <0.1 <0.1 2,4-D [2C] SW8151A µg/L <0.1 <0.1 Chloride EPA300.0/R2.1 mg/L 10.2 4.9 Fluoride EPA300.0/R2.1 mg/L <0.100 <0.100 Sodium SW6010C mg/L 7.70 3.88 Cyanide SW9012 mg/L <0.01 <0.01 Nitrate Calc. mg/L 2.33 1.83 Nitrate+Nitrite SM 18/4500-NO3 F mg/L 2.33 1.83 Nitrite SM 18/4500-NO2 B mg/L <0.05 <0.05 Sulfate EPA-300.0/R2.1 mg/L 23.5 26.4 Total recoverable phenolics EPA420.1 mg/L <0.05 <0.05 Total Organic Carbon SW9060A mg/L 1.8 1.5 Total Dissolved Solids SM18/2540C mg/L 179 101 TPH-Volatiles (GRO) SW8015C mg/L <0.50 <0.50 Kepone SW8270D µg/L <2.06 <2.00 TPH-Semi-Volatiles (DRO) SW8015C mg/L <0.30 <0.30

29
ATTACHMENT 4 Detailed City of Alexandria City Marina Dredge Sediment
Analyses Provided by URS Corporation

Dredge Material Soil Screening Levels
NJDEP (1997) Residential Soil
Cleanup
Criteria3EPA Part 503
Biosolids
USGS soil background
metals5
Proposed VA Exclusion
Criteria6
Proposed VA Clean Upland Fill
Criteria7
Sample ID Date
Average
Value1,2Industrial
SoilResidential
SoilExceptional
QualityVA background
metal levels SL-1/2 SL-3/5 SL-4/6 PARAMETER
Metals (mg kg-1) Metals (mg kg-1)1/2, SL-3/5, SL Apr-14 16233 Aluminum NA 990,000 77,000 NA NA 18500 15500 14700 Aluminum1/2, SL-3/5, SL Apr-14 0.59 Antimony 14 410 31 410 14 0.24 0.74 0.80 Antimony1/2, SL-3/5, SL Apr-14 5.79 Arsenic 20 1.6 0.39 41 5 41 20 6.27 6.39 4.71 Arsenic1/2, SL-3/5, SL Apr-14 166 Barium 700 19,000 15,000 244 19,000 700 176 180 142 Barium1/2, SL-3/5, SL Apr-14 1.22 Beryllium 1 2,000 160 <1 2,000 160 1.34 1.16 1.17 Beryllium1/2, SL-3/5, SL Apr-14 0.64 Cadmium 39 810 70 39 <0.1 810 39 0.56 0.88 0.47 Cadmium1/2, SL-3/5, SL Apr-14 6567 Calcium NA NA NA NA NA 8900 3990 6810 Calcium1/2, SL-3/5, SL Apr-14 30.4 Chromium NA 200 39 23 1,200 200 32.4 31.8 27.1 Chromium1/2, SL-3/5, SL Apr-14 22.7 Cobalt NA 300 23 300 NA 25.5 20.7 21.9 Cobalt1/2, SL-3/5, SL Apr-14 49.5 Copper 600 41,000 3,100 1,500 9 4,300 1,500 50.7 59.2 38.5 Copper1/2, SL-3/5, SL Apr-14 30100 Iron NA 720,000 55,000 150,000 150,000 33200 29000 28100 Iron1/2, SL-3/5, SL Apr-14 50.0 Lead 400 800 400 300 26 800 300 36.8 82 31.2 Lead1/2, SL-3/5, SL Apr-14 4033 Magnesium NA NA NA NA NA 4600 3550 3950 Magnesium1/2, SL-3/5, SL Apr-14 1059 Manganese NA NA NA 295 NA NA 1180 1140 856 Manganese1/2, SL-3/5, SL Apr-14 0.24 Mercury 14 100 7.8 17 0.06 100 14 0.14 0.45 0.12 Mercury1/2, SL-3/5, SL Apr-14 32.8 Nickel 250 69,000 14,000 420 9 1,000 250 36.9 29.6 31.8 Nickel1/2, SL-3/5, SL Apr-14 1593 Potassium NA NA NA NA NA 1800 1500 1480 Potassium1/2, SL-3/5, SL Apr-14 0.47 Selenium 63 5,100 390 100 5,100 63 0.52 0.48 0.41 Selenium1/2, SL-3/5, SL Apr-14 0.48 Silver 110 5,100 390 5,100 110 0.33 0.81 0.31 Silver1/2, SL-3/5, SL Apr-14 97.8 Sodium NA NA NA NA NA 125 86.1 82.3 Sodium1/2, SL-3/5, SL Apr-14 0.22 Thallium 2 NA NA 0.5 5 1 0.24 0.2 0.21 Thallium1/2, SL-3/5, SL Apr-14 37.4 Vanadium 370 5,200 390 5,200 370 41.5 36.6 34.1 Vanadium1/2, SL-3/5, SL Apr-14 200 Zinc 1,500 310,000 23,000 2,800 41 7,500 1,500 185 260 155 Zinc1/2, SL-3/5, SL Apr-14 0.262 Cyanide, Total 1,100 20,000 1,600 20,000 1,100 0.305 0.23 0.25 Cyanide, Total
PCBS (mg kg-1) PCBS (mg kg-1)1/2, SL-3/5, SL Apr-14 0.028 Aroclor 1016 NA 21 3.9 21 NA 0.0405 0.031 0.0135 Aroclor 10161/2, SL-3/5, SL Apr-14 0.028 Aroclor 1221 NA 0.62 0.17 0.62 NA 0.0405 0.031 0.0135 Aroclor 12211/2, SL-3/5, SL Apr-14 0.028 Aroclor 1232 NA 0.62 0.17 0.62 NA 0.0405 0.031 0.0135 Aroclor 12321/2, SL-3/5, SL Apr-14 0.028 Aroclor 1242 NA 0.74 0.22 0.74 NA 0.0405 0.031 0.0135 Aroclor 12421/2, SL-3/5, SL Apr-14 0.028 Aroclor 1248 NA 0.74 0.22 0.74 NA 0.0405 0.031 0.0135 Aroclor 12481/2, SL-3/5, SL Apr-14 0.028 Aroclor 1254 NA 0.74 0.22 0.74 NA 0.0405 0.031 0.0135 Aroclor 12541/2, SL-3/5, SL Apr-14 0.028 Aroclor 1260 NA 0.74 0.22 0.74 NA 0.0405 0.031 0.0135 Aroclor 12601/2, SL-3/5, SL Apr-14 0.198 Total Aroclor8 0.49 25.2 5.1 25.2 0.49 0.2835 0.217 0.0945 Total Aroclor5
Pesticides (mg kg-1) Pesticides (mg kg-1)1/2, SL-3/5, SL Apr-14 0.003 4,4'-DDD 3 7.2 2 7.2 3 0.004035 0.00239 0.00334 4,4'-DDD1/2, SL-3/5, SL Apr-14 0.004 4,4'-DDE 2 5.1 1.4 5.1 2 0.004035 0.00317 0.00334 4,4'-DDE1/2, SL-3/5, SL Apr-14 0.003 4,4'-DDT 2 7 1.7 7 2 0.004035 0.003085 0.00334 4,4'-DDT1/2, SL-3/5, SL Apr-14 0.002 Aldrin 0.04 0.11 0.029 0.11 0.04 0.002025 0.00155 0.001675 Aldrin1/2, SL-3/5, SL Apr-14 0.002 alpha-BHC NA NA NA NA NA 0.002025 0.00155 0.001675 alpha-BHC1/2, SL-3/5, SL Apr-14 0.002 beta-BHC NA NA NA NA NA 0.002025 0.00155 0.001675 beta-BHC1/2, SL-3/5, SL Apr-14 0.002 alpha-Chlordane NA NA NA NA NA 0.002025 0.00155 0.001675 alpha-Chlordane1/2, SL-3/5, SL Apr-14 0.002 gamma-Chlordane NA NA NA NA NA 0.002025 0.00155 0.001675 gamma-Chlordane
Working Area: You can enter your individual sample results here to be averaged in column "C"
to left1,2. (Note: this working area will not show up in the print window)
Criteria
PARAMETER
Values from your sample analyses go
here.
See notes 1 and 2 below for directions
EPA Region 3 Screening Levels
(EPA, 2008)4
Brief Description: City of Alexandria City Marina dredge material. Soluble salts, CCE, and PPA analyzed by Virginia Tech, remaining parameters analyzed by Gulf Coast Analytical Laboratories, Inc. as contracted by URS. Several parameters subcontracted to other testing laboratories. Virginia Tech received data compiled in the screening template (below) from URS on May 19, 2014.
Page 1 of 3

Dredge Material Soil Screening Levels
NJDEP (1997) Residential Soil
Cleanup
Criteria3EPA Part 503
Biosolids
USGS soil background
metals5
Proposed VA Exclusion
Criteria6
Proposed VA Clean Upland Fill
Criteria7
Sample ID Date
Average
Value1,2Industrial
SoilResidential
SoilExceptional
QualityVA background
metal levels SL-1/2 SL-3/5 SL-4/6 PARAMETER
Working Area: You can enter your individual sample results here to be averaged in column "C"
to left1,2. (Note: this working area will not show up in the print window)
Criteria
PARAMETER
Values from your sample analyses go
here.
See notes 1 and 2 below for directions
EPA Region 3 Screening Levels
(EPA, 2008)4
Brief Description: City of Alexandria City Marina dredge material. Soluble salts, CCE, and PPA analyzed by Virginia Tech, remaining parameters analyzed by Gulf Coast Analytical Laboratories, Inc. as contracted by URS. Several parameters subcontracted to other testing laboratories. Virginia Tech received data compiled in the screening template (below) from URS on May 19, 2014.
1/2, SL-3/5, SL Apr-14 0.002 delta-BHC NA NA NA NA NA 0.002025 0.00155 0.001675 delta-BHC1/2, SL-3/5, SL Apr-14 0.003 Dieldrin 0.042 0.11 0.03 0.11 0.042 0.004035 0.003085 0.00334 Dieldrin1/2, SL-3/5, SL Apr-14 0.002 Endosulfan NA 3,700 370 3,700 NA 0.002025 0.00155 0.001675 Endosulfan 1/2, SL-3/5, SL Apr-14 0.003 Endrin 17 180 18 180 17 0.004035 0.003085 0.00334 Endrin1/2, SL-3/5, SL Apr-14 0.003 Endrin aldehyde NA NA NA NA NA 0.004035 0.003085 0.00334 Endrin aldehyde1/2, SL-3/5, SL Apr-14 0.002 gamma-BHC (Lindane) 0.52 NA NA 0.52 0.52 0.002025 0.00155 0.001675 gamma-BHC (Lindane)1/2, SL-3/5, SL Apr-14 0.003 Endrin ketone NA NA NA NA NA 0.004035 0.003085 0.00334 Endrin ketone1/2, SL-3/5, SL Apr-14 0.002 Heptachlor 0.15 0.38 0.11 0.38 0.15 0.002025 0.00155 0.001675 Heptachlor1/2, SL-3/5, SL Apr-14 0.002 Heptachlor epoxide NA 0.19 0.053 0.19 NA 0.002025 0.00155 0.001675 Heptachlor epoxide1/2, SL-3/5, SL Apr-14 0.002 Methoxychlor 280 3,100 310 3,100 280 0.002025 0.00155 0.001675 Methoxychlor1/2, SL-3/5, SL Apr-14 0.009 Toxaphene 0.1 1.6 0.44 1.6 0.1 0.01 0.0075 0.0085 Toxaphene
Semivolatiles (mg kg-1) Semivolatiles (mg kg-1)1/2, SL-3/5, SL Apr-14 0.446 Acenaphthene 3,400 33,000 3,400 33,000 3,400 0.4 0.606 0.331 Acenaphthene1/2, SL-3/5, SL Apr-14 0.333 Acenaphthylene NA NA NA NA NA 0.4 0.267 0.331 Acenaphthylene1/2, SL-3/5, SL Apr-14 0.137 Anthracene 10,000 170,000 17,000 170,000 10,000 0.03 0.365 0.015 Anthracene1/2, SL-3/5, SL Apr-14 0.390 Benzo(a)anthracene 0.9 2.1 0.15 2.1 0.9 0.093 1.03 0.047 Benzo(a)anthracene1/2, SL-3/5, SL Apr-14 0.345 Benzo(b)fluoranthene 0.9 2.1 0.15 2.1 0.9 0.4 0.305 0.331 Benzo(b)fluoranthene1/2, SL-3/5, SL Apr-14 0.345 Benzo(k)fluoranthene 0.9 21 1.5 21 0.9 0.4 0.305 0.331 Benzo(k)fluoranthene1/2, SL-3/5, SL Apr-14 1.260 Benzo(ghi)perylene NA NA NA NA NA 0.4 3.05 0.331 Benzo(ghi)perylene1/2, SL-3/5, SL Apr-14 0.345 Benzo(a)pyrene 0.66 0.21 0.015 0.66 0.21 0.4 0.305 0.331 Benzo(a)pyrene1/2, SL-3/5, SL Apr-14 0.345 bis(2-Chloroethoxy)methane NA 1800 180 1,800 NA 0.4 0.305 0.331 bis(2-Chloroethoxy)methane1/2, SL-3/5, SL Apr-14 0.345 bis(2-Chloroethyl) ether 0.66 0.9 0.19 0.9 0.66 0.4 0.305 0.331 bis(2-Chloroethyl) ether1/2, SL-3/5, SL Apr-14 0.341 bis(2-Ethylhexyl) phthalate 49 120 35 120 49 0.386 0.305 0.331 bis(2-Ethylhexyl) phthalate1/2, SL-3/5, SL Apr-14 0.345 4-Bromophenyl phenyl ether NA NA NA NA NA 0.4 0.305 0.331 4-Bromophenyl phenyl ether1/2, SL-3/5, SL Apr-14 0.345 Butyl benzyl phthalate 1,100 910 260 1,100 910 0.4 0.305 0.331 Butyl benzyl phthalate1/2, SL-3/5, SL Apr-14 0.250 Carbazole NA NA NA NA NA 0.4 0.02 0.331 Carbazole1/2, SL-3/5, SL Apr-14 0.345 4-Chloroaniline 230 NA NA 230 230 0.4 0.305 0.331 4-Chloroaniline1/2, SL-3/5, SL Apr-14 0.345 4-Chloro-3-methylphenol 10,000 NA NA 10,000 10,000 0.4 0.305 0.331 4-Chloro-3-methylphenol1/2, SL-3/5, SL Apr-14 0.345 2-Chloronaphthalene NA NA NA NA NA 0.4 0.305 0.331 2-Chloronaphthalene1/2, SL-3/5, SL Apr-14 0.345 2-Chlorophenol 280 5,100 390 5,100 280 0.4 0.305 0.331 2-Chlorophenol1/2, SL-3/5, SL Apr-14 0.345 4-Chlorophenyl phenyl ether NA NA NA NA NA 0.4 0.305 0.331 4-Chlorophenyl phenyl ether1/2, SL-3/5, SL Apr-14 0.345 Chrysene 9 210 15 210 9 0.093 0.904 0.039 Chrysene1/2, SL-3/5, SL Apr-14 0.345 Dibenz(a,h)anthracene 0.66 0.21 0.015 0.66 0.21 0.4 0.305 0.331 Dibenz(a,h)anthracene1/2, SL-3/5, SL Apr-14 0.345 Dibenzofuran NA NA NA NA NA 0.4 0.305 0.331 Dibenzofuran1/2, SL-3/5, SL Apr-14 0.273 Di-n-butyl phthalate 5,700 NA NA 5,700 5,700 0.182 0.305 0.331 Di-n-butyl phthalate1/2, SL-3/5, SL Apr-14 0.345 1,2-Dichlorobenzene 5,100 10,000 2,000 10,000 5,100 0.4 0.305 0.331 1,2-Dichlorobenzene1/2, SL-3/5, SL Apr-14 0.345 1,3-Dichlorobenzene 5,100 NA NA 5,100 5,100 0.4 0.305 0.331 1,3-Dichlorobenzene1/2, SL-3/5, SL Apr-14 0.345 1,4-Dichlorobenzene 570 13 2.6 570 13 0.4 0.305 0.331 1,4-Dichlorobenzene1/2, SL-3/5, SL Apr-14 0.690 3,3'-Dichlorobenzidine 2 3.8 1.1 3.8 2 0.8 0.61 0.66 3,3'-Dichlorobenzidine1/2, SL-3/5, SL Apr-14 0.345 2,4-Dichlorophenol 170 1,800 180 1,800 170 0.4 0.305 0.331 2,4-Dichlorophenol1/2, SL-3/5, SL Apr-14 0.345 Diethyl phthalate 10,000 490,000 49,000 490,000 10,000 0.4 0.305 0.331 Diethyl phthalate1/2, SL-3/5, SL Apr-14 0.345 2,4-Dimethylphenol 1,100 12,000 1,200 12,000 1,100 0.4 0.305 0.331 2,4-Dimethylphenol1/2, SL-3/5, SL Apr-14 0.345 Dimethyl phthalate 10,000 NA NA 10,000 10,000 0.4 0.305 0.331 Dimethyl phthalate1/2, SL-3/5, SL Apr-14 0.345 Di-n-octyl phthalate 1,100 NA NA 1,100 1,100 0.4 0.305 0.331 Di-n-octyl phthalate1/2, SL-3/5, SL Apr-14 1.727 4,6-Dinitro-2-methylphenol NA NA NA NA NA 2 1.525 1.655 4,6-Dinitro-2-methylphenol1/2, SL-3/5, SL Apr-14 0.345 2,4-Dinitrophenol 110 1,200 120 1,200 110 0.4 0.305 0.331 2,4-Dinitrophenol1/2, SL-3/5, SL Apr-14 0.345 2,4-Dinitrotoluene NA 1,200 120 1,200 NA 0.4 0.305 0.331 2,4-Dinitrotoluene1/2, SL-3/5, SL Apr-14 0.345 2,6-Dinitrotoluene 1 620 61 620 61 0.4 0.305 0.331 2,6-Dinitrotoluene1/2, SL-3/5, SL Apr-14 0.589 Fluoranthene 2,300 22,000 2,300 22,000 2,300 0.123 1.57 0.073 Fluoranthene1/2, SL-3/5, SL Apr-14 0.386 Fluorene 2,300 22,000 2,300 22,000 2,300 0.4 0.428 0.331 Fluorene1/2, SL-3/5, SL Apr-14 0.345 Hexachlorobenzene 0.66 1.1 0.3 1.1 0.66 0.4 0.305 0.331 Hexachlorobenzene1/2, SL-3/5, SL Apr-14 0.345 Hexachlorobutadiene 1 22 6.2 22 1 0.4 0.305 0.331 Hexachlorobutadiene1/2, SL-3/5, SL Apr-14 0.345 Hexachlorocyclopentadiene 400 3,700 370 3,700 400 0.4 0.305 0.331 Hexachlorocyclopentadiene1/2, SL-3/5, SL Apr-14 0.345 Hexachloroethane 6 120 35 120 6 0.4 0.305 0.331 Hexachloroethane1/2, SL-3/5, SL Apr-14 0.345 Indeno(1,2,3-cd)pyrene 0.9 2.1 0.15 2.1 0.9 0.4 0.305 0.331 Indeno(1,2,3-cd)pyrene
Page 2 of 3

Dredge Material Soil Screening Levels
NJDEP (1997) Residential Soil
Cleanup
Criteria3EPA Part 503
Biosolids
USGS soil background
metals5
Proposed VA Exclusion
Criteria6
Proposed VA Clean Upland Fill
Criteria7
Sample ID Date
Average
Value1,2Industrial
SoilResidential
SoilExceptional
QualityVA background
metal levels SL-1/2 SL-3/5 SL-4/6 PARAMETER
Working Area: You can enter your individual sample results here to be averaged in column "C"
to left1,2. (Note: this working area will not show up in the print window)
Criteria
PARAMETER
Values from your sample analyses go
here.
See notes 1 and 2 below for directions
EPA Region 3 Screening Levels
(EPA, 2008)4
Brief Description: City of Alexandria City Marina dredge material. Soluble salts, CCE, and PPA analyzed by Virginia Tech, remaining parameters analyzed by Gulf Coast Analytical Laboratories, Inc. as contracted by URS. Several parameters subcontracted to other testing laboratories. Virginia Tech received data compiled in the screening template (below) from URS on May 19, 2014.
1/2, SL-3/5, SL Apr-14 0.345 Isophorone 1,100 1,800 510 1,800 1,100 0.4 0.305 0.331 Isophorone1/2, SL-3/5, SL Apr-14 0.265 2-Methylnaphthalene NA 4,100 310 4,100 NA 0.4 0.063 0.331 2-Methylnaphthalene1/2, SL-3/5, SL Apr-14 0.345 2-Methylphenol 2,800 NA NA 2,800 2,800 0.4 0.305 0.331 2-Methylphenol1/2, SL-3/5, SL Apr-14 0.345 4-Methylphenol 2,800 NA NA 2,800 2,800 0.4 0.305 0.331 4-Methylphenol1/2, SL-3/5, SL Apr-14 0.259 Naphthalene 230 20 3.9 230 20 0.4 0.045 0.331 Naphthalene1/2, SL-3/5, SL Apr-14 1.727 2-Nitroaniline NA NA NA NA NA 2 1.525 1.655 2-Nitroaniline1/2, SL-3/5, SL Apr-14 1.727 3-Nitroaniline NA 82 18 82 NA 2 1.525 1.655 3-Nitroaniline1/2, SL-3/5, SL Apr-14 1.727 4-Nitroaniline NA 82 23 82 NA 2 1.525 1.655 4-Nitroaniline1/2, SL-3/5, SL Apr-14 0.345 Nitrobenzene 28 280 31 280 28 0.4 0.305 0.331 Nitrobenzene1/2, SL-3/5, SL Apr-14 0.345 2-Nitrophenol NA NA NA NA NA 0.4 0.305 0.331 2-Nitrophenol1/2, SL-3/5, SL Apr-14 1.727 4-Nitrophenol NA NA NA NA NA 2 1.525 1.655 4-Nitrophenol1/2, SL-3/5, SL Apr-14 0.345 N-Nitroso-di-N-propylamine 0.66 0.25 0.069 0.66 0.25 0.4 0.305 0.331 N-Nitroso-di-N-propylamine1/2, SL-3/5, SL Apr-14 0.345 N-Nitrosodiphenylamine 140 350 99 350 140 0.4 0.305 0.331 N-Nitrosodiphenylamine1/2, SL-3/5, SL Apr-14 345 2,2'-oxybis(1-Chloropropane) 2,300 NA NA 2,300 2,300 400 305 331 2,2'-oxybis(1-Chloropropane)1/2, SL-3/5, SL Apr-14 1.727 Pentachlorophenol 6 9 3 9 6 2 1.525 1.655 Pentachlorophenol1/2, SL-3/5, SL Apr-14 0.723 Phenanthrene NA NA NA NA NA 0.073 2.04 0.056 Phenanthrene1/2, SL-3/5, SL Apr-14 0.345 Phenol 10,000 180,000 18,000 180,000 10,000 0.4 0.305 0.331 Phenol1/2, SL-3/5, SL Apr-14 0.704 Pyrene 1,700 17,000 1,700 17,000 1,700 0.146 1.89 0.076 Pyrene1/2, SL-3/5, SL Apr-14 0.345 1,2,4-Trichlorobenzene 68 400 87 400 68 0.4 0.305 0.331 1,2,4-Trichlorobenzene1/2, SL-3/5, SL Apr-14 0.345 2,4,5-Trichlorophenol 5,600 62,000 6,100 62,000 5,600 0.4 0.305 0.331 2,4,5-Trichlorophenol1/2, SL-3/5, SL Apr-14 0.345 2,4,6-Trichlorophenol 62 160 44 160 62 0.4 0.305 0.331 2,4,6-Trichlorophenol
Dioxin and Furans (ng kg-1) Dioxin and Furans (ng kg-1)1/2, SL-3/5, SL Apr-14 0.867 2,3,7,8-TCDD NA 18 4.3 18 4.3 0.784 0.927 0.89 2,3,7,8-TCDD
Tributyltin (mg kg-1) Tributyltin (mg kg-1)1/2, SL-3/5, SL Apr-14 2.03 Tributyltin Compounds 180 18 2.05 2.2 1.85 Tributyltin Compounds
Petroleum (mg kg-1) Petroleum (mg kg-1)1/2, SL-3/5, SL Apr-14 121 TPH-DRO 37 300 24.6 TPH-DRO
Units and Reporting convention Method
Proposed VA Exclusion
Criteria6
Proposed VA Clean Fill
Criteria7
Sample ID Date
Average
Value1,2Parameter
1/2, SL-3/5, SL Apr-14 0.053
Tons CCE acid demand per 1000 Tons Material
EPA 600-2-78-054
-10 unless under water
table-5 0.10 0.06 0.00 Acid-base accounting
(all samples > 0.25% total S)
1/2, SL-3/5, SL Apr-14 0.130 % or g kg-1 2.00 0.25 0.14 0.13 0.12 Sulfur
1/2, SL-3/5, SL Apr-14 2.770 %CCE AOAC 955.01 NA NA 3.40 1.96 2.95 Calcium Carbonate Equivalence
1/2, SL-3/5, SL Apr-14 0.140
mmhos cm-1
or dS m-1
Saturated paste extract NA 4.0
after leaching 0.00 0.00 0.42 Soluble Salts
1/2, SL-3/5, SL Apr-14 5.267 % or g kg-1 NA < 5% 5.70 5.50 4.60 Total Organic Carbon
1/2, SL-3/5, SL Apr-14 29.000 %Sand NA NA 27 20 40 PSA (Sand)
1/2, SL-3/5, SL Apr-14 58.667 % Silt NA NA 63 71 42 PSA (Silt)
1/2, SL-3/5, SL Apr-14 12.000 % Clay NA NA 10 8 18 PSA (Clay)
1/2, SL-3/5, SL Apr-14 0.000 >2 mm samples NA 0 0 0 Coarse fragments (> 2 mm)
Working Area: You can enter your individual sample results here to be averaged in column "C"
to left1,2 (Note: this working area will not show up in the print window)
Total Organic Carbon
Additional Analyses9
Acid-Base Accounting (all samples > 0.25% total S) or H2O2 Potential Acidity
Coarse fragments (>2 mm)
<2 mm samples Particle Size Analysis (<2 mm)
Pyritic SCalcium Carbonate Equivalence
Soluble Salts
Values from your sample analyses go here
Page 3 of 3

Dredge Material Soil Screening Levels
3. New Jersey Department of Environmental Protection, The Management and Regulation of Dredging Activities and Dredged Material in New Jersey’s Tidal Waters. 1997.http://www.njstatelib.org/digit/r588/r5881997.html
5. Background metal levels specific to the state of Virginia based on Smith, D.B. et al. 2005. Major- and Trace-Element Concentrations in Soils from Two Continental-Scale Transects of the United States and Canada. USGS Open File Report 2005-1253.http://pubs.usgs.gov/of/2005/1253/pdf/OFR1253.pdf
8. Total Aroclor concentrations are reported as sum of seven individual aroclors.
2. Use bold highlight for all individual samples entered in working area and average sample values that exceed the "proposed VA upland fill criteria" in far right column. Highlight all values exceeding proposed VA exclusion criteria in bold highlight red. Put arbitrary values calculated as 50% the RL in italics . Tip: when copying numbers from your lab analytical results spreadsheets to this spreadsheet, samples with a "<" in front of them are typically at the RL and should reported as 50% RL and put in italics .
6. The proposed Virginia exclusion standards generally represent the higher of EPA RBC Industrial, NJDEP or EPA 503 EQ levels for a given parameter. Values exceeding these limits are questionable for acceptance.
9. Additional analyses for these basic properties are essential for determining the management or acceptance of dredge material.
7. Proposed VA clean fill criteria are based primarily on NJDEP residential cleanup criteria and manually adjusted for known issues with agricultural production/bioavailability. Values between the clean fill and exclusion criteria require a variation of the current management strategy.
Note: Minimum sampling is one composite sample per 50,000 yards of material in situ. A minimum of three samples per material is required regardless of volume. Specific information on sampling procedures should go into the brief descriptions box at the top of the spreadsheet.
4. EPA Region 3 SSLs have been merged into a regional document developed with input from Regions III, VI, and IX. Values from September 12, 2008 version. Values listed for: antimony (metallic), arsenic (inorganic), chromium VI (particulates), lead and compounds, manganese and cadmium values are for diet, methyl mercury, nickel refinery dust, vanadium and compounds. Website: http://www.epa.gov/reg3hwmd/risk/human/rb-concentration_table/Generic_Tables/index.htm
NA= Indicates that criteria are not available.
1. Enter values for each discrete or composite sample into a separate column. Also provide an overall average for all samples in the right-hand data column. For samples <RL, use 50% of RL for data entry column. One-half the RL is assumed for chemicals reported as non-detect or < RL; however, these values will not be used for exclusionary purposes unless other evidence indicates such. Values in italics are not "real" values, but an arbitrary entry.
Page 1 of 1

36
ATTACHMENT 5 City of Alexandria City Marina Dredge Sediment Potential
Peroxide Acidity (PPA) Analyses

37
Brief description: Potential peroxide acidity (PPA) for composites of all pre-dredging material received in 2014 from the City of Alexandria City Marina. Values equate to net lime demand expressed as tons of 100% CCE agricultural lime per 1000 dry tons of inbound material.
Sample ID Tons CaCO3/1000 Tons Material SL-1/2 0.10
SL-3/5 0.06
SL-4/6 0.00

38
ATTACHMENT 6 City of Alexandria City Marina Dredge Sediment Calcium
Carbonate Equivalent (CCE) Analysis

39
Brief description: Calcium carbonate equivalent (CCE) for composites of all City of Alexandria City Marina dredge material received in April 2014.
Sample ID %CCE SL-1/2 3.40
SL-3/5 1.96
SL-4/6 2.95