Embed Size (px)
Citation preview

Weather 101Weather 101Chris Geraci
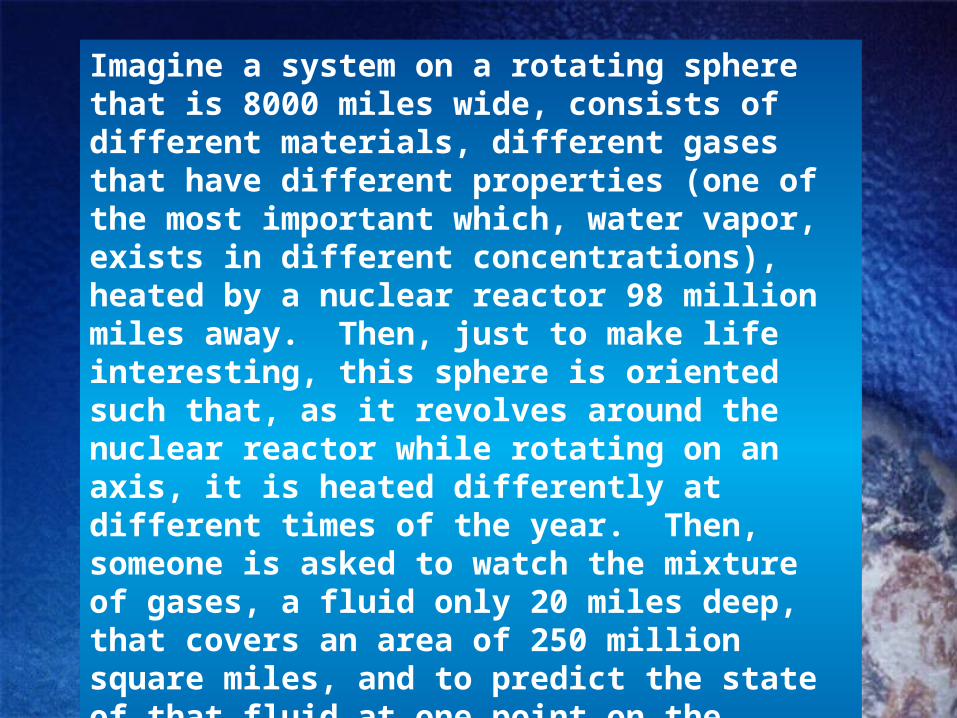
Imagine a system on a rotating sphere that is 8000 miles wide, consists of different materials, different gases that have different properties (one of the most important which, water vapor, exists in different concentrations), heated by a nuclear reactor 98 million miles away. Then, just to make life interesting, this sphere is oriented such that, as it revolves around the nuclear reactor while rotating on an axis, it is heated differently at different times of the year. Then, someone is asked to watch the mixture of gases, a fluid only 20 miles deep, that covers an area of 250 million square miles, and to predict the state of that fluid at one point on the sphere two days from now. This is the problem that Weather Forecasters face EVERY DAY!

TopicsTopics
2. Sky Condition (SkyCon) 2. Sky Condition (SkyCon)
3. Visibility / Weather3. Visibility / Weather
4. Winds 4. Winds
5. Warnings5. Warnings
1. Pressure Systems 1. Pressure Systems
6. Astronomical / Tidal Data 6. Astronomical / Tidal Data

• Low Pressure– Region between air masses where pressure
is lower than surrounding area.– Can occur as either a circulation (cyclone) or
trough. Cyclones include migratory lows commonly associated with frontal systems, tropical cyclones, and thermal lows.
– Lows are frequently associated with atmospheric lift that produces clouds, precipitation, and thunderstorms
Pressure Systems Pressure Systems L

Pressure Systems Pressure Systems
• Low Pressure
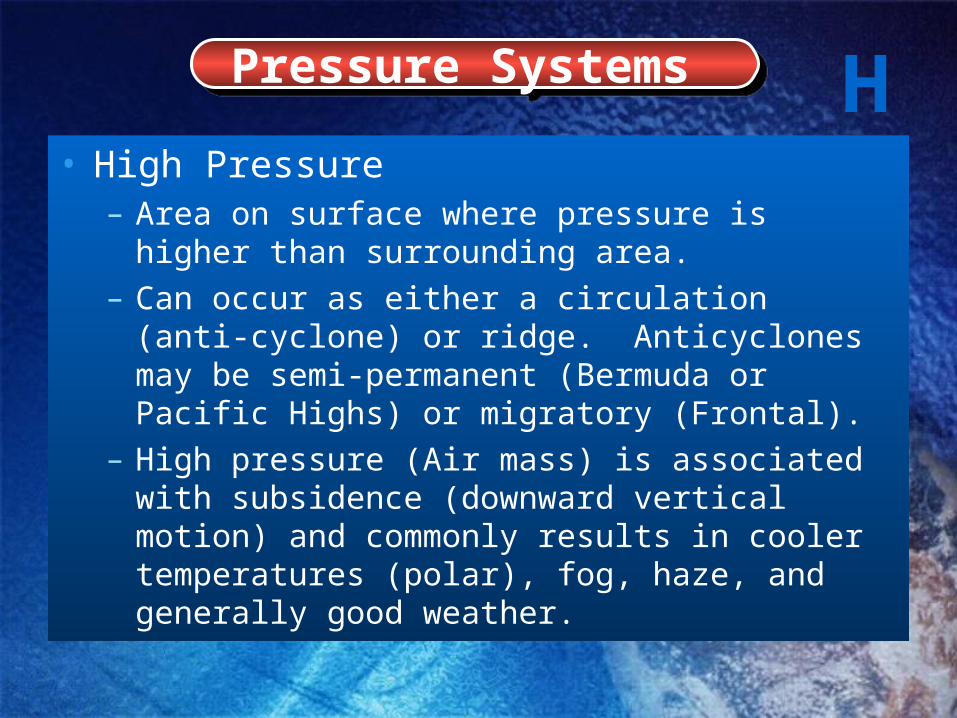
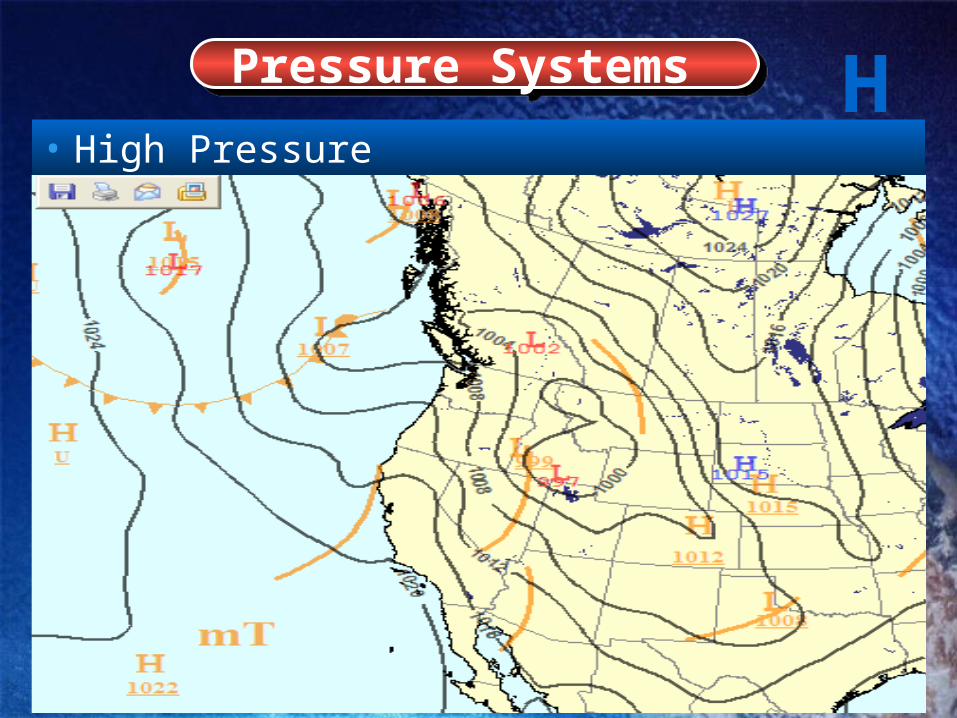
• High Pressure– Area on surface where pressure is higher than
surrounding area.– Can occur as either a circulation (anti-cyclone) or
ridge. Anticyclones may be semi-permanent (Bermuda or Pacific Highs) or migratory (Frontal).
– High pressure (Air mass) is associated with subsidence (downward vertical motion) and commonly results in cooler temperatures (polar), fog, haze, and generally good weather.
Pressure Systems Pressure Systems H
Pressure Systems Pressure Systems H• High Pressure

• Frontal Systems
Pressure Systems Pressure Systems

• Frontal Systems– Cold front depicts cold air replacing warm or
cool air.– Warm front depicts warm air replacing cold or
cool air. – Stationary front depicts little to no advection
across the frontal boundary.– Occlusion depicts a complex interaction when
a cold front overtakes a warm front.
Pressure Systems Pressure Systems

Definitions: Celestial Dome – The sky as seen from
horizon to horizon Layer – Any phenomenon aloft is considered
a layer including clouds, smoke, etc Ceiling – Cloud cover greater than ½ the
celestial dome. Obscuration – any surface based
phenomenon that restricts view of the celestial dome and is reported as SkyCon
Vertical visibility – Height the observer is able to see during a total obscuration.
SkyCon SkyCon
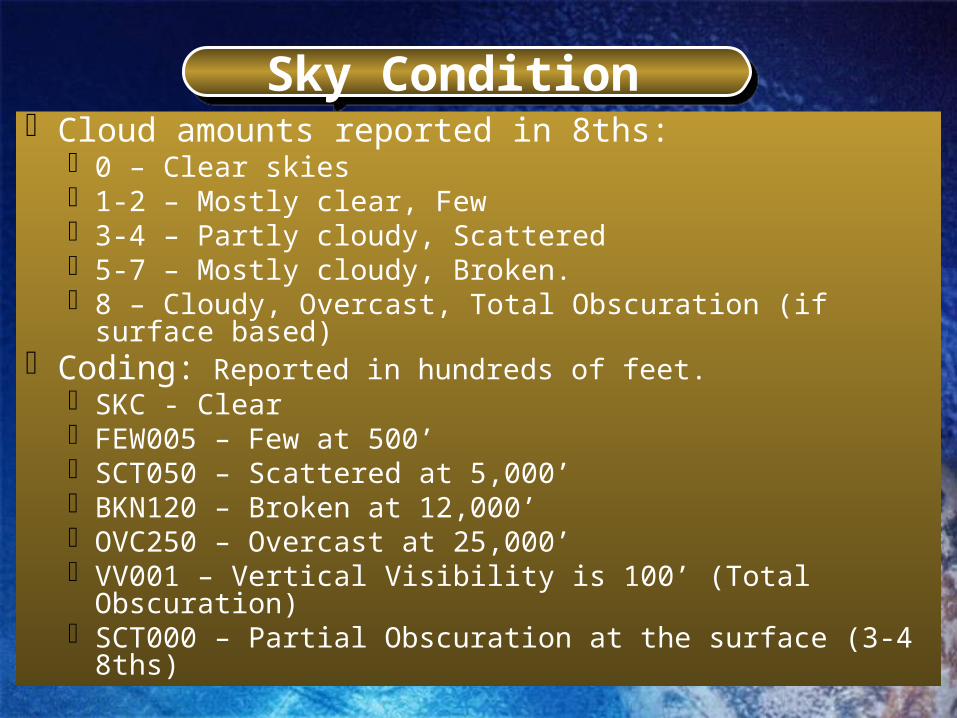
Cloud amounts reported in 8ths: 0 – Clear skies 1-2 – Mostly clear, Few 3-4 – Partly cloudy, Scattered 5-7 – Mostly cloudy, Broken. 8 – Cloudy, Overcast, Total Obscuration (if surface based)
Coding: Reported in hundreds of feet. SKC - Clear FEW005 – Few at 500’ SCT050 – Scattered at 5,000’ BKN120 – Broken at 12,000’ OVC250 – Overcast at 25,000’ VV001 – Vertical Visibility is 100’ (Total Obscuration) SCT000 – Partial Obscuration at the surface (3-4 8ths)
Sky Condition Sky Condition

Low CloudsLow Clouds
1 – Cumulus (CU)
2 – Towering Cumulus (TCU)
3 – Cumulonimbus (CB) w/out anvil
4 – Stratocumulus (SC) from CU
5 – SC not from CU
6 – Stratus (ST)
7 – Stratus fractus (Bad Weather
8 – Cu and SC not from CU
9 – CB w/ anvil
Mid CloudsMid Clouds
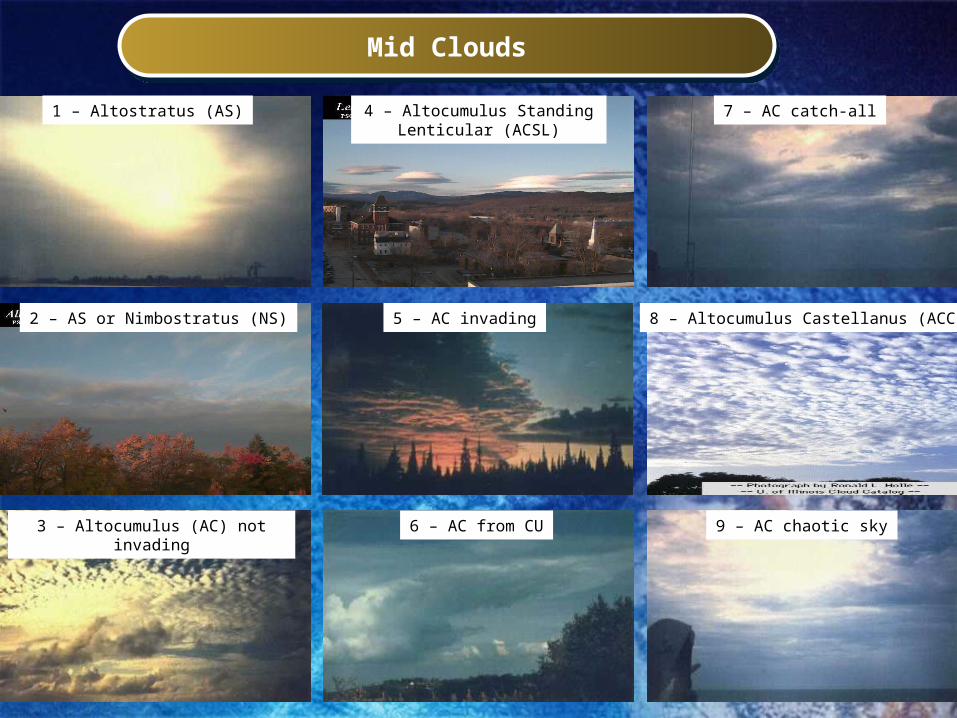
1 – Altostratus (AS)
2 – AS or Nimbostratus (NS)
3 – Altocumulus (AC) not invading
4 – Altocumulus Standing Lenticular (ACSL)
5 – AC invading
6 – AC from CU
7 – AC catch-all
8 – Altocumulus Castellanus (ACC)
9 – AC chaotic sky

High CloudsHigh Clouds
1 – Cirrus (CI) hooks and filaments not invading
2 – CI patches
3 – Dense CI anvil
4 – CI hooks and filaments invading
5 – Cirrostratus (CS) invading <45
6 – CS invading >45
7 – CS complete cover
8 – CS not invading and not covering
9 – Cirrocumulus (CC)

Visibility / WeatherVisibility / Weather Definitions:
Prevailing Visibility – Greatest visibility throughout at least half of the horizon circle and not necessarily continuous. Unrestricted visibility is reported as 7 miles or greater.
Sector visibility – Reported when either prevailing or sector visibility is below 3 miles.
Variable Prevailing Visibility - A condition when the prevailing visibility is less than 3 miles and rapidly increasing and decreasing by ½ SM or more during the period of observation
Coding: Can be reported in statute mile or coded value in meters. 7 = 9999, 6 = 9000, 5 = 8000, 4 = 6000, 3 = 4800, 2 ½ =
4000, 2 = 3200, 1 ½ = 2400, 1 = 1600, ½ = 800

Visibility / WeatherVisibility / Weather

Visibility / WeatherVisibility / Weather Precipitation/Weather:
The “+” or “-” sign indicates intensity, not any change. (e.g. +SHRA indicates heavy rainshowers, not rainshowers increasing in intensity)
The “+” or “-” in front of a thunderstorm indicates the intensity of precipitation associated with the thunderstorm, not the severity of the storm. (e.g. –TSRA indicates thunderstorms with light rainshowers, not light thunderstorms)
The “+” in front of a Funnel Cloud indicates tornado or waterspout. A “-” is never used with FC. A funnel cloud becomes a tornado or waterspout when it touches the surface.
The three types of precipitation are liquid (hits the surface as liquid), freezing (liquid freezes upon contact with surface)and frozen (hits surface already frozen).Freezing precipitation poses a significant threat to aircraft (icing).
Fog is reported when visibility is reported at ½ mile or less. Mist is reported when visibility is greater than ½ mile.
It is possible to have fog, haze or mixed, depending on RH%.

Visibility / WeatherVisibility / Weather Thunderstorms:
All thunderstorms have lightning and thunder. Lightning can strike over 5 miles away. For reporting purposes, a thunderstorm is considered on
station if thunder is heard, regardless of how far away the storm.
Severe weather associated with thunderstorms includes tornados, waterspouts, hail, downdrafts (microburst), turbulence, icing, and heavy precipitation.
Thunderstorms pose the most significant weather threat to personnel, equipment, and operations.
Fueling/Refueling, arming/de-arming, and EOD functions should cease during thunderstorms.
Aviation assets cannot fly in or near thunderstorms which severely restricts medevac, casevac, CAS, and resupply.

Definitions: Prevailing wind direction – Reported to the nearest 10
degrees using true north FROM the direction the wind is blowing. Uses 2 minute average.
Prevailing wind speed – Reported to the nearest whole degree in knots. Uses 2 minute average.
Gusts – Reported when there are rapid fluctuations of speed with at least 10 knots between peaks and lulls.
Squall – A sudden increase of wind speed of at least 16 knots with a sustained speed of 22 knots for at least a minute. A squall is usually associated with convective activity.
Variable winds – used when winds are less than 6 knots OR when the wind direction is varying by 60 degrees or more and speeds are in excess of 6 knots.
Winds Winds

Coding: Winds direction is reported from the direction the winds are
blowing using 3 digits. A westerly wind would be reported as 270. Winds are typically discussed using the 8 point compass to determine direction (N, NE, E, SE, S, SW, W, NW).
Wind speed is reported in knots using 2 digits (tens and units) unless the speed is in excess of 100 knots.
Gusts are reported using 2 digits unless the speed is in excess of 100 knots. The gusts are reported immediately after the prevailing wind speed and separated by a G.
A northeasterly wind at 12 knots, gusting to 24 knots would be reported as 04012G24KT.
Light variable winds are reported using the letters VRB. If the speed is more than six knots, the average direction is reported and the degrees of variability are listed immediately following the wind group
A variable wind at 4 knots would be reported as VRB04KT A Northwesterly through Northeasterly variable wind at 8 knots
would be reported as VRB08 KT 330V030
Winds Winds
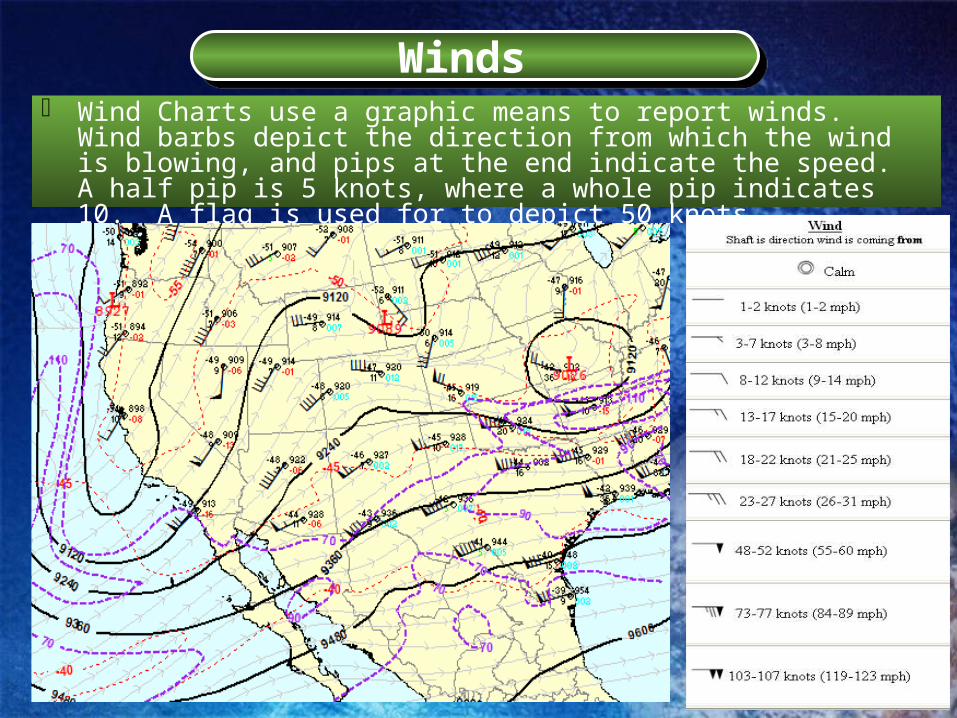
Wind Charts use a graphic means to report winds. Wind barbs depict the direction from which the wind is blowing, and pips at the end indicate the speed. A half pip is 5 knots, where a whole pip indicates 10. A flag is used for to depict 50 knots.
Winds Winds

Tropical Storms: Hurricane/Typhoon > 63 KT Tropical Storm 34-63 KT Tropical Depression < 34
Thunderstorms Thunderstorm Condition 2 (Watch) – Expected w/in 25 miles Thunderstorm Condition 1 (Warning) – Expected w/in 5-10 miles Thunderstorm Advisory – Generally 25 – 50 miles (not used by all)
Wind Wind Warning – For winds sustained 20-33 KT or gusts above 30 KT Gale Warning – For sustained winds 34-48 KT Storm warning – For sustained winds > 48 KT
Freeze Warning – Temperatures below 28F Heat Stress (Wet Bulb Globe Temperature Indez – WBGTI)
Wet Bulb Temp x .7 + Air Temp x .2 + Globe Temp x .1
WarningsWarnings

Definitions: BMNT – Begin Morning Nautical Twilight – Sun is 12o below the
horizon. Celestial navigation no longer possible. BMCT – Begin Morning Civil Twilight – Sun is 6o below the
horizon. Only the brightest stars and planets are visible. Artificial light is usually no longer required.
Sunrise – Period when the sun first becomes visible on the horizon
Sunset – Period when the sun is no longer visible on the horizon
EECT – End Evening Civil Twilight - Sun is 6o below the horizon. Only the brightest stars and planets are visible. Artificial light is usually no longer required.
EENT – End Evening Nautical Twilight - Sun is 12o below the horizon. Celestial navigation no longer possible.
Solar Data Solar Data

Definitions: Moonrise – Period when the moon is visible on the horizon. Moonset - Period when the moon is no longer visible on the
horizon. Illumination – Percent of light available from the moon
compared to full moon. Full Moon – Period when lunar illumination is at its highest for
that lunar cycle (usually 98% - 100%) New Moon – Period when the lunar illumination is at its lowest
for that lunar cycle (usually 0% - 1%) Waxing Moon – Daily lunar illumination is increasing and
approaching a full moon. Waning Moon – Daily lunar illumination is decreasing and
approaching New Moon. LUX - Is a value used to determine the light over a given area
(e.g. .0022 lux=starlight, .27 lux=full moon, 10-25k lux=Daylight)
Lunar Data Lunar Data

Lunar Data Lunar Data

Tidal ranges (amplitude) can vary by as little as half a foot to over 50 feet. Tidal currents can range from near zero to over 6 knots depending on location. Tides are either Diurnal (1 high & low per day), or semidiurnal (2 highs & 2 lows / day)
Definitions: Tidal currents – Currents that flow independent of the prevailing
surface currents and are responsible for transporting tidal water water to and from the shoreline. These currents are affected by both the moon and the sun.
Flood Tide – The rising tide of the ocean until it crests at high tide (high water mark).
Ebb Tide – The lowering tide of the ocean until it bottoms out at low tide (low water mark).
Slack Tide – The period when the currents are changing direction, usually corresponds with high and low tide.
Tidal Data Tidal Data

Tidal Data Tidal Data

TIDES BY LOCATIONTIDES BY LOCATION

ExampleExample
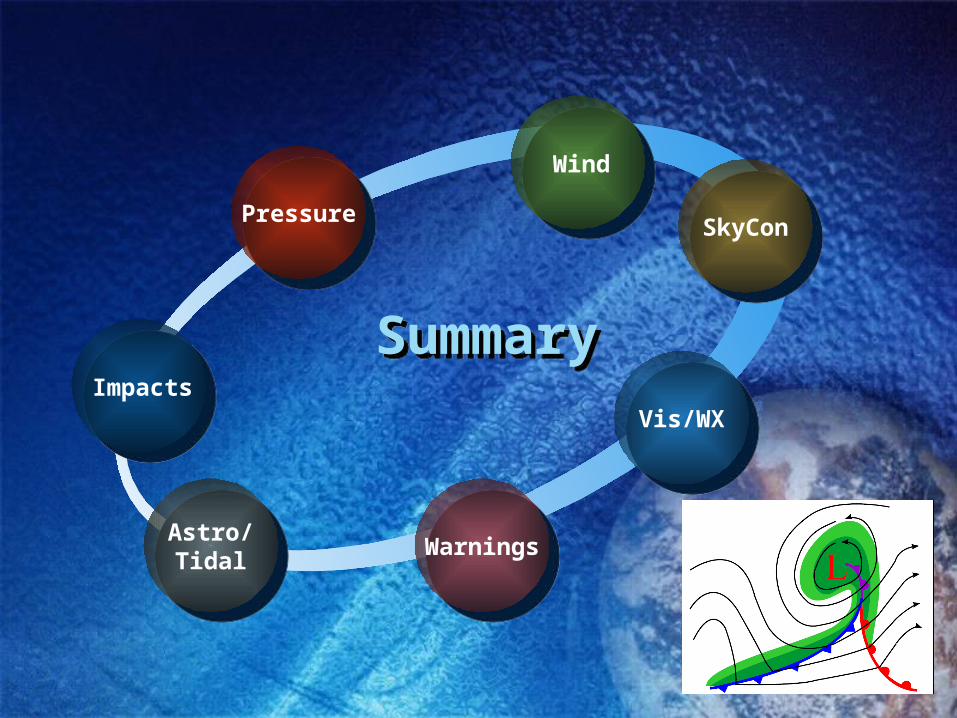
Summary Summary
Astro/Tidal
Astro/Tidal
Wind
Impacts
PressurePressure
WarningsWarnings
Vis/WXVis/WX
SkyConSkyCon