Embed Size (px)
DESCRIPTION
grade 9
Citation preview
Weather and ClimateWeather and Climate
Objectives:Objectives:Distinguish between weather and climateDistinguish between weather and climateDescribe the formation of frontsDescribe the formation of frontsAnalyze a weather mapAnalyze a weather mapDescribe conditions generating severe weatherDescribe conditions generating severe weather
Weather vs. ClimateWeather vs. Climate
Weather is the current atmospheric Weather is the current atmospheric conditionsconditions
Climate is the long term general weather Climate is the long term general weather conditions over many yearsconditions over many years
Climate Depends on LatitudeClimate Depends on Latitude
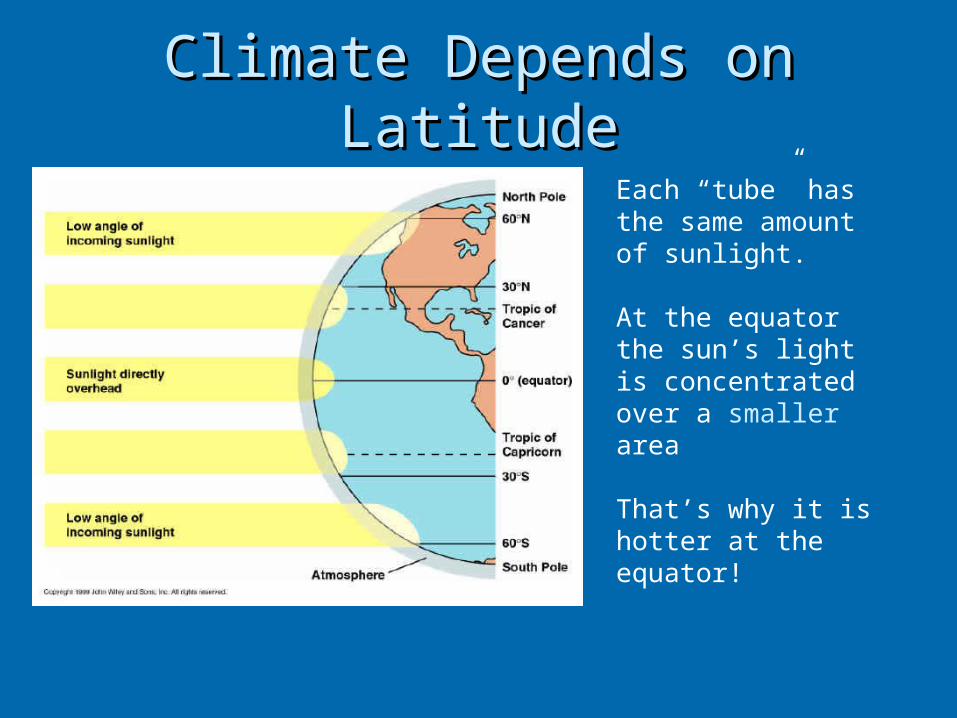
Each “tube” has the same amount of sunlight.
At the equator the sun’s light is concentrated over a smaller area
That’s why it is hotter at the equator!
SeasonsSeasons
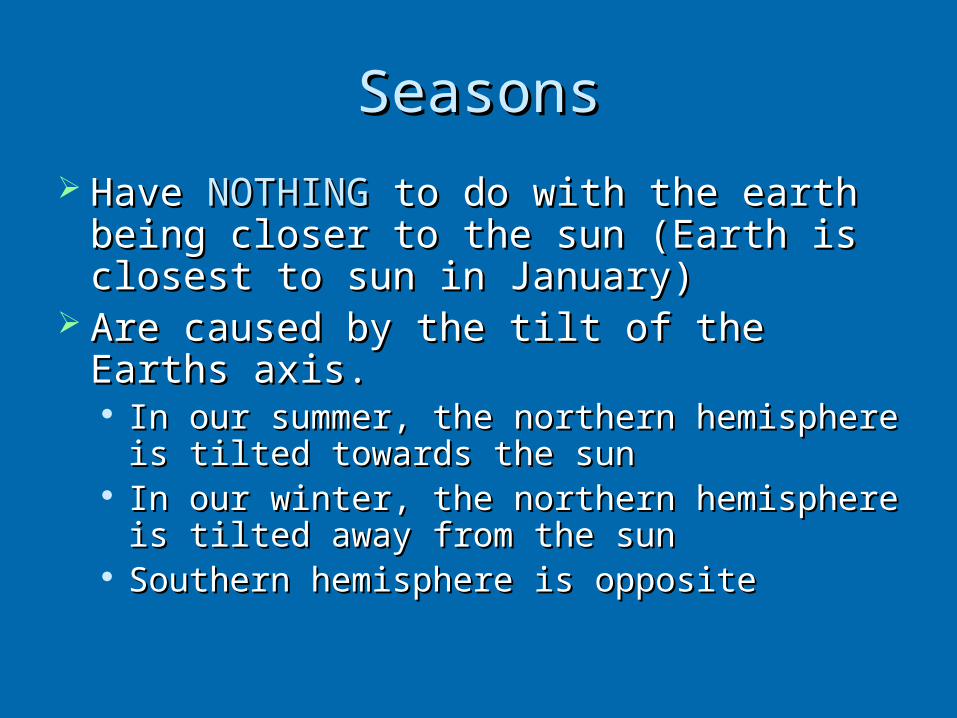
Have Have NOTHINGNOTHING to do with the earth being to do with the earth being closer to the sun (Earth is closest to sun in closer to the sun (Earth is closest to sun in January)January)
Are caused by the tilt of the Earths axis.Are caused by the tilt of the Earths axis. In our summer, the northern hemisphere is In our summer, the northern hemisphere is
tilted towards the suntilted towards the sun In our winter, the northern hemisphere is tilted In our winter, the northern hemisphere is tilted
away from the sunaway from the sun Southern hemisphere is oppositeSouthern hemisphere is opposite
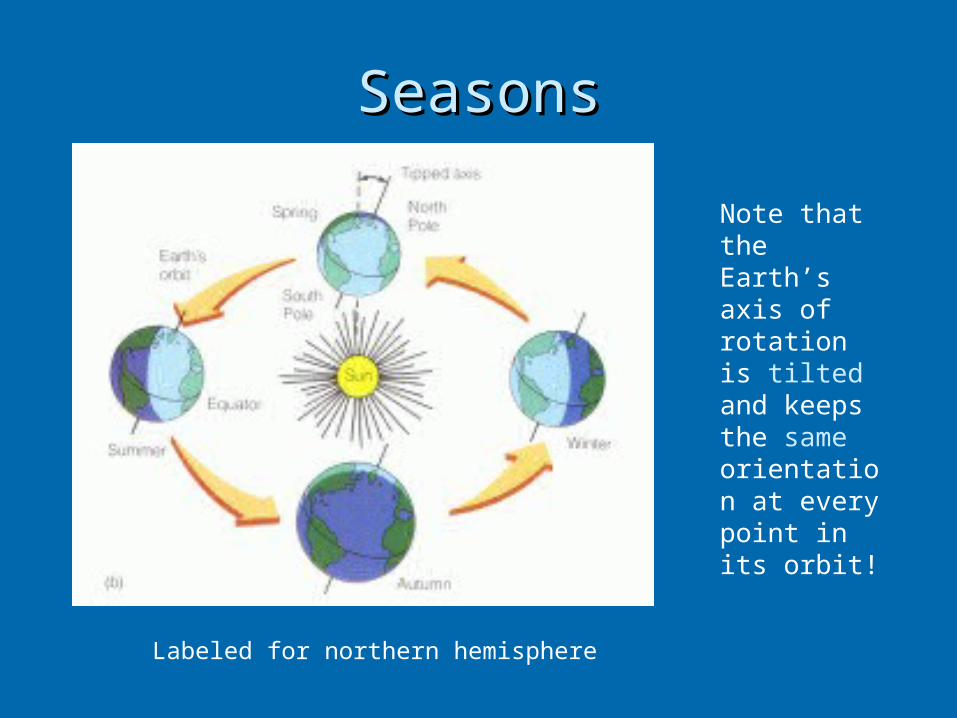
SeasonsSeasons
Labeled for northern hemisphere
Note that the Earth’s axis of rotation is tilted and keeps the same orientation at every point in its orbit!
SeasonsSeasons
More hours of sunlight in summerMore hours of sunlight in summer More radiative heating from sunMore radiative heating from sun Fewer hours of darknessFewer hours of darkness Less unbalanced radiative cooling at nightLess unbalanced radiative cooling at night Average temperature risesAverage temperature rises
Oceans Affect Weather and Oceans Affect Weather and ClimateClimate
Oceans are the most important solar-energy collectors. Water heats and cools more slowly than land, making
coastal areas milder than inland areas Ocean currents are giant rivers of seawater flowing at
the surface of the oceans, set in motion by prevailing winds.
Ocean currents move heat between the tropics and polar regions, helping to maintain Earth’s energy balance.
The oceans are also a major source of oxygen for the air and moisture for the atmosphere.
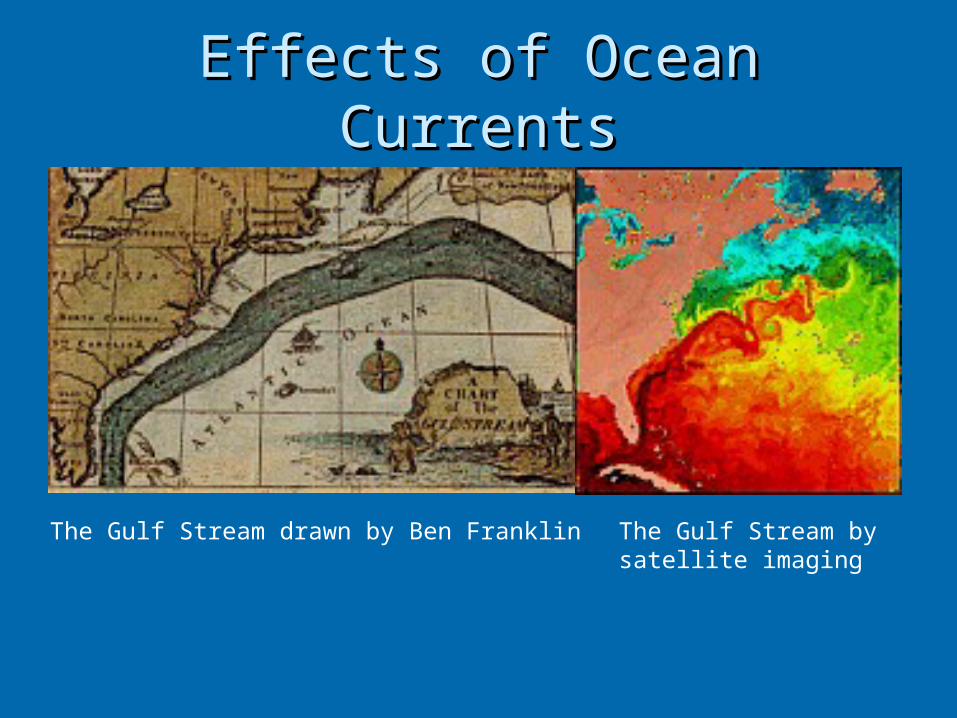
Effects of Ocean CurrentsEffects of Ocean Currents
The Gulf Stream drawn by Ben Franklin The Gulf Stream by satellite imaging
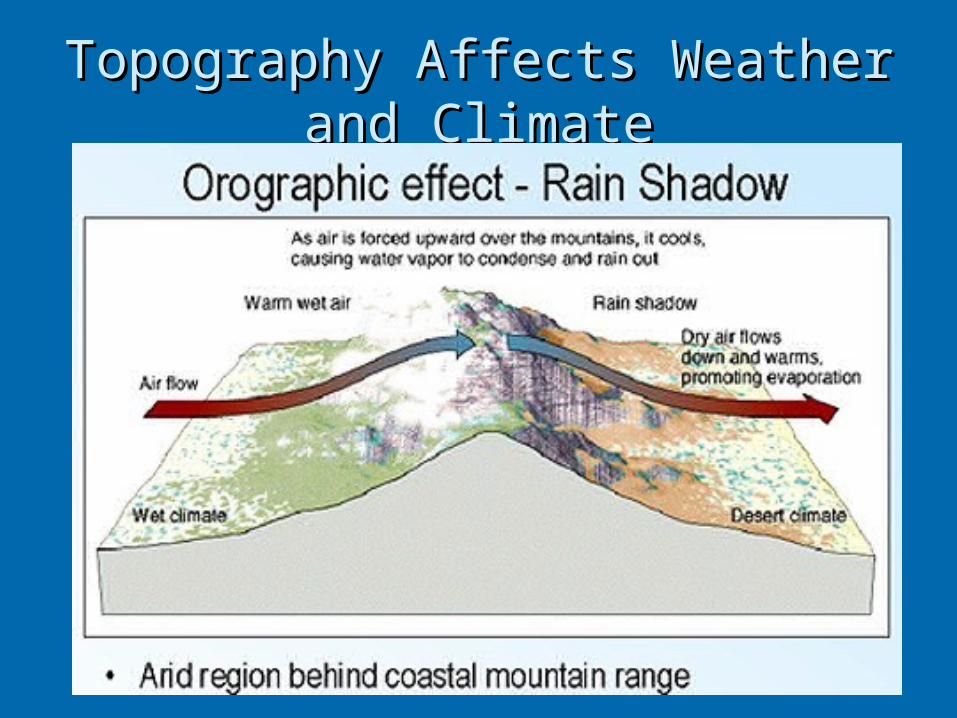
Topography Affects Weather and Topography Affects Weather and ClimateClimate
Winds blowing across Winds blowing across large bodies of water large bodies of water moderate climate moderate climate because water does not because water does not heat or cool as fast as heat or cool as fast as landland
Mountains force warm air Mountains force warm air to rise, leading to cooling to rise, leading to cooling and precipitation on one and precipitation on one side, deserts on the other side, deserts on the other
Weather TermsWeather Terms
Weather predictionWeather prediction: tracking the : tracking the movement of movement of air massesair masses
Air mass: Air mass: a large body of air with a large body of air with uniform temperature and humidityuniform temperature and humidity
Front: Front: boundary between air masses boundary between air masses of different densityof different density

Weather ChangesWeather Changes
When a front moves through an area there When a front moves through an area there can becan be PrecipitationPrecipitation Change in temperatureChange in temperature Change in wind directionChange in wind direction
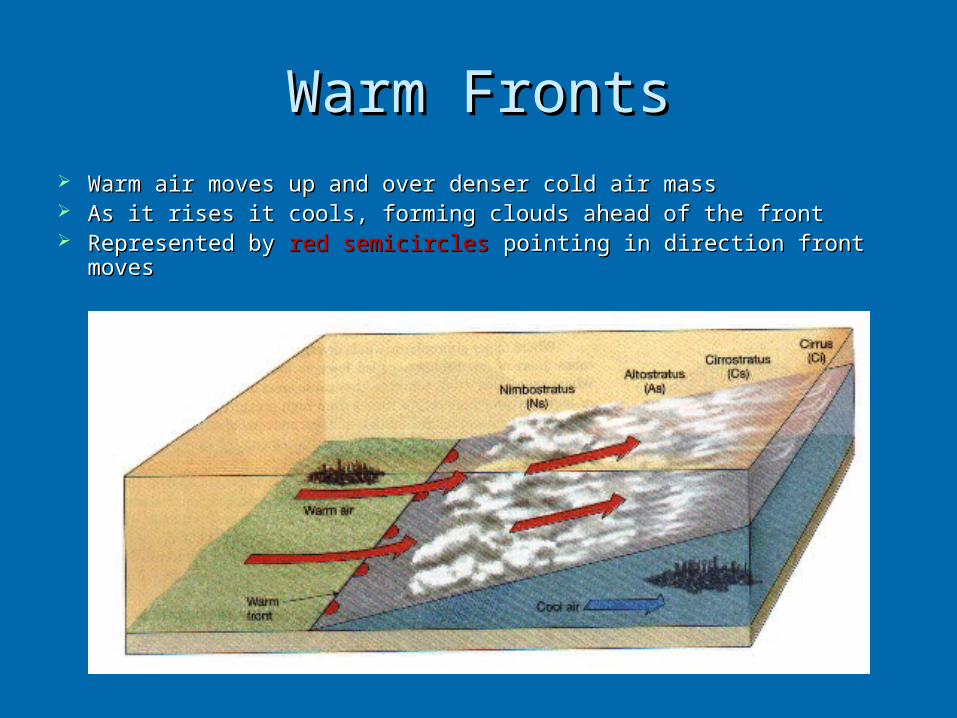
Warm FrontsWarm Fronts Warm air moves up and over denser cold air mass Warm air moves up and over denser cold air mass As it rises it cools, forming clouds ahead of the frontAs it rises it cools, forming clouds ahead of the front Represented by Represented by red semicirclesred semicircles pointing in direction front moves pointing in direction front moves
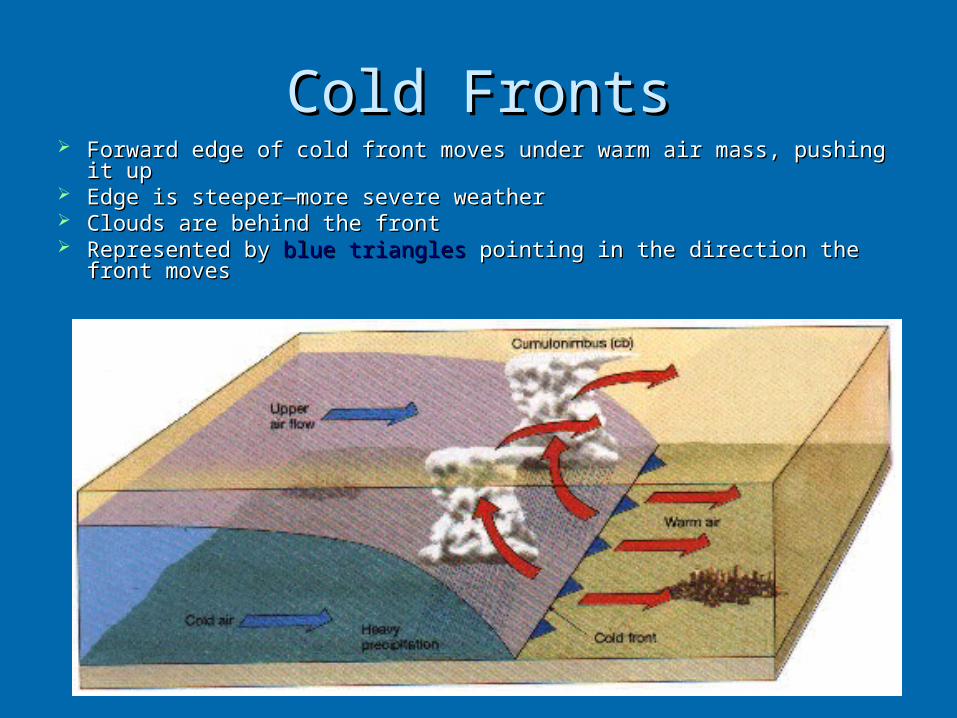
Cold FrontsCold Fronts Forward edge of cold front moves under warm air mass, pushing it upForward edge of cold front moves under warm air mass, pushing it up Edge is steeper—more severe weatherEdge is steeper—more severe weather Clouds are behind the frontClouds are behind the front Represented by Represented by blue trianglesblue triangles pointing in the direction the front moves pointing in the direction the front moves
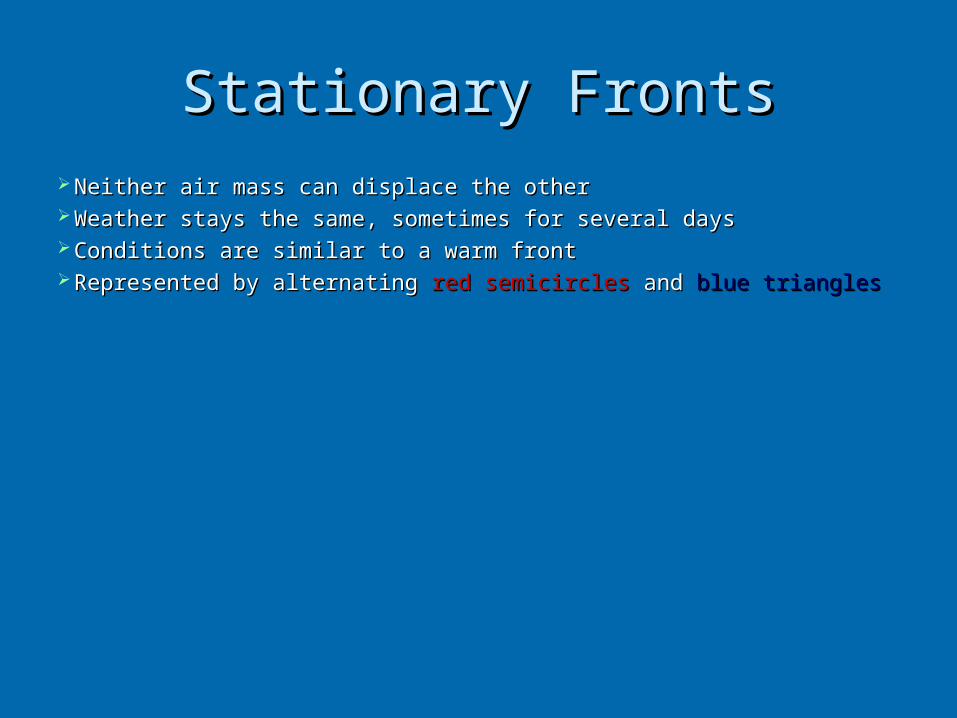
Stationary FrontsStationary Fronts Neither air mass can displace the otherNeither air mass can displace the other Weather stays the same, sometimes for several daysWeather stays the same, sometimes for several days Conditions are similar to a warm frontConditions are similar to a warm front Represented by alternating Represented by alternating red semicirclesred semicircles and and blue trianglesblue triangles
Weather MapsWeather Maps
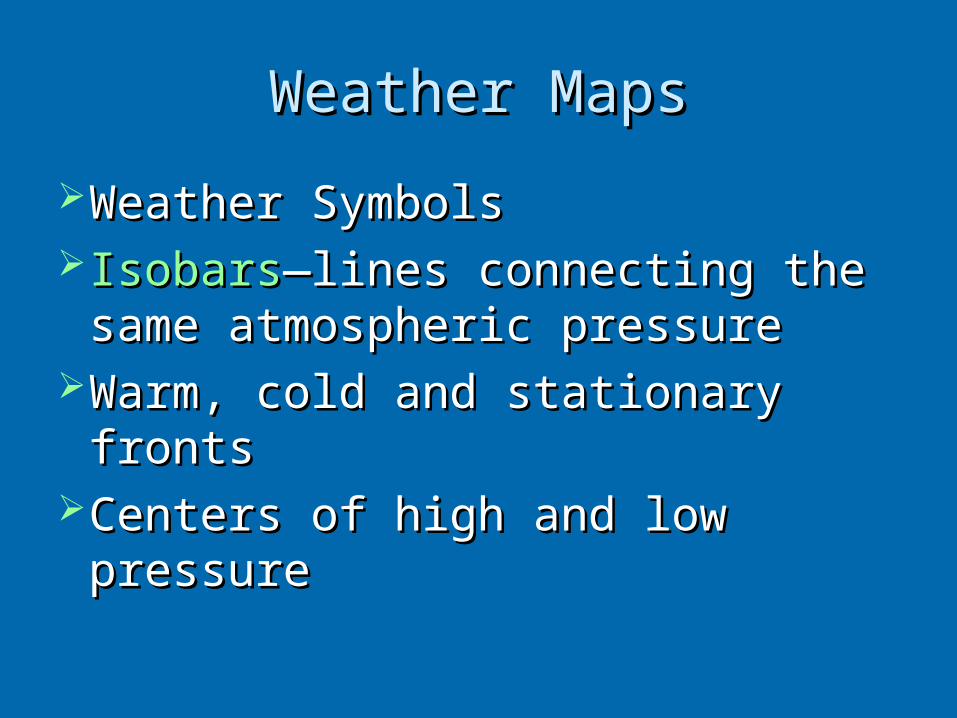
Weather SymbolsWeather Symbols IsobarsIsobars—lines connecting the —lines connecting the
same atmospheric pressuresame atmospheric pressureWarm, cold and stationary frontsWarm, cold and stationary frontsCenters of high and low pressureCenters of high and low pressure
Weather SymbolsWeather Symbols

Weather SymbolsWeather Symbols
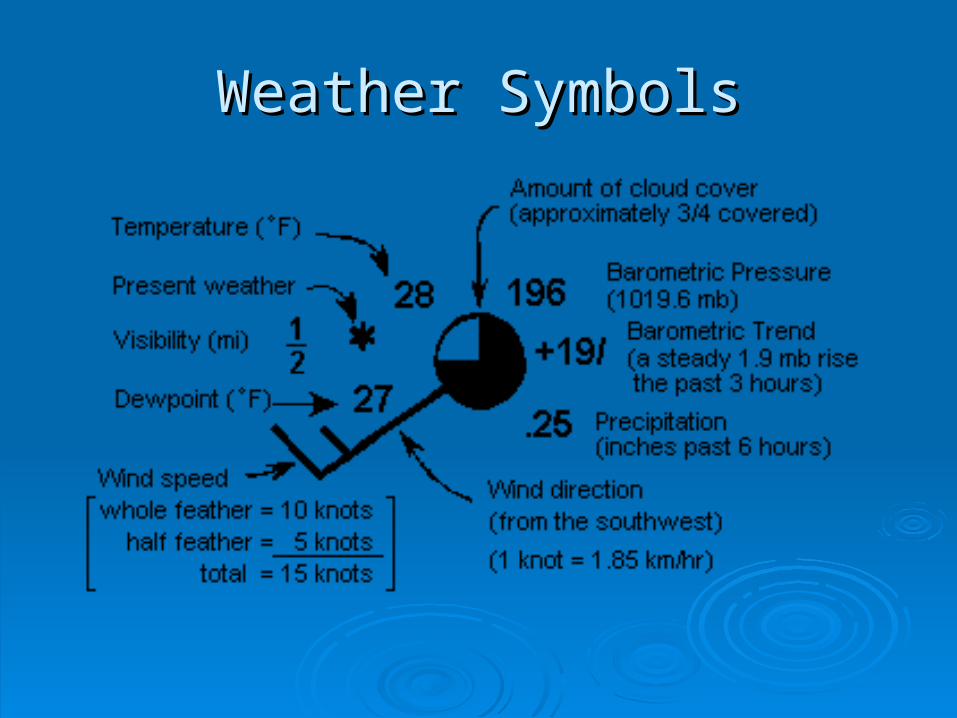
Temperature
Dew Point
Pressure (last 3 digits in mbars)
Wind BarbDirectionSpeed from feathers
¾ Cloud Cover
Symbol for weather (fog)
Is it humid?Is it windy? In what direction?Is it hot or cold?Is it mostly sunny or mostly cloudy?

Weather MapsWeather Maps
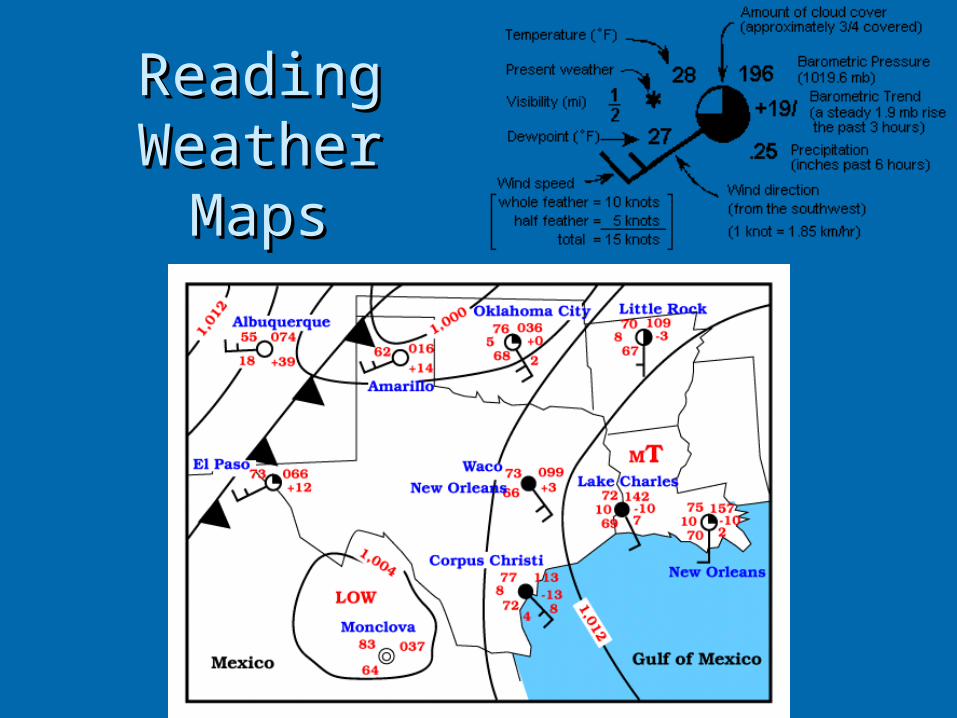
Reading Reading Weather MapsWeather Maps
Lightning and ThunderLightning and Thunder
Lightning is huge spark from built up electric Lightning is huge spark from built up electric charge on water droplets and ice crystalscharge on water droplets and ice crystals
Lightning superheats the air, generates shock Lightning superheats the air, generates shock wave which is thunderwave which is thunder
Light travels faster than sound—you see the Light travels faster than sound—you see the flash firstflash first
Sound travels 340 m/s—time after flash gives Sound travels 340 m/s—time after flash gives you an estimate of how far away the storm isyou an estimate of how far away the storm is

LightningLightning
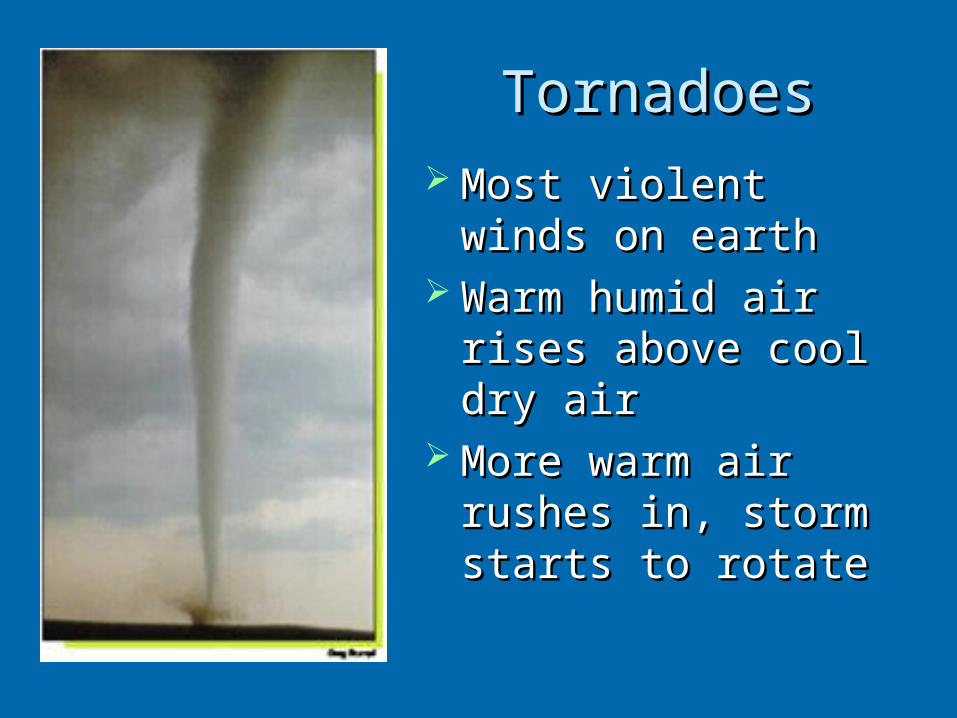
TornadoesTornadoes Most violent winds on Most violent winds on
earthearth Warm humid air rises Warm humid air rises
above cool dry airabove cool dry air More warm air rushes More warm air rushes
in, storm starts to in, storm starts to rotaterotate
Tornado FormationTornado Formation
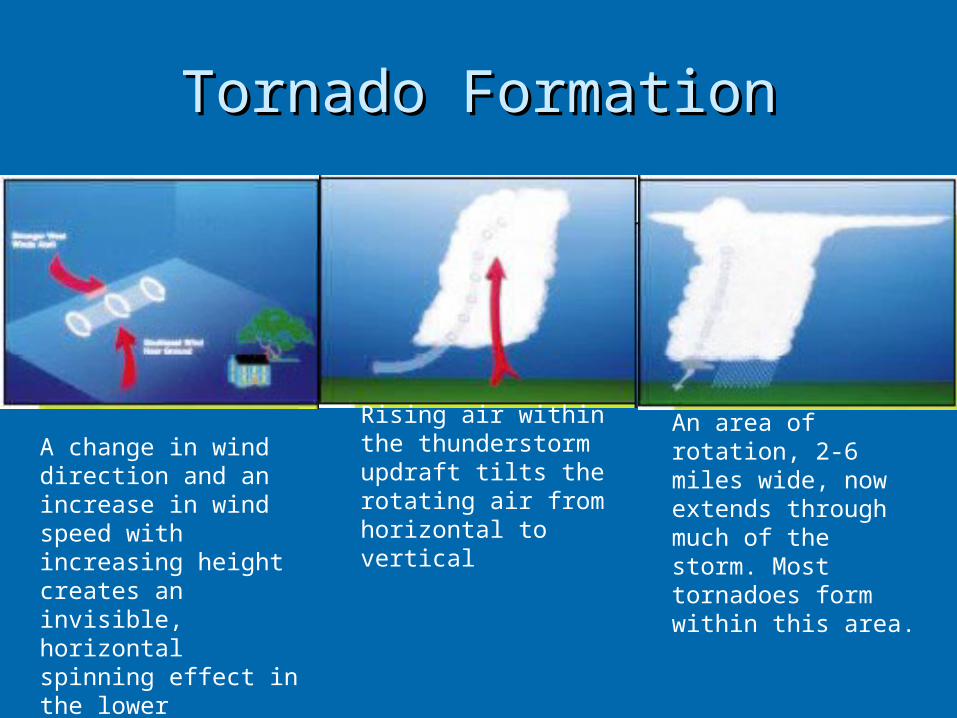
A change in wind direction and an increase in wind speed with increasing height creates an invisible, horizontal spinning effect in the lower atmosphere.
Rising air within the thunderstorm updraft tilts the rotating air from horizontal to vertical
An area of rotation, 2-6 miles wide, now extends through much of the storm. Most tornadoes form within this area.
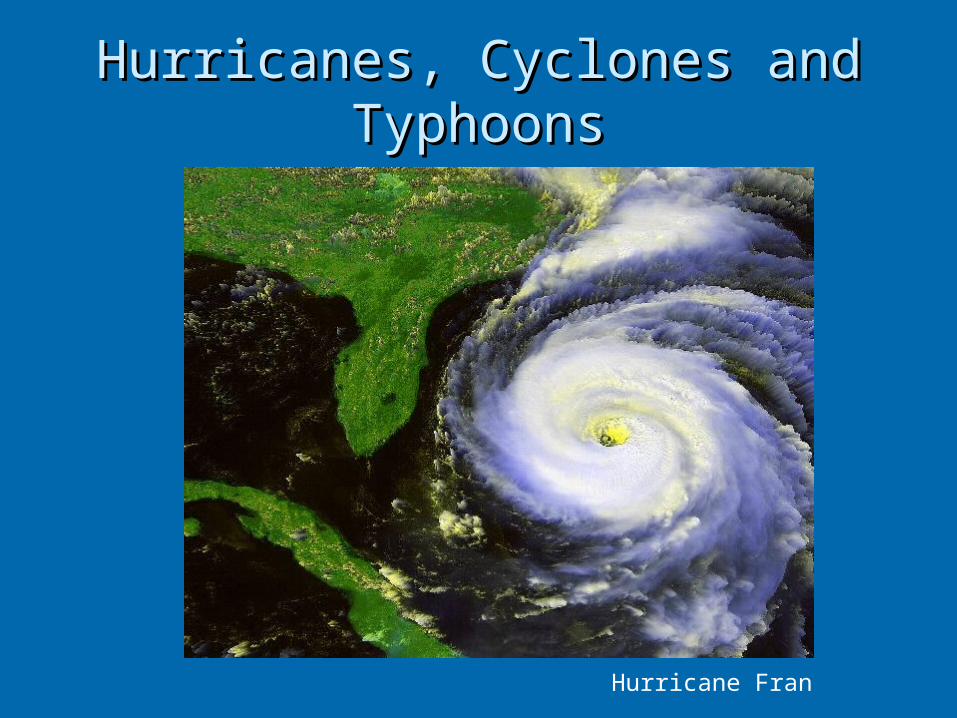
Hurricanes, Cyclones and Hurricanes, Cyclones and TyphoonsTyphoons
Hurricane Fran

Hurricane Formation--ConvectionHurricane Formation--Convection•Forms around intense tropical depressions — regions of very low pressure•Steps in hurricane formation
•Warm ocean transfers heat to air •Warm air rises and water condenses at colder temperatures aloft•Latent heat released as vapor condenses•Intense latent heating heats the ring of air near the center of the storm
•lower surface pressure increases the pressure gradient at low levels •generates stronger surface winds.
•Stronger winds increases friction via choppy seas •Stronger convergence into storm center •Enhanced convection - back to top.
•The above is a positive feedback loop - enhancing the storm's strength

Hurricane FormationHurricane Formation

Hurricane AndrewHurricane Andrew Costliest hurricane in US historyCostliest hurricane in US history Three-dimensional model view of Three-dimensional model view of
Hurricane Andrew (August 1992) Hurricane Andrew (August 1992) Results were obtained from a forecast, Results were obtained from a forecast, in research mode, using a dynamical in research mode, using a dynamical hurricane prediction system. hurricane prediction system.
Winds in excess of gale force are Winds in excess of gale force are indicated by the red and white arrows.indicated by the red and white arrows.
The color shading at the earth's The color shading at the earth's surface represents the precipitation surface represents the precipitation rate, with red indicating higher rate, with red indicating higher intensities. intensities.
The tan three-dimensional "cloud-like" The tan three-dimensional "cloud-like" feature is the 85% relative humidity feature is the 85% relative humidity surface,. Note the cylindrical "eye-wall" surface,. Note the cylindrical "eye-wall" feature near the center of the storm. feature near the center of the storm.
The blue arrows and colored plane at The blue arrows and colored plane at mid-levels depict the relative intensity mid-levels depict the relative intensity of vertical motions in the vicinity of the of vertical motions in the vicinity of the storm. storm.
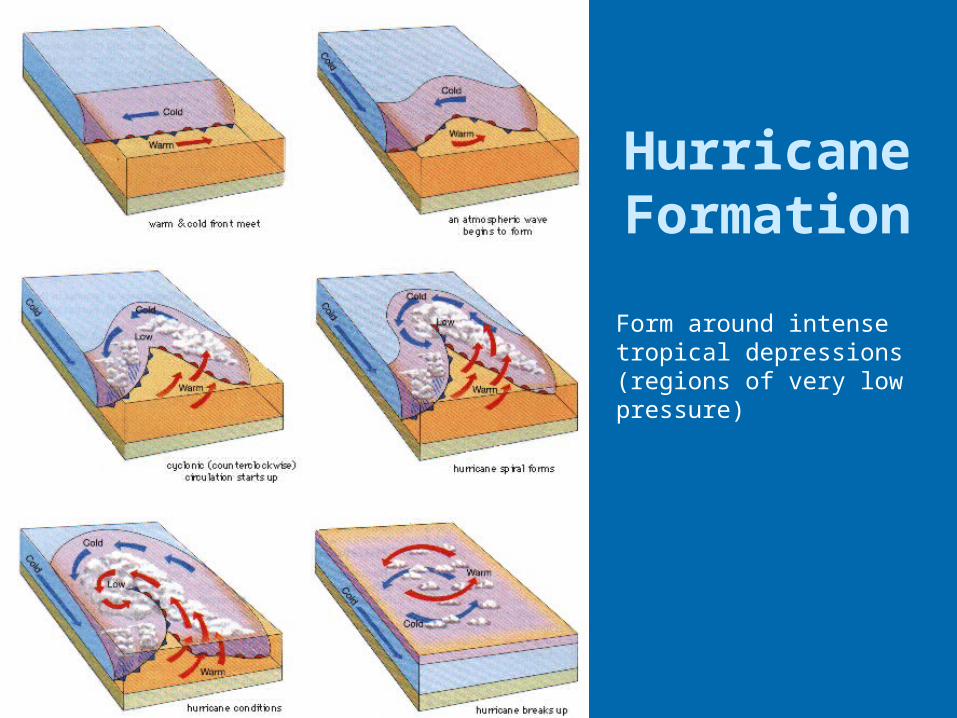
Hurricane Formation
Form around intense tropical depressions (regions of very low pressure)