Embed Size (px)
Citation preview
Weather & Hydrologic Forecasting for Water Utility Incident Preparedness and Response
Maintaining awareness of current and projected weather and hydrologic conditions is important as your drinking water or wastewater utility prepares for a natural disaster. The following information sources forecast several types of weather events over various time spans, ranging from real-time weather (i.e., today’s forecast) to 3 months. The forecasts begin with the identification of regional and local hazard outlooks across the nation, then become event-specific. Some of the resources can be found on NOAAWatch.gov, NOAA’s All-Hazard Monitor webpage that highlights various forecasting tools and describes weather events in detail. To explore the tools below, click on the title or image to be linked directly to the product’s website.
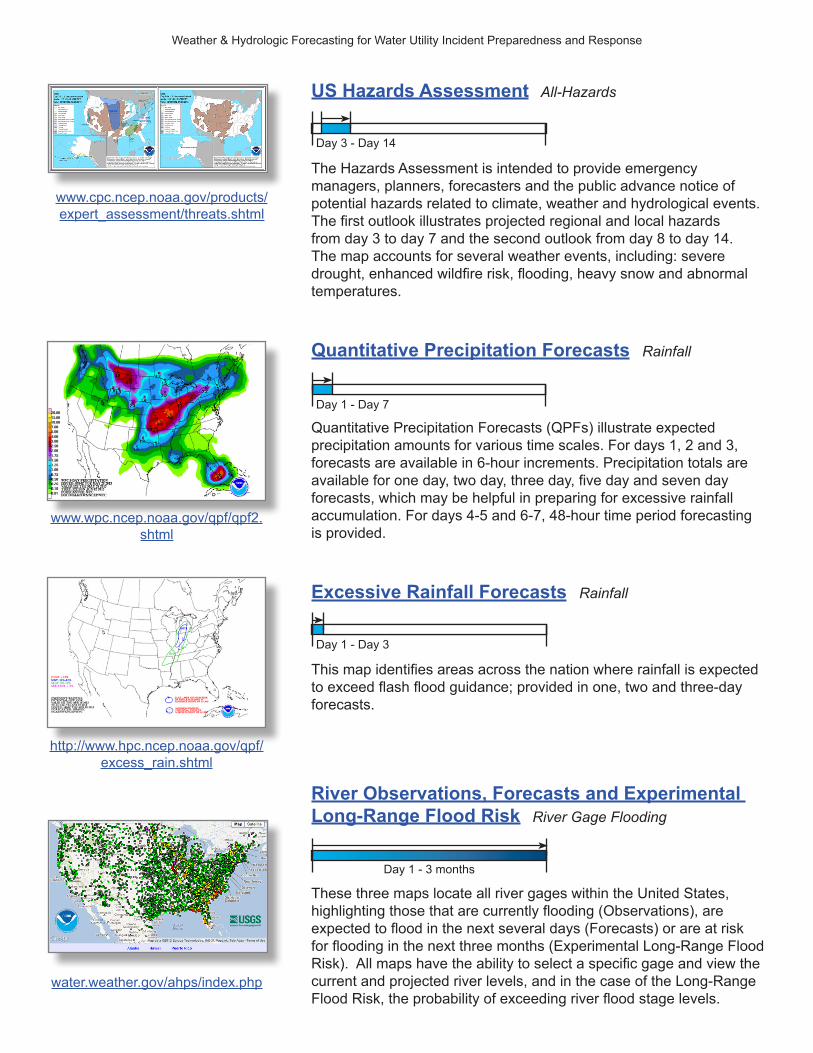
National Weather Hazards All-Hazards
www.weather.gov
Day 1
This map links to state and county level National Weather Service (NWS) watches, warnings, advisories and other similar information on events including floods, high winds, severe thunderstorms and winter storms. This page also serves as the National Weather Servicehomepage and many additional information sources are linked from this page. Some of these resources are described later in this document, but you may also want to search the site to find a new product that could benefit your utility.
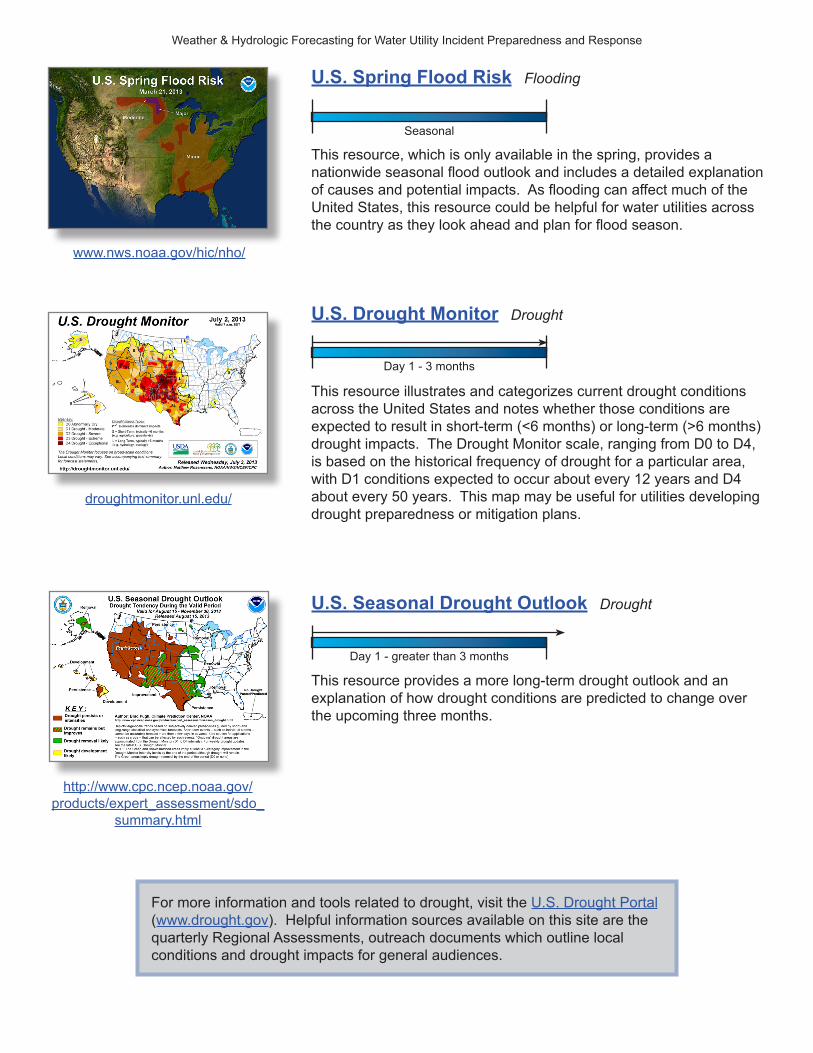
National Forecast Charts All-Hazards
www.hpc.ncep.noaa.gov/national_forecast/natfcst.php
Day 1 - Day 3
The Weather Prediction Center’s National Forecast Charts provide an overview of expected weather with an emphasis on certain hazardous and significant weather. The one, two and three-day forecasts are summaries of event-specific NOAA forecasts and include current and projected threats, such as: severe thunderstorms and tornados; tropical storms and hurricanes; heavy snow, sleet, freezing rain and flash flooding.
FEMA
Weather & Hydrologic Forecasting for Water Utility Incident Preparedness and Response
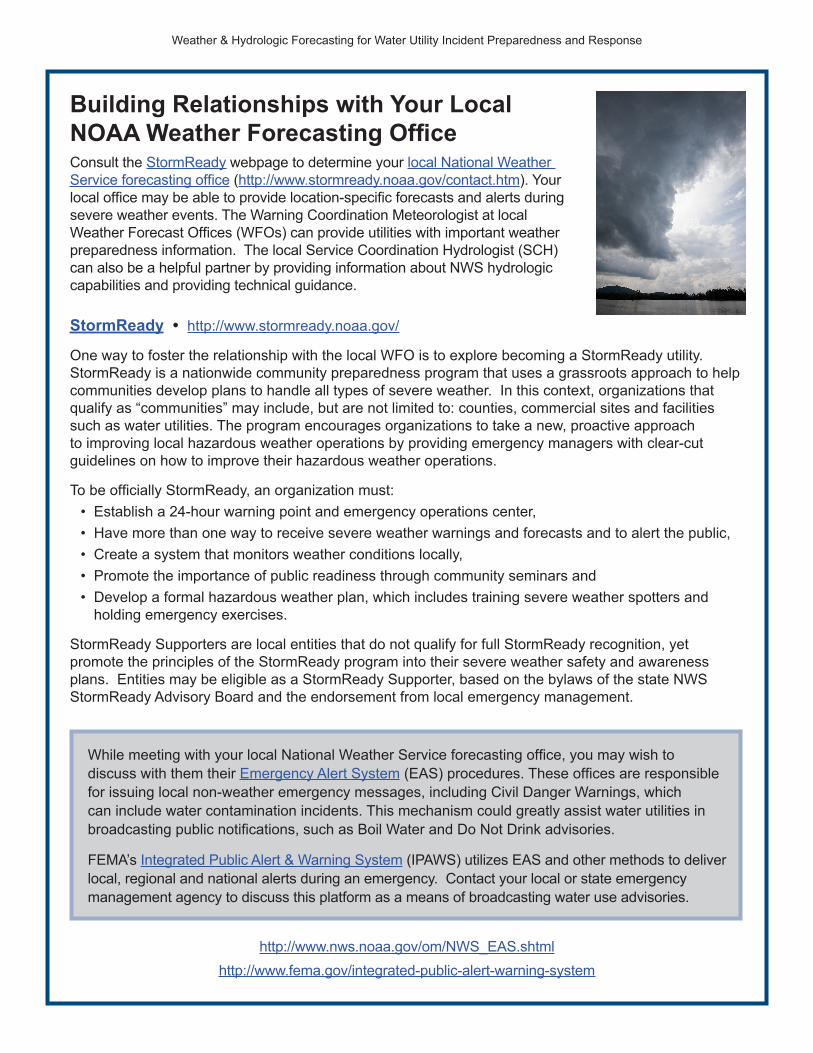
US Hazards Assessment All-Hazards
www.cpc.ncep.noaa.gov/products/expert_assessment/threats.shtml
Day 3 - Day 14
The Hazards Assessment is intended to provide emergency managers, planners, forecasters and the public advance notice of potential hazards related to climate, weather and hydrological events. The first outlook illustrates projected regional and local hazards from day 3 to day 7 and the second outlook from day 8 to day 14. The map accounts for several weather events, including: severe drought, enhanced wildfire risk, flooding, heavy snow and abnormal temperatures.
Quantitative Precipitation Forecasts Rainfall
www.wpc.ncep.noaa.gov/qpf/qpf2.shtml
Day 1 - Day 7
Quantitative Precipitation Forecasts (QPFs) illustrate expected precipitation amounts for various time scales. For days 1, 2 and 3, forecasts are available in 6-hour increments. Precipitation totals are available for one day, two day, three day, five day and seven day forecasts, which may be helpful in preparing for excessive rainfall accumulation. For days 4-5 and 6-7, 48-hour time period forecasting is provided.
Excessive Rainfall Forecasts Rainfall
http://www.hpc.ncep.noaa.gov/qpf/excess_rain.shtml
Day 1 - Day 3
This map identifies areas across the nation where rainfall is expected to exceed flash flood guidance; provided in one, two and three-day forecasts.
River Observations, Forecasts and Experimental Long-Range Flood Risk River Gage Flooding
water.weather.gov/ahps/index.php
Day 1 - 3 months
These three maps locate all river gages within the United States, highlighting those that are currently flooding (Observations), are expected to flood in the next several days (Forecasts) or are at risk for flooding in the next three months (Experimental Long-Range Flood Risk). All maps have the ability to select a specific gage and view the current and projected river levels, and in the case of the Long-Range Flood Risk, the probability of exceeding river flood stage levels.
Weather & Hydrologic Forecasting for Water Utility Incident Preparedness and Response
U.S. Spring Flood Risk Flooding
www.nws.noaa.gov/hic/nho/
Seasonal
This resource, which is only available in the spring, provides a nationwide seasonal flood outlook and includes a detailed explanation of causes and potential impacts. As flooding can affect much of the United States, this resource could be helpful for water utilities across the country as they look ahead and plan for flood season.
U.S. Drought Monitor Drought
droughtmonitor.unl.edu/
Day 1 - 3 months
This resource illustrates and categorizes current drought conditions across the United States and notes whether those conditions are expected to result in short-term (<6 months) or long-term (>6 months) drought impacts. The Drought Monitor scale, ranging from D0 to D4, is based on the historical frequency of drought for a particular area, with D1 conditions expected to occur about every 12 years and D4 about every 50 years. This map may be useful for utilities developing drought preparedness or mitigation plans.
U.S. Seasonal Drought Outlook Drought
http://www.cpc.ncep.noaa.gov/products/expert_assessment/sdo_
summary.html
Day 1 - greater than 3 months
This resource provides a more long-term drought outlook and an explanation of how drought conditions are predicted to change over the upcoming three months.
For more information and tools related to drought, visit the U.S. Drought Portal (www.drought.gov). Helpful information sources available on this site are the quarterly Regional Assessments, outreach documents which outline local conditions and drought impacts for general audiences.
Weather & Hydrologic Forecasting for Water Utility Incident Preparedness and Response
Building Relationships with Your Local NOAA Weather Forecasting OfficeConsult the StormReady webpage to determine your local National Weather Service forecasting office (http://www.stormready.noaa.gov/contact.htm). Your local office may be able to provide location-specific forecasts and alerts during severe weather events. The Warning Coordination Meteorologist at local Weather Forecast Offices (WFOs) can provide utilities with important weather preparedness information. The local Service Coordination Hydrologist (SCH) can also be a helpful partner by providing information about NWS hydrologic capabilities and providing technical guidance.
StormReady • http://www.stormready.noaa.gov/
One way to foster the relationship with the local WFO is to explore becoming a StormReady utility. StormReady is a nationwide community preparedness program that uses a grassroots approach to help communities develop plans to handle all types of severe weather. In this context, organizations that qualify as “communities” may include, but are not limited to: counties, commercial sites and facilities such as water utilities. The program encourages organizations to take a new, proactive approach to improving local hazardous weather operations by providing emergency managers with clear-cut guidelines on how to improve their hazardous weather operations.
To be officially StormReady, an organization must:• Establish a 24-hour warning point and emergency operations center,• Have more than one way to receive severe weather warnings and forecasts and to alert the public,• Create a system that monitors weather conditions locally,• Promote the importance of public readiness through community seminars and• Develop a formal hazardous weather plan, which includes training severe weather spotters and
holding emergency exercises.
StormReady Supporters are local entities that do not qualify for full StormReady recognition, yet promote the principles of the StormReady program into their severe weather safety and awareness plans. Entities may be eligible as a StormReady Supporter, based on the bylaws of the state NWS StormReady Advisory Board and the endorsement from local emergency management.
While meeting with your local National Weather Service forecasting office, you may wish to discuss with them their Emergency Alert System (EAS) procedures. These offices are responsible for issuing local non-weather emergency messages, including Civil Danger Warnings, which can include water contamination incidents. This mechanism could greatly assist water utilities in broadcasting public notifications, such as Boil Water and Do Not Drink advisories.
FEMA’s Integrated Public Alert & Warning System (IPAWS) utilizes EAS and other methods to deliver local, regional and national alerts during an emergency. Contact your local or state emergency management agency to discuss this platform as a means of broadcasting water use advisories.
http://www.nws.noaa.gov/om/NWS_EAS.shtmlhttp://www.fema.gov/integrated-public-alert-warning-system
Weather & Hydrologic Forecasting for Water Utility Incident Preparedness and Response
Helpful Tools
USGS WaterAlert • water.usgs.gov/wateralert/Sign up for WaterAlert and the U.S. Geologic Survey (USGS) will send you an email or text message alert when the river gages that you have identified surpass specified parameters. The basic real-time parameters supported by WaterAlert are: surface water (streamflow, gage height, lake/reservoir level, stream level, stream velocity); groundwater (water level depth and elevation); water quality (water temperature, specific conductance, pH, dissolved oxygen, salinity, turbidity) and total precipitation.
USGS WaterNow • water.usgs.gov/waternow/Another way to determine these real-time parameters is to text or email a unique gage or well site number to USGS WaterNow and receive descriptions of current conditions. This method does not send automatic alerts, but could be useful for occasional inquiries or for work in the field.
USGS Flood Inundation Mapper • wim.usgs.gov/FIMI/FloodInundationMapper.htmlThis interactive map allows users to select individual river gages to view observed, current and predicted water levels over a ten-day time frame, as well as historical flood levels. A unique capability of this tool is that it allows users to adjust an “Estimated Flood Conditions” scale to see clearly on a map the impact of varying flood levels on a particular location.
USGS WaterWatch • waterwatch.usgs.gov/Compare today’s conditions with historical data for streamflow levels, drought, flood and past flow/runoff.
Additional Resources
National Hurricane CenterTropical Weather/Hurricane • www.nhc.noaa.gov Day 1
During active hurricanes and tropical cyclones, the National Hurricane Center (NHC) page provides predicted storm path and timing, precipitation amounts, storm surge estimates, tropical storm wind probabilities and other useful information to prepare your utility for the storm.
Storm Surge Prediction Storm Surge • www.nws.noaa.gov/mdl/psurge/active.php Day 1 - Day 3
Measured in feet above normal tide level, this map illustrates storm surge heights that have a ten percent chanof being exceeded within the next three days.
ce
Storm Prediction Center Severe Thunderstorms and Tornadoes • www.spc.noaa.gov/ Day 1 - Day 8
The Storm Prediction Center (SPC) provides forecasts and watches for severe thunderstorms and tornadoes across the United States. The SPC also produces forecasting tools for heavy rain, snow and fire events.
Weather & Hydrologic Forecasting for Water Utility Incident Preparedness and Response
Additional Resources (continued)
Weather Prediction Center Various Products, All-Hazards • http://www.wpc.ncep.noaa.gov/ Day 1 - Day 7
The Weather Prediction Center (WPC) provides forecasts for heavy rain and winter weather events over the next seven days. Products also include current and predicted pressure systems and weather fronts.
Climate Prediction Center Various Products, All-Hazards • www.cpc.ncep.noaa.gov/ Day 6 - 3 months
The Climate Prediction Center’s (CPC) tools illustrate predicted climate variability in time scales ranging from one week to three months.
Tsunami Warnings Tsunami • www.tsunami.gov/ Day 1
This website provides active tsunami warnings for the entire United States.
Earthquakes Earthquake • earthquake.usgs.gov/earthquakes/map/ Past 7 days
This site provides information on earthquakes from the last seven days that had magnitudes greater than 2.5.
Wildfires Wildfire • www.spc.noaa.gov/products/fire_wx/ Day 1 - Day 8
This site provides fire weather outlooks in the form of one day, two day and three-eight day forecasts. For one, two and three month forecasts, please see the National Significant Wildland Fire Potential Outlooks. In addition, InciWeb.org tracks active fires throughout the nation.
FEMA Situation Reportspublic.govdelivery.com/accounts/USDHSFEMA/subscriber/new?topic_id=USDHSFEMA_432Subscribe to receive daily emails that include information on current incidents and predicted weather hazards for the entire United States.
Further information about water utility preparedness and response can be found at epa.gov/watersecurity.
Office of Water (4608-T) EPA 817-F-13-005 September 2013