Embed Size (px)
Citation preview
UNITE US ©2010 - 2012 Geophysical Institute, UAF Weather Watchers
WEATHER WATCHERS
Overview:In this lesson, students review cloud types, cloud cover and basic weather vocabulary through multimedia, hands-on activities and written work. Students then work as a class to collect long-term weather data at their school, supplementing the data they collect with data retrieved from the Alaska Climate Research Center.
Objectives:The student will:• review basic weather terminology and phenomenon;• collect long-term weather data at their school; • retrieve weather data from the Internet; and • practice using basic weather symbols.
Targeted Alaska Grade Level Expectations: [7-8] SA1.1 The student demonstrates an understanding of the processes of science by asking questions,
predicting, observing, describing, measuring, classifying, making generalizations, inferring, and communicating.
[7] SA1.2 The student demonstrates an understanding of the processes of science by collaborating to design and conduct simple repeatable investigations, in order to record, analyze (i.e., range, mean, median, mode), interpret data, and present findings.
[7] SD3.1 The student demonstrates an understanding of cycles influenced by energy from the sun and by Earth’s position and motion in our solar system by describing the weather using accepted meteorological terms (e.g., pressure systems, fronts, precipitation).
Vocabulary:atmosphere – the mixture of gases that surrounds Earth barometer – an instrument for measuring atmospheric pressureclimate – the average weather conditions of a region over time (30 years or more)condensation – the change of a gas or vapor into a liquid, either by cooling or increased pressuredew point – the temperature at which air becomes saturated with water vapor and dew formsevaporation – the change of a liquid into a vapor at a temperature at or below the boiling pointprecipitation – a form of water, such as rain, snow or sleet, that condenses from the atmosphere and falls to
Earth’s surfacerelative humidity – the ratio of the actual amount of water vapor present in the air at a given temperature to
the maximum amount of water vapor the air could hold at that temperatureweather – the state of the atmosphere at a particular time and placewind chill – a measure of the effect of wind on air temperature; the felt temperature on exposed skin due to wind
Whole Picture:Many people, including Alaska Native Elders and scientists, note patterns in weather to share with others and prepare for future conditions. Earth’s changing climate has made it even more important to keep long-term weather data and to monitor these data for changes and trends, especially in places like Alaska where change is happening most rapidly.
Weather is different from climate. Weather describes atmospheric conditions over a short period of time, whereas climate describes atmospheric conditions over relatively long periods of time (at least 30 years.) Examples of climatic conditions measured over time include sea level rise and permafrost thaw.
A6.1
UNITE US ©2010 - 2012 Geophysical Institute, UAF Weather Watchers
WEATHER WATCHERS
Knowledge of weather phenomena is an integral part of Alaska Native culture. Native Elders have long been able to predict weather based on observations. These observations and predictions are crucial to subsistence activities and safety. Weather words, including many different descriptors for clouds, are present in all Alaska Native languages.
Materials:• Binder• NOAA/NASA Skywatchers chart• Glue stick• Scissors• White construction paper (one sheet per group)• Blue construction paper (one sheet per group)• Min/max outdoor thermometer• TEMPLATE: “Weather Data”• TEACHER INFORMATION SHEET: “Introductory Activities: Weather”• TEACHER INFORMATION SHEET: “Weather Symbols”• STUDENT WORKSHEET: “Weather Words”• STUDENT WORKSHEET: “Weather Symbols” • TEMPLATE: “Weather Symbols”
Activity Preparation:1. Make copies of TEMPLATE: “Weather Data” and insert into binder.
2. Choose a location for the outdoor thermometer.3. Devise a strategy for how and where your class will collect weather data. [Note: Stick to a standard time
and process (i.e. at the start of the day or class period). Data collection should not take more than 10 minutes.] Students will need access to the Internet to record information from the Alaska Climate Research Center as well as time to check the conditions outdoors. You may choose to make collecting weather data the responsibility of one or more students for a day or week at a time and rotate. Students can report back to the class.
4. Two reliable websites for retrieving weather data from the Internet are: the Alaska Climate Research Center and Weather Underground. Check them both to determine which you will use with your class.
a. Weather Underground (http://www.wunderground.com/)—Visit. Enter your community’s zip code. Bookmark this website.
b. Alaska Climate Research Center (http://climate.gi.alaska.edu/)—Bookmark the main website as well as a link for sunrise/sunset information for your village. Bookmark the main page, then click on the menu for “External Weather Links.” Select “sunrise/sunset” from the drop down menu. When you reach the “Heavens Above” website, select the link for “Home.” Click “edit manually” under the heading “Configuration.” Enter the latitude, longitude and name of your village, then click “submit.” This should bring you back to the “Home” page. Now click on the link for “Sun” data for today and you should see sunrise/sunset information for your village. Bookmark this page.
5. Review TEACHER INFORMATION SHEET: “Introductory Activities: Weather.” Decide which (if any) are appropriate for your class.
6. Review STUDENT WORKSHEET: “Weather Symbols” and TEACHER INFORMATION SHEET: “Weather Symbols.” Print TEACHER INFORMATION SHEET: “Weather symbols.” Cut the daily weather reports on the dotted lines so that you have six strips of paper.
NOTE: This lesson requires data collection over a period of weeks or even months. The duration of data collection is flexible and up to your discretion. You may choose to make it a daily or weekly task for a small group of students and rotate the responsibility over time. You may choose to collect weather data for a few weeks or throughout the entire school year.
A6.2
UNITE US ©2010 - 2012 Geophysical Institute, UAF Weather Watchers
WEATHER WATCHERS
Activity Procedure:1. Ask students why people observe, record and study weather. The ensuing discussion should include an
understanding that weather and climate affect almost all aspects of our lives, including how we supply our basic needs and the renewable energy options that are feasible for our communities. Ask students to list aspects of their lives that are impacted by weather and climate. Include a discussion of the difference between weather and climate.
2. Conduct any activities from TEACHER INFORMATION SHEET: “Introductory Activities: Weather” that are appropriate for your class.
3. Explain that the class will be working together to collect long-term weather data in a class weather journal. Data will be collected via observations at your school and via weather data available from the Alaska Climate Research Center. Explain your strategy for data collection (what time of day, location, who will collect data, etc.).
4. Review the process of retrieving weather data from the Internet. If using the Alaska Climate Research Center website, visit http://climate.gi.alaska.edu. Click on the link “Current conditions and weather forecasts” found under the Alaska Weather heading on the menu to the left of the screen. Click on “Current weather conditions around Alaska (Pop-Up Map)” found under CURRENT CONDITONS. Choose your village and record the current weather conditions, date and time.
5. Review the process of retrieving sunrise/sunset information for your village. Show students how to access the “Heavens Above” website bookmarked on your computer. Sunrise and sunset appear in bold. Students will need to calculate the length of day.
6. Pass out STUDENT WORKSHEET: “Weather Symbols.” Review the symbols and how to fill in the boxes found on the weather data sheets.
7. Practice interpreting weather symbols. Pass out the six daily weather descriptions to six students. Instruct them to read each aloud, one at a time, pausing at the end of each sentence. Students should raise their hand as soon as they have identified which number matches this description. When the class has identified it correctly, students should fill in the date on the line provided.
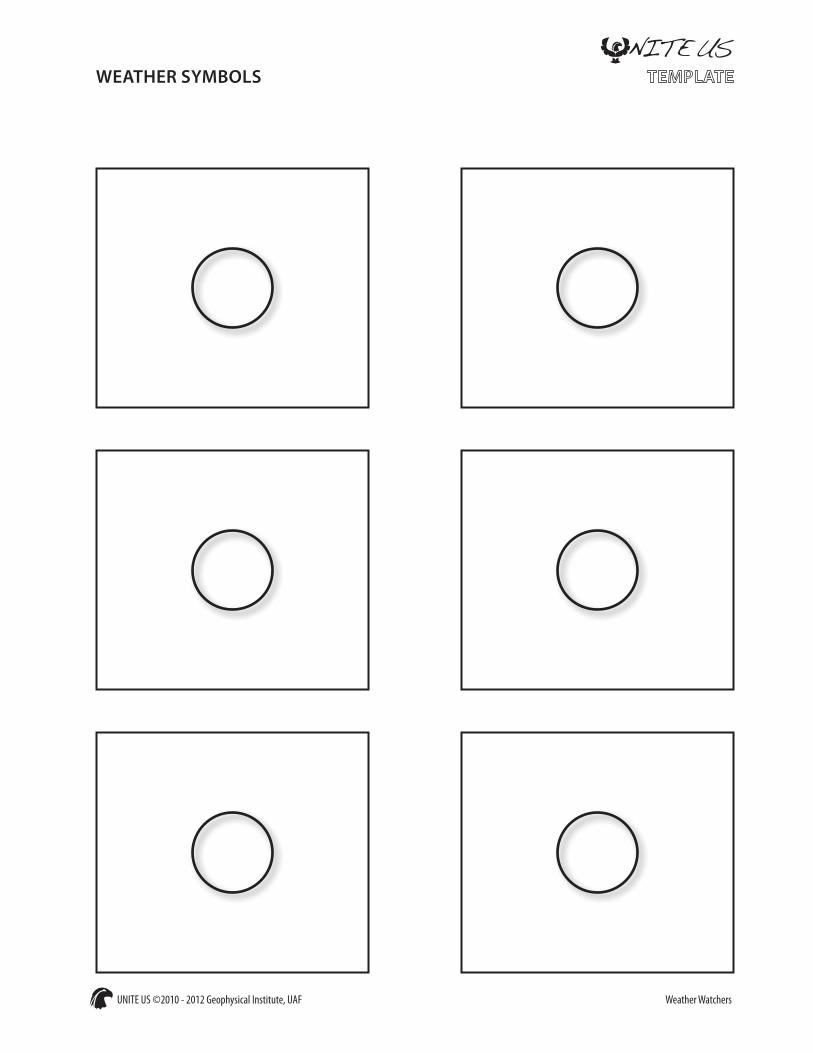
8. Use TEMPLATE: “Weather Symbols” if you would like students to draw some weather symbols for further practice.
Extension Ideas:1. Calculate the mean, median, mode, and range of
temperatures for given month or season. Graph the results.
2. Calculate the percentage of sunny days (cloud cover less than 50%) each month. Calculate the number of calm versus windy days. Discuss what this means for alternative energy strategies for the community.
3. Compare each day’s high and low to the normal and/or record temperatures for that date.
4. Calculate the heating degree days for each daily temperature. (See the lesson Community Energy Use for more on heating degree days.)
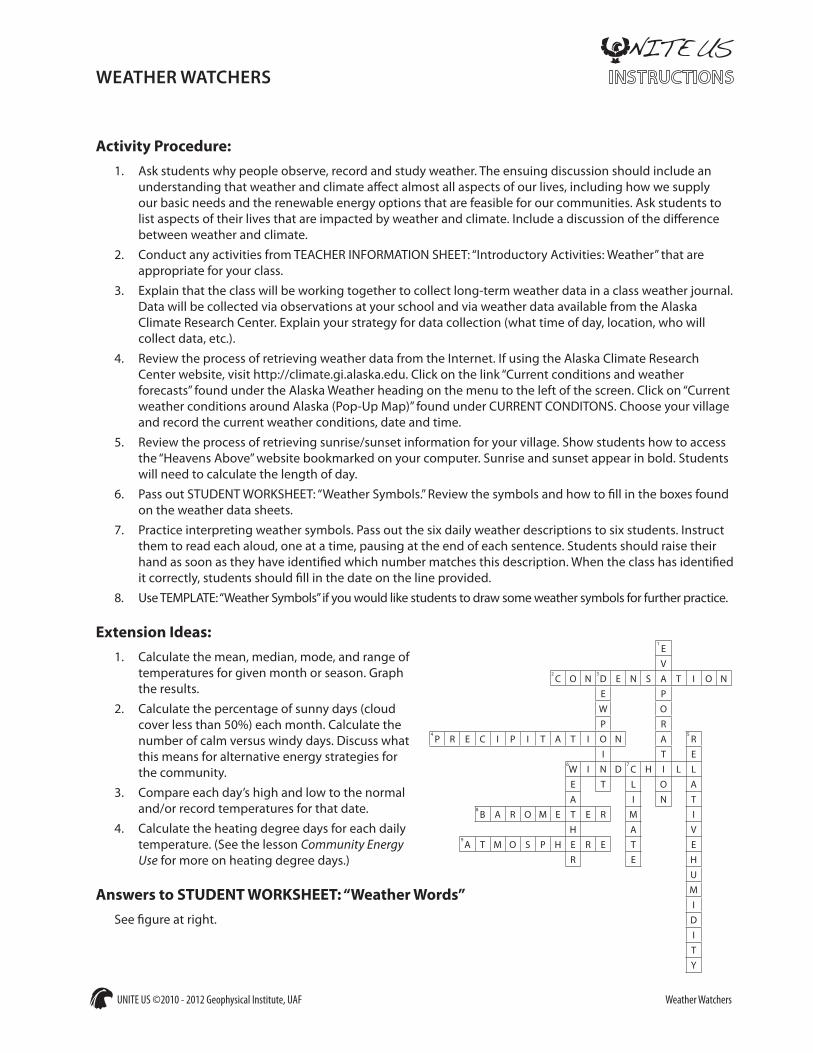
Answers to STUDENT WORKSHEET: “Weather Words”See figure at right.
1EV
2C O N
3D E N S A T I O NE PW OP R
4P R E C I P I T A T I O N A
5R
I T E6W I N D
7C H I L L
E T L O AA I N T
8B A R O M E T E R M I
H A V9A T M O S P H E R E T E
R E HUMI
DITY
A6.3
UNITE US ©2010 - 2012 Geophysical Institute, UAF Weather Watchers
WEATHER WATCHERS
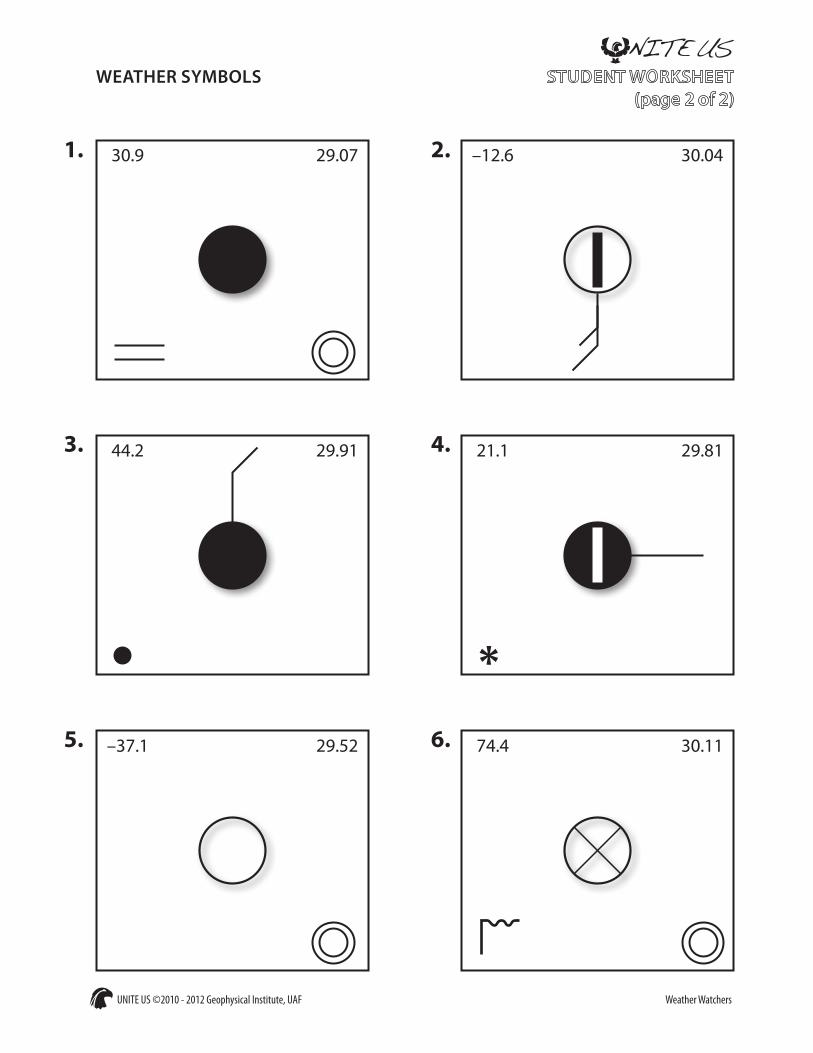
Answers to STUDENT WORKSHEET: “Weather Symbols”1. April 32. November 23. August 114. October 15. January 316. July 16
A6.4
UNITE US ©2010 - 2012 Geophysical Institute, UAF Weather Watchers
INTRODUCTORY ACTIVITIES: WEATHER
Directions:The following activities are provided as optional introductory activities to the weather journal lesson. Choose the activities best suited to students’ experience and knowledge base.
1. Review MULTIMEDIA: “Earth’s Weather Scavenger Hunt.” Decide which pieces (if any) you will use to supplement learning in this lesson. Suggestions include: “weather observation” and “sundogs” for cultural integration, “cloud game” to review cloud types, and “air pressure” to review wind and the Beaufort scale.
2. Estimating Cloud Cover: In this activity, students practice visually estimating cloud cover. Each student group will need one piece of blue construction paper, one piece of white construction paper and a glue stick. Work with students to fold the white piece of construction paper into 10 roughly equal squares. (Make one fold down the center the long way, and four folds the short way, approximately 2¾ inches apart.) Each group should choose the percent cloud cover they would like to represent (in intervals of 10) and use the appropriate number of squares to make clouds. (Each square represents 10%.) Students should use the entire square, but may tear or cut it into cloud shapes. Students should glue their clouds to the blue piece of paper (without overlapping) and write their percentage on the back of the page. Allow each group time to show their sky while other groups estimate the cloud cover represented. Facilitate a discussion about which ones were easiest to estimate and why. This activity is part of the GLOBE (Global Learning and Observations to Benefit the Environment) lesson Estimating Cloud Cover: A Simulation (http://www.globe.gov/tctg/atla-cloudcover.pdf?sectionId=20&lang=EN).
3. Assign STUDENT WORKSHEET: “Weather Words” as a review in class or as homework.
A6.5
UNITE US ©2010 - 2012 Geophysical Institute, UAF Weather Watchers
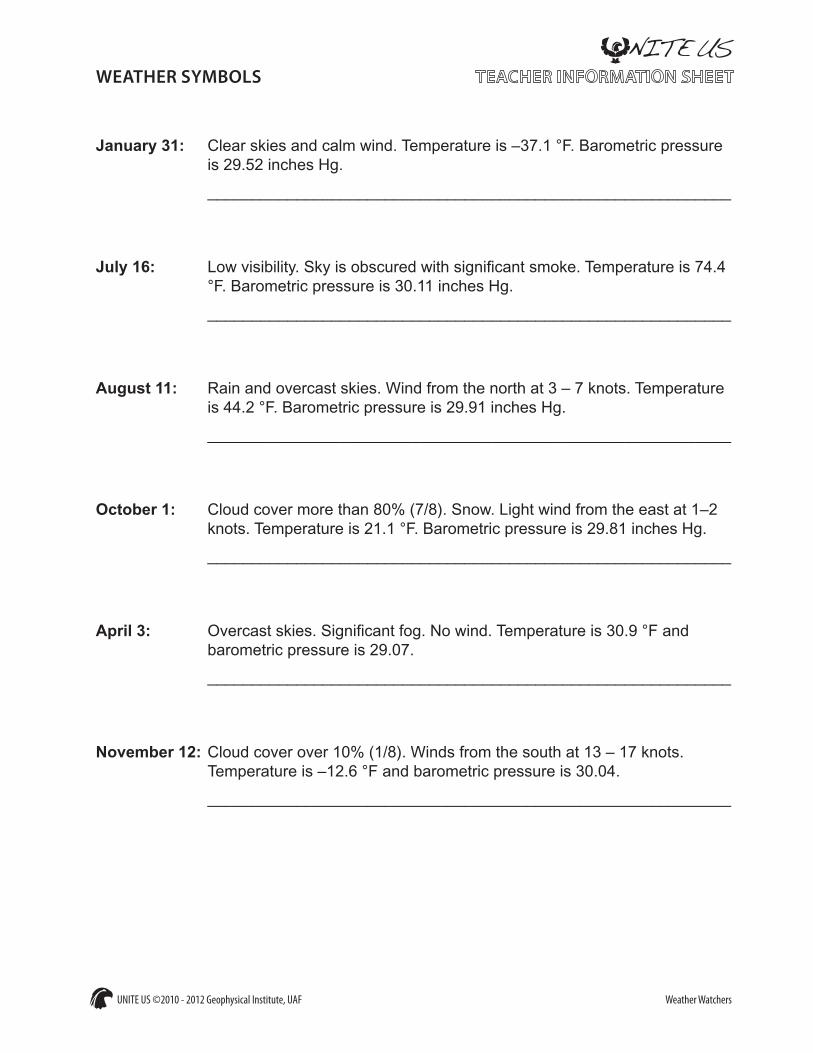
January 31: Clear skies and calm wind. Temperature is –37.1 °F. Barometric pressure is 29.52 inches Hg.
___________________________________________________________
July 16: Low visibility. Sky is obscured with significant smoke. Temperature is 74.4 °F. Barometric pressure is 30.11 inches Hg.
___________________________________________________________
August 11: Rain and overcast skies. Wind from the north at 3 – 7 knots. Temperature is 44.2 °F. Barometric pressure is 29.91 inches Hg.
___________________________________________________________
October 1: Cloud cover more than 80% (7/8). Snow. Light wind from the east at 1–2 knots. Temperature is 21.1 °F. Barometric pressure is 29.81 inches Hg.
___________________________________________________________
April 3: Overcast skies. Significant fog. No wind. Temperature is 30.9 °F and barometric pressure is 29.07.
___________________________________________________________
November 12: Cloud cover over 10% (1/8). Winds from the south at 13 – 17 knots. Temperature is –12.6 °F and barometric pressure is 30.04.
___________________________________________________________
WEATHER SYMBOLS
A6.6
UNITE US ©2010 - 2012 Geophysical Institute, UAF Weather Watchers
WEATHER WORDS
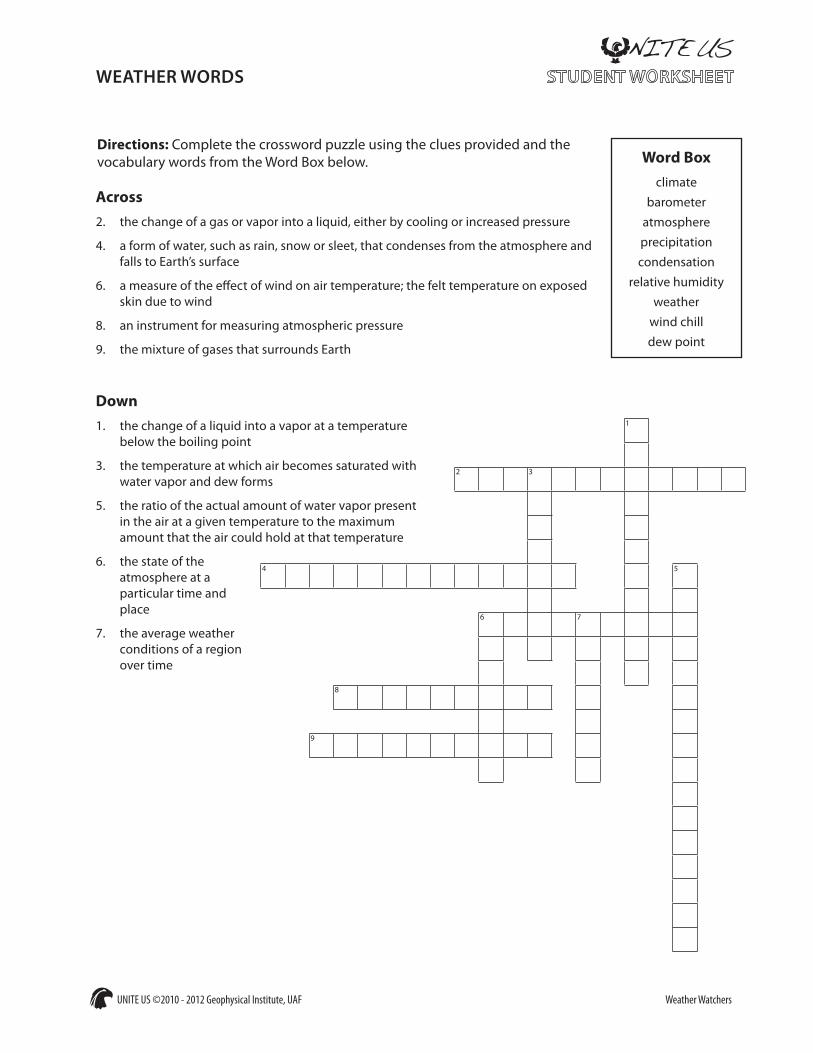
Across2. the change of a gas or vapor into a liquid, either by cooling or increased pressure
4. a form of water, such as rain, snow or sleet, that condenses from the atmosphere and falls to Earth’s surface
6. a measure of the effect of wind on air temperature; the felt temperature on exposed skin due to wind
8. an instrument for measuring atmospheric pressure
9. the mixture of gases that surrounds Earth
Down1. the change of a liquid into a vapor at a temperature
below the boiling point
3. the temperature at which air becomes saturated with water vapor and dew forms
5. the ratio of the actual amount of water vapor present in the air at a given temperature to the maximum amount that the air could hold at that temperature
6. the state of the atmosphere at a particular time and place
7. the average weather conditions of a region over time
Word Boxclimate
barometeratmosphereprecipitation condensation
relative humidityweather
wind chill dew point
Directions: Complete the crossword puzzle using the clues provided and the vocabulary words from the Word Box below.
1
2 3
4 5
6 7
8
9
A6.7
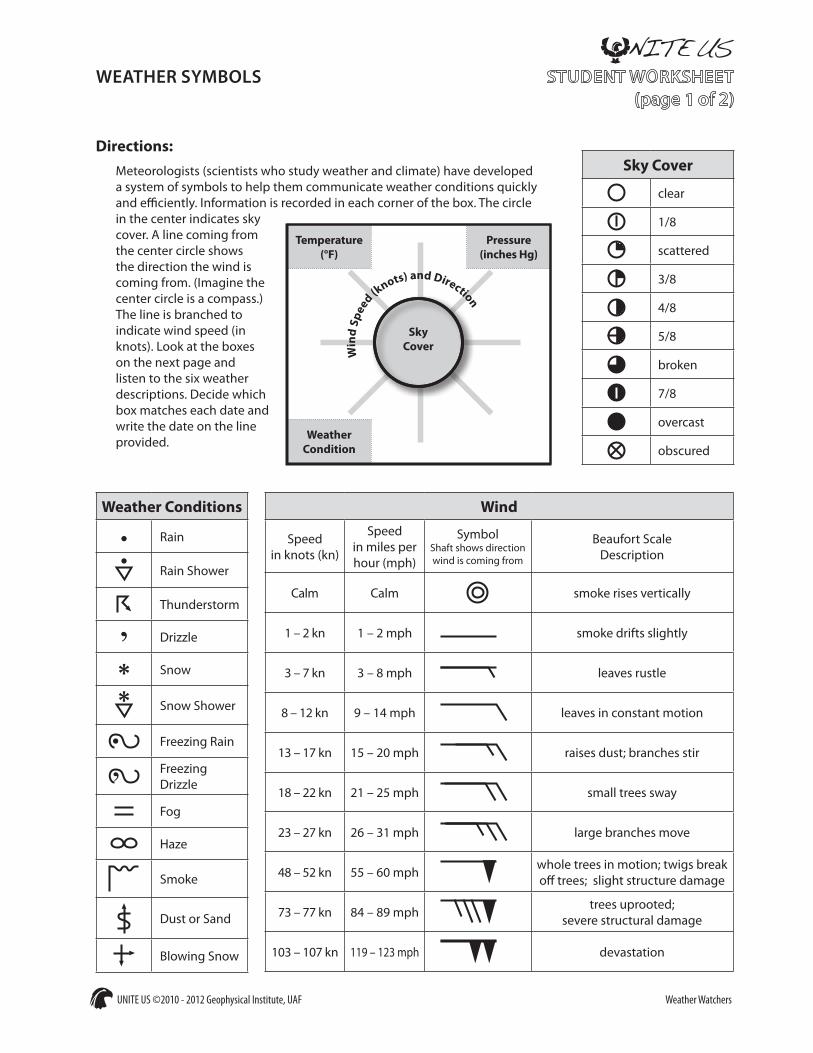
Directions:Meteorologists (scientists who study weather and climate) have developed a system of symbols to help them communicate weather conditions quickly and efficiently. Information is recorded in each corner of the box. The circle in the center indicates sky cover. A line coming from the center circle shows the direction the wind is coming from. (Imagine the center circle is a compass.) The line is branched to indicate wind speed (in knots). Look at the boxes on the next page and listen to the six weather descriptions. Decide which box matches each date and write the date on the line provided.
UNITE US ©2010 - 2012 Geophysical Institute, UAF Weather Watchers
WEATHER SYMBOLS
Wind
Speed in knots (kn)
Speed in miles per hour (mph)
SymbolShaft shows direction wind is coming from
Beaufort Scale Description
Calm Calm smoke rises vertically
1 – 2 kn 1 – 2 mph smoke drifts slightly
3 – 7 kn 3 – 8 mph leaves rustle
8 – 12 kn 9 – 14 mph leaves in constant motion
13 – 17 kn 15 – 20 mph raises dust; branches stir
18 – 22 kn 21 – 25 mph small trees sway
23 – 27 kn 26 – 31 mph large branches move
48 – 52 kn 55 – 60 mph whole trees in motion; twigs break off trees; slight structure damage
73 – 77 kn 84 – 89 mph trees uprooted; severe structural damage
103 – 107 kn 119 – 123 mph devastation
Sky Cover
clear
1/8
scattered
3/8
4/8
5/8
broken
7/8
overcast
obscured
Weather Conditions
Rain
Rain Shower
Thunderstorm
Drizzle
Snow
Snow Shower
Freezing Rain
Freezing Drizzle
Fog
Haze
Smoke
Dust or Sand
Blowing Snow
Pressure(inches Hg)
Temperature(°F)
Weather Condition
Sky CoverW
ind
Spee
d (knots) and Direction
A6.8
UNITE US ©2010 - 2012 Geophysical Institute, UAF Weather Watchers
WEATHER SYMBOLS
1.
3.
5.
2.
4.
6.
30.9
44.2
–37.1
–12.6
21.1
74.4
29.07
29.91
29.52
30.04
29.81
30.11
A6.9
UNITE US ©2010 - 2012 Geophysical Institute, UAF Weather Watchers
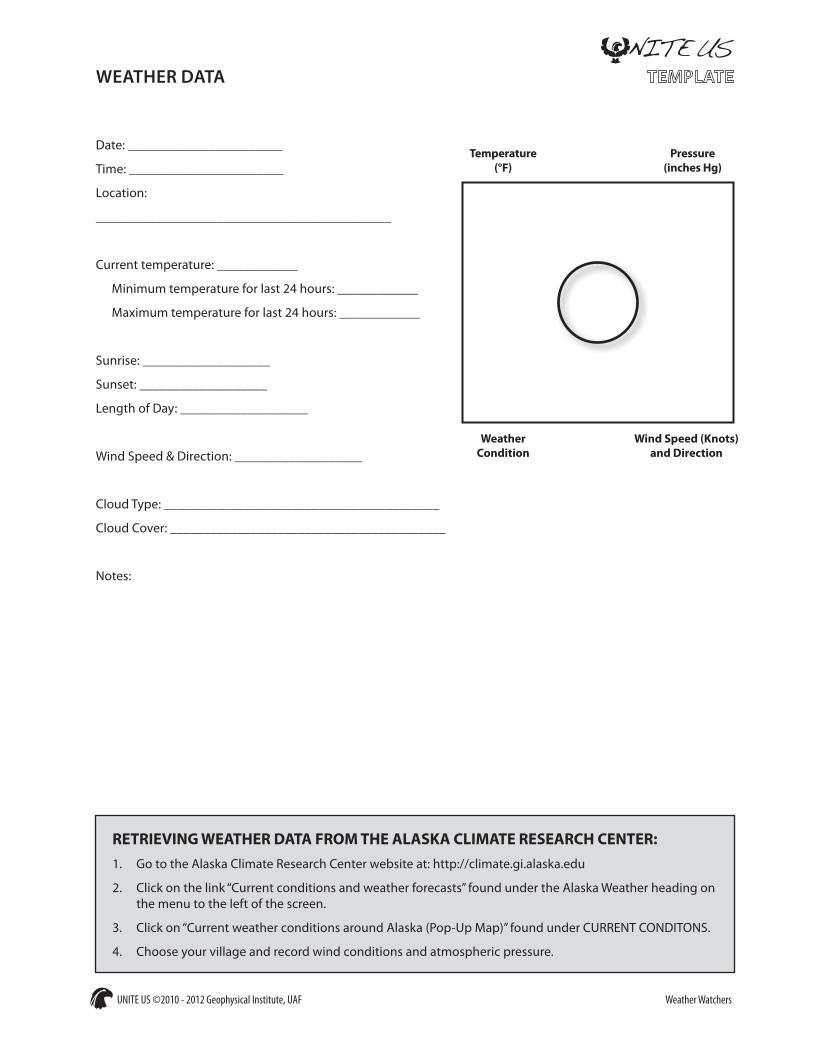
WEATHER DATA
Date: _______________________
Time: _______________________
Location:
____________________________________________
Current temperature: ____________
Minimum temperature for last 24 hours: ____________
Maximum temperature for last 24 hours: ____________
Sunrise: ___________________
Sunset: ___________________
Length of Day: ___________________
Wind Speed & Direction: ___________________
Cloud Type: _________________________________________
Cloud Cover: _________________________________________
Notes:
RETRIEVING WEATHER DATA FROM THE ALASKA CLIMATE RESEARCH CENTER:1. Go to the Alaska Climate Research Center website at: http://climate.gi.alaska.edu
2. Click on the link “Current conditions and weather forecasts” found under the Alaska Weather heading on the menu to the left of the screen.
3. Click on “Current weather conditions around Alaska (Pop-Up Map)” found under CURRENT CONDITONS.
4. Choose your village and record wind conditions and atmospheric pressure.
Pressure(inches Hg)
Temperature(°F)
Weather Condition
Wind Speed (Knots) and Direction
A6.10
UNITE US ©2010 - 2012 Geophysical Institute, UAF Weather Watchers
WEATHER SYMBOLS
A6.11