Embed Size (px)
Citation preview

We’ve got more data. We need more maps!While professional map-makers know how to make good maps, the inevitable pressure is to publish more of them, more quickly, and at lower cost. A growing army of neocartographers has its own needs, too. Nico Regnauld outlines the challenges and introduces some useful tools to overcome them
A Map is a powerful tool to display information relating to location in a way or another. The relation to location can take many forms: geo-referenced coordinates, addresses, place name, relative position to other things (5 km north of Stonehenge) etc. A map comes to its own when it brings together several types of information, allowing the reader to quickly spot correlation between them.
It becomes a powerful analysis tool to support the decision-mak-ing process. A well-known example of this dates back to 1854 when Dr John Snow mapped an outbreak of cholera. In noting that known cases (shown as stacks on the map below) were clustered around a particular water pump, he discovered that is was water, and not air as commonly believed, that was the source of the bacterial infection.
With data becoming more readily available, more and more maps are being made and used. Does this mean that we can have all the maps we need? Or are there still limitations to what can be done with all this data?
Who is making maps?Maps have traditionally been made by professional cartographers - specialists in the art of representing the world around us in ways that helps us better understand it. This rather abstract definition only reflects the fact that maps can be made for many very different purposes, each one affecting the content of the map and the scale at which it is drawn. They are typically compiled for organisations hav-ing specialised needs and output as topographic maps, road maps, nautical or flight charts, geological maps, etc.
Such organisations usually publish a range of maps derived from this data, some for general use and widely available, others targeting a very specific use such as coastal navigation. These publishers will capture and maintain large amounts of data at the highest level of detail and then derive multiple maps from it.
In recent years, another map-maker is emerging, often re-
www.geoconnexion.com // May/June 2015 48
CARToGRApHY
ferred to as the neocartographer. Such individuals often has little expertise, if any, in cartography. What they do is make a map, often for themselves, of what they need when they need it. They can do this because data is becoming more readily available and easier to access, as well as having access to software to help them make a map. It is not a simple task, though. It requires finding and integrating the data, often from multiple sources, and styling it to obtain a map.
While GIS software such as the Open Source QGIS platform, will help them in these tasks, anything more complicated than map lay-ering and styling will be hard to do. The result is not guaranteed to be pretty, and without cartographic knowledge, the neocartographer will have to make a number of attempts at styling before hopefully getting an acceptable result.
What challenges face map-makers?The professional map-making industry knows how to make good maps. The challenge is to make them more quickly, at lower cost, and to make more of them. Lowering production costs is an obvious focus as mapmaking still involves a lot of manual processes, especially for generalising the data to make it suitable for styling at smaller scales. Speeding up the process of creating a new map or updating an exist-ing one presents its own challenge. This is especially true for organi-sations such as National Mapping and Cadastre Agencies (NMCAs) that cover large territories with detailed mapping,
In most countries, the revision cycle of large scale topographic paper maps can be counted in years. Finally, as we can see with the proliferation of Neocartographers, these organisations need to respond to the need for a wider range of maps, targeting more specific uses. To increase their responsiveness to market needs, they need quick ways of deriving new products from their data. Automatic generalisation is key to achieving this.
From the Neocartographer’s point of view, the challenge is to find the data, integrate and style it, the greatest limitation being at the integration stage.
Rather than regarding the neocartographer as a threat to tradi-tional cartographers, it is interesting to look at the complementary nature of their tasks. This has been recognised by the International Cartographic Association which, last year, created a commission on neocartography to facilitate discussion and collaboration between these two fields.
Creating map series or even single maps for niche markets is rarely sustainable for NMCAs. What they are doing is to make their trusted and reliable data available via geoportals so users can make their own maps. This is often delivered as a set of base maps at sev-eral scales, often in raster but sometimes also in vector format. While such maps are intended to be used on their own they are increasingly being utilized as background maps for thematic data. This is clearly the aim, for example, of the OS VectorMap® family of products from Ordnance Survey GB. So much for the data. But what about tools for the would-be neocartographer?
Data integration and generalisationUsing readily-available software, it is possible to perform some data integration and generalisation. However, these tools require skill, may need programming, and take time to yield results. NMAs have invested heavily in developing bespoke automatic generalisation systems and a few are now operational with varying levels of automa-tion. Clearly, such solutions are not an option for neocartographers. If they want generalisation to be applied to their data, they will need to learn and apply the few interactive GIS tools currently available. The same is true for integration.
1Spatial has long recognised the need to translate more of the cartographer’s expertise into software form. For traditional cartogra-phers, such software speeds their work, reduces costs, allows them to update products in a more timely manner, and produce a wider range of maps with no increase in staffing. For neocartographers, it expands their horizons in terms of data-handling, integration and generalisation. The result: a wider range of maps produced more quickly and at higher quality.
1Integrate has been designed to help the user clean data and integrate data from multiple sources. It uses a rule editor that gives users the flexibility to create rules to detect correspondences between features from multiple sources and to perform actions to integrate them as required.
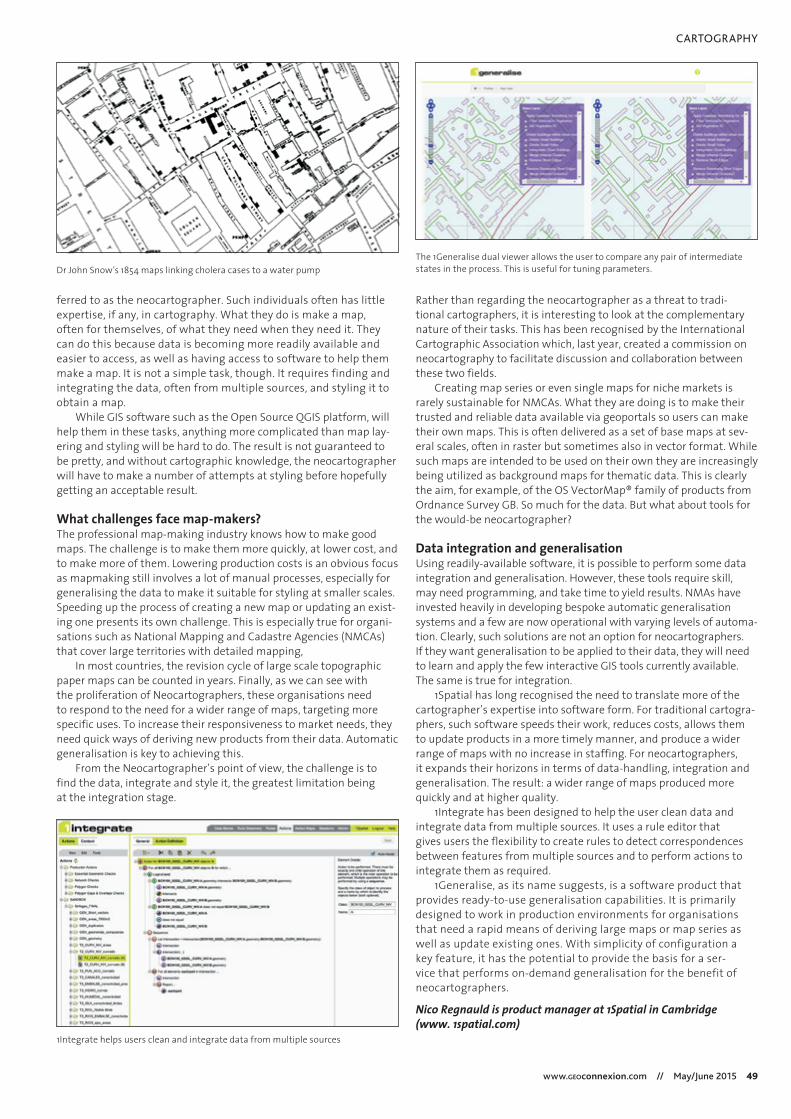
1Generalise, as its name suggests, is a software product that provides ready-to-use generalisation capabilities. It is primarily designed to work in production environments for organisations that need a rapid means of deriving large maps or map series as well as update existing ones. With simplicity of configuration a key feature, it has the potential to provide the basis for a ser-vice that performs on-demand generalisation for the benefit of neocartographers.
Nico Regnauld is product manager at 1Spatial in Cambridge (www. 1spatial.com)
Dr John Snow’s 1854 maps linking cholera cases to a water pump
1Integrate helps users clean and integrate data from multiple sources
The 1Generalise dual viewer allows the user to compare any pair of intermediate states in the process. This is useful for tuning parameters.
www.geoconnexion.com // May/June 2015 49
CARToGRApHY