Embed Size (px)
Citation preview

Web Analytics with Google Analytics (GA)
TRAINING MANUAL FOR WEB EDITORS
L S A W E B S E R V I C E S
Google Analytics Training Manual LSA Web Services
Haven Hall, Suite 6051 505 South State Street
Ann Arbor, MI 48109-1045 Phone 734.763.1734 • Fax 734.763.1778
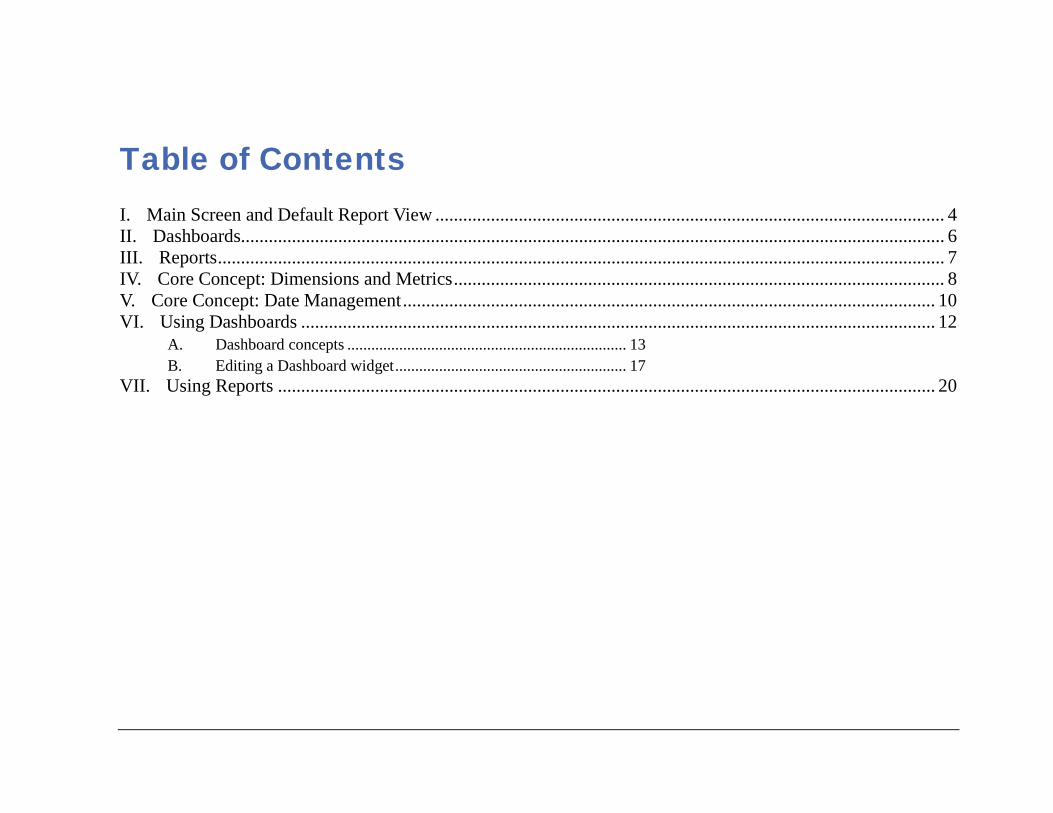
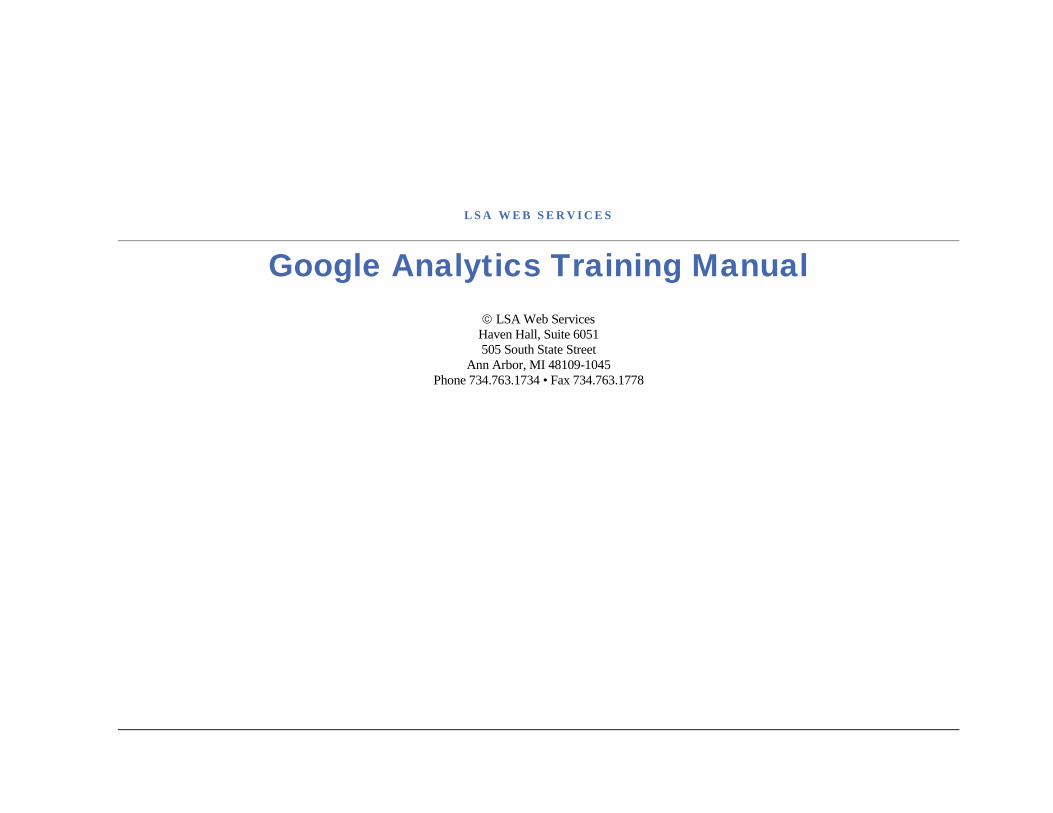
Table of Contents I. Main Screen and Default Report View .............................................................................................................. 4 II. Dashboards........................................................................................................................................................ 6 III. Reports ............................................................................................................................................................. 7 IV. Core Concept: Dimensions and Metrics .......................................................................................................... 8 V. Core Concept: Date Management ................................................................................................................... 10 VI. Using Dashboards ......................................................................................................................................... 12
Dashboard concepts ...................................................................... 13 A. Editing a Dashboard widget .......................................................... 17 B.
VII. Using Reports .............................................................................................................................................. 20

3
Getting to Know the Google Analytics Environment As an web admin, you will access your website in what we call the “Google Analytics Dashboard. (https://analytics.google.com)
CHAPTER
1
4
I. Main Screen and Default Report View
The main screen is what you’ll see when you log into analytics. Generally speaking you just have to select your particular department’s site, which will be labeled under the LSA Sites account. Click on the link and it will take you to the default
5
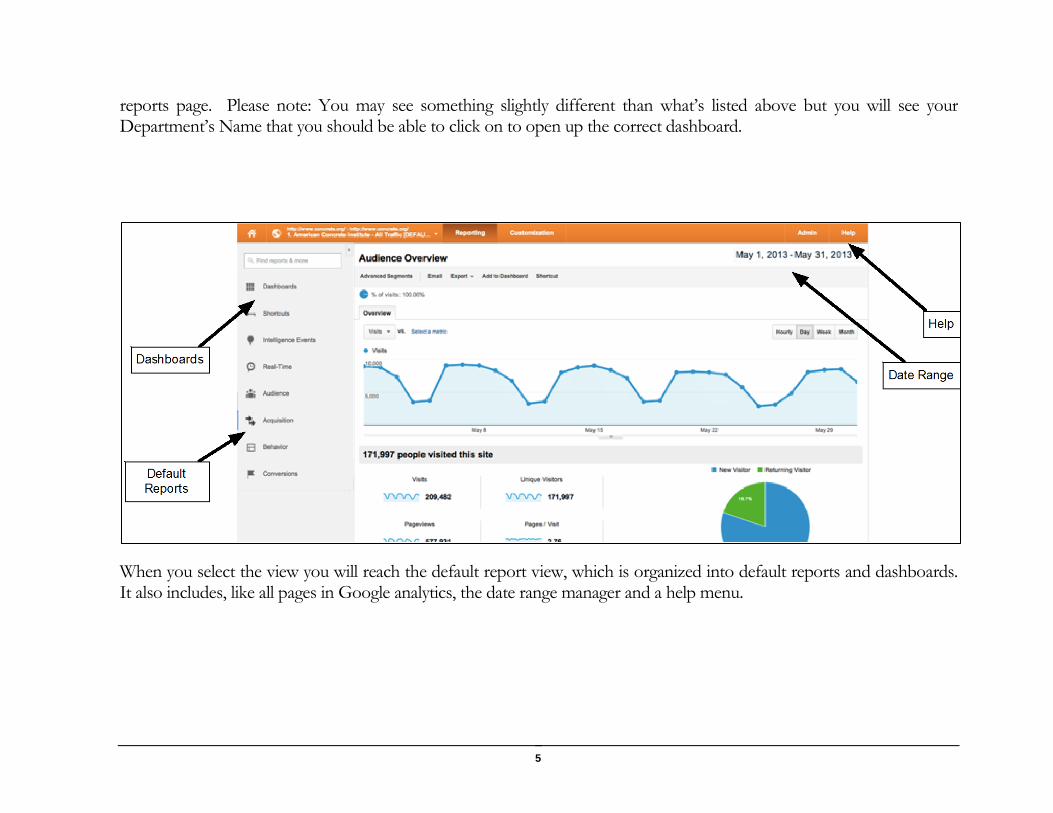
reports page. Please note: You may see something slightly different than what’s listed above but you will see your Department’s Name that you should be able to click on to open up the correct dashboard.
When you select the view you will reach the default report view, which is organized into default reports and dashboards. It also includes, like all pages in Google analytics, the date range manager and a help menu.
6
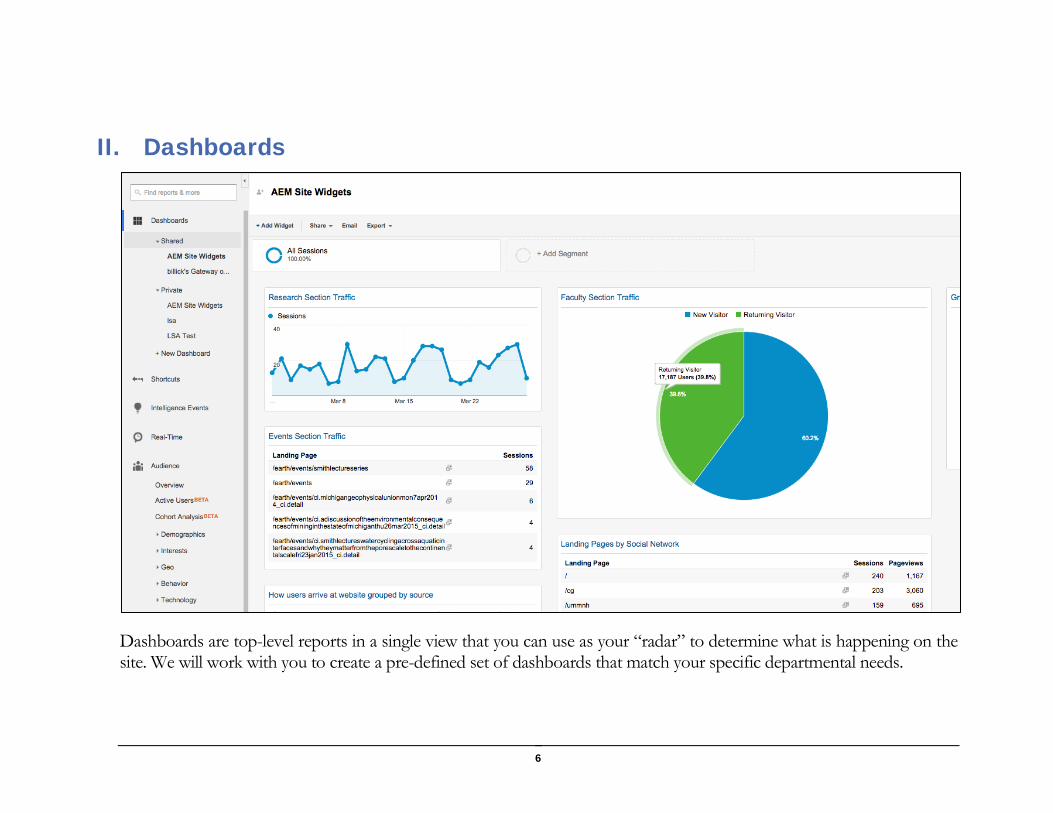
II. Dashboards
Dashboards are top-level reports in a single view that you can use as your “radar” to determine what is happening on the site. We will work with you to create a pre-defined set of dashboards that match your specific departmental needs.
7
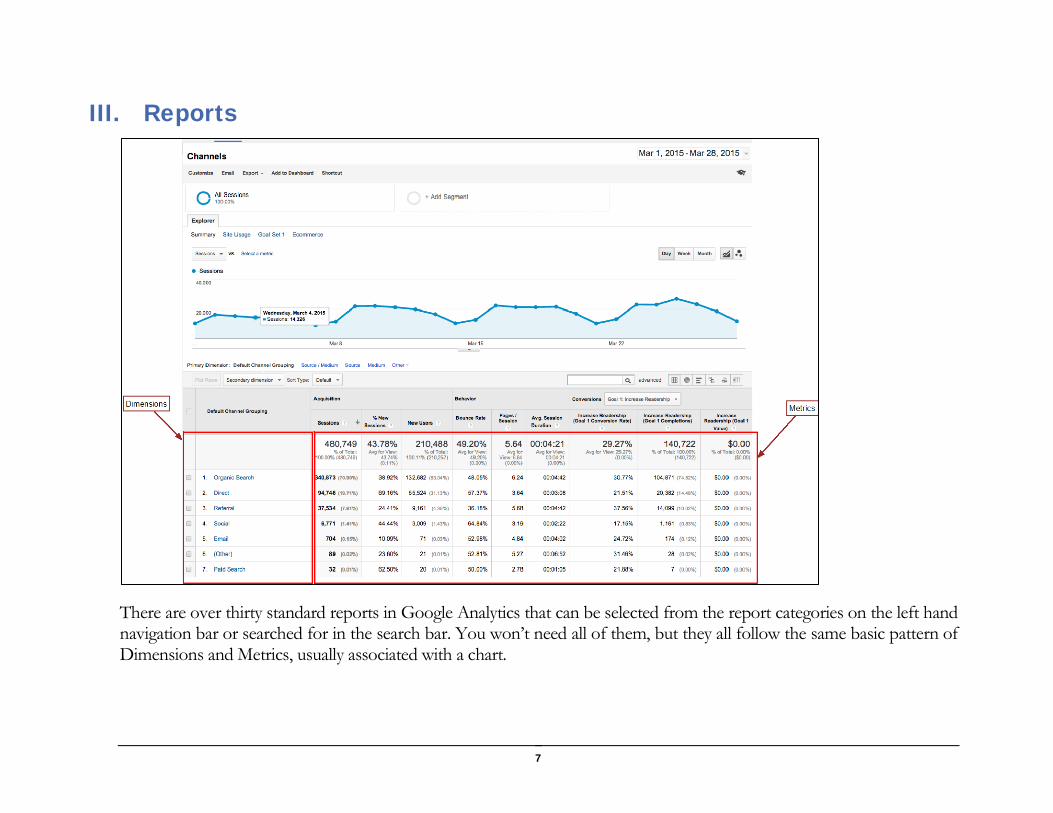
III. Reports
There are over thirty standard reports in Google Analytics that can be selected from the report categories on the left hand navigation bar or searched for in the search bar. You won’t need all of them, but they all follow the same basic pattern of Dimensions and Metrics, usually associated with a chart.
8
Using Google Analytics The best thing about using Google Analytics is that you can do a great deal in the tool without knowing everything about it. This training guide and the supporting on-demand videos are designed to support an incremental approach, where you learn about the tool over time as your needs change and expand. Our approach assumes that you will:
• Start with a set of dashboards that support your core needs
• Drill down into specific reports for certain questions
• Expand your knowledge of other reports as your questions get more sophisticated and you start to spend more time in the tool.
IV. Core Concept: Dimensions and Metrics Dimensions and Metrics are the center of data in Google Analytics. A DIMENSION is a list of things, like cities in the United States, the pages on a site, or types of visitors.
If you can list things in a category, it is probably a dimension.
CHAPTER
2
9
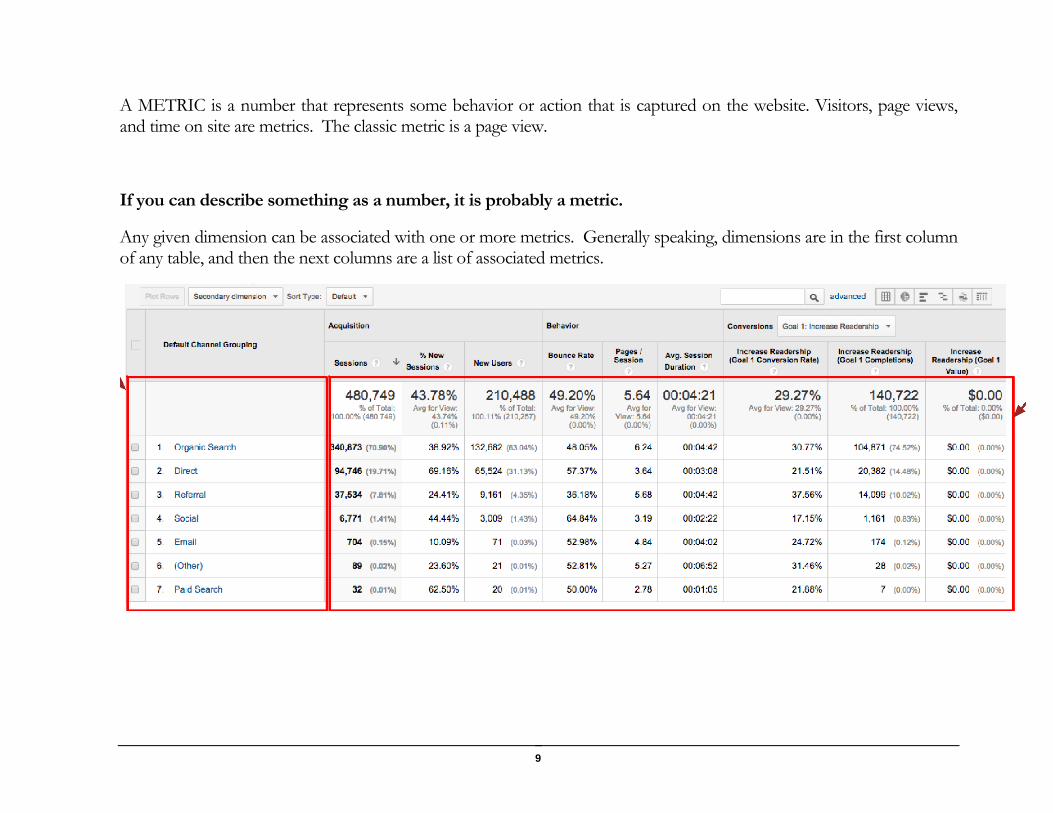
A METRIC is a number that represents some behavior or action that is captured on the website. Visitors, page views, and time on site are metrics. The classic metric is a page view.
If you can describe something as a number, it is probably a metric.
Any given dimension can be associated with one or more metrics. Generally speaking, dimensions are in the first column of any table, and then the next columns are a list of associated metrics.
10
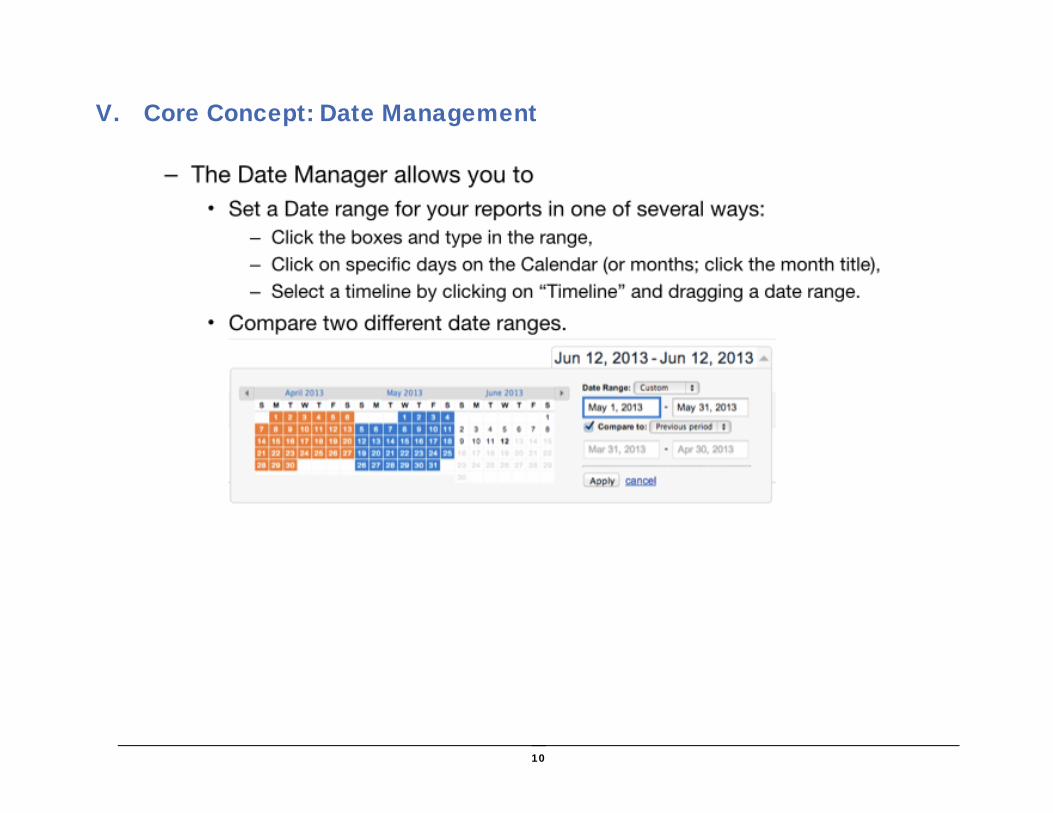
V. Core Concept: Date Management
11
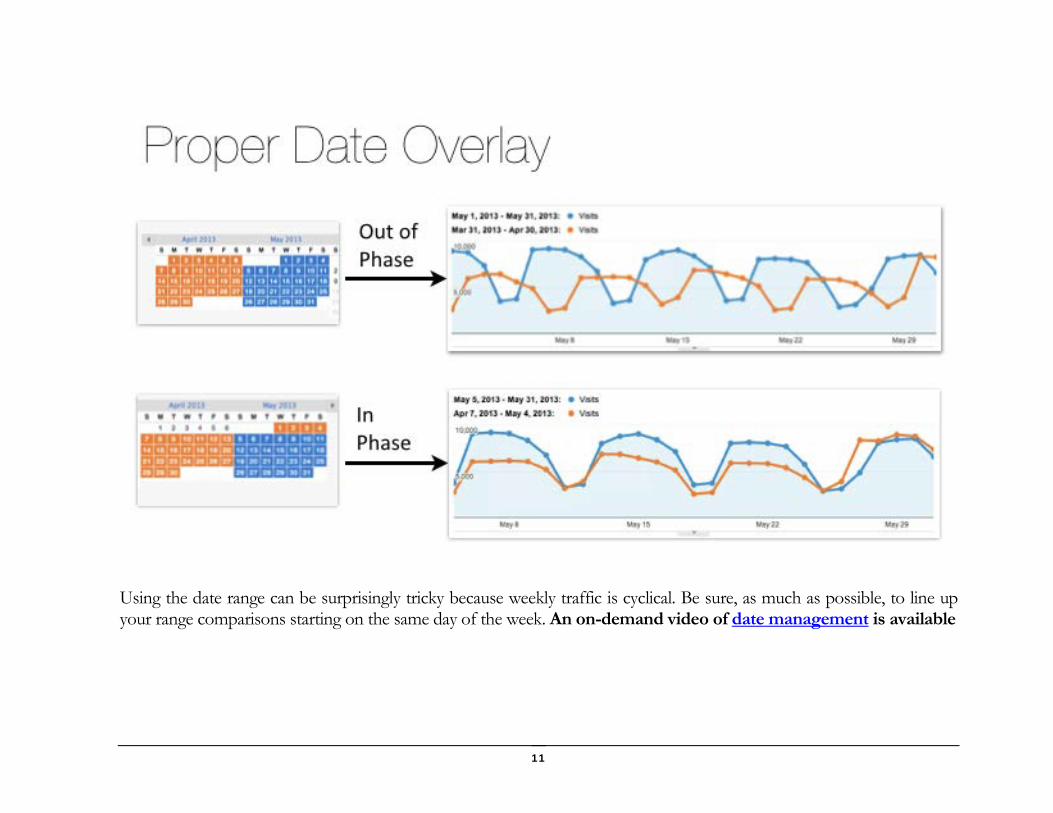
Using the date range can be surprisingly tricky because weekly traffic is cyclical. Be sure, as much as possible, to line up your range comparisons starting on the same day of the week. An on-demand video of date management is available
12
VI. Using Dashboards Dashboards are a top-level view of what’s going on in your site. They allow you to quickly check the status of ongoing activities and look over a broad range of key numbers at the same time. Dashboards operate as a kind of high-level radar that allows you to drill into any single widget one of them to get more details. This report will show you how to do three things for a dashboard report. An on-demand video of Dashboard management is available.
13
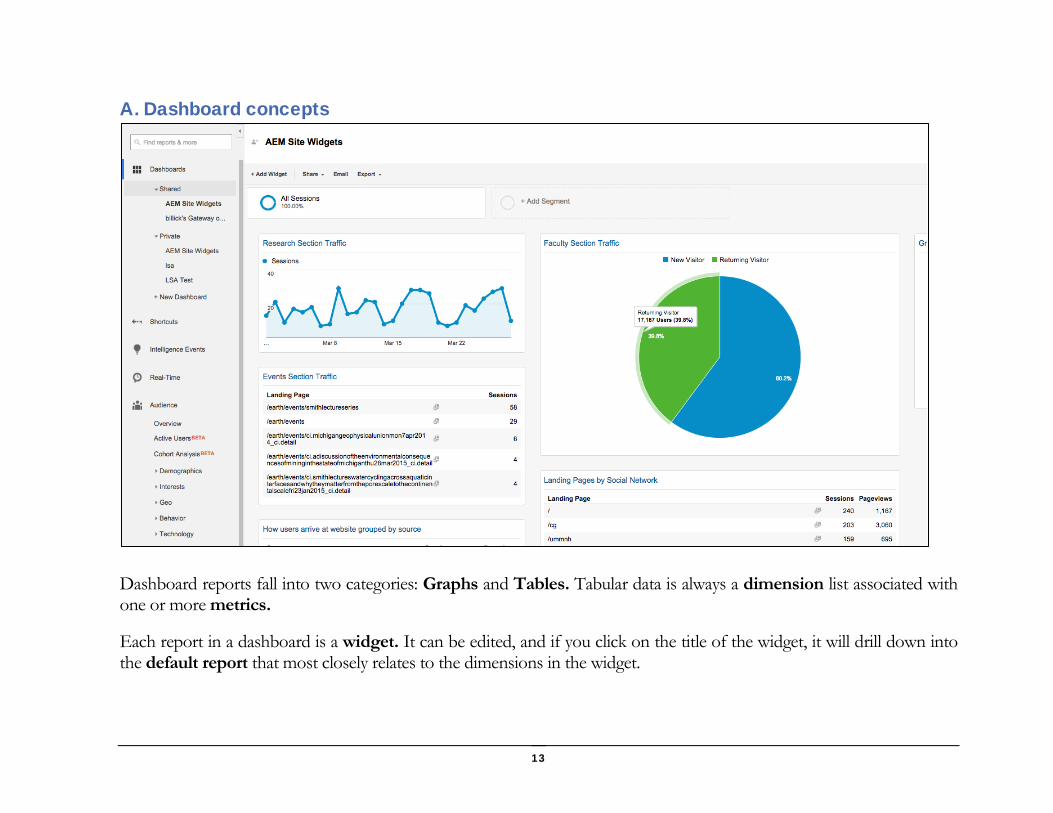
Dashboard concepts A.
Dashboard reports fall into two categories: Graphs and Tables. Tabular data is always a dimension list associated with one or more metrics.
Each report in a dashboard is a widget. It can be edited, and if you click on the title of the widget, it will drill down into the default report that most closely relates to the dimensions in the widget.
14
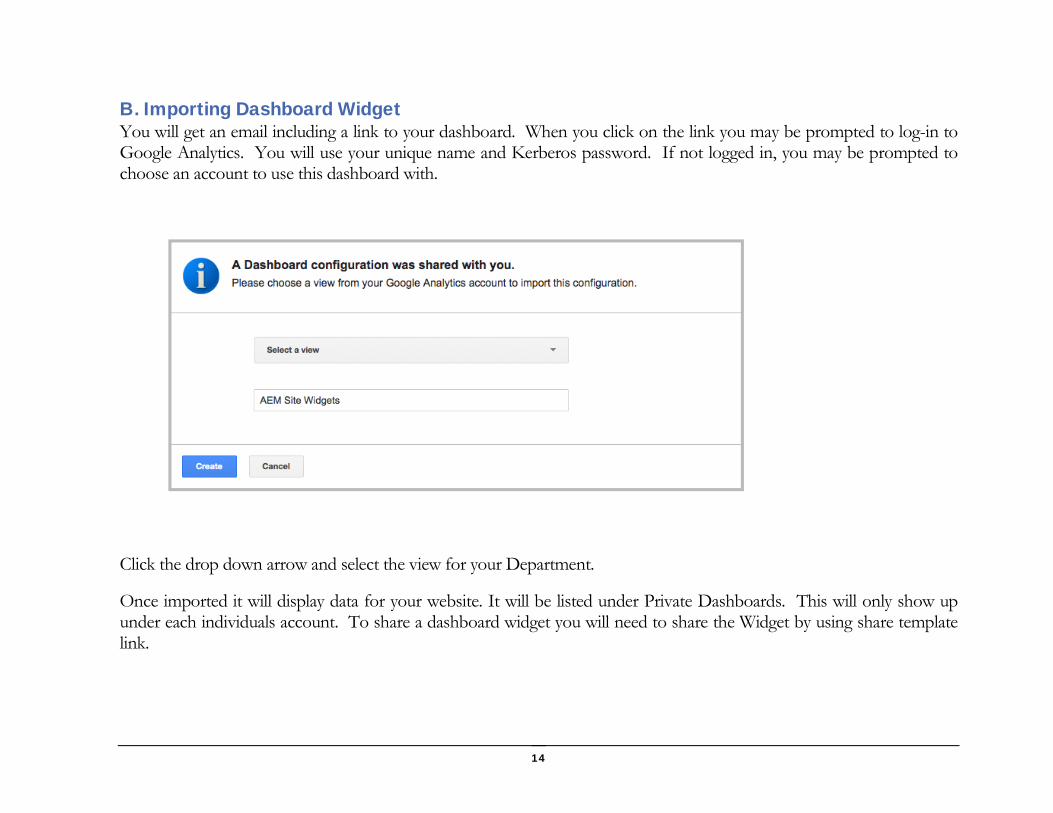
Importing Dashboard Widget B.You will get an email including a link to your dashboard. When you click on the link you may be prompted to log-in to Google Analytics. You will use your unique name and Kerberos password. If not logged in, you may be prompted to choose an account to use this dashboard with.
Click the drop down arrow and select the view for your Department.
Once imported it will display data for your website. It will be listed under Private Dashboards. This will only show up under each individuals account. To share a dashboard widget you will need to share the Widget by using share template link.
15
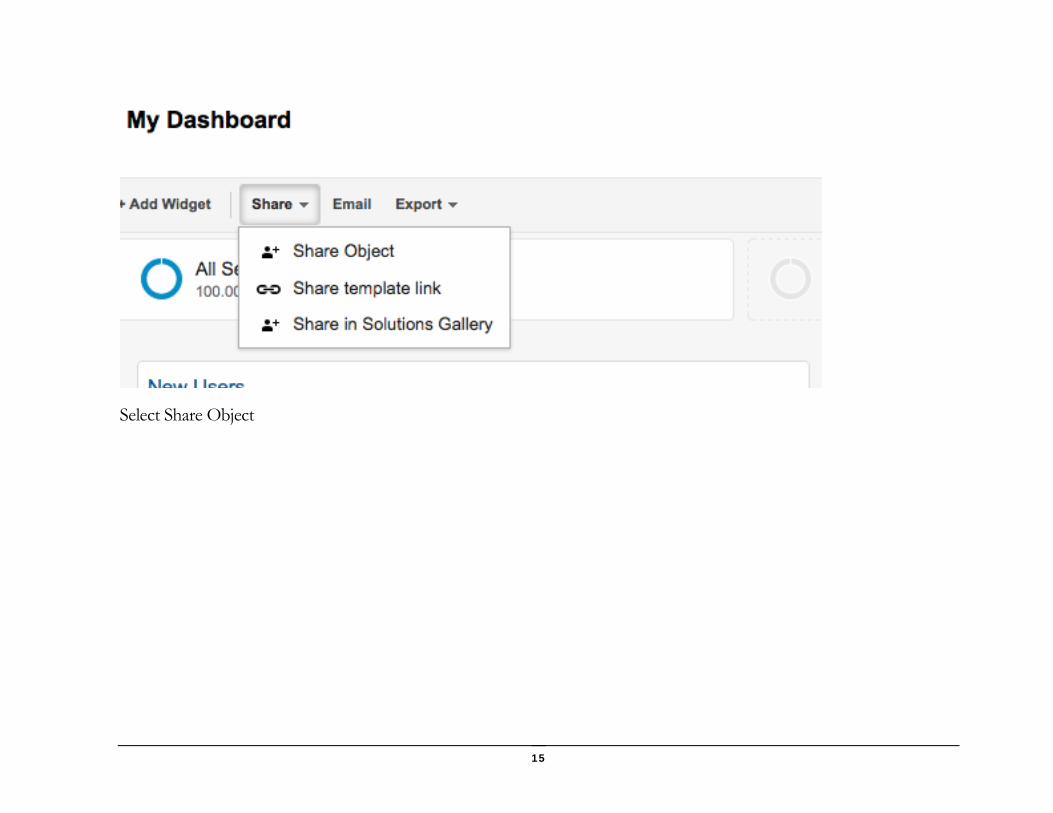
Select Share Object
16
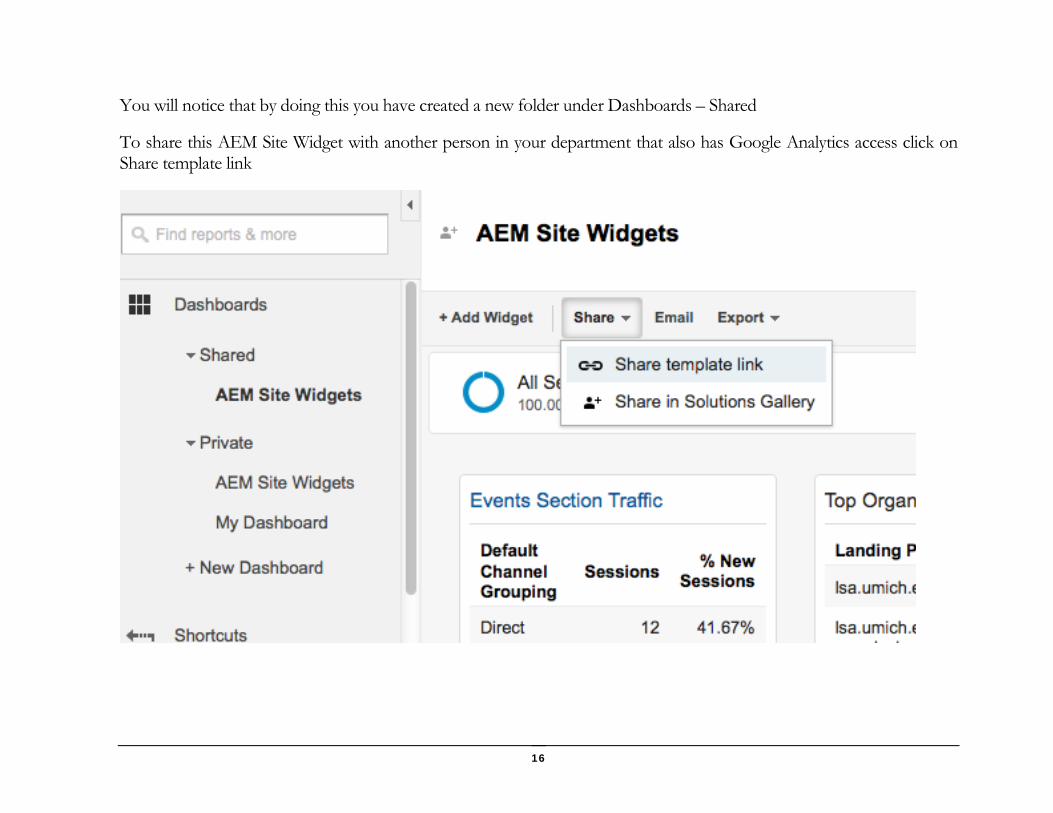
You will notice that by doing this you have created a new folder under Dashboards – Shared
To share this AEM Site Widget with another person in your department that also has Google Analytics access click on Share template link
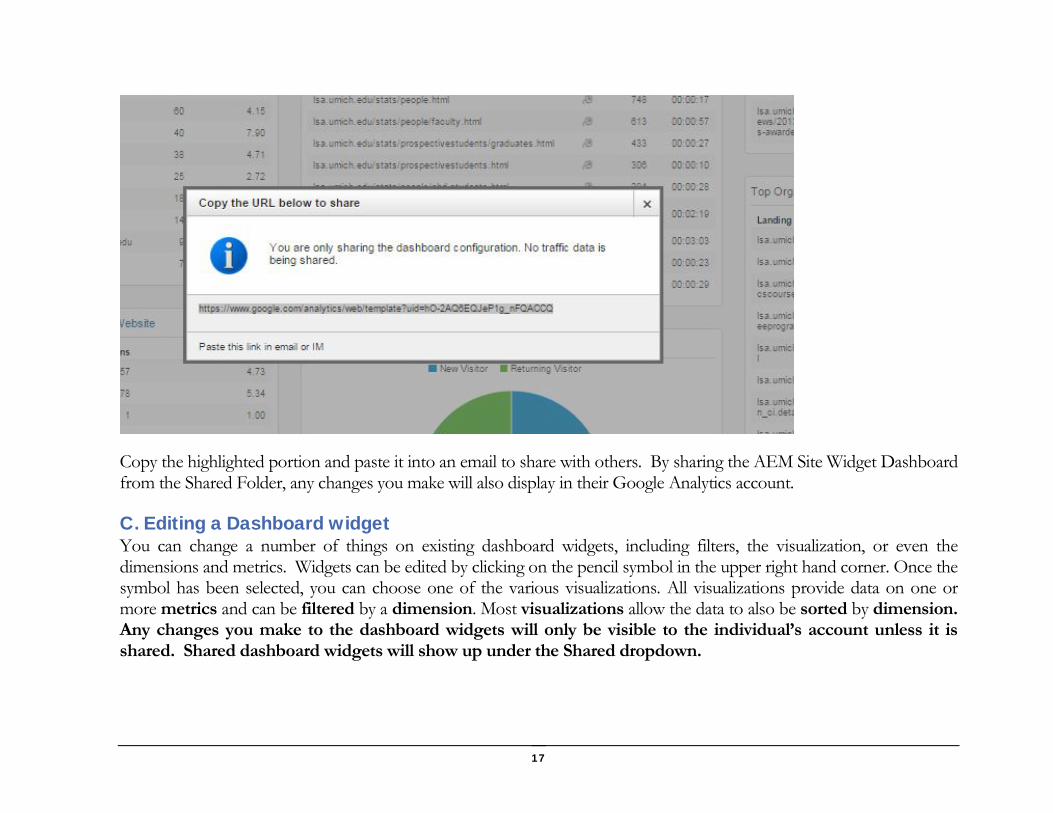
17
Copy the highlighted portion and paste it into an email to share with others. By sharing the AEM Site Widget Dashboard from the Shared Folder, any changes you make will also display in their Google Analytics account.
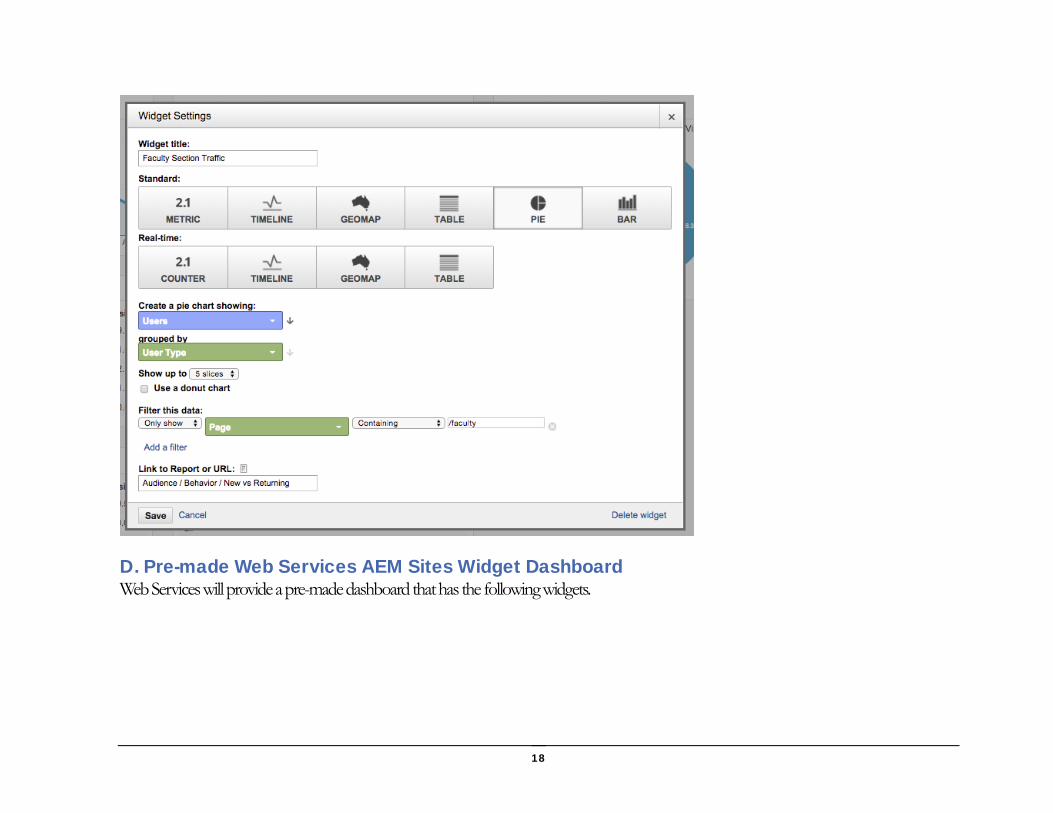
Editing a Dashboard widget C.You can change a number of things on existing dashboard widgets, including filters, the visualization, or even the dimensions and metrics. Widgets can be edited by clicking on the pencil symbol in the upper right hand corner. Once the symbol has been selected, you can choose one of the various visualizations. All visualizations provide data on one or more metrics and can be filtered by a dimension. Most visualizations allow the data to also be sorted by dimension. Any changes you make to the dashboard widgets will only be visible to the individual’s account unless it is shared. Shared dashboard widgets will show up under the Shared dropdown.
18
Pre-made Web Services AEM Sites Widget Dashboard D.Web Services will provide a pre-made dashboard that has the following widgets.

19
Dashboard Widget Department Objective Goals on Website Underlying Report Main/secondary dimension Filter
Undergraduate Section Traffic
Enrollment Increased Traffic on Undergrad Section
New vs. Returning User Type Advanced segment: page containing /undergraduate
Events Section Traffic Enrollment Outreach Effort for Events
Default Channel Grouping Default Channel Grouping / Page
Advanced segment: Page containing /events
"Top organic search landing pages"
Recruitment Search Keywords used to reach site
Landing Page Landing Page / Default Channel Grouping
Advanced: Default Channel Grouping containing Organic S h Graduate Section Traffic Recruitment Increase Traffic on Grad Section New vs. Returning User Type Advanced segment: page containing /graduate
Faculty Section Traffic Recruitment Increase Traffic on Faculty Section New vs. Returning User Type Advanced segment: page containing /faculty
Research Section Traffic Recruitment Increase Traffic on Research Section
Default Channel Grouping Default Channel Grouping / Page
Advanced segment: Page regex match ̂ /research
Loyal Alumni Traffic Convening Regular traffic on Alumni & Friends section of the website
New vs. Returning User Type Advanced: Segment:
Exclude Network Domain w/umich
Include Page containing /alumnifriends
Landing pages by Social Network
Convening Click-thrus from Social Media channels
Landing Page Landing Page / Default Channel Grouping
Advanced: Default Channel Grouping containing Social Search
Where are users coming from
Sharing Traffic on Research, News, Publications, Events grouped by medium
All Traffic Medium None
How users arrive to your website
Sharing Traffic on Research, News, Publications, Events grouped by source
All Traffic Source None
20
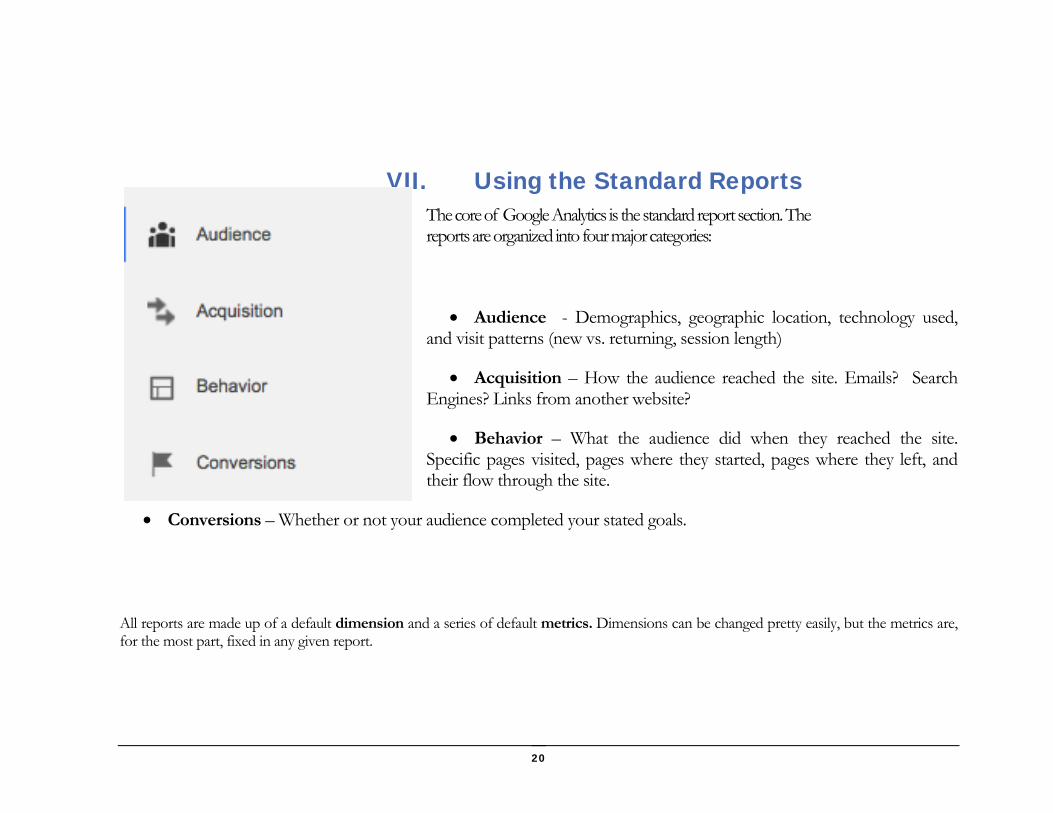
VII. Using the Standard Reports The core of Google Analytics is the standard report section. The reports are organized into four major categories:
• Audience - Demographics, geographic location, technology used, and visit patterns (new vs. returning, session length)
• Acquisition – How the audience reached the site. Emails? Search Engines? Links from another website?
• Behavior – What the audience did when they reached the site. Specific pages visited, pages where they started, pages where they left, and their flow through the site.
• Conversions – Whether or not your audience completed your stated goals.
All reports are made up of a default dimension and a series of default metrics. Dimensions can be changed pretty easily, but the metrics are, for the most part, fixed in any given report.
21
For now the most likely way that you will use reports is by drilling down through a dashboard to get more detailed or complex information. The dashboards that exist drill down to the following reports: An on-demand video Giving and Example of Report Viewing and Filtering is available.
VIII. Support • Google Support has videos, tutorials and instructions available.
• Schedule time to attend an Open Lab if you have specific issues or questions.


![Google Analytics Year 2[1].ppt - Enterprise Resource … Google Analytics With PeopleSoft Year ... Code Reference fsu_google_analytics.js ... HTML object on each pageEmbed the GA Tracker](https://img.pdfslide.net/doc/110x75/5b4d2a4c7f8b9ac3688b5133/google-analytics-year-21ppt-enterprise-resource-google-analytics-with-peoplesoft.jpg)