Embed Size (px)
Citation preview

2901 South Loop Drive, Suite 3100 ~ Ames, Iowa 50010-8634
Iowa State University ~ University of Missouri-Columbia ~ Lincoln UniversityUniversity of Missouri-Kansas City ~ University of Missouri-St. Louis ~ University of Northern Iowa
Web-based Implementation of Winter Maintenance Decision Support System Using GIS and Remote Sensing
Final Report—May 2005
Sponsored by
University Transportation Centers Program,U.S. Department of Transportation(MTC Project 2003-05)

The contents of this report reflect the views of the authors, who are responsible for the facts and the accuracy of the information presented herein. This document is disseminated under the spon-sorship of the U.S. Department of Transportation in the interest of information exchange. The U.S. Government assumes no liability for the contents or use of the information contained in this document. This report does not constitute a standard, specification, or regulation.
The U.S. Government does not endorse products or manufacturers. Trademarks or manufactur-ers’ names appear in this report only because they are considered essential to the objective of the document.
The mission of the University Transportation Centers (UTC) Program is to advance U.S. technol-ogy and expertise in the many disciplines comprising transportation through the mechanisms of education, research, and technology transfer at university-based centers of excellence. The Mid-west Transportation Consortium (MTC) is the UTC Program regional center for Iowa, Kansas, Missouri, and Nebraska. Iowa State University, through its Center for Transportation Research and Education (CTRE), is the MTC’s lead institution. The MTC’s theme is “Transportation System Management and Operations,” specifically, sustainable transportation asset management principles and techniques.
Technical Report Documentation Page
1. Report No. 2. Government Accession No. 3. Recipient’s Catalog No. MTC Project 2003-05
4. Title and Subtitle 5. Report Date May 2005 6. Performing Organization Code
Web-based Implementation of a Winter Maintenance Decision Support System Using GIS and Remote Sensing
7. Authors 8. Performing Organization Report No. Ramanathan Sugumaran, Md Salim, Tim Strauss, and Chris Fulcher
9. Performing Organization Name and Address 10. Work Unit No. (TRAIS) 11. Contract or Grant No.
Midwest Transportation Consortium 2901 South Loop Drive, Suite 3100 Ames, IA 50010-8634
12. Sponsoring Organization Name and Address 13. Type of Report and Period Covered
Final Report 14. Sponsoring Agency Code
U.S. Department of Transportation Research and Special Programs Administration 400 7th Street SW Washington, DC 20590-0001
15. Supplementary Notes Visit www.ctre.iastate.edu for color PDF files of this and other research reports. 16. Abstract Winter maintenance, particularly snow removal and the stress of snow removal materials on public structures, is an enormous budgetary burden on municipalities and nongovernmental maintenance organizations in cold climates. Lately, geospatial technologies such as remote sensing, geographic information systems (GIS), and decision support tools are providing a valuable tool for planning snow removal operations. A few researchers recently used geospatial technologies to develop winter maintenance tools. However, most of these winter maintenance tools, while having the potential to address some of these information needs, are not typically placed in the hands of planners and other interested stakeholders. Most tools are not constructed with a nontechnical user in mind and lack an easy-to-use, easily understood interface. A major goal of this project was to implement a web-based Winter Maintenance Decision Support System (WMDSS) that enhances the capacity of stakeholders (city/county planners, resource managers, transportation personnel, citizens, and policy makers) to evaluate different procedures for managing snow removal assets optimally. This was accomplished by integrating geospatial analytical techniques (GIS and remote sensing), the existing snow removal asset management system, and web-based spatial decision support systems. The web-based system was implemented using the ESRI ArcIMS ActiveX Connector and related web technologies, such as Active Server Pages, JavaScript, HTML, and XML. The expert knowledge on snow removal procedures is gathered and integrated into the system in the form of encoded business rules using Visual Rule Studio. The system developed not only manages the resources but also provides expert advice to assist complex decision making, such as routing, optimal resource allocation, and monitoring live weather information. This system was developed in collaboration with Black Hawk County, IA, the city of Columbia, MO, and the Iowa Department of Transportation. This product was also demonstrated for these agencies to improve the usability and applicability of the system.
17. Key Words 18. Distribution Statement remote sensing—geographic information systems—expert system—snowplow—decision support system—snow—winter maintenance
No restrictions.
19. Security Classification (of this report)
20. Security Classification (of this page)
21. No. of Pages 22. Price
Unclassified. Unclassified. 46 NA
Form DOT F 1700.7 (8-72) Reproduction of completed page authorized

Web-based Implementation of a Winter Maintenance Decision Support System Using
GIS and Remote Sensing
Final Report May 2005
Principal Investigator Ramanathan Sugumaran
Associate Professor, Department of Geography University of Northern Iowa
Co-Principal Investigators
Tim Strauss Associate Professor, Department of Geography
University of Northern Iowa
Md. Salim Professor, Department of Industrial Technology
University of Northern Iowa
Chris Fulcher Assistant Professor, Harry S Truman School of Public Affairs
University of Missouri-Columbia
Research Assistants James Gerjevic, Shriram Ilavajhala, Alvaro Villavicencio, Adam Ramthun, Krista Kellyson, and Pavuluri Manoj Kumar
Authors
Ramanathan Sugumaran, Md. Salim, Tim Strauss, and Chris Fulcher
Preparation of this report was financed in part through funds provided by the U.S. Department of Transportation
through the Midwest Transportation Consortium.
Midwest Transportation Consortium 2901 South Loop Drive, Suite 3100
Ames, IA 50010-8634 Telephone: 515-294-8103
Fax: 515-294-0467 www.ctre.iastate.edu/mtc/
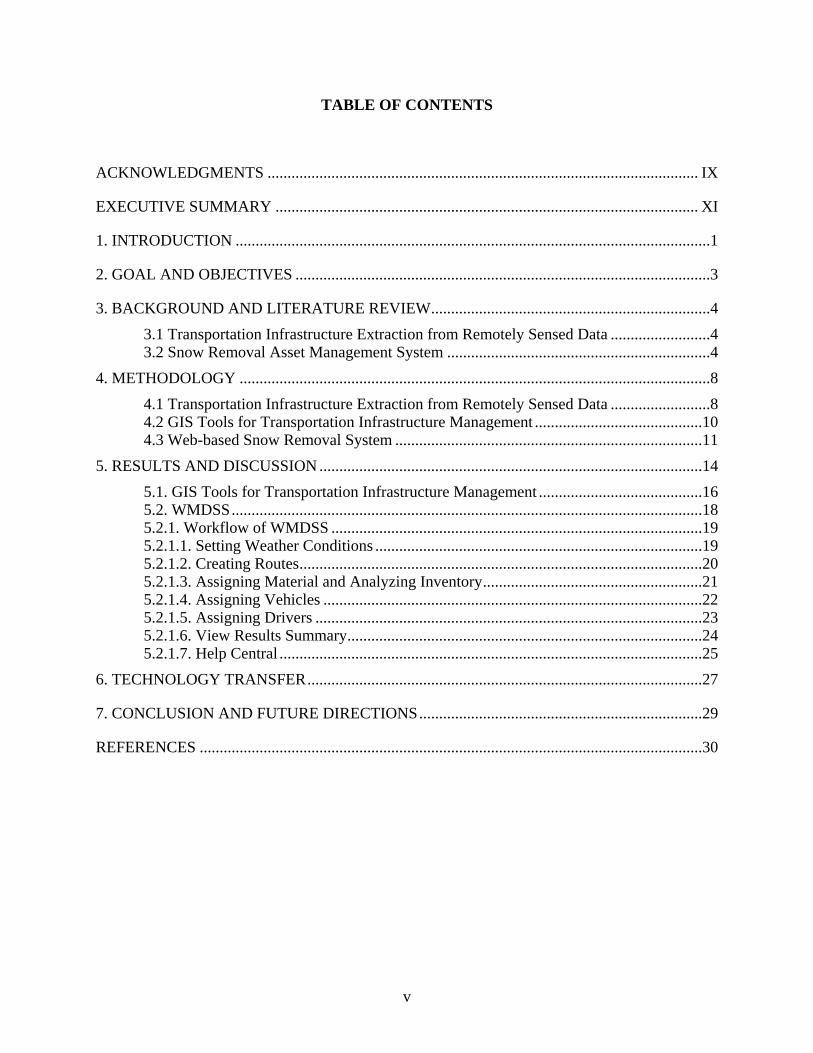
TABLE OF CONTENTS
ACKNOWLEDGMENTS ............................................................................................................ IX
EXECUTIVE SUMMARY .......................................................................................................... XI
1. INTRODUCTION .......................................................................................................................1
2. GOAL AND OBJECTIVES ........................................................................................................3
3. BACKGROUND AND LITERATURE REVIEW......................................................................4 3.1 Transportation Infrastructure Extraction from Remotely Sensed Data .........................4 3.2 Snow Removal Asset Management System ..................................................................4
4. METHODOLOGY ......................................................................................................................8 4.1 Transportation Infrastructure Extraction from Remotely Sensed Data .........................8 4.2 GIS Tools for Transportation Infrastructure Management ..........................................10 4.3 Web-based Snow Removal System .............................................................................11
5. RESULTS AND DISCUSSION ................................................................................................14 5.1. GIS Tools for Transportation Infrastructure Management .........................................16 5.2. WMDSS......................................................................................................................18 5.2.1. Workflow of WMDSS .............................................................................................19 5.2.1.1. Setting Weather Conditions ..................................................................................19 5.2.1.2. Creating Routes.....................................................................................................20 5.2.1.3. Assigning Material and Analyzing Inventory.......................................................21 5.2.1.4. Assigning Vehicles ...............................................................................................22 5.2.1.5. Assigning Drivers .................................................................................................23 5.2.1.6. View Results Summary.........................................................................................24 5.2.1.7. Help Central ..........................................................................................................25
6. TECHNOLOGY TRANSFER...................................................................................................27
7. CONCLUSION AND FUTURE DIRECTIONS.......................................................................29
REFERENCES ..............................................................................................................................30
v
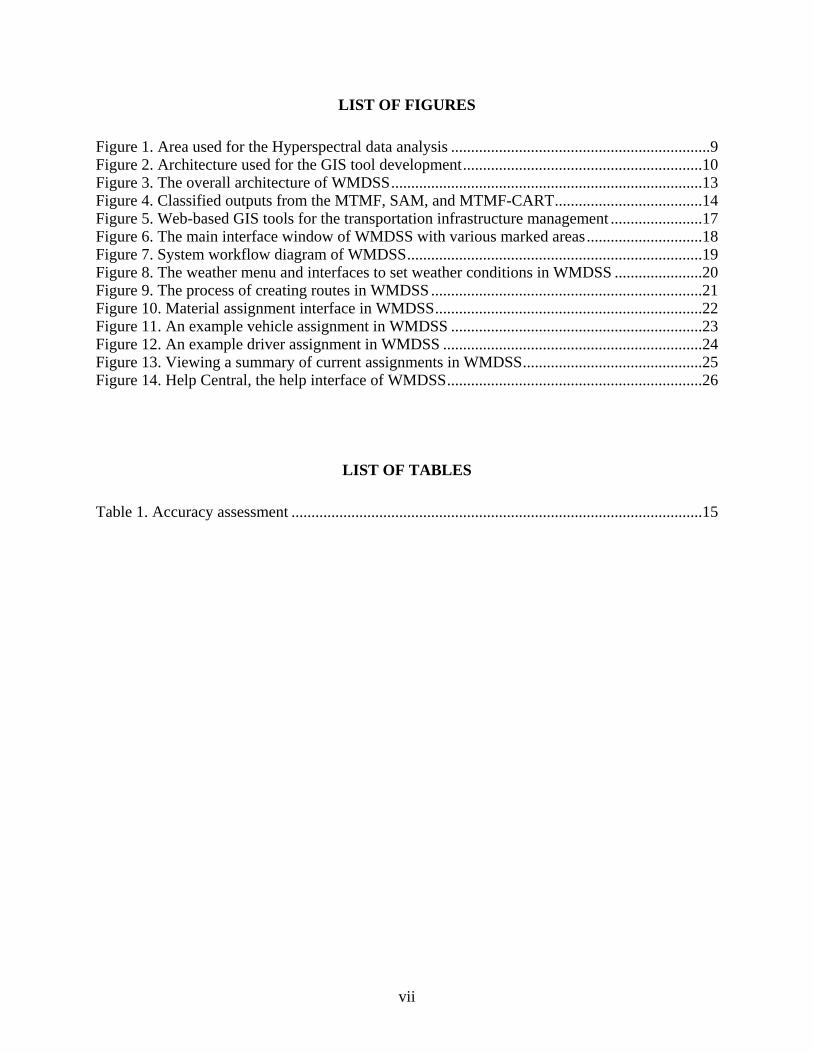
LIST OF FIGURES
Figure 1. Area used for the Hyperspectral data analysis .................................................................9 Figure 2. Architecture used for the GIS tool development............................................................10 Figure 3. The overall architecture of WMDSS..............................................................................13 Figure 4. Classified outputs from the MTMF, SAM, and MTMF-CART.....................................14 Figure 5. Web-based GIS tools for the transportation infrastructure management .......................17 Figure 6. The main interface window of WMDSS with various marked areas.............................18 Figure 7. System workflow diagram of WMDSS..........................................................................19 Figure 8. The weather menu and interfaces to set weather conditions in WMDSS ......................20 Figure 9. The process of creating routes in WMDSS ....................................................................21 Figure 10. Material assignment interface in WMDSS...................................................................22 Figure 11. An example vehicle assignment in WMDSS ...............................................................23 Figure 12. An example driver assignment in WMDSS .................................................................24 Figure 13. Viewing a summary of current assignments in WMDSS.............................................25 Figure 14. Help Central, the help interface of WMDSS................................................................26
LIST OF TABLES
Table 1. Accuracy assessment .......................................................................................................15
vii

ACKNOWLEDGMENTS
The authors would like to thank the Midwest Transportation Consortium, the Iowa Department of Transportation, and the University of Northern Iowa for sponsoring this research. We also wish to thank the NASA-JPL center for providing the AVIRIS data set for this research; David Plazak for his continuous support throughout the project; Mr. Russ Frisch, Highway Maintenance Supervisor 3 of the Iowa DOT; Mr. Steve Decker of the Waterloo Street Department; and Mr. Darrell Fanning and Mr. Steve Ravn of the Cedar Falls Streets Department for their time and input.
ix

EXECUTIVE SUMMARY
Winter maintenance, particularly snow removal and the stress of snow removal materials on public structures, is an enormous budgetary burden on municipalities and nongovernmental maintenance organizations in cold climates. Lately, geo-spatial technologies such as remote sensing, geographical information systems (GIS), and decision support tools are providing valuable assistance in planning snow removal operations. A few researchers recently used geo-spatial technologies for the development of winter maintenance tools. However, most of these winter maintenance tools, while having the potential to address some of the informational needs of snow removal agencies, are not typically placed in the hands of planners and other interested stakeholders. Most tools are not constructed with a nontechnical user in mind and lack an easy-to-use, easily understood interface.
A major goal of the project was to implement a web-based Winter Maintenance Decision Support System (WMDSS) for planning snow removal operations that enhances the capacity of stakeholders (city/county planners, resource managers, transportation personnel, citizens, and policy makers) to evaluate different procedures to manage snow removal assets optimally. This goal was accomplished by integrating geo-spatial analytical techniques (GIS and remote sensing), existing snow removal asset management systems (SRAMS), and web-based spatial decision support systems. In order to extract up-to-date transportation infrastructure features, this study used hyperspectral imagery from the high-resolution Airborne Visible/Infrared Imaging Spectrometer (AVIRIS). Classifiers such as the Spectral Angle Mapper (SAM), Mixture-tuned Matched Filtering (MTMF) and Mixture-Tuned Matched Filtering combined with Classification and Regression Tree (MTMF-CART) were used to extract the transportation infrastructures. The study found that the MTMF classification method produced the best overall results compared to both the SAM classifier and MTMF-CART methods, and the overall accuracies for the three classifications were 81.89%, 88.92%, and 84.32%, respectively. The web-based decision support system was implemented using the ESRI ArcIMS ActiveX Connector and related web technologies like ASP, JavaScript, HTML, and XML. The expert knowledge is represented as “business rules” using Visual Rule Studio, and is integrated with the system. The developed system not only manages and allocates resources, but also provides expert advice to assist complex decision making such as routing, optimal resource allocation, and live weather information monitoring. This system was developed in collaboration with Black Hawk County; the City of Columbia, MO; the Iowa DOT; and the cities of Cedar Falls, IA and Waterloo, IA. Demonstration versions of this product were also given to these agencies in order to improve the usability and applicability of the system.
xi

1. INTRODUCTION
Winter maintenance, particularly snow removal and the stress of snow removal materials on public structures, is an enormous budgetary burden on municipalities and nongovernmental maintenance organizations in cold climates (Anonymous 1998; Black 1999; Anonymous 1999). Also, snow removal operations during winter are of prime importance for reducing traffic accidents and providing safe travel conditions on the nation’s highways and city streets. Quality snow and ice control service is critical to preserving traffic safety, maintaining city commerce, and allowing residents access to schools and medical facilities (Hintz, Kettlewell, Shambarger and Sweeney 2001). The department of transportation (DOT) of each state, the county, and the city governments plan and manage snow removal operations to clear the roads of snow and ice. The DOTs are responsible for snow removal on all interstates and all primary highways, such as U.S. federal and state highways, while the street departments of each city, or sometimes the DOTs themselves, plow the city streets (DOT, 2005).
During winter months, officials at the DOTs and city governments around the state keep tabs on forecasted weather data for possible snowfall. When snowfall is predicted, trucks are sent out to the roads to pre-wet them with liquid salt to prevent bonding between the pavement and the ice. This process is known as “anti-icing.” After the snowfall, the snowplows clear the roads according to the priorities. All the management is thus manual, from choosing routes to assigning vehicles and personnel to determining the materials (e.g., salt, de-icing chemicals, etc.) and material amounts for each route. Most existing methods of snowplowing management, such as resource allocation, inventory management, and routing, are performed manually by the person or persons in charge of snow removal operations. These methods, in most cases, are based on a predetermined set of static rules that are inefficient for snow plowing and resource allocation during constantly changing winter weather conditions. These methods also tend to result in inefficient operations and less-than-optimal results and increase the costs involved in snow removal. Moreover, a lengthier reaction time and a small margin of error during heavy storm conditions can prove deadly, and human-based methods are always prone to such errors.
Additionally, the existing methods of snow removal do not substantially utilize any analytical tools before planning snowplowing operations to reduce costs and maximize overall effectiveness. For example, the methods used by most local government agencies do not use any special measures to cut snowplowing costs through efficient routing and resource allocation. Many existing methods do not choose the shortest or quickest path from the snowplow station to the snowplow route. Neither do they optimize resource allocation by taking into consideration various important factors such as the cost of vehicle operation, availability of drivers or vehicles, and so on. Such methods are terribly inefficient; even a slight change in weather conditions can almost double the resources and unplanned travel time needed for a different, non-predetermined route, and thus can result in a waste of time and money. Therefore, the existing manual methods cannot efficiently deal with resource allocation for newly added routes and changing weather conditions.
Further, the existing methods do not use automated inventory management and control. Inventory management is very important and analytical tools must be used to keep up with the demand for snow removal. Various factors, such as the lead time for an order, the reorder point,
1

stock levels, and so on, must always be monitored to keep the necessary materials used in snow removal (e.g., salt) in stock. Because providing a speedy response after a snow storm is important, inventory management tools are indispensable for planning snow removal operations. In addition to the above shortcomings, existing snow removal methods do not provide visual feedback about routing and resource allocation. Visual feedback not only improves the perception of current assignments, but also allows a review of the allocations for better planning in the future. Also, the current methods do not use integrated weather information that could alert the snow removal crews and provide scenario-based decision support.
Lately, geo-spatial technologies such as geographical information systems (GIS) and decision support tools have been providing a valuable tool for planning snow removal operations (Farkas, Donald, Corbley, and Kevin 1998).The applications chiefly involve using GIS as a mapping and route generation tool for snow removal equipment. The Hennepin County Department of Public Works in Minnesota developed an automated snowplow routing application using TransCAD GIS software (Caliper Corporation 1999). The Indiana Department of Transportation (INDOT) is using a GIS spatial database program called the Computer-Aided System for Planning Efficient Routes (CASPER) for optimizing route planning strategies for snow removal equipment (Pittman 1996). The article referenced for this information predicts that the implementation of automatic GIS-based route planning will have a significant economic benefit to the state: "Based upon an extrapolation of pilot test results, INDOT expects to achieve $8 million to $10 million savings in winter maintenance costs, a significant improvement in snow removal and ice control activities, and an extensive involvement of highway personnel in the modeling and analysis of route design activities" (Pittman 1996). Researchers have also explored the possible use of decision science tools for optimizing the asset management of snow removal resources (Campbell, and Langevin 1995). For example the Snow Removal Asset Management System (SRAMS) was developed as an analytical tool to improve resource allocation in Iowa using GIS and artificial intelligence techniques (Salim, et al. 2002).
Most of these winter maintenance tools, while having the potential to address some of these information needs, are not typically placed in the hands of planners and other interested stakeholders. Several issues have precluded this. Most tools are not constructed with a nontechnical user in mind and lack an easy-to-use, easily understood interface. The implementation of such tools is also hindered by the unavailability of suitable data sets and inefficient methods for transferring technology to the end user. The proposed research addresses these issues and seeks to implement a web-based Winter Maintenance Decision Support System (WMDSS) that allows transportation personnel in local and state government public works departments to do the following: (a) access and visualize Iowa DOT GIS inventory data for their county or city in a web-based GIS environment; (b) view remote sensing data and extract up-to-date transportation infrastructure data; (c) use web-based GIS tools to manage, analyze, and edit infrastructure data, including both spatial editing (e.g., the addition of new road segments) and attribute editing (the adjustment of city- or county-based priorities assigned to road segments); and (d) readily use such data, edited to support local use, in the existing SRAMS.
2

2. GOAL AND OBJECTIVES
The major goal of the project was to implement a web-based WMDSS that enhances the capacity of stakeholders (city/county planners, resource managers, transportation personnel, citizens, and policy makers) to evaluate different procedures for managing snow removal assets optimally. This was accomplished by integrating geo-spatial analytical techniques (GIS and remote sensing), the existing SRAMS, and web-based spatial decision support systems.
To accomplish the above-stated goal, the project has three objectives:
1. Transportation infrastructure extraction from remotely sensed data 2. Development of web-based interactive GIS tools using ESRI’s Internet Map Server
(IMS) technology 3. Web-based SRAMS implementation and technology transfer
3
3. BACKGROUND AND LITERATURE REVIEW
3.1 Transportation Infrastructure Extraction from Remotely Sensed Data
Accurate and up-to-date information regarding road locations and conditions is essential for transportation infrastructure planning and management. This information is used for a variety of purposes, including traffic safety, construction projects, traffic engineering studies, and the evaluation of maintenance needs (Hallmark et al. 2001). Additionally, spatially accurate and up-to-date transportation networks are vital in ambulance and rescue dispatch emergency situations (Gardner et al. 2001). However, accurate and current road infrastructure databases are often outdated due to the dynamic nature of road networks, in which roads deteriorate or are improved and reconstructed (Fletcher and Kunda 1999). In other cases infrastructure databases may not even exist at all. This is particularly true for areas experiencing rapid road network expansion (Gardner et al. 2001).
Currently, one of the most common methods of gathering transportation infrastructure information is global positioning system (GPS) mapping (Gardner et al. 2001). This method, the primary method used by the U.S. Department of Transportation (USDOT), has been supported by the increasing availability of quality GPS technology, which can fairly accurately locate and store planar coordinates (usually latitude and longitude) for a particular point (Hallmark et al. 2001). However, GPS methods, along with other data collection methods that include manual methods, digitization of aerial photographs, and video- or photo-log vans, are all methods that require every road within a DOT’s jurisdiction to be field-visited to obtain accurate information. These methods are effective but inefficient, since significant amounts of time and resources are required to cover even a small amount of roadway (Gardner et al. 2001; Hallmark et al. 2001). This is problematic, since both state DOTs and local areas are responsible for significant street network systems. Iowa, for example, has a street system covering approximately 110,000 linear miles (Hallmark et al. 2001). Consequently, the USDOT is interested in identifying alternative technologies, such as remote sensing, that could be used along with current methods to meet road infrastructure informational needs more effectively (Gardner et al. 2001).
In line with these goals, this study explored the possibility of using hyperspectral remote sensing data to address the issues associated with current transportation infrastructure data collection methods (e.g., extensive field work, inefficient use of time, and traffic disruptions). In particular, hyperspectral remotely sensed data was chosen for this study because of the availability of high spectral and spatial resolution. This choice was supported by previous studies that conclude that hyperspectral data has the highest potential for mapping complex urban environments because manmade features are often too small for sensors with lower spatial resolutions to detect and manmade materials are too compositionally similar to each other for sensors with lower spectral resolutions to discern (Bhaskara and Datt 2000; NCRST 2002).
3.2 Snow Removal Asset Management System
To develop a WMDSS, a comprehensive review of literature was undertaken to understand existing research in the fields of spatial decision support systems (SDSS), GIS-based intelligent
4
systems (expert systems), resource allocation and network routing algorithms, and their adaptation to GIS-based systems, along with the applications of real-time weather data in GIS-based systems. The literature review was also conducted to study the applications of GIS for resource allocation and asset management; network routing, planning and route generation; applications of weather data in GIS-based decision support systems (DSS), SDSS (GIS-based), and web-based SDSS.
Salim and Timmerman (2001) described asset management. According to the authors, “Asset Management combines and integrates acquisition, evaluation, storage, and distribution of assets and resources required by an organization.” They also described artificial intelligence-based software techniques for optimizing resource allocation and asset management to improve productivity. The model uses an artificial intelligence-based shell that takes decisions in combination with various asset databases. Kane (2000) discussed why asset management is more critical than ever. Kane argued the need for urgency in efficient asset management under constantly changing technologies. He further emphasized the need for information systems in asset management, specifically in the context of federal highway asset management. In other research, Salim et al. (2002) discussed asset management in detail in the context of their SRAMS. Lemer (1998) discussed the integration of GIS and asset management in detail. Kindrachuk (2001) concludes that “a carefully designed and portioned asset database coupled with the effective use of GIS can significantly enhance the effectiveness of asset management.” Similar research was submitted by Stickel (2004). He proposed integrating transportation data with an asset management system, using GIS. Also, Hahne (2004) described the advantages of the integration of GIS and asset management systems by the Chelan Public Utilities Department.
The literature reviewed in the area of GIS-based routing showed that there are many advantages to developing systems that make use of GIS and intelligent software components (e.g., intelligent agents) for optimal routing. In their work, Shad et al. (2003) evaluated various route-finding methods for a GIS-based application. Batty and Jiang (1999) illustrated how software agents can be programmed to find network paths and the shortest routes—both ad hoc and in a structured way. Kray (2001), in his paper, “The benefits of multi-agent systems in spatial reasoning,” showed that a multi-agent–based system offers flexibility and extensibility for spatial reasoning problems. A similar approach can be adapted for developing GIS-based routing for large vehicles (Osegueda et al. 1999). The system called “GIS-based network routing procedures for overweight and oversized vehicles” describes the development of routing paths for large load carrying vehicles on a highway network. Zaman et al. (2002) implemented a Dijkstra-based shortest-path-routing algorithm for solving real world logistic vehicle routing problems. Thompson, Wang and Bishop (1999) described a GIS system integrated with an intelligent transportation system and stochastic programming for improved vehicle scheduling.
A substantial amount of research reviewed utilized weather information for GIS-based systems and other DSS. The literature included systems that use comprehensive weather information to provide decision support and systems that improve the functionality of current systems. An example of such research is presented by Mahoney and Myers (2003). They described a winter road MDSS. Their research focused mainly on using weather data to design a DSS for maintaining roads during winters. Similar work was presented by Pisano, Stern and Mahoney (2004). They demonstrated a winter maintenance DSS that uses complex winter weather prediction data plan snow removal operations. In another study, Mangold (2000) described the
5

costs of snowplowing and using road salt, as well as its importance for snow removal. Rasmussen et al. (2000) developed “weather support to de-icing decision making”: a winter now-casting system. The system uses commercial weather data in the form of Next Generation Radar (NEXRAD) WSR-88D and METAR surface weather reports from Automated Surface Observing System stations and observers.
A great amount of published literature is also available in the area of SDSS. The definition of SDSS could be found in much research. El-Najdawi and Stylianou (1993) define a basic DSS as “a set of computer-based tools used by managers to assist them in their decision making.” Keenan (1996) described SDSS as a subset of DSS. Malczewski (1996) gives a comprehensive definition of SDSS. Choi (2004) defines SDSS as a “DSS that can assess and present information geographically, or spatially, through the addition of geographic information systems (GIS).” Keenan (1996) discussed combining GIS and DSS to create SDSS. He argued that “there is evidence that GIS software is becoming increasingly suitable for use as a generator for SDSS.” Also, Muller (1993) identified SDSS as a growth area in the application of GIS technology. Various research also discusses intelligent DSS and its importance. Eklund et al. (1996) explain the SDSS and its importance. Intelligent SDSS include intelligence of some form (e.g., human knowledge) to provide decision support for spatial problems. El-Najdawi and Stylianou (1993) discussed the integration of expert systems with DSS to develop an intelligent spatial decision support system (ISDSS). Various alternative terms to ISDSS were also presented, including expert DSS, expert support system, and knowledge-based DSS. Bian et al. (2004) described an integrated GIS- and knowledge-based DSS in decision making. In order to design the system, they integrated expert knowledge and GIS models into decision making. In similar work, Eldrandaly et al. (2003) developed an SDSS using multi-criteria decision making.
Much recently published research describes web-based intelligent systems and their advantages over non-web–based decision support systems. The literature on web-based snow removal ISDSS is scant. However, there is a wide array of categories for which web-based ISDSS has been developed (e.g., web-based vehicle routing, spatial search, and so on). Both agent-based and knowledge-based architectures are presented and discussed. Most of the current research in the area of agent-based intelligent support systems deals with intelligent spatial search and information retrieval. Tsou (2002) described “developing a prototype framework for an agent-based information finding/filtering application by customizing ArcGIS and ArcIMS.” Aridor et al. (2000) described the development of a knowledge agent for the web. Shahiari and Tao (2002) in their paper, “GIS Applications using Agent Technology,” described special spatial search (SSS), which provided a web-based spatial search engine to search geospatial data. Choi (2004) discussed a web-based prototype SDSS for watershed management. Campos et al. (1996) described building an interface agent for ArcInfo. Bai et al. (2002), in their paper, “Spatial Search Engine–Enabling the Intelligent Geographic Information Retrieval,” presented a spatial search engine to retrieve geographic information from the internet. Other systems, such as web- and agent-based information retrieval systems with varying techniques, were researched and presented. Li et al. (2002) in their paper, “Multi-agent Systems for Web-Based Map Information Retrieval,” developed a web-based map information retrieval system that uses software agent techniques.
In summary, the review of the research literature above presents architectures for building DSS and emphasizes the importance of SDSS in solving real world problems. Various components of
6

SDSS have been discussed and their functionality explained. While some SDSS technologies presented possessed intelligence in the form of an embedded knowledge component (e.g., expert systems), other systems did not possess embedded intelligence. These SDSS technologies also differ in that some SDSS used a web-based interface for ubiquitous and easy access, while the others used a standalone PC-based interface. The advantages of the SDSS categories presented above can be combined to develop a web-based intelligent SDSS that offers ease-of-use and provides intelligent spatial decision support. Also, the literature review provides the benefits that GIS-based asset management and resource allocation offers. Further, GIS-based routing has proven to be efficient for transportation purposes. However, the literature review in the intelligent SDSS category shows the clear lack of an intelligent web-based DSS for snow removal. In the final analysis, a web-based intelligent SDSS system could offer more benefits than the SDSS technologies presented in the current research.
7
4. METHODOLOGY
The methodology used for all three objectives of this study is explained below.
4.1 Transportation Infrastructure Extraction from Remotely Sensed Data
This objective assessed the potential of using hyperspectral remote sensing data with the transportation infrastructure. Specifically, how are hyperspectral remote sensing data used to detect and extract transportation infrastructure features reliably? The individual objectives of the research included the following:
1. Reduce the dimensionality of the hyperspectral data and determine the optimal bands for transportation infrastructure feature extraction through statistical analysis
2. Classify transportation infrastructure features using various image processing techniques
3. Assess the accuracy of classification methods using standard statistical error evaluation methods to determine the method that performs best and the overall feasibility of using hyperspectral data as an alternative (or supplement) to current transportation infrastructure data collection methods
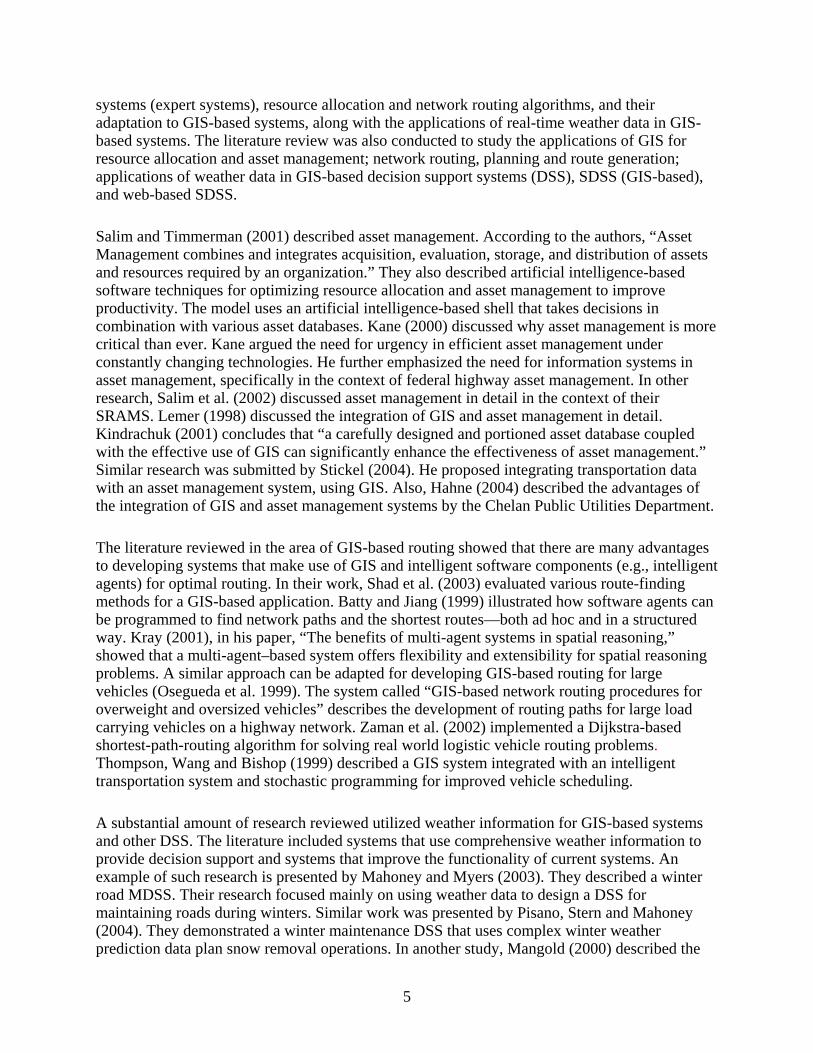
The data chosen for this study was hyperspectral imagery acquired in the spring of 1999 over Shelton, Nebraska (see Figure 1) by the High-Resolution Airborne Visible/Infrared Imaging Spectrometer (AVIRIS), available from the Jet Propulsion Laboratory at the California Institute of Technology. The Shelton, Nebraska site was chosen for this study for three reasons: (1) the data are free and the location represents one of the few areas in the Midwest in which data have been collected using a hyperspectral sensor with high spatial resolution, (2) imagery for this area is currently archived and readily available, and (3) a variety of road infrastructures are present in the image (e.g., urban streets, rural roads, highways, and unpaved roads). Along with the AVIRIS hyperspectral image, other data used in this study included GPS data collected during the spring of 2003 to map transportation features, such as roads and parking lots, as well as features and surfaces that could easily be confused with transportation features and surfaces (e.g., fence lines, a baseball field infield, and parking lots). These features were collected within the Universal Transverse Mercator Geographic Coordinate System using a Trimble ProXR GPS receiver. The ProXR receiver was used because it provides real-time differential GPS data, sub-meter accuracy, and the capabilities of the TerraSync software running on the Trimble GIS TSCe field device, which provides feature and attribute data input. Furthermore, differential correction was used to enhance the positional accuracy of the GPS data. This GPS information was used to help determine regions of interest. Lastly, a corresponding high-resolution digital orthophotographic quadrant (DOQ) with a one-meter spatial resolution was used as reference data for classification accuracy assessment. It is important to note that the DOQ imagery was acquired only two months prior to the AVIRIS data. Thus, there should have been little or no change in the study area’s transportation infrastructure during the short period of time between acquisition dates.
8
Initial image processing conducted in this research involved procedures that mosaicked, georegistered, and compensated for sensor detector and environmental attenuation error in the AVIRIS hyperspectral data. After mosaicking and georeferencing the image, this study utilized a minimum noise fraction (MNF) to reduce of the number of bands or spectral dimensions to be analyzed. The MNF transformation is a linear transformation related to principal components that orders the data according to signal-to-noise ratio (Green et al., 1998). The transformation can determine the inherent dimensionality of the data, segregate noise in the data, and reduce the computational requirements for subsequent processing (Green et al. 1998; Boardman and Kruse 1994). The MNF transformation can partition the data space into two parts: one associated with large eigenvalues and coherent eigenimages, and a second with near-unity eigenvalues and noise-dominated images.
Figure 1. Area used for the Hyperspectral data analysis
By using only the coherent portions in subsequent processing, the noise is separated from the data, thus improving spectral processing results. The higher numbered MNF bands contain a progressively lower signal-to-noise ratio (Kruse, Richardson, and Ambrosial 1997). Using this method, the 224 band image was reduced to 30 bands that contained the best signal-to-noise ratio and therefore the highest quality of information.
In addition to the MNF transformation, a classification and regression tree (CART) was also tested for its ability to select the best available bands from the hyperspectral dataset. The CART method, developed by Breiman, Jerome, Richard, and Charles (1984), is a popular decision tree
9
tool that automatically sifts large, complex databases, searching for and isolating significant patterns and relationships. In previous remote sensing studies, the CART method had been used to analyze reflectance data extracted from each band for rule-based land cover mapping (Sugumaran et al. 2003; Regional Earth Science Applications Center 2003). In this study, the CART method was used to reduce the previously MNF-transformed AVIRIS dataset even further, essentially reducing the high-quality, noise-free bands of the MNF dataset to just those containing the most information about transportation features. Determining a list of the best bands was an attempt to improve the current data reduction techniques, which are standard for hyperspectral data. To test these, the classification results generated using the CART process were compared to those generated using the entire MNF transformation subset.
Hsu and Tseng (1999) call attention to the fact that using traditional multispectral classification methods with hyperspectral data usually results in disappointing efficiency, a need for a large amount of training data, and difficult improvements to classification accuracy. As a result, this study utilized whole-pixel classification methods that have been approved for hyperspectral imagery, such as the Spectral Angle Mapper, as well as sub-pixel classification methods, such as Mixture Tuned Matched Filtering, which is capable of targeting multiple materials per pixel in hyperspectral data (Shippert 2003).
4.2 GIS Tools for Transportation Infrastructure Management
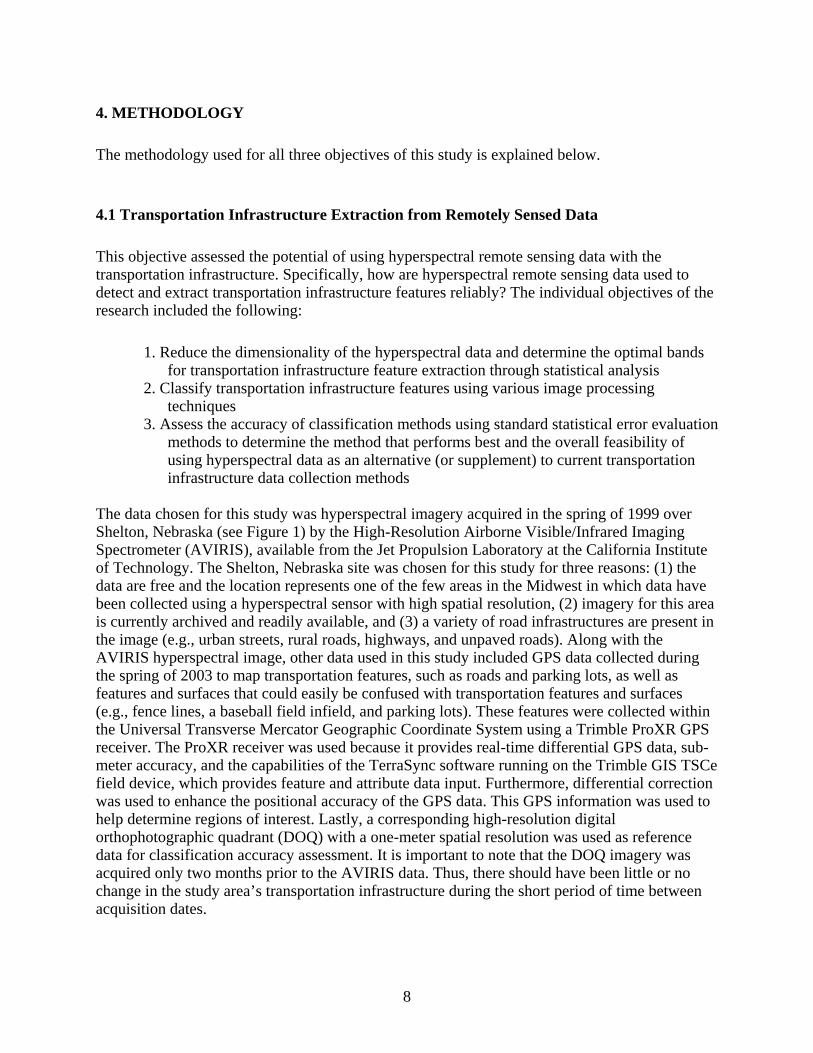
The development of web-based GIS tools for the management of a transportation infrastructure were developed using ArcIMS 4.0.1, ArcObjects, Arcviewshape.dll, ASP, VBScript and JavaScript. The GIS tools allow the users to create and update the transportation infrastructure on the web. The overall architecture used for this objective is given in Figure 2.
Figure 2. Architecture used for the GIS tool development
10
4.3 Web-based Snow Removal Planning System
WMDSS is implemented by integrating geospatial, analytical, and web-based techniques. The methods and techniques used in developing the current system are chosen to provide intelligent decision support through leveraging technologies like the internet, GIS, expert systems, and software engineering. The methodology for this research includes four steps: (1) data collection, (2) data analysis and modeling, (3) integration with a web interface, and (4) feedback and refinement.
The first step in developing the web-based intelligent SDSS is data collection. During data collection for this research, three categories of data were collected: (a) expert knowledge, (b) GIS-based (spatial) data, and (c) non-GIS-based (non-spatial) data. The aim of expert knowledge elicitation was to gather knowledge about various snow removal operations, such as resource allocation, routing, etc., from the officials responsible for handling snowplowing operations. For this research, officials from the street departments of the cities of Cedar Falls and Waterloo, IA, along with the Iowa DOT’s highway maintenance supervisor in Waterloo, IA, were consulted to obtain knowledge about snow removal in the area of Blackhawk County, IA. Through a series of direct interviews, a variety of information regarding the existing snow removal procedures was gathered. Obtaining knowledge from both city and Iowa DOT officials helped the researcher comprehend the differences in the standard operating procedures and the scale of operations. The knowledge gained through these interviews was encoded into a form suitable for building a knowledge base. WMDSS then references the intelligence stored in a knowledge repository and makes conscious decisions. Therefore, expert knowledge is crucial for providing intelligent decision support for various purposes, such as routing, resource allocation, inventory analysis, and so on.
The GIS-based data required for the current project was the county-wide road and street dataset for Blackhawk County, IA. This data is available from the Iowa DOT’s maps website (DOT 2005). The dataset essentially contains the centerlines for public roads, including interstates, U.S. and state highways, county roads, city streets, park roads, and institutional roads. The Iowa DOT’s Geographic Information Management System was used to digitize the road maps and is updated through construction and maintenance updates. The road data is available in the form of shapefiles, a GIS-based storage format. The non-spatial data contains data that is not spatially relevant. There are two kinds of non-spatial information: asset data and weather data. Asset data is the data of various snow removal resources, such as vehicles, drivers, and personnel. Weather data for this research was obtained using the Rich Simple Syndication or Really Simple Syndication (RSS) feeds technology. RSS is an Extensible Markup Language (XML)-based document format for syndicating news and other timely news-like information (NOAA 2003). Free weather feeds are available from such online sources as www.rssweather.com, www.weatherroom.com, www.weather.gov, etc. Live as well as forecast weather data can thus be obtained and presented to the user via a particular weather feed webpage. Important weather factors that were considered in this research were air temperature, dew point, visibility, wind speeds, precipitation type, and precipitation amounts.
The data gathered through data collection procedures was analyzed and modeled to develop the core components for the system. The core components developed though data analysis and
11

modeling were the intelligent component (expert system and knowledge base) and analytical tools (spatial and non-spatial tools). For the current research, the intelligent software component developed is an expert system. This expert system provides decision support using knowledge gathered from the snow removal experts and real-time weather data. The functionality provided by the expert system includes providing advised decision making for generating shortest paths and prioritized routes, allocating resources optimally for snow plowing purposes, and generating suggestions based on real-time weather data. The knowledge gathered was entirely conditions-based, in the form of a set of actions resulting from a set of conditions. This sort of knowledge can best be represented by “if-then” structures. Therefore, the knowledge is coded as a set of rules for each of the three categories stated above, using Rule Machine’s Visual Rule Studio software suite. The knowledge, in the form of rules, is stored in a centralized location called the knowledge base. The knowledge base serves as the input for the inference engine, which consumes the knowledge and infers decisions based on input criteria.
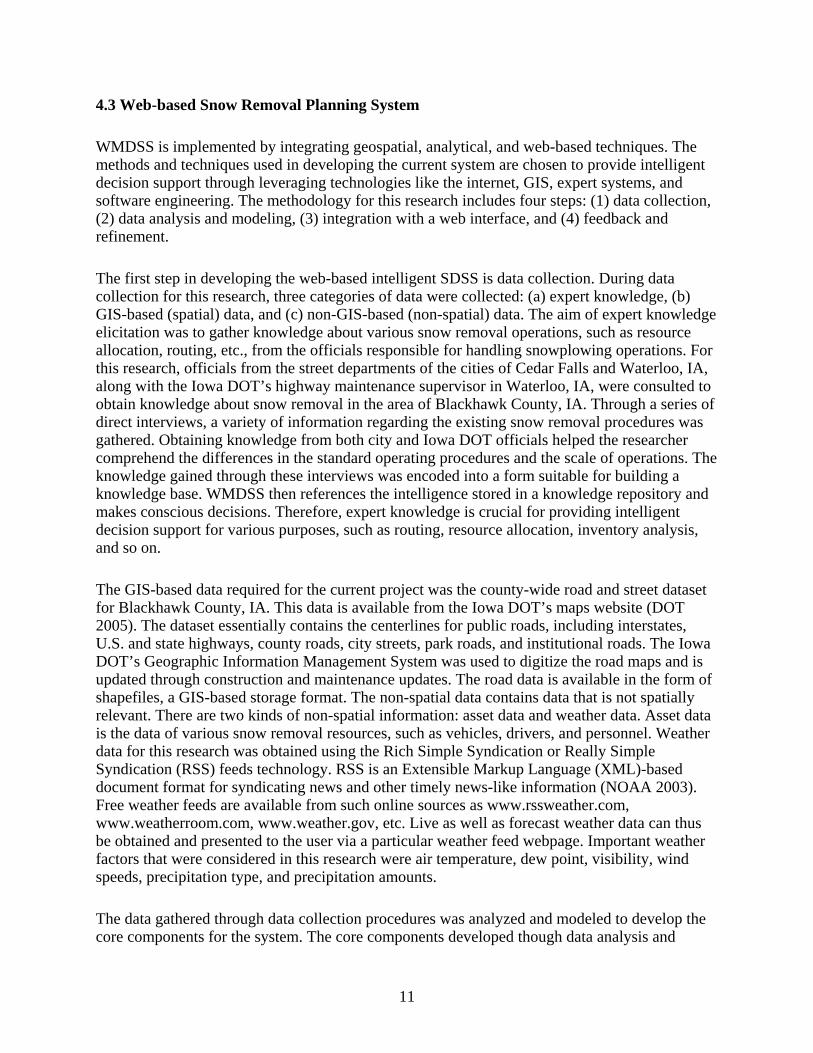
There are two types of analytical tools available for this project: the spatial analytical tools and non-spatial analytical tools. The spatial analytical tools provide functions related to spatial (GIS-based) data, such as routing tools, map navigations tools, etc. The tools for routing provide route creation, deletion, saving, and loading to/from the disk. To supplement the routing tools, the map navigation tools help move the map around by providing functionality, like zooming, panning, and identifying. These tools are helpful during general navigation as well as route creation. The non-spatial analytical tools provide functionality independent from spatial data. Non-spatial tools for the current project were resource management tools to manage and allocate resources like vehicles, drivers, and material. The weather tools read real-time weather information and provide live as well as forecast weather information within the application. The analytical tools are coded as Microsoft Active Server Pages scripts. These scripts are hosted on a Microsoft Internet Information Server running Windows XP Professional (see figure 3).
The intelligent component and the analytical tools are integrated into a single interface that can be accessed through the internet. In this research, a website was therefore designed for publishing the road (street) map of Blackhawk County, IA using the ESRI ArcIMS ActiveX Connector. Routing was provided using the ArcIMS RouteServer Extension. This website, in effect, will serve both as a user interface and as a way to publish the resultant maps and display the results. Various routes were color-coded according to priority (e.g., A, B, C, D or 1, 2, 3, 4) to effectively present the route information visually for better understanding. The GIS-based website was designed to contain the GIS-based road information of Blackhawk County in the form of shapefiles. Upon obtaining the road map of Blackhawk County, IA, the map was converted into a form (ESRI .AXL file) suitable to be published on the web. The website also provides a way to perform various functions, such as route creation, assigning material to each route, and so on. From within the website, live and forecast weather data can be read and various scenario-based analyses can be performed. There is also a provision to manage various resources, such as material, drivers, and vehicles.
Once a prototype of the system was made, the system was demonstrated to the Iowa DOT and county and city officials from local street departments. Feedback was sought for improving and refining the system. The system was tested to determine whether it met the required performance and requirement specifications, along with the user interface concerns. Once feedback was
12
obtained, the system was further improved and then implemented. This process continued until the system met all of its design goals.
Figure 3. The overall architecture of WMDSS
13
5. RESULTS AND DISCUSSION
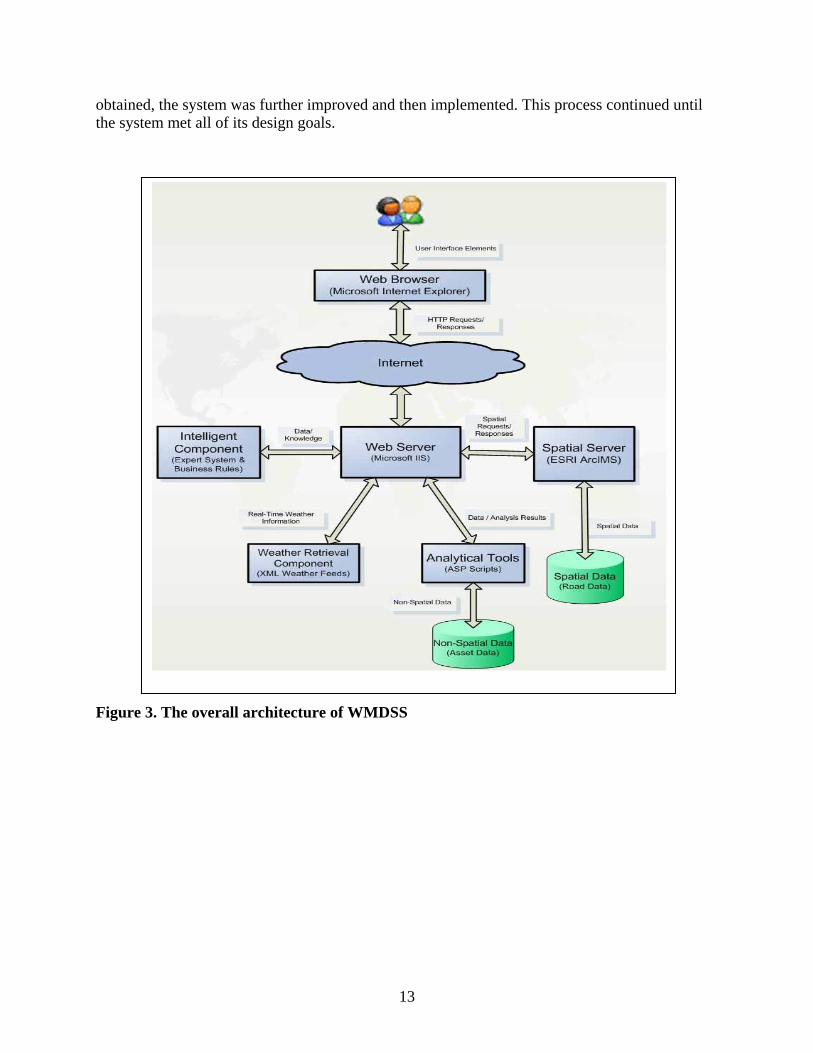
Three classification methods were tested in this study: (1) the Spectral Angle Mapper (SAM), (2) mixture-tuned matched filtering (MTMF), and (3) mixture-tuned matched filtering combined with classification and regression tree (MTMF-CART) selected bands. Figure 4 shows the classified outputs from the MTMF, SAM, and MTMF-CART. The overall accuracies for the three classifications were 88.92%, 81.89%, and 84.32%, respectively (Table 1). The overall measures of accuracy provided by the kappa statistic were 87.61%, 79.87%, and 82.46%, respectively (Table 1).
Figure 4. Classified outputs from the MTMF, SAM, and MTMF-CART
In terms of reliability, the best overall accuracy and highest kappa coefficient value was produced by the MTMF classification, while the SAM classifier resulted in the lowest overall accuracy and kappa. The primary reason why the SAM method performed poorer than the MTMF and MTMF-CART methods was because of its greater difficultly distinguishing the gravel roads class from the background class. In this case, the SAM classifier overrepresented the gravel roads class compared to the other two classifiers by incorrectly identifying a number of areas in the image as gravel roads that may have been gravel but technically were not roads (e.g., gravel driveways and parking lots). Thus, though the SAM classifier’s pixels may correctly identify gravel material, they do not correctly identify gravel roads. As a result, these pixels were recorded as incorrect in the accuracy assessment. Nevertheless, it should be pointed out that the SAM classifier was the quickest and easiest method to perform, making it an excellent candidate for creating initial classification images.
Further examination of the error matrices demonstrates that, in terms of producer’s accuracy, the concrete, gravel, railroad, track, and, to a lesser degree, brick classes were consistently classified well in all three classification methods. Quarry material was also classified well, with the
14
exception of the SAM classification. On the other hand, none of the three classification methods consistently underperformed.
In terms of user accuracy, only brick and quarry performed exceptionally well in all three classification methods. As a drawback, city streets and concrete both performed consistently poorly in terms of user accuracy. However, it should be noted that, as in the SAM results for the gravel class described above, the majority of error in user accuracy for the concrete and city street classes was caused by confusing these classes with the background class. In other words, pixels were classified as either concrete or city street when in fact they should have been classified as background. Interestingly, these errors were only partial errors. In nearly all cases, these errors were the result of a concrete driveway being classified as concrete street or a parking lot made from the same material as the city streets being classified as a city street. Since driveways and parking lots are technically not streets, the only option was to record them as misclassifications in the accuracy assessment. This error indicates a limitation of remote sensing in general. While it may allow for materials to be identified, there is still no way to determine the use of that material. This limitation proved to be particularly significant in this study.
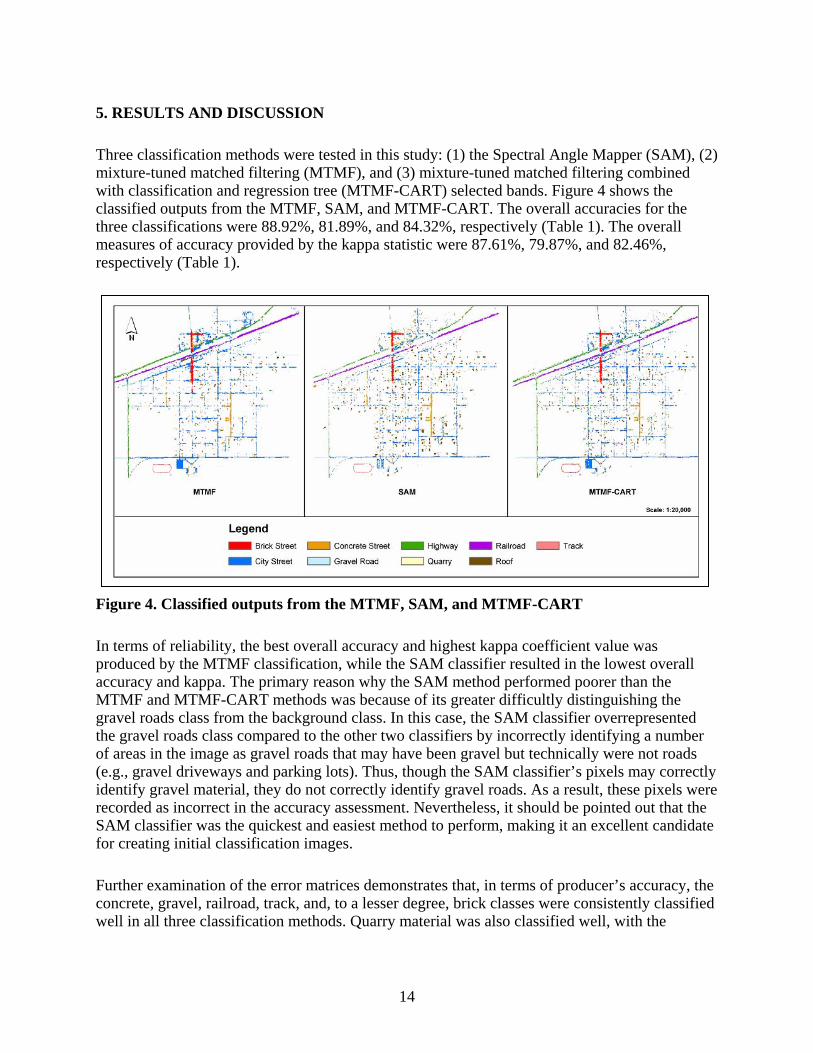
Table 1. Accuracy assessment
SAM MTMF MTMF-CART
Land-cover Producer’s User’s
Accuracy KappaStatistics
Producer’s User’s Accuracy
KappaStatistics
Producer’s User’s Accuracy Accuracy Accuracy Class
Accuracy Kappa Statistics
Other --- --- --- --- --- --- --- --- ---
City Street 92.86% 61.90% 0.5703 100.00% 71.43% 0.6797 78.72% 60.66% 0.5493
Quarry 82.76% 97.96% 0.9758 100.00% 100.00% 1.0000 100.00% 100.00% 1.0000
Gravel Road 100.00% 63.83% 0.6064 100.00% 100.00% 1.0000 100.00% 100.00% 1.0000
Hwy 97.73% 97.73% 0.9742 88.89% 100.00% 1.0000 87.50% 84.00% 0.8161
Railroad 100.00% 91.67% 0.9085 96.88% 86.11% 0.8480 97.06% 86.84% 0.8551
Concrete Road 100.00% 54.29% 0.5181 100.00% 55.26% 0.5257 100.00% 60.00% 0.5759
Roof 90.91% 88.24% 0.8708 93.62% 93.62% 0.9269 88.57% 86.11% 0.8466
Brick Road 96.88% 96.88% 0.9658 96.88% 100.00% 1.0000 93.75% 100.00% 1.0000
Track 100.00% 100.00% 1.0000 100.00% 100.00% 1.0000 100.00% 93.33% 0.9279
Overall Accuracy 81.89% Overall Kappa 79.87%
Overall Accuracy 88.92% Overall Kappa 87.61%
Overall Accuracy 84.32% Overall Kappa 82.46%
Other possible explanations for the poor results of the city streets class for the SAM classifier can be attributed to spectral mixing that is likely occurring in image pixels representing city streets. This spectral mixing is caused by overhanging trees, cars parked on the street, and the street’s proximity to similar materials, such as concrete driveways and rooftops. This might explain why the MTMF-based methods, which can detect and extract specific materials even in mixed pixels, resulted in their better performance compared to the SAM method. This issue then
15
raises the question of why the overall accuracy of the MTMF-CART method was only slightly greater than that of the SAM classifier, despite the fact that MTMF-CART is based on the MTMF method. The likely reason the MTMF-CART classification method performed worse than expected is two-fold. First, the CART method used to reduce the data dimensionality and select the best bands for transportation feature extraction is heavily dependent of the size of training sets. In other words, the CART method required a larger number of training information to make the CART process more accurate. However, this requirement contradicts the MTMF classifier and hyperspectral remote sensing in general, where a smaller number of spectrally pure pixels are preferred to larger training sets that likely contain impure or errant pixels. This idea is reiterated by the work of Shrestha et al. (2002), who point out that endmember selection is critically important for hyperspectral classification, since choosing a wrong member can make a significant difference in classification results. In the case of this study, the larger regions of interest most likely resulted in inaccurate endmember collection and classification. A second possibility explaining the underperformance of the CART method is that, by attempting to choose only the best bands, the CART process simply reduced the data dimensionality too much. In other words, it is possible that the CART method may have eliminated bands that contained useful information about transportation features.
5.1. GIS Tools for Transportation Infrastructure Management
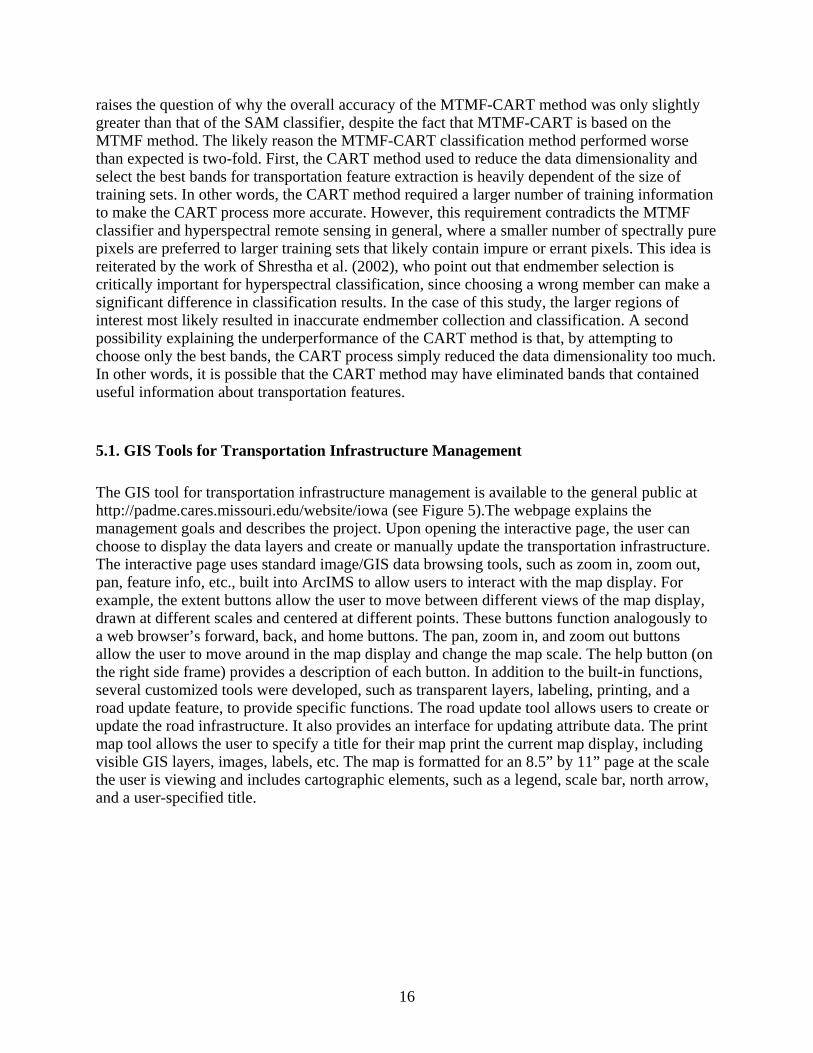
The GIS tool for transportation infrastructure management is available to the general public at http://padme.cares.missouri.edu/website/iowa (see Figure 5).The webpage explains the management goals and describes the project. Upon opening the interactive page, the user can choose to display the data layers and create or manually update the transportation infrastructure. The interactive page uses standard image/GIS data browsing tools, such as zoom in, zoom out, pan, feature info, etc., built into ArcIMS to allow users to interact with the map display. For example, the extent buttons allow the user to move between different views of the map display, drawn at different scales and centered at different points. These buttons function analogously to a web browser’s forward, back, and home buttons. The pan, zoom in, and zoom out buttons allow the user to move around in the map display and change the map scale. The help button (on the right side frame) provides a description of each button. In addition to the built-in functions, several customized tools were developed, such as transparent layers, labeling, printing, and a road update feature, to provide specific functions. The road update tool allows users to create or update the road infrastructure. It also provides an interface for updating attribute data. The print map tool allows the user to specify a title for their map print the current map display, including visible GIS layers, images, labels, etc. The map is formatted for an 8.5” by 11” page at the scale the user is viewing and includes cartographic elements, such as a legend, scale bar, north arrow, and a user-specified title.
16
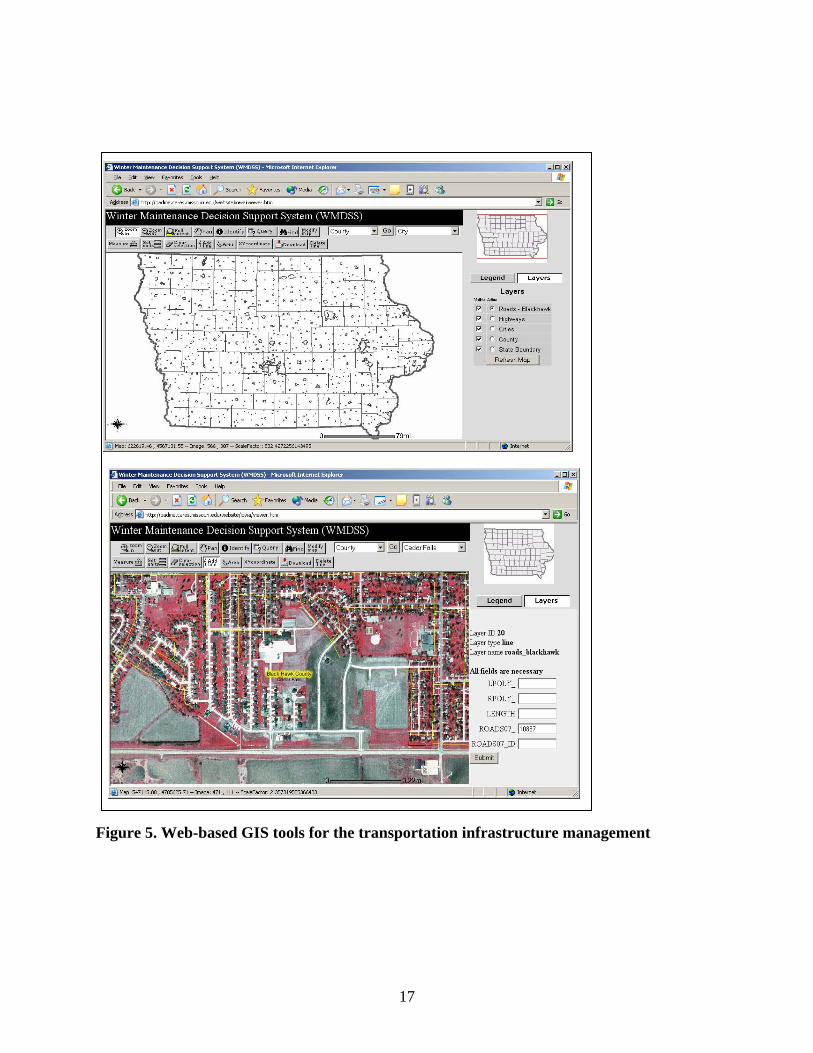
Figure 5. Web-based GIS tools for the transportation infrastructure management
17
5.2. WMDSS
This section presents and discusses the results of the development of WMDSS. Various screenshots, including a detailed description of WMDSS, are also provided in this section. One of the main objectives of WMDSS is to provide an easy-to-use interface that can be operated by a nontechnical user. With this objective in mind, the system provides an uncluttered interface, divided neatly into various areas. For example the menu and the tool bar appear on top, the map and map layers area is beneath the menu, and a message area displays detailed messages to the users. The interface is mainly menu driven, making it very easy to use. All the menu options are given appropriate, nontechnical names so that a novice computer user can use the system. Figure 6 shows the main interface of WISPRO and its organization into various areas.
Menu Bar
Buttons & Toolbar
Map Area
Message Area
Map Layers
Figure 6. The main interface window of WMDSS with various marked areas
The system generates detailed alerts, warnings, tips, and other messages that help nontechnical users better understand the system. Most of the commonly used menu options are provided as tools on a separate tool bar and can be used by clicking on the appropriate icon. When the user clicks on particular tool, a message is displayed in the message area of the window. A detailed help system is available, which avoids technical jargon and provides the user a quick and easy guide for using the system.
18
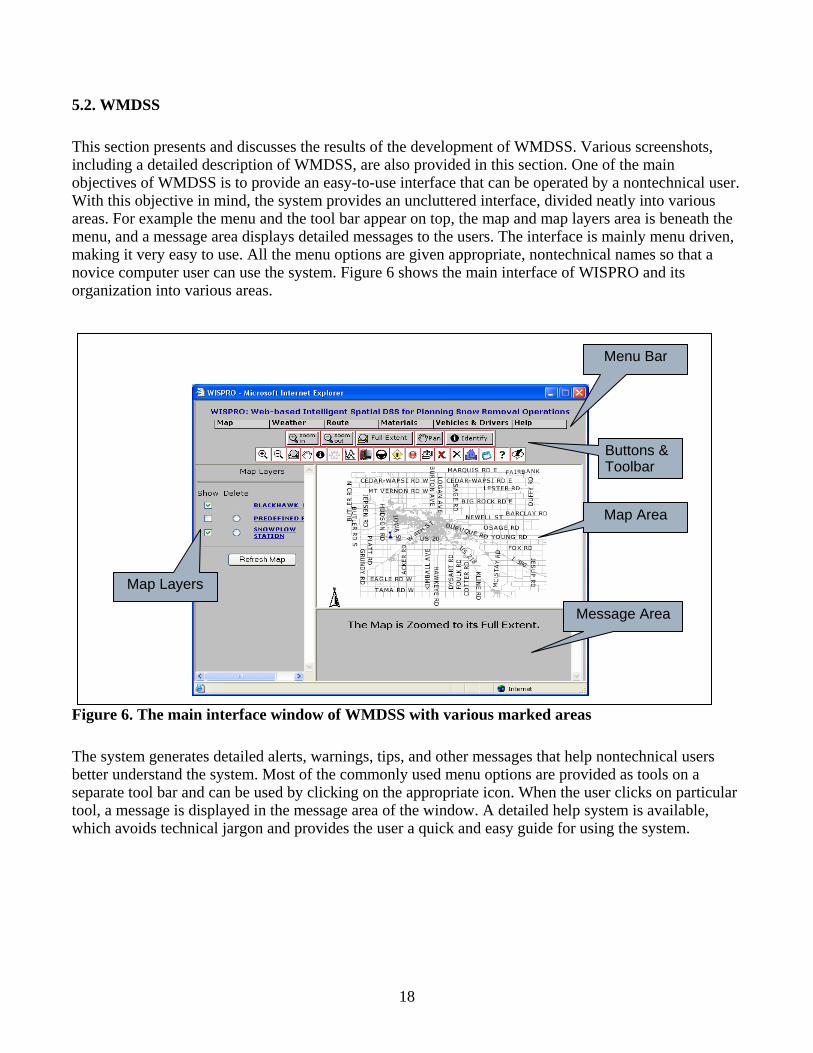
5.2.1. Workflow of WMDSS
The WMDSS can be used to manage and assign various resources related to snow removal. The logical sequence of actions that must be followed is depicted in Figure 7. A stepwise explanation of each action is explained below.
Figure 7. System workflow diagram of WMDSS
Start
Set Weather Conditions
Routes
Assign Drivers to the Vehicles
View Results Summary
End
Create Routes
Assign Vehicles to the
Routes
Assign Materials to the Routes
Override Assignments
Perform Inventory Analysis
5.2.1.1. Setting Weather Conditions
The weather menu lets users set and view real-time weather information. User can choose to view live or forecasted weather information along with stored weather conditions. Various weather parameters are provided for live weather data, including air temperature, wind speeds, wind direction, wind-chill, and visibility. Live and forecasted weather data can be obtained and presented to users from a particular weather feed webpage. The current weather conditions help generate suggestions for material assignment and help determine the allocation of resources. The forecast data is used to generate alerts. The weather information can also be used for generating scenario-based solutions. Weather conditions can be set either manually, by entering a set of parameters, or automatically, by obtaining them from the web. The weather menu also provides an option for viewing the NOAA NEXRAD image for the state of Iowa. The weather menu is depicted in Figure 8.
19
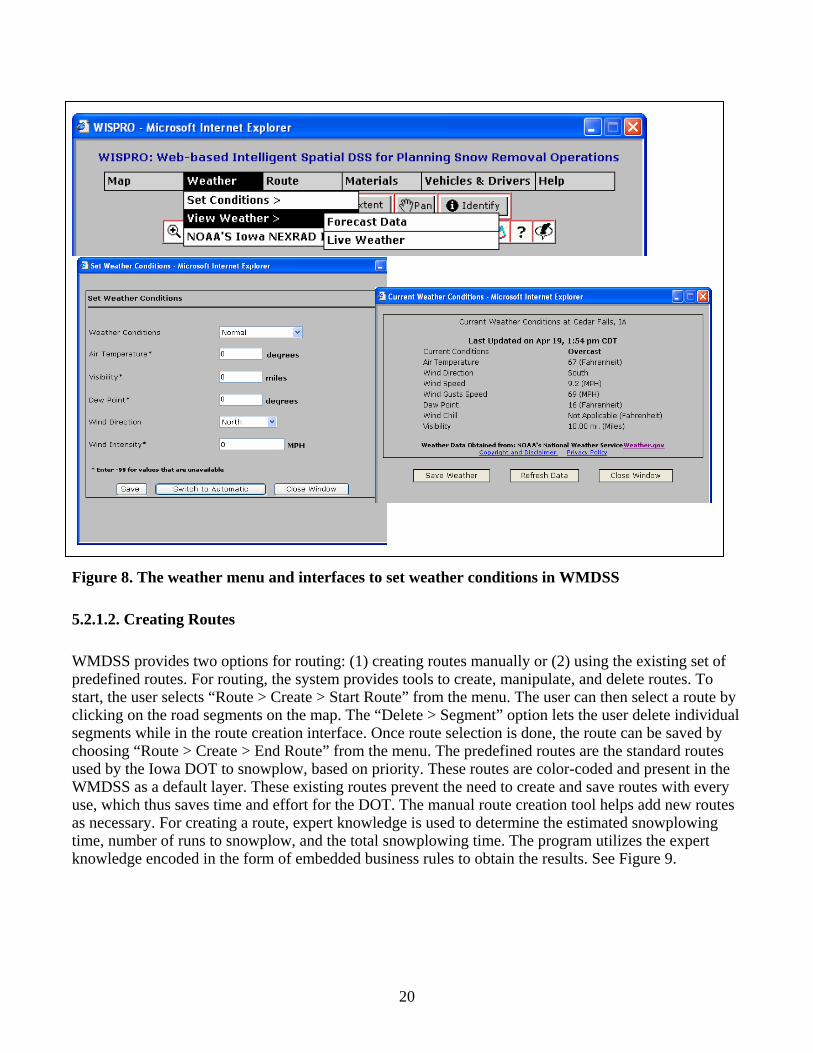
Figure 8. The weather menu and interfaces to set weather conditions in WMDSS
5.2.1.2. Creating Routes
WMDSS provides two options for routing: (1) creating routes manually or (2) using the existing set of predefined routes. For routing, the system provides tools to create, manipulate, and delete routes. To start, the user selects “Route > Create > Start Route” from the menu. The user can then select a route by clicking on the road segments on the map. The “Delete > Segment” option lets the user delete individual segments while in the route creation interface. Once route selection is done, the route can be saved by choosing “Route > Create > End Route” from the menu. The predefined routes are the standard routes used by the Iowa DOT to snowplow, based on priority. These routes are color-coded and present in the WMDSS as a default layer. These existing routes prevent the need to create and save routes with every use, which thus saves time and effort for the DOT. The manual route creation tool helps add new routes as necessary. For creating a route, expert knowledge is used to determine the estimated snowplowing time, number of runs to snowplow, and the total snowplowing time. The program utilizes the expert knowledge encoded in the form of embedded business rules to obtain the results. See Figure 9.
20
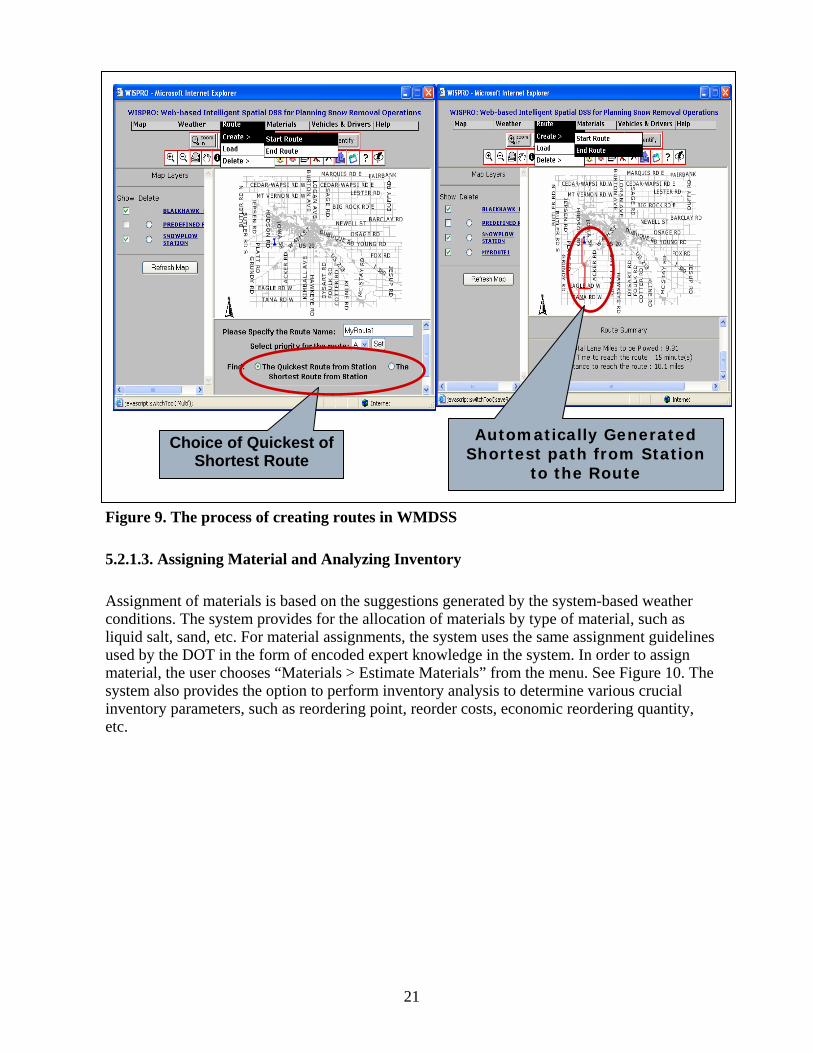
Figure 9. The process of creating routes in WMDSS
Choice of Quickest of Shortest Route
Automatically Generated Shortest path from Station
to the Route
5.2.1.3. Assigning Material and Analyzing Inventory
Assignment of materials is based on the suggestions generated by the system-based weather conditions. The system provides for the allocation of materials by type of material, such as liquid salt, sand, etc. For material assignments, the system uses the same assignment guidelines used by the DOT in the form of encoded expert knowledge in the system. In order to assign material, the user chooses “Materials > Estimate Materials” from the menu. See Figure 10. The system also provides the option to perform inventory analysis to determine various crucial inventory parameters, such as reordering point, reorder costs, economic reordering quantity, etc.
21
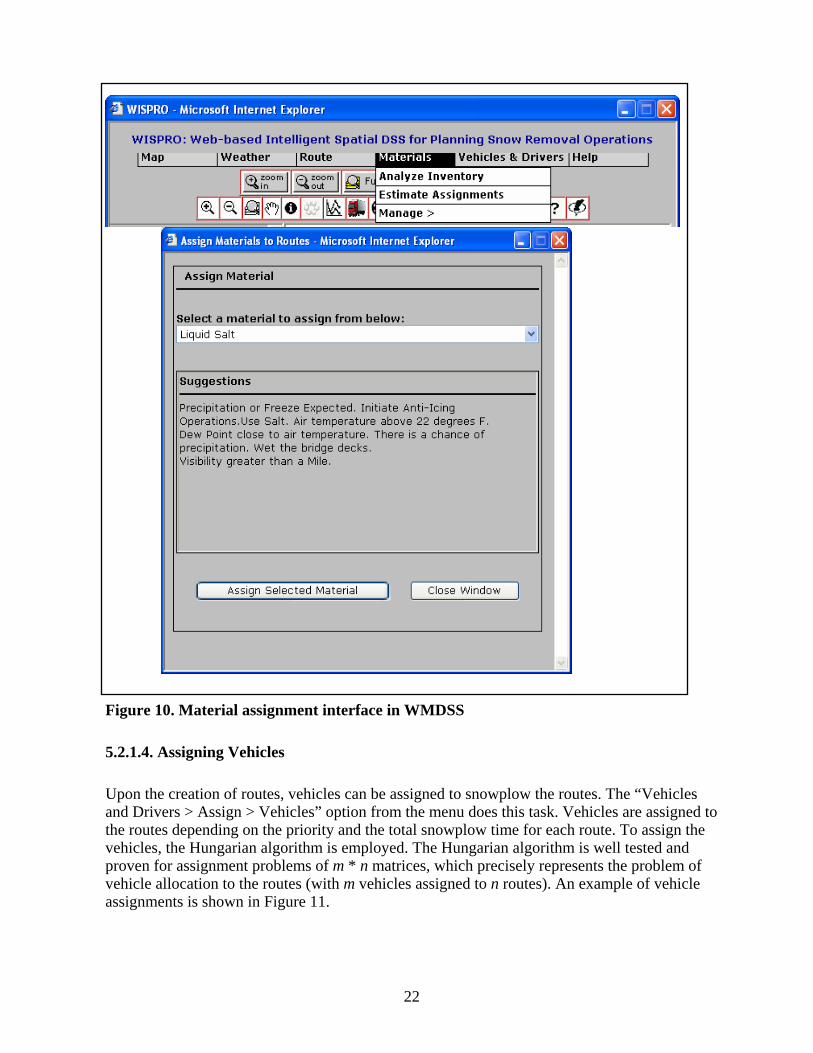
Figure 10. Material assignment interface in WMDSS
5.2.1.4. Assigning Vehicles
Upon the creation of routes, vehicles can be assigned to snowplow the routes. The “Vehicles and Drivers > Assign > Vehicles” option from the menu does this task. Vehicles are assigned to the routes depending on the priority and the total snowplow time for each route. To assign the vehicles, the Hungarian algorithm is employed. The Hungarian algorithm is well tested and proven for assignment problems of m * n matrices, which precisely represents the problem of vehicle allocation to the routes (with m vehicles assigned to n routes). An example of vehicle assignments is shown in Figure 11.
22
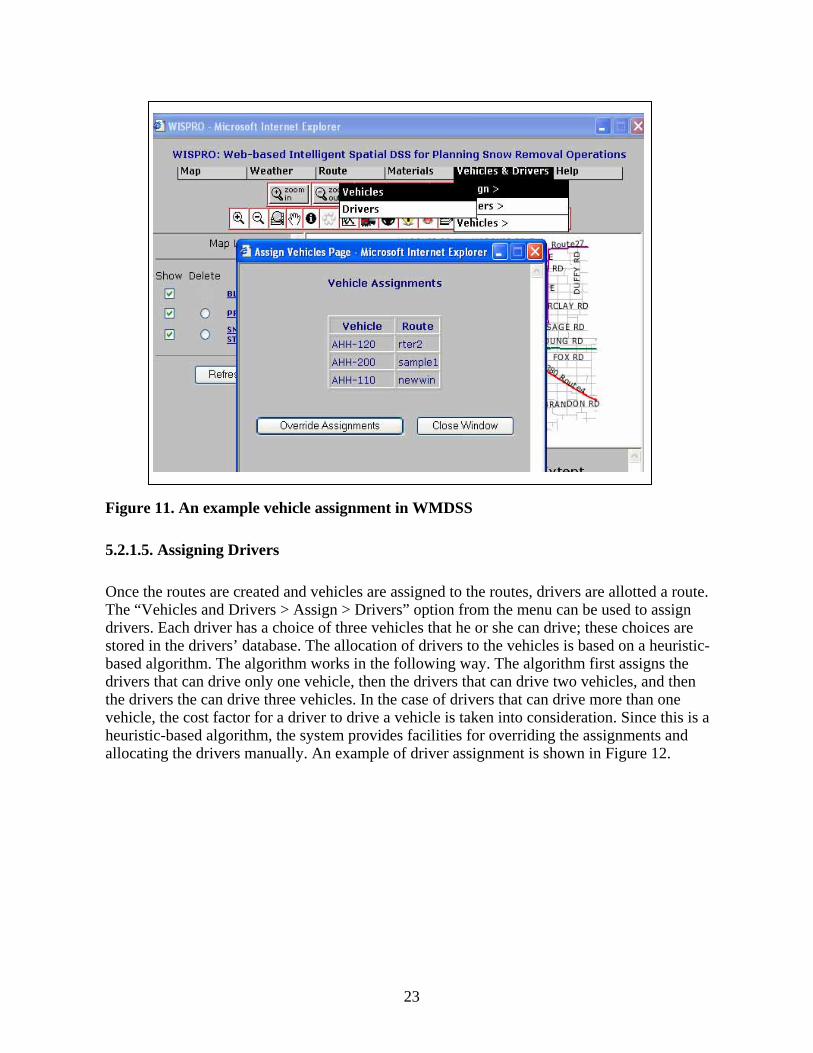
Figure 11. An example vehicle assignment in WMDSS
5.2.1.5. Assigning Drivers
Once the routes are created and vehicles are assigned to the routes, drivers are allotted a route. The “Vehicles and Drivers > Assign > Drivers” option from the menu can be used to assign drivers. Each driver has a choice of three vehicles that he or she can drive; these choices are stored in the drivers’ database. The allocation of drivers to the vehicles is based on a heuristic-based algorithm. The algorithm works in the following way. The algorithm first assigns the drivers that can drive only one vehicle, then the drivers that can drive two vehicles, and then the drivers the can drive three vehicles. In the case of drivers that can drive more than one vehicle, the cost factor for a driver to drive a vehicle is taken into consideration. Since this is a heuristic-based algorithm, the system provides facilities for overriding the assignments and allocating the drivers manually. An example of driver assignment is shown in Figure 12.
23
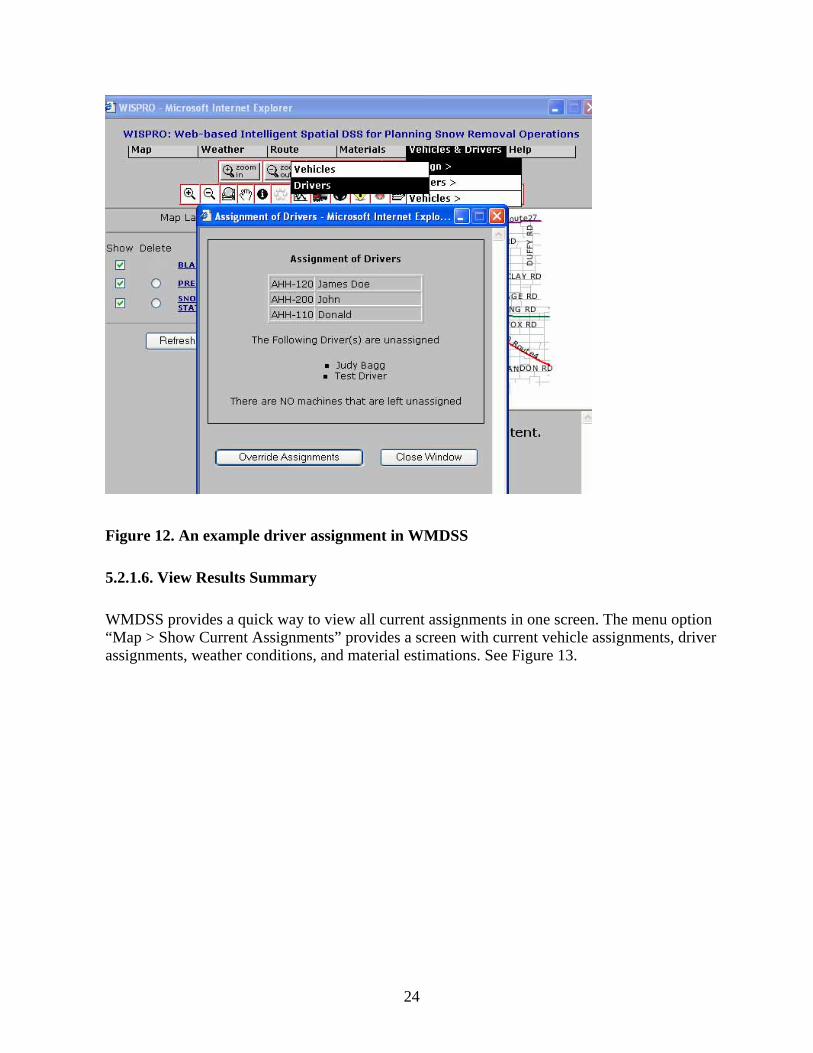
Figure 12. An example driver assignment in WMDSS
5.2.1.6. View Results Summary
WMDSS provides a quick way to view all current assignments in one screen. The menu option “Map > Show Current Assignments” provides a screen with current vehicle assignments, driver assignments, weather conditions, and material estimations. See Figure 13.
24
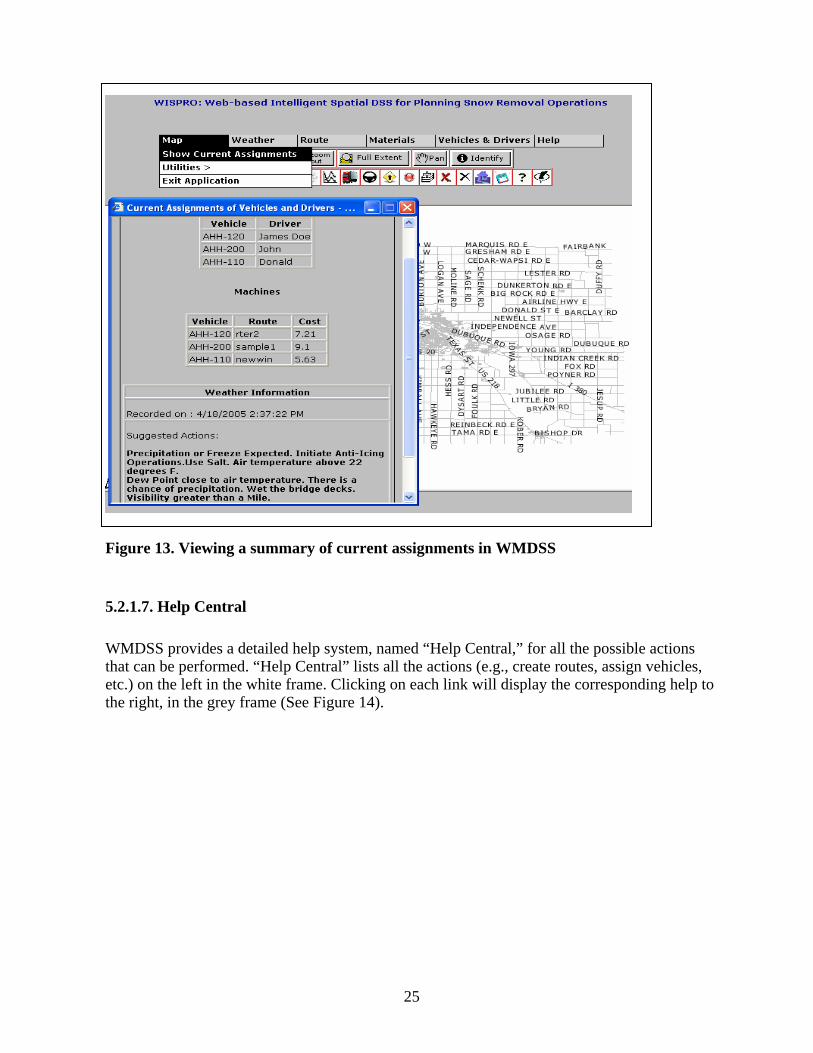
Figure 13. Viewing a summary of current assignments in WMDSS
5.2.1.7. Help Central
WMDSS provides a detailed help system, named “Help Central,” for all the possible actions that can be performed. “Help Central” lists all the actions (e.g., create routes, assign vehicles, etc.) on the left in the white frame. Clicking on each link will display the corresponding help to the right, in the grey frame (See Figure 14).
25
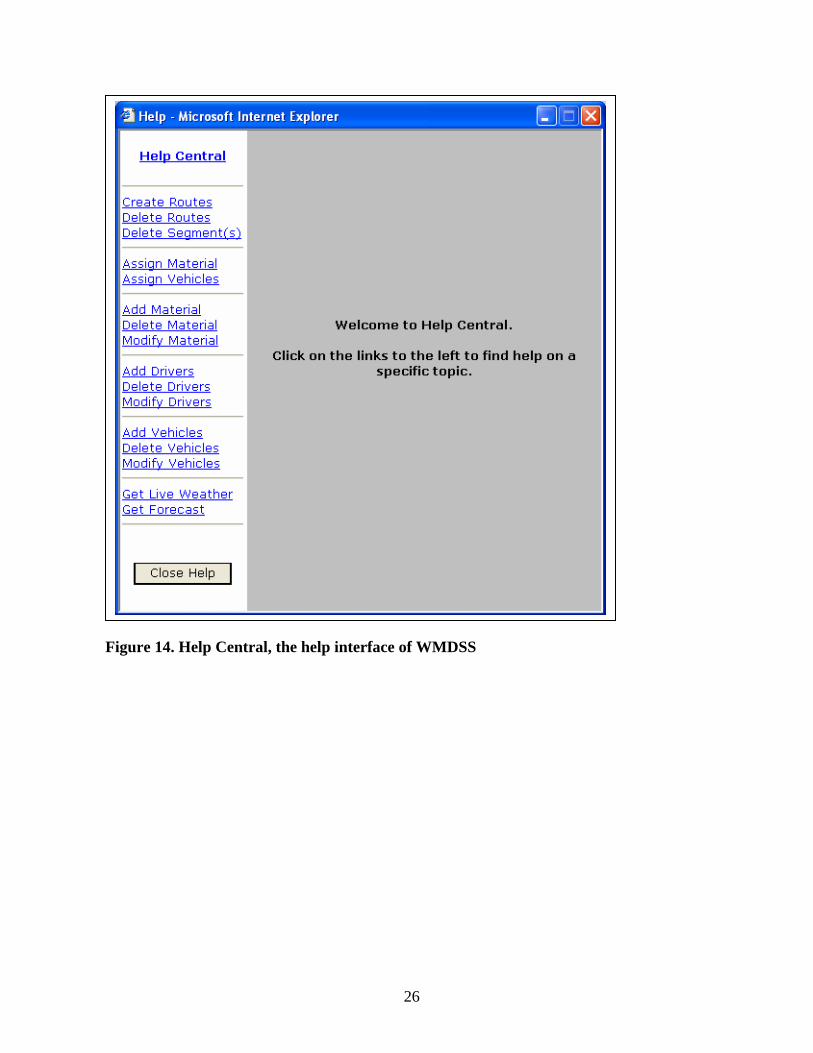
Figure 14. Help Central, the help interface of WMDSS
26
6. TECHNOLOGY TRANSFER
Transferring the technology from this project to the end user was accomplished in different ways. Results from this project were widely published in refereed journals and conference proceedings and presented in workshops and conferences. Refer to the detailed publication list below. A detailed tutorial has also been made available on the website. In addition, a hands-on workshop showcasing WMDSS for the end users was also given. This project also produced two master theses. The project team will continue to promote technology transfer through the distribution of user manuals, meetings with the end users, and other winter maintenance personnel, as well as the development of an educational interactive website.
Publications from this project
1. Sugumaran, R., S. Ilavajhala, and V. Sugumaran. 2005. Designing and implementing the Web-based Intelligent Spatial Decision Support System for planning snow removal operations (WISPRO). The Journal of the Transportation Research Forum. (Under preparation).
2. Gerjevic, J. and R. Sugumaran. 2005. Extraction of Transportation Infrastructure
from Hyper-spectral Remote Sensing Data. Canadian Journal of Remote Sensing. (Under preparation).
3. Sugumaran, R., S. Ilavajhala, V. Sugumaran. 2005. Developing a Web-based Spatial
Decision Support System using Expert System and GIS for Planning Snow Removal Operations, Emerging Spatial Information Systems and Applications. Idea Group Publishing, Information Science Publishing, IRM Press, CyberTech Publishing and Idea Group Reference (proposal accepted).
4. Ilavajhala, S., R. Sugumaran, A. Villavicencio, and M.D. Salim. 2005. A Web-based
Intelligent GIS for Efficient Planning and Management of Snowplowing Operations. AAG Annual Meeting, April 5-9, Denver, CO.
5. Sugumaran, R., S. Ilavajhala, and V. Sugumaran. 2005. Experiences with
Implementing a Spatial Decision Support System for Planning Snow Removal Operations, Proceedings of Americas Conference on Information Systems. Omaha, Nebraska, August 11- 14 (Peer Reviewed).
6. Sugumaran, R., V. Sugumaran, M.D. Salim, and A. Villavicencio. 2004, An Agent-
Based Spatial Decision Support System for Snow Removal Asset Management: A Web-Based Approach. Proceedings of Americas Conference on Information Systems. Tampa, Florida, August 5 – 8 (Peer Reviewed).
7. Salim, M.D., R. Sugumaran, and A. Villavicencio. 2004. An Intelligent Asset
27
Management System for Construction and Maintenance Projects. Proceedings on ICAIET 2004 Second International Conference on Artificial Intelligence in Engineering and Technology. August 3-5, Sabah, Malaysia, CD-ROM Publication, (Peer Reviewed).
8. Gerjevic, J. and R. Sugumaran. 2004. Extraction of Transportation Infrastructure
from Hyper-spectral Remote Sensing Data. Proceedings of ASPRS 2004 Annual Conference. Denver, Colorado, May 23 - 27, CD-ROM publication.
9. Sugumaran, R., and M. Pavuluri, 2004. Development of Web-Based GIS Tools for
the Management of Transportation Infrastructure. GIS-T 2004: Geo-spatial Information Systems for Transportation Symposium. March 28 - 31, Rapid City, South Dakota.
. 10. Sugumaran, V., R. Sugumaran. 2003. Spatial Decision Support Systems Using
Intelligent Agents and GIS Web Services. Proceedings of Americas Conference on Information Systems. Tampa, Florida, August 4 – 6: 2481–2486, (Peer Reviewed).
28

7. CONCLUSION AND FUTURE DIRECTIONS
As mentioned earlier, a major goal of the project was to implement a web-based WMDSS that enhances the capacity of stakeholders (city/county planners, resource managers, transportation personnel, citizens, and policy makers) to evaluate different procedures to manage snow removal assets optimally. This was accomplished by integrating geospatial analytical techniques (GIS and remote sensing), the existing SRAMS, and SDSS. Remote sensing data, particularly hyperspectral data, was used to extract up-to-date road infrastructures. The road feature extraction from remote sensing data was considered to be successful, but there is still room for improvement. Of several classifier used, the MTMF classifier outperformed both the SAM and MTMF-CART methods. In particular, the MTMF produced higher accuracies in the city street and roof classes, which made most of the difference. Overall, all three classification methods were able to identify the classes of quarry, highway, brick road, railroad, roof top, and fitness track with a relatively high degree of success. In contrast, the city street and concrete street classes consistently recorded low accuracies. Future directions include using object-oriented classification and integration of the extracted features into the GIS database.
The web-based WMDSS overcomes the disadvantages of the existing systems by providing intelligent decision support for effectively planning snow removal operations. The system has been designed by integrating the ArcIMS ActiveX Connector with ArcIMS RouteServer Extension and web technologies, such as ASP, XML, RSS, etc. The system provides prioritized route creation, inventory management, resource allocation, and a provision for embedded weather information. The sample test runs show that the system can effectively plan snow removal operations based on live and forecasted weather data, thus improving snowplowing efficiency and thereby cutting costs for the parities involved in snow removal procedures. For extending this prototype, ArcGIS Server 9.x can be used in conjunction with ArcObjects to provide advanced functionality, such as adding new features (e.g., new roads) and advanced geoanalytical tools. Additional solutions based on intelligent technologies, such as agents, can be explored to extend the fundamental rule-based system to a full-scale intelligent agent-based system. Also, the use of a commercial weather data service that provides frequent updates and segmentwise conditions can improve the efficiency of the current prototype by generating very accurate snowplow routes and further cutting costs. Currently, the prototype is optimized to work with the Microsoft Internet Explorer browser. This prototype can be further expanded to work with other browsers, such as Netscape, Mozilla, and Firefox, by carefully considering cross-browser functionality issues.
29
REFERENCES
Aridor, Y., D. Carmel, R. Lempel, A. Soffer, and S.Y. Maarek. 2000. Knowledge Agents on the Web. IBM Haifa Research Laboratory. MATAM, Haifa, Israel.
Anonymous. 1999. A lesson in snow removal. Public Works 130.8: 51-2.
Anonymous, Equipment plays key role in airport snow removal. Public Works 129.13: 22-4.
Bai, Y., C. Yang, D. Liu, and L. Guo. 2002. Spatial Search Engine – Enabling the Intelligent Geographic Information Retrieval. ISPRS Commission II, Symposium.
Batty, M. and B. Jiang. 1999. Multi-agent simulation: new approaches to exploring space-time dynamics within GIS. Annual Meeting of Geographic Information Systems Research – UK.
Bhaskara, S., and B. Datt. 2000. Applications of hyperspectral remote sensing in urban regions. Asian Conference on Remote Sensing. Poster session. Taipei, Taiwan.
Bian, F., Z. Sha, W. Hong. 2004. An integrated GIS and knowledge-based decision support system in assisting farm-level agronomic decision-making. XXth ISPRS Congress. 12-23 July 2004. Istanbul, Turkey.
Black, Tom. 1997. The white stuff: it can cost plenty of green and leave budgets in the red, American City and County 112: 32+.
Boardman, J. 1998. Leveraging the high dimensionality of AVIRIS data for improved sub-pixel target unmixing and rejection of false positives: Mixture tuned matched filtering. Summaries of the Seventh Annual JPL Airborne Geoscience Workshop. Pasadena, CA. 55.
Boardman, J., and F. Kruse. 1994. Automated spectral analysis: A geological example using AVIRIS data, north Grapevine Mountains, Nevada. Paper presented at the Environmental Research Institute of Michigan’s Tenth Thematic Conference on Geologic Remote Sensing. Ann Arbor, MI.
Breiman, L., F. Jerome, O. Richard, and S. Charles. 1984. Classification and regression trees. Belmont, CA: Wadsworth Int. Group.
Caliper Corporation. 1999. Caliper Announces Development of an Automated Snow Plow Routing Application for Hennepin County. http://www.caliper.com/Press/pr990104.htm.
Campbell, J. F. and A. Langevin. 1995. Operations management for urban snow removal and disposal. Transportation Research Part A, Policy and Practice 29A: 359-70.
Campos, D.D., A.Y. Naumov, and C.S. Shapiro. 1996. Building an Interface Agent for ArcInfo. ESRI User Conference.
30
Choi, Y., J. 2004. A Framework for Web-based SDSS for Watershed Management. [Electronic Edition]. http://www.epa.gov/waterspace/partners_aboutsdss.html.
DOT. 2005. Iowa Department of Transportation. http://www.dot.state.ia.us/.
Eklund, W. P., S. Kirkby, and S. Pollitt. 1996. A Dynamic Multisource Dijkstra's Algorithm for Vehicle Routing. Australian and New Zealand Conference on Intelligent Information Systems 1996: 329--333.
El-Najdawi, M., K., and A.C. Stylianou. 1993. Expert support Systems: Integrating AI technologies. Communications of ACM 36.2: 55–65.
Eldrandaly, K., N. Eldin, D. Sui. 2003. A COM-based Spatial Decision Support System for Industrial Site Selection. Journal of Geographic Information and Decision Analysis 7.2: 72–92.
Farkas, Donald, and K. Corbley. 1998. City updates tax maps and tracks snow removal with GIS. Public Works 129.3: 54-6.
Fletcher, D., and R. Kunda. 1999. Development and Automation of High-Resolution Image Extraction Methodologies for Transportation Features. Albuquerque: University of New Mexico, Affiliated Research Center.
Gardner, M., D. Roberts, C. Funk, and V. Noronha. 2001. Road extraction from AVIRIS using spectral mixture and Q-tree filter techniques. Technical Report, May, 2001. University of California, Santa Barbara, National Consortium on Remote Sensing and Transportation: Infrastructure.
Green, R., M. Eastwood, C. Sarture, T. Chrien, M. Aronsson, and B. Chippendale. 1998. Imaging spectroscopy and the Airborne Visible/Infrared Imaging Spectrometer (AVIRIS). Remote Sensing of Environment 65: 227-248.
Hallmark, S., K. Mantravadi, D. Veneziano, and R. Souleyrette. 2001. Evaluating remotely sensed images for use in inventorying roadway infrastructure features. Ames, IA: Iowa State University, Center for Transportation Research and Education.
Hahne, R. 2004. Chelan PUD Integrates GIS and Asset Management. http://tdworld.com/mag/power_chelan_pud_integrates/.
Hintz, G., A. Kettlewell, E. Shambarger, and T. Sweeney. 2001. Milwaukee’s Snow and Ice Control Service. La Follette Policy Report. La Follette School of Public Affairs 12.1.
Hsu, P., and Y. Tseng. 1999. Feature extraction for hyperspectral image. Paper presented at the Asian Conference on Remote Sensing. Hong Kong, China.
Kane, R. A. 2000. Why Asset Management is More Critically Important than Ever Before. U.S. Department of Transportation. Public Roads featuring developments in federal highway policies, programs, and research and technology 63.5.
31
Keenan, P. 1996. Using a GIS as a DSS generator. In J. Darzentas, J. S. Darzentas, and T. Spyrou (Eds.) Perspectives on DSS. University of the Aegean, Greece. 33-40.
Kindrachuk, G. 2001. Integration of asset management and GIS. Geospatial Information and Technology Association Proceedings.
Kray, C. 2001. The benefits of multi-agent systems in spatial reasoning. Proceedings of Flairs 2001. Key West, FL.
Kruse, F., A. Lefkoff, J. Boardman, K. Heidebrecht, A. Shapiro and P. Barloon. 1993. The spectral image processing system (SIPS) – interactive visualization and analysis of imaging spectrometer data. Remote Sensing of Environment 44: 145-163.
Li, M., Zhou, S., and B.C. Jones. 2002. Multi-agent Systems for Web-Based Map Information Retrieval Geographic Information Science. Second International Conference, GIScience Proceedings.
Lemer, A.C. 1998. Progress toward integrated infrastructure-assets-management systems: GIS and beyond. Proceedings of the APWA International Public Works Congress. NRCC/CPWA Seminar Series in Innovations in Urban Infrastructure. 7-24.
Mahoney, P. W., W. Myers. 2003. The winter road maintenance decision support system (MDSS) Project Update and Future Plans. 19th Conference on IIPS.
Malczewski, J. 1999. GIS and Multicriteria Decision Analysis. New York City: John Wiley and Sons.
Mangold, T. 2000. Road Salt Use for Winter Maintenance. [Electronic Version]. http://www.cnr.umn.edu/sci/StudProj/5061Mangold.pdf.
Ming-Hsiang Tsou. 2002. Adopting Software Agents for Internet Mapping and Distributed GIServices. ESRI International User Conference 2002, session 234.
Muller, J.,C. 1993. Latest developments in GIS/LIS. International Journal of Geographical Information Systems 7.4: 293-303.
NCRST (National Consortia on Remote Sensing in Transportation). 2002. Iowa Department of Transportation and National Consortium on Remote Sensing in Transportation – Environmental Group. NCRST-E Remote Sensing Mission to Eddyville, Iowa in conjunction with the Iowa Department of Transportation. http://www.ncrste.msstate.edu/publications/posters/ncrste_eddyville_mission_2001.pdf.
NOAA. 2003. Experimental XML Feeds of Current Weather Conditions. http://www.nws.noaa.gov/data/current_obs/.
Osegueda, R., A. Garcia-Diaz, S. Ashur, O. Melchor, S. Chang, C. Carrasco, et al. 1999.GIS-Based Network Routing Procedures for Overweight and Oversized Vehicles. Journal of Transportation Engineering 125: 324-331.
32
Pisano, A. P., D.A. Stern, and P.W. Mahoney III. 2004. The winter maintenance decision support system (MDSS): Demonstration Results and Future Plans. [Electronic Version]. http://ops.fhwa.dot.gov/weather/best_practices/MDSSpaperAMS2004.pdf.
Pittman, R. 1996. Indiana streamlines permitting and ice/snow removal. Public Works 127: 49–50.
Rasmussen, R.M., M. Dixon, F. Hage, J. Cole, C. Wade, J. Tuttle, S. McGettigan, T. Carty, L. Stevenson, W. Fellner, S. Knight, E. Karplus, and N. Rehak. 2001. Weather Support to Deicing Decision Making (WSDDM): A Winter Weather Nowcasting System. Bulletin of the AMS 82.4.
Regional Earth Science Applications Center. 2003. Land cover mapping of the Chesapeake Bay watershed. http://www.geog.umd.edu/resac/pdf/resac_mapping_primer_april2003.pdf.
Salim, M.D., T. Strauss, and M.A. Emch. 2002. Geographic Information Integrated Intelligent System for Maintenance of Roads and Bridges. Paper in preparation for the 15th International Conference on Industrial and Engineering Application of Artificial Intelligence and Expert Systems, June 17-20, 2002. Cairns, Australia.
Salim, M. D., A.M. Timmerman, T. Strauss, and M.E. Emch. 2002. Artificial-Intelligence-Based Optimization of the Management of Snow Removal Assets and Resources. MTC Final Report.
Salim, M. D. and A.M. Timmerman. 2001. A communication-based paradigm for construction asset management. http://itc.scix.net/data/works/att/ecce-2001-35.content.pdf.
Shad, R., H. Ebadi, E. Ghods. 2003. Evaluation of Route Finding Methods in GIS Application. Map Asia Conference.
Shahiari, N. and C.V. Tao. 2002. GIS Applications using Agent Technology. Symposium on Geospatial Theory, Processing and Applications. Ottawa, Canada.
Shippert, P. 2003. Introduction to hyperspectral image analysis. http://satjournal.tcom.ohiou.edu/pdf/shippert.pdf.
Shrestha, D., D. Margate, H. Anh, and F. Van Der Meer. 2002. Spectral unmixing versus spectral angle mapper for land degradation assessment: A case study in southern Spain. Paper presented at the 17th World Congress of Soil Science. Bangkok, Thailand.
Stickel, J. 2004. Communicating with RWIS Using Spread Spectrum Technologies. North American Travel Monitoring Exhibition and Conference.
Sugumaran, R., M. Pavuluri, and D. Zerr. 2003. The role of high-resolution imageries for identification of urban climax forest using traditional and rule-based classification approach. IEEE Transactions on Geoscience and Remote Sensing 41.9: 1933-1939.
33

Thompson, R., Y. Wang, and I.D. Bishop. 1999. Integrating GIS with Intelligent transport systems and stochastic programming for improved vehicle scheduling. In P. Rizzi (Ed.) Computers in Urban Planning and Urban Management: on the Edge of the Millennium. Italy: Franco Angeli.
Zaman, U.S., Y. Chen, and H. Miyagi. 2002. GIS Oriented Platform For Solving Real World Logistic Vehicle Routing Problems. ITC-CSCC-2002.
34